Attached files
| file | filename |
|---|---|
| EX-32.2 - KIWA BIO-TECH PRODUCTS GROUP CORP | ex32-2.htm |
| EX-32.1 - KIWA BIO-TECH PRODUCTS GROUP CORP | ex32-1.htm |
| EX-31.2 - KIWA BIO-TECH PRODUCTS GROUP CORP | ex31-2.htm |
| EX-31.1 - KIWA BIO-TECH PRODUCTS GROUP CORP | ex31-1.htm |
UNITED STATES
SECURITIES AND EXCHANGE COMMISSION
Washington, D.C. 20549
FORM 10-Q
| [X] | QUARTERLY REPORT PURSUANT TO SECTION 13 OR 15(d) OF THE SECURITIES EXCHANGE ACT OF 1934 |
For the Quarterly Period Ended June 30, 2018
| [ ] | TRANSITION REPORT PURSUANT TO SECTION 13 OR 15(d) OF THE SECURITIES EXCHANGE ACT OF 1934 |
For the Transition Period from ____________ to ____________
Commission File Number: 000-33167
KIWA BIO-TECH PRODUCTS GROUP CORPORATION
(Exact name of registrant as specified in its charter)
| Nevada | 77-0632186 | |
(State or other jurisdiction of incorporation or organization) |
(I.R.S. Employer Identification No.) | |
3200 Guasti Road, Suite #100, Ontario, California |
91761 | |
| (Address of principal executive offices) | (Zip Code) |
(909) 456-8828
(Registrant’s telephone number, including area code)
3200 Guasti Road, Suite #100
Ontario, CA 91761
(Former address)
Indicate by check mark whether the registrant (1) has filed all reports required to be filed by Section 13 or 15(d) of the Securities Exchange Act of 1934 during the preceding 12 months (or for such shorter period that the registrant was required to file such reports), and (2) has been subject to such filing requirements for the past 90 days. Yes [X] No [ ]
Indicate by check mark whether the registrant has submitted electronically and posted on its corporate Web site, if any, every Interactive Data File required to be submitted and posted pursuant to Rule 405 of Regulation S-T (§ 232.405 of this chapter) during the preceding 12 months (or for such shorter period that the registrant was required to submit and post such files). Yes [X] No [ ]
Indicate by check mark whether the registrant is a large accelerated filer, an accelerated filer, a non-accelerated filer, or a smaller reporting company. See the definitions of “large accelerated filer,” “accelerated filer” and “smaller reporting company” in Rule 12b-2 of the Exchange Act.
| Large accelerated filer [ ] | Accelerated filer [ ] |
| Non-accelerated filer [ ] | Smaller reporting company [X] |
| (Do not check if a smaller reporting company) | Emerging growth company [ ] |
Indicate by check mark whether the registrant is a shell company (as defined in Rule 12b-2 of the Exchange Act). Yes [ ] No [X]
As of August 14, 2018, the Company had 16,637,017 shares of common stock, $0.001 par value, issued and outstanding.
Table of contents
| 2 |
KIWA BIO-TECH PRODUCTS GROUP CORPORATION AND SUBSIDIARIES
CONDENSED CONSOLIDATED BALANCE SHEETS
| June 30, 2018 | December 31, 2017 | |||||||
| (Unaudited) | ||||||||
| ASSETS | ||||||||
| Current assets | ||||||||
| Cash and cash equivalents | $ | 5,081,590 | $ | 1,083,539 | ||||
| Accounts receivable | 6,993,742 | 28,620 | ||||||
| Prepaid expenses | 3,118,208 | 2,474,272 | ||||||
| Rent deposits and other receivables | 456,287 | 44,423 | ||||||
| Advance to suppliers | 6,097,017 | 12,660,793 | ||||||
| Due from related parties - non-trade | 23,472 | 19,017 | ||||||
| Inventory | 1,705,748 | 2,745,991 | ||||||
| Deferred cost of goods sold | 5,108,997 | 16,726 | ||||||
| Total current assets | 28,585,061 | 19,073,381 | ||||||
| OTHER ASSETS | ||||||||
| Property, plant and equipment - net | 63,810 | 90,500 | ||||||
| Rent deposits-non-current | 74,006 | 72,631 | ||||||
| Deposit for Long-Term Investment | 755,466 | 768,074 | ||||||
| Total non-current assets | 893,282 | 931,205 | ||||||
| Total assets | $ | 29,478,343 | $ | 20,004,586 | ||||
| LIABILITIES AND STOCKHOLDERS’ EQUITY | ||||||||
| Current liabilities | ||||||||
| Accounts payable | $ | 880,333 | $ | 1,800,614 | ||||
| Advances from customers | 597,123 | 543,581 | ||||||
| Due to related parties-non-trade | 527,785 | 320,199 | ||||||
| Convertible notes payable, net of discount of $0 and $1,977 at June 30, 2018 and December 31, 2017, respectively. | 258,655 | 273,200 | ||||||
| Derivative liabilities | 45,562 | 247,933 | ||||||
| Notes payable | 360,000 | 360,000 | ||||||
| Salaries payable | 487,113 | 291,401 | ||||||
| Taxes payable | 1,967,908 | 1,142,973 | ||||||
| Interest payable | 1,855,737 | 1,756,275 | ||||||
| Other payables and accruals | 2,846,309 | 2,108,873 | ||||||
| Deferred revenue | 6,993,742 | 28,620 | ||||||
| Total current liabilities | 16,820,267 | 8,873,669 | ||||||
| Convertible note payable – non-current, net of discount of $243,522 and $384,799 at June 30, 2018 and December 31, 2017, respectively. | 587,490 | 460,082 | ||||||
| Total Liabilities | 17,407,757 | 9,333,751 | ||||||
| Stockholders’ equity | ||||||||
| Preferred stock - $0.001 par value, Authorized 20,000,000 shares. Series A - Issued and outstanding 500,000 and 500,000 shares at June 30, 2018, 2018 and December 31, 2017, respectively; Series B - Issued and outstanding 811,148 and 811,148 shares at June 30, 2018 and December 31, 2017, respectively. | 1,311 | 1,311 | ||||||
| Common stock - $0.001 per value. Authorized 100,000,000 shares. Issued and outstanding 16,637,017 and 15,202,965 shares at June 30, 2018, and December 31, 2017, respectively. | 16,578 | 15,203 | ||||||
| Additional paid-in capital | 26,717,774 | 24,455,291 | ||||||
| Statutory Reserve | 458,334 | 458,334 | ||||||
| Accumulated deficit | (15,165,480 | ) | (14,583,080 | ) | ||||
| Accumulated other comprehensive income | 42,069 | 323,776 | ||||||
| Total stockholders’ equity | 12,070,586 | 10,670,835 | ||||||
| Total liabilities and stockholders’ equity | $ | 29,478,343 | $ | 20,004,586 | ||||
The accompanying notes are an integral part of these unaudited condensed consolidated financial statements.
| 3 |
KIWA BIO-TECH PRODUCTS GROUP CORPORATION AND SUBSIDIARIES
CONDENSED CONSOLIDATED STATEMENTS OF OPERATIONS AND COMPREHENSIVE INCOME (LOSS)
(Unaudited)
| Three Months Ended June 30, | Six Months Ended June 30, | |||||||||||||||
| 2018 | 2017 | 2018 | 2017 | |||||||||||||
| (As Restated) | (As Restated) | |||||||||||||||
| Revenue | $ | 5,334,830 | $ | - | $ | 14,086,221 | $ | - | ||||||||
| Cost of goods sold | (3,873,502 | ) | - | (10,180,066 | ) | - | ||||||||||
| Gross Profit | 1,461,328 | - | 3,906,155 | - | ||||||||||||
| Operating expenses | ||||||||||||||||
| Selling expense | 161,256 | 54,232 | 345,567 | 90,485 | ||||||||||||
| Research and development | 39,230 | 36,433 | 78,543 | 72,724 | ||||||||||||
| General and administrative | 1,514,298 | 625,275 | 3,079,028 | 1,033,437 | ||||||||||||
| Total operating expenses | 1,714,784 | 715,940 | 3,503,138 | 1,196,646 | ||||||||||||
| Operating income (loss) | (253,456 | ) | (715,940 | ) | 403,017 | (1,196,646 | ) | |||||||||
| Other income/(expense), net | ||||||||||||||||
| Change in fair value of derivative liabilities | 72,433 | (6,561 | ) | 202,371 | (6,561 | ) | ||||||||||
| Interest expense | (152,564 | ) | (125,341 | ) | (307,927 | ) | (187,131 | ) | ||||||||
| Other income/(expense) | - | 800 | (905 | ) | 800 | |||||||||||
| Exchange gain (loss) | 56,285 | (16,903 | ) | 18,253 | (17,075 | ) | ||||||||||
| Total other income/(expense), net | (23,846 | ) | (148,005 | ) | (88,208 | ) | (209,967 | ) | ||||||||
| Income (loss) from continuing operations before income taxes | (277,302 | ) | (863,945 | ) | 314,809 | (1,406,613 | ) | |||||||||
| (Provision) benefit for income taxes | ||||||||||||||||
| Current | (358,066 | ) | (379,973 | ) | (897,209 | ) | (599,022 | ) | ||||||||
| Deferred | - | 427,798 | - | 698,243 | ||||||||||||
| Total (provision) benefit for income taxes | (358,066 | ) | 47,825 | (897,209 | ) | 99,221 | ||||||||||
| Income (loss) from continuing operations | (635,368 | ) | (816,120 | ) | (582,400 | ) | (1,307,392 | ) | ||||||||
| Income from discontinued operations, net of taxes | - | 4,511,384 | - | 4,512,182 | ||||||||||||
| Net income (loss) | (635,368 | ) | 3,695,264 | (582,400 | ) | 3,204,790 | ||||||||||
| Other comprehensive income (loss) | ||||||||||||||||
| Foreign currency translation adjustment | (781,013 | ) | 78,689 | (281,707 | ) | 43,418 | ||||||||||
| Total comprehensive income (loss) | $ | (1,416,381 | ) | $ | 3,773,953 | $ | (864,107 | ) | $ | 3,248,208 | ||||||
| Earnings per share – Basic: | ||||||||||||||||
| Loss from continuing operations | (0.04 | ) | (0.08 | ) | (0.04 | ) | (0.14 | ) | ||||||||
| Discontinued operations | - | 0.46 | - | 0.48 | ||||||||||||
| Net Income (loss) | $ | (0.04 | ) | $ | 0.38 | $ | (0.04 | ) | $ | 0.34 | ||||||
| Earnings per share – Diluted: | ||||||||||||||||
| Loss from continuing operations | (0.04 | ) | (0.07 | ) | (0.04 | ) | (0.10 | ) | ||||||||
| Discontinued operations | - | 0.41 | - | 0.39 | ||||||||||||
| Net Income (loss) | (0.04 | ) | 0.34 | (0.04 | ) | 0.29 | ||||||||||
| Weighted average number of common shares outstanding - basic | 16,479,316 | 9,823,223 | 16,201,020 | 9,450,561 | ||||||||||||
| Weighted average number of common shares outstanding - diluted | 16,497,316 | 10,972,147 | 16,201,020 | 11,437,817 | ||||||||||||
The accompanying notes are an integral part of these condensed consolidated financial statements.
| 4 |
KIWA BIO-TECH PRODUCTS GROUP CORPORATION AND SUBSIDIARIES
CONDENSED CONSOLIDATED STATEMENTS OF CASH FLOWS
(Unaudited)
| Six Months Ended June 30, | ||||||||
| 2018 | 2017 | |||||||
| (As Restated) | ||||||||
| Cash flows from continuing operating activities: | ||||||||
| Net income (loss) | $ | (582,400 | ) | $ | 3,204,790 | |||
| Income from discontinued operations, net of taxes | - | (4,512,182 | ) | |||||
| Net income (loss) from continuing operations | (582,400 | ) | (1,307,392 | ) | ||||
| Adjustments to reconcile net income to net cash used in continuing operating activities: | ||||||||
| Depreciation | 20,451 | 17,787 | ||||||
| Accrued interest | 307,927 | 186,649 | ||||||
| Stock compensation expense | 1,276,269 | 310,506 | ||||||
| Employee benefits | - | 102,743 | ||||||
| (Gain) loss on derivative liabilities | (202,371 | ) | 6,561 | |||||
| Deferred income tax | - | (698,243 | ) | |||||
| Changes in continuing operating assets and liabilities: | ||||||||
| Accounts receivable | (7,241,877 | ) | (8,164,649 | ) | ||||
| Prepaid expenses | 36,793 | (48,374 | ) | |||||
| Rent deposit and other receivables | (431,569 | ) | (117,586 | ) | ||||
| Advance to suppliers | 6,608,056 | 660,523 | ||||||
| Due from related party – non-trade | (4,957 | ) | - | |||||
| Due from related party – trade | - | 206,253 | ||||||
| Inventory | 1,034,641 | - | ||||||
| Deferred cost of goods sold | (5,294,537 | ) | (6,034,924 | ) | ||||
| Accounts payable | (926,055 | ) | 3,556,354 | |||||
| Salary payable | 203,670 | 70,383 | ||||||
| Taxes payable | 877,180 | 187,896 | ||||||
| Advances from customers | 64,943 | (13,018 | ) | |||||
| Other payables and accruals | 770,480 | (83,312 | ) | |||||
| Deferred revenue | 7,241,877 | 8,827,897 | ||||||
| Net cash provided by (used in) continuing operating activities | 3,758,521 | (2,333,946 | ) | |||||
| Net cash used in discontinued operations | - | - | ||||||
| Net cash provided by (used in) operating activities | 3,758,521 | (2,333,946 | ) | |||||
| Cash flows from investing activities: | ||||||||
| Purchase of property, plant and equipment | (3,488 | ) | (2,333 | ) | ||||
| Payment of deposit for long-term investment | - | (145,449 | ) | |||||
| Net cash used in investing activities | (3,488 | ) | (147,782 | ) | ||||
| Cash flows from financing activities: | ||||||||
| Borrowings from related parties, net | 209,111 | 17,000 | ||||||
| Proceeds from sale of common stock | 235,600 | 1,481,508 | ||||||
| Proceeds from convertible notes | - | 955,955 | ||||||
| Net cash provided by financing activities | 444,711 | 2,454,463 | ||||||
| Effect of exchange rate change | (201,693 | ) | 85,350 | |||||
| Cash and cash equivalents: | ||||||||
| Net increase | 3,998,051 | 58,085 | ||||||
| Balance at beginning of period | 1,083,539 | 13,469 | ||||||
| Balance at end of period | $ | 5,081,590 | $ | 71,554 | ||||
| Non-cash financing activities: | ||||||||
| Issuance of common stock for consulting services | $ | 1,942,050 | $ | 41,396 | ||||
| Issuance of common stock for financing related services | $ | - | $ | 138,501 | ||||
| Supplemental Disclosures of Cash Flow Information: | ||||||||
| Cash paid for interest | $ | - | $ | - | ||||
| Cash paid for income taxes | $ | - | $ | 444,331 | ||||
The accompanying notes are an integral part of these unaudited condensed consolidated financial statements.
| 5 |
KIWA BIO-TECH PRODUCTS GROUP CORPORATION AND SUBSIDIARIES
NOTES TO CONDENSED CONSOLIDATED FINANCIAL STATEMENTS
(UNAUDITED)
1. Description of Business and Organization
Organization
Kiwa Bio-Tech Products Group Corporation (“the Company”) is the result of a share exchange transaction accomplished on March 12, 2004 between the shareholders of Kiwa Bio-Tech Products Group Ltd. (“Kiwa BVI”), a company originally organized under the laws of the British Virgin Islands on June 5, 2002 and Tintic Gold Mining Company (“Tintic”), a corporation originally incorporated in the state of Utah on June 14, 1933 to perform mining operations in Utah. The share exchange resulted in a change of control of Tintic, with former Kiwa BVI stockholders owning approximately 89% of Tintic on a fully diluted basis and Kiwa BVI surviving as a wholly-owned subsidiary of Tintic. Subsequent to the share exchange transaction, Tintic changed its name to Kiwa Bio-Tech Products Group Corporation. On July 21, 2004, the Company completed its reincorporation in the State of Delaware. On March 8, 2017, we completed our reincorporation in the State of Nevada.
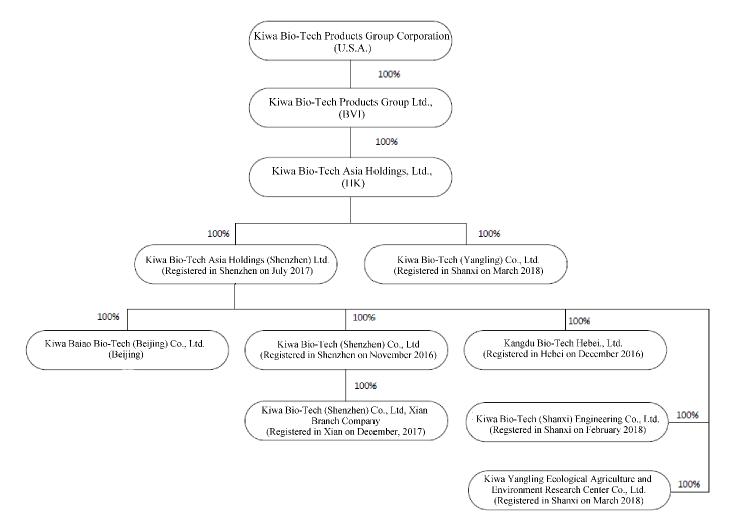
The Company operates through a series of subsidiaries in the Peoples Republic of China as detailed in the following Organizational Chart. The Company had previously operated its business through its subsidiaries Kiwa Bio-Tech Products (Shandong) Co., Ltd. (“Kiwa Shandong”) and Tianjin Kiwa Feed Co., Ltd. (“Kiwa Tianjin”). Kiwa Tianjin was dissolved on July, 11, 2012. On February 11, 2017, the Company entered an Equity Transfer Agreement with Dian Shi Cheng Jing (Beijing) Technology Co. (“Transferee”) to transfer all of shareholders’ right, title and interest in Kiwa Shandong to the Transferee for RMB1.00. On April 12, 2017, the government processing of transfer has been completed. Currently, the Company mainly operates its business through its subsidiaries Kiwa Baiao Bio-Tech (Beijing) Co., Ltd. (“Kiwa Beijing”), Kiwa Bio-Tech Products (Shenzhen) Co., Ltd. (“Kiwa Shenzhen”), which was incorporated in China in November 2016, Kiwa Bio-Tech Products (Hebei) Co., Ltd. (“Kiwa Hebei”), which was incorporated in China in December 2016, and Kiwa Bio-Tech Products (Shenzhen) Co., Ltd. Xian Branch Company, (“Kiwa Xian”), which was incorporated in China in December 2017. Kiwa Beijing was acquired from a group of unrelated third parties in January 2016 together with its holding company HK Baina Group Holding Company for approximately $34,000 (RMB 220,000) and renamed to Kiwa Baiao Bio-Tech (Beijing) Co., Ltd. from Oriental Baina Co., Ltd. in February 2016. HK Baina Group Holding Company and Oriental Baina Co., Ltd. have no operations prior to the acquisition and the purchase price was initially recorded as goodwill and fully impaired at the year-end of 2016. In July 2017, the Company established Kiwa Bio-Tech Asia Holding (Shenzhen) Ltd. (“Kiwa Asia”) to be the direct holding company of Kiwa Beijing, Kiwa Shenzhen, Kiwa Xian and Kiwa Hebei. The Company established Inner Mongolia Jing Nong Investment & Management, Ltd. (“Kiwa Jing Nong”) in August 2017. The Company established Kiwa Bio-Tech (Shanxi) Engineering Co., Ltd. (“Kiwa Shanxi”) in February 2018. The Company established Kiwa Bio-Tech (Yangling) Co., Ltd. (“Kiwa Yangling”) and Kiwa Yangling Ecological Agriculture and Environment Research Center Co., Ltd. (“Kiwa R&D Center”) in March 2018.
| 6 |
Business
The Company develops, manufactures, distributes and markets innovative, cost-effective and environmentally safe bio-technological products for agricultural use. Our products are designed to enhance the quality of human life by increasing the value, quality and productivity of crops and decreasing the negative environmental impact of chemicals and other wastes.
2. Restatements of June 30, 2017 consolidated financial statements
| 1) | Consolidated statements of operations and comprehensive income (loss) for the three months ended June 30, 2017: |
The unaudited consolidated condensed statements of operations and comprehensive income (loss) for three months ended June 30, 2017 contain restatements related to the following:
| a) | Revenue of $5,682,108 and cost of goods sold of $3,970,915 were being deferred as the Company considers the revenue recognition criteria are not met as of June 30, 2017 and therefore defers the revenue and cost of goods sold until payments were collected; | |
| b) | Recognition of the relative fair value of beneficial conversion feature (“BCF”) $45,094 into additional paid in capital and debt discount and amortize value over the term of the convertible notes issued on January 17, 2017 with amortization of debt discount of $11,243 for the three months ended June 30, 2017; |
| 7 |
Recognition of derivative liability from conversion feature of convertible note of $569,784 into debt discount and amortize value over the term of the convertible notes issued on May 9, 2017 with amortization of debt discount of $41,177 for the three months ended June 30, 2017;
| c) | Issuance of common stock for financing related services of $38,744 were reversed from G&A expenses and net against additional paid-in-capital as they were directly incremental to the financing transaction; | |
| d) | Tax effect of $427,798 and foreign currency translation effect of $11,221 as a result of the above restatements; | |
| e) | Recognition of exchange loss of $1,979 resulted from disposal gain of discontinued operations of $4,511,384. The Company executed an Equity Transfer Agreement with Dian Shi Cheng Jing (Beijing) Technology Co. (“Transferee”) on February 11, 2017 whereby the Company transferred all of its right, title and interest in Kiwa Bio-Tech Products (Shandong) Co., Ltd. (“Shandong”) to the Transferee for the RMB 1.00. The government approval and processing of the transaction was completed on April 12, 2017. This transaction was considered as completed and effective on April 12, 2017; | |
f)
|
Recognition of the derivative liability and change in fair value of derivative liability of $ 6,561 for fair value of the conversion option of convertible notes issued on May 9, 2017 for the three months ended June 30, 2017; | |
g) |
Recognition of California state income tax refund of $800 for the three months ended June 30, 2017; | |
| h) | Recognition of exchange gain of $16,903 for the convertible notes which was issued by using foreign currency (RMB) and recorded by using U.S. dollar quarterly. |
The impact of these restatements on the three months ended June 30, 2017 unaudited condensed consolidated statements of operations and comprehensive income (loss) is reflected in the following:
Statement of operations and comprehensive income (loss) amounts for the three months ended June 30, 2017:
| As previously reported | Restatement | As restated | ||||||||||
| Revenue | $ | 5,682,108 | $ | (5,682,108 | ) | $ | - | |||||
| Cost of goods sold | 3,970,915 | (3,970,915 | ) | - | ||||||||
| Gross profit | 1,711,193 | (1,711,193 | ) | - | ||||||||
| Operating expenses: | ||||||||||||
| Research and development | 36,433 | - | 36,433 | |||||||||
| Selling expenses | 54,232 | - | 54,232 | |||||||||
| General and administrative | 664,019 | (38,744 | ) | 625,275 | ||||||||
| Total operating expenses | 754,684 | (38,744 | ) | 715,940 | ||||||||
| Operating Income (loss) | 956,509 | (1,672,449 | ) | (715,940 | ) | |||||||
| Other income/(expense), net | ||||||||||||
| Change in fair value of derivative liabilities | - | (6,561 | ) | (6,561 | ) | |||||||
| Interest expense | (72,921 | ) | (52,420 | ) | (125,341 | ) | ||||||
| Other income/(expense) | - | 800 | 800 | |||||||||
| Exchange loss | - | (16,903 | ) | (16,903 | ) | |||||||
| Total other income/(expense), net | (72,921 | ) | (75,084 | ) | (148,005 | ) | ||||||
| Income (loss) from continuing operations before income taxes | 883,588 | (1,747,533 | ) | (863,945 | ) | |||||||
| (Provision) benefit for income taxes | ||||||||||||
| Current | (379,973 | ) | - | (379,973 | ) | |||||||
| Deferred | - | 427,798 | 427,798 | |||||||||
| Total (provision) benefit for income taxes | (379,973 | ) | 427,798 | 47,825 | ||||||||
| Income (loss) from continuing operations | 503,615 | (1,319,735 | ) | (816,120 | ) | |||||||
| Income from discontinued operations, net of taxes | 4,513,363 | (1,979 | ) | 4,511,384 | ||||||||
| Net income (loss) | 5,016,978 | (1,321,714 | ) | 3,695,264 | ||||||||
| Other comprehensive income (loss) | ||||||||||||
| Foreign currency translation adjustment | 89,910 | (11,221 | ) | 78,689 | ||||||||
| Total comprehensive income (loss) | $ | 5,106,888 | $ | (1,332,935 | ) | $ | 3,773,953 | |||||
| Earnings (loss) per share - Basic: | ||||||||||||
| Income (loss) from continuing operations | $ | 0.05 | $ | (0.13 | ) | $ | (0.08 | ) | ||||
| Discontinued operations | 0.46 | - | 0.46 | |||||||||
| Net income (loss) | $ | 0.51 | $ | (0.13 | ) | $ | 0.38 | |||||
| Earnings per share - Diluted: | ||||||||||||
| Income (loss) from continuing operations | $ | 0.05 | $ | (0.12 | ) | $ | (0.07 | ) | ||||
| Discontinued operations | 0.40 | 0.01 | 0.41 | |||||||||
| Net income (loss) | $ | 0.45 | $ | (0.11 | ) | $ | 0.34 | |||||
| Weighted average number of common shares outstanding - basic | 9,865,031 | (41,808 | ) | 9,823,223 | ||||||||
| Weighted average number of common shares outstanding - diluted | 11,360,700 | (388,553 | ) | 10,972,147 | ||||||||
| 8 |
| 2) | Consolidated statements of operations and comprehensive income (loss) and statements of cash flows for the six months ended June 30, 2017: |
The unaudited consolidated condensed statements of operations and comprehensive income (loss) and statements of cash flow for six months ended June 30, 2017 contain restatements related to the following:
| a) | Revenue of $8,827,897 and cost of goods sold of $6,034,924 were being deferred as the Company considers the revenue recognition criteria are not met as of June 30, 2017 and therefore defers the revenue and cost of goods sold until payments were collected; | |
| b) | Recognition of the relative fair value of beneficial conversion feature (“BCF”) $45,094 into additional paid in capital and debt discount and amortize value over the term of the convertible notes issued on January 17, 2017 with amortization of debt discount of $21,710 for the six months ended June 30, 2017; | |
Recognition of derivative liability from conversion feature of convertible note of $569,784 into debt discount and amortize value over the term of the convertible notes issued on May 9, 2017 with amortization of debt discount of $41,177 for the six months ended June 30, 2017; | ||
| c) | Issuance of common stock for financing related services of $61,959 were reversed from G&A expenses and net against additional paid-in-capital as they were directly incremental to the financing transaction; |
| 9 |
| d) | Tax effect of $698,243 and foreign currency translation effect of $14,149 as a result of the above restatements; | |
| e) | Recognition of exchange loss of $1,979 resulted from disposal of discontinued operations gain of $4,512,182 with the respective reclassification of $254,098 of accounts payable, $539,014 of salary payable, $508,107 of taxes payable, $102,651 of other payable, $1,061,367 of due to related party-trade, $1,672,666 of loan payable, $258,213 of construction cost payable changes for the six months ended June 30, 2017 in the statement of cash flow. The Company executed an Equity Transfer Agreement with Dian Shi Cheng Jing (Beijing) Technology Co. (“Transferee”) on February 11, 2017 whereby the Company transferred all of its right, title and interest in Kiwa Bio-Tech Products (Shandong) Co., Ltd. (“Shandong”) to the Transferee for the RMB 1.00. The government approval and processing of the transaction was completed on April 12, 2017. This transaction was considered as completed and effective on April 12, 2017; | |
f)
|
Recognition of the derivative liability and change in fair value of derivative liability of $ 6,561 for fair value of the conversion option of convertible notes issued on May 9, 2017 for the six months ended June 30, 2017; | |
g) |
Recognition of California state income tax refund of $800 for the six months ended June 30, 2017; | |
h)
|
Recognition of exchange gain of $17,075 for the convertible notes which was issued by using foreign currency (RMB) and recorded by using U.S. dollar quarterly. | |
| i) | Reclassification of $206,254 of change in other receivables to change in due from related party in the consolidated statement of cash flow as the Company previously presented the balance of $1,329,166 and $1,522,434 due from Kangtan Gerui (Beijing) Bio-Tech Co, Ltd (“Gerui”), which Ms. Feng Li, a member of the Company’s board of directors and shareholder of the Company (Ms. Li held approximately 12.93% of the Company’s Common Stock and 50% of the Company’s Series A Preferred Stock), is also a 23% shareholder of Gerui, as other receivables - third party as of June 30, 2017 and December 31, 2016, respectively; | |
| j) | Reclassification of prepaid expenses to advance to suppliers of $75,000 as of June 30, 2017. |
| 10 |
The impact of these restatements on the six months ended June 30, 2017 unaudited consolidated condensed statements of operations and comprehensive income (loss) and statements of cash flows is reflected in the following:
Statement of operations and comprehensive income (loss) amounts for the six months ended June 30, 2017:
| As previously reported | Restatement | As restated | ||||||||||
| Revenue | $ | 8,827,897 | $ | (8,827,897 | ) | $ | - | |||||
| Cost of goods sold | 6,034,924 | (6,034,924 | ) | - | ||||||||
| Gross profit | 2,792,973 | (2,792,973 | ) | - | ||||||||
| Operating expenses: | ||||||||||||
| Research and development | 72,724 | - | 72,724 | |||||||||
| Selling expenses | 90,485 | - | 90,485 | |||||||||
| General and administrative | 1,095,396 | (61,959 | ) | 1,033,437 | ||||||||
| Total operating expenses | 1,258,605 | (61,959 | ) | 1,196,646 | ||||||||
| Operating Income (loss) | 1,534,368 | (2,731,014 | ) | (1,196,646 | ) | |||||||
| Other income/(expense), net | ||||||||||||
| Change in fair value of derivative liabilities | - | (6,561 | ) | (6,561 | ) | |||||||
| Interest expense | (124,244 | ) | (62,887 | ) | (187,131 | ) | ||||||
| Other income/(expense) | - | 800 | 800 | |||||||||
| Exchange loss | - | (17,075 | ) | (17,075 | ) | |||||||
| Total other income/(expense), net | (124,244 | ) | (85,723 | ) | (209,967 | ) | ||||||
| Income (loss) from continuing operations before income taxes | 1,410,124 | (2,816,737 | ) | (1,406,613 | ) | |||||||
| (Provision) benefit for income taxes | ||||||||||||
| Current | (599,022 | ) | - | (599,022 | ) | |||||||
| Deferred | - | 698,243 | 698,243 | |||||||||
| Total (provision) benefit for income taxes | (599,022 | ) | 698,243 | 99,221 | ||||||||
| Income (loss) from continuing operations | 811,102 | (2,118,494 | ) | (1,307,392 | ) | |||||||
| Income from discontinued operations, net of taxes | 4,514,161 | (1,979 | ) | 4,512,182 | ||||||||
| Net income (loss) | 5,325,263 | (2,120,473 | ) | 3,204,790 | ||||||||
| Other comprehensive income (loss) | ||||||||||||
| Foreign currency translation adjustment | 57,567 | (14,149 | ) | 43,418 | ||||||||
| Total comprehensive income (loss) | $ | 5,382,830 | $ | (2,134,622 | ) | $ | 3,248,208 | |||||
| Earnings (loss) per share - Basic: | ||||||||||||
| Income (loss) from continuing operations | $ | 0.09 | $ | (0.23 | ) | $ | (0.14 | ) | ||||
| Discontinued operations | 0.47 | 0.01 | 0.48 | |||||||||
| Net income (loss) | $ | 0.56 | $ | (0.22 | ) | $ | 0.34 | |||||
| Earnings per share - Diluted: | ||||||||||||
| Income (loss) from continuing operations | $ | 0.08 | $ | (0.18 | ) | $ | (0.10 | ) | ||||
| Discontinued operations | 0.41 | (0.02 | ) | 0.39 | ||||||||
| Net income (loss) | $ | 0.49 | $ | (0.20 | ) | $ | 0.29 | |||||
| Weighted average number of common shares outstanding - basic | 9,564,506 | (113,945 | ) | 9,450,561 | ||||||||
| Weighted average number of common shares outstanding - diluted | 11,033,303 | 404,514 | 11,437,817 | |||||||||
| 11 |
Statement of cash flows amounts for the six months ended June 30, 2017:
| As previously reported | Restatement/ Reclassification | As restated | ||||||||||
| Cash flows from continuing operating activities: | ||||||||||||
| Net income (loss) | $ | 5,325,262 | $ | (2,120,472 | ) | $ | 3,204,790 | |||||
| Loss from discontinued operations, net of taxes | - | (4,512,182 | ) | (4,512,182 | ) | |||||||
| Net income (loss) from continuing operations | 5,325,262 | (6,632,654 | ) | (1,307,392 | ) | |||||||
| Adjustments to reconcile net income (loss) to net cash used in continuing operating activities: | ||||||||||||
| Depreciation | 17,787 | - | 17,787 | |||||||||
| Accrued interest | 124,301 | 62,348 | 186,649 | |||||||||
| Employee benefits | 102,743 | - | 102,743 | |||||||||
| Stock compensation expense | 372,465 | (61,959 | ) | 310,506 | ||||||||
| Loss on derivative liabilities | - | 6,561 | 6,561 | |||||||||
| Deferred income tax | - | (698,243 | ) | (698,243 | ) | |||||||
| Changes in continuing operating assets and liabilities: | ||||||||||||
| Accounts receivable | (8,164,649 | ) | - | (8,164,649 | ) | |||||||
| Prepaid expenses | 26,626 | (75,000 | ) | (48,374 | ) | |||||||
| Rent deposit and other receivables | 88,668 | (206,254 | ) | (117,586 | ) | |||||||
| Advance to suppliers | 585,523 | 75,000 | 660,523 | |||||||||
| Due from related parties-trade | - | 206,253 | 206,253 | |||||||||
| Deferred cost of goods sold | - | (6,034,924 | ) | (6,034,924 | ) | |||||||
| Accounts payable | 3,302,256 | 254,098 | 3,556,354 | |||||||||
| Salary payable | (468,631 | ) | 539,014 | 70,383 | ||||||||
| Taxes payable | (320,211 | ) | 508,107 | 187,896 | ||||||||
| Advances from customers | (13,018 | ) | - | (13,018 | ) | |||||||
| Other payables and accruals | (185,963 | ) | 102,651 | (83,312 | ) | |||||||
| Due to related party-trade | (1,061,367 | ) | 1,061,367 | - | ||||||||
| Loan payable | (1,672,666 | ) | 1,672,666 | - | ||||||||
| Construction cost payable | (258,213 | ) | 258,213 | - | ||||||||
| Deferred revenue | - | 8,827,897 | 8,827,897 | |||||||||
| Net cash used in continuing operating activities | (2,199,087 | ) | (134,859 | ) | (2,333,946 | ) | ||||||
| Net cash used in discontinued operations | - | - | - | |||||||||
| Net cash used in operating activities | (2,199,087 | ) | (134,859 | ) | (2,333,946 | ) | ||||||
| Cash flows from investing activities: | ||||||||||||
| Purchase of property, plant and equipment | (2,333 | ) | - | (2,333 | ) | |||||||
| Investment in subsidiary | (145,449 | ) | - | (145,449 | ) | |||||||
| Net cash used in investing activities | (147,782 | ) | - | (147,782 | ) | |||||||
| Cash flows from financing activities: | ||||||||||||
| Working capital borrowed from related parties, net of payments to related parties | 17,000 | - | 17,000 | |||||||||
| Proceeds from sale of common stock | 1,481,508 | - | 1,481,508 | |||||||||
| Proceeds from convertible note | 955,955 | - | 955,955 | |||||||||
| Net cash provided by financing activities | 2,454,463 | - | 2,454,463 | |||||||||
| Effect of exchange rate change | (49,509 | ) | 134,859 | 85,350 | ||||||||
| Cash and cash equivalents: | ||||||||||||
| Net increase | 58,085 | - | 58,085 | |||||||||
| Balance at beginning of period | 13,469 | - | 13,469 | |||||||||
| Balance at end of period | $ | 71,554 | $ | - | $ | 71,554 | ||||||
| Non-cash financing activities: | ||||||||||||
| Issuance of common stock for consulting service | $ | 179,897 | $ | (138,501 | ) | $ | 41,396 | |||||
| Issuance of common stock for financing related service | $ | - | $ | 138,501 | $ | 138,501 | ||||||
| Supplemental Disclosures of Cash flow Information: | ||||||||||||
| Cash paid for interest | $ | - | $ | - | $ | - | ||||||
| Cash paid for income taxes | $ | 411,846 | $ | 32,485 | $ | 444,331 | ||||||
| 12 |
3. Summaries of Significant Accounting Policies
Basis of presentation
The accompanying unaudited condensed consolidated financial statements have been prepared in accordance with accounting principles generally accepted in the United States of America (“U.S. GAAP”) for information pursuant to the rules and regulations of the Securities Exchange Commission (“SEC”).
In the opinion of management, all adjustments, consisting only of normal recurring adjustments, considered necessary to give a fair presentation have been included. Interim results are not necessarily indicative of results of a full year. The information in this Form 10-Q should be read in conjunction with information included in the annual report for the fiscal year ended December 31, 2017 on Form 10-K filed with the SEC on June 30, 2018.
Principle of Consolidation
These consolidated unaudited condensed financial statements include the financial statements of the Company and its wholly-owned subsidiaries, Kiwa BVI, Hong Kong Baina Group Holding Company, Kiwa Beijing, Kiwa Shandong, Kiwa Shenzhen, Kiwa Hebei, Kiwa Asia, Kiwa Yangling, Kiwa Shanxi, Kiwa R&D Center and Kiwa Jing Nong. All significant inter-company balances or transactions are eliminated on consolidation.
Use of Estimates
The preparation of financial statements in conformity with US GAAP requires management to make estimates and assumptions that affect the reported amounts of assets and liabilities, disclosure of contingent assets and liabilities at the date of the consolidated financial statements, and the reported amounts of revenues and expenses during the reporting period. Actual results could differ from those estimates. Significant accounting estimates include the valuation of securities issued, derivative liabilities, deferred tax assets and related valuation allowance.
Certain of our estimates, including evaluating the collectability of accounts receivable and the fair market value of long-lived assets, could be affected by external conditions, including those unique to our industry, and general economic conditions. It is possible that these external factors could have an effect on our estimates that could cause actual results to differ from our estimates. We re-evaluate all of our accounting estimates annually based on these conditions and record adjustments when necessary.
Cash and Cash Equivalents
Cash and cash equivalents consist of all cash balances and highly liquid investments with an original maturity of three months or less. Because of the short maturity of these investments, the carrying amounts approximate their fair value. Restricted cash is excluded from cash and cash equivalents.
Accounts receivable and allowance for doubtful accounts
Accounts receivable represent customer accounts receivables. The Company provides an allowance for doubtful accounts equal to the estimated uncollectible amounts. The Company’s estimate is based on historical collection experience, the economic environment, trends in the microbial fertilizer industry, and a review of the current status of trade accounts receivable. Management reviews its accounts receivable each reporting period to determine if the allowance for doubtful accounts is adequate. Such allowances, if any, would be recorded in the period the impairment is identified. It is reasonably possible that the Company’s estimate of the allowance for doubtful accounts will change. Uncollectible accounts receivable are charged against the allowance for doubtful accounts when all reasonable efforts to collect the amounts due have been exhausted.
Inventory
Inventories are stated at the lower of cost, determined on the weighted average method, and net realizable value. Work in progress and finished goods are composed of direct materials, direct labor and a portion of manufacturing overhead. Net realizable value is the estimated based on selling price in the ordinary course of business, less estimated costs to complete and dispose.
| 13 |
Property, plant and equipment
Property, plant and equipment are stated at cost less accumulated depreciation and accumulated impairment losses, if any. Gains or losses on disposals are reflected as gain or loss in the year of disposal. The cost of improvements that extend the life of property, plant and equipment are capitalized. These capitalized costs may include structural improvements, equipment and fixtures. All ordinary repair and maintenance costs are expensed as incurred. Depreciation for financial reporting purposes is provided using the straight-line method over the estimated useful lives of the assets as follows:
| Useful Life | ||||
| (In years) | ||||
| Buildings | 30 - 35 | |||
| Machinery and equipment | 5 - 10 | |||
| Automobiles | 8 | |||
| Office equipment | 2 - 5 | |||
| Computer software | 3 | |||
| Leasehold improvement | The shorter of the lease term and useful life | |||
Impairment of Long-Lived Assets
The Company’s long-lived assets consist of property, plant and equipment. The Company evaluates its investment in long-lived assets, including property and equipment, for recoverability whenever events or changes in circumstances indicate the net carrying amount may not be recoverable. It is possible that these assets could become impaired as a result of legal factors, market conditions, operational performance indicators, technological or other industry changes. If circumstances require a long-lived asset or asset group to be tested for possible impairment, the Company first compares undiscounted cash flows expected to be generated by that asset or asset group to its carrying value. If the carrying value of the long-lived asset or asset group is not recoverable on an undiscounted cash flow basis, an impairment is recognized to the extent that the carrying value exceeds its fair value. Fair value is determined through various valuation techniques, including discounted cash flow models, quoted market values and third-party independent appraisals, as considered necessary.
Financial Instruments
The Company analyzes all financial instruments with features of both liabilities and equity under FASB Accounting Standards Codification (“ASC”) Topic 480 “Distinguishing Liabilities from Equity” and FASB ASC Topic 815 “Derivatives and Hedging”.
Embedded conversion features of convertible debentures not considered to be derivative instruments
The embedded conversion features of convertible debentures not considered to be derivative instruments provide for a rate of conversion that is below market value. Such feature is normally characterized as a “beneficial conversion feature” (“BCF”). The relative fair values of the BCF were recorded as discounts from the face amount of the respective debt instrument. The Company amortized the discount using the straight-line method which approximates the effective interest method through maturity of such instruments.
Embedded conversion features of convertible debentures that are classified as derivative liabilities
The embedded conversion features of convertible debentures that are classified as derivative liabilities are recorded at fair value as a discount from the face amount of the respective debt instrument. The discount is being amortized to interest expense over the life of the note using the straight-line method, which approximates the effective interest method. These instruments are accounted for as derivative liabilities and marked-to-market each reporting period. The change in the value of the derivative liabilities is charged against or credited to income in the captioned “change in fair value of derivative liabilities” in the accompanying consolidated statements of operations and comprehensive income.
| 14 |
Fair Value of Financial Instruments
The Company follows paragraph 825-10-50-10 of the FASB Accounting Standards Codification for disclosures about fair value of its financial instruments and paragraph 820-10-35-37 of the FASB Accounting Standards Codification (“Paragraph 820-10-35-37”) to measure the fair value of its financial instruments. Paragraph 820-10-35-37 establishes a framework for measuring fair value with U.S. GAAP and expands disclosures about fair value measurements.
To increase consistency and comparability in fair value measurements and related disclosures, Paragraph 820-10-35-37 establishes a fair value hierarchy which prioritizes the inputs to valuation techniques used to measure fair value into three (3) broad levels. The fair value hierarchy gives the highest priority to quoted prices (unadjusted) in active markets for identical assets or liabilities and the lowest priority to unobservable inputs. The three (3) levels of fair value hierarchy defined by Paragraph 820-10-35-37 are described below:
| ● | Level 1: quoted market prices available in active markets for identical assets or liabilities as of the reporting date. | |
| ● | Level 2: pricing inputs other than quoted prices in active markets included in Level 1, which are either directly or indirectly observable as of the reporting date. | |
| ● | Level 3: Pricing inputs that are generally observable inputs and not corroborated by market data. |
Financial assets are considered Level 3 when their fair values are determined using pricing models, discounted cash flow methodologies or similar techniques and at least one significant model assumption or input is unobservable.
The fair value hierarchy gives the highest priority to quoted prices (unadjusted) in active markets for identical assets or liabilities and the lowest priority to unobservable inputs. If the inputs used to measure the financial assets and liabilities fall within more than one level described above, the categorization is based on the lowest level input that is significant to the fair value measurement of the instrument.
The carrying amount of the Company’s financial assets and liabilities, such as cash and cash equivalent, prepaid expenses, accounts payable and accrued expenses, approximate their fair value because of the short maturity of those instruments. Derivative instruments are carried at fair value, estimated using the Black Scholes Merton model.
Transactions involving related parties cannot be presumed to be carried out on an arm’s-length basis, as the requisite conditions of competitive, free-market dealings may not exist. Representations about transactions with related parties, if made, shall not imply that the related party transactions were consummated on terms equivalent to those that prevail in arm’s-length transactions unless such representations can be substantiated.
It is not however practical to determine the fair value of advances from stockholders, if any, due to their related party nature.
Revenue Recognition
On January 1, 2018 we adopted Accounting Standards Update (“ASU”) 2014-09 Revenue from Contracts with Customers (FASB ASC Topic 606) using the modified retrospective method for contracts that were not completed as of January 1, 2018. This did not result in an adjustment to the retained earnings upon adoption of this new guidance as the Company’s revenue was recognized based on the amount of consideration we expect to receive in exchange for satisfying the performance obligations.
The core principle underlying the revenue recognition ASU is that the Company will recognize revenue to represent the transfer of goods and services to customers in an amount that reflects the consideration to which the Company expects to be entitled in such exchange. This will require the Company to identify contractual performance obligations and determine whether revenue should be recognized at a point in time or over time, based on when control of goods and services transfers to a customer. The Company’s revenue streams are recognized at a point in time.
| 15 |
The ASU requires the use of a new five-step model to recognize revenue from customer contracts. The five-step model requires that the Company (i) identify the contract with the customer, (ii) identify the performance obligations in the contract, (iii) determine the transaction price, including variable consideration to the extent that it is probable that a significant future reversal will not occur, (iv) allocate the transaction price to the respective performance obligations in the contract, and (v) recognize revenue when (or as) the Company satisfies the performance obligation. The application of the five-step model to the revenue streams compared to the prior guidance did not result in significant changes in the way the Company records its revenue. Upon adoption, the Company evaluated its revenue recognition policy for all revenue streams within the scope of the ASU under previous standards and using the five-step model under the new guidance and confirmed that there were no differences in the pattern of revenue recognition.
The Company continues to derive its revenues from sales contracts with its customers with revenues being recognized upon delivery of products. Persuasive evidence of an arrangement is demonstrated via sales contract and invoice; and the sales price to the customer is fixed upon acceptance of the sales contract and there is no separate sales rebate, discount, or volume incentive. The Company recognizes revenue when title and ownership of the goods are transferred upon shipment to the customer by the Company to consider control of goods are transferred to its customer and collectability of payment is reasonably assured. The Company’s revenues are recognized at a point in time after all performance obligations are satisfied.
The Company’s customers are mainly agricultural cooperative company and distributors who then resell the Company’s products to individual farmers. Because the crop growing cycle usually takes approximately 3 to 9 months in the agricultural industry, for some co-ops and distributors, it will take approximately similar time frame of 3 to 9 months for farmers to harvest crops and to realize profits to repay them. As a result, for the sales contracts with these customers, the collectability of payment is highly dependent on the successful harvest of corps and the customers’ ability to collect money from farmers. The Company deemed the collectability of payment may not be reasonably assured until after the Company get paid. Collectability is a necessary condition for the contract to be accounted for to meet the criteria of the first step “identifying the contract with the customer” under the new revenue guidance in ASC 606. As a result, these sales contracts are not considered a contract under ASC 606, thus the shipments under these contracts are not recognized as revenue until all criteria for “identifying the contract with the customer” and revenue recognition are met using the five-step model.
Deferred Revenue and Deferred Cost of Goods Sold
Deferred revenue and deferred cost of goods sold result from transactions where the Company has shipped product for which all revenue recognition criteria under the five-step model have not yet been met. Though these contracts are not considered a contract under ASC 606, they are legally enforceable, and the Company has an unconditional and immediate right to payment after the Company has shipped products, therefore, the Company recognizes a receivable and a corresponding deferred revenue upon shipment. Deferred cost of goods sold includes direct inventory costs. Once all revenue recognition criteria under the five-step model have been met, the deferred revenues and associated cost of goods sold are recognized.
Income Taxes
The Company accounts for income taxes under the provisions of FASB ASC Topic 740, “Income Tax,” which requires recognition of deferred tax assets and liabilities for the expected future tax consequences of events that have been included in the consolidated financial statements or tax returns. Deferred tax assets and liabilities are recognized for the future tax consequence attributable to the difference between the tax bases of assets and liabilities and their reported amounts in the financial statements. Deferred tax assets and liabilities are measured using the enacted tax rate expected to apply to taxable income in the years in which those temporary differences are expected to be recovered or settled. The effect on deferred tax assets and liabilities of a change in tax rates is recognized in income in the period that includes the enactment date. The Company establishes a valuation when it is more likely than not that the assets will not be recovered.
| 16 |
FASB ASC Topic 740-10, “Accounting for Uncertainty in Income Taxes,” defines uncertainty in income taxes and the evaluation of a tax position as a two-step process. The first step is to determine whether it is more likely than not that a tax position will be sustained upon examination, including the resolution of any related appeals or litigation based on the technical merits of that position. The second step is to measure a tax position that meets the more-likely-than-not threshold to determine the amount of benefit to be recognized in the financial statements. A tax position is measured at the largest amount of benefit that is greater than 50 percent likelihood of being realized upon ultimate settlement. Tax positions that previously failed to meet the more-likely-than-not recognition threshold should be recognized in the first subsequent period in which the threshold is met. Previously recognized tax positions that no longer meet the more-likely-than-not criteria should be de-recognized in the first subsequent financial reporting period in which the threshold is no longer met. Penalties and interest incurred related to underpayment of income tax are classified as income tax expense in the period incurred. United States federal, state and local income tax returns prior to 2015 are not subject to examination by any applicable tax authorities. PRC tax returns filed for 2015, 2016 and 2017 are subject to examination by any applicable tax authorities.
Stock Based Compensation
The Company accounts for share-based compensation awards to employees in accordance with FASB ASC Topic 718, “Compensation – Stock Compensation”, which requires that share-based payment transactions with employees be measured based on the grant-date fair value of the equity instrument issued and recognized as compensation expense over the requisite service period. The Company records stock-based compensation expense at fair value on the grant date and recognizes the expense over the employee’s requisite service period. The Company’s expected volatility assumption is based on the historical volatility of Company’s stock. The expected life assumption is primarily based on historical exercise patterns and employee post-vesting termination behavior. The risk-free interest rate for the expected term of the option is based on the U.S. Treasury yield curve in effect at the time of grant. The expected dividend yield is based on the Company’s current and expected dividend policy.
The Company accounts for share-based compensation awards to non-employees in accordance with FASB ASC Topic 718 and FASB ASC Subtopic 505-50, “Equity-Based Payments to Non-employees”. Under FASB ASC Topic 718 and FASB ASC Subtopic 505-50, stock compensation granted to non-employees has been determined as the fair value of the consideration received or the fair value of equity instrument issued, whichever is more reliably measured and is recognized as an expense as the goods or services are received.
Foreign Currency Translation and Other Comprehensive Income
The Company uses United States dollars (“US Dollar” or “US$” or “$”) for financial reporting purposes. However, the Company maintains the books and records in its functional currency, Chinese Renminbi (“RMB”) and Hong Kong Dollar (“HKD”), being the functional currency of the economic environment in which its operations are conducted. In general, the Company translates its assets and liabilities into U.S. dollars using the applicable exchange rates prevailing at the balance sheet date, and the statement of comprehensive loss and the statement of cash flow are translated at average exchange rates during the reporting period. Equity accounts are translated at historical rates. Adjustments resulting from the translation of the Company’s financial statements are recorded as accumulated other comprehensive income.
Other comprehensive income for the three and six months ended June 30, 2018 and 2017 represented foreign currency translation adjustments and were included in the unaudited condensed consolidated statements of operations and comprehensive income.
The exchange rates used to translate amounts in RMB into U.S. Dollars for the purposes of preparing the unaudited condensed consolidated financial statements were as follows:
| As of June 30, 2018 | As of December 31, 2017 | |||||||
| Balance sheet items, except for equity accounts | 6.61843 | 6.5098 | ||||||
| 17 |
| Three months ended June 30, | ||||||||
| 2018 | 2017 | |||||||
| Items in the statements of comprehensive income | 6.3726 | 6.8619 | ||||||
| Six months ended June 30, | ||||||||
| 2018 | 2017 | |||||||
| Items in the statements of comprehensive income | 6.3659 | 6.8753 | ||||||
The exchange rates used to translate amounts in HKD into U.S. Dollars for the purposes of preparing the consolidated financial statements were as follows:
| As of June 30, 2018 | As of December 31, 2017 | |||||||
| Balance sheet items, except for equity accounts | 7.8465 | 7.8149 | ||||||
| Three months ended June 30, | ||||||||
| 2018 | 2017 | |||||||
| Items in the statements of comprehensive income | 7.8476 | 7.7855 | ||||||
| Six months ended June 30, | ||||||||
| 2018 | 2017 | |||||||
| Items in the statements of comprehensive income | 7.8372 | 7.7728 | ||||||
Earnings Per Common Share
Net income per common share is computed pursuant to section 260-10-45 of the FASB Accounting Standards Codification. Basic net income per common share is computed by dividing net income by the weighted average number of common shares outstanding during the period.
Diluted net income per common share is computed by dividing net income by the weighted average number of shares of common stock and potentially outstanding shares of common stock during the period to reflect the potential dilution that could occur from common shares issuable through contingent shares issuance arrangement, stock options or warrants. Common stock equivalents having an anti-dilutive effect on earnings per share are excluded from the calculation of diluted earnings per share.
Commitments and Contingencies
The Company follows subtopic 450-20 of the FASB Accounting Standards Codification to report accounting for contingencies. Certain conditions may exist as of the date the consolidated financial statements are issued, which may result in a loss to the Company but which will only be resolved when one or more future events occur or fail to occur. The Company assesses such contingent liabilities, and such assessment inherently involves an exercise of judgment. In assessing loss contingencies related to legal proceedings that are pending against the Company or unassured claims that may result in such proceedings, the Company evaluates the perceived merits of any legal proceedings or unassured claims as well as the perceived merits of the amount of relief sought or expected to be sought therein.
If the assessment of a contingency indicates that it is probable that a material loss has been incurred and the amount of the liability can be estimated, then the estimated liability would be accrued in the Company’s consolidated financial statements. If the assessment indicates that a potential material loss contingency is not probable but is reasonably possible, or is probable but cannot be estimated, then the nature of the contingent liability, and an estimate of the range of possible losses, if determinable and material, would be disclosed.
Loss contingencies considered remote are generally not disclosed unless they involve guarantees, in which case the guarantees would be disclosed. Management does not believe, based upon information available at this time that these matters will have a material adverse effect on the Company’s financial position, results of operations or cash flows.
| 18 |
Cash Flow Reporting
The Company adopted paragraph 230-10-45-24 of the FASB Accounting Standards Codification for cash flows reporting, classifies cash receipts and payments according to whether they stem from operating, investing, or financing activities and provides definitions of each category, and uses the indirect or reconciliation method (“Indirect method”) as defined by paragraph 230-10-45-25 of the FASB Accounting Standards Codification to report net cash flow from operating activities by adjusting net income to reconcile it to net cash flow from operating activities by removing the effects of :
(a) all deferrals of past operating cash receipts and payments and all accruals of expected future operating cash receipts and payments;
(b) all items that are included in net income that do not affect operating cash receipts and payments.
The Company reports the reporting currency equivalent of foreign currency cash flows, using the current exchange rate at the time of the cash flows and the effect of exchange rate changes on cash held in foreign currencies is reported as a separate item in the reconciliation of beginning and ending balances of cash and cash equivalents and separately provides information about investing and financing activities not resulting in cash receipts or payments in the period pursuant to paragraph 830-230-45-1 of the FASB Accounting Standards Codification.
Recent Accounting Pronouncements
In February 2016, the FASB issued Accounting Standards Update No. 2016-02 (ASU 2016-02), Leases (Topic 842). ASU 2016-02 requires a lessee to record a right-of-use asset and a corresponding lease liability, initially measured at the present value of the lease payments, on the balance sheet for all leases with terms longer than 12 months, as well as the disclosure of key information about leasing arrangements. ASU 2016-02 requires recognition in the statement of operations of a single lease cost, calculated so that the cost of the lease is allocated over the lease term. ASU 2016-02 requires classification of all cash payments within operating activities in the statement of cash flows. Disclosures are required to provide the amount, timing and uncertainty of cash flows arising from leases. A modified retrospective transition approach is required for lessees for capital and operating leases existing at, or entered into after, the beginning of the earliest comparative period presented in the financial statements, with certain practical expedients available. ASU 2016-02 is effective for fiscal years beginning after December 15, 2018, including interim periods within those fiscal years. Early application is permitted. In July 2018, the FASB issued ASU 2018-10, Codification Improvements to Topic 842, Leases. The Company has not yet evaluated the impact of the adoption of ASU 2016-02 on the Company’s unaudited condensed consolidated financial statement presentation or disclosures.
In January 2017, the FASB issued ASU 2017-01, “Business Combinations (Topic 805): Clarifying the Definition of a Business.” The amendments in this guidance are clarifying the definition of a business to assist entities when determining whether an integrated set of assets and activities meets the definition of a business. The update provides that when substantially all the fair value of the assets acquired is concentrated in a single identifiable asset or a group of similar identifiable assets, the set is not a business. The guidance is effective for fiscal years beginning after December 15, 2017, including interim periods within those fiscal years. The adoption of this new guidance is not expected to have a material impact on our unaudited condensed consolidated financial statements.
In January 2017, the FASB issued ASU 2017-04—Intangibles—Goodwill and Other (Topic 350): Simplifying the Test for Goodwill Impairment. The amendments in this guidance to eliminate the requirement to calculate the implied fair value of goodwill to measure goodwill impairment charge (Step 2). As a result, an impairment charge will equal the amount by which a reporting unit’s carrying amount exceeds its fair value, not to exceed the amount of goodwill allocated to the reporting unit. An entity still has the option to perform the qualitative assessment for a reporting unit to determine if the quantitative impairment test is necessary. The amendment should be applied on a prospective basis. The guidance is effective for goodwill impairment tests in fiscal years beginning after December 15, 2019. Early adoption is permitted for goodwill impairment tests performed after January 1, 2017. The impact of this guidance for the Company will depend on the outcomes of future goodwill impairment tests.
In May 2017, the FASB issued Accounting Standards Update No. 2017-09 (ASU 2017-09), Compensation — Stock Compensation (Topic 718) Scope of Modification Accounting. The amendments in ASU 2017-09 provide guidance about which changes to the terms or conditions of a share-based payment award require an entity to apply modification accounting in Topic 718. The adoption of ASU 2017-09 which will become effective for annual periods beginning after December 15, 2017 and for interim periods within those annual periods, is not expected to have any impact on the Company’s unaudited condensed consolidated financial statement presentation or disclosures.
| 19 |
In July 2017, the FASB issued Accounting Standards Update No. 2017-11 (ASU 2017-11), Earnings Per Share (Topic 260); Distinguishing Liabilities from Equity (Topic 480); Derivatives and Hedging (Topic 815): (Part I) Accounting for Certain Financial Instruments with Down Round Features, (Part II) Replacement of the Indefinite Deferral for Mandatorily Redeemable Financial Instruments of Certain Nonpublic Entities and Certain Mandatorily Redeemable Noncontrolling Interests with a Scope Exception. The amendments in ASU 2017-11 change the classification analysis of certain equity-linked financial instruments (or embedded features) with down round features. When determining whether certain financial instruments should be classified as liabilities or equity instruments, a down round feature no longer precludes equity classification when assessing whether the instrument is indexed to an entity’s own stock. The adoption of ASU 2017-11 which will become effective for annual periods beginning after December 15, 2018 and for interim periods within those annual periods. The Company elected to early adopt ASU 2017-11 when preparing these unaudited condensed consolidated financial statements and no effect on the Company’s unaudited condensed consolidated financial statements.
In February 2018, the FASB issued Accounting Standards Update No. 2018-02 (ASU 2018-02), Income Statement - Reporting Comprehensive Income (Topic 220): Reclassification of Certain Tax Effects from Accumulated Other Comprehensive Income. The amendments in this Update affect any entity that is required to apply the provisions of Topic 220, Income Statement – Reporting Comprehensive Income, and has items of other comprehensive income for which the related tax effects are presented in other comprehensive income as required by GAAP. The amendments in this Update are effective for all entities for fiscal years beginning after December 15, 2018, and interim periods within those fiscal years. Early adoption of the amendments in this Update is permitted, including adoption in any interim period, (1) for public business entities for reporting periods for which financial statements have not yet been issued and (2) for all other entities for reporting periods for which financial statements have not yet been made available for issuance. The amendments in this Update should be applied either in the period of adoption or retrospectively to each period (or periods) in which the effect of the change in the U.S. federal corporate income tax rate in the Tax Cuts and Jobs Act is recognized. The Company does not believe the adoption of this ASU would have a material effect on the Company’s unaudited condensed consolidated financial statements.
Management does not believe that any other recently issued, but not yet effective, authoritative guidance, if currently adopted, would have a material impact on the Company’s unaudited condensed consolidated financial statement presentation or disclosures.
4. Accounts Receivable, net
As of June 30, 2018 and December 31, 2017, we had $6,993,742 and $28,620, respectively, of accounts receivable from the Company’s customers. The Company’s current payment terms on these customers are ranging typically from 60 days to 9 months after receipts of the goods depending on the creditworthiness of these customers. These customers are either agricultural cooperative company or distributors who then resell the Company’s products to individual farmers.
The Company’s provision on allowance for doubtful accounts is based on historical collection experience, the economic environment, trends in the microbial fertilizer industry, and a review of the current status of trade accounts receivable and come up with an aging allowance method. Currently, the Company provides a provision of 1%-6% of the allowance for doubtful accounts for accounts receivable balance that are more than 180 days old but less than one year old, 50% of the allowance for doubtful accounts for accounts receivable from one to one and half years old, 100% of the allowance for doubtful accounts for accounts receivable beyond one and half years old, plus additional amount as necessary, which the Company’s collection department had determined the collection of the full amount is remote with the approval from its management to provide a 100% provision allowance for doubtful accounts. The Company’s management has continued to evaluate the reasonableness of the valuation allowance policy and update it if necessary.
| 20 |
Accounts receivable consisted of the following:
| June 30, 2018 | December 31, 2017 | |||||||
| Accounts receivable | $ | 6,993,742 | $ | 83,860 | ||||
| Less: Allowance for doubtful accounts | - | (55,240 | ) | |||||
| Accounts receivable, net | $ | 6,993,742 | $ | 28,620 | ||||
5. Prepaid Expense
Prepaid expenses consisted of the following:
| Notes | June 30, 2018 | December 31, 2017 | ||||||||||
| Prepaid office rent | $ | 20,244 | $ | 41,487 | ||||||||
| Prepaid license Fee (for fertilizer) | - | 26,115 | ||||||||||
| Prepaid government filing expense | 12,000 | 5,000 | ||||||||||
| Prepaid consulting expenses | (1) | 3,065,863 | 2,392,273 | |||||||||
| Others | 20,121 | 9,397 | ||||||||||
| Total | $ | 3,118,208 | $ | 2,474,272 | ||||||||
(1) Prepaid consulting expense for issuance of common stock for prepaid services. Pursuant to the indemnification terms of the services agreements, the Company has the rights to demand the full services being accomplished as scheduled during the service period and to enforce the consultants to pay pro-rata penalties if the consultants do not fulfill the contract services within the services periods. As of June 30, 2018, the Company evaluated the performance of the consultants and concluded all the contracts were on schedule of delivery. The company amortized the consulting fee over the service periods per agreements based on the progress of services delivered. For the three months ended June 30, 2018 and 2017, the amortization of consulting expense was $679,925 and $152,652, respectively. For the six months ended June 30, 2018 and 2017, the amortization of consulting expense was $1,268,460 and $309,702, respectively.
6. Advance to suppliers
Advance to suppliers are mainly funds deposited for future raw material purchases. As a common practice in China’s agriculture industry, many of these vendors require a certain amount to be deposited with them as a guarantee that the Company will complete its purchases on a timely basis as well as securing the current agreed upon purchase price. Since the Company anticipates the price of raw materials is on the rise in 2018, it entered large amount of purchase agreements with its major raw materials supplier and made prepayments in advance of securing a lower purchase price and timely delivery. As of June 30, 2018 and December 31, 2017, such advance to suppliers was $6,097,017 and $12,660,793, respectively.
7. Inventory
Inventory consisted of the following:
| June 30, 2018 | December 31, 2017 | |||||||
| Raw materials | $ | 1,411,271 | $ | 2,745,991 | ||||
| Finished goods | 261,381 | - | ||||||
| Packing materials | 33,096 | - | ||||||
| Total | $ | 1,705,748 | $ | 2,745,991 | ||||
| 21 |
8. Property, Plant and Equipment
Property, plant and equipment, net consisted of the following:
| June 30, 2018 | December 31, 2017 | |||||||
| Property, Plant and Equipment | ||||||||
| Office equipment | $ | 17,581 | $ | 15,899 | ||||
| Furniture | 24,444 | 23,331 | ||||||
| Leasehold improvement | 90,105 | 91,609 | ||||||
| Construction in progress | 26,290 | 26,729 | ||||||
| Others | 665 | 1,106 | ||||||
| Property, plant and equipment - total | $ | 159,085 | $ | 158,674 | ||||
| Less: accumulated depreciation | (95,275 | ) | (68,174 | ) | ||||
| Property, plant and equipment - net | $ | 63,810 | $ | 90,500 | ||||
Depreciation expense was $4,817 and $8,318 for the three months ended June 30, 2018 and 2017, and $20,451 and $17,787 for the six months ended June 30, 2018 and 2017, respectively.
9. Deposit for Long-Term Investment
On June 8, 2017, Kiwa Hebei entered an equity purchase agreement with the shareholders of Yantai Peng Hao New Materials Technology Co. Ltd. (“Peng Hao”) to acquire 100% interest in Peng Hao for approximately RMB 15,000,000 (approximately US$ 2.3 million). As of June 30, 2018, Kiwa Hebei has made deposit payment of RMB 5,000,000 (approximately $0.8 million). Due to certain administrative approval process from the Chinese government, the closing of the equity purchase agreement has been delayed. RMB 6,500,000 (approximately $1.0 million) will be paid upon completion of the land use rights ownership transfer and RMB 3,500,000 (approximately $0.5 million) will be paid upon completion of the business licenses transfer. The Company estimated the completion of the transfer will be sometime in March 2019.
10. Salaries payable
| June 30, 2018 | December 31, 2017 | |||||||
| Ms. Yvonne Wang (“Ms. Wang”) | $ | 217,000 | $ | 175,000 | ||||
| Other Employees | 270,113 | 116,401 | ||||||
| Total | $ | 487,113 | $ | 291,401 | ||||
No salary was paid to Ms. Wang since December 2015. The Company expects to be in negotiations with Ms. Wang to settle these obligations.
11. Related Party Transactions
Due from related parties – non-trade
Amounts due from related parties consisted of the following as of June 30, 2018 and December 31, 2017:
| Item | Nature | Notes | June 30, 2018 | December 31, 2017 | ||||||||
| Mr. Wei Li | Non-trade | (1) | 19,017 | |||||||||
| Xiaoqiang Yu | Non-trade | (2) | 23,472 | |||||||||
| Total | $ | 23,472 | $ | 19,017 | ||||||||
(1) Mr. Wei Li
During the year ended December 31, 2017, Mr. Wei Li, the former chairman and CEO, founder and major shareholder of the Company, obtained a cash advance from the Company for operational purpose . The balance was repaid in March 2018.
(2) Xiaoqiang Yu
During the three months ended June 30, 2018, Mr. Xiaoqiang Yu, the general manager of the operations division of the Company, obtained a cash advance from the Company for operational purpose.
| 22 |
Due to related parties– non-trade
Amounts due to related parties consisted of the following as of June 30, 2018 and December 31, 2017:
| Item | Nature | Notes | June 30, 2018 | December 31, 2017 | ||||||||
| Ms. Wang | Non-trade | (1) | 490,012 | 320,199 | ||||||||
| Ms. Feng Li (“Ms. Li”) | Non-trade | (2) | 37,773 | - | ||||||||
| Total amount due to related parties | $ | 527,785 | $ | 320,199 | ||||||||
(1) Ms. Wang
Effective November 20, 2015, the Company appointed Ms. Wang as the Chairman of the Board and effective August 11, 2016, the Company’s Board of Directors has assigned Ms. Wang the additional titles of Acting President, Acting Chief Executive Officer and Acting Chief Financial Officer. On April 15, 2018, Ms. Wang turned over the Acting Chief Financial Officer to her successor.
During the six months ended June 30, 2018 and 2017, Ms. Wang paid various expenses on behalf of the Company. As of June 30, 2018 and December 31, 2017, the amount due to Ms. Wang was $490,012 and $320,199, respectively.
(2) Ms. Feng Li
Ms. Feng Li is a member of the Company’s board of directors and shareholder of the Company. Ms. Li held approximately 20% of the Company’s Common Stock and 50% of the Company’s Series A Preferred Stock. Ms. Feng Li paid various expenses on behalf of the Company. As of June 30, 2018 and December 31, 2017, the amount due to Ms. Feng Li was $37,773 and $0, respectively.
12. Convertible Notes Payable
Convertible notes payable consisted of the following:
| June 30, 2018 | December 31, 2017 | |||||||
| 6% secured convertible notes – FirsTrust Group Inc. (1) | $ | 107,562 | $ | 121,562 | ||||
| 15% convertible notes- Mr. Geng Liu (1) | 151,093 | 153,615 | ||||||
| 15% convertible notes- Mr. Junwei Zheng (2) | 831,012 | 844,881 | ||||||
| Less: notes discount | (243,522 | ) | (386,776 | ) | ||||
| Convertible notes payable - total | 846,145 | 733,282 | ||||||
| Non-current | (587,490 | ) | (460,082 | ) | ||||
| Current | $ | 258,655 | $ | 273,200 | ||||
| 23 |
(1) Convertible Notes Payable - Current
Convertible notes payable - current consists of $107,562 of 6% secured convertible notes issued to FirsTrust Group Inc. on June 29, 2006 and $151,093 (face amount $151,093 net of discount of $0) of 15% convertible note issued to Mr. Geng Liu on January 17, 2017.
6% secured convertible notes – FirsTrust Group Inc.
On June 29, 2006, the Company entered into a securities purchase agreement (the “Purchase Agreement”) with six institutional investors (collectively, the “Purchasers”) for the issuance and sale of 6% secured convertible notes, due three years from the date of issuance, in the aggregate principal amount of $2,450,000 (the “6% Convertible Notes”), convertible into shares of the Company’s common stock.
On August 12, 2013, the Company, entered into a Settlement Agreement and Release (the “Release”) with the holders (the “Holders”) of the “6% Convertible Notes” in the aggregate principal amount of $2,000,000. Pursuant to the terms of the Release, the Company paid the Holders $75,000 for a full release, including the forgiveness of past defaults of unpaid principal amounts, interests and penalties. During the course of the time, certain notes had been converted as well. On March 18, 2008, FirsTrust Group, Inc. (“FirsTrust”) purchased the three remaining 6% Convertible Notes, totaling $168,000 ($59,100, $50,400 and $59,100 respectively), from Nite Capital, one of the six institutional investors which purchased a total of $300,000 of the Note in three tranches ($105,000, $90,000, $105,000 respectively), for a cash payment of $100,000. After the Release and conversion, FirsTrust is the only holder of the outstanding 6% Convertible Note with outstanding principal amount of $150,250.
On June 29, 2009, the 6% Notes were due. The Company informed the Purchasers of its inability to repay the outstanding balance on the due date. Therefore, the 6% Notes are in default and the default interest rate of 15% per annum is being charged on the 6% Notes.
On October 19, 2017, the Company issued total 14,151 common shares at $1.04 per share price to FirsTrust Group, Inc. for the conversion of convertible note. According to the convertible note agreement, the conversion price is based on a 40% discount to the average of the lowest three days trading price of the Company’s common stock on the OTC Bulletin Board over a 20-day trading period per the convertible notes agreement. As the carrying value of the notes and the intrinsic value of that conversion feature equaled to the fair value of the 14,151 common shares at $2.25 per share, no gain or loss were recognized upon this conversion.
On December 13, 2017, the Company issued total 105,095 common shares at $0.75 per share price to FirsTrust Group, Inc. for the conversion of convertible note. According to the convertible note agreement, the conversion price is based on a 40% discount to the average of the lowest three days trading price of the Company’s common stock on the OTC Bulletin Board over a 20-day trading period per the convertible notes agreement. As the carrying value of the notes and the intrinsic value of that conversion feature equaled to the fair value of the 105,095 common shares at $2.3 per share, no gain or loss were recognized upon this conversion.
On April 27, 2018, the Company issued total 126,045 common shares at $0.62 per share price to FirsTrust Group, Inc. for the conversion of convertible note. According to the convertible note agreement, the conversion price is based on a 40% discount to the average of the lowest three days trading price of the Company’s common stock on the OTC Bulletin Board over a 20-day trading period per the convertible notes agreement. As the carrying value of the notes and the intrinsic value of that conversion feature equaled to the fair value of the 126,045 common shares at $1.3 per share, no gain or loss were recognized upon this conversion.
The conversion price of the Notes is based on a 40% discount to the average of the lowest three days trading price of the Company’s common stock on the OTC Bulletin Board over a 20-day trading period. The conversion price is also adjusted for certain subsequent issuances of equity securities of the Company at prices below the conversion price then in effect. The Notes contain a volume limitation that prohibits the holder from further converting the 6% Notes if doing so would cause the holder and its affiliates to hold more than 4.99% of the Company’s outstanding common stock.
The Company has elected to early adopt the guidance in ASU 2017-11. As a result, the Company has concluded that the conversion feature of the Notes is indexed to its own stock and would be classified and recorded as equity. The Company retrospectively applied the guidance to the above Notes and determined that the impact of the conversion feature for the above Notes is immaterial.
| 24 |
The Company also incurs a financial liquidated damages in cash or shares at the option of the Company (equal to 2% of the outstanding amount of the Notes per month plus accrued and unpaid interest on the Notes, prorated for partial months) if it breaches any affirmative covenants in the Purchase Agreement, including a covenant to maintain a sufficient number of authorized shares under its Certificate of Incorporation to cover at least 110% of the stock issuable upon full conversion of the Notes. Pursuant to the relevant provisions for liquidated damages in Purchase Agreement, the Company has accrued the amounts of $35,246 and $40,814 for liquidated damages for the six months ended June 30, 2018 and 2017, respectively. The Company also accrued $8,588 and $11,176 for interest at the rate of 15% per annum for the six months ended June 30, 2018 and 2017, respectively. The total 15% interest accrued was $169,046 and $182,858 at June 30, 2018 and at December 31, 2017, respectively. The total accrued liquidated damages were $515,503 and $522,257 at June 30, 2018 and at December 31, 2017, respectively.
The Company’s obligations under the Notes are secured by a first priority security interest in the Company’s intellectual property pursuant to an Intellectual Property Security Agreement with the Holders. In addition, Mr. Li, the Company’s former Chief Executive Officer, has pledged all of his common stock of the Company as collateral for the Company’s obligations under the 6% Convertible Notes.
15% convertible notes- Mr. Geng Liu
On January 17, 2017, the Company entered a Convertible Note Agreement with Mr. Geng Liu with principal of RMB 3 million. The note bears interest at 15% per annum and will mature on January 16, 2018. Before the maturity date, the Note holder has an option to convert partial or all of the outstanding principal to the Company’s common shares with a conversion price of $0.90 per share. Subsequently, the Company reached an agreement with Mr. Geng Liu that the maturity date will be extended to December 31, 2018.
The notes are convertible into shares of the common stock, at conversion price is $0.90 which is lower than the price of the Company’s common stock on the date of issue. Therefore, the conversion feature embedded in the convertible note meet the definition of beneficial conversion feature (“BCF”). The Company evaluated the intrinsic value of the BCF as $45,094 at the issue date. The relative fair values of the BCF were recorded into additional paid in capital, and the remainder proceeds of $99,850 from issuance of the convertible note was allocated to convertible notes payable.
For the six months ended June 30, 2018 and 2017, the Company recorded interest expense of $13,661 and $30,190 on the note, including the amortization of the debt discount resulting from the value of beneficial conversion feature, and the carrying value of the note as at June 30, 2018 was $151,093.
(2) Convertible Notes Payable - Non-current and derivative liabilities
Convertible notes payable – non-current consists $831,012 of 15% convertible note issued to Mr. Junwei Zheng on May 9, 2017.
15% convertible notes- Mr. Junwei Zheng
On May 9, 2017, the Company entered a Convertible Note Agreement with Mr. Junwei Zheng with principal of RMB 30 million. The note bears interest at 15% per annum and will mature on May 8, 2019. Before the maturity date, the Note holder has an option to convert partial or all of the outstanding principal and accrued interest to the Company’s common shares with a conversion price of $3.5 per share. As of June 30, 2018, the Company has received partial principal totaled RMB 5.5 million ($831,012 equivalent USD at June 30, 2018) out of the RMB 30 million Convertible Note Agreement.
The notes are convertible into shares of the common stock, at conversion price is $3.5 which is higher than the price of the Company’s common stock on the date of issue, therefore the conversion feature embedded in the note did not meet the definition of BCF. The Company determined that conversion option embedded in the note meet the definition of a derivative instrument. Since the embedded conversion price of the conversion feature is denominated in U.S. dollar, a currency other than the convertible note payable currency. As a result, the embedded conversion feature is not considered indexed to the Company’s own stock due to the variable exchange rate between U.S. Dollar and RMB, and as such, the Company determined that the embedded conversion feature to be carried as a liability and remeasured at fair value at each financial reporting date until such time as the conversion feature is exercised or expired. The Company evaluated the fair value of the embedded conversion feature at the issue date and recorded the amount into as discount to convertible note payable. The discount to convertible note payable is being amortized to interest expense over the life of the note using the straight-line method, which approximates the effective interest method.
| 25 |
The fair value of embedded conversion feature was calculated using the BlackScholesMerton model based on the following variables at inception on May 9, 2017:
| ● | Strike price of $3.5, for the conversion options | |
| ● | Expected volatility of 260.8% calculated using the Company’s historical price of its common stock | |
| ● | Expected dividend yield of 0% | |
| ● | Risk-free interest rate of 1.37%, for the conversion options | |
| ● | Expected lives of 2.0 years | |
| ● | Market price at issuance date of $2.7 |
The fair value of embedded conversion feature were calculated using the BlackScholesMerton model based on the following variables on December 31, 2017:
| ● | Strike price of $3.5, for the conversion options | |
| ● | Expected volatility of 151.9% calculated using the Company’s historical price of its common stock | |
| ● | Expected dividend yield of 0% | |
| ● | Risk-free interest rate of 1.80%, for the conversion options | |
| ● | Expected lives of 1.33 years | |
| ● | Market price at issuance date of $2.0 |
The fair value of embedded conversion feature was calculated using the BlackScholesMerton model based on the following variables on June 30, 2018:
| ● | Strike price of $3.5, for the conversion options | |
| ● | Expected volatility of 127.80% calculated using the Company’s historical price of its common stock | |
| ● | Expected dividend yield of 0% | |
| ● | Risk-free interest rate of 2.26%, for the conversion options | |
| ● | Expected lives of 0.83 years | |
| ● | Market price at remeasurement date of $1.14 |
On May 9, 2017, the Company recorded $569,784 as derivative liability for fair value of the conversion option. The initial carrying value of the Notes was $227,051. On December 31, 2017, the fair value of derivative liabilities was recalculated at $247,933. On June 30, 2018, the fair value of derivative liabilities was recalculated at $45,562. For the three and six months ended June 30, 2018, the Company recognized a gain of $72,433 and $202,371, respectively, in change in fair value of derivative liabilities.
| 26 |
For the three and six months ended June 30, 2018, the Company recorded interest expense of $103,304 and $205,540 on the note, including the amortization of the debt discount resulting from the value of the embedded conversion feature, and the carrying value of the note as of June 30, 2018 was $587,490.
13. Note Payable
On May 29, 2007, the Company issued a $360,000 promissory note (the “Promissory Note”) to an unrelated individual (the “Original Note holder”). This note bears interest at 18% per annum and was due on July 27, 2007. This note is currently in default and bears interest of 25% per annum (the “Default rate”) until paid in full. This note is secured by a pledge of shares of the Company’s common stock owned by Investlink (China) Limited (the “Pledged Shares”). The Company accrued $45,000 and $45,000 interest expense on note payable for the six months ended June 30, 2018 and 2017, respectively.
As of December 31, 2016, the Original Note holder informed the Company that all right, title and interests in the Promissory Note has been assigned and transferred to FirsTrust. As of June 30, 2018, all of $360,000 of Promissory Note to FirsTrust is still outstanding, and total accrued interest of the Promissory Note is $994,300. The Company has begun preliminary discussion with FirsTrust with regards to a potential settlement of the Note, but no agreement has been reached yet.
14. Other Payables and accruals
Other payable consisted of the following:
| Notes | June 30, 2018 | December 31, 2017 | ||||||||
| Stock subscription proceeds received in advance | (1) | $ | 1,736,869 | $ | 1,718,642 | |||||
| Accrued expenses | 228,925 | 36,240 | ||||||||
| R&D expense payable | 387,156 | 309,555 | ||||||||
| Others | 493,359 | 44,436 | ||||||||
| $ | 2,846,309 | $ | 2,108,873 | |||||||
(1). The Company received RMB 3.2 million (approximately $510,000) as at June 30, 2018) in 2016 from two unrelated potential investors, and additionally received RMB 8 million (approximately $1,273,000 as at June 30, 2018) in 2017 from one unrelated potential investors pending for stock issuances. The Company is in the process of negotiating the issuance price per shares of these stock subscriptions with the investors.
15. Stockholders’ Equity
Preferred stock
On December 14, 2015, the Company issued 500,000 shares of preferred stock series A for the aggregate amount of $1,000,000 as debt cancellation owed to two related party individuals.
These shares of Series A Preferred Stock shall have voting rights equal to aggregate of 75% of total shares entitled to vote by both (i) the holders of all of the then outstanding shares of Common Stock (whether or not such holders vote) and (ii) the holders of all of the then outstanding shares of the Company. The holders of preferred stock are entitled to receive noncumulative dividends, when and if declared by the board of directors. Dividends are not mandatory and shall not accrue. The Company shall have the right to redeem the Series A Preferred Stock, plus any accrued and unpaid dividends at a cash redemption price equal to the aggregate issuance price of $2.0 per share.
On December 28, 2017, the Company issued 811,148 shares of preferred stock series B for the aggregate amount of $1,054,492 as debt cancellation owed to one related party individual.
| 27 |
These shares of Series B Preferred Stock have a liquidation preference which is same with the Company’s Series A Preferred Stock, and is entitled to vote on an as-converted basis as the holder of common stock, and is convertible into the Company’s common stock on a one-for-one basis at any time at the option of the holder. The holders of preferred stock are entitled to receive noncumulative dividends, when and if declared by the board of directors. Dividends are not mandatory and shall not accrue. The Company shall have the right to redeem the Series B Preferred Stock, plus any accrued and unpaid dividends at a cash redemption price equal to the aggregate issuance price of $1.3 per share.
In the event of any liquidation, dissolution, or winding up of the Company, either voluntary or involuntary, distributions to the stockholders of the Company should firstly go to the holders of Series A and B preferred stock. After the payment of the full Series A and B liquidation preference, the remaining assets of the Company legally available for distribution shall be distributed ratably to the holders of the common stock in an amount equal to the full payment of the full Series A and B liquidation preference, after such distributions to the holders of the Common stock , the remaining assets of the Company legally available for distribution shall be distributed ratably among the holders of Series A and B preferred stock and the holders of the common stock.
Reverse Split
On January 14, 2016, the Company filed a Certificate of Amendment of its Certificate of Incorporation with the State of Delaware with reference to a 1-for-200 reverse stock split with respect to its Common Stock with effective date of January 28, 2016. In connection with the reverse split, the Company’s authorized capital was amended to be 120,000,000 shares, comprising 100,000,000 shares of Common Stock par value $0.001 and 20,000,000 shares of Preferred Stock par value $0.001. All relevant information relating to numbers of shares and per share information have been retrospectively adjusted to reflect the reverse stock split for all periods presented.
Common stock
During the six months ended June 30, 2018, the Company issued 187,700 common shares to four individuals residing in China for net proceeds of $235,600. The sales were completed pursuant to the exemption from registration provided by Regulation S promulgated under the Securities Act of 1933, as amended
During the six months ended June 30, 2018, the Company entered into nine consulting agreements and issued 1,053,800 shares of common stock to consultants for IR, Training system, and business development services based on market price of the shares at the transaction dates. The valuation of the shares utilized an average issuance price of $1.84 per share.
During the six months ended June 30, 2018, the Company issued 6,507 common shares to one officer for salary payment based on the average stock price of his service period which valued at $7,809.
Conversion of convertible note
As disclosed in Note 12(1), on October 19, 2017, the Company issued total 14,151 common shares at $1.04 per share price to FirsTrust Group, Inc. for the conversion of convertible note. According to the convertible note agreement, the conversion price is based on a 40% discount to the average of the lowest three days trading price of the Company’s common stock on the OTC Bulletin Board over a 20-day trading period per the convertible notes agreement.
As disclosed in Note 12(1), on December 13, 2017, the Company issued total 105,095 common shares at $0.75 per share price to FirsTrust Group, Inc. for the conversion of convertible note. According to the convertible note agreement, the conversion price is based on a 40% discount to the average of the lowest three days trading price of the Company’s common stock on the OTC Bulletin Board over a 20-day trading period per the convertible notes agreement.
As disclosed in Note 12(1), on April 27, 2018, the Company issued total 126,045 common shares at $0.62 per share price to FirsTrust Group, Inc. for the conversion of convertible note. According to the convertible note agreement, the conversion price is based on a 40% discount to the average of the lowest three days trading price of the Company’s common stock on the OTC Bulletin Board over a 20-day trading period per the convertible notes agreement.
| 28 |
Additional paid-in-capital
As disclosed in Note 12(1), on January 17, 2017, the Company issued RMB 1 million ($144,944 equivalent). Convertible Note to Mr. Geng Liu with BCF embedded. The Company evaluated the intrinsic value of the BCF as $45,094 at the issue date and recorded the amount into additional paid in capital. All other amounts recorded in additional paid in capital are derived from issuance of preferred shares or common shares as disclosed in the above.
16. Stock-based Compensation
On March 15, 2017, the Board of Directors approved a new stock option plan with ten years’ term. As of June 30, 2018, the Company has not granted any incentive compensation under this plan.
17. Fair Value Measurements
The following table sets forth by level within the fair value hierarchy the Company’s financial assets and liabilities recorded at fair value on recurring basis that were accounted for at fair value as of:
June 30, 2018
| Recurring Fair Value Measures | Level 1 | Level 2 | Level 3 | Total | ||||||||||||
| Derivative liabilities | — | — | $ | 45,562 | $ | 45,562 | ||||||||||
| Total | — | — | $ | 45,562 | $ | 45,562 | ||||||||||
December 31, 2017
| Recurring Fair Value Measures | Level 1 | Level 2 | Level 3 | Total | ||||||||||||
| Derivative liabilities | — | — | $ | 247,933 | $ | 247,933 | ||||||||||
| Total | — | — | $ | 247,933 | $ | 247,933 | ||||||||||
The following is a reconciliation of the beginning and ending balance of the assets and liabilities measured at fair value on a recurring basis for the six months ended June 30, 2018 and for the year ended December 31, 2017:
| Six months ended June 30, 2018 | Year
ended December 31, 2017 | |||||||
| Beginning balance | $ | 247,933 | $ | - | ||||
| Fair value of derivative liabilities at inception | - | 569,784 | ||||||
| Change in fair value of derivative liabilities | (202,371 | ) | (321,851 | ) | ||||
| Ending balance | $ | 45,562 | $ | 247,933 | ||||
18. Income Tax
In accordance with the current tax laws in the U.S., the Company is subject to a corporate tax rate of 21% on its taxable income. No provision for taxes is made for U.S. income tax for the three and six months ended June 30, 2018 and 2017 as it has no taxable income in the U.S.
On December 22, 2017, the “Tax Cuts and Jobs Act” (“The 2017 Tax Act”) was enacted in the United States. Under the provisions of the Act, the U.S. corporate tax rate decreased from 34% to 21%. Accordingly, we have remeasured our deferred tax assets on net operating loss carryforwards in the U.S at the lower enacted cooperated tax rate of 21%. However, this re-measurement has no effect on the Company’s income tax expenses as the Company has provided a 100% valuation allowance on its deferred tax assets previously.
| 29 |
Additionally, the 2017 Tax Act implemented a modified territorial tax system and imposing a tax on previously untaxed accumulated earnings and profits (“E&P”) of foreign subsidiaries (the “Toll Charge”). The Toll Charge is based in part on the amount of E&P held in cash and other specific assets as of December 31, 2017. The Toll Charge can be paid over an eight-year period, starting in 2018, and will not accrue interest. The 2017 Tax Act also imposed a global intangible low-taxed income tax (“GILTI”), which is a new tax on certain off-shore earnings at an effective rate of 10.5% for tax years beginning after December 31, 2017 (increasing to 13.125% for tax years beginning after December 31, 2025) with a partial offset for foreign tax credits. As a fiscal-year taxpayer, certain provisions of the 2017 Tax Act may impact the Company in fiscal 2018, including the Toll Charge, while other provisions, including the GILTI, will be effective starting at the beginning of fiscal 2018.
On December 22, 2017, the Securities and Exchange Commission Staff issued Accounting Bulletin No. 118, Income Tax Accounting Implications of the Tax Cuts and Jobs Act (“SAB 118”), which provides guidance on accounting for the tax effects of the 2017 Tax Act. SAB 118 provides a measurement period that extends beyond one year from the 2017 Tax Act’s enactment date for registrants to complete the accounting under ASC 740. In accordance with SAB 118, a registrant must reflect the income tax effects of those aspects of the 2017 Tax Act for which the accounting under ASC 740 is complete. To the extent that a registrant’s accounting for certain income tax effects of the 2017 Tax Act is incomplete, but the registrant is able to determine a reasonable estimate, the registrant must record a provisional estimate to be included in its financial statements. If a registrant is unable to determine a reasonable estimate and record a provisional estimate, the registrant should continue to apply ASC 740 on the basis of the provision of the tax laws that were in effect immediately before the enactment of the 2017 Tax Act.
The Company has determined that this one-time Toll Charge has no effect on the Company’s income tax expenses as the Company has no undistributed foreign earnings prior to December 31, 2017 since the Company has cumulative foreign losses as of December 31, 2017.
The Company determined that there is no impact of GILTI for the year ended December 31, 2018, which the Company believes that it will be imposed a minimum tax rate of 10.5% and to the extent foreign tax credits are available to reduce its US corporate tax, which may result in no additional US federal income tax being due.
In accordance with the current tax laws in China, Kiwa Shandong, Kiwa Beijing, Kiwa Shenzhen, Kiwa Xian, and Kiwa Hebei, Kiwa Shanxi and Kiwa Yangling is subject to a corporate income tax rate of 25% on its taxable income. Kiwa Shandong has not provided for any corporate income taxes since it had no taxable income for the three and six months ended June 30, 2017. Kiwa Xian, Kiwa Hebei, Kiwa Shenzhen, and Kiwa Shanxi has not provided for any corporate income taxes since it had no taxable income for the three and six months ended June 30, 2018. For the three and six months ended June 30, 2018, Kiwa Beijing recorded no income tax provision and RMB 3,429,747 or approximately $539,000 income tax provision; Kiwa Yangling recorded RMB 2,281,825 or approximately $358,000 income tax provision, and RMB 2,281,825 or approximately $358,000 income tax provision.
In accordance with the relevant tax laws in the British Virgin Islands, Kiwa BVI, as an International Business Company, is exempt from income taxes.
A reconciliation of the provision for income taxes from continuing operation determined at the local income tax rate to the Company’s effective income tax rate is as follows:
| Three
months ended June 30, | Six
months ended June 30, | |||||||||||||||
| 2018 | 2017 | 2018 | 2017 | |||||||||||||
| Pre-tax income (loss) from continuing operation | $ | (277,302 | ) | $ | (863,945 | ) | $ | 314,809 | $ | (1,406,613 | ) | |||||
| U.S. federal corporate income tax rate | 21 | % | 34 | % | 21 | % | 34 | % | ||||||||
| Income tax expense (benefit) computed at U.S. federal corporation income tax rate | (58,233 | ) | (292,942 | ) | 66,110 | (478,248 | ) | |||||||||
| Reconciling items: | ||||||||||||||||
| Rate differential for PRC earnings | 24,563 | 29,325 | 80,270 | 48,623 | ||||||||||||
| Change of valuation allowance | 385,686 | 207,758 | 740,369 | 310,395 | ||||||||||||
| Effect of tax exempted income in BVI | 6,050 | 8,034 | 10,460 | 20,009 | ||||||||||||
| Deferred tax used to offset tax liability | - | - | - | - | ||||||||||||
| Effective tax expenses (benefits) | $ | 385,066 | $ | (47,825 | ) | $ | 897,209 | $ | (99,221 | ) | ||||||
| 30 |
The Company had deferred tax assets from continuing operation as follows:
| June 30, 2018 | December 31, 2017 | |||||||
| Net operating losses carried forward by parent Company in the US | $ | 1,948,488 | $ | 1,746,802 | ||||
| Net operating losses carried forward by China Subsidiaries except for Kiwa Beijing | 542,396 | 311,925 | ||||||
| Less: Valuation allowance | (2,490,884 | ) | (2,058,727 | ) | ||||
| Net deferred tax assets | $ | - | $ | - | ||||
As of June 30, 2018 and December 31, 2017, the Company had approximately $11.9 million and $9.5 million net operating loss carryforwards available to reduce future taxable income. Net operating loss of the parent Company could be carried forward and taken against any taxable income for a period of not more than twenty years from the year of the initial loss pursuant to Section 172 of the Internal Revenue Code of 1986, as amended. The net operating loss of the Company’s PRC subsidiaries could be carried forward for a period of not more than five years from the year of the initial loss pursuant to relevant PRC tax laws and regulations. It is more likely than not that the deferred tax assets cannot be utilized in the future because there will not be significant future earnings from the entity which generated the net operating loss. Therefore, the Company recorded a full valuation allowance on its deferred tax assets.
As of June 30, 2018 and December 31, 2017, the Company has no material unrecognized tax benefits which would favorably affect the effective income tax rate in future periods and does not believe that there will be any significant increases or decreases of unrecognized tax benefits within the next twelve months. No interest or penalties relating to income tax matters have been imposed on the Company during the three and six months ended June 30, 2018 and 2017, and no provision for interest and penalties is deemed necessary as of June 30, 2018 and December 31, 2017.
19. Commitments and Contingencies
The Company has the following material contractual obligations:
(1) Investment in manufacturing facilities in Penglai City, Shandong Province in China
As disclosed in Note 8, on June 8, 2017, Kiwa Hebei entered an equity purchase agreement with the shareholders of Yantai Peng Hao New Materials Technology Co. Ltd. (“Peng Hao”) to acquire 100% interest in Peng Hao for approximately RMB 15,000,000 (approximately US$ 2.3 million). As of December 31, 2017, Kiwa Hebei has made deposit payment of RMB 5,000,000 (approximately $0.8 million) and is committed to pay the remaining RMB10,000,000 based on the payment milestone in the equity purchase agreement. RMB 6,500,000 (approximately $1.0 million) will be paid upon completion of the land use rights ownership transfer and RMB 3,500,000 (approximately $0.5 million) will be paid upon completion of the business licenses transfer.
| 31 |
(2) Strategic cooperation with the institutes in China
On November 5, 2015, the Company signed a strategic cooperation agreement (the “Agreement”) with China Academy of Agricultural Science (“CAAS”)’s Institute of Agricultural Resources & Regional Planning (“IARRP”) and Institute of Agricultural Economy & Development (“IAED”). Pursuant to the Agreement, the Company will form a strategic partnership with the two institutes and establish an “International Cooperation Platform for Internet and Safe Agricultural Products”. To fund the cooperation platform’s R&D activities, the Company will provide RMB 1 million (approximately $160,000) per year to the Spatial Agriculture Planning Method & Applications Innovation Team that belongs to the Institutes. The term of the Agreement is for three years beginning November 20, 2015 and will expire on November 19, 2018. However, the Company is only liable for the annual funds to be provided to the extent of the contract obligations performed by CAAS IARRP and IAED, and the agreement is terminable before the three years’ commitment date based on negotiations of both parties. (3) Guarantee
(3) Guarantee for Huinong Wanjia Hebei Agricultural Technology Service Co., Ltd.
On June 21, 2018, Shandong Ronghua Bio-Tech Co., Ltd. (“the supplier”) entered into a Purchase Agreement with Huinong Wanjia Hebei Agricultural Technology Service Co., Ltd (“the purchaser”), wherein the purchaser agreed to purchase 5,000 tons of Bio-Organic fertilizer for an aggregate purchase amount of US$571,667 dollars (RMB 3,700,000). This arrangement was supported by the Company’s guarantee that the supplier would fulfill all terms specified in the purchase agreement.
(4) Lease payments
The Company entered various lease agreements for business purpose. The future lease payments at June 30, 2018 are summarized below:
| Twelve months ending June 30, 2019 | $ | 267,593 | ||
| Twelve months ending June 30, 2020 | 11,181 | |||
| Twelve months ending June 30, 2021 | 7,680 | |||
| Thereafter | - | |||
| Total minimum lease payment | $ | 286,454 |
20. Concentration of Risk
Credit risk
Financial instruments that potentially subject the Company to significant concentrations of credit risk consist primarily of cash and accounts receivable. As of June 30, 2018 and December 31, 2017, $5,081,590, and $1,083,539 were deposited with various major financial institutions located in the PRC, respectively. While management believes that these financial institutions are of high credit quality, it also continually monitors their credit worthiness.
Accounts receivable are typically unsecured and derived from revenue earned from customers, thereby exposed to credit risk. The risk is mitigated by the Company’s assessment of its customers’ creditworthiness and its ongoing monitoring of outstanding balances.
Customer and vendor concentration risk
For the three months ended June 30, 2018, one customer accounted for 98% for the Company’s total sales. For the six months ended June 30, 2018, three customers accounted for 51%, 32%, and 15% for the Company’s total sales.
As of June 30, 2018, three customers accounted for 42%, 30% and 27% of the Company’s accounts receivable. As of December 31, 2017, three customers accounted for 52%, 22% and 14% of the Company’s accounts receivable.
For the three months ended June 30, 2018, one supplier accounted for 95% of the Company’s total purchases. For the six months ended June 30, 2018, one supplier accounted for 95% of the Company’s total purchases.
| 32 |
For the three months ended June 30, 2017, one supplier accounted for 93% of the Company’s total purchase. For the six months ended June 30, 2017, one supplier accounted for 91% of the Company’s total purchase.
As of June 30, 2018, two suppliers accounted for 70%, and 15% of the Company’s accounts payable, respectively. As of December 31, 2017, two suppliers accounted for 67% and 27% of the Company’s accounts payable, respectively.
As of June 30, 2018, one supplier accounted for 99% of the Company’s advance to suppliers. As of December 31, 2017, one supplier accounted for 97% of the Company’s advance to suppliers.
21. Discontinued Operation
On February 11, 2017, the Company executed an Equity Transfer Agreement with Dian Shi Cheng Jing (Beijing) Technology Co. (“Transferee”) whereby the Company transferred all of its right, title and interest in Kiwa Bio-Tech Products (Shandong) Co., Ltd. (“Shandong”) to the Transferee for the RMB 1.00. The government approval and processing of the transaction was completed on April 12, 2017. This transaction was considered as completed and effective on April 12, 2017.
The income statements for the three and six months ended June 30, 2018 and 2017 reflected the Kiwa Shandong business segment as a discontinued operation. The following results of operations of Kiwa Shandong are presented as a loss from a discontinued operation in the unaudited condensed consolidated statements of operations:
| Three months ended June 30, | Six months ended June 30, | |||||||||||||||
| 2018 | 2017 | 2018 | 2017 | |||||||||||||
| Net sales | - | - | - | - | ||||||||||||
| Gross profit | - | - | - | - | ||||||||||||
| Operating expense | - | 2,629 | - | 16,849 | ||||||||||||
| Disposal of discontinued operations | - | 4,508,755 | - | 4,495,333 | ||||||||||||
| Gain from discontinued operations | $ | - | $ | 4,511,384 | $ | - | $ | 4,512,182 | ||||||||
22. Subsequent Events
On July 13, 2018, the Company issued 40,000 shares of restricted common stock at $1.20 per share to Jiawei Huang for an aggregate amount of $48,000. The Company has received the full amount.
On July 13, 2018, the Company issued 20,000 shares of restricted common stock at $1.20 per share to Ling Li for an aggregate amount of $24,000. The Company has received the full amount.
| 33 |
ITEM 2. MANAGEMENT’S DISCUSSION AND ANALYSIS OF FINANCIAL CONDITION AND RESULTS OF OPERATIONS.
This Quarterly Report on Form 10-Q for the three and six months ended June 30, 2018 contains “forward-looking statements” within the meaning of Section 21E of the Securities and Exchange Act of 1934, as amended, including statements that include the words “believes,” “expects,” “anticipates,” or similar expressions. These forward-looking statements include, among others, statements concerning our expectations regarding our working capital requirements, financing requirements, business, growth prospects, competition and results of operations, and other statements of expectations, beliefs, future plans and strategies, anticipated events or trends, and similar expressions concerning matters that are not historical facts. The forward-looking statements in this Quarterly Report on Form 10-Q for the three and six months ended June 30, 2018 involve known and unknown risks, uncertainties and other factors that could cause our actual results, performance or achievements to differ materially from those expressed in or implied by the forward-looking statements contained herein.
Overview
The Company took its present corporate form in March 2004 when shareholders of Kiwa Bio-Tech Products Group Ltd. (“Kiwa BVI”), a company originally organized under the laws of the British Virgin Islands on June 5, 2002 and Tintic Gold Mining Company (“Tintic”), a corporation originally incorporated in the state of Utah on June 14, 1933 to perform mining operations in Utah, entered into a share exchange transaction. The share exchange transaction left the shareholders of Kiwa BVI owning a majority of Tintic and Kiwa BVI a wholly-owned subsidiary of Tintic. For accounting purposes this transaction was treated as an acquisition of Tintic by Kiwa BVI in the form of a reverse triangular merger and a recapitalization of Kiwa BVI and its wholly owned subsidiary, Kiwa Bio-Tech Products (Shandong) Co., Ltd. (“Kiwa Shandong”). On July 21, 2004, we completed our reincorporation in the State of Delaware. On March 8, 2017, we completed our reincorporation in the State of Nevada.
On November 30, 2015, we entered into an acquisition agreement (the “Agreement”) with the shareholders of Caber Holdings LTD, whose Chinese name is Hong Kong Baina Group Co., Ltd, located in Hong Kong (“Baina Hong Kong”), and Oriental Baina Co. Ltd. (hereinafter referred to as “Baina Beijing”), Baina Hong Kong’s wholly-owned subsidiary in Beijing, China. Kiwa will rename Baina Beijing to Kiwa Baiao Co. Ltd. Kiwa Baiao Co. Ltd will replace Kiwa’s current subsidiary in China - Kiwa Bio-Tech (Shandong) Co., Ltd (“Kiwa Shandong”) - to operate Kiwa’s bio-fertilizer market expansion and become Kiwa’s platform for future acquisitions of new agricultural-related projects in China. In accordance with the terms of the Agreement, Kiwa agreed to pay approximately $34,000 (RMB 220,000) to the Baina Hong Kong Shareholders, a group of unrelated third parties, for the acquisition of 100% of the equity of Baina Hong Kong. The acquisition was completed on January 7, 2016. Both Baina Hong Kong and Baina Beijing had no activities before the acquisition date and had no assets and liabilities. The purpose of this acquisition was to acquire Baina Hong Kong’s corporation registration in Hong Kong and in China.
We previously established a subsidiary in China, Kiwa Shandong in 2002, a wholly-owned subsidiary, engaging in the bio-fertilizer business. Formerly, our subsidiary Tianjin Kiwa Feed Co., Ltd. (“Kiwa Tianjin”), was engaged in the bio-enhanced feed business. At the end of 2009, Kiwa Tianjin could no longer use its assets including machinery and inventory in the normal course of operations. Kiwa Tianjin has been dissolved since July 11, 2012. On February 11, 2017, the Company entered an Equity Transfer Agreement with Dian Shi Cheng Jing (Beijing) Technology Co. (“Transferee”) to transfer all of shareholders’ right, title and interest in Kiwa Shandong to the Transferee for RMB1.00. On April 12, 2017, the government processing of transfer has been completed.
Principal Factors Affecting Our Financial Performance
We believe that the following factors that would affect our financial performance:
We believe that the following factors could affect our financial performance:
| ● | Change in the Chinese Government Policy on agricultural industry. The Chinese Government is continuously to promote green environment and implement quality standards and environmentally sensitive policies in the Agricultural industry. Below is a list of government policies issued by the Chinese Government to promote green environment and these policies are either directly or indirectly to encourage the end users of the bio-fertilizer to use more organic related products. Unfavorable changes to these policies could affect demand of our products that we produce and could materially and adversely affect the results of operations. Although we have generally benefited from these policies by using our bio-fertilizer to enhances the capacity of plants to transform inorganic materials to organic products, to boost overall plant health and productivity and not to deteriorate landfall soil. |
| ○ | In April 2008, the Ministry of Finance of PRC issued Circular No. 2008-56 to tax-exempt value-added taxes on all organically fertilizer related products effectively from June 1, 2008. | |
| ○ | In January 2016, the PRC State Council official website issued statements to fasten the agricultural modernization process. | |
| ○ | In June 2016, the PRC State Council issued Circular No. 2016-31 to prevent further deterioration of landfall soil action plan. | |
| ○ | In February 2017, the PRC State Council official website issued statements to promote agricultural structural reform on accelerating the cultivation in the agricultural development. |
| 34 |
| ○ | In February 2017, the Ministry of Agriculture of PRC issued Circular No. 2017-02 to carry out replacement of chemical bio-fertilizers by organically bio-fertilizers action plan on vegetables, fruits and teas planting. | |
| ○ | In April 2017, the Ministry of Agriculture of PRC issued Circular No. 2017-06 to implementing five major action plans on agriculture green development with an action plan for replacing chemical bio-fertilizers with organically bio-fertilizers on vegetables, fruits and teas planting under action plan No. 2-2. | |
| ○ | In April 2018, at the second meeting of the 13th National People’s Congress meeting, the Minister of the Agriculture and Rural Affairs has pronoun that the Chinese government will continue to promote green environment, to ensure food safety and food qualify for the people in the PRC, and to provide more education and training cause to the farmer in the Agriculture industry. Follow up with the second meeting, in July 2018, the Chinese government is in the process of setting up some government grants to these companies or individuals, including but not limited, organic fertilizer production companies, organic fertilizer raw materials (livestock and poultry excrement) storage and transportation companies, users of organic fertilizer, and users of organic fertilizer production machinery. |
| ● | Innovation Efforts. We strive to produce the most technically and scientifically advanced products for our customers and maintained close relationships with institutes in the PRC. |
| ○ | We signed a strategic cooperation agreement with China Academy of Agricultural Science’s Institute of Agricultural Resources & Regional Planning and Institute of Agricultural Economy & Development. Pursuant to the Agreement, we will form a strategic partnership with the two institutes and establish an “International Cooperation Platform for Internet and Safe Agricultural Products”. To fund the cooperation platform’s R&D activities, we will provide RMB 1 million (approximately $160,000) per year to the Spatial Agriculture Planning Method & Applications Innovation Team that belongs to the Institutes. The term of the Agreement is for three years beginning November 20, 2015 and will expire on November 19, 2018. | |
| ○ | In March, 2018, Kiwa Bio-Tech has established a Research Institute of Ecological Agriculture and Environmental Research. Based on cooperation with various Universities including the China Agriculture University, Northwest University, Northwest A&F University, Harbin Institute of Technology and Tsinghua University, we believe that it can secure a leading position in the KETS technology in the next thirty years. In comparison to our existing technology, Ecology Technological Sustainability (“KETS”) technology is comprised of microorganisms with a larger scale of micro-flora. The micro-flora could significantly increase the beneficial microorganism in the soil that enhances the yield of the plant crops and prevents soil ecological problems. The newly upgraded technology will be applied to the main crop planting areas and presently-polluted arable areas for soil restoration. |
| ● | Experienced Management. Management’s technical knowledge and business relationships give us the ability to secure more sales orders with our customers. If there were to be any significant turnover in our senior management, it could deplete the institutional knowledge held by our existing senior management team. | |
| ● | Large Scale Customer Relationship. We have contracts with major customers that are distributors of our products. Our sales efforts focus on these distributors which place large recurring orders and present less credit risk to us. For the three months ended June 30, 2018, one customers accounted for 98% for the Company’s total sales. Should we lose any large-scale customers in the future and are unable to obtain additional customers, our revenues will suffer. | |
| ● | Competition. Our competition includes a number of publicly traded companies in the PRC and privately-held PRC-based companies that produce and sell products similar to ours. We compete primarily on the basis of quality, technological innovation and price. Some of our competitors have achieved greater market penetration but with less sophisticated technological innovation than our products as there were in the transition period from being the chemical bio-fertilizer producers to the organically bio-fertilizer producers. We believe that we have a better competitive advantage over them as we are the pioneer within our markets. Some of our competitors competed within our markets have lesser financial and other resources than us as they have established their companies a few years behind us. If we are unable to compete successfully in our markets, our relative market share and profits could be reduced. |
| 35 |
Results of Operations
Three months ended June 30, 2018 and June 30, 2017
The following table summarizes the results of our operations during the three months periods ended June 30, 2018 and 2017, respectively, and provides information regarding the dollar and percentage increase or (decrease) during such periods.
| Three
months Ended June 30, | Change | Change | ||||||||||||||
| Statement of Operations Data: | 2018 | 2017 | (Amount) | (Percentage) | ||||||||||||
| (As Restated) | ||||||||||||||||
| Revenues | $ | 5,334,830 | $ | - | $ | 5,334,830 | 100 | % | ||||||||
| Cost of goods sold | (3,873,502 | ) | - | (3,873,502 | ) | (100 | )% | |||||||||
| Gross profit | 1,461,328 | - | 1,461,328 | 100 | % | |||||||||||
| Operating expenses | ||||||||||||||||
| Research and development | 39,230 | 36,433 | 2,797 | 8 | % | |||||||||||
| Selling expenses | 161,256 | 54,232 | 107,024 | 197 | % | |||||||||||
| General and administrative | 1,514,298 | 625,275 | 889,023 | 142 | % | |||||||||||
| Total operating expenses | 1,714,784 | 715,940 | 998,844 | 140 | % | |||||||||||
| Operating Income (Loss) | (253,456 | ) | (715,940 | ) | 462,484 | (65 | )% | |||||||||
| Other income/(expense), net | ||||||||||||||||
| Change in fair value of derivative liabilities | 72,433 | (6,561 | ) | 78,994 | (1204 | )% | ||||||||||
| Interest expense | (152,564 | ) | (125,341 | ) | (27,223 | ) | 22 | % | ||||||||
| Other income/ (expense) | - | 800 | (800 | ) | (100 | )% | ||||||||||
| Exchange gain (loss) | 56,285 | (16,903 | ) | 73,188 | (433 | )% | ||||||||||
| Total other income/(expense), net | (23,846 | ) | (148,005 | ) | 124,159 | (84 | )% | |||||||||
| Income (loss) from continuing operations before income taxes | (277,302 | ) | (863,945 | ) | 586,643 | (68 | )% | |||||||||
| (Provision) benefit for income taxes | ||||||||||||||||
| Current | (358,066 | ) | (379,973 | ) | 21,907 | 6 | % | |||||||||
| Deferred | - | 427,798 | (427,798 | ) | (100 | )% | ||||||||||
| Total (provision) benefit for income taxes | (358,066 | ) | 47,825 | (405,891 | ) | (849 | )% | |||||||||
| Income (loss) from continuing operations | (635,368 | ) | (816,120 | ) | 180,752 | (22 | )% | |||||||||
| Income from discontinued operations, net of taxes | - | 4,511,384 | (4,511,384 | ) | (100 | )% | ||||||||||
| Net Income (loss) | $ | (635,368 | ) | $ | 3,695,264 | $ | (4,330,632 | ) | (117 | )% | ||||||
Revenue
Revenue increased by approximately $5.3 million or 100%, to approximately $5.3 million in the three months ended June 30, 2018 from $0 in the three months ended June 30, 2017. The increase is mainly due to: 1) more sales are achieved due to the good quality of our products and more reputation gained in the agricultural industry; 2) more sales are achieved in different regions of the PRC, such as Hainan Province, Guangdong Province and Shanxi Province upon establishment of our sales office in different regions, and 3) introduction of our new product, Bio-water soluble fertilizer, during the three months ended June 30, 2018. As a result, our revenue increased significantly for the three months ended June 30, 2018 as compared to the same period in 2017. In addition, approximately $7.2 million and $5.7 million of our revenues was being deferred for the three months ended June 30, 2018 and June 30, 2017, respectively, as discusses in the non-GAAP analysis section below.
| 36 |
We currently realized revenue in three major product categories of Biological Organic Fertilizer, Compound Microbial Fertilizer and Bio-Water Soluble Fertilizer. We sold and shipped Biological Organic Fertilizer and Compound Microbial Fertilizer in the second quarter of 2017 and recorded the shipment amount in deferred revenue as our revenue recognition criteria has not been met. Our revenues from our major product category are summarized as follows:
| For
the three months ended June 30, 2018 | For
the three months ended June 30, 2017 | Change | Change (%) | |||||||||||||
| Biological Organic Fertilizer | ||||||||||||||||
| Revenue in USD | $ | 2,900,817 | $ | - | $ | 2,900,817 | 100 | % | ||||||||
| Quantity sold in tons | 15,334 | - | 15,334 | 100 | % | |||||||||||
| Average selling price | $ | 189.18 | $ | - | $ | 189.18 | 100 | % | ||||||||
| Compound Microbial Fertilizer | ||||||||||||||||
| Sold and shipped in USD | $ | 2,426,561 | $ | - | $ | 2,426,561 | 100 | % | ||||||||
| Quantity sold in tons | 7,026 | - | 7,026 | 100 | % | |||||||||||
| Average selling price | $ | 345.37 | $ | - | $ | 345.37 | 100 | % | ||||||||
| Bio-Water Soluble Fertilizer | ||||||||||||||||
| Sold and shipped in USD | $ | 7,452 | $ | - | $ | 7,452 | 100 | % | ||||||||
| Quantity sold in tons | 10 | - | 10 | 100 | % | |||||||||||
| Average selling price | $ | 745.20 | $ | - | $ | 745.20 | 100 | % | ||||||||
Revenue from Biological Organic Fertilizer, Compound Microbial Fertilizer and Bio-Water Soluble Fertilizer increased by approximately $2.9 million, $2.4 million and $7,452 or 100%, 100% and 100% to approximately $2.9 million, $2.4 million and $7,452, respectively, in the three months ended June 30, 2018 from $0 in the three months ended June 30, 2017. The increase is mainly due to more sales are achieved due to the good quality of our products and more reputation gained in the agricultural industry and therefore we can be able to attract more customers and we have deferred all of our revenue to be recognized for products shipped during the three months ended June 30, 2017.
Compound Microbial Fertilizer is adding appropriate amount of nitrogen, phosphorus, potassium and other nutrients into Biological Organic Fertilizer. Through the action of organic matter and beneficial microorganisms, the utilization rate of nitrogen, phosphorus, potassium can be significantly improved. The Bio-Water Soluble Fertilizer is mainly another form of the biological fertilizer that we firstly introduced in the first quarter of 2018. It is in the form of powder which has high water solubility, and it is convenient for the farmers to use during the drop irrigation. Compound Microbial Fertilizer and Bio-Water Soluble Fertilizer generally contain more microorganism and have a higher effectiveness on the productivity of crops and increasing the value and quality of the crops harvested than Biological Organic Fertilizer. As a result, our Compound Microbial Fertilizer and Bio-Water Soluble Fertilizer generally have a higher average selling price as compared to Biological Organic Fertilizer.
Because the Chinese Government is continuously to promote green environment and implement quality standards and environmentally sensitive policies in the Agricultural industry, we expect our revenues from our innovated and highly effective products, Compound Microbial Fertilizer and Bio-Water Soluble Fertilizer, will continue to grow in a higher rate than that from Biological Organic Fertilizer. Our Compound Microbial Fertilizer and Bio-Water Soluble Fertilizer generally have a higher effectiveness on the productivity of crops that are suitable for promoting green environment. In addition, our marketing team is expanding to the Western areas of China and Hainan province and we expect our revenues will continue to grow in the third and fourth quarters of 2018. Meanwhile, we expect to continue to gain more market shares in our existing sales channel bases in the Northern and the Southern areas of China due to the good quality of the products and better reputation in the industry.
| 37 |
Non-GAAP analysis
Our strategy on the expansion of our business was to gain market shares in the bio-fertilizer market, thereby, we have extended credit to our customers. Our current payment terms on these customers are ranging from 60 days to 9 months after receipts of the goods depending on the creditworthiness of these customers. These customers are mainly agricultural cooperative company and distributors who then resell our products to individual farmers. Because the crop growing cycle usually takes approximately 3 to 9 months in the agricultural industry, it will take approximately similar time frame of 3 to 9 months for farmers to harvest crops and to realize profits to repay our distributors. As a result, for the sales contracts with these customers, the collectability of payment is highly dependent on the successful harvest of corps and the customers’ ability to collect money from farmers. The Company deemed the collectability of payment may not be reasonably assured until after the Company get paid. Starting in March 2018, the Company began to use a supply chain financing model, which the Company’s customers engage with third party financing companies to advance the Company’s accounts receivable on its behalf without recourse to the Company. The Company’s customers are required to purchase an insurance product to cover the risk of bad weather or any other reason which they are not able to harvest crops and to realize profits of repaying the third party financing companies. This model allows the Company to collect its accounts receivables sooner than the 3 to 9 months crop growing period. The Company deemed the collectability of payment may not be reasonably assured until after the Company get paid from these financing companies. For those sales contracts that the Company has shipped its products but the payment is contingent on collections of payments from the downstream customers or is contingent on the approval of the financing companies to advance payment on behalf of the Company’s customers, the Company considers the revenue recognition criteria using the five-step model under the new guidance are not met and therefore defers the revenue and cost of goods sold until payments are collected. We have sold and shipped approximately $12.5 million of our products during the three months ended June 30, 2018, approximately $7.2 million of which the revenue recognition criteria of collectability of payments is reasonably assured has not yet been met, and we have deferred these revenues to be recognized in the future periods when our collectability of payments will be assured. We have sold and shipped approximately $5.7 million of our products during the three months ended June 30, 2017, all of which the revenue recognition criteria of collectability of payments is reasonably assured has not yet been met, and we have deferred all of these revenues to be recognized in the future periods when our collectability of payments will be assured.
Our sales and shipment from our two major products categories are summarized as follows including revenue recognized and deferred under U.S. GAAP:
| For
the three months ended June 30, 2018 | For
the three months ended June 30, 2017 | Change | Change (%) | |||||||||||||
| Biological Organic Fertilizer | ||||||||||||||||
| Sold and shipped in USD | $ | 6,343,085 | $ | 2,972,942 | $ | 3,370,143 | 113 | % | ||||||||
| Quantity sold in tons | 33,565 | 17,000 | 16,565 | 97 | % | |||||||||||
| Average selling price | $ | 188.98 | $ | 174.88 | $ | 14.10 | 8 | % | ||||||||
| Compound Microbial Fertilizer | ||||||||||||||||
| Sold and shipped in USD | $ | 6,224,045 | $ | 2,709,166 | $ | 3,514,879 | 130 | % | ||||||||
| Quantity sold in tons | 18,026 | 8,500 | 9,526 | 112 | % | |||||||||||
| Average selling price | $ | 345.28 | $ | 318.73 | $ | 26.55 | 8 | % | ||||||||
| Bio-Water Soluble Fertilizer | ||||||||||||||||
| Sold and shipped in USD | $ | 7,452 | $ | - | $ | 7,452 | 100 | % | ||||||||
| Quantity sold in tons | 10 | - | 10 | 100 | % | |||||||||||
| Average selling price | $ | 745.20 | $ | - | $ | 745.20 | 100 | % | ||||||||
The sales and shipment of all our products increased in the three months ended June 30, 2018 as compared to the three months ended June 30, 2017. The increase is mainly due to more sales are achieved due to the good quality of our products and more reputation gained in the agricultural industry, and we added more diversity of our products, and therefore we can be able to attract more customers as discussed above. In addition, the increase is also attributable to more sales are achieved in different region of the PRC, such as Hainan Province, Guangdong Province and Shanxi Province upon establishment of our sales office in different regions. The increase is also slightly attributable to the introduction of our new product, Bio-water soluble fertilizer, in 2018.
| 38 |
Average selling prices of Biological Organic Fertilizers increased by $14.10 or 8% in the three months ended June 30, 2018 as compared with the same period of 2017 mainly due to RMB appreciation against USD of approximately 7% along with a slight increase of unit selling prices of approximately 1% because we have added more microorganism ingredient of the Biological Organic Fertilizers into our product mix. There are more microorganism species in the new products with this new product ingredient compared with the products that we sold in the second quarter of 2017. This new product with more microorganism ingredient will increase the effectiveness of our Biological Organic Fertilizers, and it’s easier for the plant to absorb. Therefore, the average selling prices goes higher.
Average selling prices of Compound Microbial Fertilizer increased by $26.55 or 8% in the three months ended June 30, 2018 as compared with the same period of 2017 mainly due to RMB appreciation against USD of approximately 7% along with a slight increase of unit selling prices of approximately 1% for the same reason as discussed above. Therefore, the average selling prices goes higher.
Cost of Revenue
Our cost of revenues from our major product category are summarized as follows:
| For
the three months ended June 30, 2018 | For
the three months ended June 30, 2017 | Change | Change (%) | |||||||||||||
| Biological Organic Fertilizer | ||||||||||||||||
| Cost of sold and shipped in USD | $ | 1,968,584 | $ | - | $ | 1,968,584 | 100 | % | ||||||||
| Quantity sold and shipped in tons | 15,334 | - | 15,334 | 100 | % | |||||||||||
| Average unit cost | $ | 128.38 | $ | - | $ | 128.38 | 100 | % | ||||||||
| Compound Microbial Fertilizer | ||||||||||||||||
| Cost of sold and shipped in USD | $ | 1,900,474 | $ | - | $ | 1,900,474 | 100 | % | ||||||||
| Quantity sold and shipped in tons | 7,026 | - | 7,026 | 100 | % | |||||||||||
| Average unit cost | $ | 270.49 | $ | - | $ | 270.49 | 100 | % | ||||||||
| Bio-Water Soluble Fertilizer | ||||||||||||||||
| Sold and shipped in USD | $ | 4,444 | $ | - | $ | 4,444 | 100 | % | ||||||||
| Quantity sold in tons | 10 | - | 10 | 100 | % | |||||||||||
| Average unit cost | $ | 444.40 | $ | - | $ | 444.40 | 100 | % | ||||||||
Cost of revenue from Biological Organic Fertilizer, Compound Microbial Fertilizer and Bio-Water Soluble Fertilizer increased by approximately $2.0 million, $1.9 million and $4,444 or 100%, 100% and 100% to approximately $2.0 million, $1.9 million and $4,444 in the three months ended June 30, 2018 from $0 in the three months ended June 30, 2017. The increase is mainly due to more sales are achieved due to the good quality of our products and more reputation gained in the agricultural industry and therefore we can be able to attract more customers and we have deferred all of our revenue to be recognized for products shipped during the three months ended June 30, 2017. As a result, our cost of revenue increased accordingly along with our sales.
| 39 |
Non-GAAP analysis
Our cost of goods sold for our two major products categories are summarized as follows including cost of goods sold recognized and deferred under U.S. GAAP:
| For
the three months ended June 30, 2018 | For
the three months ended June 30, 2017 | Change | Change (%) | |||||||||||||
| Biological Organic Fertilizer | ||||||||||||||||
| Cost of sold and shipped in USD | $ | 4,287,011 | $ | 1,993,498 | $ | 2,293,513 | 115 | % | ||||||||
| Quantity sold and shipped in tons | 33,565 | 17,000 | 16,565 | 97 | % | |||||||||||
| Average unit cost | $ | 127.72 | $ | 117.26 | $ | 10.46 | 9 | % | ||||||||
| Compound Microbial Fertilizer | ||||||||||||||||
| Cost of sold and shipped in USD | $ | 4,875,231 | $ | 1,977,417 | $ | 2,897,814 | 147 | % | ||||||||
| Quantity sold and shipped in tons | 18,026 | 8,500 | 9,526 | 112 | % | |||||||||||
| Average unit cost | $ | 270.46 | $ | 232.64 | $ | 37.82 | 16 | % | ||||||||
| Bio-Water Soluble Fertilizer | ||||||||||||||||
| Sold and shipped in USD | $ | 4,444 | $ | - | $ | 4,444 | 100 | % | ||||||||
| Quantity sold in tons | 10 | - | 10 | 100 | % | |||||||||||
| Average unit cost | $ | 444.40 | $ | - | $ | 444.40 | 100 | % | ||||||||
The costs of goods sold of all of our products increased in the three months ended June 30, 2018 as compared to the three months ended June 30, 2017. The increase is mainly due to more sales are achieved due to the good quality of our products and more reputation gained in the agricultural industry and therefore we can be able to attract more customers as discussed above. As a result, our cost of revenue increased accordingly along with our sales.
Average unit cost of Biological Organic Fertilizers increased by $10.46 or 9% in the three months ended June 30, 2018 as compared with the same period of 2017 mainly due to the RMB appreciation against USD of approximately 7% along with the ingredient mix of raw material price increase of approximately 2%. The Chinese government has implemented strict environmental protection policies, resulting in a variety of raw material prices increased, therefore, the average unit cost goes higher. Average unit of Compound Microbial Fertilizer increased by $37.82 or 16% in the three months ended June 30, 2018 as compared with the same period of 2017 mainly due to the RMB appreciation against USD of approximately 7% along with the ingredient mix of raw material price increase of approximately 9% as the same reason as discussed above.
Gross Profit
Our gross profit from our major product category are summarized as follows:
| For
the three months ended June 30, 2018 | For
the three months ended June 30, 2017 | Change | Change (%) | |||||||||||||
| Biological Organic Fertilizer | ||||||||||||||||
| Gross Profit | $ | 932,233 | $ | - | $ | 932,233 | 100 | % | ||||||||
| Gross Profit Percentage | 32.1 | % | - | 32.1 | % | 100 | % | |||||||||
| Compound Microbial Fertilizer | ||||||||||||||||
| Gross Profit | $ | 526,087 | $ | - | $ | 526,087 | 100 | % | ||||||||
| Gross Profit Percentage | 21.7 | % | - | 21.7 | % | 100 | % | |||||||||
| Bio-Water Soluble Fertilizer | ||||||||||||||||
| Gross Profit | $ | 3,008 | $ | - | $ | 3,008 | 100 | % | ||||||||
| Gross Profit Percentage | 40.4 | % | - | 40.4 | % | 100 | % | |||||||||
Gross profit for all three of our products increased 100% for the three months ended June 30, 2018 as compared to the three months ended June 30, 2018 mainly due to more sales are achieved due to the good quality of our products and more reputation gained in the agricultural industry and therefore we can be able to attract more customers and we have deferred all of our revenue to be recognized for products shipped during the three months ended June 30, 2017 as discussed above.
| 40 |
Non-GAAP analysis
Our total gross profit from our two major products categories are summarized as follows including the gross profit recognized and deferred under U.S. GAAP:
| For
the three months ended June 30, 2018 | For
the three months ended June 30, 2017 | Change | Change (%) | |||||||||||||
| Biological Organic Fertilizer | ||||||||||||||||
| Gross Profit | $ | 2,056,074 | $ | 979,444 | $ | 1,076,630 | 110 | % | ||||||||
| Gross Profit Percentage | 32.4 | % | 32.9 | % | (0.5 | )% | (2 | )% | ||||||||
| Compound Microbial Fertilizer | ||||||||||||||||
| Gross Profit | $ | 1,348,814 | $ | 731,749 | $ | 617,065 | 84 | % | ||||||||
| Gross Profit Percentage | 21.7 | % | 27.0 | % | (5.3 | )% | (20 | )% | ||||||||
| Bio-Water Soluble Fertilizer | ||||||||||||||||
| Gross Profit | $ | 3,008 | $ | - | $ | 3,008 | 100 | % | ||||||||
| Gross Profit Percentage | 40.37 | % | - | 40.37 | % | 100 | % | |||||||||
Gross profit percentage for Biological Organic Fertilizer decreased from 32.9% for the three months ended June 30, 2017 to 32.4% for the three months ended June 30, 2018 mainly due to the increase in selling price of our products is less than the increase in unit cost as discussed above.
Gross profit percentage for Compound Microbial decreased from 27% for the three months ended June 30, 2017 to 21.7% for the three months ended June 30, 2018 mainly due to the increase in selling price of our products is less than the increase in unit cost as discussed above.
Although a variety of raw material prices increased during the three months ended June 30, 2018 as compared to the same period of 2017, we did not raise our selling price of our products at the same rate as compared to the raw material price increased rate. The major reason is mainly due to our customers are willing to cooperate with our supply chain financing model as discussed above, which they cooperated with the third-party financing companies to obtain approval of advancing and paying off our accounts receivable without waiting for the downstream customers of harvesting crops and realizing their profits to repay us in approximately 3 to 9 months as compared to the same period in 2017. By cooperating with our supply chain financing model, our customers will have to bear additional cost on interest and insurance expenses. As a result, we did not intend to pass on the raw materials price increase cost to our customers as we were able to receive our accounts receivable sooner than the 3 to 9 months period.
Research and Development Expenses
Research and development expenses was approximately $39,000 (RMB 250,000) for the three months ended June 30, 2018, keeping the same as the prior comparable period of RMB 250,000 in RMB and approximately $36,000 in USD. . On November 20, 2015, the Company signed a strategic cooperation agreement (the “Agreement”) with China Academy of Agricultural Science (“CAAS”)’s Institute of Agricultural Resources & Regional Planning (“IARRP”) and Institute of Agricultural Economy & Development (“IAED”). Pursuant to the Agreement, the Company will form a strategic partnership with the two institutes and establish an “International Cooperation Platform for Internet and Safe Agricultural Products”. To fund the cooperation platform’s R&D activities, the Company will provide RMB 1 million (approximately $160,000) per year to the Spatial Agriculture Planning Method & Applications Innovation Team that belongs to the Institutes. The term of the Agreement is for three years beginning November 20, 2015 and will expire on November 19, 2018. However, the Company is only liable for the annual funds to be provided to the extent of the contract obligations performed by CAAS IARRP and IAED, and the agreement is terminable before the three years’ commitment date based on negotiations of both parties. The Company contributed approximately $39,000 (RMB 250,000) for the three months ended June 30, 2018. The Company plans to contribute the remaining balance quarterly until the date of the Agreement expired on November 19, 2018.
| 41 |
Selling Expenses
Selling expenses for the three months ended June 30, 2018 and 2017 were $161,256 and $54,232, respectively. Selling expenses include salaries of sales personnel, sales commission, travel and entertainment as well as freight out expenses. The increase in selling expenses is mainly due to the increase of salary expenses. The increase in salary expenses is mainly because we have hired more sales managers in the second quarter of 2018 for the marketing of our products.
General and Administration Expenses
General and administrative expenses increased by approximately 142% from approximately $0.6 million in the three months period ended June 30, 2017 to approximately $1.5 million in the same period in 2018. General and administrative expenses include professional fees, officers’ compensation, depreciation and amortization, salaries, travel and entertainment, rent, office expense and telephone expense. The increase in general and administrative expenses is mainly attributed to business expansion and the establishment of Kiwa Asia in July 2017, Kiwa Xian in December 2017, Kiwa Shanxi in February 2018, and Kiwa Yangling in March 2018 where we did not have such expenses in the three months ended June 30, 2017, which contributed approximately $0.7 million increase. In addition, approximately $0.2 million increase of G&A expenses are attributable to the increase of professional fees, such as attorneys, auditors, financial consultants, IT consultants, and business strategic and development consultants as we need more professional to assist and support us for our business expansion.
Interest Expense
Net interest expense was $152,564 and $125,341 for the three months ended June 30, 2018 and 2017, respectively, representing an increase of approximately $27,223 or 22%. Interest expense included accrued interest on convertible note and other note payable, and the amortization of the convertible note discount for the three months ended June 30, 2018 and 2017. The increase in interest expenses is mainly attributed to newly issuance a 15% convertible notes issued in the middle of May 2017 where we incurred only one and a half month interest expense during the second quarter of 2017 on the notes for the three months ended June 30, 2017.
Income from discontinued operations, net of taxes
Gain from discontinued operations, net of taxes was $0 and $4,511,384 for the three months ended June 30, 2018 and 2017, respectively, which results in an increase of $4,511,384 from discontinued operations, net of taxes for the three months ended June 30, 2018 to the same period of 2017. Due to suffering from losses for several years, on February 11, 2017, the Company executed an Equity Transfer Agreement with Dian Shi Cheng Jing (Beijing) Technology Co. (“Transferee”) whereby the Company transferred all of its right, title and interest in Kiwa Bio-Tech Products (Shandong) Co., Ltd. (“Shandong”) to the Transferee for RMB 1.00. The government processing of the transaction was completed on April 12, 2017. This transaction was completed and effective on April 12, 2017. The Company recorded a net gain of approximately $4.5 million during the three months ended June 30, 2017 based on the discharge of the excess liabilities over the assets of the Kiwa Shandong.
Net Income (loss)
Net income (loss) for the three months ended June 30, 2018 decreased by approximately 117% from a profit of $3,695,264 to a loss of $635,368. Such change was the result of the combination of the changes as discussed above.
Results of Operations for Six months ended June 30, 2018 and June 30, 2017
The following table summarizes the results of our operations during the six months periods ended June 30, 2018 and 2017, respectively, and provides information regarding the dollar and percentage increase or (decrease) during such periods.
| 42 |
| Six months Ended June 30, | Change | Change | ||||||||||||||
| Statement of Operations Data: | 2018 | 2017 | (Amount) | (Percentage) | ||||||||||||
| (As Restated) | ||||||||||||||||
| Revenues | $ | 14,086,221 | $ | - | $ | 14,086,221 | 100 | % | ||||||||
| Cost of goods sold | (10,180,066 | ) | - | (10,180,066 | ) | (100 | )% | |||||||||
| Gross profit | 3,906,155 | - | 3,906,155 | 100 | % | |||||||||||
| Operating expenses | ||||||||||||||||
| Research and development | 78,543 | 72,724 | 5,819 | 8 | % | |||||||||||
| Selling expenses | 345,567 | 90,485 | 255,082 | 282 | % | |||||||||||
| General and administrative | 3,079,028 | 1,033,437 | 2,045,591 | 198 | % | |||||||||||
| Total operating expenses | 3,503,138 | 1,196,646 | 2,306,492 | 193 | % | |||||||||||
| Operating Income (Loss) | 403,017 | (1,196,646 | ) | 1,599,663 | (134 | )% | ||||||||||
| Other income/(expense), net | ||||||||||||||||
| Change in fair value of derivative liabilities | 202,371 | (6,561 | ) | 208,932 | (3,184 | )% | ||||||||||
| Interest expense | (307,927 | ) | (187,131 | ) | (120,796 | ) | 65 | % | ||||||||
| Other income/ (expense) | (905 | ) | 800 | (1,705 | ) | (213 | )% | |||||||||
| Exchange gain (loss) | 18,253 | (17,075 | ) | 35,328 | (207 | )% | ||||||||||
| Total other income/(expense), net | (88,208 | ) | (209,967 | ) | 121,759 | (58 | )% | |||||||||
| Income (loss) from continuing operations before income taxes | 314,809 | (1,406,613 | ) | 1,721,422 | (122 | )% | ||||||||||
| (Provision) benefit for income taxes | ||||||||||||||||
| Current | (897,209 | ) | (599,022 | ) | (298,187 | ) | 50 | % | ||||||||
| Deferred | - | 698,243 | (698,243 | ) | (100 | )% | ||||||||||
| Total (provision) benefit for income taxes | (897,209 | ) | 99,221 | (996,430 | ) | (1,004 | )% | |||||||||
| Income (loss) from continuing operations | (582,400 | ) | (1,307,392 | ) | 724,992 | (55 | )% | |||||||||
| Income from discontinued operations, net of taxes | - | 4,512,182 | (4,512,182 | ) | (100 | )% | ||||||||||
| Net Income (loss) | $ | (582,400 | ) | $ | 3,204,790 | $ | (3,787,190 | ) | (118 | )% | ||||||
Revenue
Revenue increased by approximately $14.1 million or 100%, to approximately $14.1 million in the six months ended June 30, 2018 from $0 in the six months ended June 30, 2017. The increase is mainly due to: 1) more sales are achieved due to the good quality of our products and more reputation gained in the agricultural industry; 2) more sales are achieved in different regions of the PRC, such as Hainan Province, Guangdong Province and Shanxi Province upon establishment of our sales office in different regions, and 3) introduction of our new product, Bio-water soluble fertilizer, during the six months ended June 30, 2018. As a result, our revenue increased significantly for the six months ended June 30, 2018 as compared to the same period in 2017. In addition, approximately $7.2 million and $8.8 million of our revenues was being deferred for the six months ended June 30, 2018 and June 30, 2017 respectively, as discusses in the non-GAAP analysis section below.
We currently realized revenue in three major product categories of Biological Organic Fertilizer, Compound Microbial Fertilizer and Bio-Water Soluble Fertilizer. We sold and shipped Biological Organic Fertilizer and Compound Microbial Fertilizer in the first two quarters of 2017 and recorded the selling amount in deferred revenue as our revenue recognition criteria has not been met. Our revenues from our major product category are summarized as follows:
| 43 |
| For the six months ended June 30, 2018 | For the six months ended June 30, 2017 | Change | Change (%) | |||||||||||||
| Biological Organic Fertilizer | ||||||||||||||||
| Revenue in USD | $ | 7,126,132 | $ | - | $ | 7,126,132 | 100 | % | ||||||||
| Quantity sold in tons | 37,702 | - | 37,702 | 100 | % | |||||||||||
| Average selling price | $ | 189.01 | $ | - | $ | 189.01 | 100 | % | ||||||||
| Compound Microbial Fertilizer | ||||||||||||||||
| Sold and shipped in USD | $ | 6,929,867 | $ | - | $ | 6,929,867 | 100 | % | ||||||||
| Quantity sold in tons | 20,049 | - | 20,049 | 100 | % | |||||||||||
| Average selling price | $ | 345.65 | $ | - | $ | 345.65 | 100 | % | ||||||||
| Bio-Water Soluble Fertilizer | ||||||||||||||||
| Sold and shipped in USD | $ | 30,222 | $ | - | $ | 30,222 | 100 | % | ||||||||
| Quantity sold in tons | 72 | - | 72 | 100 | % | |||||||||||
| Average selling price | $ | 419.75 | $ | - | $ | 419.75 | 100 | % | ||||||||
Revenue from Biological Organic Fertilizer, Compound Microbial Fertilizer and Bio-Water Soluble Fertilizer increased by approximately $7.1 million, $6.9 million and $30,222 or 100%, 100% and 100% to $7.1 million, $6.9 million and $30,222, respectively, in the six months ended June 30, 2018 from $0 in the six months ended June 30, 2017. The increase is mainly due to more sales are achieved due to the good quality of our products and more reputation gained in the agricultural industry and therefore we can be able to attract more customers and we have deferred all of our revenue to be recognized for products shipped during the six months ended June 30, 2017.
Compound Microbial Fertilizer is adding appropriate amount of nitrogen, phosphorus, potassium and other nutrients into Biological Organic Fertilizer. Through the action of organic matter and beneficial microorganisms, the utilization rate of nitrogen, phosphorus, potassium can be significantly improved. The Bio-Water Soluble Fertilizer is mainly another form of the biological fertilizer that we firstly introduced in the first quarter of 2018. It is in the form of powder which has high water solubility, and it is convenient for the farmers to use during the drop irrigation. Compound Microbial Fertilizer and Bio-Water Soluble Fertilizer generally contain more microorganism and have a higher effectiveness on the productivity of crops and increasing the value and quality of the crops harvested than Biological Organic Fertilizer. As a result, our Compound Microbial Fertilizer and Bio-Water Soluble Fertilizer generally have a higher average selling price as compared to Biological Organic Fertilizer.
Because the Chinese Government is continuing to promote green environment and implement quality standards and environmentally sensitive policies in the Agricultural industry, we expect our revenues from our innovated and highly effective products, Compound Microbial Fertilizer and Bio-Water Soluble Fertilizer, will continue to grow in a higher rate than that from Biological Organic Fertilizer. Our Compound Microbial Fertilizer and Bio-Water Soluble Fertilizer generally have a higher effectiveness on the productivity of crops that are suitable for promoting green environment. In addition, our marketing team is expanding to the Western areas of China and Hainan province and we expect our revenues will continue to grow in the third and fourth quarters of 2018. Meanwhile, we expect to continue to gain more market shares in our existing sales channel bases in the Northern and the Southern areas of China due to the good quality of the products and better reputation in the industry.
| 44 |
Non-GAAP analysis
Our strategy on the expansion of our business was to gain market shares in the bio-fertilizer market, thereby, we have extended credit to our customers. Our current payment terms on these customers are ranging from 60 days to 9 months after receipts of the goods depending on the creditworthiness of these customers. These customers are mainly agricultural cooperative company and distributors who then resell our products to individual farmers. Because the crop growing cycle usually takes approximately 3 to 9 months in the agricultural industry, it will take approximately similar time frame of 3 to 9 months for farmers to harvest crops and to realize profits to repay our distributors. As a result, for the sales contracts with these customers, the collectability of payment is highly dependent on the successful harvest of corps and the customers’ ability to collect money from farmers. The Company deemed the collectability of payment may not be reasonably assured until after the Company get paid. Starting in March 2018, the Company began to use a supply chain financing model, which the Company’s customers engage with third party financing companies to advance the Company’s accounts receivable on its behalf without recourse to the Company. The Company’s customers are required to purchase an insurance product to cover the risk of bad weather or any other reason which they are not able to harvest crops and to realize profits of repaying the third-party financing companies. This model allows the Company to collect its accounts receivables sooner than the 3 to 9 months crop growing period. The Company deemed the collectability of payment may not be reasonably assured until after the Company get paid from these financing companies. For those sales contracts that the Company has shipped its products but the payment is contingent on collections of payments from the downstream customers or is contingent on the approval of the financing companies to advance payment on behalf of the Company’s customers, the Company considers the revenue recognition criteria are not met using the five-step model under the new guidance and therefore defers the revenue and cost of goods sold until payments are collected. We have sold and shipped approximately $21.3 million of our products during the six months ended June 30, 2018, approximately $7.2 million of which the revenue recognition criteria of collectability of payments is reasonably assured has not yet been met, and we have deferred approximately these revenues to be recognized in the future periods when our collectability of payments will be assured. We have sold and shipped approximately $8.8 million of our products during the six months ended June 30, 2017, all of which the revenue recognition criteria of collectability of payments is reasonably assured has not yet been met, and we have deferred all of these revenues to be recognized in the future periods when our collectability of payments will be assured.
Our sales and shipment from our two major products categories are summarized as follows including revenue recognized and deferred under U.S. GAAP:
| For the six months ended June 30, 2018 | For the six months ended June 30, 2017 | Change | Change (%) | |||||||||||||
| Biological Organic Fertilizer | ||||||||||||||||
| Sold and shipped in USD | $ | 10,566,522 | $ | 5,637,613 | $ | 4,928,909 | 87 | % | ||||||||
| Quantity sold in tons | 55,906 | 32,300 | 23,606 | 73 | % | |||||||||||
| Average selling price | $ | 189.01 | $ | 174.54 | $ | 14.47 | 8 | % | ||||||||
| Compound Microbial Fertilizer | ||||||||||||||||
| Sold and shipped in USD | $ | 10,731,354 | $ | 3,190,284 | $ | 7,541,070 | 236 | % | ||||||||
| Quantity sold in tons | 31,049 | 10,020 | 21,029 | 210 | % | |||||||||||
| Average selling price | $ | 345.63 | $ | 318.39 | $ | 27.23 | 9 | % | ||||||||
| Bio-Water Soluble Fertilizer | ||||||||||||||||
| Sold and shipped in USD | $ | 30,222 | $ | - | $ | 30,222 | 100 | % | ||||||||
| Quantity sold in tons | 72 | - | 72 | 100 | % | |||||||||||
| Average selling price | $ | 419.75 | $ | - | $ | 419.75 | 100 | % | ||||||||
The sales and shipment of all our products increased in the six months ended June 30, 2018 as compared to the six months ended June 30, 2017. The increase is mainly due to more sales are achieved due to the good quality of our products and more reputation gained in the agricultural industry and we added more diversity of our products, and therefore we can be able to attract more customers as discussed above. In addition, the increase is also attributable to more sales are achieved in different region of the PRC, such as Hainan Province, Guangdong Province and Shanxi Province upon establishment of our sales office in different regions. The increase is also slightly attributable to the introduction of our new product, Bio-water soluble fertilizer, in 2018.
Average selling prices of Biological Organic Fertilizers increased by $14.47 or 8% in the six months ended June 30, 2018 as compared with the same period of 2017 mainly due to RMB appreciation against USD of approximately 7% along with a slight increase of unit selling prices of approximately 1% because we have added more microorganism ingredient of the Biological Organic Fertilizers into our product mix. There are more microorganism species in the new products with this new product ingredient compared with the products that we sold in the first two quarters of 2017. This new product with more microorganism ingredient will increase the effectiveness of our Biological Organic Fertilizers, and it’s easier for the plant to absorb. Therefore, the average selling prices goes higher.
| 45 |
Average selling prices of Compound Microbial Fertilizer increased by $27.23 or 9% in the six months ended June 30, 2018 as compared with the same period of 2017 mainly due to RMB appreciation against USD of approximately 7% along with a slight increase of unit selling prices of approximately 2% for the same reason as discussed above. Therefore, the average selling prices goes higher.
Cost of Revenue
Our cost of revenues from our major product category are summarized as follows:
| For the six months ended June 30, 2018 | For the six months ended June 30, 2017 | Change | Change (%) | |||||||||||||
| Biological Organic Fertilizer | ||||||||||||||||
| Cost of sold and shipped in USD | $ | 4,834,082 | $ | - | $ | 4,834,082 | 100 | % | ||||||||
| Quantity sold and shipped in tons | 37,702 | - | 37,702 | 100 | % | |||||||||||
| Average unit cost | $ | 128.22 | $ | - | $ | 128.22 | 100 | % | ||||||||
| Compound Microbial Fertilizer | ||||||||||||||||
| Cost of sold and shipped in USD | $ | 5,325,880 | $ | - | $ | 5,325,880 | 100 | % | ||||||||
| Quantity sold and shipped in tons | 20,049 | - | 20,049 | 100 | % | |||||||||||
| Average unit cost | $ | 265.64 | $ | - | $ | 265.64 | 100 | % | ||||||||
| Bio-Water Soluble Fertilizer | ||||||||||||||||
| Sold and shipped in USD | $ | 20,104 | $ | - | $ | 20,104 | 100 | % | ||||||||
| Quantity sold in tons | 72 | - | 72 | 100 | % | |||||||||||
| Average unit cost | $ | 279.22 | $ | - | $ | 279.22 | 100 | % | ||||||||
Cost of revenue from Biological Organic Fertilizer, Compound Microbial Fertilizer and Bio-Water Soluble Fertilizer increased by approximately $4.8 million, $5.3 million and $20,000 or 100%, 100% and 100% to approximately $4.8 million, $5.3 million and $20,000 in the six months ended June 30, 2018 from $0 in the six months ended June 30, 2017. The increase is mainly due to more sales are achieved due to the good quality of our products and more reputation gained in the agricultural industry and therefore we can be able to attract more customers and we have deferred all of our revenue to be recognized for products shipped during the six months ended June 30, 2017. As a result, our cost of revenue increased accordingly along with our sales.
Non-GAAP analysis
Our cost of goods sold for our two major products categories are summarized as follows including cost of goods sold recognized and deferred under U.S. GAAP:
| For the six months ended June 30, 2018 | For the six months ended June 30, 2017 | Change | Change (%) | |||||||||||||
| Biological Organic Fertilizer | ||||||||||||||||
| Cost of sold and shipped in USD | $ | 7,150,254 | $ | 3,688,657 | $ | 3,461,597 | 94 | % | ||||||||
| Quantity sold and shipped in tons | 55,906 | 32,300 | 23,606 | 73 | % | |||||||||||
| Average unit cost | $ | 127.90 | $ | 114.20 | $ | 13.70 | 12 | % | ||||||||
| Compound Microbial Fertilizer | ||||||||||||||||
| Cost of sold and shipped in USD | $ | 8,303,772 | $ | 2,346,267 | $ | 5,957,505 | 254 | % | ||||||||
| Quantity sold and shipped in tons | 31,049 | 10,020 | 21,029 | 210 | % | |||||||||||
| Average unit cost | $ | 267.44 | $ | 234.16 | $ | 33.28 | 14 | % | ||||||||
| Bio-Water Soluble Fertilizer | ||||||||||||||||
| Sold and shipped in USD | $ | 20,575 | $ | - | $ | 20,575 | 100 | % | ||||||||
| Quantity sold in tons | 72 | - | 72 | 100 | % | |||||||||||
| Average unit cost | $ | 285.76 | $ | - | $ | 285.76 | 100 | % | ||||||||
| 46 |
The costs of goods sold of all of our products increased in the six months ended June 30, 2018 as compared to the six months ended June 30, 2017. The increase is mainly due to more sales are achieved due to the good quality of our products and more reputation gained in the agricultural industry and therefore we can be able to attract more customers as discussed above. As a result, our cost of revenue increased accordingly along with our sales.
Average unit cost of Biological Organic Fertilizers increased by $13.70 or 12% in the six months ended June 30, 2018 as compared with the same period of 2017 mainly due to the RMB appreciation against USD of approximately 7% along with the ingredient mix of raw material price increase of approximately 5%. The Chinese government has implemented strict environmental protection policies, resulting in a variety of raw material prices increased, therefore, the average unit cost goes higher.
Average unit of Compound Microbial Fertilizer increased by $33.28 or 14% in the six months ended June 30, 2018 as compared with the same period of 2017 mainly due to the RMB appreciation against USD of approximately 7% along with the ingredient mix of raw material price increase of approximately 7% as the same reason as discussed above.
Gross Profit
Our gross profit from our major product category are summarized as follows:
| For the six months ended June 30, 2018 | For the six months ended June 30, 2017 | Change | Change (%) | |||||||||||||
| Biological Organic Fertilizer | ||||||||||||||||
| Gross Profit | $ | 2,292,050 | $ | - | $ | 2,292,050 | 100 | % | ||||||||
| Gross Profit Percentage | 32.2 | % | - | 32.2 | % | 100 | % | |||||||||
| Compound Microbial Fertilizer | ||||||||||||||||
| Gross Profit | $ | 1,603,987 | $ | - | $ | 16,03,987 | 100 | % | ||||||||
| Gross Profit Percentage | 23.1 | % | - | 23.1 | % | 100 | % | |||||||||
| Bio-Water Soluble Fertilizer | ||||||||||||||||
| Gross Profit | $ | 10,118 | $ | - | $ | 10,118 | 100 | % | ||||||||
| Gross Profit Percentage | 33.5 | % | - | 33.5 | % | 100 | % | |||||||||
Gross profit for all three of our products increased 100% for the six months ended June 30, 2018 as compared to the six months ended June 30, 2018 mainly due to more sales are achieved due to the good quality of our products and more reputation gained in the agricultural industry and therefore we can be able to attract more customers and we have deferred all of our revenue to be recognized for products shipped during the six months ended June 30, 2017 as discussed above.
| 47 |
Non-GAAP analysis
Our total gross profit from our two major products categories are summarized as follows including the gross profit recognized and deferred under U.S. GAAP:
| For
the six months ended June 30, 2018 |
For
the six months ended June 30, 2017 |
Change | Change (%) | |||||||||||||
| Biological Organic Fertilizer | ||||||||||||||||
| Gross Profit | $ | 3,416,268 | $ | 1,948,956 | $ | 1,467,312 | 75 | % | ||||||||
| Gross Profit Percentage | 32.3 | % | 34.6 | % | (2.3 | )% | (7 | )% | ||||||||
| Compound Microbial Fertilizer | ||||||||||||||||
| Gross Profit | $ | 2,427,582 | $ | 844,017 | $ | 1,583,565 | 188 | % | ||||||||
| Gross Profit Percentage | 22.6 | % | 26.5 | % | (3.9 | )% | (15 | )% | ||||||||
| Bio-Water Soluble Fertilizer | ||||||||||||||||
| Gross Profit | $ | 9,647 | $ | - | $ | 9,647 | 100 | % | ||||||||
| Gross Profit Percentage | 31.9 | % | - | 31.9 | % | 100 | % | |||||||||
Gross profit percentage for Biological Organic Fertilizer decreased from 34.6% for the six months ended June 30, 2017 to 32.3% for the six months ended June 30, 2018 mainly due to the increase in selling price of our products is less than the increase in unit cost as discussed above.
Gross profit percentage for Compound Microbial decreased from 26.5% for the six months ended June 30, 2017 to 22.6% for the six months ended June 30, 2018 mainly due to the increase in selling price of our products is less than the increase in unit cost as discussed above.
Although a variety of raw material prices increased during the six months ended June 30, 2018 as compared to the same period of 2017, we did not raise our selling price of our products at the same rate as compared to the raw material price increased rate. The major reason is mainly due to our customers are willing to cooperate with our supply chain financing model as discussed above, which they cooperated with the third-party financing companies to obtain approval of advancing and paying off our accounts receivable without waiting for the downstream customers of harvesting crops and realizing their profits to repay us in approximately 3 to 9 months as compared to the same period in 2017. By cooperating with our supply chain financing model, our customers will have to bear additional cost on interest and insurance expenses. As a result, we did not intend to pass on the raw materials price increase cost to our customers as we were able to receive our accounts receivable sooner than the 3 to 9 months period.
Research and Development Expenses
Research and development expenses was approximately $79,000 (RMB 500,000) for the six months ended June 30, 2018, keeping the same as the prior comparable period of RMB 500,000 and approximately $73,000 in USD. On November 20, 2015, the Company signed a strategic cooperation agreement (the “Agreement”) with China Academy of Agricultural Science (“CAAS”)’s Institute of Agricultural Resources & Regional Planning (“IARRP”) and Institute of Agricultural Economy & Development (“IAED”). Pursuant to the Agreement, the Company will form a strategic partnership with the two institutes and establish an “International Cooperation Platform for Internet and Safe Agricultural Products”. To fund the cooperation platform’s R&D activities, the Company will provide RMB 1 million (approximately $160,000) per year to the Spatial Agriculture Planning Method & Applications Innovation Team that belongs to the Institutes. The term of the Agreement is for three years beginning November 20, 2015 and will expire on November 19, 2018. However, the Company is only liable for the annual funds to be provided to the extent of the contract obligations performed by CAAS IARRP and IAED, and the agreement is terminable before the three years’ commitment date based on negotiations of both parties. The Company contributed approximately $79,000 (RMB 500,000) for the six months ended June 30, 2018. The Company plans to contribute the remaining balance quarterly until the date of the Agreement expired on November 19, 2018.
Selling Expenses
Selling expenses for the six months ended June 30, 2018 and 2017 were approximately $346,000 and $90,000, respectively. Selling expenses include salaries of sales personnel, sales commission, travel and entertainment as well as freight out expenses. The increase in selling expenses is mainly due to the increase of salary expenses. The increase in salary expenses is mainly because we have hired more sales managers in the first two quarters of 2018 for the marketing of our products.
| 48 |
General and Administration Expenses
General and administrative expenses increased by approximately 198% from approximately $1.0 million in the six months period ended June 30, 2017 to approximately $3.1 million in the same period in 2018. General and administrative expenses include professional fees, officers’ compensation, depreciation and amortization, salaries, travel and entertainment, rent, office expense and telephone expense. The increase in general and administrative expenses is mainly attributed to business expansion and the establishment of Kiwa Asia in July 2017, Kiwa Xian in December 2017, Kiwa Shanxi in February 2018, and Kiwa Yangling in March 2018 where we did not have such expenses in the six months ended June 30, 2017, which contributed approximately $1.1 million increase. In addition, approximately $1.1 million increase of G&A expenses are attributable to the increase of professional fees, such as attorneys, auditors, financial consultants, IT consultants, and business strategic and development consultants as we need more professional to assist and support us for our business expansion.
Interest Expense
Net interest expense was $307,927 and $187,131 for the six months ended June 30, 2018 and 2017, respectively, representing an increase of approximately $120,796 or 65%. Interest expense included accrued interest on convertible note and other note payable, and the amortization of the convertible note discount for the six months ended June 30, 2018 and 2017. The increase in interest expenses is mainly attributed to newly issuance a 15% convertible notes issued in the middle of May 2017 where we incurred only one and a half month interest expense during the six months ended June 30, 2017 on the notes for the six months ended June 30, 2017.
Income from discontinued operations, net of taxes
Gain from discontinued operations, net of taxes was $0 and $4,512,182 for the six months ended June 30, 2018 and 2017, respectively, which results in an increase of $4,512,182 from discontinued operations, net of taxes for the six months ended June 30, 2018 to the same period of 2017. Due to suffering from losses for several years, On February 11, 2017, the Company executed an Equity Transfer Agreement with Dian Shi Cheng Jing (Beijing) Technology Co. (“Transferee”) whereby the Company transferred all of its right, title and interest in Kiwa Bio-Tech Products (Shandong) Co., Ltd. (“Shandong”) to the Transferee for RMB 1.00. The government processing of the transaction was completed on April 12, 2017. This transaction was completed and effective on April 12, 2017. The Company recorded a net gain of approximately $4.5 million during the six months ended June 30, 2017 based on the discharge of the excess liabilities over the assets of the Kiwa Shandong.
Net Income (loss)
Net income for the six months ended June 30, 2018 decreased by approximately 118% from a profit of $3,204,790 to a loss of $582,400. Such change was the result of the combination of the changes as discussed above.
Critical Accounting Policies and Estimates
We prepared our unaudited condensed consolidated financial statements in accordance with accounting principles generally accepted in the United States of America. The preparation of these financial statements requires the use of estimates and assumptions that affect the reported amounts of assets and liabilities and the disclosure of contingent assets and liabilities at the date of the financial statements and the reported amount of revenues and expenses during the reporting period. Management periodically evaluates the estimates and judgments made. Management bases its estimates and judgments on historical experience and on various factors that are believed to be reasonable under current circumstances. Actual results may differ from these estimates as a result of different assumptions or conditions.
The following critical accounting policies affect the more significant judgments and estimates used in the preparation of our consolidated financial statements. In addition, you should refer to our accompanying unaudited condensed consolidated balance sheets as of June 30, 2018, and the unaudited condensed consolidated statements of operations and comprehensive income, and cash flows for the three and six months ended June 30, 2018, and the related notes thereto, for further discussion of our accounting policies.
| 49 |
Revenue Recognition
On January 1, 2018 we adopted Accounting Standards Update (“ASU”) 2014-09 Revenue from Contracts with Customers (FASB ASC Topic 606) using the modified retrospective method for contracts that were not completed as of January 1, 2018. We did not result in an adjustment to the retained earnings upon adoption of this new guidance as the Company’s revenue was recognized based on the amount of consideration we expect to receive in exchange for satisfying the performance obligations.
The core principle underlying the revenue recognition ASU is that the Company will recognize revenue to represent the transfer of goods and services to customers in an amount that reflects the consideration to which the Company expects to be entitled in such exchange. This will require the Company to identify contractual performance obligations and determine whether revenue should be recognized at a point in time or over time, based on when control of goods and services transfers to a customer. The Company’s revenue streams are recognized at a point in time.
The ASU requires the use of a new five-step model to recognize revenue from customer contracts. The five-step model requires that the Company (i) identify the contract with the customer, (ii) identify the performance obligations in the contract, (iii) determine the transaction price, including variable consideration to the extent that it is probable that a significant future reversal will not occur, (iv) allocate the transaction price to the respective performance obligations in the contract, and (v) recognize revenue when (or as) the Company satisfies the performance obligation. The application of the five-step model to the revenue streams compared to the prior guidance did not result in significant changes in the way the Company records its revenue. Upon adoption, the Company evaluated its revenue recognition policy for all revenue streams within the scope of the ASU under previous standards and using the five-step model under the new guidance and confirmed that there were no differences in the pattern of revenue recognition.
The Company continues to derive its revenues from sales contracts with its customers with revenues being recognized upon delivery of products. Persuasive evidence of an arrangement is demonstrated via sales contract and invoice; and the sales price to the customer is fixed upon acceptance of the sales contract and there is no separate sales rebate, discount, or volume incentive. The Company recognizes revenue when title and ownership of the goods are transferred upon shipment to the customer by the Company to consider control of goods are transferred to its customer and collectability of payment is reasonably assured. The Company’s revenues are recognized at a point in time after all performance obligations are satisfied.
The Company’s customers are mainly agricultural cooperative company and distributors who then resell the Company’s products to individual farmers. Because the crop growing cycle usually takes approximately 3 to 9 months in the agricultural industry for some of these Co-ops and distributors, will take approximately similar time frame of 3 to 9 months for farmers to harvest crops and to realize profits to repay the resellers. As a result, for the sales contracts with these customers, the collectability of payment is highly dependent on the successful harvest of corps and the customers’ ability to collect money from farmers. The Company deemed the collectability of payment may not be reasonably assured until after the Company get paid. Collectability is a necessary condition for the contract to be accounted for to meet the criteria of the first step “identifying the contract with the customer” under the new revenue guidance in ASC 606. As a result, the sales contracts with these customers are not considered a contract under ASC 606, thus the shipments under these contracts are not recognized as revenue until all criteria for “identifying the contract with the customer” and revenue recognition are met using the five-step model.
Deferred Revenue and Deferred Cost of Goods Sold
Deferred revenue and deferred cost of goods sold result from transactions where the Company has shipped product for which all revenue recognition criteria under the five-step model have not yet been met. Though these contracts are not considered a contract under ASC 606, they are legally enforceable, and the Company has an unconditional and immediate right to payment after the Company has shipped products, therefore, the Company recognizes a receivable and a corresponding deferred revenue upon shipment. Deferred cost of goods sold related to deferred product revenues includes direct inventory costs. Once all revenue recognition criteria under the five-step model have been met, the deferred revenues and associated cost of goods sold are recognized.
| 50 |
Accounts receivable and allowance for doubtful accounts
Accounts receivable represent customer accounts receivables. The Company provides an allowance for doubtful accounts equal to the estimated uncollectible amounts. The Company’s estimate is based on historical collection experience, the economic environment trends in the microbial fertilizer industry, and a review of the current status of trade accounts receivable. Management reviews its accounts receivable each reporting period to determine if the allowance for doubtful accounts is adequate. Such allowances, if any, would be recorded in the period the impairment is identified. It is reasonably possible that the Company’s estimate of the allowance for doubtful accounts will change. Uncollectible accounts receivables are charged against the allowance for doubtful accounts when all reasonable efforts to collect the amounts due have been exhausted.
Impairment of Long-Lived Assets
The Company’s long-lived assets consist of property and equipment. The Company evaluates its investment in long-lived assets for recoverability whenever events or changes in circumstances indicate the net carrying amount may not be recoverable. It is possible that these assets could become impaired as a result of legal factors, market conditions, operational performance indicators, technological or other industry changes. If circumstances require a long-lived asset or asset group to be tested for possible impairment, the Company first compares undiscounted cash flows expected to be generated by that asset or asset group to its carrying value. If the carrying value of the long-lived asset or asset group is not recoverable on an undiscounted cash flow basis, an impairment is recognized to the extent that the carrying value exceeds its fair value. Fair value is determined through various valuation techniques, including discounted cash flow models, quoted market values and third-party independent appraisals, as considered necessary.
Related Parties
The Company follows subtopic 850-10 of the FASB Accounting Standards Codification for the identification of related parties and disclosure of related party transactions. Pursuant to Section 850-10-20 the related parties include: a) affiliates of the Company; b) entities for which investments in their equity securities would be required, absent the election of the fair value option under the Fair Value Option Subsection of Section 825–10–15, to be accounted for by the equity method by the investing entity; c) trusts for the benefit of employees, such as pension and profit-sharing trusts that are managed by or under the trusteeship of management; d) principal owners of the Company; e) management of the Company; f) other parties with which the Company may deal if one party controls or can significantly influence the management or operating policies of the other to an extent that one of the transacting parties might be prevented from fully pursuing its own separate interests; and g) other parties that can significantly influence the management or operating policies of the transacting parties or that have an ownership interest in one of the transacting parties and can significantly Influence the other to an extent that one or more of the transacting parties might be prevented from fully pursuing its own separate interests.
The disclosures shall include: a. the nature of the relationship(s) involved; b. a description of the transactions, including transactions to which no amounts or nominal amounts were ascribed, for each of the periods for which income statements are presented, and such other information deemed necessary to an understanding of the effects of the transactions on the consolidated financial statements; c. the dollar amounts of transactions for each of the periods for which income statements are presented and the effects of any change in the method of establishing the terms from that used in the preceding period; and d. amounts due from or to related parties as of the date of each balance sheet presented and, if not otherwise apparent, the terms and manner of settlement.
Income Taxes
The Company accounts for income taxes under the provisions of FASB ASC Topic 740, “Income Tax,” which requires recognition of deferred tax assets and liabilities for the expected future tax consequences of events that have been included in the consolidated financial statements or tax returns. Deferred tax assets and liabilities are recognized for the future tax consequence attributable to the difference between the tax bases of assets and liabilities and their reported amounts in the financial statements. Deferred tax assets and liabilities are measured using the enacted tax rate expected to apply to taxable income in the years in which those temporary differences are expected to be recovered or settled. The effect on deferred tax assets and liabilities of a change in tax rates is recognized in income in the period that includes the enactment date. The Company establishes a valuation when it is more likely than not that the assets will not be recovered.
| 51 |
ASC Topic 740-10, “Accounting for Uncertainty in Income Taxes,” defines uncertainty in income taxes and the evaluation of a tax position as a two-step process. The first step is to determine whether it is more likely than not that a tax position will be sustained upon examination, including the resolution of any related appeals or litigation based on the technical merits of that position. The second step is to measure a tax position that meets the more-likely-than-not threshold to determine the amount of benefit to be recognized in the financial statements. A tax position is measured at the largest amount of benefit that is greater than 50 percent likelihood of being realized upon ultimate settlement. Tax positions that previously failed to meet the more-likely-than-not recognition threshold should be recognized in the first subsequent period in which the threshold is met. Previously recognized tax positions that no longer meet the more-likely-than-not criteria should be de-recognized in the first subsequent financial reporting period in which the threshold is no longer met. Penalties and interest incurred related to underpayment of income tax are classified as income tax expense in the period incurred.
Liquidity and Capital Resources
In assessing our liquidity, we monitor and analyze our cash on-hand and our operating and capital expenditure commitments. Our liquidity needs is to meet our working capital requirements, operating expenses and capital expenditure obligations.
Our business is capital intensive as we need to make advance payment to our suppliers to secure timely delivery and current market price of raw materials. Debt financing in the form of notes payable and loans from related parties have been utilized to finance our working capital requirements. As of June 30, 2018, our working capital was approximately $11.8 million and we had cash of approximately $5.1 million, with remaining current assets mainly composed of accounts receivable, advance to suppliers and deferred cost of goods sold.
We may have to consider supplementing our available sources of funds for operations through the following sources:
| ● | We will continuously seek additional equity financing to support our working capital; | |
| ● | other available sources of financing from PRC banks and other financial institutions; and | |
| ● | financial support and credit guarantee commitments from our major shareholder |
The following table set forth summary of our cash flows for the periods indicated:
| For the six months ended June 30, | ||||||||
| 2018 | 2017 | |||||||
| Net cash provided by (used in) operating activities | $ | 3,758,521 | $ | (2,333,946 | ) | |||
| Net cash used in investing activities | (3,488 | ) | (147,782 | ) | ||||
| Net cash provided by financing activities | 444,711 | 2,454,463 | ||||||
| Effect of exchange rate changes on cash | (201,693 | ) | 85,350 | |||||
| Net increase in cash | 3,998,051 | 58,085 | ||||||
| Cash, beginning of period | 1,083,539 | 13,469 | ||||||
| Cash, end of period | $ | 5,081,590 | $ | 71,554 | ||||
| 52 |
Operating Activities
Net cash provided by operating activities was approximately $3.8 million for the six months ended June 30, 2018, compared to cash used in operating activities of approximately $2.3 million for the same period in 2017. Net cash provided by operating activities for the six months ended June 30, 2018 was primarily attributable to 1) decrease of approximately of $6.6 million advance to suppliers as we previously secure current market price of raw materials purchases which we were anticipating the raw materials price is on the rise in the near future and we have received significant portion of the inventory for production and shipment accordingly during the period; 2) decrease of approximately $1.0 million of inventory as we have shipped out more products on our inventory that we previously stocked up for productions during the period; 3) increase of approximately $0.9 million of taxes payable as we incurred more taxes payables from our operations; 4) increase of approximately $0.8 million of other payables and accruals as we incurred more payable from our operations; 5) approximately $1.3 million of non-cash stock compensation issued for consulting fees and officer salaries; 6) increase of approximately $7.2 million of deferred revenue and increase of approximately $5.3 million of deferred cost of goods sold as we deferred our revenues and cost of goods sold due to our evaluation of the collectability with our customers until all revenue recognition criteria under the five-step model have been met; offset by; 7) increase of approximately $7.2 million of accounts receivable as we shipped out approximately $7.2 million products and pending for collection during the period; 8) increase of approximately $0.4 million of rent deposit and other receivables; and 9) decrease of approximately $0.9 million of accounts payable as we repaid timely when due.
Investing Activities
Net cash used in investing activities was approximately $3,500 in the six months ended June 30, 2018, which was mainly attributable to purchase of office equipment. Net cash used in investing activities was $0.1 million for the six months ended June 30, 2017.
Financing Activities
Net cash provided by financing activities was $0.4 million for the six months ended June 30, 2018 and net cash provided by financing activities was approximately $2.5 million for the six months ended June 30, 2017. The cash inflow for the six months ended June 30, 2018 was mainly resulted from $0.2 million which we borrowed from our related parties for working capital purpose and $0.2 million from sale of common stocks.
Trends and Uncertainties in Regulation and Government Policy in China
Foreign Exchange Policy Changes
China is considering allowing its currency to be freely exchangeable for other major currencies. This change will result in greater liquidity for revenues generated in Renminbi (“RMB”). We would benefit by having easier access to and greater flexibility with capital generated in and held in the form of RMB. The majority of our assets are located in China and most of our earnings are currently generated in China and are therefore denominated in RMB. Changes in the RMB-U.S. Dollar exchange rate will impact our reported results of operations and financial condition. In the event that RMB appreciates over the next year as compared to the U.S. Dollar, our earnings will benefit from the appreciation of the RMB. However, if we have to use U.S. Dollars to invest in our Chinese operations, we will suffer from the depreciation of U.S. Dollars against the RMB. On the other hand, if the value of the RMB were to depreciate compared to the U.S. Dollar, then our reported earnings and financial condition would be adversely affected when converted to U.S. Dollars.
On July 21, 2005, the People’s Bank of China announced it would appreciate the RMB, increasing the RMB-U.S. Dollar exchange rate from approximately US$1.00 = RMB 8.28 to approximately US$1.00 = RMB 8.11. So far the trend of such appreciation continues. The exchange rate of U.S. Dollar against RMB on June 30, 2018 was US$1.00 = RMB 6.6184.
Commitments and Contingencies
See Note 19 to the Unaudited Condensed Consolidated Financial Statements under Item 1 in Part I.
Off-Balance Sheet Arrangements
At June 30, 2018, we did not have any relationships with unconsolidated entities or financial partnerships, such as entities often referred to as structured finance or special purpose entities, established for the purpose of facilitating off-balance sheet arrangements or other contractually narrow or limited purposes. As such, we are not exposed to any financing, liquidity, market or credit risk that could arise if we had engaged in such relationships.
| 53 |
ITEM 3. QUANTITATIVE AND QUALITATIVE DISCLOSURES ABOUT MARKET RISK
Not applicable.
ITEM 4. CONTROLS AND PROCEDURES
(a) Evaluation of Disclosure Controls and Procedures
Our Chief Executive Officer and Chief Financial Officer, after evaluating the effectiveness of our disclosure controls and procedures (as defined in Securities Exchange Act Rule 13a-15(e)) as of the end of the quarterly period covered by this report, have concluded that our disclosure controls and procedures are not effective to reasonably ensure that material information required to be disclosed by us in the reports that we file or submit under the Exchange Act is recorded, processed, summarized and reported within the time periods specified by the Securities and Exchange Commission’s Rules and forms and that such information is accumulated and communicated to our management, including our Chief Executive Officer and Chief Financial Officer, as appropriate, to allow timely decisions regarding required disclosure. The principal basis for this conclusion is due to (i) failure to engage sufficient resources in regard to our accounting and reporting obligations and (ii) failure to fully document our internal control policies and procedures.
(b) Changes in Internal Control over Financial Reporting
On January 1, 2018, we adopted Accounting Standards Update (“ASU”) 2014-09 Revenue from Contracts with Customers (FASB ASC Topic 606). There have not been any other changes in the Company’s internal control over financial reporting (as such term is defined in Rules 13a-15(f) under the Exchange Act) during the current quarter ended June 30, 2018 to have materially affected the Company’s internal control over financial reporting.
None.
Smaller reporting companies are not required to provide the information required by this item.
Item 2. Unregistered Sales of Equity Securities and Use of Proceeds
The following is a list of shares of Company Common Stock issued for cash, the conversion of convertible debentures or as stock compensation to consultants during the period from January 1, 2018 through August 14, 2018, which were not registered under the Securities Act:
| Stock Purchase for cash | 247,700 shares |
| Consultant Fees | 1,053,800 shares |
| Conversion of Convertible Note | 126,045 shares |
| Salary Compensation | 6,507 shares |
| Total | 1,434,052 shares |
| 54 |
There were no other sales of unregistered securities not already reported on the Company’s quarterly filings on Form 10-Q or on a Current Report on Form 8-K.
Item 3. Defaults Upon Senior Securities
None.
Item 4. Mine safety disclosures
Not applicable.
None.
| Exhibit No. | Description | |
| 31.1/31.2 | Certification of Principal Executive Officer and Principal Financial Officer pursuant to Rule 13a-14(a) and Rule15d-14(a) of the Securities Exchange Act of 1934, as amended | |
| 32.1/32.2 | Certification of Principal Executive Officer and Principal Financial Officer, pursuant to 18 U.S.C. 1350, as adopted pursuant to Section 906 of the Sarbanes-Oxley Act of 2002 | |
| 101.INS | XBRL Instance Document | |
| 101.SCH | XBRL Taxonomy Extension Schema Document | |
| 101.PRE | XBRL Taxonomy Extension Presentation Linkbase Document | |
| 101.CAL | XBRL Taxonomy Extension Calculation Linkbase Document | |
| 101.LAB | XBRL Taxonomy Extension Label Linkbase Document | |
| 101.DEF | XBRL Taxonomy Extension Definition Linkbase Document |
| 55 |
In accordance with the requirements of the Securities Exchange Act of 1934, the Registrant has caused this report to be signed on its behalf by the undersigned, thereunto duly authorized.
| KIWA BIO-TECH PRODUCTS GROUP CORPORATION | ||
| August 14, 2018 | By: | /s/ Yvonne Wang |
| Yvonne Wang, Interim Chief Executive Officer | ||
| 56 |