Attached files
| file | filename |
|---|---|
| EX-32.2 - KIWA BIO-TECH PRODUCTS GROUP CORP | ex32-2.htm |
| EX-32.1 - KIWA BIO-TECH PRODUCTS GROUP CORP | ex32-1.htm |
| EX-31.2 - KIWA BIO-TECH PRODUCTS GROUP CORP | ex31-2.htm |
| EX-31.1 - KIWA BIO-TECH PRODUCTS GROUP CORP | ex31-1.htm |
UNITED STATES
SECURITIES AND EXCHANGE COMMISSION
Washington, D.C. 20549
FORM 10-Q
| [X] | QUARTERLY REPORT PURSUANT TO SECTION 13 OR 15(d) OF THE SECURITIES EXCHANGE ACT OF 1934 |
For the Quarterly Period Ended September 30, 2017
| [ ] | TRANSITION REPORT PURSUANT TO SECTION 13 OR 15(d) OF THE SECURITIES EXCHANGE ACT OF 1934 |
For the Transition Period from ____________ to ____________
Commission File Number: 000-33167
KIWA BIO-TECH PRODUCTS GROUP CORPORATION
(Exact name of registrant as specified in its charter)
| Nevada | 77-0632186 | |
(State or other jurisdiction of incorporation or organization) |
(I.R.S. Employer Identification No.) | |
3200 Guasti Road, Suite #100, Ontario, California |
91761 | |
| (Address of principal executive offices) | (Zip Code) |
(909) 456-8828
(Registrant’s telephone number, including area code)
3200 Guasti Road, Suite #100 Ontario, CA 91761 |
||
| (Former address) |
Indicate by check mark whether the registrant (1) has filed all reports required to be filed by Section 13 or 15(d) of the Securities Exchange Act of 1934 during the preceding 12 months (or for such shorter period that the registrant was required to file such reports), and (2) has been subject to such filing requirements for the past 90 days. Yes [X] No [ ]
Indicate by check mark whether the registrant has submitted electronically and posted on its corporate Web site, if any, every Interactive Data File required to be submitted and posted pursuant to Rule 405 of Regulation S-T (§ 232.405 of this chapter) during the preceding 12 months (or for such shorter period that the registrant was required to submit and post such files). Yes [X] No [ ]
Indicate by check mark whether the registrant is a large accelerated filer, an accelerated filer, a non-accelerated filer, or a smaller reporting company. See the definitions of “large accelerated filer,” “accelerated filer” and “smaller reporting company” in Rule 12b-2 of the Exchange Act.
| Large accelerated filer [ ] | Accelerated filer [ ] |
Non-accelerated filer [ ]
(Do not check if a smaller reporting company) |
Smaller reporting company [X]
Emerging growth company [ ] |
Indicate by check mark whether the registrant is a shell company (as defined in Rule 12b-2 of the Exchange Act). Yes [ ] No [X]
As of December 22, 2017, the Company had 12,557,870 shares of common stock, $0.001 par value, issued and outstanding.
Table of contents
| 2 |
KIWA BIO-TECH PRODUCTS GROUP CORPORATION AND SUBSIDIARIES
CONDENSED CONSOLIDATED BALANCE SHEETS
| September 30, 2017 | December 31, 2016 | |||||||
| (Unaudited) | ||||||||
| ASSETS | ||||||||
| Current assets | ||||||||
| Cash and cash equivalents | $ | 23,275 | $ | 13,469 | ||||
| Accounts receivable, net | 15,245,255 | 1,122,754 | ||||||
| Prepaid expenses | 1,214,261 | 1,417,554 | ||||||
| Rent deposit and other receivable | 127,419 | 38,897 | ||||||
| Advance to suppliers | 2,979,664 | 1,880,044 | ||||||
| Due from related party- non-trade | 963,846 | - | ||||||
| Inventory | 10,826 | - | ||||||
| Deferred cost of goods sold | 10,274,930 | - | ||||||
| Total current assets | 30,839,476 | 4,472,718 | ||||||
| OTHER ASSETS | ||||||||
| Property, plant and equipment, net | 84,453 | 55,319 | ||||||
| Rent deposit – non-current | 38,003 | 34,519 | ||||||
| Due from related party- non-trade | - | 1,522,434 | ||||||
| Deposit for Long-Term investment | 751,050 | - | ||||||
| Deferred tax asset | 246,872 | - | ||||||
| Total non-current assets | 1,120,378 | 1,612,272 | ||||||
| Total assets | $ | 31,959,854 | $ | 6,084,990 | ||||
| LIABILITIES AND SHAREHOLDERS’ EQUITY(DEFICIENCY) | ||||||||
| Current liabilities | ||||||||
| Accounts payable | $ | 8,869,452 | $ | 1,073,094 | ||||
| Advances from customers | 32,686 | - | ||||||
| Due to related parties | 130,199 | 261,259 | ||||||
| Convertible
notes payable, net of discount of $13,466 at September 30, 2017 | 286,992 | 150,250 | ||||||
| Derivative liabilities | 370,733 | - | ||||||
| Notes payable | 360,000 | 360,000 | ||||||
| Salary payable | 1,315,413 | 1,154,921 | ||||||
| Taxes payable | - | 414,970 | ||||||
| Interest payable | 1,733,544 | 1,524,988 | ||||||
| Other payables and accruals | 1,640,889 | 924,875 | ||||||
| Deferred revenue | 14,996,057 | - | ||||||
| Current liabilities of discontinued operation | - | 4,464,685 | ||||||
| Total current liabilities | 29,735,965 | 10,329,042 | ||||||
| Convertible note payable – non-current, net of discount of $ 455,827 at September 30, 2017 | 370,321 | - | ||||||
| Total Liabilities | 30,106,286 | 10,329,042 | ||||||
| Shareholder’s equity (deficiency) | ||||||||
| Preferred stock - $0.001 par value, Authorized 20,000,000 shares. Issued and outstanding 500,000 and 500,000 shares at September 30, 2017 and December 31, 2016, respectively. | 500 | 500 | ||||||
| Common stock - $0.001 per value. Authorized 100,000,000 shares. Issued and outstanding 11,167,719 and 8,728,981 shares at September 30, 2017 and December 31, 2016, respectively | 11,168 | 8,729 | ||||||
| Additional paid-in capital | 18,733,056 | 15,234,878 | ||||||
| Statutory Reserve | 127,473 | 127,473 | ||||||
| Accumulated deficit | (17,072,416 | ) | (19,561,255 | ) | ||||
| Accumulated other comprehensive gain (loss) | 53,787 | (54,377 | ) | |||||
| Total shareholders’ equity (deficiency) | 1,853,568 | (4,244,052 | ) | |||||
| Total liabilities and shareholder’s equity | $ | 31,959,854 | $ | 6,084,990 | ||||
The accompanying notes are an integral part of these unaudited condensed consolidated financial statements.
| 3 |
KIWA BIO-TECH PRODUCTS GROUP CORPORATION AND SUBSIDIARIES
CONDENSED CONSOLIDATED STATEMENTS OF OPERATIONS AND COMPREHENSIVE INCOME
(LOSS)
(Unaudited)
| Three Months Ended September 30, | Nine Months Ended September 30, | |||||||||||||||
| 2017 | 2016 | 2017 | 2016 | |||||||||||||
| Revenue | $ | 31,025 | $ | 1,185,309 | $ | 30,411 | $ | 1,185,310 | ||||||||
| Cost of goods sold | (19,697 | ) | (770,451 | ) | (19,308 | ) | (770,451 | ) | ||||||||
| Gross Profit | 11,328 | 414,858 | 11,103 | 414,859 | ||||||||||||
| Operating expenses | ||||||||||||||||
| Research and development expenses | 37,469 | 37,303 | 110,194 | 112,580 | ||||||||||||
| Selling expenses | 147,782 | - | 236,252 | - | ||||||||||||
| General and administrative expenses | 1,068,446 | 181,333 | 2,073,035 | 375,915 | ||||||||||||
| Total operating expenses | 1,253,697 | 218,636 | 2,419,481 | 488,495 | ||||||||||||
| Operating Income (Loss) | (1,242,369 | ) | 196,222 | (2,408,378 | ) | (73,636 | ) | |||||||||
| Other income/(expense), net | ||||||||||||||||
| Trademark license income-related party | - | 76,235 | - | 786,329 | ||||||||||||
| Change in fair value of derivative liabilities | 205,612 | - | 199,051 | - | ||||||||||||
| Interest expense | (168,573 | ) | (47,745 | ) | (356,256 | ) | (142,296 | ) | ||||||||
| Other income | 372,711 | - | 373,512 | - | ||||||||||||
| Foreign exchange loss | (18,257 | ) | - | (35,342 | ) | - | ||||||||||
| Total other income/(expense), net | 391,493 | 28,490 | 180,965 | 644,033 | ||||||||||||
| Income (loss) from continuing operations before income taxes | (850,876 | ) | 224,712 | (2,227,413 | ) | 570,397 | ||||||||||
| Provision (benefit) for income taxes | ||||||||||||||||
| Current | - | 78,945 | - | 78,945 | ||||||||||||
| Deferred | (123,068 | ) | - | (220,860 | ) | - | ||||||||||
| Total provision (benefit) for income taxes | (123,068 | ) | 78,945 | (220,860 | ) | 78,945 | ||||||||||
| Income (loss) from continuing operations | (727,808 | ) | 145,767 | (2,006,553 | ) | 491,452 | ||||||||||
| Discontinued operations: | ||||||||||||||||
| Loss from discontinued operations, net of taxes | - | (52,166 | ) | (16,790 | ) | (159,745 | ) | |||||||||
| Gain on disposal of discontinued operations, net of taxes | - | - | 4,512,182 | - | ||||||||||||
| Income (loss) from discontinued operations, net of taxes | - | (52,166 | ) | 4,495,392 | (159,745 | ) | ||||||||||
| Net Income (loss) | (727,808 | ) | 93,601 | 2,488,839 | 331,707 | |||||||||||
| Other comprehensive income (loss) | ||||||||||||||||
| Foreign currency translation adjustment | 39,845 | 9,765 | 108,164 | 103,870 | ||||||||||||
| Total comprehensive income (loss) | $ | (687,963 | ) | $ | 103,366 | $ | 2,597,003 | $ | 435,577 | |||||||
| Earnings per share – Basis: | ||||||||||||||||
| Income (loss) from continuing operations | (0.07 | ) | 0.03 | (0.20 | ) | 0.12 | ||||||||||
| Discontinued operations | - | (0.01 | ) | 0.46 | (0.04 | ) | ||||||||||
| Net Income (loss) | (0.07 | ) | 0.02 | 0.26 | 0.08 | |||||||||||
| Earnings per share – Diluted: | ||||||||||||||||
| Income (loss) from continuing operations | (0.07 | ) | 0.03 | (0.15 | ) | 0.06 | ||||||||||
| Discontinued operations | - | (0.01 | ) | 0.38 | (0.02 | ) | ||||||||||
| Net Income (loss) | (0.07 | ) | 0.02 | 0.23 | 0.04 | |||||||||||
| Weighted average number of common shares outstanding - basic | 10,640,453 | 5,447,326 | 9,846,791 | 4,133,119 | ||||||||||||
| Weighted average number of common shares outstanding - diluted | 11,581,789 | 6,442,528 | 11,891,678 | 9,555,574 | ||||||||||||
The accompanying notes are an integral part of these unaudited condensed consolidated financial statements.
| 4 |
KIWA BIO-TECH PRODUCTS GROUP CORPORATION AND SUBSIDIARIES
CONDENSED CONSOLIDATED STATEMENTS OF CASH FLOWS
(Unaudited)
| Nine Months Ended September 30, | ||||||||
| 2017 | 2016 | |||||||
| Cash flows from continuing operating activities: | ||||||||
| Net income | $ | 2,488,839 | $ | 331,707 | ||||
| (Income) loss from discontinued operations, net of taxes | (4,495,392 | ) | 159,745 | |||||
| Net Income (loss) from continuing operations | (2,006,553 | ) | 491,452 | |||||
| Adjustments to reconcile net income to net cash used in continuing operating activities: | ||||||||
| Bad debt | 237,998 | - | ||||||
| Depreciation | 29,527 | 13,039 | ||||||
| Accrued interest | 356,256 | 142,296 | ||||||
| Stock compensation for consulting fee | 474,301 | 57,717 | ||||||
| Gain on derivative liabilities | (199,051 | ) | - | |||||
| Deferred income tax | (241,452 | ) | - | |||||
| Changes in continuing operating assets and liabilities: | ||||||||
| Accounts receivable | (14,002,636 | ) | (1,240,550 | ) | ||||
| Prepaid expenses | 47,169 | (7,500 | ) | |||||
| Rent deposit and other receivable | (86,938 | ) | (37,809 | ) | ||||
| Advance to suppliers | (1,071,968 | ) | (1,700,605 | ) | ||||
| Due from related party – non-trade | 611,155 | - | ||||||
| Inventory | (10,588 | ) | - | |||||
| Deferred cost of goods sold | (10,049,349 | ) | ||||||
| Accounts payable | 7,579,497 | 794,868 | ||||||
| Advance from customers | 31,968 | - | ||||||
| Due to related parties | 110,690 | 150,411 | ||||||
| Salary payable | 157,968 | 93,993 | ||||||
| Taxes payable | (409,408 | ) | 78,945 | |||||
| Other payables and accruals | 407,319 | 425,985 | ||||||
| Deferred revenue | 14,666,825 | |||||||
| Net cash used in continuing operating activities | (3,367,270 | ) | (737,758 | ) | ||||
| Net cash used by discontinued operations | - | - | ||||||
| Net cash used in operating activities | (3,367,270 | ) | (737,758 | ) | ||||
| Cash flows from investing activities: | ||||||||
| Payment of deposit for Long-Term investment | (734,561 | ) | - | |||||
| Purchase of property, plant and equipment | (58,427 | ) | (79,604 | ) | ||||
| Net cash used in investing activities | (792,988 | ) | (79,604 | ) | ||||
| Cash flows from financing activities: | ||||||||
| Working capital borrowed from related parties, net of payments to related parties | 30,346 | 51,500 | ||||||
| Proceeds from sale of common stock | 3,221,127 | 766,281 | ||||||
| Proceeds from convertible notes | 976,356 | - | ||||||
| Net cash provided by financing activities | 4,227,829 | 817,781 | ||||||
| Effect of exchange rate change | (57,765 | ) | (595 | ) | ||||
| Cash and cash equivalents: | ||||||||
| Net increase | 9,806 | (176 | ) | |||||
| Balance at beginning of period | 13,469 | 721 | ||||||
| Balance at end of period | $ | 23,275 | $ | 545 | ||||
| Non-cash financing activities: | ||||||||
| Issuance of common stock for debt settlements | $ | - | $ | 3,191,974 | ||||
| Issuance of common stock for consulting services | $ | 234,396 | $ | - | ||||
| Issuance of common stock for financing services | $ | 1,022,156 | $ | - | ||||
| Supplemental Disclosures of Cash flow Information: | ||||||||
| Cash paid for interest | $ | - | $ | - | ||||
| Cash paid for income taxes | $ | 457,564 | $ | - | ||||
The accompanying notes are an integral part of these unaudited condensed consolidated financial statements.
| 5 |
KIWA BIO-TECH PRODUCTS GROUP CORPORATION AND SUBSIDIARIES
NOTES TO CONDENSED CONSOLIDATED FINANCIAL STATEMENTS
(UNAUDITED)
1. Description of Business and Organization
Organization
Kiwa Bio-Tech Products Group Corporation (“the Company”) is the result of a share exchange transaction accomplished on March 12, 2004 between the shareholders of Kiwa Bio-Tech Products Group Ltd. (“Kiwa BVI”), a company originally organized under the laws of the British Virgin Islands on June 5, 2002 and Tintic Gold Mining Company (“Tintic”), a corporation originally incorporated in the state of Utah on June 14, 1933 to perform mining operations in Utah. The share exchange resulted in a change of control of Tintic, with former Kiwa BVI stockholders owning approximately 89% of Tintic on a fully diluted basis and Kiwa BVI surviving as a wholly-owned subsidiary of Tintic. Subsequent to the share exchange transaction, Tintic changed its name to Kiwa Bio-Tech Products Group Corporation. On July 21, 2004, the Company completed its reincorporation in the State of Delaware. On March 8, 2017, we completed our reincorporation in the State of Nevada.
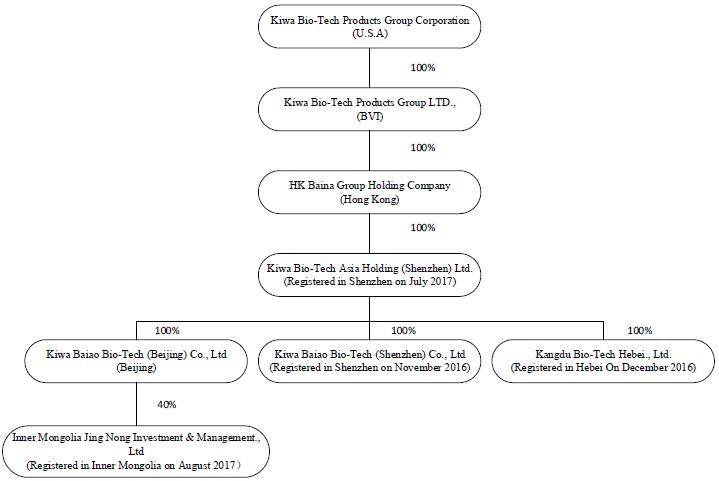
The Company operates through a series of subsidiaries in the Peoples Republic of China as detailed in the following Organizational Chart. The Company had previously operated its business through its subsidiaries Kiwa Bio-Tech Products (Shandong) Co., Ltd. (“Kiwa Shandong”) and Tianjin Kiwa Feed Co., Ltd. (“Kiwa Tianjin”). Kiwa Tianjin has been dissolved since July, 11, 2012. On February 11, 2017, the Company entered an Equity Transfer Agreement with Dian Shi Cheng Jing (Beijing) Technology Co. (“Transferee”) to transfer all of shareholders’ right, title and interest in Kiwa Shandong to the Transferee for RMB1.00. On April 12, 2017, the government processing of transfer has been completed. Currently, the Company mainly operates its business through its subsidiaries Kiwa Baiao Bio-Tech (Beijing) Co., Ltd. (“Kiwa Beijing”), Kiwa Bio-Tech Products (Shenzhen) Co., Ltd. (“Kiwa Shenzhen”), which was incorporated in China in November 2016 and Kiwa Bio-Tech Products (Hebei) Co., Ltd. (“Kiwa Hebei”), which was incorporated in China in December 2016. Kiwa Beijing was acquired from a group of unrelated third parties in January 2016 together with its holding company HK Baina Group Holding Company for approximately $34,000 (RMB 220,000) and renamed to Kiwa Baiao Bio-Tech (Beijing) Co., Ltd. from Oriental Baina Co., Ltd. in February 2016. HK Baina Group Holding Company and Oriental Baina Co., Ltd. have no operations prior to the acquisition and the purchase price was initially recorded as goodwill and fully impaired at the year end of 2016. In July 2017, the Company established Kiwa Bio-Tech Asia Holding (Shenzhen) Ltd. (“Kiwa Asia”) to be the direct holding company of Kiwa Beijing, Kiwa Shenzhen and Kiwa Hebei. The Company established Inner Mongolia Jing Nong Investment & Management, Ltd. (“Kiwa Jing Nong”) in August 2017.
| 6 |
Business
The Company develops, manufactures, distributes and markets innovative, cost-effective and environmentally safe bio-technological products for agricultural use. Our products are designed to enhance the quality of human life by increasing the value, quality and productivity of crops and decreasing the negative environmental impact of chemicals and other wastes.
Prior to August 2016, the Company did not have any license to sell its bio-technological fertilizer products in China and could not generate direct sales on its own. Instead the Company had been licensing its trademark to Kangtan Gerui (Beijing) Bio-Tech Co., Ltd. (“Gerui”), a related party (see Note 10), in China to sell fertilizers. The Company charged Gerui 10% of net sales of fertilizers bearing the Company’s trademark. The trademark license income was recorded in the captioned “Trademark license income-related party” in the accompanying unaudited condensed consolidated statements of operations and comprehensive income. In August 2016, the Company obtained a fertilizer sales permit from the Chinese government. As a result, the Company ceased its cooperation with Gerui and began to sell products directly to customers on its own.
2. Summaries of Significant Accounting Policies
Basic of presentation
The accompanying unaudited condensed consolidated financial statements have been prepared in accordance with accounting principles generally accepted in the United States of America (“U.S. GAAP”) for information pursuant to the rules and regulations of the Securities Exchange Commission (“SEC”).
In the opinion of management, all adjustments, consisting only of normal recurring adjustments, considered necessary to give a fair presentation have been included. Interim results are not necessarily indicative of results of a full year. The information in this Form 10-Q should be read in conjunction with information included in the annual report for the fiscal year ended December 31, 2016 on Form 10-K/A filed with the SEC on November 22, 2017.
Principle of Consolidation
These consolidated unaudited condensed financial statements include the financial statements of the Company and its wholly-owned subsidiaries, Kiwa BVI, Hong Kong Baina Group Holding Company, Kiwa Beijing, Kiwa Shandong, Kiwa Shenzhen, Kiwa Hebei, Kiwa Asia and Kiwa Jing Nong. All significant inter-company balances or transactions are eliminated on consolidation.
| 7 |
Use of Estimates
The preparation of financial statements in conformity with US GAAP requires management to make estimates and assumptions that affect the reported amounts of assets and liabilities, disclosure of contingent assets and liabilities at the date of the consolidated financial statements, and the reported amounts of revenues and expenses during the reporting period. Actual results could differ from those estimates. Significant accounting estimates include the valuation of securities issued, derivative liabilities, deferred tax assets and related valuation allowance.
Certain of our estimates, including evaluating the collectability of accounts receivable and the fair market value of long-lived assets, could be affected by external conditions, including those unique to our industry, and general economic conditions. It is possible that these external factors could have an effect on our estimates that could cause actual results to differ from our estimates. We re-evaluate all of our accounting estimates annually based on these conditions and record adjustments when necessary.
Cash and Cash Equivalents
Cash and cash equivalents consist of all cash balances and highly liquid investments with an original maturity of three months or less. Because of the short maturity of these investments, the carrying amounts approximate their fair value. Restricted cash is excluded from cash and cash equivalents.
Accounts receivable and allowance for doubtful accounts
Accounts receivable represent customer accounts receivables. The Company provides an allowance for doubtful accounts equal to the estimated uncollectible amounts. The Company’s estimate is based on historical collection experience, the economic environment, trends in the microbial fertilizer industry, and a review of the current status of trade accounts receivable. Management reviews its accounts receivable each reporting period to determine if the allowance for doubtful accounts is adequate. Such allowances, if any, would be recorded in the period the impairment is identified. It is reasonably possible that the Company’s estimate of the allowance for doubtful accounts will change. Uncollectible accounts receivable are charged against the allowance for doubtful accounts when all reasonable efforts to collect the amounts due have been exhausted.
Inventory
Inventories are stated at the lower of cost, determined on the weighted average method, and net realizable value. Work in progress and finished goods are composed of direct materials, direct labor and a portion of manufacturing overhead. Net realizable value is the estimated based on selling price in the ordinary course of business, less estimated costs to complete and dispose.
Property, plant and equipment
Property, plant and equipment are stated at cost less accumulated depreciation and accumulated impairment losses, if any. Gains or losses on disposals are reflected as gain or loss in the year of disposal. The cost of improvements that extend the life of property, plant and equipment are capitalized. These capitalized costs may include structural improvements, equipment and fixtures. All ordinary repair and maintenance costs are expensed as incurred. Depreciation for financial reporting purposes is provided using the straight-line method over the estimated useful lives of the assets as follows:
| Useful Life | ||||
| (In years) | ||||
| Buildings | 30 - 35 | |||
| Machinery and equipment | 5 - 10 | |||
| Automobiles | 8 | |||
| Office equipment | 2 - 5 | |||
| Computer software | 3 | |||
| Leasehold improvement | The
shorter of the lease term and useful life |
|||
| 8 |
Impairment of Long-Lived Assets
The Company’s long-lived assets consist of property, plant and equipment. The Company evaluates its investment in long-lived assets, including property and equipment, for recoverability whenever events or changes in circumstances indicate the net carrying amount may not be recoverable. It is possible that these assets could become impaired as a result of legal factors, market conditions, operational performance indicators, technological or other industry changes. If circumstances require a long-lived asset or asset group to be tested for possible impairment, the Company first compares undiscounted cash flows expected to be generated by that asset or asset group to its carrying value. If the carrying value of the long-lived asset or asset group is not recoverable on an undiscounted cash flow basis, an impairment is recognized to the extent that the carrying value exceeds its fair value. Fair value is determined through various valuation techniques, including discounted cash flow models, quoted market values and third-party independent appraisals, as considered necessary.
Financial Instruments
The Company analyzes all financial instruments with features of both liabilities and equity under FASB Accounting Standards Codification (“ASC”) Topic 480 “Distinguishing Liabilities from Equity” and FASB ASC Topic 815 “Derivatives and Hedging”.
Embedded conversion features of convertible debentures not considered to be derivative instruments
The embedded conversion features of convertible debentures not considered to be derivative instruments provide for a rate of conversion that is below market value. Such feature is normally characterized as a “beneficial conversion feature” (“BCF”). The relative fair values of the BCF were recorded as discounts from the face amount of the respective debt instrument. The Company amortized the discount using the straight-line method which approximates the effective interest method through maturity of such instruments.
Embedded conversion features of convertible debentures that are classified as derivative liabilities
The embedded conversion features of convertible debentures that are classified as derivative liabilities are recorded at fair value as a discount from the face amount of the respective debt instrument. The discount is being amortized to interest expense over the life of the note using the straight-line method, which approximates the effective interest method. These instruments are accounted for as derivative liabilities and marked-to-market each reporting period. The change in the value of the derivative liabilities is charged against or credited to income in the captioned “change in fair value of derivative liabilities” in the accompanying unaudited condensed consolidated statements of operations and comprehensive income.
Fair Value of Financial Instruments
The Company follows paragraph 825-10-50-10 of the FASB Accounting Standards Codification for disclosures about fair value of its financial instruments and paragraph 820- 10-35-37 of the FASB Accounting Standards Codification (“Paragraph 820-10-35-37”) to measure the fair value of its financial instruments. Paragraph 820-10-35-37 establishes a framework for measuring fair value with U.S. GAAP, and expands disclosures about fair value measurements.
To increase consistency and comparability in fair value measurements and related disclosures, Paragraph 820-10-35-37 establishes a fair value hierarchy which prioritizes the inputs to valuation techniques used to measure fair value into three (3) broad levels. The fair value hierarchy gives the highest priority to quoted prices (unadjusted) in active markets for identical assets or liabilities and the lowest priority to unobservable inputs. The three (3) levels of fair value hierarchy defined by Paragraph 820-10-35-37 are described below:
| ● | Level 1: quoted market prices available in active markets for identical assets or liabilities as of the reporting date. | |
| ● | Level 2: pricing inputs other than quoted prices in active markets included in Level 1, which are either directly or indirectly observable as of the reporting date. | |
| ● | Level 3: Pricing inputs that are generally observable inputs and not corroborated by market data. |
Financial assets are considered Level 3 when their fair values are determined using pricing models, discounted cash flow methodologies or similar techniques and at least one significant model assumption or input is unobservable.
The fair value hierarchy gives the highest priority to quoted prices (unadjusted) in active markets for identical assets or liabilities and the lowest priority to unobservable inputs. If the inputs used to measure the financial assets and liabilities fall within more than one level described above, the categorization is based on the lowest level input that is significant to the fair value measurement of the instrument.
| 9 |
The carrying amount of the Company’s financial assets and liabilities, such as cash and cash equivalent, prepaid expenses, accounts payable and accrued expenses, approximate their fair value because of the short maturity of those instruments. Derivative instruments are carried at fair value, estimated using the Black Scholes Merton model.
Transactions involving related parties cannot be presumed to be carried out on an arm’s-length basis, as the requisite conditions of competitive, free-market dealings may not exist. Representations about transactions with related parties, if made, shall not imply that the related party transactions were consummated on terms equivalent to those that prevail in arm’s-length transactions unless such representations can be substantiated.
It is not however practical to determine the fair value of advances from stockholders, if any, due to their related party nature.
Revenue Recognition
The Company applies paragraph 605-10-S99-1 of the FASB Accounting Standards Codification for revenue recognition. The Company recognizes revenue when it is realized or realizable and earned. The Company considers revenue realized or realizable and earned when all of the following criteria are met: (i) persuasive evidence of an arrangement exists, (ii) the product has been shipped or the services have been rendered to the customer, (iii) the sales price is fixed or determinable, and (iv) collectability is reasonably assured.
The Company derives its revenues from sales contracts with its customers with revenues being recognized upon delivery of products. Persuasive evidence of an arrangement is demonstrated via sales contract and invoice; and the sales price to the customer is fixed upon acceptance of the sales contract and there is no separate sales rebate, discount, or volume incentive. The Company recognizes revenue when title and ownership of the goods are transferred upon shipment to the customer by the Company and collectability of payment is reasonably assured.
The Company’s customers are mainly agricultural cooperative company and distributors who then resell the Company’s products to individual farmers. Because the crop growing cycle usually takes approximately 3 to 9 months in the agricultural industry, for some co-ops and distributors, it will take approximately similar time frame of 3 to 9 months for farmers to harvest crops and to realize profits to repay them. As a result, for the sales contracts with these customers, the collectability of payment is highly dependent on the successful harvest of corps and the customers’ ability to collect money from farmers. The Company deemed the collectability of payment may not be reasonably assured until after the Company get paid. For those sales contracts that the Company has shipped its products but the payment is contingent on collections of payments from the downstream customers, the Company considers the revenue recognition criteria are not met and therefore defers the revenue and cost of goods sold until payments are collected. These revenue and cost of goods sold are classified in the captioned “Deferred revenue” and “Deferred cost of goods sold” in the accompanying unaudited condensed consolidated balance sheets. For other customers whose repayment term is within normal business course and not dependent on the harvest of corps, the Company recognized revenue when title and ownership of the goods are transferred upon shipment to the customer by the Company.
Deferred Revenue and Deferred Cost of Goods Sold
Deferred revenue and deferred cost of goods sold result from transactions where the Company has shipped product for which all revenue recognition criteria have not yet been met. Deferred cost of goods sold related to deferred product revenues includes direct inventory costs. Once all revenue recognition criteria have been met, the deferred revenues and associated cost of goods sold are recognized.
Income Taxes
The Company accounts for income taxes under the provisions of FASB ASC Topic 740, “Income Tax,” which requires recognition of deferred tax assets and liabilities for the expected future tax consequences of events that have been included in the consolidated financial statements or tax returns. Deferred tax assets and liabilities are recognized for the future tax consequence attributable to the difference between the tax bases of assets and liabilities and their reported amounts in the financial statements. Deferred tax assets and liabilities are measured using the enacted tax rate expected to apply to taxable income in the years in which those temporary differences are expected to be recovered or settled. The effect on deferred tax assets and liabilities of a change in tax rates is recognized in income in the period that includes the enactment date. The Company establishes a valuation when it is more likely than not that the assets will not be recovered.
ASC Topic 740-10, “Accounting for Uncertainty in Income Taxes,” defines uncertainty in income taxes and the evaluation of a tax position as a two-step process. The first step is to determine whether it is more likely than not that a tax position will be sustained upon examination, including the resolution of any related appeals or litigation based on the technical merits of that position. The second step is to measure a tax position that meets the more-likely-than-not threshold to determine the amount of benefit to be recognized in the financial statements. A tax position is measured at the largest amount of benefit that is greater than 50 percent likelihood of being realized upon ultimate settlement. Tax positions that previously failed to meet the more-likely-than-not recognition threshold should be recognized in the first subsequent period in which the threshold is met. Previously recognized tax positions that no longer meet the more-likely-than-not criteria should be de-recognized in the first subsequent financial reporting period in which the threshold is no longer met. Penalties and interest incurred related to underpayment of income tax are classified as income tax expense in the period incurred. United States federal, state and local income tax returns prior to 2014 are not subject to examination by any applicable tax authorities. PRC tax returns filed for 2014, 2015 and 2016 are subject to examination by any applicable tax authorities.
Stock Based Compensation
The Company accounts for share-based compensation awards to employees in accordance with FASB ASC Topic 718, “Compensation – Stock Compensation”, which requires that share-based payment transactions with employees be measured based on the grant-date fair value of the equity instrument issued and recognized as compensation expense over the requisite service period. The Company records stock-based compensation expense at fair value on the grant date and recognizes the expense over the employee’s requisite service period. The Company’s expected volatility assumption is based on the historical volatility of Company’s stock. The expected life assumption is primarily based on historical exercise patterns and employee post-vesting termination behavior. The risk-free interest rate for the expected term of the option is based on the U.S. Treasury yield curve in effect at the time of grant. The expected dividend yield is based on the Company’s current and expected dividend policy.
The Company accounts for share-based compensation awards to non-employees in accordance with FASB ASC Topic 718 and FASB ASC Subtopic 505-50, “Equity-Based Payments to Non-employees”. Under FASB ASC Topic 718 and FASB ASC Subtopic 505-50, stock compensation granted to non-employees has been determined as the fair value of the consideration received or the fair value of equity instrument issued, whichever is more reliably measured and is recognized as an expense as the goods or services are received.
| 10 |
Foreign Currency Translation and Other Comprehensive Income
The Company uses United States dollars (“US Dollar” or “US$” or “$”) for financial reporting purposes. However, the Company maintains the books and records in its functional currency, Chinese Renminbi (“RMB”) and Hong Kong Dollar (“HKD”), being the functional currency of the economic environment in which its operations are conducted. In general, the Company translates its assets and liabilities into U.S. dollars using the applicable exchange rates prevailing at the balance sheet date, and the statement of comprehensive loss and the statement of cash flow are translated at average exchange rates during the reporting period. Equity accounts are translated at historical rates. Adjustments resulting from the translation of the Company’s financial statements are recorded as accumulated other comprehensive income.
Other comprehensive income for the nine months ended September 30, 2017 and 2016 represented foreign currency translation adjustments and were included in the unaudited condensed consolidated statements of operations and comprehensive income.
The exchange rates used to translate amounts in RMB into U.S. Dollars for the purposes of preparing the unaudited condensed consolidated financial statements were as follows:
| As
of September 30, 2017 | As
of December 31, 2016 | |||||||
| Balance sheet items, except for equity accounts | 6.6574 | 6.9472 | ||||||
| Three months ended September 30, | ||||||||
| 2017 | 2016 | |||||||
| Items in the statements of comprehensive income | 6.6721 | 6.6702 | ||||||
| Nine months ended September 30, | ||||||||
| 2017 | 2016 | |||||||
| Items in the statements of comprehensive income | 6.8068 | 6.5806 | ||||||
The exchange rates used to translate amounts in HKD into U.S. Dollars for the purposes of preparing the consolidated financial statements were as follows:
| As
of September 30, 2017 | As
of December 31, 2016 | |||||||
| Balance sheet items, except for equity accounts | 7.8107 | - | ||||||
| Three months ended September 30, | ||||||||
| 2017 | 2016 | |||||||
| Items in the statements of comprehensive income | 7.8143 | - | ||||||
| Nine months ended September 30, | ||||||||
| 2017 | 2016 | |||||||
| Items in the statements of comprehensive income | 7.7868 | - | ||||||
Earnings Per Common Share
Net income per common share is computed pursuant to section 260-10-45 of the FASB Accounting Standards Codification. Basic net income per common share is computed by dividing net income by the weighted average number of common shares outstanding during the period.
Diluted net income per common share is computed by dividing net income by the weighted average number of shares of common stock and potentially outstanding shares of common stock during the period to reflect the potential dilution that could occur from common shares issuable through contingent shares issuance arrangement, stock options or warrants. Common stock equivalents having an anti-dilutive effect on earnings per share are excluded from the calculation of diluted earnings per share.
| 11 |
Commitments and Contingencies
The Company follows subtopic 450-20 of the FASB Accounting Standards Codification to report accounting for contingencies. Certain conditions may exist as of the date the consolidated financial statements are issued, which may result in a loss to the Company but which will only be resolved when one or more future events occur or fail to occur. The Company assesses such contingent liabilities, and such assessment inherently involves an exercise of judgment. In assessing loss contingencies related to legal proceedings that are pending against the Company or unassured claims that may result in such proceedings, the Company evaluates the perceived merits of any legal proceedings or unassured claims as well as the perceived merits of the amount of relief sought or expected to be sought therein.
If the assessment of a contingency indicates that it is probable that a material loss has been incurred and the amount of the liability can be estimated, then the estimated liability would be accrued in the Company’s consolidated financial statements. If the assessment indicates that a potential material loss contingency is not probable but is reasonably possible, or is probable but cannot be estimated, then the nature of the contingent liability, and an estimate of the range of possible losses, if determinable and material, would be disclosed.
Loss contingencies considered remote are generally not disclosed unless they involve guarantees, in which case the guarantees would be disclosed. Management does not believe, based upon information available at this time that these matters will have a material adverse effect on the Company’s financial position, results of operations or cash flows.
Cash Flow Reporting
The Company adopted paragraph 230-10-45-24 of the FASB Accounting Standards Codification for cash flows reporting, classifies cash receipts and payments according to whether they stem from operating, investing, or financing activities and provides definitions of each category, and uses the indirect or reconciliation method (“Indirect method”) as defined by paragraph 230-10-45-25 of the FASB Accounting Standards Codification to report net cash flow from operating activities by adjusting net income to reconcile it to net cash flow from operating activities by removing the effects of :
(a) all deferrals of past operating cash receipts and payments and all accruals of expected future operating cash receipts and payments;
(b) all items that are included in net income that do not affect operating cash receipts and payments.
The Company reports the reporting currency equivalent of foreign currency cash flows, using the current exchange rate at the time of the cash flows and the effect of exchange rate changes on cash held in foreign currencies is reported as a separate item in the reconciliation of beginning and ending balances of cash and cash equivalents and separately provides information about investing and financing activities not resulting in cash receipts or payments in the period pursuant to paragraph 830-230-45-1 of the FASB Accounting Standards Codification.
| 12 |
Recent Accounting Pronouncements
In May 2014, the Financial Accounting Standards Board (the “FASB”) issued Accounting Standards Update No. 2014-09 (ASU 2014-09), Revenue from Contracts with Customers. ASU 2014-09 will eliminate transaction- and industry-specific revenue recognition guidance under current GAAP and replace it with a principle based approach for determining revenue recognition. ASU 2014-09 will require that companies recognize revenue based on the value of transferred goods or services as they occur in the contract. ASU 2014-09 also will require additional disclosure about the nature, amount, timing and uncertainty of revenue and cash flows arising from customer contracts, including significant judgments and changes in judgments and assets recognized from costs incurred to obtain or fulfill a contract. Based on the FASB’s Exposure Draft Update issued on April 29, 2015, and approved in July 2015, Revenue from Contracts With Customers (Topic 606): Deferral of the Effective Date, ASU 2014-09 is now effective for reporting periods beginning after December 15, 2017, with early adoption permitted only as of annual reporting periods beginning after December 15, 2016, including interim reporting periods within that reporting period. Entities will be able to transition to the standard either retrospectively or as a cumulative-effect adjustment as of the date of adoption. While no significant impact is expected upon adoption of the new guidance, the Company will not be able to make that determination until the time of adoption based upon outstanding contracts at that time. In September 2017, the FASB issued Accounting Standards Update (ASU) No. 2017-13, “Revenue Recognition (Topic 605), Revenue from Contracts with Customers (Topic 606), Leases (Topic 840), and Leases (Topic 842): Amendments to SEC Paragraphs Pursuant to the Staff Announcement at the July 20, 2017 EITF Meeting and Rescission of Prior SEC Staff Announcements and Observer Comments.” The amendments in ASU No. 2017-13 amends the early adoption date option for certain companies related to the adoption of ASU No. 2014-09. The effective date for the Company is the same as the effective date and transition requirements for the amendments for ASU 2014-09 beginning in January 1, 2018.
In February 2016, the FASB issued Accounting Standards Update No. 2016-02 (ASU 2016-02), Leases (Topic 842). ASU 2016-02 requires a lessee to record a right-of-use asset and a corresponding lease liability, initially measured at the present value of the lease payments, on the balance sheet for all leases with terms longer than 12 months, as well as the disclosure of key information about leasing arrangements. ASU 2016-02 requires recognition in the statement of operations of a single lease cost, calculated so that the cost of the lease is allocated over the lease term. ASU 2016-02 requires classification of all cash payments within operating activities in the statement of cash flows. Disclosures are required to provide the amount, timing and uncertainty of cash flows arising from leases. A modified retrospective transition approach is required for lessees for capital and operating leases existing at, or entered into after, the beginning of the earliest comparative period presented in the financial statements, with certain practical expedients available. ASU 2016-02 is effective for fiscal years beginning after December IS, 2018, including interim periods within those fiscal years. Early application is permitted. The Company has not yet evaluated the impact of the adoption of ASU 2016-02 on the Company’s unaudited condensed consolidated financial statement presentation or disclosures.
In January 2017, the FASB issued ASU 2017-01, “Business Combinations (Topic 805): Clarifying the Definition of a Business.” The amendments in this guidance are clarifying the definition of a business to assist entities when determining whether an integrated set of assets and activities meets the definition of a business. The update provides that when substantially all the fair value of the assets acquired is concentrated in a single identifiable asset or a group of similar identifiable assets, the set is not a business. The guidance is effective for fiscal years beginning after December 15, 2017, including interim periods within those fiscal years. The adoption of this new guidance is not expected to have a material impact on our unaudited condensed consolidated financial statements.
In January 2017, the FASB issued ASU 2017-04—Intangibles—Goodwill and Other (Topic 350): Simplifying the Test for Goodwill Impairment. The amendments in this guidance to eliminate the requirement to calculate the implied fair value of goodwill to measure goodwill impairment charge (Step 2). As a result, an impairment charge will equal the amount by which a reporting unit’s carrying amount exceeds its fair value, not to exceed the amount of goodwill allocated to the reporting unit. An entity still has the option to perform the qualitative assessment for a reporting unit to determine if the quantitative impairment test is necessary. The amendment should be applied on a prospective basis. The guidance is effective for goodwill impairment tests in fiscal years beginning after December 15, 2019. Early adoption is permitted for goodwill impairment tests performed after January 1, 2017. The impact of this guidance for the Company will depend on the outcomes of future goodwill impairment tests.
| 13 |
In May 2017, the FASB issued Accounting Standards Update No. 2017-09 (ASU 2017-09), Compensation — Stock Compensation (Topic 718) Scope of Modification Accounting. The amendments in ASU 2017-09 provide guidance about which changes to the terms or conditions of a share-based payment award require an entity to apply modification accounting in Topic 718. The adoption of ASU 2017-09 which will become effective for annual periods beginning after December 15, 2017 and for interim periods within those annual periods, is not expected to have any impact on the Company’s unaudited condensed consolidated financial statement presentation or disclosures.
In July 2017, the FASB issued Accounting Standards Update No. 2017-11 (ASU 2017-11), Earnings Per Share (Topic 260); Distinguishing Liabilities from Equity (Topic 480); Derivatives and Hedging (Topic 815): (Part I) Accounting for Certain Financial Instruments with Down Round Features, (Part II) Replacement of the Indefinite Deferral for Mandatorily Redeemable Financial Instruments of Certain Nonpublic Entities and Certain Mandatorily Redeemable Noncontrolling Interests with a Scope Exception. The amendments in ASU 2017-11 change the classification analysis of certain equity-linked financial instruments (or embedded features) with down round features. When determining whether certain financial instruments should be classified as liabilities or equity instruments, a down round feature no longer precludes equity classification when assessing whether the instrument is indexed to an entity’s own stock. The adoption of ASU 2017-11 which will become effective for annual periods beginning after December 15, 2018 and for interim periods within those annual periods. The Company elected to early adopt ASU 2017-11 when preparing these unaudited condensed consolidated financial statements for the nine months ended September 30, 2017.
Management does not believe that any other recently issued, but not yet effective, authoritative guidance, if currently adopted, would have a material impact on the Company’s unaudited condensed consolidated financial statement presentation or disclosures.
3. Going Concern
The unaudited condensed consolidated financial statements have been prepared assuming that the Company will continue as a going concern, which contemplates the realization of assets and the satisfaction of liabilities in the normal course of business.
As of September 30, 2017, the Company had an accumulated deficit of $17,072,416, and net cash used in continuing operating activities of $3,367,270. These circumstances, among others, raise substantial doubt about the Company’s ability to continue as a going concern. The accompanying unaudited condensed financial statements do not include any adjustments that might result from the outcome of this uncertainty. The accompanying unaudited condensed consolidated financial statements also do not include any adjustments relating to the recoverability and classification of recorded asset amounts, or amounts and classifications of liabilities that might be necessary should the Company be unable to continue as a going concern.
Though the Company is generating additional revenue but not cash flow while seeking additional equity financing, the Company does not have enough cash to support the operation without raising additional capital, within the one year from the date of the issuance of these financial statements. To the extent that the Company is unable to successfully raise the capital necessary to fund its future cash requirements on a timely basis and under acceptable terms and conditions, the Company may not have sufficient liquidity to maintain operations and repay its liabilities for the next twelve months. As a result, the Company may be unable to implement its current plans for expansion, repay its debt obligations or respond to competitive pressures, any of which would have a material adverse effect on its business, prospects, financial condition and results of operations.
4. Accounts Receivable, net
As of September 30, 2017 and December 31, 2016, we had approximately $15.2 million and $1.1 million, respectively, of accounts receivable from the Company’s customers. Since the Company obtained a fertilizer sales permit from the Chinese government in August 2016 and began to sell the products directly to its customers in September 2016, the Company’s strategy was to gain market shares in the bio-fertilizer market by extending longer credit term to its customers. As a result, the Company’s accounts receivable increased from approximately $1.1 million at December 31, 2016 to approximately $15.2 million at September 30, 2017. The Company’s current payment terms on these customers are ranging from 60 days to 9 months after receipts of the goods depending on the creditworthiness of these customers. These customers are either agricultural cooperative company or distributors who then resell the Company’s products to individual farmers. The reason the Company decides to extend credit for up to 9 months is mainly because the crop growing cycle usually takes approximately 3 to 9 months in the agricultural industry, it will take approximately similar time frame of 3 to 9 months for farmers to harvest crops and to realize profits to repay us. It is very common for cooperative farms and distributors to request longer sales credit under these circumstances.
Based on the evaluation of the collectability of these accounts receivable, the Company has provided allowance for doubtful accounts of approximately $0.3 million as of September 30, 2017. As of the date of this report, the Company has subsequently collected approximately $8.7 million or 56% of these outstanding accounts receivable as of September 30, 2017. The Company expects to fully collect the remaining balance of approximately $6.8 million of these accounts receivable by December 31, 2017.
The Company’s provision on allowance for doubtful accounts is based on historical collection experience, the economic environment, trends in the microbial fertilizer industry, and a review of the current status of trade accounts receivable and come up with an aging allowance method. Currently, the Company provides a provision of 1%-6% of the allowance for doubtful accounts for accounts receivable balance that are more than 180 days old but less than one year old, 50% of the allowance for doubtful accounts for accounts receivable from one to one and half years old, 100% of the allowance for doubtful accounts for accounts receivable beyond one and half years old, plus additional amount as necessary, which the Company’s collection department had determined the collection of the full amount is remote with the approval from its management to provide a 100% provision allowance for doubtful accounts. The Company’s management has continued to evaluate the reasonableness of the valuation allowance policy and update it if necessary.
Accounts receivable consisted of the following:
| September 30, 2017 | December 31, 2016 | |||||||
| Accounts receivable | $ | 15,543,835 | $ | 1,177,994 | ||||
Less: Allowance for doubtful accounts | (298,580 | ) | (55,240 | ) | ||||
| Accounts receivable, net | $ | 15,245,255 | $ | 1,122,754 | ||||
Movement of allowance for doubtful accounts is as follows:
| Nine months ended September 30, 2017 | Year
ended December 31, 2016 | |||||||
| Beginning balance | $ | 55,240 | $ | - | ||||
| Provision for doubtful accounts | 237,998 | 55,240 | ||||||
| Less: write-off | - | - | ||||||
| Exchange rate effect | 5,342 | - | ||||||
| Ending balance | $ | 298,580 | $ | 55,240 | ||||
5. Prepaid Expense
Prepaid expenses consisted of the following:
| Notes | September 30, 2017 | December 31, 2016 | ||||||||||
| Prepaid office rent | $ | 21,080 | $ | 12,504 | ||||||||
| Prepaid government filing expense | 33,036 | 5,000 | ||||||||||
| Prepaid consulting expenses | (1) | 1,160,145 | 1,400,050 | |||||||||
| $ | 1,214,261 | $ | 1,417,554 | |||||||||
| 14 |
(1) Prepaid consulting expense for issuance of common stock
As of September 30, 2017, the Company issued a total of 1,825,916 shares of common stock to three consulting companies for investor relation consulting services, one individual for financing service, one consulting company for IT service and four individuals for the growth and development strategy consulting service in China, which represents the amount of $1,922,696 based on quoted price at issuance. Pursuant to the indemnification terms of the services agreements, the Company has the rights to demand the full services being accomplished as scheduled during the service period and to enforce the consultants to pay pro-rata penalties if the consultants do not fulfill the contract services within the services periods. As of September 30, 2017, the Company evaluated the performance of the consultants and concluded all the contracts were on schedule of delivery. The Company recorded the prepaid consulting expenses totally $1,922,696 and amortized the consulting fee over the service periods per agreements based on the progress of services delivered. For the nine months ended September 30, 2017 and 2016, the amortization of consulting expense was $474,301 and $57,717, respectively.
6. Advance to suppliers
Since currently the Company does not have manufacturing facility, it has contracted with several third parties to produce fertilizer products. These third parties produce the fertilizer products in accordance with the product formula and specification instructed by the Company. Pursuant to the agreements entered by the Company and those third-party companies, the Company was required to make partially prepayments in advance of securing the purchases or completion of productions on a timely basis. As of September 30, 2017 and December 31, 2016, such advance to suppliers was $ 2,979,664 and $1,880,044, respectively.
7. Property, Plant and Equipment
Property, plant and equipment, net consisted of the following:
| September 30, 2017 | December 31, 2016 | |||||||
| Property, Plant and Equipment | ||||||||
| Office equipment | $ | 14,270 | $ | 896 | ||||
| Furniture | 22,813 | 7,838 | ||||||
| Leasehold improvement | 74,251 | 66,896 | ||||||
| Construction in progress | 26,137 | - | ||||||
| Others | 1,082 | - | ||||||
| Property, plant and equipment - total | $ | 138,553 | $ | 75,630 | ||||
| Less: accumulated depreciation | (54,100 | ) | (20,311 | ) | ||||
| Property, plant and equipment - net | $ | 84,453 | $ | 55,319 | ||||
Depreciation expense was $11,878 and $10,045 for the three months ended September 30, 2017 and 2016, and $29,527 and $ 13,039 for the nine months ended September 30, 2017 and 2016, respectively.
8. Deposit for Long-Term Investment
On June 8, 2017, Kiwa Hebei entered an equity purchase agreement with the shareholders of Yantai Peng Hao New Materials Technology Co. Ltd. (“Peng Hao”) to acquire 100% interest in Peng Hao for approximately RMB 15,000,000 (approximately US$ 2.2 million). As of September 30, 2017, Kiwa Hebei has made deposit payment of RMB 5,000,000 (approximately $751,050).
| 15 |
9. Salary payable
There were $1,208,492 and $1,145,492 as at September 30, 2017 and December 31, 2016, respectively, among the balance of salary payable which were due to the former Chairman of the Board and CEO Mr. Li, and the current Chairman of the Board and CEO Ms. Wang. Mr. Li was the Chairman of the Board until November 2015 and was the Chief Executive Officer of the Company until July 2015. No salary was paid to Mr. Li during his service period. Ms. Wang served as Chairman of the Board since November 2015 and served as CEO since August 2016. No salary was paid to Ms. Wang since December 2015. The Company expects to be in negotiations with both parties to settle these obligations.
10. Related Party Transactions
Amounts due from related parties consisted of the following as of September 30, 2017 and December 31, 2016:
| Item | Nature | Notes | September 30, 2017 | December 31, 2016 | ||||||||||||
| Kangtan Gerui (Beijing) Bio-Tech Co., Ltd. (“Gerui”) | Non-trade | (1) | $ | 963,846 | $ | 1,522,434 | ||||||||||
| Total | $ | 963,846 | $ | 1,522,434 | ||||||||||||
(1) Gerui
Ms. Feng Li, a member of the Company’s board of directors and shareholder of the Company (Ms. Li held approximately 20% of the Company’s Common Stock and 50% of the Company’s Series A Preferred Stock), is also a 23% shareholder of Gerui. According to the agreement between the Company and Gerui, all the balances will be paid off before June 30, 2018. During the nine months ended September 30, 2017, the Company collected $558,588 from Gerui and the remaining balance was $963,846 as at September 30, 2017. The management has determined that no allowance for doubtful debts was necessary.
Amounts due to related parties consisted of the following as of September 30, 2017 and December 31, 2016:
| Item | Nature | Notes | September 30, 2017 | December 31, 2016 | ||||||||||||
| Ms. Yvonne Wang (“Ms. Wang”) | Non-trade | (1) | 130,199 | 100,798 | ||||||||||||
| Subtotal | 130,199 | 100,798 | ||||||||||||||
| CAAS IARRP and IAED Institutes | Trade | (2) | - | 160,461 | ||||||||||||
| Subtotal | - | 160,461 | ||||||||||||||
| Total amount due to related parties | 130,199 | 261,259 | ||||||||||||||
(1) Ms. Wang
Effective as of November 20, 2015, the Company appointed Ms. Wang as the Chairman of the Board and effective as of August 11, 2016, the Company’s Board of Directors has assigned Ms. Wang the additional titles of Acting President, Acting Chief Executive Officer and Acting Chief Financial Officer.
During the nine months ended September 30, 2017, Ms. Wang paid various expenses on behalf of the Company. As of September 30, 2017, the amount due to Ms. Wang was $130,199.
(2) CAAS IARRP and IAED Institutes
On November 5, 2015, the Company signed a strategic cooperation agreement (the “Agreement”) with China Academy of Agricultural Science (“CAAS”)’s Institute of Agricultural Resources & Regional Planning (“IARRP”) and Institute of Agricultural Economy & Development (“IAED”). The term of the Agreement was three years that began on November 20, 2015 and ends on November 19, 2018.
Pursuant to the agreement, Kiwa agree to fund RMB 1 million (approximately $160,000) each year to the Spatial Agriculture Planning Method & Applications Innovation Team that belongs to the Institutes. Professor Yong Chang Wu, the authorized representative of CAAS IARRP, is also one of the Company’s directors effective since November 20, 2015 until March 13, 2017.
The Company recorded $37,469 and $37,303 research and development expenses related to the institutes, for the three months ended September 30, 2017 and 2016, respectively, and $110,194 and $112,580 research and development expenses for the nine months ended September 30, 2017 and 2016, respectively.
| 16 |
The amount due to CAAS IARRP and IAED Institutes was reclassified to other payables and accruals at September 30, 2017 since Professor Yong Chang Wu is no longer the Company’s director from March 13, 2017. See note 13.
11. Convertible Notes Payable
(1) Convertible Notes Payable - Current
Convertible notes payable - current consists of $ 150,250 of 6% secured convertible notes issued to FirsTrust Group Inc. on June 29, 2006 and $136,742 (face amount $150,208 net of discount of $13,466) of 15% convertible note issued to Mr. Geng Liu on January 17, 2017.
6% secured convertible notes – FirsTrust Group Inc.
On June 29, 2006, the Company entered into a securities purchase agreement (the “Purchase Agreement”) with six institutional investors (collectively, the “Purchasers”) for the issuance and sale of 6% secured convertible notes, due three years from the date of issuance, in the aggregate principal amount of $2,450,000 (the “6% Convertible Notes”), convertible into shares of the Company’s common stock.
On August 12, 2013, the Company, entered into a Settlement Agreement and Release (the “Release”) with the holders (the “Holders”) of the “6% Convertible Notes” in the aggregate principal amount of $2,000,000. Pursuant to the terms of the Release, the Company paid the Holders $75,000 for a full release, including the forgiveness of past defaults of unpaid principal amounts, interests and penalties. During the course of the time, certain notes had been converted as well. On March 18, 2008, FirsTrust Group, Inc. (“FirsTrust”) purchased the three remaining 6% Convertible Notes, totaling $168,000 ($59,100, $50,400 and $59,100 respectively), from Nite Capital, one of the six institutional investors which purchased a total of $300,000 of the Note in three tranches ($105,000, $90,000, $105,000 respectively), for a cash payment of $100,000. After the Release and conversion, FirsTrust is the only holder of the outstanding 6% Convertible Note with outstanding principal amount of $150,250.
On June 29, 2009, the 6% Notes were due. The Company informed the Purchasers of its inability to repay the outstanding balance on the due date. Therefore, the 6% Notes are in default and the default interest rate of 15% per annum is being charged on the 6% Notes.
The conversion price of the Notes is based on a 40% discount to the average of the lowest three days trading price of the Company’s common stock on the OTC Bulletin Board over a 20-day trading period. The conversion price is also adjusted for certain subsequent issuances of equity securities of the Company at prices below the conversion price then in effect. The Notes contain a volume limitation that prohibits the holder from further converting the 6% Notes if doing so would cause the holder and its affiliates to hold more than 4.99% of the Company’s outstanding common stock.
The Company has elected to early adopt the guidance in ASU 2017-11. As a result, the Company has concluded that the conversion feature of the Notes is indexed to its own stock and would be classified and recorded as equity. The Company retrospectively applied the guidance to the above Notes and determined that the impact of the conversion feature for the above Notes is immaterial.
The Company also incurs a financial liquidated damages in cash or shares at the option of the Company (equal to 2% of the outstanding amount of the Notes per month plus accrued and unpaid interest on the Notes, prorated for partial months) if it breaches any affirmative covenants in the Purchase Agreement, including a covenant to maintain a sufficient number of authorized shares under its Certificate of Incorporation to cover at least 110% of the stock issuable upon full conversion of the Notes. Pursuant to the relevant provisions for liquidated damages in Purchase Agreement, the Company has accrued the amounts of $61,730 and $57,672 for liquidated damages for the nine months ended September 30, 2017 and 2016, respectively. The Company also accrued $16,857 and $16,919 for interest at the rate of 15% per annum for the nine months ended September 30, 2017 and 2016, respectively. The total 15% interest was $200,218 and $177,681 at September 30, 2017 and 2016, respectively. The total accrued liquidated damages were $544,056 and $462,423 at September 30, 2017 and 2016, respectively.
| 17 |
The Company’s obligations under the Notes are secured by a first priority security interest in the Company’s intellectual property pursuant to an Intellectual Property Security Agreement with the Holders. In addition, Mr. Li, the Company’s former Chief Executive Officer until July 1, 2015, has pledged all of his common stock of the Company as collateral for the Company’s obligations under the 6% Convertible Notes.
15% convertible notes- Mr. Geng Liu
On January 17, 2017, the Company entered a Convertible Note Agreement with Mr. Geng Liu with principal of RMB 3 million. The note bears interest at 15% per annum and will mature on January 16, 2018. Before the maturity date, the Note holder has an option to convert partial or all of the outstanding principal to the Company’s common shares with a conversion price of $0.90 per share. As of September 30, 2017, the Company has received partial principal totaled RMB 1 million ($150,208 equivalent revalued as at September 30, 2017).
The notes are convertible into shares of the common stock, at conversion price is $0.9 which is lower than the price of the Company’s common stock on the date of issue. Therefore, the conversion feature embedded in the convertible note meet the definition of beneficial conversion feature (“BCF”). The Company evaluated the intrinsic value of the BCF as $45,094 at the issue date. The relative fair values of the BCF were recorded into additional paid in capital, and the remainder proceeds of $99,850 from issuance of the convertible note was allocated to convertible notes payable.
For the nine months ended September 30, 2017, the Company recorded interest expense of $45,535 on the note, including the amortization of the debt discount resulting from the value of beneficial conversion feature, and the carrying value of the note as at September 30, 2017 was $136,742 .
(2) Convertible Notes Payable - Non-current and derivative liabilities
Convertible notes payable – non-current consists $826,148 of 15% convertible note issued to Mr. Junwei Zheng on May 9, 2017.
15% convertible notes- Mr. Junwei Zheng
On May 9, 2017, the Company entered a Convertible Note Agreement with Mr. Junwei Zheng with principal of RMB 30 million. The note bears interest at 15% per annum and will mature on May 8, 2019. Before the maturity date, the Note holder has an option to convert partial or all of the outstanding principal and accrued interest to the Company’s common shares with a conversion price of $3.5 per share. As of September 30, 2017, the Company has received partial principal totaled RMB 5.5 million ($826,148 equivalent revalued at September 30, 2017).
The notes are convertible into shares of the common stock, at conversion price is $3.5 which is higher than the price of the Company’s common stock on the date of issue, therefore the conversion feature embedded in the note was out of money at the issue date thus did not meet the definition of BCF. The Company determined that conversion option embedded in the note meet the definition of a derivative instrument. Since the embedded conversion price of the conversion feature is denominated in U.S. dollar, a currency other than the convertible note payable currency. As a result, the embedded conversion feature is not considered indexed to the Company’s own stock due to the variable exchange rate between U.S. Dollar and RMB, and as such, the Company determined that the embedded conversion feature to be carried as a liability and remeasured at fair value at each financial reporting date until such time as the conversion feature is exercised or expired. The Company evaluated the fair value of the embedded conversion feature at the issue date and recorded the amount into as discount to convertible note payable. The discount to convertible note payable is being amortized to interest expense over the life of the note using the straight-line method, which approximates the effective interest method.
The fair value of embedded conversion feature were calculated using the BlackScholesMerton model based on the following variables at inception on May 9, 2017:
| ● | Strike price of $3.5, for the conversion options | |
| ● | Expected volatility of 260.8% calculated using the Company’s historical price of its common stock | |
| ● | Expected dividend yield of 0% | |
| ● | Risk-free interest rate of 1.37%, for the conversion options | |
| ● | Expected lives of 2.0 years | |
| ● | Market price at issuance date of $2.7 |
The fair value of embedded conversion feature were calculated using the BlackScholesMerton model based on the following variables on September 30, 2017:
| ● | Strike price of $3.5, for the conversion options | |
| ● | Expected volatility of 158.1% calculated using the Company’s historical price of its common stock | |
| ● | Expected dividend yield of 0% | |
| ● | Risk-free interest rate of 1.43%, for the conversion options | |
| ● | Expected lives of 1.58 years | |
| ● | Market price at remeasurement date of $2.5 |
On May 9, 2017, the Company recorded $569,784 as derivative liability for fair value of the conversion option. The initial carrying value of the Notes was $227,051. On September 30, 2017, the fair value of derivative liabilities was recalculated at $370,733. For the three months and nine months ended September 30, 2017, the Company recognized a gain of $205,612 and $199,051, respectively, in change in fair value of derivative liabilities.
For the nine months ended September 30, 2017, the Company recorded interest expense of $162,520 on the note, including the amortization of the debt discount resulting from the value of the embedded conversion feature, and the carrying value of the note as of September 30, 2017 was $370,321.
12. Note Payable
On May 29, 2007, the Company issued a $360,000 promissory note (the “Promissory Note”) to an unrelated individual (the “Original Note holder”). This note bears interest at 18% per annum and was due on July 27, 2007. This note is currently in default and bears interest of 25% per annum (the “Default rate”) until paid in full. This note is secured by a pledge of shares of the Company’s common stock owned by Investlink (China) Limited (the “Pledged Shares”). The Company accrued $22,500 and 22,500 interest expense on note payable for the three months ended September 30, 2017 and 2016, respectively, and $67,500 and $67,500 interest expense on note payable for the nine months ended September 30, 2017 and 2016, respectively.
| 18 |
As of December 31, 2016, the Original Note holder informed the Company that all right, title and interests in the Promissory Note has been assigned and transferred to FirsTrust. As of September 30, 2017, all of $360,000 of Promissory Note to FirsTrust is still outstanding, and total accrued interest of the Promissory Note is $ 926,800. The Company has begun preliminary discussion with FirsTrust with regards to a potential settlement of the Note, but no agreement has been reached yet.
13. Other Payables and accruals
Other payable consisted of the following:
| Notes | September 30, 2017 | December 31, 2016 | ||||||||||
| Stock subscription proceeds received in advance | (1) | $ | 1,310,522 | $ | 460,617 | |||||||
| Investment received in advance | (2) | - | 79,168 | |||||||||
| Accrued expenses | 59,216 | 385,090 | ||||||||||
| R&D expense payable | 271,151 | - | ||||||||||
| $ | 1,640,889 | $ | 924,875 | |||||||||
(1). The Company received RMB 3.2 million in 2016 and RMB 5.5 million for the nine months ended September 30, 2017 from four unrelated potential investors, which was approximately $1,310,522. The Company has subsequently issued 38,000 shares of common stock to one investor for the amount $ 76,000 (RMB 0.5 million) and the other investment agreements have not been finalized yet for the remaining part.
(2). The Company received the investment funds in advance in 2016 from Mr. Geng Liu, which amount was approximately $79,168. Subsequently on January 17, 2017, the Company entered a Convertible Note Agreement with Mr. Geng. The note bears interest at 15% per annum and will mature on January 16, 2018. See Note 12.
14. Stockholders’ Equity (Deficiency)
Preferred stock
On December 14, 2015, the Company issued 500,000 shares of preferred stock for the aggregate amount of $1,000,000 as debt cancellation owed to two related party individuals.
Reverse Split
On January 14, 2016, the Company filed a Certificate of Amendment of its Certificate of Incorporation with the State of Delaware with reference to a 1-for-200 reverse stock split with respect to its Common Stock with effective date of January 28, 2016. In connection with the reverse split, the Company’s authorized capital was amended to be 120,000,000 shares, comprising 100,000,000 shares of Common Stock par value $0.001 and 20,000,000 shares of Preferred Stock par value $0.001. All relevant information relating to numbers of shares and per share information have been retrospectively adjusted to reflect the reverse stock split for all periods presented.
Common stock
During the nine months ended September 30, 2017, the Company issued 1,674,900 common shares to six individuals residing in China for net proceeds of $2,410,654.
On June 30, 2017, the Company issued 97,850 common shares to ten employees for cash at $1.95 per share for an aggregate price to $190,807. The difference $102,273 based on the calculation between stock price and employee purchase price was recognized as expense of employee benefits and accordingly, credited the same amount to APIC.
| 19 |
During the nine months ended September 30, 2017, the Company entered into ten consulting agreements and issued 665,988 shares of common stocks to consultants for financing, business development services and IT services based on market price of issuance.
Additional paid-in-capital
As disclosed in Note 11(1), on January 17, 2017, the Company issued RMB 1 million ($144,944 equivalent).Convertible Note to Mr. Geng Liu with BCF embedded. The Company evaluated the intrinsic value of the BCF as $45,094 at the issue date and recorded the amount into additional paid in capital.
15. Stock-based Compensation
On March 15, 2017, the Board of Directors approved a new stock option plan with ten years’ term. As of September 30, 2017, the Company has not granted any incentive compensation under this plan.
16. Fair Value Measurements
The following table sets forth by level within the fair value hierarchy the Company’s financial assets and liabilities recorded at fair value on recurring basis that were accounted for at fair value as of:
September 30, 2017
| Recurring Fair Value Measures | Level 1 | Level 2 | Level 3 | Total | ||||||||||||
| Derivative liabilities | — | — | $ | 370,733 | $ | 370,733 | ||||||||||
| Total | — | — | $ | 370,733 | $ | 370,733 | ||||||||||
The following is a reconciliation of the beginning and ending balance of the assets and liabilities measured at fair value on a recurring basis for the nine months ended September 30, 2017 and for the year ended December 31, 2016:
| Nine months ended September 30, 2017 | Year ended December 31, 2016 | |||||||
| Beginning balance | $ | - | $ | - | ||||
| Fair value of derivative liabilities at inception | 569,784 | - | ||||||
| Change in fair value of derivative liabilities | (199,051 | ) | - | |||||
| Ending balance | $ | 370,733 | $ | - | ||||
17. Income Tax
In accordance with the current tax laws in the U.S., the Company is subject to a corporate tax rate of 34% on its taxable income. No provision for taxes is made for U.S. income tax for the three and nine months ended September 30, 2017 and 2016 as it has no taxable income in the U.S.
In accordance with the current tax laws in China, Kiwa Shandong, Kiwa Beijing, Kiwa Shenzhen and Kiwa Hebei is subject to a corporate income tax rate of 25% on its taxable income. Kiwa Shandong has not provided for any corporate income taxes since it had no taxable income for the three and nine months ended September 30, 2017 and 2016. Kiwa Shenzhen and Kiwa Hebei has not provided for any corporate income taxes since it had no taxable income for the three and nine months ended September 30, 2017 and 2016. For the three and nine months ended September 30, 2017, Kiwa Beijing recorded no current income tax provision.
In accordance with the relevant tax laws in the British Virgin Islands, Kiwa BVI, as an International Business Company, is exempt from income taxes.
A reconciliation of the provision for income taxes from continuing operation determined at the local income tax rate to the Company’s effective income tax rate is as follows:
| Three
months ended September 30, | Nine
months ended September 30, | |||||||||||||||
| 2017 | 2016 | 2017 | 2016 | |||||||||||||
| Pre-tax income (loss) from continuing operation | $ | (850,876 | ) | $ | 224,712 | $ | (2,227,413 | ) | $ | 570,397 | ||||||
| U.S. federal corporate income tax rate | 34 | % | 34 | % | 34 | % | 34 | % | ||||||||
Income tax expense (benefit) computed at U.S. federal corporation income tax rate | (289,298 | ) | 76,402 | (757,320 | ) | 193,935 | ||||||||||
| Reconciling items: | ||||||||||||||||
| Rate differential for PRC earnings | 85,840 | (32,403 | ) | 133,249 | (28,419 | ) | ||||||||||
| Change of valuation allowance | 73,251 | 60,880 | 381,789 | 180,581 | ||||||||||||
| Effect of tax exempted income in BVI | 7,139 | (25,934 | ) | 21,422 | (267,152 | ) | ||||||||||
| Effective tax expenses (benefits) | $ | (123,068 | ) | $ | 78,945 | $ | (220,860 | ) | $ | 78,945 | ||||||
| 20 |
The Company had deferred tax assets from continuing operation as follows:
| September 30, 2017 | December 31, 2016 | |||||||
| Net operating losses carried forward by the Company and its China subsidiaries except for Kiwa Beijing | $ | 2,814,453 | $ | 2,555,064 | ||||
| Less: Valuation allowance | (2,814,453 | ) | (2,555,064 | ) | ||||
| Bad debt allowance | 63,244 | - | ||||||
| Net operating losses carried forward by Kiwa Beijing | 183,628 | - | ||||||
| Net deferred tax assets | $ | 246,872 | $ | - | ||||
As of September 30, 2017 and December 31, 2016, the Company had approximately $8.3 million and $7.5 million net operating loss carryforwards available to reduce future taxable income. Net operating loss of the parent Company could be carried forward and taken against any taxable income for a period of not more than twenty years from the year of the initial loss pursuant to Section 172 of the Internal Revenue Code of 1986, as amended. The net operating loss of Kiwa Shenzhen could be carried forward for a period of not more than five years from the year of the initial loss pursuant to relevant PRC tax laws and regulations. It is more likely than not that the deferred tax assets cannot be utilized in the future because there will not be significant future earnings from the entity which generated the net operating loss. Therefore, the Company recorded a full valuation allowance on its deferred tax assets.
As of September 30, 2017, the Company had approximately $0.1 million deferred tax assets on bad debt allowance. Bad debt allowance must be approved by the PRC tax authority prior to being deducted as an expense item on the tax return.
As of September 30, 2017 and December 31, 2016, the Company has no material unrecognized tax benefits which would favorably affect the effective income tax rate in future periods and does not believe that there will be any significant increases or decreases of unrecognized tax benefits within the next twelve months. No interest or penalties relating to income tax matters have been imposed on the Company during the nine months ended September 30, 2017 and December 31, 2016, and no provision for interest and penalties is deemed necessary as of September 30, 2017 and December 31, 2016.
18. Commitments and Contingencies
The Company has the following material contractual obligations:
(1) Investment in manufacturing facilities in Penglai City, Shandong Province in China
As disclosed in Note 8, on June 8, 2017, Kiwa Hebei entered an equity purchase agreement with the shareholders of Yantai Peng Hao New Materials Technology Co. Ltd. (“Peng Hao”) to acquire 100% interest in Peng Hao for approximately RMB 15,000,000 (approximately US$ 2.2 million). As of September 30, 2017, Kiwa Hebei has made deposit payment of RMB 5,000,000 (approximately $751,050) and is committed to pay the remaining RMB10,000,000 based on the payment milestone in the equity purchase agreement.
(2) Strategic cooperation with the institutes in China
On November 5, 2015, the Company signed a strategic cooperation agreement (the “Agreement”) with China Academy of Agricultural Science (“CAAS”)’s Institute of Agricultural Resources & Regional Planning (“IARRP”) and Institute of Agricultural Economy & Development (“IAED”). Pursuant to the Agreement, the Company will form a strategic partnership with the two institutes and establish an “International Cooperation Platform for Internet and Safe Agricultural Products”. To fund the cooperation platform’s R&D activities, the Company will provide RMB 1 million (approximately $160,000) per year to the Spatial Agriculture Planning Method & Applications Innovation Team that belongs to the Institutes. The term of the Agreement is for three years beginning November 20, 2015 and will expire on November 19, 2018. However, the Company is only liable for the annual funds to be provided to the extent of the contract obligations performed by CAAS IARRP and IAED, and the agreement is terminable before the three years’ commitment date based on negotiations of both parties.
| 21 |
(3) Lease payments
(a) On March 21, 2016, Kiwa Baiao Bio-Tech (Beijing) Co., Ltd. entered an office lease agreement with two-year term. Monthly lease payment fee totaled RMB 68,133 or approximately USD $10,536.
(b) On November 20, 2016, Kiwa Baiao Bio-Tech (Beijing) Co., Ltd. entered an apartment lease agreement for its employees. The lease term is one year with monthly lease payment of RMB 6,000 or approximately USD $896. This lease was terminated on May 31, 2017 upon mutual agreement.
(c) On March 1, 2017, Kiwa Bio-Tech (Shenzhen) Co., Ltd, a newly established subsidiary entered an office lease agreement with one-year term. Monthly lease payment is RMB 29,000 or approximately of USD $4,320. This lease was terminated on August 31, 2017.
(d) On June 20, 2017, Kiwa Bio-Tech (Shenzhen) Co., Ltd, a newly established subsidiary entered an office lease agreement with two-year term. Monthly lease payment is RMB 117,221 or approximately of USD $17,213 for the first year and RMB 124,254 or approximately of USD $18,245 for the second year. And the previous lease agreement terminated automatically since the landlord is the same one.
(e) On September 1, 2017, Kiwa Bio-Tech (Shenzhen) Co., Ltd. entered a storage lease agreement with one-year term. Monthly lease payment fee totaled RMB 4,800 or approximately USD $721.
(f) On May 5, 2017, Kiwa Bio-Tech Products Group Corporation entered an office lease agreement with 13 months term. Monthly lease payment totaled USD $781.15.
(g) On July 1, 2017, Kiwa Bio-Tech Products Group Corporation entered an office lease agreement with one-year term. Monthly lease payment totaled USD $1,087.
(h) On July 4, 2017, Kiwa Bio-Tech (Hebei) Co., Ltd, a newly established subsidiary entered an office lease agreement with one-year term. Monthly lease payment is RMB 2,000 or approximately of USD $301.
(i) On September 1, 2017, Kiwa Bio-Tech (Hebei) Co., Ltd, entered an apartment lease agreement for its employees. The lease term is one year with monthly lease payment of RMB 1,060 or approximately USD $161.
The future lease payments at September 30, 2017 are summarized below.
| Twelve months ending September 30, 2018 | $ | 314,214 | ||
| Twelve months ending September 30, 2019 | $ | 167,976 | ||
| Thereafter | - | |||
| Total minimum lease payment | $ | 482,190 |
19. Concentration of Risk
Credit risk
Financial instruments that potentially subject the Company to significant concentrations of credit risk consist primarily of cash and accounts receivable. As of September 30, 2017 and December 31, 2016, $23,275, and $13,469 were deposited with various major financial institutions located in the PRC, respectively. While management believes that these financial institutions are of high credit quality, it also continually monitors their credit worthiness.
Accounts receivable are typically unsecured and derived from revenue earned from customers, thereby exposed to credit risk. The risk is mitigated by the Company’s assessment of its customers’ creditworthiness and its ongoing monitoring of outstanding balances.
Customer and vendor concentration risk
For the nine months ended September 30, 2017, five customers accounted for 23%, 14%, 14%, 14% and 14% of the Company’s sales. For the nine months ended September 30, 2016, one customer accounted for 100% of the Company’s revenues.
As of September 30, 2017, three customers accounted for 45%, 30% and 12% of the Company’s accounts receivable. As of December 31, 2016, one customer accounted for 100% of the Company’s accounts receivable.
For the nine months ended September 30, 2017, one supplier accounted for 93% of the Company’s total purchases. For the nine months ended September 30, 2016, one supplier accounted for 91% of the Company’s total purchases.
As of September 30, 2017, two suppliers accounted for 81% and 13% of the Company’s accounts payable. As of December 31, 2016, two suppliers accounted for 57% and 43% of the Company’s accounts payable.
20. Discontinued Operation
On February 11, 2017, the Company executed an Equity Transfer Agreement with Dian Shi Cheng Jing (Beijing) Technology Co. (“Transferee”) whereby the Company transferred all of its right, title and interest in Kiwa Bio-Tech Products (Shandong) Co., Ltd. (“Shandong”) to the Transferee for the RMB 1.00. The government approval and processing of the transaction was completed on April 12, 2017. This transaction was considered as completed and effective on April 12, 2017.
The following table summarizes the assets and liabilities of the discontinued operation, excluding intercompany balances eliminated in consolidation, at April 12, 2017 and December 31, 2016, respectively:
| April 12, 2017 | December 31, 2016 | |||||||
| Assets held for sale: | ||||||||
| Property, plant and equipment – Original cost | 2,117,324 | 2,117,324 | ||||||
| Less: accumulated depreciation | (765,598 | ) | (765,598 | ) | ||||
| Less: impairment | (1,351,726 | ) | (1,351,726 | ) | ||||
| Deferred tax assets | 1,013,365 | 1,013,365 | ||||||
| Less: Deferred tax assets allowance | (1,013,365 | ) | (1,013,365 | ) | ||||
| Total assets of business held for sale | $ | - | $ | - | ||||
| Liabilities of business held for sale: | ||||||||
| Accounts Payable | 253,208 | 251,466 | ||||||
| Advances from customers | 12,972 | 12,883 | ||||||
| Salary payable | 537,127 | 533,432 | ||||||
| Accrued expense | 29,035 | 28,835 | ||||||
| Other payable | 102,291 | 101,588 | ||||||
| Due to related party-trade | 1,130,534 | 1,122,754 | ||||||
| Loan payable | 1,666,813 | 1,655,343 | ||||||
| Construction cost payable | 257,309 | 255,539 | ||||||
| Tax payable | 522,893 | 502,845 | ||||||
| Total liabilities of business held for sale | $ | 4,512,182 | $ | 4,464,685 | ||||
| 22 |
The income statements for the three and nine months ended September 30, 2017 and 2016 reflected the Kiwa Shandong business segment as a discontinued operation. The following results of operations of Kiwa Shandong are presented as a loss from a discontinued operation in the unaudited condensed consolidated statements of operations:
| Three months ended September 30, | Nine months ended September 30, | |||||||||||||||
| 2017 | 2016 | 2017 | 2016 | |||||||||||||
| Net sales | - | - | - | - | ||||||||||||
| Gross profit | - | - | - | - | ||||||||||||
| Operating expense | - | 52,166 | 16,790 | 159,745 | ||||||||||||
| Income tax | - | - | - | - | ||||||||||||
| Loss from discontinued operations | $ | - | $ | 52,166 | $ | 16,790 | $ | 159,745 | ||||||||
The following is the calculation of the gain on the sale of Kiwa Shandong:
| Selling price | $ | - | ||
| Net assets (liabilities) transferred at the transaction date | $ | (4,512,182 | ) | |
| Gain on sale of discontinued operations | $ | 4,512,182 |
| 23 |
21. Subsequent Events
On October 24, 2017, the Company issued 38,000 shares of restricted common stock at $2.00 per share to Erli Wei for an aggregate amount of $76,000. The Company has received the full amount.
On October 19, 2017, the Company issued total 14,151 common shares at $1.04 per share price to FirsTrust Group, Inc. for the conversion of convertible note. According to the convertible note agreement, the conversion price is based on a 40% discount to the average of the lowest three days trading price of the Company’s common stock on the OTC Bulletin Board over a 20-day trading period per the convertible notes agreement.
On October 24, 2017, the Company issued a total of 1,338,000 common shares to nine individuals for their consulting services to assist the Company in marketing and financing projects. The number of shares was determined based on the fair value of the services. The agreements have terms ranging from one to three years.
ITEM 2. MANAGEMENT’S DISCUSSION AND ANALYSIS OF FINANCIAL CONDITION AND RESULTS OF OPERATIONS.
This Quarterly Report on Form 10-Q for the three and nine months ended September 30, 2017 contains “forward-looking statements” within the meaning of Section 21E of the Securities and Exchange Act of 1934, as amended, including statements that include the words “believes,” “expects,” “anticipates,” or similar expressions. These forward-looking statements include, among others, statements concerning our expectations regarding our working capital requirements, financing requirements, business, growth prospects, competition and results of operations, and other statements of expectations, beliefs, future plans and strategies, anticipated events or trends, and similar expressions concerning matters that are not historical facts. The forward-looking statements in this Quarterly Report on Form 10-Q for the three and nine months ended September 30, 2017 involve known and unknown risks, uncertainties and other factors that could cause our actual results, performance or achievements to differ materially from those expressed in or implied by the forward-looking statements contained herein.
Overview
The Company took its present corporate form in March 2004 when shareholders of Kiwa Bio-Tech Products Group Ltd. (“Kiwa BVI”), a company originally organized under the laws of the British Virgin Islands on June 5, 2002 and Tintic Gold Mining Company (“Tintic”), a corporation originally incorporated in the state of Utah on June 14, 1933 to perform mining operations in Utah, entered into a share exchange transaction. The share exchange transaction left the shareholders of Kiwa BVI owning a majority of Tintic and Kiwa BVI a wholly-owned subsidiary of Tintic. For accounting purposes this transaction was treated as an acquisition of Tintic by Kiwa BVI in the form of a reverse triangular merger and a recapitalization of Kiwa BVI and its wholly owned subsidiary, Kiwa Bio-Tech Products (Shandong) Co., Ltd. (“Kiwa Shandong”). On July 21, 2004, we completed our reincorporation in the State of Delaware. On March 8, 2017, we completed our reincorporation in the State of Nevada.
On November 30, 2015, we entered into an acquisition agreement (the “Agreement”) with the shareholders of Caber Holdings LTD, whose Chinese name is Hong Kong Baina Group Co., Ltd, located in Hong Kong (“Baina Hong Kong”), and Oriental Baina Co. Ltd. (hereinafter referred to as “Baina Beijing”), Baina Hong Kong’s wholly-owned subsidiary in Beijing, China. Kiwa will rename Baina Beijing to Kiwa Baiao Co. Ltd. Kiwa Baiao Co. Ltd will replace Kiwa’s current subsidiary in China - Kiwa Bio-Tech (Shandong) Co., Ltd (“Kiwa Shandong”) - to operate Kiwa’s bio-fertilizer market expansion and become Kiwa’s platform for future acquisitions of new agricultural-related projects in China. In accordance with the terms of the Agreement, Kiwa agreed to pay approximately $34,000 (RMB 220,000) to the Baina Hong Kong Shareholders, a group of unrelated third parties, for the acquisition of 100% of the equity of Baina Hong Kong. The acquisition was completed on January 7, 2016. Both Baina Hong Kong and Baina Beijing had no activities before the acquisition date and had no assets and liabilities. The purpose of this acquisition was to acquire Baina Hong Kong’s corporation registration in Hong Kong and in China.
We previously established a subsidiary in China, Kiwa Shandong in 2002, a wholly-owned subsidiary, engaging in the bio-fertilizer business. Formerly, our subsidiary Tianjin Kiwa Feed Co., Ltd. (“Kiwa Tianjin”), was engaged in the bio-enhanced feed business. At the end of 2009, Kiwa Tianjin could no longer use its assets including machinery and inventory in the normal course of operations. Kiwa Tianjin has been dissolved since July 11, 2012. On February 11, 2017, the Company entered an Equity Transfer Agreement with Dian Shi Cheng Jing (Beijing) Technology Co. (“Transferee”) to transfer all of shareholders’ right, title and interest in Kiwa Shandong to the Transferee for RMB1.00. On April 12, 2017, the government processing of transfer has been completed.
| 24 |
Principal Factors Affecting Our Financial Performance
We believe that the following factors that would affect our financial performance:
| ● | Change in the Chinese Government Policy on agricultural industry. The Chinese Government is continuously to promote green environment and implement quality standards and environmentally sensitive policies in the Agricultural industry. Below are a list of government policies issued by the Chinese Government to promote green environment and these policies are either directly or indirectly to encourage the end users of the bio-fertilizer to use more organic related products. Unfavorable changes to these policies could affect demand of our products that we produce and could materially and adversely affect the results of operations. Although we have generally benefited from these policies by using our bio-fertilizer to enhances the capacity of plants to transform inorganic materials to organic products, to boost overall plant health and productivity and not to deteriorate landfall soil. |
| o | In April 2008, the Ministry of Finance of PRC issued Circular No. 2008-56 to tax-exempt value-added taxes on all organically fertilizer related products effectively from June 1, 2008. | |
| o | In January 2016, the PRC State Council official website issued statements to fasten the agricultural modernization process. | |
| o | In June 2016, the PRC State Council issued Circular No. 2016-31 to prevent further deterioration of landfall soil action plan. | |
| o | In February 2017, the PRC State Council official website issued statements to promote agricultural structural reform on accelerating the cultivation in the agricultural development. | |
| o | In February 2017, the Ministry of Agriculture of PRC issued Circular No. 2017-02 to carry out replacement of chemical bio-fertilizers by organically bio-fertilizers action plan on vegetables, fruits and teas planting. | |
| o | In April 2017, the Ministry of Agriculture of PRC issued Circular No. 2017-06 to implementing five major action plans on agriculture green development with one of the action plan of replacing chemical bio-fertilizers by organically bio-fertilizers on vegetables, fruits and teas planting under action plan No. 2-2. |
| ● | Innovation Efforts. We strive to produce the most technically and scientifically advanced products for our customers and maintained close relationships with institutes in the PRC. |
| o | We signed a strategic cooperation agreement with China Academy of Agricultural Science’s Institute of Agricultural Resources & Regional Planning and Institute of Agricultural Economy & Development. Pursuant to the Agreement, we will form a strategic partnership with the two institutes and establish an “International Cooperation Platform for Internet and Safe Agricultural Products”. To fund the cooperation platform’s R&D activities, we will provide RMB 1 million (approximately $160,000) per year to the Spatial Agriculture Planning Method & Applications Innovation Team that belongs to the Institutes. The term of the Agreement is for three years beginning November 20, 2015 and will expire on November 19, 2018. | |
| o | Meanwhile, on February 23, 2017, the Company entered a strategic relationship with ETS (Tianjin) Biological Science and Technology Development Co., Ltd. (“ETS”). ETS technology was first established in the U.S., and commercialized and improved in Japan for nearly 30 years. In 2013, the ETS technology was introduced into Mainland China. It has been widely accepted that the application of ETS biotechnology facilitates agricultural sustainability and helps to protect the soil and improve grain output. The technology focuses on keeping soil healthy by restoring healthy microbes that are naturally present in healthy soils. As the technology gains worldwide recognition, it is imperative to popularize bio-fertilizer in developing countries to fulfill the needs of growing populations and promote environmentally friendly agriculture. The cooperation will include the deployment and strategic use of ETS biotechnology to produce of bio-fertilizers for use in both China and internationally. The cooperation will bring technological transformation and support for Kiwa to improve its existing manufacturing techniques. Kiwa and ETS will also collaborate to establish a comprehensive platform for producing, supplying, and marketing in China. Ultimately, Kiwa would look to introduce these products to the international market, including the United States. |
| ● | Experienced Management. Management’s technical knowledge and business relationships give us the ability to secure more sales orders with our customers. If there were to be any significant turnover in our senior management, it could deplete the institutional knowledge held by our existing senior management team. | |
| ● | Large Scale Customer Relationship. We have contracts with major customers that are distributors of our products. Our sales efforts focus on these distributors which place large recurring orders and present less credit risk to us. For the nine months ended September 30, 2017, five customers accounted for approximately 23%, 14%, 14%, 14%, and 12% of our sales. Should we lose any large scale customers in the future and are unable to obtain additional customers, our revenues will suffer. | |
| ● | Competition. Our competition includes a number of publicly traded companies in the PRC and privately-held PRC-based companies that produce and sell products similar to ours. We compete primarily on the basis of quality, technological innovation and price. Some of our competitors have achieved greater market penetration but with less sophisticated technological innovation than our products as there were in the transition period from being the chemical bio-fertilizer producers to the organically bio-fertilizer producers. We believe that we have a better competitive advantage over them as we are the pioneer within our markets. Some of our competitors competed within our markets have lesser financial and other resources than us as they have established their companies a few years behind us. If we are unable to compete successfully in our markets, our relative market share and profits could be reduced. |
| 25 |
Results of Operations
Three months ended September 30, 2017 and September 30, 2016
The following table summarizes the results of our operations during the three months periods ended September 30, 2017 and 2016, respectively, and provides information regarding the dollar and percentage increase or (decrease) during such periods.
(All amounts, other than percentages, in thousands of U.S. dollars)
| Three months Ended September 30, | Amount Increase | Percentage Increase | ||||||||||||||
| Statement of Operations Data: | 2017 | 2016 | (Decrease) | (Decrease) | ||||||||||||
| Revenues | $ | 31 | $ | 1,185 | $ | (1,154 | ) | (97 | )% | |||||||
| Cost of goods sold | (20 | ) | (770 | ) | (750 | ) | (97 | )% | ||||||||
| Gross profit | 11 | 415 | (404 | ) | (97 | )% | ||||||||||
| Operating expenses | ||||||||||||||||
| Research and development expense | 37 | 37 | - | - | % | |||||||||||
| Selling expenses | 148 | - | 148 | 100 | % | |||||||||||
| General and administrative expenses | 1,068 | 182 | 886 | 487 | % | |||||||||||
| Total operating expenses | 1,253 | 219 | 1,034 | 472 | % | |||||||||||
| Operating Income (Loss) | (1,242 | ) | 196 | (1,438 | ) | (734 | )% | |||||||||
| Other income/(expense), net | ||||||||||||||||
| Trademark license income-related party | - | 76 | (76 | ) | (100 | )% | ||||||||||
| Change in fair value of derivative liabilities | 205 | - | 205 | 100 | % | |||||||||||
| Interest expense | (169 | ) | (47 | ) | 122 | 260 | % | |||||||||
| Other income | 373 | - | 373 | 100 | % | |||||||||||
| Exchange loss | (18 | ) | - | 18 | 100 | % | ||||||||||
| Total other income/(expense), net | 391 | 29 | 362 | 1,248 | % | |||||||||||
| Income (loss) from continuing operations before income taxes | (851 | ) | 225 | (1,076 | ) | (478 | )% | |||||||||
| Provision (benefit) for income taxes | ||||||||||||||||
| Current | - | 79 | (79 | ) | (100 | )% | ||||||||||
| Deferred | (123 | ) | - | 123 | 100 | % | ||||||||||
| Total provision (benefit) for income taxes | (123 | ) | 79 | (202 | ) | (256 | %) | |||||||||
| Income (loss) from continuing operations | (728 | ) | 146 | (874 | ) | (599 | )% | |||||||||
| Discontinued operations: | ||||||||||||||||
| Loss from discontinued operations, net of taxes | - | (52 | ) | (52 | ) | (100 | )% | |||||||||
| Gain on disposal of discontinued operations, net of taxes | - | - | - | - | % | |||||||||||
| Income (loss) from discontinued operations, net of taxes | - | (52 | ) | (52 | ) | (100 | )% | |||||||||
| Net Income (loss) | $ | (728 | ) | $ | 94 | $ | (822 | ) | (874 | )% | ||||||
| 26 |
Revenue
Revenue decreased by approximately $1.2 million or 97%, to approximately $31,000 in the three months ended September 30, 2017 from approximately $1.2 million in the three month ended September 30, 2016. The decrease is mainly due to approximately $5.9 million of our revenues is being deferred for the three months ended September 30, 2017. In August 2016, Kiwa Baiao Bio-Tech (Beijing) Co., Ltd obtained a fertilizer sales permit from the Chinese government and began to sell the products directly to customers in Northern areas of China. Due to the good quality of our products, we have gained more reputation in the agricultural industry and were able to attract more customers. In addition, we established Kiwa Bio-Tech Products (Shenzhen) Co., Ltd. in November 2016 to support sales in Southern areas of China. Our strategy on the expansion of our business was to gain market shares in the bio-fertilizer market, thereby, we have extended credit to our customers. Our current payment terms on these customers are ranging from 60 days to 9 months after receipts of the goods depending on the creditworthiness of these customers. These customers are mainly agricultural cooperative company and distributors who then resell our products to individual farmers. Because the crop growing cycle usually takes approximately 3 to 9 months in the agricultural industry, it will take approximately similar time frame of 3 to 9 months for farmers to harvest crops and to realize profits to repay our distributors. As a result, for the sales contracts with these customers, the collectability of payment is highly dependent on the successful harvest of corps and the customers' ability to collect money from farmers. The Company deemed the collectability of payment may not be reasonably assured until after the Company get paid. For those sales contracts that the Company has shipped its products but the payment is contingent on collections of payments from the downstream customers, the Company considers the revenue recognition criteria are not met and therefore defers the revenue and cost of goods sold until payments are collected. We have sold and shipped approximately $5.9 million of our products during the three months ended September 30, 2017 for which the revenue recognition criteria of collectability of payments is reasonably assured has not yet been met, and we have deferred approximately $5.9 million of revenues to be recognized in the future periods when our collectability of payments will be assured. As a result, our revenue decreased accordingly for the three months ended September 30, 2017 as compared to the same period in 2016.
We currently only realized revenue in one major product categories of Biological Organic Fertilizer. We sold and shipped another product category of Compound Microbial Fertilizer in the third quarter of 2017 and recorded the selling amount in deferred revenue. We plan to launch another product category of Bio-Water Soluble Fertilizer in 2018. Our revenues from our major product category are summarized as follows:
| For
the three months ended September 30, 2017 | For
the three months ended September 30, 2016 | Change | Change (%) | |||||||||||||
| Biological Organic Fertilizer | ||||||||||||||||
| Revenue in USD | $ | 31,025 | $ | 1,185,309 | $ | (1,154,284 | ) | -97.4 | % | |||||||
| Quantity sold in tons | 162 | 6,500 | (6,338 | ) | -97.5 | % | ||||||||||
| Average selling price | $ | 191.51 | $ | 182.36 | $ | 9.15 | 5.0 | % | ||||||||
Revenue from Biological Organic Fertilizer decreased by approximately $1.2 million or 97.4%, to approximately $31,000 in the three months ended September 30, 2017 from approximately $1.2 million in the three month ended September 30, 2016. The decrease is mainly due to approximately $2.3 million of our revenues is being deferred as discussed above. Average selling prices increased by $9.15 or 5.0% during the three months ended September 30, 2017 as compared to the three months ended September 30, 2016 was mainly due to the revenue that we generated for the three months September 30, 2017 are mainly from our individual customers who purchased from us with a slightly higher price.
Because the Chinese Government is continuously to promote green environment and implement quality standards and environmentally sensitive policies in the Agricultural industry, we expect our revenues from our innovated and highly effective products, Compound Microbial Fertilizer and Bio-Water Soluble Fertilizer, will continue to grow in a higher rate than that from Biological Organic Fertilizer. Our Compound Microbial Fertilizer and Bio-Water Soluble Fertilizer generally have a higher effectiveness on the productivity of crops that are suitable for promoting green environment. In addition, our marketing team is expanding to the Western areas of China and Hainan province and we expect our revenues will continue to grow in the fourth quarter of 2017 and in 2018. Meanwhile, we expect to continue to gain more market shares in our existing sales channel bases in the Northern and the Southern areas of China due to the good quality of the products and better reputation in the industry.
Non-GAAP analysis
Our selling and shipment from our two major products categories are summarized as follows including revenue recognized and deferred under U.S. GAAP:
| For
the three months ended September 30, 2017 |
For
the three months ended September 30, 2016 |
Change | Change (%) | |||||||||||||
| Biological Organic Fertilizer | ||||||||||||||||
| Sold and shipped in USD | $ | 2,369,119 | $ | 1,185,309 | $ | 1,183,810 | 99.9 | % | ||||||||
| Quantity sold in tons | 13,162 | 6,500 | 6,662 | 102.5 | % | |||||||||||
| Average selling price | $ | 180.00 | $ | 182.36 | $ | (2.36) | (1.3) | % | ||||||||
| Compound Microbial Fertilizer | ||||||||||||||||
| Sold and shipped in USD | $ | 3,528,125 | $ | - | $ | 3,528,125 | 100.0 | % | ||||||||
| Quantity sold in tons | 10,700 | - | 10,700 | 100.0 | % | |||||||||||
| Average selling price | $ | 329.73 | $ | - | $ | 329.73 | 100.0 | % | ||||||||
Compound Microbial Fertilizer is adding appropriate amount of nitrogen, phosphorus, potassium and other nutrients into Biological Organic Fertilizer. Through the action of organic matter and beneficial microorganisms, the utilization rate of nitrogen, phosphorus, potassium can be significantly improved. The Bio-Water Soluble Fertilizer is mainly another form of the biological fertilizer. It is in the form of powder which has high water solubility, and it is convenient for the farmers to use during the drop irrigation. Compound Microbial Fertilizer and Bio-Water Soluble Fertilizer generally contain more bacteria and have a higher effectiveness on the productivity of crops and increasing the value and quality of the crops harvested than Biological Organic Fertilizer. As a result, our Compound Microbial Fertilizer and Bio-Water Soluble Fertilizer generally have a higher average selling price.
The sold and shipped amount of Biological Organic Fertilizer increased by approximately $1.2 million or 99.9%, to approximately $2.4 million in the three months ended September 30, 2017 from approximately $1.2 million in the three month ended September 30, 2016. The increase was mainly because we have gained more reputation in the agricultural industry and were able to attract more customers during the three months ended September 30, 2017 as compared to the three months ended September 30, 2016 during which we just obtained our fertilizer sales permit from the Chinese government and began to sell the products during the period. Average selling prices for both periods remained stable. The slight decrease of $2.36 or 1.3% was mainly due to the effect of exchange rate.
The sold and shipped amount of Compound Microbial Fertilizer increased by approximately $3.5 million or 100.0% in the three months ended September 30, 2017 as we did not sell this product category during the same period for 2016. Compound Microbial Fertilizer products are our new products with higher effectiveness on the productivity of crops and increasing the value and quality of the crops harvested that we firstly introduced in March 2017
| 27 |
Cost of Revenue
Our cost of revenues from our major product category are summarized as follows:
| For
the three months ended September 30, 2017 |
For
the three months ended September 30, 2016 |
Change | Change (%) | |||||||||||||
| Biological Organic Fertilizer | ||||||||||||||||
| Cost of Revenue in USD | $ | 19,697 | $ | 770,451 | $ | (750,754) | (97.4) | % | ||||||||
| Quantity sold in tons | 162 | 6,500 | (6,338) | (97.5) | % | |||||||||||
| Average unit cost | $ | 121.59 | $ | 118.53 | $ | 3.06 | 2.6 | % | ||||||||
Cost of revenue from Biological Organic Fertilizer decreased by approximately $0.8 million or 97.4%, to approximately $20,000 in the three months ended September 30, 2017 from approximately $0.8 million in the three month ended September 30, 2016. The decrease in cost of revenue during the period which is in line with the decrease in revenue from Biological Organic Fertilizer. We were able to stabilize our average unit production cost within a reasonable range of 2.6% increase. The increase of $3.06 or 2.6% of average unit production cost is mainly due to the increase of price for raw materials (mainly includes nitrogen, phosphorus and potassium) used in the products for the three months ended September 30, 2017.
Non-GAAP analysis
Our cost of shipping to our two major products categories are summarized as follows including cost of goods sold recognized and deferred under U.S. GAAP:
| For
the three months ended September 30, 2017 | For
the three months ended September 30, 2016 | Change | Change (%) | |||||||||||||
| Biological Organic Fertilizer | ||||||||||||||||
| Cost of sold and shipped in USD | $ | 1,639,315 | $ | 770,451 | $ | 868,864 | 112.8 | % | ||||||||
| Quantity sold and shipped in tons | 13,162 | 6,500 | 6,662 | 102.5 | % | |||||||||||
| Average unit cost | $ | 124.55 | $ | 118.53 | $ | 6.02 | 5.1 | % | ||||||||
| Compound Microbial Fertilizer | ||||||||||||||||
| Cost of sold and shipped in USD | $ | 2,413,924 | $ | - | $ | 2,413,924 | 100.0 | % | ||||||||
| Quantity sold and shipped in tons | 10,700 | - | 10,700 | 100.0 | % | |||||||||||
| Average unit cost | $ | 225.60 | $ | - | $ | 225.60 | 100.0 | % | ||||||||
Cost of sold and shipped from Biological Organic Fertilizer increased by approximately $0.9 million or 112.8%, to approximately $1.6 million in the three months ended September 30, 2017 from approximately $0.8 million in the three month ended September 30, 2016. The increase during the period is in line with the increase in the selling amount of Biological Organic Fertilizer. We were able to stabilize our average unit production cost within a reasonable range of 5.1% increase. The increase of $6.02 or 5.1% of average unit production cost is mainly due to the increase of price for raw materials (mainly includes nitrogen, phosphorus and potassium) used in the products for the three months ended September 30, 2017.
Cost of sold and shipped from Compound Microbial Fertilizer increased by approximately $2.4 million or 100.0%. The increase was in line with the increase in the selling amount of Compound Microbial Fertilizer. We plan to launch the Bio-Water Soluble Fertilizer products in 2018.
Gross Profit
Our gross profit from our major product category are summarized as follows:
| For
the three months ended September 30, 2017 |
For
the three months ended September 30, 2016 |
Change | Change (%) | |||||||||||||
| Biological Organic Fertilizer | ||||||||||||||||
| Gross Profit | $ | 11,327 | $ | 414,858 | $ | (403,531) | (97.3 | )% | ||||||||
| Gross Profit Percentage | 36.5 | % | 35.0 | % | 1.5% | 4.3 | % | |||||||||
Gross profit percentage for Biological Organic Fertilizer increased from 35.0% for the three months ended September 30, 2016 to 36.5% for the three months ended September 30, 2017 mainly due to the increase in our unit selling price of our products at a rate higher than the increase in raw materials price of the products for the reason as discussed above.
Non-GAAP analysis
Our total gross profit from our two major products categories are summarized as follows including the gross profit recognized and deferred under U.S. GAAP:
| For
the three months ended September 30, 2017 |
For
the three months ended September 30, 2016 |
Change | Change (%) | |||||||||||||
| Biological Organic Fertilizer | ||||||||||||||||
| Gross Profit | $ | 729,804 | $ | 414,858 | $ | 314,946 | 75.9 | % | ||||||||
| Gross Profit Percentage | 30.8 | % | 35.0 | % | (4.2 | %) | (12 | %) | ||||||||
| Compound Microbial Fertilizer | ||||||||||||||||
| Gross Profit | $ | 1,114,200 | $ | - | $ | 1,114,200 | 100.0 | % | ||||||||
| Gross Profit Percentage | 31.6 | % | - | 31.6 | % | 100.0 | % | |||||||||
Gross profit percentage for Biological Organic Fertilizer decreased from 35.0% for the three months ended September 30, 2016 to 30.8% for the three months ended September 30, 2017 mainly due to the increase in raw materials price of the products for the reason as discussed above.
Research and Development Expenses
Research and development expenses was approximately $37,000 (RMB 250,000) for the three months ended September 30, 2017, keeping the same as the prior comparable period. On November 20, 2015, the Company signed a strategic cooperation agreement (the “Agreement”) with China Academy of Agricultural Science (“CAAS”)’s Institute of Agricultural Resources & Regional Planning (“IARRP”) and Institute of Agricultural Economy & Development (“IAED”). Pursuant to the Agreement, the Company will form a strategic partnership with the two institutes and establish an “International Cooperation Platform for Internet and Safe Agricultural Products”. To fund the cooperation platform’s R&D activities, the Company will provide RMB 1 million (approximately $160,000) per year to the Spatial Agriculture Planning Method & Applications Innovation Team that belongs to the Institutes. The term of the Agreement is for three years beginning November 20, 2015 and will expire on November 19, 2018. However, the Company is only liable for the annual funds to be provided to the extent of the contract obligations performed by CAAS IARRP and IAED, and the agreement is terminable before the three years’ commitment date based on negotiations of both parties. The Company contributed approximately $37,000 (RMB 250,000) for the three months ended September 30, 2017 and September 30, 2016. The Company plans to contribute the remaining balance quarterly until the date of the Agreement expired on November 19, 2018.
Selling Expenses
Selling expenses for the three months ended September 30, 2017 and 2016 were approximately $148,000 and $0, respectively. Selling expenses include salaries of sales personnel, sales commission, travel and entertainment as well as freight out expenses. The increase in selling expenses is mainly because we have started hiring sales managers in the fourth quarter of 2016 for the marketing of our products. During the three months ended September 30, 2016, there was no designated sales personnel since Kiwa Beijing just obtained the permit to sell bio-fertilizer in September 2016. With business expansion, we have hired more sales managers in Kiwa Beijing and in Kiwa Shenzhen to manage our sales activities in different regions of China from October 2016 to September 2017. In addition, the increase of sales also led to the increase of freight out expense, resulting in the increase of selling expense.
| 28 |
General and Administration Expenses
General and administrative expenses increased by approximately 487% from approximately $0.2 million in the three month period ended September 30, 2016 to approximately $1.1 million in the same period in 2017. General and administrative expenses include professional fees, officers’ compensation, depreciation and amortization, salaries, travel and entertainment, rent, office expense and telephone expense and the like. The increase in general and administrative expenses is mainly attributed to business expansion and the establishment of Kiwa Shenzhen in November, 2016, Kiwa Hebei in December 2016 and Kiwa Asia in July 2017.
Right-to-use Trademark Income
Trademark license income totaled $0 for the three months ended September 30, 2017, compared with $76,235 for the same period of 2016, reflecting a decrease of 100% from the same period of last year. Income was generated from licensing our trademark to Gerui. We signed the license agreement with Gerui to allow Gerui to sell fertilizer using our trademark in December 2015. We charged Gerui 10% of net sales of fertilizers bearing Kiwa trademark for using our trademark. Gerui began to sell fertilizers bearing Kiwa trademark in 2016. In August 2016, the Company obtained the government approval of selling fertilizers in China. As a result, we ceased the licensing arrangement cooperation with Gerui and started to sell our own bio-fertilizers from September 2016.
Other Income
Other income increased by approximately $0.4 million from $0 in the three month period ended September 30, 2016 to approximately $0.4 million in the same period in 2017. The increase is mainly attributable the accrued professional fees which were unclaimed for more than ten years and we have evaluated and reached the decision to discharge these liabilities.
Interest Expense
Net interest expense was $168,573 and $47,745 for the three months ended September 30, 2017 and 2016, respectively, representing an increase of approximately $0.1 million or 253%. Interest expense included accrued interest on convertible note and other note payable, and the amortization of the convertible note discount for the three months ended September 30, 2017 and 2016. The increase in interest expenses is mainly attributed to newly issuance of two 15% convertible notes for the nine months ended September 30, 2017.
Loss from discontinued operations, net of taxes
Loss from discontinued operations, net of taxes was $-0- and $52,166 for the three months ended September 30, 2017 and 2016, respectively, which results in a decrease of $52,166 from discontinued operations, net of taxes for the three months ended September 30, 2017 to the same period of 2016. Due to suffering from losses for several years, On February 11, 2017, the Company executed an Equity Transfer Agreement with Dian Shi Cheng Jing (Beijing) Technology Co. (“Transferee”) whereby the Company transferred all of its right, title and interest in Kiwa Bio-Tech Products (Shandong) Co., Ltd. (“Shandong”) to the Transferee for RMB 1.00. The government processing of the transaction was completed on April 12, 2017. Therefore, it’s resulted in the decrease of loss from discontinued operations, net of taxes.
Net Income
Net income for the three months ended September 30, 2017 decreased by approximately 874% from approximately profit of $94,000 to loss of approximately $728,000. Such change was the result of the combination of the changes as discussed above.
| 29 |
Results of Operations for Nine Months Ended September 30, 2017 and 2016
The following table summarizes the results of our operations during the nine month periods ended September 30, 2017 and 2016, respectively, and provides information regarding the dollar and percentage increase or (decrease) during such periods.
(All amounts, other than percentages, in thousands of U.S. dollars)
| Nine months Ended September 30, | Amount Increase | Percentage Increase | ||||||||||||||
| Statement of Operations Data: | 2017 | 2016 | (Decrease) | (Decrease) | ||||||||||||
| Revenues | $ | 30 | $ | 1,185 | $ | (1,155 | ) | (97 | )% | |||||||
| Cost of goods sold | (19 | ) | (770 | ) | (751 | ) | (98 | )% | ||||||||
| Gross profit | 11 | 415 | (404 | ) | (97 | )% | ||||||||||
| Operating expenses | ||||||||||||||||
| Research and development expense | 110 | 113 | (3 | ) | (3 | )% | ||||||||||
| Selling expenses | 236 | - | 236 | 100 | % | |||||||||||
| General and administrative expenses | 2,073 | 376 | 1,697 | 451 | % | |||||||||||
| Total operating expenses | 2,419 | 489 | 1,930 | 395 | % | |||||||||||
| Operating Income (Loss) | (2,408 | ) | (74 | ) | 2,334 | 3,154 | % | |||||||||
| Other income/(expense), net | ||||||||||||||||
| Trademark license income-related party | - | 786 | (786 | ) | (100 | )% | ||||||||||
| Change in fair value of derivative liabilities | 199 | - | 199 | 100 | % | |||||||||||
| Interest expense | (356 | ) | (142 | ) | 214 | 151 | % | |||||||||
| Other income | 373 | - | 373 | 100 | % | |||||||||||
| Exchange loss | (35 | ) | - | 35 | 100 | % | ||||||||||
| Total other income/(expense), net | 181 | 644 | (463 | ) | (72 | )% | ||||||||||
| Income (loss) from continuing operations before income taxes | (2,227 | ) | 570 | (2,797 | ) | (491 | )% | |||||||||
| Provision (benefit) for income taxes | ||||||||||||||||
| Current | - | 79 | (79 | ) | (100 | )% | ||||||||||
| Deferred | (221 | ) | - | 221 | 100 | % | ||||||||||
| Total provision (benefit) for income taxes | (221 | ) | 79 | (300 | ) | (380 | )% | |||||||||
| Income (loss) from continuing operations | (2,006 | ) | 491 | (2,497 | ) | (509 | )% | |||||||||
| Discontinued operations: | ||||||||||||||||
| Loss from discontinued operations, net of taxes | (17 | ) | (159 | ) | 142 | (89 | )% | |||||||||
| Gain on disposal of discontinued operations, net of taxes | 4,512 | - | 4,512 | 100 | % | |||||||||||
| Income (loss) from discontinued operations, net of taxes | 4,495 | (159 | ) | 4,654 | 2,927 | % | ||||||||||
| Net income (loss) | $ | 2,489 | $ | 332 | $ | 2,157 | 650 | % | ||||||||
| 30 |
Revenue
Revenue decreased by approximately $1.2 million or 97%, to approximately $30,000 in the nine months ended September 30, 2017 from approximately $1.2 million in the nine months ended September 30, 2016. The decrease is mainly due to approximately $14.7 million of our revenues is being deferred for the nine months ended September 30, 2017. In August 2016, Kiwa Baiao Bio-Tech (Beijing) Co., Ltd obtained a fertilizer sales permit from the Chinese government and began to sell the products directly to customers in Northern areas of China. Due to the good quality of our products, we have gained more reputation in the agricultural industry and were able to attract more customers. In addition, we established Kiwa Bio-Tech Products (Shenzhen) Co., Ltd. in November 2016 to support sales in Southern areas of China. Our strategy on the expansion of our business was to gain market shares in the bio-fertilizer market, thereby, we have extended credit to our customers. Our current payment terms on these customers are ranging from 60 days to 9 months after receipts of the goods depending on the creditworthiness of these customers. These customers are mainly agricultural cooperative company and distributors who then resell our products to individual farmers. Because the crop growing cycle usually takes approximately 3 to 9 months in the agricultural industry, it will take approximately similar time frame of 3 to 9 months for farmers to harvest crops and to realize profits to repay our distributors. As a result, for the sales contracts with these customers, the collectability of payment is highly dependent on the successful harvest of corps and the customers’ ability to collect money from farmers. The Company deemed the collectability of payment may not be reasonably assured until after the Company get paid. For those sales contracts that the Company has shipped its products but the payment is contingent on collections of payments from the downstream customers, the Company considers the revenue recognition criteria are not met and therefore defers the revenue and cost of goods sold until payments are collected. We have sold and shipped approximately $14.7 million of our products during the nine months ended September 30, 2017 for which the revenue recognition criteria of collectability of payments is reasonably assured has not yet been met, and we have deferred approximately $14.7 million of revenues to be recognized in the future periods when our collectability of payments will be assured. As a result, our revenue decreased accordingly for the nine months ended September 30, 2017 as compared to the same period in 2016.
We currently only realized revenue in one major product categories of Biological Organic Fertilizer. We sold and shipped another product category of Compound Microbial Fertilizer in the third quarter of 2017 and recorded the selling amount in deferred revenue. We plan to launch another product category of Bio-Water Soluble Fertilizer in 2018. Our revenues from our major product categories are summarized as follows:
| For the nine months ended September 30, 2017 | For the nine months ended September 30, 2016 | Change | Change (%) | |||||||||||||
| Biological Organic Fertilizer | ||||||||||||||||
| Revenue in USD | $ | 30,411 | $ | 1,185,310 | $ | (1,154,899 | ) | (97.4 | )% | |||||||
| Quantity sold in tons | 162 | 6,500 | (6,338 | ) | (97.5 | )% | ||||||||||
| Average selling price | $ | 187.72 | $ | 182.36 | $ | 5.36 | 2.9 | % | ||||||||
Revenue from Biological Organic Fertilizer decreased by approximately $1.2 million or 97.4%, to approximately $30,000 in the nine months ended September 30, 2017 from approximately $1.2 million in the nine month ended September 30, 2016. The decrease is mainly due to approximately $8.0 million of our revenues is being deferred as discussed above. Average selling prices increased by $5.36 or 2.9% during the nine months ended September 30, 2017 as compared to the nine months ended September 30, 2016 was mainly due to the revenue that we generated for the nine months September 30, 2017 are mainly from our individual customers who purchased from us with a slightly higher price.
Because the Chinese Government is continuously to promote green environment and implement quality standards and environmentally sensitive policies in the Agricultural industry, we expect our revenues from our innovated and highly effective products, Compound Microbial Fertilizer and Bio-Water Soluble Fertilizer, will continue to grow in a higher rate than that from Biological Organic Fertilizer. Our Compound Microbial Fertilizer and Bio-Water Soluble Fertilizer generally have a higher effectiveness on the productivity of crops that are suitable for promoting green environment. In addition, our marketing team is expanding to the Western areas of China and Hainan province and we expect our revenues will continue to grow in the fourth quarter of 2017 and in 2018. Meanwhile, we expect to continue to gain market shares in our existing sales channel bases in the Northern and the Southern areas of China due to the good quality of the products and better reputation in the industry.
Non-GAAP analysis
Our sales and shipment from our two major products categories are summarized as follows including revenue recognized and deferred under U.S. GAAP:
| For
the nine months ended September 30, 2017 |
For
the nine months ended September 30, 2016 |
Change | Change (%) | |||||||||||||
| Biological Organic Fertilizer | ||||||||||||||||
| Sold and shipped in USD | $ | 8,016,554 | $ | 1,185,310 | $ | 6,831,244 | 576.3 | % | ||||||||
| Quantity sold in tons | 45,462 | 6,500 | 38,962 | 599.4 | % | |||||||||||
| Average selling price | $ | 176.34 | $ | 182.36 | $ | (6.02 | ) | (3.3 | %) | |||||||
| Compound Microbial Fertilizer | ||||||||||||||||
| Sold and shipped in USD | $ | 6,680,682 | $ | - | $ | 6,680,682 | 100.0 | % | ||||||||
| Quantity sold in tons | 20,720 | - | 20,720 | 100.0 | % | |||||||||||
| Average selling price | $ | 322.43 | $ | - | $ | 322.43 | 100.0 | % | ||||||||
Compound Microbial Fertilizer is adding appropriate amount of nitrogen, phosphorus, potassium and other nutrients into Biological Organic Fertilizer. Through the action of organic matter and beneficial microorganisms, the utilization rate of nitrogen, phosphorus, potassium can be significantly improved. The Bio-Water Soluble Fertilizer is mainly another form of the biological fertilizer. It is in the form of powder which has high water solubility, and it is convenient for the farmers to use during the drop irrigation. Compound Microbial Fertilizer and Bio-Water Soluble Fertilizer generally contain more bacteria and have a higher effectiveness on the productivity of crops and increasing the value and quality of the crops harvested than Biological Organic Fertilizer. As a result, our Compound Microbial Fertilizer and Bio-Water Soluble Fertilizer generally have a higher average selling price.
The sold and shipped amount of Biological Organic Fertilizer increased by approximately $6.8 million or 576.3%, to approximately $8.0 million in the nine months ended September 30, 2017 from approximately $1.2 million in the nine month ended September 30, 2016. The increase was mainly because we have gained more reputation in the agricultural industry and were able to attract more customers during the nine months ended September 30, 2017 as compared to the nine months ended September 30, 2016 during which we just obtained our fertilizer sales permit from the Chinese government and began to sell the products during the period. Average selling prices for both periods remained stable with a decrease of $6.02 or 3.3% mainly due to the effect of exchange rate.
The sold and shipped amount of Compound Microbial Fertilizer increased by approximately $6.7 million or 100.0% in the nine months ended September 30, 2017 from $0 in the nine month ended September 30, 2016 as we did not sell this product category during the same period for 2016. Compound Microbial Fertilizer products are our new products with higher effectiveness on the productivity of crops and increasing the value and quality of the crops harvested that we firstly introduced in March 2017.
Cost of Revenue
Our cost of revenues from our major product category are summarized as follows:
| For
the nine months ended September 30, 2017 |
For
the nine months ended September 30, 2016 |
Change | Change (%) | |||||||||||||
| Biological Organic Fertilizer | ||||||||||||||||
| Cost of Revenue in USD | $ | 19,308 | $ | 770,451 | $ | (751,143) | (97.5) | % | ||||||||
| Quantity sold in tons | 162 | 6,500 | (6,338) | (97.5) | % | |||||||||||
| Average unit cost | $ | 119.18 | $ | 118.53 | $ | 0.65 | 0.5 | % | ||||||||
Cost of revenue from Biological Organic Fertilizer decreased by approximately $0.8 million or 97.5%, to approximately $19,000 in the nine months ended September 30, 2017 from approximately $0.8 million in the nine month ended September 30, 2016. The decrease in cost of revenue during the period which is in line with the decrease in revenue from Biological Organic Fertilizer. The average unit production cost of Biological Organic Fertilizer increased by $0.65 or 0.5% in the nine months ended September 30, 2017 as compared to in the nine months ended September 30, 2016. The reason of the slight increase is mainly due to the increase of price for raw materials (mainly includes nitrogen, phosphorus and potassium) used in the products, offsetting by the appreciation of Renminbi against U.S. Dollar of approximately 4.2%.
| 31 |
Non-GAAP analysis
Our cost of sold and shipped from our two major products categories are summarized as follows including cost of goods sold recognized and deferred under U.S. GAAP:
| For
the nine months ended September 30, 2017 |
For
the nine months ended September 30, 2016 |
Change | Change (%) | |||||||||||||
| Biological Organic Fertilizer | ||||||||||||||||
| Cost of sold and shipped in USD | $ | 5,419,723 | $ | 770,451 | $ | 4,649,272 | 603.4 | % | ||||||||
| Quantity sold and shipped in tons | 45,462 | 6,500 | 38,962 | 599.4 | % | |||||||||||
| Average unit cost | $ | 119.21 | $ | 118.53 | $ | 0.68 | 0.6 | % | ||||||||
| Compound Microbial Fertilizer | ||||||||||||||||
| Cost of sold and shipped in USD | $ | 4,648,934 | $ | - | $ | 4,648,934 | 100.0 | % | ||||||||
| Quantity sold and shipped in tons | 20,720 | - | 20,720 | 100.0 | % | |||||||||||
| Average unit cost | $ | 224.37 | $ | - | $ | 224.37 | 100.0 | % | ||||||||
Cost of sold and shipped from Biological Organic Fertilizer increased by approximately $4.6 million or 603.4%, to approximately $5.4 million in the nine months ended September 30, 2017 from approximately $0.8 million in the nine month ended September 30, 2016. The increase during the period which is in line with the increase in the selling amount of Biological Organic Fertilizer. The average unit production cost of Biological Organic Fertilizer increased by $0.68 or 0.6% in the nine months ended September 30, 2017 as compared to in the nine months ended September 30, 2016. The reason of the slight increase is mainly due to the increase of price for raw materials (mainly includes nitrogen, phosphorus and potassium) used in the products, offsetting by the appreciation of Renminbi against U.S. Dollar of approximately 4.2%.
Cost of sold and shipped from Compound Microbial Fertilizer increased by approximately $4.6 million or 100.0%. The increase were in line with the increase in the selling amount of from Compound Microbial Fertilizer. We plan to launch the Bio-Water Soluble Fertilizer products in 2018.
Gross Profit
Our gross profit from our major product category are summarized as follows:
| For
the nine months ended September 30, 2017 |
For
the nine months ended September 30, 2016 |
Change | Change (%) | |||||||||||||
| Biological Organic Fertilizer | ||||||||||||||||
| Gross Profit | $ | 11,103 | $ | 414,859 | $ | (403,756) | (97.3) | % | ||||||||
| Gross Profit Percentage | 36.5 | % | 35.0 | % | 1.5% | 4.3 | % | |||||||||
Gross profit percentage for Biological Organic Fertilizer increased from 35.0% for the nine months ended September 30, 2016 to 36.5% for the nine months ended September 30, 2017 mainly due to the increase in our unit selling price of our products at a rate higher than the increase in raw materials price of the products for the reason as discussed above.
Non-GAAP analysis
Our total gross profit from our two major products categories are summarized as follows including the gross profit recognized and deferred under U.S. GAAP:
| For
the nine months ended September 30, 2017 | For
the nine months ended September 30, 2016 | Change | Change (%) | |||||||||||||
| Biological Organic Fertilizer | ||||||||||||||||
| Gross Profit | $ | 2,596,831 | $ | 414,859 | $ | 2,181,972 | 526.0 | % | ||||||||
| Gross Profit Percentage | 32.4 | % | 35.0 | % | (2.6 | %) | (7.4 | %) | ||||||||
| Compound Microbial Fertilizer | ||||||||||||||||
| Gross Profit | $ | 2,031,748 | $ | - | $ | 2,031,748 | 100.0 | % | ||||||||
| Gross Profit Percentage | 30.4 | % | - | 30.4 | % | 100.0 | % | |||||||||
Gross profit percentage for Biological Organic Fertilizer decreased from 35.0% for the nine months ended September 30, 2016 to 32.4% for the nine months ended September 30, 2017. The decrease in gross profit were mainly attributable to the decrease in selling price of the products and the increase in unit production cost as discussed above.
Research and Development Expenses
Research and development expenses was approximately $110,000 (RMB 750,000) for the nine months ended September 30, 2017, compared to approximately $113,000 (RMB 750,000) for the prior comparable period. On November 20, 2015, the Company signed a strategic cooperation agreement (the “Agreement”) with China Academy of Agricultural Science (“CAAS”)’s Institute of Agricultural Resources & Regional Planning (“IARRP”) and Institute of Agricultural Economy & Development (“IAED”). Pursuant to the Agreement, the Company will form a strategic partnership with the two institutes and establish an “International Cooperation Platform for Internet and Safe Agricultural Products”. To fund the cooperation platform’s R&D activities, the Company will provide RMB 1 million (approximately $160,000) per year to the Spatial Agriculture Planning Method & Applications Innovation Team that belongs to the Institutes. The term of the Agreement is for three years beginning November 20, 2015 and will expire on November 19, 2018. However, the Company is only liable for the annual funds to be provided to the extent of the contract obligations performed by CAAS IARRP and IAED, and the agreement is terminable before the three years’ commitment date based on negotiations of both parties. The Company contributed approximately $113,000 (RMB 750,000) for the nine months ended September 30, 2017 and September 30, 2016. The Company plans to contribute the remaining balance until the date of the Agreement expired on November 19, 2018.
Selling Expenses
Selling expenses for the nine months ended September 30, 2017 and 2016 were approximately $236,252 and $0, respectively. Selling expenses include salaries of sales personnel, sales commission, travel and entertainment as well as freight out expenses. The increase in selling expenses is mainly because we have started hiring sales managers in the fourth quarter of 2016 for the marketing of our products. During the nine months ended September 30, 2016, there was no designated sales personnel since Kiwa Beijing just obtained the permit to sell bio-fertilizer in September 2016. With business expansion, we have hired more sales managers in Kiwa Beijing and in Kiwa Shenzhen to manage our sales activities in different regions of China from October 2016 to September 2017. In addition, the increase of sales also led to the increase of freight out expense, resulting in the increase of selling expense.
| 32 |
General and Administration Expenses
General and administrative expenses increased by approximately 451% from approximately $0.4 million in the nine months ended September 30, 2016 to approximately $2.1 million in the same period in 2017. General and administrative expenses include professional fees, officers’ compensation, depreciation and amortization, salaries, travel and entertainment, rent, office expense and telephone expense and the like. The increase in general and administrative expenses is mainly attributed to business expansion and the establishment of Kiwa Shenzhen in November, 2016, Kiwa Hebei in December 2016 and Kiwa Asia in July 2017.
Right-to-use Trademark Income
Right-to-use Trademark income totaled $0 for the nine months ended September 30, 2017, compared with $786,329 for the same period of 2016, reflecting a decrease of 100% from the same period of last year. Income was generated from licensing our trademark to Gerui. We signed the license agreement with Gerui to allow Gerui to sell fertilizer using our trademark in December 2015. We charged Gerui 10% of net sales of fertilizers bearing Kiwa trademark for using our trademark. Gerui began to sell fertilizers bearing Kiwa trademark in 2016. In August 2016, the Company obtained the government approval of selling fertilizers in China. As a result, we ceased the cooperation with Gerui and started to sell our own bio-fertilizers from September 2016.
Other Income
Other income increased by approximately $0.4 million from $0 in the nine months ended September 30, 2016 to approximately $0.4 million in the same period in 2017. The increase is mainly attributable the accrued professional fees which were unclaimed for more than ten years and we have evaluated and reached the decision to discharge these liabilities.
Interest Expense
Net interest expense was $356,256 and $142,296 for the nine months ended September 30, 2017 and 2016, respectively, representing an increase of $213,960 or 150%. Interest expense included accrued interest on convertible note and other note payable and the amortization of the convertible note discount for the nine months ended September 30, 2017 and 2016. The increase in interest expenses is mainly attributed to newly issuance of two 15% convertible notes for the nine months ended September 30, 2017.
Loss from discontinued operations, net of taxes
Loss from discontinued operations, net of taxes was approximately $17,000 and approximately 159,000 for the three months ended September 30, 2017 and 2016, respectively, which results an increase of approximately $142,000 from discontinued operations, net of taxes for the three months ended September 30, 2017 to the same period of 2016. Due to suffering from losses for several years, On February 11, 2017, the Company executed an Equity Transfer Agreement with Dian Shi Cheng Jing (Beijing) Technology Co. (“Transferee”) whereby the Company transferred all of its right, title and interest in Kiwa Bio-Tech Products (Shandong) Co., Ltd. (“Shandong”) to the Transferee for RMB 1.00. The government processing of the transaction was completed on April 12, 2017. Therefore, it’s resulted in the decrease of loss from discontinued operations, net of taxes.
Net Income
Net income for the nine months ended September 30, 2017 increased by approximately 650% from approximately $332,000 to approximately $2, 489,000. Such change was the result of the combination of the changes as discussed above.
Critical Accounting Policies and Estimates
We prepared our unaudited condensed consolidated financial statements in accordance with accounting principles generally accepted in the United States of America. The preparation of these financial statements requires the use of estimates and assumptions that affect the reported amounts of assets and liabilities and the disclosure of contingent assets and liabilities at the date of the financial statements and the reported amount of revenues and expenses during the reporting period. Management periodically evaluates the estimates and judgments made. Management bases its estimates and judgments on historical experience and on various factors that are believed to be reasonable under current circumstances. Actual results may differ from these estimates as a result of different assumptions or conditions.
| 33 |
The following critical accounting policies affect the more significant judgments and estimates used in the preparation of our consolidated financial statements. In addition, you should refer to our accompanying unaudited condensed consolidated balance sheets as of September 30, 2017, and the unaudited condensed consolidated statements of operations and comprehensive income, and cash flows for the nine months ended September 30, 2017, and the related notes thereto, for further discussion of our accounting policies.
Revenue Recognition
The Company applies paragraph 605-10-S99-1 of the FASB Accounting Standards Codification for revenue recognition. The Company recognizes revenue when it is realized or realizable and earned. The Company considers revenue realized or realizable and earned when all of the following criteria are met: (i) persuasive evidence of an arrangement exists, (ii) the product has been shipped or the services have been rendered to the customer, (iii) the sales price is fixed or determinable, and (iv) collectability is reasonably assured.
The Company’s current payment terms on credits to its customers are ranging from 60 days to 9 months after receipts of the goods depending on the creditworthiness of its customers. The Company’s customers are mainly agricultural cooperative company and distributors who then resell the Company’s products to individual farmers. Because the crop growing cycle usually takes approximately 3 to 9 months in the agricultural industry for some of these Co-ops and distributors, will take approximately similar time frame of 3 to 9 months for farmers to harvest crops and to realize profits to repay the resellers. As a result, for the sales contracts with these customers, the collectability of payment is highly dependent on the successful harvest of corps and the customers’ ability to collect money from farmers. The Company deemed the collectability of payment may not be reasonably assured until after the Company get paid. For those sales contracts that the Company has shipped its products but the payment is contingent on collections of payments from the downstream customers, the Company considers the revenue recognition criteria are not met and therefore defers the revenue and cost of goods sold until payments are collected. These revenue and cost of goods sold are classified in the captioned “Deferred revenue” and “Deferred cost of goods sold” in the accompanying unaudited condensed consolidated balance sheets. For other customers whose repayment is within normal business course and not highly dependent on the succession of corps being harvested, the Company recognized revenue when title and ownership of the goods are transferred upon shipment to the customer by the Company.
Deferred Revenue and Deferred Cost of Goods Sold
Deferred revenue and deferred cost of goods sold result from transactions where the Company has shipped product for which all revenue recognition criteria have not yet been met. Deferred cost of goods sold related to deferred product revenues includes direct inventory costs. Once all revenue recognition criteria have been met, the deferred revenues and associated cost of goods sold are recognized.
Accounts receivable and allowance for doubtful accounts
Accounts receivable represent customer accounts receivables. The Company provides an allowance for doubtful accounts equal to the estimated uncollectible amounts. The Company’s estimate is based on historical collection experience, the economic environment trends in the microbial fertilizer industry, and a review of the current status of trade accounts receivable. Management reviews its accounts receivable each reporting period to determine if the allowance for doubtful accounts is adequate. Such allowances, if any, would be recorded in the period the impairment is identified. It is reasonably possible that the Company’s estimate of the allowance for doubtful accounts will change. Uncollectible accounts receivables are charged against the allowance for doubtful accounts when all reasonable efforts to collect the amounts due have been exhausted.
Impairment of Long-Lived Assets
The Company’s long-lived assets consist of property and equipment. The Company evaluates its investment in long-lived assets for recoverability whenever events or changes in circumstances indicate the net carrying amount may not be recoverable. It is possible that these assets could become impaired as a result of legal factors, market conditions, operational performance indicators, technological or other industry changes. If circumstances require a long-lived asset or asset group to be tested for possible impairment, the Company first compares undiscounted cash flows expected to be generated by that asset or asset group to its carrying value. If the carrying value of the long-lived asset or asset group is not recoverable on an undiscounted cash flow basis, an impairment is recognized to the extent that the carrying value exceeds its fair value. Fair value is determined through various valuation techniques, including discounted cash flow models, quoted market values and third-party independent appraisals, as considered necessary.
Related Parties
The Company follows subtopic 850-10 of the FASB Accounting Standards Codification for the identification of related parties and disclosure of related party transactions. Pursuant to Section 850-10-20 the related parties include: a) affiliates of the Company; b) entities for which investments in their equity securities would be required, absent the election of the fair value option under the Fair Value Option Subsection of Section 825–10–15, to be accounted for by the equity method by the investing entity; c) trusts for the benefit of employees, such as pension and profit-sharing trusts that are managed by or under the trusteeship of management; d) principal owners of the Company; e) management of the Company; f) other parties with which the Company may deal if one party controls or can significantly influence the management or operating policies of the other to an extent that one of the transacting parties might be prevented from fully pursuing its own separate interests; and g) other parties that can significantly influence the management or operating policies of the transacting parties or that have an ownership interest in one of the transacting parties and can significantly Influence the other to an extent that one or more of the transacting parties might be prevented from fully pursuing its own separate interests.
The disclosures shall include: a. the nature of the relationship(s) involved; b. a description of the transactions, including transactions to which no amounts or nominal amounts were ascribed, for each of the periods for which income statements are presented, and such other information deemed necessary to an understanding of the effects of the transactions on the consolidated financial statements; c. the dollar amounts of transactions for each of the periods for which income statements are presented and the effects of any change in the method of establishing the terms from that used in the preceding period; and d. amounts due from or to related parties as of the date of each balance sheet presented and, if not otherwise apparent, the terms and manner of settlement.
Income Taxes
The Company accounts for income taxes under the provisions of FASB ASC Topic 740, “Income Tax,” which requires recognition of deferred tax assets and liabilities for the expected future tax consequences of events that have been included in the consolidated financial statements or tax returns. Deferred tax assets and liabilities are recognized for the future tax consequence attributable to the difference between the tax bases of assets and liabilities and their reported amounts in the financial statements. Deferred tax assets and liabilities are measured using the enacted tax rate expected to apply to taxable income in the years in which those temporary differences are expected to be recovered or settled. The effect on deferred tax assets and liabilities of a change in tax rates is recognized in income in the period that includes the enactment date. The Company establishes a valuation when it is more likely than not that the assets will not be recovered.
ASC Topic 740-10, “Accounting for Uncertainty in Income Taxes,” defines uncertainty in income taxes and the evaluation of a tax position as a two-step process. The first step is to determine whether it is more likely than not that a tax position will be sustained upon examination, including the resolution of any related appeals or litigation based on the technical merits of that position. The second step is to measure a tax position that meets the more-likely-than-not threshold to determine the amount of benefit to be recognized in the financial statements. A tax position is measured at the largest amount of benefit that is greater than 50 percent likelihood of being realized upon ultimate settlement. Tax positions that previously failed to meet the more-likely-than-not recognition threshold should be recognized in the first subsequent period in which the threshold is met. Previously recognized tax positions that no longer meet the more-likely-than-not criteria should be de-recognized in the first subsequent financial reporting period in which the threshold is no longer met. Penalties and interest incurred related to underpayment of income tax are classified as income tax expense in the period incurred.
| 34 |
Liquidity and Capital Resources
Since inception of our agriculture-biotech business in 2002, we have relied on the proceeds from the sale of our equity securities and loans from both unrelated and related parties to provide the resources necessary to fund our operations and the execution of our business plan.
Our current assets as of September 30, 2017 were approximately $30.8 million, and our current liabilities were approximately $29.7 million, which resulted in a current ratio of approximately 1.04. Total equity as of September 30, 2017 was approximately $1.9 million. Most of our current assets are in the form of accounts receivable generated from our sales. We have subsequently collected approximately $8.7 million of our $15.2 million outstanding accounts receivables as of September 30, 2017. We expect to collect the remaining balance of these accounts receivable by the end of December 31, 2017.
While we had net working capital of approximately $1.1 million at September 30, 2017 and a small net income from our continued operations, we used approximately $3.4 million net cash in our operating activities and we had very little cash on hand as of September 30, 2017. These circumstances, among others, raise substantial doubt about the Company’s ability to continue as a going concern, which we believe is sufficient to support our working capital needs for the next twelve months.
Our ability to repay its current obligations will depend on the future operating revenues generated from our products and seeking additional equity financing. Because the Chinese Government is continuously to promote green environment and implement quality standards and environmentally sensitive policies in the Agricultural industry, we expect our revenues from our innovated and highly effective products, Compound Microbial Fertilizer and Bio-Water Soluble Fertilizer, will continue to grow in our business. In addition, our marketing team is expanding to the Western areas of China and Hainan province and we expect our revenues will continue to grow in the fourth quarter of 2017 and in 2018. Meanwhile, we expect to continue to gain market shares in our existing sales channel bases in the Northern and the Southern areas of China due to the good quality of the products and better reputation in the industry. We believe these factors will enable us sufficiently to support our working capital needs for the next twelve months. However, if management is unable to execute our revenue plan as expected, there would be likely being a material effect on our operations.
Furthermore, our management already raised additional equity for approximately $76,000 and reduced our convertible debts for approximately $15,000 in October 2017. Management is currently and will continuously seeking additional equity financing to support our working capital. To the extent that we are unable to successfully raise the capital necessary to fund our future cash requirements on a timely basis and under acceptable terms and conditions, we may not have sufficient liquidity to maintain operations and repay our liabilities for the next twelve months. As a result, we may be unable to implement its current plans for expansion, repay our debt obligations or respond to competitive pressures, any of which would have a material adverse effect on our business, prospects, financial condition and results of operations.
Accounts receivable
As of September 30, 2017, we had approximately $15.2 million of accounts receivables from our customers. Since we obtained a fertilizer sales permit from the Chinese government in August 2016 and began to sell the products directly to customers in September 2016, our strategy was to gain market shares in the bio-fertilizer market by extending longer credit to our customers. As a result, our accounts receivable increased from approximately $1.1 million at December 31, 2016 to approximately $15.2 million at September 30, 2017. Our current payment terms on these customers are ranging from 60 days to 9 months after receipts of the goods depending on the creditworthiness of these customers. These customers are either agricultural cooperative company or distributors who then resell our products to individual farmers. Because the crop growing cycle usually takes approximately 3 to 9 months in the agricultural industry, it will take approximately similar time frame of 3 to 9 months for farmers to harvest crops and to realize profits to repay us. Based on our evaluation of the collectability of our trade accounts receivable, we have provided allowance for doubtful accounts of approximately $0.3 million as of September 30, 2017. As of the date of this report, we have subsequently collected approximately $8.7 million or 56% of the outstanding accounts receivable as of September 30, 2017. We expect to collect the remaining balance of approximately $6.8 million of these outstanding accounts receivable by the end of December 31, 2017.
Our provision on allowance for doubtful accounts is based on historical collection experience, the economic environment, trends in the microbial fertilizer industry, and a review of the current status of trade accounts receivable and come up with an aging allowance method. Currently, we provide a provision of 1%-6% of the allowance for doubtful accounts for accounts receivable balance that are more than 180 days old but less than one year old, 50% of the allowance for doubtful accounts for accounts receivable from one to one and half years old, 100% of the allowance for doubtful accounts for accounts receivable beyond one and half years old, plus additional amount as necessary, which our collection department had determined the collection of the full amount is remote with the approval from our management to provide a 100% provision allowance for doubtful accounts. Our management have continued to evaluate the reasonableness of the valuation allowance policy and update it if necessary.
Deferred revenue and deferred cost of goods sold
As of September 30, 2017, we had approximately $15.0 million of deferred revenue and approximately $10.3 million of deferred cost of goods sold because these transactions resulted from where we have shipped our products for which all revenue recognition criteria have not yet been met. As of the date of this report, we have subsequently collected approximately $8.7 million or 56% of the outstanding deferred revenues as of September 30, 2017. As a result, we expect to recognize approximately $8.7 million of deferred revenue and approximately $6.0 million of deferred cost of goods sold in the fourth quarter of 2017.
The following table set forth summary of our cash flows for the periods indicated:
(All in amounts in thousands of U.S. dollars)
| Nine Months Ended | ||||||||
| 2017 | 2016 | |||||||
| Net cash (used) in continuing operating activities | $ | (3,367 | ) | $ | (738 | ) | ||
| Net cash (used) in continuing investing activities | (793 | ) | (79 | ) | ||||
| Net cash provided by continuing financing activities | 4,228 | 818 | ||||||
| Net cash used in discontinued operations | - | - | ||||||
| Effect of exchange rate changes on cash | (58 | ) | (1 | ) | ||||
| Net increase (decrease) in cash | 10 | (0 | ) | |||||
| Cash, beginning of nine month period | 13 | 1 | ||||||
| Cash, end of nine month period | $ | 23 | $ | 1 | ||||
| 35 |
Operating Activities
Net cash used in continuing operating activities was approximately $3.4 million in the nine months ended September 30, 2017, compared to cash used in operating activities of approximately $0.7 million for the same period in 2016. The increase in net cash used in operating activities was primarily attributable to 1) increase of approximately $14.0 million of accounts receivable as our strategy is to gain market shares in the bio-fertilizer market by extending credit to our customers; 2) increase of approximately $1.1 million of advance to suppliers as we need to secure current market price of raw materials purchases as we are anticipating the raw materials price is on the rise in the near future; 3) increase of approximately $10.0 million of deferred cost of goods sold offset by 4) increase of approximately $7.6 million of accounts payable as we have increased our purchases to fulfill more sales orders in the nine months ended September 30, 2017 and 5) increase of approximately $14.7 million of deferred revenue.
Investing Activities
Net cash used in continuing investing activities was approximately $0.8 million in the nine months ended September 30, 2017, and net cash used in investing activities was approximately $0.08 million for the nine months period ended September 30, 2016. The net cash used in investing activities was mainly attributable to deposit of investment. The Company entered an equity purchase agreement with the shareholders of Yantai Peng Hao New Materials Technology Co. Ltd. (“Peng Hao”) to acquire 100% interest in Peng Hao on June 8, 2017. As of September 30, 2017, the Company has made deposit payment of RMB 5,000,000 (approximately $751,050).
Financing Activities
Net cash provided continuing financing activities was approximately $4.2 million for the nine months ended September 30, 2017 and net cash provided by financing activities was approximately $0.8 million for the nine months period ended September 30, 2016. The cash inflow for the nine months ended September 30, 2017 was mainly resulted from sale of common stocks of approximately $3.2 million and from issuing of our convertible note of approximately $1 million.
Trends and Uncertainties in Regulation and Government Policy in China
Foreign Exchange Policy Changes
China is considering allowing its currency to be freely exchangeable for other major currencies. This change will result in greater liquidity for revenues generated in Renminbi (“RMB”). We would benefit by having easier access to and greater flexibility with capital generated in and held in the form of RMB. The majority of our assets are located in China and most of our earnings are currently generated in China, and are therefore denominated in RMB. Changes in the RMB-U.S. Dollar exchange rate will impact our reported results of operations and financial condition. In the event that RMB appreciates over the next year as compared to the U.S. Dollar, our earnings will benefit from the appreciation of the RMB. However, if we have to use U.S. Dollars to invest in our Chinese operations, we will suffer from the depreciation of U.S. Dollars against the RMB. On the other hand, if the value of the RMB were to depreciate compared to the U.S. Dollar, then our reported earnings and financial condition would be adversely affected when converted to U.S. Dollars.
On July 21, 2005, the People’s Bank of China announced it would appreciate the RMB, increasing the RMB-U.S. Dollar exchange rate from approximately US$1.00 = RMB 8.28 to approximately US$1.00 = RMB 8.11. So far the trend of such appreciation continues. The exchange rate of U.S. Dollar against RMB on September 30, 2017 was US$1.00 = RMB 6.6574.
Commitments and Contingencies
See Note 17 to the Unaudited Condensed Consolidated Financial Statements under Item 1 in Part I.
Off-Balance Sheet Arrangements
At September 30, 2017, we did not have any relationships with unconsolidated entities or financial partnerships, such as entities often referred to as structured finance or special purpose entities, established for the purpose of facilitating off-balance sheet arrangements or other contractually narrow or limited purposes. As such, we are not exposed to any financing, liquidity, market or credit risk that could arise if we had engaged in such relationships.
ITEM 3. QUANTITATIVE AND QUALITATIVE DISCLOSURES ABOUT MARKET RISK
Not applicable.
ITEM 4. CONTROLS AND PROCEDURES
(a) Evaluation of Disclosure Controls and Procedures
Our Chief Executive Officer and Chief Financial Officer, after evaluating the effectiveness of our disclosure controls and procedures (as defined in Securities Exchange Act Rule 13a-15(e)) as of the end of the quarterly period covered by this report, have concluded that our disclosure controls and procedures are not effective to reasonably ensure that material information required to be disclosed by us in the reports that we file or submit under the Exchange Act is recorded, processed, summarized and reported within the time periods specified by the Securities and Exchange Commission’s Rules and forms and that such information is accumulated and communicated to our management, including our Chief Executive Officer and Chief Financial Officer, as appropriate, to allow timely decisions regarding required disclosure. The principal basis for this conclusion is the lack of sufficient and skilled accounting personnel with an appropriate level of technical accounting knowledge and experience in the application of US GAAP and the lack of audit committee oversight.
(b) Changes in Internal Control over Financial Reporting
There have not been any changes in the Company’s internal control over financial reporting (as such term is defined in Rules 13a-15(f) under the Exchange Act) during the current quarter ended September 30, 2017, to have materially affected the Company’s internal control over financial reporting.
| 36 |
None.
Smaller reporting companies are not required to provide the information required by this item.
Item 2. Unregistered Sales of Equity Securities and Use of Proceeds
The following is a list of securities issued for cash or converted with debentures or as stock compensation to consultants during the period from January 1, 2017 through December 22, 2017, which were not registered under the Securities Act:
| Name of Purchaser | Issue Date | Security | Shares | Consideration | ||||||
| JUNWEI ZHENG | 3/3/17 | Common | 920,000 | Stock Purchase | ||||||
| YUAN WANG | 3/3/17 | Common | 80,000 | Stock Purchase | ||||||
| YUAN WANG | 3/3/17 | Common | 70,000 | Consultant Fees | ||||||
| HAIPING LIU | 6/13/17 | Common | 19,380 | Consultant Fees | ||||||
| YANG YANG | 6/13/17 | Common | 96,900 | Stock Purchase | ||||||
| YUAN ZENG | 6/30/17 | Common | 21,100 | Stock Purchase | ||||||
| BAOYU OUYANG | 6/30/17 | Common | 17,000 | Stock Purchase | ||||||
| HONGHUA ZHANG | 6/30/17 | Common | 15,000 | Stock Purchase | ||||||
| WEIQIANG XU | 6/30/17 | Common | 10,000 | Stock Purchase | ||||||
| JIALIN XIONG | 6/30/17 | Common | 3,750 | Stock Purchase | ||||||
| KUN WEI | 6/30/17 | Common | 3,000 | Stock Purchase | ||||||
| YANYU GUO | 6/30/17 | Common | 2,000 | Stock Purchase | ||||||
| YANJIAO GUO | 6/30/17 | Common | 1,000 | Stock Purchase | ||||||
| MENGSHA YUAN | 6/30/17 | Common | 10,000 | Stock Purchase | ||||||
| MO HAN | 6/30/17 | Common | 15,000 | Stock Purchase | ||||||
| HEBE HAN | 6/30/17 | Common | 15,108 | Stock Purchase | ||||||
| QUANZHEN SHEN | 8/1/17 | Common | 98,000 | Stock Purchase | ||||||
| QUANZHEN SHEN | 8/1/17 | Common | 49,000 | Consultant Fees | ||||||
| YUAN WANG | 8/1/17 | Common | 39,000 | Consultant Fees | ||||||
| JUNWEI ZHENG | 8/1/17 | Common | 245,000 | Stock Purchase | ||||||
| YANWU ZHU | 8/18/17 | Common | 67,500 | Consultant Fees | ||||||
| ZHEN LIN | 8/18/17 | Common | 50,000 | Consultant Fees | ||||||
| HAIPENG LIU | 8/18/17 | Common | 50,000 | Consultant Fees | ||||||
| YANAN FU | 8/18/17 | Common | 206,000 | Consultant Fees | ||||||
| XIAOCHUN ZHANG | 8/18/17 | Common | 100,000 | Consultant Fees | ||||||
| YUEFENG SU | 8/18/17 | Common | 135,000 | Stock Purchase | ||||||
| ZHEN LIN | 8/18/17 | Common | 50,000 | Stock Purchase | ||||||
| HAIPENG LIU | 8/18/17 | Common | 50,000 | Stock Purchase | ||||||
| FIRSTTRUSTGROUP, INC. | 10/19/17 | Common | 14,151 | Conversion of Note | ||||||
| DONGQING ZHAO | 10/24/17 | Common | 50,000 | Consultant Fees | ||||||
| LIYA WANG | 10/24/17 | Common | 50,000 | Consultant Fees | ||||||
| MING JI | 10/24/17 | Common | 50,000 | Consultant Fees | ||||||
| SHUMIN E | 10/24/17 | Common | 50,000 | Consultant Fees | ||||||
| XIUFANG GAO | 10/24/17 | Common | 50,000 | Consultant Fees | ||||||
| YUFANG YANG | 10/24/17 | Common | 50,000 | Consultant Fees | ||||||
| GENG LIU | 10/24/17 | Common | 500,000 | Consultant Fees | ||||||
| XUAN ZHANG | 10/24/17 | Common | 500,000 | Consultant Fees | ||||||
| HAIRONG CHEN | 10/24/17 | Common | 38,000 | Consultant Fees | ||||||
| ERLI WEI | 10/24/17 | Common | 38,000 | Stock Purchase | ||||||
| Total: | 3,828,889 | |||||||||
| 37 |
Item 3. Defaults Upon Senior Securities
None.
Item 4. Mine safety disclosures
Not applicable.
None.
| Exhibit No. | Description | |
| 31.1/31.2 | Certification of Principal Executive Officer and Principal Financial Officer pursuant to Rule 13a-14(a) and Rule15d-14(a) of the Securities Exchange Act of 1934, as amended | |
| 32.1/32.2 | Certification of Principal Executive Officer and Principal Financial Officer, pursuant to 18 U.S.C. 1350, as adopted pursuant to Section 906 of the Sarbanes-Oxley Act of 2002 | |
| 101.INS | XBRL Instance Document | |
| 101.SCH | XBRL Taxonomy Extension Schema Document | |
| 101.PRE | XBRL Taxonomy Extension Presentation Linkbase Document | |
| 101.CAL | XBRL Taxonomy Extension Calculation Linkbase Document | |
| 101.LAB | XBRL Taxonomy Extension Label Linkbase Document | |
| 101.DEF | XBRL Taxonomy Extension Definition Linkbase Document |
| 38 |
In accordance with the requirements of the Securities Exchange Act of 1934, the Registrant has caused this report to be signed on its behalf by the undersigned, thereunto duly authorized.
| KIWA BIO-TECH PRODUCTS GROUP CORPORATION | ||
| December 22, 2017 | By: | /s/ Yvonne Wang |
| Yvonne Wang, Interim Chief Executive Officer and | ||
| Interim Chief Financial Officer | ||
| 39 |