Attached files
| file | filename |
|---|---|
| EX-32.1 - EX-32.1 - InPoint Commercial Real Estate Income, Inc. | ck0001690012-ex321_9.htm |
| EX-32.2 - EX-32.2 - InPoint Commercial Real Estate Income, Inc. | ck0001690012-ex322_8.htm |
| EX-31.2 - EX-31.2 - InPoint Commercial Real Estate Income, Inc. | ck0001690012-ex312_7.htm |
| EX-31.1 - EX-31.1 - InPoint Commercial Real Estate Income, Inc. | ck0001690012-ex311_6.htm |
UNITED STATES
SECURITIES AND EXCHANGE COMMISSION
Washington, D.C. 20549
FORM 10-Q
|
☒ |
QUARTERLY REPORT PURSUANT TO SECTION 13 OR 15(d) OF THE SECURITIES EXCHANGE ACT OF 1934 |
For the quarterly period ended June 30, 2020
OR
|
☐ |
TRANSITION REPORT PURSUANT TO SECTION 13 OR 15(d) OF THE SECURITIES EXCHANGE ACT OF 1934 |
For the transition period from to
Commission file number 000-55782
INPOINT COMMERCIAL REAL ESTATE INCOME, INC.
(Exact name of registrant as specified in its charter)
|
Maryland |
32-0506267 |
|
(State or other jurisdiction of incorporation or organization) |
(I.R.S. Employer Identification No.) |
|
2901 Butterfield Road Oak Brook, Illinois |
60523 |
|
(Address of principal executive offices) |
(Zip Code) |
Registrant’s telephone number, including area code: (800) 826-8228
Securities registered pursuant to Section 12(b) of the Act:
Indicate by check mark whether the registrant (1) has filed all reports required to be filed by Section 13 or 15(d) of the Securities Exchange Act of 1934 during the preceding 12 months (or for such shorter period that the registrant was required to file such reports), and (2) has been subject to such filing requirements for the past 90 days. Yes ☒ No ☐
Indicate by check mark whether the registrant has submitted electronically every Interactive Data File required to be submitted pursuant to Rule 405 of Regulation S-T (§232.405 of this chapter) during the preceding 12 months (or for such shorter period that the registrant was required to submit such files). Yes ☒ No ☐
Indicate by check mark whether the registrant is a large accelerated filer, an accelerated filer, a non-accelerated filer, a smaller reporting company, or an emerging growth company. See the definitions of “large accelerated filer,” “accelerated filer,” “smaller reporting company,” and “emerging growth company” in Rule 12b-2 of the Exchange Act.
|
Large accelerated filer |
☐ |
Accelerated filer |
☐ |
|
|
|
|
|
|
Non-accelerated filer |
☒ |
Smaller Reporting Company |
☒ |
|
|
|
|
|
|
Emerging Growth Company |
☒ |
|
|
If an emerging growth company, indicate by check mark if the registrant has elected not to use the extended transition period for complying with any new or revised financial accounting standards provided pursuant to Section 13(a) of the Exchange Act. ☒
Indicate by check mark whether the registrant is a shell company (as defined in Rule 12b-2 of the Exchange Act). Yes ☐ No ☒
As of August 10, 2020, the Registrant had the following shares outstanding: 10,151,787 shares of Class P common stock, 397,251 shares of Class T common stock, 378,302 shares of Class I common stock, 653,566 shares of Class A common stock, 50,081 shares of Class D common stock and no shares of Class S common stock.
|
PART I FINANCIAL INFORMATION |
|
||
|
Item 1. |
Financial Statements |
|
|
|
|
|
|
|
|
|
Consolidated Balance Sheets as of June 30, 2020 (unaudited) and December 31, 2019 |
2 |
|
|
|
|
|
|
|
|
3 |
||
|
|
|
|
|
|
|
4 |
||
|
|
|
|
|
|
|
5 |
||
|
|
|
|
|
|
|
Unaudited Consolidated Statements of Cash Flows for the six-months ended June 30, 2020 and 2019 |
6 |
|
|
|
|
|
|
|
|
7 |
||
|
|
|
|
|
|
Item 2. |
Management’s Discussion and Analysis of Financial Condition and Results of Operations |
21 |
|
|
|
|
|
|
|
Item 3. |
39 |
||
|
|
|
|
|
|
Item 4. |
40 |
||
|
|
|
|
|
|
PART II OTHER INFORMATION |
|
||
|
|
|
|
|
|
Item 1. |
40 |
||
|
|
|
|
|
|
Item 1A. |
41 |
||
|
|
|
|
|
|
Item 2. |
47 |
||
|
|
|
|
|
|
Item 3. |
48 |
||
|
|
|
|
|
|
Item 4. |
48 |
||
|
|
|
|
|
|
Item 5. |
48 |
||
|
|
|
|
|
|
Item 6. |
49 |
||
|
|
|
||
|
50 |
|||
1
INPOINT COMMERCIAL REAL ESTATE INCOME, INC.
(Dollar amounts in thousands, except share data)
|
|
|
June 30, 2020 (unaudited) |
|
|
December 31, 2019 |
|
||
|
ASSETS |
|
|
|
|
|
|||
|
Cash and cash equivalents |
|
$ |
39,533 |
|
|
$ |
37,210 |
|
|
Restricted cash |
|
|
404 |
|
|
|
429 |
|
|
Real estate securities at fair value |
|
|
73,903 |
|
|
|
157,869 |
|
|
Commercial mortgage loans at cost, net of allowance for loan loss of $5,765 and $0, respectively |
|
|
498,141 |
|
|
|
504,702 |
|
|
Deferred debt finance costs |
|
|
1,320 |
|
|
|
1,133 |
|
|
Accrued interest receivable |
|
|
1,322 |
|
|
|
1,822 |
|
|
Prepaid expenses and other assets |
|
|
35 |
|
|
|
154 |
|
|
Total assets |
|
$ |
614,658 |
|
|
$ |
703,319 |
|
|
LIABILITIES AND EQUITY |
|
|
|
|
|
|
|
|
|
Liabilities: |
|
|
|
|
|
|
|
|
|
Repurchase agreements—real estate securities |
|
$ |
45,328 |
|
|
$ |
107,489 |
|
|
Repurchase agreements—commercial mortgage loans |
|
|
327,928 |
|
|
|
335,805 |
|
|
Loan fees payable |
|
|
181 |
|
|
|
55 |
|
|
Due to related parties |
|
|
1,988 |
|
|
|
698 |
|
|
Interest payable |
|
|
341 |
|
|
|
652 |
|
|
Distributions payable |
|
|
— |
|
|
|
1,699 |
|
|
Accrued expenses |
|
|
1,362 |
|
|
|
755 |
|
|
Total liabilities |
|
|
377,128 |
|
|
|
447,153 |
|
|
Stockholders’ Equity: |
|
|
|
|
|
|
|
|
|
Class P common stock, $0.001 par value, 500,000,000 shares authorized, 10,151,787 and 10,182,305 shares issued and outstanding at June 30, 2020 and December 31, 2019, respectively |
|
|
10 |
|
|
|
10 |
|
|
Class A common stock, $0.001 par value, 500,000,000 shares authorized, 653,566 and 272,006 shares issued and outstanding as of June 30, 2020 and December 31, 2019, respectively |
|
|
1 |
|
|
|
— |
|
|
Class T common stock, $0.001 par value, 500,000,000 shares authorized, 397,251 and 121,718 shares issued and outstanding as of June 30, 2020 and December 31, 2019, respectively |
|
— |
|
|
|
— |
|
|
|
Class S common stock, $0.001 par value, 500,000,000 shares authorized, 0 shares issued and outstanding as of June 30, 2020 and December 31, 2019, respectively |
|
— |
|
|
|
— |
|
|
|
Class D common stock, $0.001 par value, 500,000,000 shares authorized, 50,081 and 41,538 shares issued and outstanding as of June 30, 2020 and December 31, 2019, respectively |
|
— |
|
|
|
— |
|
|
|
Class I common stock, $0.001 par value, 500,000,000 shares authorized, 378,302 and 100,743 shares issued and outstanding as of June 30, 2020 and December 31, 2019, respectively |
|
— |
|
|
|
— |
|
|
|
Additional paid in capital (net of offering costs of $24,618 and $22,718 at June 30, 2020 and December 31, 2019, respectively) |
|
|
287,703 |
|
|
|
265,963 |
|
|
Accumulated deficit |
|
|
(50,184 |
) |
|
|
(9,807 |
) |
|
Total stockholders’ equity |
|
|
237,530 |
|
|
|
256,166 |
|
|
Total liabilities and stockholders’ equity |
|
$ |
614,658 |
|
|
$ |
703,319 |
|
The accompanying notes are an integral part of these consolidated financial statements
2
INPOINT COMMERCIAL REAL ESTATE INCOME, INC.
CONSOLIDATED STATEMENTS OF OPERATIONS
(Unaudited, dollar amounts in thousands, except share data)
|
|
|
Three-months ended June 30, |
|
|
Six-months ended June 30, |
|
||||||||||
|
|
|
2020 |
|
|
2019 |
|
|
2020 |
|
|
2019 |
|
||||
|
Interest income: |
|
|
|
|
|
|
|
|
|
|
|
|
|
|
|
|
|
Interest income |
|
$ |
8,759 |
|
|
$ |
8,456 |
|
|
$ |
19,115 |
|
|
$ |
15,047 |
|
|
Less: Interest expense |
|
|
(2,683 |
) |
|
|
(3,509 |
) |
|
|
(6,645 |
) |
|
|
(6,264 |
) |
|
Net interest income |
|
|
6,076 |
|
|
|
4,947 |
|
|
|
12,470 |
|
|
|
8,783 |
|
|
Operating expenses: |
|
|
|
|
|
|
|
|
|
|
|
|
|
|
|
|
|
Advisory fee |
|
|
1,557 |
|
|
|
1,954 |
|
|
|
2,401 |
|
|
|
3,485 |
|
|
Debt finance costs |
|
|
304 |
|
|
|
226 |
|
|
|
558 |
|
|
|
422 |
|
|
Directors compensation |
|
|
24 |
|
|
|
23 |
|
|
|
48 |
|
|
|
43 |
|
|
Professional service fees |
|
|
1,294 |
|
|
|
159 |
|
|
|
1,512 |
|
|
|
309 |
|
|
Other expenses |
|
|
247 |
|
|
|
83 |
|
|
|
472 |
|
|
|
166 |
|
|
Total operating expenses |
|
|
3,426 |
|
|
|
2,445 |
|
|
|
4,991 |
|
|
|
4,425 |
|
|
Other (loss) income: |
|
|
|
|
|
|
|
|
|
|
|
|
|
|
|
|
|
Provision for loan losses |
|
|
(1,265 |
) |
|
|
— |
|
|
|
(5,765 |
) |
|
|
— |
|
|
Realized loss on sale of commercial loan |
|
|
(375 |
) |
|
|
— |
|
|
|
(375 |
) |
|
|
— |
|
|
Unrealized gain (loss) in value of real estate securities |
|
|
19,284 |
|
|
|
(18 |
) |
|
|
(18,903 |
) |
|
|
1,790 |
|
|
Realized loss on the sale of real estate securities |
|
|
(19,288 |
) |
|
|
— |
|
|
|
(19,288 |
) |
|
|
(43 |
) |
|
Total other (loss) income |
|
|
(1,644 |
) |
|
|
(18 |
) |
|
|
(44,331 |
) |
|
|
1,747 |
|
|
Net income (loss) |
|
$ |
1,006 |
|
|
$ |
2,484 |
|
|
$ |
(36,852 |
) |
|
$ |
6,105 |
|
|
Net income (loss) per share basic and diluted |
|
$ |
0.09 |
|
|
$ |
0.30 |
|
|
$ |
(3.21 |
) |
|
$ |
0.82 |
|
|
Weighted average number of shares |
|
|
|
|
|
|
|
|
|
|
|
|
|
|
|
|
|
Basic |
|
|
11,630,987 |
|
|
|
8,287,246 |
|
|
|
11,490,217 |
|
|
|
7,486,495 |
|
|
Diluted |
|
|
11,631,304 |
|
|
|
8,287,480 |
|
|
|
11,490,217 |
|
|
|
7,486,628 |
|
The accompanying notes are an integral part of these consolidated financial statements
3
INPOINT COMMERCIAL REAL ESTATE INCOME, INC.
CONSOLIDATED STATEMENTS OF CHANGES IN STOCKHOLDERS’ EQUITY
(Unaudited, dollar amounts in thousands)
|
For the three-months ended June 30, 2020 |
Par Value Common Stock |
|
|
|
|
|
|
|
|
|
|
|
|
|
|||||||||||||||||||||
|
Class P |
|
|
Class A |
|
|
Class T |
|
|
Class S |
|
|
Class D |
|
|
Class I |
|
|
Additional Paid in Capital |
|
|
Accumulated Deficit |
|
|
Total Stockholders’ Equity |
|
||||||||||
|
Balance as of March 31, 2020 |
$ |
10 |
|
|
$ |
1 |
|
|
$ |
— |
|
|
$ |
— |
|
|
$ |
— |
|
|
$ |
— |
|
|
$ |
288,030 |
|
|
$ |
(51,190 |
) |
|
$ |
236,851 |
|
|
Proceeds from issuance of common stock |
|
— |
|
|
|
— |
|
|
|
— |
|
|
|
— |
|
|
|
— |
|
|
|
— |
|
|
|
— |
|
|
|
— |
|
|
|
— |
|
|
Offering costs |
|
— |
|
|
|
— |
|
|
|
— |
|
|
|
— |
|
|
|
— |
|
|
|
— |
|
|
|
(335 |
) |
|
|
— |
|
|
|
(335 |
) |
|
Net income |
|
— |
|
|
|
— |
|
|
|
— |
|
|
|
— |
|
|
|
— |
|
|
|
— |
|
|
|
— |
|
|
|
1,006 |
|
|
|
1,006 |
|
|
Distributions declared |
|
— |
|
|
|
— |
|
|
|
— |
|
|
|
— |
|
|
|
— |
|
|
|
— |
|
|
|
— |
|
|
|
— |
|
|
|
— |
|
|
Distribution reinvestment |
|
— |
|
|
|
— |
|
|
|
— |
|
|
|
— |
|
|
|
— |
|
|
|
— |
|
|
|
— |
|
|
|
— |
|
|
|
— |
|
|
Redemptions |
|
— |
|
|
|
— |
|
|
|
— |
|
|
|
— |
|
|
|
— |
|
|
|
— |
|
|
|
— |
|
|
|
— |
|
|
|
— |
|
|
Equity-based compensation |
|
— |
|
|
|
— |
|
|
|
— |
|
|
|
— |
|
|
|
— |
|
|
|
— |
|
|
|
8 |
|
|
|
— |
|
|
|
8 |
|
|
Balance as of June 30, 2020 |
$ |
10 |
|
|
$ |
1 |
|
|
$ |
— |
|
|
$ |
— |
|
|
$ |
— |
|
|
$ |
— |
|
|
$ |
287,703 |
|
|
$ |
(50,184 |
) |
|
$ |
237,530 |
|
|
For the three-months ended June 30, 2019 |
Par Value Common Stock |
|
|
|
|
|
|
|
|
|
|
|
|
|
|||||||||||||||||||||
|
|
Class P |
|
|
Class A |
|
|
Class T |
|
|
Class S |
|
|
Class D |
|
|
Class I |
|
|
Additional Paid in Capital |
|
|
Accumulated Deficit |
|
|
Total Stockholders’ Equity |
|
|||||||||
|
Balance as of March 31, 2019 |
$ |
8 |
|
|
$ |
— |
|
|
$ |
— |
|
|
$ |
— |
|
|
$ |
— |
|
|
$ |
— |
|
|
$ |
188,309 |
|
|
$ |
(5,934 |
) |
|
$ |
182,383 |
|
|
Proceeds from issuance of common stock |
|
1 |
|
|
|
— |
|
|
|
— |
|
|
|
— |
|
|
|
— |
|
|
|
— |
|
|
|
51,635 |
|
|
|
— |
|
|
|
51,636 |
|
|
Offering costs |
|
— |
|
|
|
— |
|
|
|
— |
|
|
|
— |
|
|
|
— |
|
|
|
— |
|
|
|
(3,297 |
) |
|
|
— |
|
|
|
(3,297 |
) |
|
Net income |
|
— |
|
|
|
— |
|
|
|
— |
|
|
|
— |
|
|
|
— |
|
|
|
— |
|
|
|
— |
|
|
|
2,484 |
|
|
|
2,484 |
|
|
Distributions declared |
|
— |
|
|
|
— |
|
|
|
— |
|
|
|
— |
|
|
|
— |
|
|
|
— |
|
|
|
— |
|
|
|
(3,977 |
) |
|
|
(3,977 |
) |
|
Redemptions |
|
— |
|
|
|
— |
|
|
|
— |
|
|
|
— |
|
|
|
— |
|
|
|
— |
|
|
|
(90 |
) |
|
|
— |
|
|
|
(90 |
) |
|
Equity-based compensation |
|
— |
|
|
|
— |
|
|
|
— |
|
|
|
— |
|
|
|
— |
|
|
|
— |
|
|
|
5 |
|
|
|
— |
|
|
|
5 |
|
|
Balance as of June 30, 2019 |
$ |
9 |
|
|
$ |
— |
|
|
$ |
— |
|
|
$ |
— |
|
|
$ |
— |
|
|
$ |
— |
|
|
$ |
236,562 |
|
|
$ |
(7,427 |
) |
|
$ |
229,144 |
|
The accompanying notes are an integral part of these consolidated financial statements
4
INPOINT COMMERCIAL REAL ESTATE INCOME, INC.
CONSOLIDATED STATEMENTS OF CHANGES IN STOCKHOLDERS’ EQUITY
(Unaudited, dollar amounts in thousands)
|
For the six-months ended June 30, 2020 |
Par Value Common Stock |
|
|
|
|
|
|
|
|
|
|
|
|
|
|||||||||||||||||||||
|
Class P |
|
|
Class A |
|
|
Class T |
|
|
Class S |
|
|
Class D |
|
|
Class I |
|
|
Additional Paid in Capital |
|
|
Accumulated Deficit |
|
|
Total Stockholders’ Equity |
|
||||||||||
|
Balance as of December 31, 2019 |
$ |
10 |
|
|
$ |
— |
|
|
$ |
— |
|
|
$ |
— |
|
|
$ |
— |
|
|
$ |
— |
|
|
$ |
265,963 |
|
|
$ |
(9,807 |
) |
|
$ |
256,166 |
|
|
Proceeds from issuance of common stock |
|
— |
|
|
|
1 |
|
|
|
— |
|
|
|
— |
|
|
|
— |
|
|
|
— |
|
|
|
24,260 |
|
|
|
— |
|
|
|
24,261 |
|
|
Offering costs |
|
— |
|
|
|
— |
|
|
|
— |
|
|
|
— |
|
|
|
— |
|
|
|
— |
|
|
|
(1,900 |
) |
|
|
— |
|
|
|
(1,900 |
) |
|
Net loss |
|
— |
|
|
|
— |
|
|
|
— |
|
|
|
— |
|
|
|
— |
|
|
|
— |
|
|
|
— |
|
|
|
(36,852 |
) |
|
|
(36,852 |
) |
|
Distributions declared |
|
— |
|
|
|
— |
|
|
|
— |
|
|
|
— |
|
|
|
— |
|
|
|
— |
|
|
|
— |
|
|
|
(3,525 |
) |
|
|
(3,525 |
) |
|
Distribution reinvestment |
|
— |
|
|
|
— |
|
|
|
— |
|
|
|
— |
|
|
|
— |
|
|
|
— |
|
|
|
127 |
|
|
|
— |
|
|
|
127 |
|
|
Redemptions |
|
— |
|
|
|
— |
|
|
|
— |
|
|
|
— |
|
|
|
— |
|
|
|
— |
|
|
|
(763 |
) |
|
|
— |
|
|
|
(763 |
) |
|
Equity-based compensation |
|
— |
|
|
|
— |
|
|
|
— |
|
|
|
— |
|
|
|
— |
|
|
|
— |
|
|
|
16 |
|
|
|
— |
|
|
|
16 |
|
|
Balance as of June 30, 2020 |
$ |
10 |
|
|
$ |
1 |
|
|
$ |
— |
|
|
$ |
— |
|
|
$ |
— |
|
|
$ |
— |
|
|
$ |
287,703 |
|
|
$ |
(50,184 |
) |
|
$ |
237,530 |
|
|
For the six-months ended June 30, 2019 |
Par Value Common Stock |
|
|
|
|
|
|
|
|
|
|
|
|
|
|||||||||||||||||||||
|
|
Class P |
|
|
Class A |
|
|
Class T |
|
|
Class S |
|
|
Class D |
|
|
Class I |
|
|
Additional Paid in Capital |
|
|
Accumulated Deficit |
|
|
Total Stockholders’ Equity |
|
|||||||||
|
Balance as of December 31, 2018 |
$ |
6 |
|
|
$ |
— |
|
|
$ |
— |
|
|
$ |
— |
|
|
$ |
— |
|
|
$ |
— |
|
|
$ |
148,650 |
|
|
$ |
(6,384 |
) |
|
$ |
142,272 |
|
|
Proceeds from issuance of common stock |
|
3 |
|
|
|
— |
|
|
|
— |
|
|
|
— |
|
|
|
— |
|
|
|
— |
|
|
|
94,313 |
|
|
|
— |
|
|
|
94,316 |
|
|
Offering costs |
|
— |
|
|
|
— |
|
|
|
— |
|
|
|
— |
|
|
|
— |
|
|
|
— |
|
|
|
(6,321 |
) |
|
|
— |
|
|
|
(6,321 |
) |
|
Net income |
|
— |
|
|
|
— |
|
|
|
— |
|
|
|
— |
|
|
|
— |
|
|
|
— |
|
|
|
— |
|
|
|
6,105 |
|
|
|
6,105 |
|
|
Distributions declared |
|
— |
|
|
|
— |
|
|
|
— |
|
|
|
— |
|
|
|
— |
|
|
|
— |
|
|
|
— |
|
|
|
(7,148 |
) |
|
|
(7,148 |
) |
|
Redemptions |
|
— |
|
|
|
— |
|
|
|
— |
|
|
|
— |
|
|
|
— |
|
|
|
— |
|
|
|
(90 |
) |
|
|
— |
|
|
|
(90 |
) |
|
Equity-based compensation |
|
— |
|
|
|
— |
|
|
|
— |
|
|
|
— |
|
|
|
— |
|
|
|
— |
|
|
|
10 |
|
|
|
— |
|
|
|
10 |
|
|
Balance as of June 30, 2019 |
$ |
9 |
|
|
$ |
— |
|
|
$ |
— |
|
|
$ |
— |
|
|
$ |
— |
|
|
$ |
— |
|
|
$ |
236,562 |
|
|
$ |
(7,427 |
) |
|
$ |
229,144 |
|
The accompanying notes are an integral part of these consolidated financial statements
5
INPOINT COMMERCIAL REAL ESTATE INCOME, INC.
CONSOLIDATED STATEMENTS OF CASH FLOWS
(Unaudited, dollar amounts in thousands)
|
|
|
For the six-months ended June 30, |
|
|||||
|
|
|
2020 |
|
|
2019 |
|
||
|
Cash flows from operating activities: |
|
|
|
|
|
|
|
|
|
Net (loss) income |
|
$ |
(36,852 |
) |
|
$ |
6,105 |
|
|
Adjustments to reconcile net (loss) income to cash provided by operations: |
|
|
|
|
|
|
|
|
|
Net realized loss on real estate securities |
|
|
19,288 |
|
|
|
43 |
|
|
Net unrealized loss (gain) on real estate securities |
|
|
18,903 |
|
|
|
(1,790 |
) |
|
Provision for loan losses |
|
|
5,765 |
|
|
|
— |
|
|
Realized loss on sale of commercial mortgage loan |
|
|
375 |
|
|
|
— |
|
|
Amortization of equity-based compensation |
|
|
16 |
|
|
|
10 |
|
|
Amortization of debt finance costs to operating expense |
|
|
558 |
|
|
|
422 |
|
|
Amortization of debt finance costs to interest expense |
|
|
39 |
|
|
|
40 |
|
|
Amortization of bond discount |
|
|
(309 |
) |
|
|
(383 |
) |
|
Amortization of origination fees |
|
|
(821 |
) |
|
|
(645 |
) |
|
Amortization of deferred exit fees |
|
|
— |
|
|
|
(280 |
) |
|
Changes in assets and liabilities: |
|
|
|
|
|
|
|
|
|
Accrued interest receivable |
|
|
372 |
|
|
|
(489 |
) |
|
Accrued expenses |
|
|
606 |
|
|
|
(491 |
) |
|
Loan fees payable |
|
|
126 |
|
|
|
— |
|
|
Accrued interest payable |
|
|
(311 |
) |
|
|
775 |
|
|
Due to related parties |
|
|
585 |
|
|
|
8 |
|
|
Prepaid expenses and other assets |
|
|
119 |
|
|
|
101 |
|
|
Net cash provided by operating activities |
|
|
8,459 |
|
|
|
3,426 |
|
|
Cash flows from investing activities: |
|
|
|
|
|
|
|
|
|
Origination of commercial loans |
|
|
(55,018 |
) |
|
|
(181,557 |
) |
|
Origination fees received on commercial loans |
|
|
— |
|
|
|
1,951 |
|
|
Principal repayments of commercial loans |
|
|
47,036 |
|
|
|
2,477 |
|
|
Proceeds from sale of commercial loan |
|
|
9,625 |
|
|
|
— |
|
|
Purchase of real estate securities |
|
|
— |
|
|
|
(32,459 |
) |
|
Proceeds from real estate securities sold |
|
|
43,928 |
|
|
|
9,211 |
|
|
Real estate securities principal pay-down |
|
|
2,156 |
|
|
|
906 |
|
|
Net cash provided by (used in) investing activities |
|
|
47,727 |
|
|
|
(199,471 |
) |
|
Cash flows from financing activities: |
|
|
|
|
|
|
|
|
|
Proceeds from issuance of common stock |
|
|
24,261 |
|
|
|
94,316 |
|
|
Redemptions of common stock |
|
|
(763 |
) |
|
|
(90 |
) |
|
Payment of offering costs |
|
|
(1,467 |
) |
|
|
(6,321 |
) |
|
Proceeds from repurchase agreements |
|
|
520,663 |
|
|
|
613,365 |
|
|
Principal repayments of repurchase agreements |
|
|
(590,714 |
) |
|
|
(477,785 |
) |
|
Debt finance costs |
|
|
(770 |
) |
|
|
(1,337 |
) |
|
Distributions paid |
|
|
(5,098 |
) |
|
|
(6,684 |
) |
|
Net cash (used in) provided by financing activities |
|
|
(53,888 |
) |
|
|
215,464 |
|
|
Net change in cash, cash equivalents and restricted cash |
|
|
2,298 |
|
|
|
19,419 |
|
|
Cash, cash equivalents and restricted cash at beginning of period |
|
|
37,639 |
|
|
|
28,497 |
|
|
Cash, cash equivalents and restricted cash at end of period |
|
$ |
39,937 |
|
|
$ |
47,916 |
|
|
Supplemental disclosure of cash flow information: |
|
|
|
|
|
|
|
|
|
Change in deferred offering costs and accrued offering expenses, included in due to related parties |
|
$ |
— |
|
|
$ |
(431 |
) |
|
Amortization of deferred exit fees due to related party |
|
$ |
273 |
|
|
$ |
— |
|
|
Interest paid |
|
$ |
6,956 |
|
|
$ |
6,162 |
|
|
Distributions payable |
|
$ |
— |
|
|
$ |
1,405 |
|
|
Payable for securities purchased |
|
$ |
— |
|
|
$ |
18,001 |
|
|
Accrued interest receivable on securities purchased |
|
$ |
— |
|
|
$ |
(1 |
) |
|
Purchase of real estate securities |
|
$ |
— |
|
|
$ |
(18,000 |
) |
|
Deferred interest capitalized on commercial loan |
|
$ |
128 |
|
|
$ |
— |
|
|
Accrued stockholder servicing fee due to related party |
|
$ |
433 |
|
|
$ |
— |
|
|
Distribution reinvestment |
|
$ |
127 |
|
|
$ |
— |
|
The accompanying notes are an integral part of these consolidated financial statements
6
InPoint Commercial Real Estate Income, Inc.
Notes to Consolidated Financial Statements
June 30, 2020
(Unaudited, dollar amounts in thousands, except share data)
Note 1 – Organization and Business Operations
InPoint Commercial Real Estate Income, Inc. (the “Company”) was incorporated in Maryland on September 13, 2016 to originate, acquire and manage a diversified portfolio of commercial real estate (“CRE”) investments primarily comprised of (i) CRE debt, including floating-rate first mortgage loans, subordinate mortgage and mezzanine loans, and participations in such loans and (ii) floating-rate CRE securities, such as commercial mortgage-backed securities (“CMBS”), and senior unsecured debt of publicly traded real estate investment trusts (“REITs”). The Company may also invest in select equity investments in single-tenant, net leased properties. Substantially all of the Company’s business is conducted through InPoint REIT Operating Partnership, LP (the “Operating Partnership”), a Delaware limited partnership. The Company is the sole general partner and directly or indirectly holds all of the limited partner interests in the Operating Partnership. The Company has elected to be taxed as a REIT for U.S. federal income tax purposes.
The Company is externally managed by Inland InPoint Advisor, LLC (the “Advisor”), a Delaware limited liability company formed in August 2016 that is a wholly owned indirect subsidiary of Inland Real Estate Investment Corporation, a member of The Inland Real Estate Group of Companies, Inc. The Advisor is responsible for coordinating the management of the day-to-day operations and originating, acquiring and managing the Company’s CRE investment portfolio, subject to the supervision of the Company’s board of directors (the “Board”). The Advisor performs its duties and responsibilities as the Company’s fiduciary pursuant to an amended and restated advisory agreement dated April 29, 2019 among the Company, the Advisor and the Operating Partnership (the “Advisory Agreement”), which supersedes and replaces the advisory agreement dated October 25, 2016 (the “Prior Advisory Agreement”).
The Advisor has delegated certain of its duties to SPCRE InPoint Advisors, LLC (the “Sub-Advisor”), a Delaware limited liability company formed in September 2016 that is a wholly owned subsidiary of Sound Point CRE Management, LP, pursuant to an amended and restated sub-advisory agreement between the Advisor and the Sub-Advisor dated April 29, 2019, which supersedes and replaces the sub-advisory agreement dated October 25, 2016. Among other duties, the Sub-Advisor has the authority to identify, negotiate, acquire and originate the Company’s investments and provide portfolio management, disposition, property management and leasing services to the Company. Notwithstanding such delegation to the Sub-Advisor, the Advisor retains ultimate responsibility for the performance of all the matters entrusted to it under the Advisory Agreement, including those duties which the Advisor has not delegated to the Sub-Advisor such as (i) valuation of the Company’s assets and calculation of the Company’s net asset value (“NAV”); (ii) management of the Company’s day-to-day operations; (iii) preparation of stockholder reports and communications and arrangement of the Company’s annual stockholder meeting; and (iv) advising the Company regarding its initial qualification as a REIT for U.S. federal income tax purposes and monitoring its ongoing compliance with the REIT qualification requirements thereafter.
On October 25, 2016, the Company commenced a private offering (the “Private Offering”) of up to $500,000 in shares of Class P common stock (“Class P Shares”). Inland Securities Corporation, an affiliate of the Advisor (the “Dealer Manager”), was the dealer manager for the Private Offering. On June 28, 2019, the Company terminated the Private Offering in anticipation of selling shares in the IPO (described below). The Company continued to accept Private Offering subscription proceeds through July 16, 2019 from subscription agreements executed no later than June 28, 2019. As of July 16, 2019, the Company had received and accepted investors’ subscriptions for and issued 10,258,094 Class P Shares in the Private Offering, resulting in gross proceeds of $276,681.
On March 22, 2019, the Company filed a Registration Statement on Form S-11 (File No. 333-230465) (the “Registration Statement”) to register up to $2,350,000 in shares of common stock (the “IPO”).
On April 29, 2019, the Company filed articles of amendment with the State Department of Assessments and Taxation of the State of Maryland (the “SDAT”) (i) to modify the number of shares of capital stock the Company has authority to issue under its charter from 500,000,000 to 3,050,000,000, consisting of 3,000,000,000 Class P Shares and 50,000,000 shares of preferred stock, and (ii) to modify the aggregate par value of all authorized shares of stock from $500 to $3,050.
On April 29, 2019, the Company also filed articles supplementary with SDAT to reclassify and designate: (i) 500,000,000 authorized but unissued Class P Shares as Class A common shares; (ii) 500,000,000 authorized but unissued Class P Shares as Class D common shares; (iii) 500,000,000 authorized but unissued Class P Shares as Class I common shares; (iv) 500,000,000 authorized but unissued Class P Shares as Class S common shares; and (v) 500,000,000 authorized but unissued Class P Shares as Class T common shares.
7
InPoint Commercial Real Estate Income, Inc.
Notes to Consolidated Financial Statements
June 30, 2020
(Unaudited, dollar amounts in thousands, except share data)
On May 3, 2019, the Securities and Exchange Commission (the “SEC”) declared effective the Registration Statement and the Company commenced the IPO. Prior to July 17, 2019 (the “NAV Pricing Date”), the purchase price for each class of its common stock in its primary offering was $25.00 per share, plus applicable upfront selling commissions and dealer manager fees. Following the NAV Pricing Date, the purchase price per share for each class of common stock in the IPO varies and generally equals the prior month’s NAV per share, as determined monthly, plus applicable upfront selling commissions and dealer manager fees. The Dealer Manager serves as the Company’s exclusive dealer manager for the IPO on a best efforts basis.
On March 24, 2020, the Board suspended (i) the sale of shares in the IPO, (ii) the operation of the share repurchase program (the “SRP”), (iii) the payment of distributions to the Company’s stockholders, and (iv) the operation of the distribution reinvestment plan (the “DRP”), effective as of April 6, 2020.
In determining to suspend the IPO, the SRP, the payment of distributions and the DRP, the Board considered various factors, including the impact of the global COVID-19 pandemic on the economy, the inability to accurately calculate the Company’s NAV per share due to uncertainty, volatility and lack of liquidity in the market, the Company’s need for liquidity due to financing challenges related to additional collateral required by the banks that regularly finance the Company’s assets and these uncertain and rapidly changing economic conditions. While the Company did not calculate the NAV for the months of March through May 2020, the Advisor has determined since then that there has been reduced volatility in the market for the Company’s investments and some improvement in the U.S. economic outlook, and the Advisor resumed calculation of the NAV beginning as of June 30, 2020. However, the IPO, SRP, payment of distributions and DRP remained suspended as of June 30, 2020. The Company is working toward and intends to restart the IPO and the DRP subject to receiving the required regulatory approvals to do so. The Company will continue to closely monitor the pandemic, the economy and the markets for the Company’s investments in order to determine an appropriate time to resume the SRP. Please refer to “Note 13 – Subsequent Events” and Part II, “Item 1A – Risk Factors” for updates on the business after June 30, 2020 and discussion of risk factors related to the COVID-19 pandemic, respectively.
Note 2 – Summary of Significant Accounting Policies
Disclosures discussing all significant accounting policies are set forth in the Company’s Annual Report on Form 10-K for the year ended December 31, 2019 (the “Annual Report”), as filed with the SEC on March 11, 2020, under the heading Note 2 – Summary of Significant Accounting Policies. There have been no changes to the Company’s significant accounting policies for the six-months ended June 30, 2020.
Basis of Accounting
The accompanying consolidated financial statements and related footnotes have been prepared in conformity with U.S. generally accepted accounting principles (“GAAP”) and require management to make estimates and assumptions that affect the reported amounts of assets and liabilities as of the date of the financial statements and the reported amounts of income and expenses during the reported periods. Actual results could differ from such estimates.
In the opinion of management, the accompanying unaudited consolidated financial statements reflect all adjustments, which are normal and recurring in nature, necessary for fair financial statement presentation.
Cash, Cash Equivalents and Restricted Cash
Cash and cash equivalents include funds on deposit with financial institutions, including demand deposits with financial institutions with original maturities of three months or less. The account balance may exceed the Federal Deposit Insurance Corporation (“FDIC”) insurance coverage limits and, as a result, there could be a concentration of credit risk related to amounts on deposit in excess of FDIC insurance coverage limits. The Company believes that the risk will not be significant, as the Company does not anticipate the financial institutions’ non-performance.
Restricted cash represents cash the Company is required to hold in a segregated account. As of June 30, 2020 and December 31, 2019, the restricted cash was held as additional collateral on real estate securities repurchase agreements.
8
InPoint Commercial Real Estate Income, Inc.
Notes to Consolidated Financial Statements
June 30, 2020
(Unaudited, dollar amounts in thousands, except share data)
The following table provides a reconciliation of cash, cash equivalents and restricted cash in the Company’s consolidated balance sheets to the total amount shown in the Company’s consolidated statements of cash flows:
|
|
|
June 30, |
|
|
December 31, |
|
||
|
|
|
2020 |
|
|
2019 |
|
||
|
Cash and cash equivalents |
|
$ |
39,533 |
|
|
$ |
37,210 |
|
|
Restricted cash |
|
|
404 |
|
|
|
429 |
|
|
Total cash, cash equivalents, and restricted cash |
|
$ |
39,937 |
|
|
$ |
37,639 |
|
Accounting Pronouncements Recently Issued but Not Yet Effective
In June 2016, the Financial Accounting Standards Board (“FASB”) issued ASU 2016-13, “Financial Instruments – Credit Losses (Topic 326): Measurement of Credit Losses on Financial Instruments” (“ASU 2016-13”), which changes how entities measure credit losses for financial assets carried at amortized cost. ASU 2016-13 eliminates the requirement that a credit loss must be probable before it can be recognized and instead requires an entity to recognize the current estimate of all expected credit losses. ASU 2016-13 is effective for SEC filers for reporting periods beginning after December 15, 2019. In November 2019, the FASB issued ASU 2019-10, “Financial Instruments – Credit Losses (Topic 326), Derivatives and Hedging (Topic 815), and Leases (Topic 842): Effective Dates”, which grants smaller reporting companies (as defined by the SEC) until reporting periods commencing after December 15, 2022 to implement ASU 2016-13. The Company has elected to use this extension and is continuing to evaluate the impact ASU 2016-13 will have on its allowance for loan losses estimate.
Note 3 – Commercial Mortgage Loans Held for Investment
The tables below show the Company’s commercial mortgage loans held for investment as of June 30, 2020 and December 31, 2019:
June 30, 2020
|
|
|
Number of Loans |
|
|
Principal Balance |
|
|
Unamortized (fees)/costs, net |
|
|
Allowance for loan losses(1) |
|
|
Carrying Value |
|
|
Weighted Average Interest Rate |
|
|
Weighted Average Years to Maturity |
|
|||||||
|
First mortgage loans |
|
|
30 |
|
|
$ |
488,012 |
|
|
$ |
(606 |
) |
|
$ |
(4,265 |
) |
|
$ |
483,141 |
|
|
|
5.5 |
% |
|
|
1.7 |
|
|
Credit loans |
|
|
3 |
|
|
|
16,500 |
|
|
|
— |
|
|
|
(1,500 |
) |
|
|
15,000 |
|
|
|
9.5 |
% |
|
|
5.4 |
|
|
Total and average |
|
|
33 |
|
|
$ |
504,512 |
|
|
$ |
(606 |
) |
|
$ |
(5,765 |
) |
|
$ |
498,141 |
|
|
|
5.6 |
% |
|
|
1.9 |
|
December 31, 2019
|
|
|
Number of Loans |
|
|
Principal Balance |
|
|
Unamortized (fees)/costs, net |
|
|
Allowance for loan losses |
|
|
Carrying Value |
|
|
Weighted Average Interest Rate |
|
|
Weighted Average Years to Maturity |
|
|||||||
|
First mortgage loans |
|
|
29 |
|
|
$ |
489,902 |
|
|
$ |
(1,700 |
) |
|
$ |
— |
|
|
$ |
488,202 |
|
|
|
5.6 |
% |
|
|
2.0 |
|
|
Credit loans |
|
|
3 |
|
|
|
16,500 |
|
|
|
— |
|
|
|
— |
|
|
|
16,500 |
|
|
|
9.5 |
% |
|
|
5.9 |
|
|
Total and average |
|
|
32 |
|
|
$ |
506,402 |
|
|
$ |
(1,700 |
) |
|
$ |
— |
|
|
$ |
504,702 |
|
|
|
5.7 |
% |
|
|
2.2 |
|
|
____________ |
|
|
|
|
|
|
|
|
|
|
|
|
|
|
|
|
|
|
|
|
|
|
|
|
|
|
|
|
|
(1) |
Includes a reserve on one first mortgage loan and one credit loan at June 30, 2020. There is no general reserve for loan losses. |
9
InPoint Commercial Real Estate Income, Inc.
Notes to Consolidated Financial Statements
June 30, 2020
(Unaudited, dollar amounts in thousands, except share data)
For the six months ended June 30, 2020 and the year ended December 31, 2019, the activity in the Company’s commercial mortgage loans, held-for-investment portfolio was as follows:
|
|
|
Six Months Ended June 30, 2020 |
|
|
Year Ended December 31, 2019 |
|
||
|
Balance at Beginning of Year |
|
$ |
504,702 |
|
|
$ |
249,573 |
|
|
Loan originations |
|
|
55,018 |
|
|
|
329,155 |
|
|
Principal repayments |
|
|
(47,036 |
) |
|
|
(74,478 |
) |
|
Amortization of loan origination and deferred exit fees |
|
|
1,094 |
|
|
|
2,403 |
|
|
Sale of commercial loan |
|
|
(10,000 |
) |
|
|
— |
|
|
Origination fees received on commercial loans |
|
|
— |
|
|
|
(1,951 |
) |
|
Provision for loan losses |
|
|
(5,765 |
) |
|
|
— |
|
|
Deferred interest capitalized on commercial loan |
|
|
128 |
|
|
|
— |
|
|
Balance at End of Period |
|
$ |
498,141 |
|
|
$ |
504,702 |
|
During May 2020, the Company sold one credit loan with an outstanding principal balance of $10,000 generating proceeds of $9,625. The Company had not previously planned to sell the loan and had classified it as held for investment. The Company recognized a loss of $375 recorded in realized loss on sale of commercial loan.
Allowance for Loan Losses
The following table presents the activity in the Company’s allowance for loan losses:
|
|
|
Six Months Ended June 30, 2020 |
|
|
Six Months Ended June 30, 2019 |
|
||
|
Beginning of period |
|
$ |
— |
|
|
$ |
— |
|
|
Provision for loan losses |
|
|
(5,765 |
) |
|
|
— |
|
|
Charge-offs |
|
|
— |
|
|
|
— |
|
|
Ending allowance for loan losses |
|
$ |
(5,765 |
) |
|
$ |
— |
|
In accordance with the Company’s allowance for loan loss policy, during the six month period ended June 30, 2020, the Company recorded impairment charges of $4,265 on one first mortgage loan secured by a hotel property in Illinois and $1,500 on a credit loan secured by a hotel property located in Florida. The impairment charges were based on the estimated fair value of the underlying collateral. As of June 30, 2020, the Company’s recorded investment in the loans were $20,374 ($24,639, net of a $4,265 allowance for loan loss) and $1,500 ($3,000, net of a $1,500 allowance for loan loss), respectively. For the three and six months ended June 30, 2020, interest income for the impaired loans was $71 and $606, respectively. For further information on the Company’s allowance for loan losses policy, see “Note 2 – Summary of Significant Accounting Policies” in its Annual Report.
Credit Characteristics
As part of the Company’s process for monitoring the credit quality of its investments, it performs a quarterly asset review of the investment portfolio and assigns risk ratings to each of its loans and CMBS. Risk factors include payment status, lien position, borrower financial resources and investment in collateral, collateral type, project economics and geographic location, as well as national and regional economic factors. To determine the likelihood of loss, the loans are rated on a 5-point scale as follows:
10
InPoint Commercial Real Estate Income, Inc.
Notes to Consolidated Financial Statements
June 30, 2020
(Unaudited, dollar amounts in thousands, except share data)
|
Grade |
Investment Grade Definition |
|
1 |
Investment exceeding fundamental performance expectations and/or capital gain expected. Trends and risk factors since time of investment are favorable. |
|
2 |
Performing consistent with expectations and a full return of principal and interest expected. Trends and risk factors are neutral to favorable. |
|
3 |
Performing investment requiring closer monitoring. Trends and risk factors show some deterioration. Collection of principal and interest is still expected. |
|
4 |
Underperforming investment with the potential of some interest loss but still expecting a positive return on investment. Trends and risk factors are negative. |
|
5 |
Underperforming investment with expected loss of interest and some principal. |
All investments are assigned an initial risk rating of 2 at origination or acquisition.
As of June 30, 2020, 24 loans had a risk rating of 2, five had a risk rating of 3, two had a risk rating of 4 and two had a risk rating of 5. As of December 31, 2019, 30 loans had a risk rating of 2 and two had a risk rating of 3.
Loan Modifications
During April 2020, the Company agreed to modify one first mortgage loan on a hospitality property providing for a two-month partial reduction in the required monthly interest payment with payment of the amount by which the interest payments were reduced deferred to the two-month period beginning in October 2020. Prior to the COVID-19 pandemic, the loan was current on all required payments.
Note 4 – Real Estate Securities
The Company classified its real estate securities as available-for-sale. These investments are reported at fair value in the consolidated balance sheets with changes in fair value recorded in other income or loss in the consolidated statements of operations.
The tables below show the Company’s real estate securities as of June 30, 2020 and December 31, 2019:
June 30, 2020
|
Number of Positions |
|
|
External Credit Rating |
|
Collateral |
|
Weighted Average Interest Rate |
|
|
Weighted Average Years to Maturity |
|
Par Value |
|
|
Amortized Cost |
|
|
Unrealized Gains |
|
|
Unrealized Losses |
|
|
Fair Value |
|
|||||||
|
2 |
|
|
AAA |
|
Hospitality, Office |
|
|
1.0 |
% |
|
0.6 |
|
$ |
15,000 |
|
|
$ |
15,000 |
|
|
$ |
— |
|
|
$ |
(1,068 |
) |
|
$ |
13,932 |
|
|
|
1 |
|
|
AA- |
|
Hospitality |
|
|
1.2 |
% |
|
0.9 |
|
|
2,000 |
|
|
|
2,000 |
|
|
|
— |
|
|
|
(155 |
) |
|
|
1,845 |
|
|
|
6 |
|
|
BB- |
|
Retail, Hospitality, Mixed Use, Office |
|
|
3.2 |
% |
|
0.9 |
|
|
48,419 |
|
|
|
48,441 |
|
|
|
— |
|
|
|
(9,594 |
) |
|
|
38,847 |
|
|
|
2 |
|
|
Unrated |
|
Hospitality |
|
|
5.2 |
% |
|
0.9 |
|
|
27,575 |
|
|
|
27,575 |
|
|
|
— |
|
|
|
(8,296 |
) |
|
|
19,279 |
|
|
|
|
11 |
|
|
|
|
|
|
|
3.4 |
% |
|
0.8 |
|
$ |
92,994 |
|
|
$ |
93,016 |
|
|
$ |
— |
|
|
$ |
(19,113 |
) |
|
$ |
73,903 |
|
11
InPoint Commercial Real Estate Income, Inc.
Notes to Consolidated Financial Statements
June 30, 2020
(Unaudited, dollar amounts in thousands, except share data)
December 31, 2019
|
Number of Positions |
|
|
External Credit Rating |
|
Collateral |
|
Weighted Average Interest Rate |
|
|
Weighted Average Years to Maturity |
|
Par Value |
|
|
Amortized Cost |
|
|
Unrealized Gains |
|
|
Unrealized Losses |
|
|
Fair Value |
|
|||||||
|
3 |
|
|
AAA |
|
Hospitality, Office |
|
|
2.6 |
% |
|
0.5 |
|
$ |
19,113 |
|
|
$ |
19,081 |
|
|
$ |
— |
|
|
$ |
(43 |
) |
|
$ |
19,038 |
|
|
|
1 |
|
|
AA- |
|
Hospitality |
|
|
2.8 |
% |
|
0.4 |
|
|
2,000 |
|
|
|
1,999 |
|
|
|
— |
|
|
|
(11 |
) |
|
|
1,988 |
|
|
|
9 |
|
|
BB- |
|
Retail, Hospitality, Mixed Use, Office |
|
|
4.4 |
% |
|
1.3 |
|
|
72,052 |
|
|
|
72,033 |
|
|
|
104 |
|
|
|
(81 |
) |
|
|
72,056 |
|
|
|
1 |
|
|
BBB- |
|
Multifamily |
|
|
3.4 |
% |
|
1.5 |
|
|
10,000 |
|
|
|
10,000 |
|
|
|
— |
|
|
|
— |
|
|
|
10,000 |
|
|
|
3 |
|
|
Unrated |
|
Hospitality |
|
|
7.0 |
% |
|
0.7 |
|
|
55,275 |
|
|
|
54,967 |
|
|
|
— |
|
|
|
(180 |
) |
|
|
54,787 |
|
|
|
|
17 |
|
|
|
|
|
|
|
5.0 |
% |
|
1.0 |
|
$ |
158,440 |
|
|
$ |
158,080 |
|
|
$ |
104 |
|
|
$ |
(315 |
) |
|
$ |
157,869 |
|
At June 30, 2020, the Company held 11 CMBS with a total carrying value of $73,903 and a total net unrealized loss of $19,113. At December 31, 2019, the Company held 17 CMBS with a total carrying value of $157,869 and a total net unrealized loss of $211. The increase in the unrealized loss was primarily attributed to the significant economic impact of the COVID-19 pandemic on the economy. In particular, CMBS secured by hospitality properties were severely impacted due to concerns over a decline in hotel stays throughout the country. During the three and six months ended June 30, 2020, the Company sold real estate securities for $43,928 that resulted in realized losses of $19,288. During the six months ended June 30, 2019, the Company sold real estate securities for $9,211 that resulted in realized losses of $43.
As of June 30, 2020, three of the CMBS had an internal risk rating of 2, seven of the CMBS had an internal risk rating of 3, and one of the CMBS had an internal risk rating of 4. As of December 31, 2019, each CMBS had an internal risk rating of 2.
Note 5 – Repurchase Agreements
Commercial Mortgage Loans
On February 15, 2018, the Company, through a wholly owned subsidiary, entered into a master repurchase agreement (the “CF Repo Facility”) with Column Financial, Inc. as administrative agent for certain of its affiliates. The CF Repo Facility had an initial advance amount of $100,000 subject to a maximum advance amount of $250,000. The Company increased the advance amount in August 2018 to $175,000, and in January 2019 to the maximum of $250,000. In March 2020, the Company temporarily increased the maximum advance amount to $300,000, with this increase as amended set to expire on June 30, 2020. The initial term of the CF Repo Facility was 12 months and the Company extended the maturity date in March 2020 to February 2021. Advances under the CF Repo Facility accrue interest at a per annum rate equal to the London Interbank Offered Rate (“LIBOR”) plus 2.0%. The CF Repo Facility is subject to certain financial covenants. The Company was in compliance with all financial covenant requirements as of June 30, 2020 and December 31, 2019.
On May 6, 2019, the Company, through a wholly owned subsidiary, entered into an uncommitted master repurchase agreement (the “JPM Repo Facility”) with JPMorgan Chase Bank, National Association. The JPM Repo Facility provides up to $150,000 in advances that the Company expects to use to finance the acquisition or origination of eligible loans and participation interests therein. Advances under the JPM Repo Facility accrue interest at per annum rates equal to the sum of (i) the applicable LIBOR index rate plus (ii) a margin of between 1.75% to 2.50%, depending on the attributes of the purchased assets. The initial maturity date of the JPM Repo Facility is May 6, 2021, with two successive one-year extensions at the Company’s option, which may be exercised upon the satisfaction of certain conditions. The JPM Repo Facility is subject to certain financial covenants. The Company was in compliance with all financial covenant requirements as of June 30, 2020 and December 31, 2019.
The JPM Repo Facility and CF Repo Facility (collectively, the “Repo Facilities”) are used to finance eligible loans and each act in the manner of a revolving credit facility that can be repaid as the Company’s assets are paid off and re-drawn as advances against new assets.
12
InPoint Commercial Real Estate Income, Inc.
Notes to Consolidated Financial Statements
June 30, 2020
(Unaudited, dollar amounts in thousands, except share data)
The tables below show the Repo Facilities as of June 30, 2020 and December 31, 2019:
|
June 30, 2020 |
|
|
|
|
|
|
|
|
|
|
|
|
|
|
|
|
Weighted Average |
|
|||||
|
|
Committed Financing |
|
|
Amount Outstanding(1) |
|
|
Accrued Interest Payable |
|
|
Collateral Pledged |
|
|
Interest Rate |
|
|
Days to Maturity |
|
||||||
|
CF Repo Facility |
$ |
300,000 |
|
|
$ |
183,042 |
|
|
$ |
145 |
|
|
$ |
257,451 |
|
|
|
2.18 |
% |
|
|
227 |
|
|
JPM Repo Facility |
|
150,000 |
|
|
|
144,953 |
|
|
|
110 |
|
|
|
206,061 |
|
|
|
2.10 |
% |
|
|
310 |
|
|
|
$ |
450,000 |
|
|
$ |
327,995 |
|
|
$ |
255 |
|
|
$ |
463,512 |
|
|
|
2.15 |
% |
|
|
264 |
|
|
December 31, 2019 |
|
|
|
|
|
|
|
|
|
|
|
|
|
|
|
|
Weighted Average |
|
|||||
|
|
Committed Financing |
|
|
Amount Outstanding(1) |
|
|
Accrued Interest Payable |
|
|
Collateral Pledged |
|
|
Interest Rate |
|
|
Days to Maturity |
|
||||||
|
|
|
|
|
|
|
|
|
|
|
|
|
|
|
|
|
|
|
|
|
|
|
|
|
|
CF Repo Facility |
$ |
250,000 |
|
|
$ |
224,590 |
|
|
$ |
327 |
|
|
$ |
304,708 |
|
|
|
3.74 |
% |
|
|
318 |
|
|
JPM Repo Facility |
|
150,000 |
|
|
|
111,295 |
|
|
|
157 |
|
|
|
153,194 |
|
|
|
3.63 |
% |
|
|
492 |
|
|
|
$ |
400,000 |
|
|
$ |
335,885 |
|
|
$ |
484 |
|
|
$ |
457,902 |
|
|
|
3.70 |
% |
|
|
376 |
|
|
(1) |
Excludes $67 and $80 of unamortized debt issuance costs at June 30, 2020 and December 31, 2019, respectively. |
Real Estate Securities
The Company entered into two master repurchase agreements for real estate securities with separate counterparties and had the following balances outstanding as described in the table below:
|
|
|
|
|
|
|
|
|
|
|
|
|
|
|
Weighted Average |
|
|||||
|
|
|
Amount Outstanding |
|
|
Accrued Interest Payable |
|
|
Collateral Pledged |
|
|
Interest Rate |
|
|
Days to Maturity |
|
|||||
|
As of June 30, 2020 |
|
$ |
45,328 |
|
|
$ |
86 |
|
|
$ |
93,464 |
|
|
|
4.07 |
% |
|
|
34 |
|
|
As of December 31, 2019 |
|
$ |
107,489 |
|
|
$ |
168 |
|
|
$ |
149,164 |
|
|
|
3.14 |
% |
|
|
11 |
|
The total amount outstanding as of June 30, 2020 and December 31, 2019 was with JP Morgan Securities LLC. The master repurchase agreements are subject to certain financial covenants. The Company was in compliance with all financial covenant requirements as of June 30, 2020 and December 31, 2019.
13
InPoint Commercial Real Estate Income, Inc.
Notes to Consolidated Financial Statements
June 30, 2020
(Unaudited, dollar amounts in thousands, except share data)
The following tables detail the change in the Company’s outstanding shares of all classes of common stock, including restricted common stock:
|
|
|
Common Stock |
|
|||||||||||||||||||||
|
Six-months ended June 30, 2020 |
|
Class P |
|
|
Class A |
|
|
Class T |
|
|
Class S |
|
|
Class D |
|
|
Class I |
|
||||||
|
Beginning balance |
|
|
10,182,305 |
|
|
|
272,006 |
|
|
|
121,718 |
|
|
|
— |
|
|
|
41,538 |
|
|
|
100,743 |
|
|
Issuance of shares |
|
|
— |
|
|
|
379,250 |
|
|
|
274,570 |
|
|
|
— |
|
|
|
8,066 |
|
|
|
276,250 |
|
|
Distribution reinvestment |
|
|
— |
|
|
|
2,310 |
|
|
|
963 |
|
|
|
— |
|
|
|
477 |
|
|
|
1,309 |
|
|
Issuance of restricted shares |
|
|
— |
|
|
|
— |
|
|
|
— |
|
|
|
— |
|
|
|
— |
|
|
|
— |
|
|
Redemptions |
|
|
(30,518 |
) |
|
|
— |
|
|
|
— |
|
|
|
— |
|
|
|
— |
|
|
|
— |
|
|
Ending balance |
|
|
10,151,787 |
|
|
|
653,566 |
|
|
|
397,251 |
|
|
|
— |
|
|
|
50,081 |
|
|
|
378,302 |
|
|
|
|
|
|
|
|
|
|
|
|
|
|
|
|
|
|
|
|
|
|
|
|
|
|
|
|
|
|
Common Stock |
|
|||||||||||||||||||||
|
Six-months ended June 30, 2019 |
|
Class P |
|
|
Class A |
|
|
Class T |
|
|
Class S |
|
|
Class D |
|
|
Class I |
|
||||||
|
Beginning balance |
|
|
5,940,744 |
|
|
|
— |
|
|
|
— |
|
|
|
— |
|
|
|
— |
|
|
|
— |
|
|
Issuance of shares |
|
|
3,495,435 |
|
|
|
— |
|
|
|
— |
|
|
|
— |
|
|
|
— |
|
|
|
— |
|
|
Issuance of restricted shares |
|
|
2,400 |
|
|
|
— |
|
|
|
— |
|
|
|
— |
|
|
|
— |
|
|
|
— |
|
|
Redemptions |
|
|
(3,586 |
) |
|
|
— |
|
|
|
— |
|
|
|
— |
|
|
|
— |
|
|
|
— |
|
|
Ending balance |
|
|
9,434,993 |
|
|
|
— |
|
|
|
— |
|
|
|
— |
|
|
|
— |
|
|
|
— |
|
Distributions
From January 1, 2019 to July 31, 2019, the Company paid distributions on Class P Shares based on daily record dates, payable in arrears the following month, equal to a daily amount of 1/365th of $1.92 per share. Distributions declared on or after August 1, 2019 through February 29, 2020 on Class P Shares were based on monthly record dates, payable in arrears the following month equal to a monthly amount of 1/12th of $1.92 per share. Distributions on shares of Class A, Class T, Class D and Class I common stock through February 29, 2020 were based on monthly record dates, payable in arrears the following month equal to a monthly amount of 1/12th of $1.62 per share. The table below presents the aggregate distributions declared for each applicable class of common stock during the six-months ended June 30, 2020. The table excludes from dividend declaration any month when there were no outstanding shares for a class of stock.
|
|
|
Common Stock |
|
|||||||||||||||||||||
|
|
|
Class P |
|
|
Class A |
|
|
Class T |
|
|
Class S |
|
|
Class D |
|
|
Class I |
|
||||||
|
Aggregate gross distributions declared per share |
|
$ |
0.3200 |
|
|
$ |
0.2700 |
|
|
$ |
0.2700 |
|
|
$ |
— |
|
|
$ |
0.2700 |
|
|
$ |
0.2700 |
|
|
Stockholder servicing fee per share |
|
N/A |
|
|
N/A |
|
|
|
0.0349 |
|
|
|
— |
|
|
|
0.0103 |
|
|
N/A |
|
|||
|
Net distributions declared per share |
|
$ |
0.3200 |
|
|
$ |
0.2700 |
|
|
$ |
0.2351 |
|
|
$ |
— |
|
|
$ |
0.2597 |
|
|
$ |
0.2700 |
|
As of December 31, 2019, distributions declared but not yet paid amounted to $1,699. No distributions were declared beginning in March 2020, as discussed below. During the six-months ended June 30, 2019, the Company had no shares of Class A, Class T, Class S, Class D or Class I common stock outstanding.
On March 24, 2020, the Board suspended the payment of distributions to the Company’s stockholders.
In determining to suspend the payment of distributions, the Board considered various factors, including the impact of the global COVID-19 pandemic on the economy, the inability to accurately calculate the Company’s NAV per share due to uncertainty, volatility and lack of liquidity in the market, the Company’s need for liquidity due to financing challenges related to additional collateral required by the banks that regularly finance the Company’s assets and these uncertain and rapidly changing economic conditions. While the Company did not calculate the NAV for the months of March through May 2020, the Advisor has determined since then that there has been reduced volatility in the market for the Company’s investments and some improvement in the U.S. economic outlook, and the Advisor resumed calculation of the NAV beginning as of June 30, 2020. However, the payment of distributions
14
InPoint Commercial Real Estate Income, Inc.
Notes to Consolidated Financial Statements
June 30, 2020
(Unaudited, dollar amounts in thousands, except share data)
remained suspended as of June 30, 2020. Please refer to “Note 13 – Subsequent Events” and Part II, “Item 1A – Risk Factors” for updates on the business after June 30, 2020 and discussion of risk factors related to the COVID-19 pandemic, respectively.
Note 7 – Net (Loss) Income Per Share
Basic earnings per share (“EPS”) are computed by dividing net income by the weighted average number of common shares outstanding for the period. Diluted EPS is computed by dividing net income by the common shares plus common share equivalents. The Company’s common share equivalents are unvested restricted shares. The Company excludes antidilutive restricted shares from the calculation of weighted-average shares for diluted earnings per share. There were zero and 214 antidilutive restricted shares for the three and six months ended June 30, 2020. There were no antidilutive restricted shares for the three months and six months ended June 30, 2019. For further information about the Company’s restricted shares, see “Note 11 – Equity-Based Compensation.”
The following table is a summary of the basic and diluted net (loss) income per share computation for the three and six-months ended June 30, 2020 and 2019:
|
|
|
Three-months ended June 30, |
|
|
Six-months ended June 30, |
|
||||||||||
|
|
|
2020 |
|
|
2019 |
|
|
2020 |
|
|
2019 |
|
||||
|
Net income (loss) |
|
$ |
1,006 |
|
|
$ |
2,484 |
|
|
$ |
(36,852 |
) |
|
$ |
6,105 |
|
|
Weighted average shares outstanding, basic |
|
|
11,630,987 |
|
|
|
8,287,246 |
|
|
|
11,490,217 |
|
|
|
7,486,495 |
|
|
Dilutive effect of restricted stock |
|
|
317 |
|
|
|
234 |
|
|
|
— |
|
|
|
133 |
|
|
Weighted average shares outstanding, diluted |
|
|
11,631,304 |
|
|
|
8,287,480 |
|
|
|
11,490,217 |
|
|
|
7,486,628 |
|
|
Net income (loss) per share, basic and diluted |
|
$ |
0.09 |
|
|
$ |
0.30 |
|
|
$ |
(3.21 |
) |
|
$ |
0.82 |
|
Note 8 – Commitments and Contingencies
In the ordinary course of business, the Company may become subject to litigation, claims and regulatory matters. The Company has no knowledge of material legal or regulatory proceedings pending or known to be contemplated against the Company at this time.
The Company has made a commitment to advance additional funds under certain of its CRE loans if the borrower meets certain conditions. As of June 30, 2020, the Company had 22 of such loans with a total remaining future funding commitment of $59,278. As of December 31, 2019, the Company had 22 of such loans with a total remaining future funding commitment of $54,620. The Company advances future funds if the borrower meets certain requirements as specified in the individual loan agreements.
Note 9 – Segment Reporting
The Company has one reportable segment as defined by GAAP for the six months ended June 30, 2020 and 2019.
Note 10 – Transactions with Related Parties
As of June 30, 2020, the Advisor had invested $1,000 in the Company through the purchase of 40,040 Class P Shares. The purchase price per Class P Share for the Advisor’s investment was equal to $25.00, with no payment of selling commissions, dealer manager fees or organization and offering expenses. The Advisor has agreed pursuant to its subscription agreement that, for so long as it or its affiliate is serving as the Company’s advisor, (i) it will not sell or transfer at least 8,000 of the Class P Shares that it has purchased, accounting for $200 of its investment, to an unaffiliated third party; (ii) it will not be eligible to submit a request for these 40,040 Class P Shares pursuant to the SRP prior to the fifth anniversary of the date on which such Class P Shares were purchased (November 2021); and (iii) repurchase requests made for these Class P Shares will only be accepted (a) on the last business day of a calendar quarter, (b) after all repurchase requests from all other stockholders for such quarter have been accepted and (c) to the extent that such repurchases do not cause total repurchases in the quarter in which they are being repurchased to exceed that quarter’s repurchase cap.
As of June 30, 2020, Sound Point Capital Management, LP (“Sound Point”), an affiliate of the Sub-Advisor, had invested $3,000 in the Company through the purchase of 120,000 Class P Shares. The purchase price per Class P Share for this investment was $25.00, with no payment of selling commissions, dealer manager fees or organization and offering expenses. Sound Point has agreed pursuant
15
InPoint Commercial Real Estate Income, Inc.
Notes to Consolidated Financial Statements
June 30, 2020
(Unaudited, dollar amounts in thousands, except share data)
to its subscription agreement that, for so long as the Sub-Advisor or its affiliate is serving as the Company’s sub-advisor, (i) it will not be eligible to submit a request for the repurchase of these 120,000 Class P Shares pursuant to the SRP prior to the fifth anniversary of the date on which such Class P Shares were purchased (November 2021); and (ii) repurchase requests made for these Class P Shares will only be accepted (a) on the last business day of a calendar quarter, (b) after all repurchase requests from all other stockholders for such quarter have been accepted and (c) to the extent that such repurchases do not cause total repurchases in the quarter in which they are being repurchased to exceed that quarter’s repurchase cap.
The following table summarizes the Company’s related party transactions for the three and six-months ended June 30, 2020 and 2019 and the amount due to related parties at June 30, 2020 and December 31, 2019:
|
|
|
Three-months ended June 30, |
|
|
Six-months ended June 30, |
|
|
Payable as of June 30, |
|
|
Payable as of December 31, |
|
||||||||||||
|
|
|
2020 |
|
|
2019 |
|
|
2020 |
|
|
2019 |
|
|
2020 |
|
|
2019 |
|
||||||
|
Organization and offering expense reimbursement(1) |
|
$ |
10 |
|
|
$ |
155 |
|
|
$ |
70 |
|
|
$ |
267 |
|
|
$ |
— |
|
|
$ |
17 |
|
|
Selling commissions and dealer manager fee(2) |
|
|
— |
|
|
|
3,132 |
|
|
|
758 |
|
|
|
5,617 |
|
|
|
— |
|
|
|
— |
|
|
Advisory fee(3) |
|
|
1,557 |
|
|
|
1,954 |
|
|
|
2,401 |
|
|
|
3,485 |
|
|
|
519 |
|
|
|
— |
|
|
Loan fees(4) |
|
|
299 |
|
|
|
— |
|
|
|
1,093 |
|
|
|
— |
|
|
|
763 |
|
|
|
408 |
|
|
Accrued stockholder servicing fee(5) |
|
|
— |
|
|
|
— |
|
|
|
446 |
|
|
|
— |
|
|
|
706 |
|
|
|
273 |
|
|
Operating expense reimbursement to advisor (6) |
|
|
— |
|
|
|
3 |
|
|
|
— |
|
|
|
5 |
|
|
|
— |
|
|
|
— |
|
|
Total |
|
$ |
1,866 |
|
|
$ |
5,244 |
|
|
$ |
4,768 |
|
|
$ |
9,374 |
|
|
$ |
1,988 |
|
|
$ |
698 |
|
|
(1) |
The Company reimburses the Advisor, the Sub-Advisor and their respective affiliates for costs and other expenses related to the Private Offering, provided that aggregate reimbursements of such costs and expenses shall not exceed the organization and offering expenses paid by investors in connection with the sale of Class P Shares in the Private Offering. The Company also reimburses the Advisor, the Sub-Advisor and their respective affiliates for costs and other expenses related to the IPO, provided the Advisor has agreed to reimburse the Company to the extent that the organization and offering expenses that the Company incurs exceeds 15% of its gross proceeds from the IPO. For the Private Offering, offering costs were offset against stockholders’ equity when paid. For the IPO, offering costs are offset against stockholders’ equity when incurred. |
|
(2) |
The Dealer Manager received selling commissions up to 5%, and a dealer manager fee up to 3%, of the transaction price for each Class P Share sold in the Private Offering, the majority of which was paid to third-party broker-dealers. For the IPO, the Dealer Manager is entitled to receive (a) upfront selling commissions of up to 6.0%, and upfront dealer manager fees of up to 1.25%, of the transaction price of each Class A share sold in the primary offering, however such amounts may vary at certain participating broker-dealers provided that the sum will not exceed 7.25% of the transaction price; (b) upfront selling commissions of up to 3.0%, and upfront dealer manager fees of 0.5%, of the transaction price of each Class T share sold in the primary offering, however such amounts may vary at certain participating broker-dealers provided that the sum will not exceed 3.5% of the transaction price; and (c) upfront selling commissions of up to 3.5% of the transaction price of each Class S share sold in the primary offering. No upfront selling commissions or dealer manager fees are paid with respect to purchases of Class D shares, Class I shares or shares of any class sold pursuant to the DRP. |
16
InPoint Commercial Real Estate Income, Inc.
Notes to Consolidated Financial Statements
June 30, 2020
(Unaudited, dollar amounts in thousands, except share data)
|
assets, paid quarterly in arrears, and (ii) following the NAV Pricing Date, 1/12th of 1.25% per annum of the gross value of the Company’s assets, paid monthly in arrears, provided that any such monthly payment shall not exceed 1/12th of 2.5% of the Company’s NAV; and (2) the performance component of the advisory fee is calculated and paid annually, such that for any year in which the Company’s total return per share exceeds 7% per annum, the Advisor will receive 20% of the excess total return allocable to shares of the Company’s common stock; provided that in no event will the performance fee exceed 15% of the aggregate total return allocable to shares of the Company’s common stock for such year. For the six months ended June 30, 2020, the Advisor waived $874 of the fixed component of the advisory fees. |
|
(4) |
Effective July 17, 2019, the Company pays the Advisor all new loan origination and administrative fees related to CRE loans held for investment, to the extent that such fees are paid by the borrower. |
|
(5) |
Subject to the Financial Industry Regulatory Authority, Inc. limitations on underwriting compensation, the Company pays the Dealer Manager selling commissions over time as stockholder servicing fees for ongoing services rendered to stockholders by participating broker-dealers or broker-dealers servicing stockholders’ accounts as follows: (a) for Class T shares only, 0.85% per annum of the NAV of the Class T shares; (b) for Class S shares only, 0.85% per annum of the aggregate NAV for the Class S shares; and (c) for Class D shares only, 0.25% per annum of the aggregate NAV for the Class D shares. The Company will cease paying the stockholder servicing fee with respect to any Class T share, Class S share or Class D share held in a stockholder’s account upon the occurrence of certain events. The Company accrues the full cost of the stockholder servicing fee as an offering cost at the time the Company sells Class T, Class S, and Class D shares. The Dealer Manager does not retain any of these fees, all of which are retained by, or reallowed (paid) to, participating broker-dealers and servicing broker-dealers for ongoing stockholder services performed by such broker-dealers. |
|
(6) |
The Company reimburses the Advisor for expenses that it (or the Sub-Advisor acting on the Advisor’s behalf) incurs in connection with providing services to the Company, provided that the Company does not reimburse overhead costs, including rent and utilities or personnel costs (including salaries, bonuses, benefits and severance payments) and the Company will only reimburse the Advisor for fees payable to its affiliates if they are incurred for legal or marketing services rendered on the Company’s behalf. |
Note 11 – Equity-Based Compensation
On December 2, 2019, the Company granted each of its three independent directors 399 restricted Class I shares for a total of 1,197 Class I shares with a grant date fair value of $25.07 per share and a total value of $30. The restricted Class I shares vest in equal one-third increments on December 2, 2020, 2021 and 2022. On January 7, 2019, the Company granted 400 restricted Class P Shares to each of its three independent directors for a total of 1,200 Class P Shares with a grant date fair value of $25.00 per share and a total value of $30. These restricted Class P Shares vest in equal one-third increments on January 7, 2020, 2021 and 2022. On March 1, 2018, the Company granted 400 restricted Class P Shares to each of its three independent directors for a total of 1,200 Class P Shares with a grant date fair value of $25.00 per share and a total value of $30. These restricted Class P Shares vest in equal one-third increments on March 1, 2019, 2020 and 2021.
Under the Company’s Independent Director Restricted Share Plan, restricted shares generally vest over a three-year vesting period from the date of the grant, subject to the specific terms of the grant. Restricted shares are included in common stock outstanding on the grant date. The grant-date value of the restricted shares is amortized over the vesting period representing the requisite service period. Compensation expense associated with the restricted shares issued to the independent directors was $8 and $16, in the aggregate, for the three-months and six-months ended June 30, 2020, respectively. Compensation expense associated with the restricted shares issued to the independent directors was $5 and $10 for the three and six-months ended June 30, 2019. As of June 30, 2020, the Company had $46 of unrecognized compensation expense related to the unvested restricted shares, in the aggregate. The weighted average remaining period that compensation expense related to unvested restricted shares will be recognized is 1.54 years. The total fair value at the vesting date for restricted shares that vested during the six-months ended June 30, 2020 and 2019 was $17 and $10, respectively. There were no restricted shares that vested during the three-months ended June 30, 2020 and 2019.
17
InPoint Commercial Real Estate Income, Inc.
Notes to Consolidated Financial Statements
June 30, 2020
(Unaudited, dollar amounts in thousands, except share data)
A summary table of the status of the restricted shares is presented below:
|
|
|
Restricted Shares |
|
|
Weighted Average Grant Date Fair Value Per Share |
|
||
|
Outstanding at December 31, 2019 |
|
|
3,197 |
|
|
$ |
25.02 |
|
|
Granted |
|
|
— |
|
|
|
— |
|
|
Vested |
|
|
(800 |
) |
|
|
25.00 |
|
|
Converted |
|
|
— |
|
|
|
— |
|
|
Forfeited |
|
|
— |
|
|
|
— |
|
|
Outstanding at June 30, 2020 |
|
|
2,397 |
|
|
$ |
25.03 |
|
Note 12 – Fair Value of Financial Instruments
The following table presents the Company’s financial instruments measured on a recurring basis and carried at fair value in the consolidated balance sheets by their level in the fair value hierarchy (see Note 2 – Summary of Significant Accounting Policies included in the Annual Report) as of June 30, 2020 and December 31, 2019:
|
|
|
June 30, 2020 |
|
|
December 31, 2019 |
|
||||||||||||||||||||||||||
|
|
|
Total |
|
|
Level I |
|
|
Level II |
|
|
Level III |
|
|
Total |
|
|
Level I |
|
|
Level II |
|
|
Level III |
|
||||||||
|
Real estate securities |
|
$ |
73,903 |
|
|
|
— |
|
|
$ |
73,903 |
|
|
|
— |
|
|
$ |
157,869 |
|
|
|
— |
|
|
$ |
157,869 |
|
|
|
— |
|
The Company did not transfer any assets within fair value levels during the three and six months ended June 30, 2020 and 2019.
The following table presents the Company’s financial instruments measured on a non-recurring basis and carried at fair value in the consolidated balance sheet by their level in the fair value hierarchy as of June 30, 2020 and December 31, 2019:
|
|
|
June 30, 2020 |
|
|
December 31, 2019 |
|
||||||||||||||||||||||||||
|
|
|
Total |
|
|
Level I |
|
|
Level II |
|
|
Level III |
|
|
Total |
|
|
Level I |
|
|
Level II |
|
|
Level III |
|
||||||||
|
Collateral dependent impaired loans: |
|
|
|
|
|
|
|
|
|
|
|
|
|
|
|
|
|
|
|
|
|
|
|
|
|
|
|
|
|
|
|
|
|
Impaired first mortgage loan |
|
$ |
20,235 |
|
|
|
— |
|
|
|
— |
|
|
$ |
20,235 |
|
|
$ |
— |
|
|
|
— |
|
|
|
— |
|
|
$ |
— |
|
|
Impaired credit loan |
|
$ |
1,500 |
|
|
|
— |
|
|
|
— |
|
|
$ |
1,500 |
|
|
$ |
— |
|
|
|
— |
|
|
|
— |
|
|
$ |
— |
|
During the six months ended June 30, 2020, the Company recorded impairment charges of $4,265 and $1,500 each on one first mortgage loan and one credit loan, respectively, in accordance with the Company’s allowance for loan loss policy. The impairment charges were based on the estimated fair value of the underlying collateral. For further details on these loans, see discussion at “Note 3 – Commercial Mortgage Loans Held for Investment.”
For collateral dependent impaired loans, these loans are recorded at the estimated fair value of collateral less the estimated cost to sell. If an appraised value is not available, the Advisor generally will use the income approach through internally developed valuation models to estimate the fair value of the collateral for such loans.
The following table presents the valuation methods and significant unobservable inputs used to value Level 3 assets measured at fair value on a nonrecurring basis at June 30, 2020:
18
InPoint Commercial Real Estate Income, Inc.
Notes to Consolidated Financial Statements
June 30, 2020
(Unaudited, dollar amounts in thousands, except share data)
|
|
Valuation Method |
|
Unobservable Inputs |
|
Range of Quantitative Values |
|
||
|
|
Market approach |
|
Appraised Value (1) |
|
$ |
21,600 |
|
|
|
Impaired first mortgage loan |
|
Market approach |
|
Costs to Foreclose and Sell |
|
$ |
1,365 |
|
|
Impaired credit loan |
|
Market approach |
|
Market Price of Single Asset Hotel Mezzanine CMBS |
|
50% of Par |
|
|
|
____________ |
|
|
|
|
|
|
|
|
|
(1) |
The Company obtained a third-party appraisal for the collateral on the impaired first mortgage loan and used this value rather than an indicative market value of the collateral used to establish the estimated fair value as of March 31, 2020. |
GAAP requires the disclosure of fair value information about financial instruments, whether or not they are recognized at fair value in the consolidated balance sheets, for which it is practicable to estimate that value. The following table details the carrying amount and estimated fair value of the Company’s financial instruments at the dates below:
|
|
June 30, 2020 |
|
|
December 31, 2019 |
|
||||||||||
|
|
Carrying Amount |
|
|
Estimated Fair Value |
|
|
Carrying Amount |
|
|
Estimated Fair Value |
|
||||
|
Financial assets |
|
|
|
|
|
|
|
|
|
|
|
|
|
|
|
|
Cash and cash equivalents |
$ |
39,533 |
|
|
$ |
39,533 |
|
|
$ |
37,210 |
|
|
$ |
37,210 |
|
|
Restricted cash |
|
404 |
|
|
|
404 |
|
|
|
429 |
|
|
|
429 |
|
|
Commercial mortgage loans, net |
|
498,141 |
|
|
|
505,446 |
|
|
|
504,702 |
|
|
|
511,734 |
|
|
Total |
$ |
538,078 |
|
|
$ |
545,383 |
|
|
$ |
542,341 |
|
|
$ |
549,373 |
|
|
Financial liabilities |
|
|
|
|
|
|
|
|
|
|
|
|
|
|
|
|
Repurchase agreements - real estate securities |
$ |
45,328 |
|
|
$ |
45,328 |
|
|
$ |
107,489 |
|
|
$ |
107,489 |
|
|
Repurchase agreements - commercial mortgage loans |
|
327,928 |
|
|
|
327,928 |
|
|
|
335,805 |
|
|
|
335,805 |
|
|
Total |
$ |
373,256 |
|
|
$ |
373,256 |
|
|
$ |
443,294 |
|
|
$ |
443,294 |
|
The following describes the Company’s methods for estimating the fair value for financial instruments:
|
• |
The estimated fair value of cash and cash equivalents and restricted cash was based on the bank balance and was a Level 1 fair value measurement. |
|
• |
The estimated fair value of commercial mortgage loans, net is a Level 3 fair value measurement. The Sub-Advisor estimates the fair values of commercial loans by analyzing interest rate spreads on loans based on various factors including capitalization rates, occupancy rates, sponsorship, geographic concentration, collateral type, market conditions and actions of other lenders. |
|
• |
The estimated fair value of repurchase agreements is a Level 3 fair value measurement based on an expected present value technique. This method discounts future estimated cash flows using rates the Company determined best reflect current market interest rates that would be offered for repurchase agreements with similar characteristics and credit quality. |
19
InPoint Commercial Real Estate Income, Inc.
Notes to Consolidated Financial Statements
June 30, 2020
(Unaudited, dollar amounts in thousands, except share data)
The Company has evaluated subsequent events through August 12, 2020, the date the financial statements were issued. The following are updates on the Company’s portfolio and operations since June 30, 2020, including with respect to the ongoing COVID-19 pandemic.
Amendment of the Distribution Reinvestment Plan
On July 14, 2020, in anticipation of the potential future payments of distributions, the Board approved an amended and restated DRP, which became effective on August 7, 2020. As amended, stockholders who hold Class P Shares may now elect to participate in the DRP, and cash distributions with respect to Class P Shares will be applied to the purchase of Class I shares once the Company resumes the DRP, which remains suspended.
Distributions
The Board has authorized distributions for each class of its common stock in the amount per share set forth below:
|
|
|
Common Stock |
|
|||||||||||||||||||||
|
|
|
Class P |
|
|
Class A |
|
|
Class T |
|
|
Class S |
|
|
Class D |
|
|
Class I |
|
||||||
|
Aggregate gross distributions declared per share |
|
$ |
0.0715 |
|
|
$ |
0.0715 |
|
|
$ |
0.0715 |
|
|
$ |
— |
|
|
$ |
0.0715 |
|
|
$ |
0.0715 |
|
|
Stockholder servicing fee per share |
|
N/A |
|
|
N/A |
|
|
|
0.0155 |
|
|
|
— |
|
|
|
0.0045 |
|
|
N/A |
|
|||
|
Net distributions declared per share |
|
$ |
0.0715 |
|
|
$ |
0.0715 |
|
|
$ |
0.0560 |
|
|
$ |
— |
|
|
$ |
0.0670 |
|
|
$ |
0.0715 |
|
The net distributions for each class of common stock (which represents the gross distributions less stockholder servicing fees for the applicable class of common stock) are payable to stockholders of record as of the close of business on July 31, 2020 and will be paid on or about August 18, 2020.
Cash and Cash Equivalents, and Restricted Cash
As of July 31, 2020, the Company’s cash and cash equivalents, and restricted cash balances were $33,846 and $404, respectively.
20
Item 2. Management’s Discussion and Analysis of Financial Condition and Results of Operations
Certain statements in this Quarterly Report on Form 10-Q constitute “forward-looking statements” within the meaning of Section 27A of the Securities Act of 1933, as amended (the “Securities Act”), and Section 21E of the Securities Exchange Act of 1934, as amended (the “Exchange Act”). Words such as “may,” “could,” “should,” “expect,” “intend,” “plan,” “goal,” “seek,” “anticipate,” “believe,” “estimate,” “predict,” “variables,” “potential,” “continue,” “expand,” “maintain,” “create,” “strategies,” “likely,” “will,” “would” and variations of these terms and similar expressions, or the negative of these terms or similar expressions, are intended to identify forward-looking statements.
These forward-looking statements are not historical facts but reflect the intent, belief or current expectations of the management of InPoint Commercial Real Estate Income, Inc. (which we refer to herein as the “Company,” “we,” “our” or “us”) based on their knowledge and understanding of the business and industry, the economy and other future conditions. These statements are not guarantees of future performance, and we caution stockholders not to place undue reliance on forward-looking statements. Actual results may differ materially from those expressed or forecasted in the forward-looking statements due to a variety of risks, uncertainties and other factors, including but not limited to the factors listed and described under “Risk Factors” in this Quarterly Report on Form 10-Q, our Quarterly Report on Form 10-Q for the quarter ended March 31, 2020, as filed with the Securities and Exchange Commission (the “SEC”) on May 13, 2020 and in our Annual Report on Form 10-K for the year ended December 31, 2019 (the “Annual Report”), as filed with the SEC on March 11, 2020, and the factors described below:
|
• |
Market disruptions caused by the economic effects of or uncertainties surrounding the future effects of the COVID-19 pandemic or otherwise have adversely impacted aspects of our operating results and operating condition and may continue to do so, or these effects may become more severe, e.g., if COVID-19 cases increase nationally or in markets that affect the value of our investments; |
|
• |
If we cannot generate sufficient cash flow from operations to fully fund distributions, some or all of our distributions may be paid from other sources, including from the proceeds from sales of our common stock, which will reduce the amount of cash we ultimately have to invest in assets; |
|
• |
There is no current public trading market for our common stock, and we do not expect that such a market will ever develop. Therefore, repurchase of shares by us will likely be the only way for stockholders to dispose of their shares, and our share repurchase program (the “SRP”) is currently suspended and, if reinstated it may still be suspended again in the future; |
|
• |
Even if our stockholders are able to sell their shares by our SRP, or otherwise, they may not be able to recover the amount of their investment in our shares; |
|
• |
Our charter generally limits the total amount we may borrow to 300% of our net assets, equivalent to 75% of the costs of our assets; |
|
• |
Inland InPoint Advisor, LLC (our “Advisor”) and SPCRE InPoint Advisors, LLC (our “Sub-Advisor”) may face conflicts of interest in allocating personnel and resources between their affiliates; |
|
• |
We do not have arm’s-length agreements with our Advisor, our Sub-Advisor or any affiliates of our Advisor or Sub-Advisor; |
|
• |
If we fail to continue to qualify as a real estate investment trust (“REIT”), our operations and distributions to stockholders will be adversely affected; and |
|
• |
The COVID-19 pandemic has had a significant and adverse effect on the economy and our investments backed by hospitality and retail properties, and its future impacts are uncertain and hard to measure but may cause a material adverse effect on our business and results of operations. |
Forward-looking statements in this Quarterly Report on Form 10-Q reflect our management’s view only as of the date of this Quarterly Report on Form 10-Q, and may ultimately prove to be incorrect or false. We undertake no obligation to update or revise forward-looking statements to reflect changed assumptions, the occurrence of unanticipated events or changes to future operating results except as required by applicable law. We intend for these forward-looking statements to be covered by the applicable safe harbor provisions created by Section 27A of the Securities Act and Section 21E of the Exchange Act.
The following discussion and analysis relate to the three and six-months ended June 30, 2020 and 2019 and as of June 30, 2020 and December 31, 2019. You should read the following discussion and analysis along with our consolidated financial statements and the related notes included in this Quarterly Report on Form 10-Q. Unless otherwise stated, all dollar amounts are stated in thousands, except share data.
21
We are a Maryland corporation formed on September 13, 2016 to originate, acquire and manage an investment portfolio of commercial real estate (“CRE”) investments primarily comprised of (i) CRE debt, including floating-rate first mortgage loans, subordinate mortgage and mezzanine loans, and participations in such loans and (ii) floating-rate CRE securities such as commercial mortgage-backed securities (“CMBS”) and senior unsecured debt of publicly traded REITs. We may also invest in select equity investments in single-tenant, net leased properties. Substantially all of our business is conducted through InPoint Operating Partnership, LP (our “Operating Partnership”), of which we are the sole general partner. We are externally managed by our Advisor, an indirect subsidiary of Inland Real Estate Investment Corporation. Our Advisor has engaged the Sub-Advisor, a subsidiary of Sound Point CRE Management, LP, to perform certain services on behalf of the Advisor for us.
We have operated in a manner that allows us to qualify as a REIT for U.S. federal income tax purposes commencing with the taxable year ending December 31, 2017. Among other requirements, REITs are required to distribute to stockholders at least 90% of their annual REIT taxable income (computed without regard to the dividends-paid deduction and excluding net capital gain).
On October 25, 2016, we commenced a private offering (the “Private Offering”) of up to $500,000 in shares of our Class P common stock (“Class P Shares”). Inland Securities Corporation, an affiliate of our Advisor (the “Dealer Manager”), was our dealer manager for the Private Offering. On June 28, 2019, we terminated the Private Offering in anticipation of selling shares in the IPO (described below). We continued to accept Private Offering subscription proceeds through July 16, 2019 from subscription agreements executed no later than June 28, 2019. As of July 16, 2019, we had received and accepted investors’ subscriptions for and issued 10,258,094 Class P Shares in the Private Offering, resulting in gross proceeds of $276,681.
On May 3, 2019, we commenced an initial public offering of up to $2,350,000 in shares of our Class A, Class T, Class S, Class D and Class I common stock (the “IPO”) pursuant to our Registration Statement on Form S-11 (File No. 333-230465). Prior to July 17, 2019 (the “NAV Pricing Date”), the purchase price for each class of our common stock in our primary offering was $25.00 per share, plus applicable upfront selling commissions and dealer manager fees, and the per share purchase price for shares of our common stock in our distribution reinvestment plan (the “DRP”) was $25.00. Following the NAV Pricing Date, the purchase price per share for each class of common stock will vary and will generally equal our prior month’s net asset value (“NAV”) per share, as determined monthly, plus applicable upfront selling commissions and dealer manager fees. The Dealer Manager serves as our exclusive dealer manager for the IPO on a best efforts basis. As of August 11, 2020, we had received and accepted investors’ subscriptions for and issued 653,566 Class A shares, 397,251 Class T shares, 50,081 Class D shares and 377,105 of Class I shares of common stock, respectively, in the IPO, resulting in gross proceeds of $38,326. As of August 11, 2020, $2.31 billion of our shares of common stock remained to be sold in the IPO.
On March 24, 2020, our board of directors (the “Board”) suspended (i) the sale of shares in our IPO, (ii) the operation of the SRP, (iii) the payment of distributions to our stockholders, and (iv) the operation of the DRP, effective as of April 6, 2020.
In determining to suspend our IPO, the SRP, the payment of distributions and the DRP, our Board considered various factors, including the impact of the global COVID-19 pandemic on the economy, the inability to accurately calculate our NAV per share due to uncertainty, volatility and lack of liquidity in the market, our need for liquidity due to financing challenges related to additional required by the banks that regularly finance our assets and these uncertain and rapidly changing economic conditions. While we did not calculate the NAV for the months of March through May 2020, our Advisor determined since then that there has been reduced volatility in the market for our investments and some improvement in the U.S. economic outlook, and our Advisor resumed calculation of the NAV beginning as of June 30, 2020 and our Board authorized a distribution on July 30, 2020 to stockholders of record as of July 31, 2020. However, our IPO, DRP and SRP remained suspended. We are working toward and intend to restart the IPO and the DRP subject to receiving the required regulatory approvals to do so. We will continue to closely monitor the pandemic, the economy and the markets for the Company’s investments in order to determine an appropriate time to resume our IPO, the DRP and the SRP. Please refer to “Note 13 – Subsequent Events” and Part II, “Item 1A – Risk Factors” for updates on our business after June 30, 2020 and discussion of risk factors related to the COVID-19 pandemic, respectively.
Recent Developments
We continue to evaluate the economic impact from the COVID-19 pandemic and the resulting temporary closures of non-essential businesses. Since June 30, 2020 and through the filing of this Quarterly Report on Form 10-Q on August 12, 2020, we have not closed any new investments, and we are focused on properly managing existing investments and executing on loan commitments. With regard to portfolio management, we are partnering with our borrowers to address the impacts of COVID-19 on their respective businesses. To the extent that certain borrowers are experiencing significant financial dislocation, for a limited period of time we may consider the use of interest and other reserves or replenishment obligations of the borrower or guarantors to meet current interest payment obligations.
22
In July, we published the NAV as of June 30, 2020. The NAV per share declined approximately 14% from the last published NAV with the decline being primarily attributable to the economic impact of COVID-19. The most significant impact was in the valuation of CMBS primarily secured by hospitality properties. See “Note 4 – Real Estate Securities”.
Loans and Warehouse Financing.
As of June 30, 2020, our loan portfolio, which was comprised of 33 loans with a current principal balance of $504.5 million, was diversified across property types, which may be advantageous in times of disruption. Our portfolio was comprised of approximately 15% retail and hospitality properties, which were immediately impacted by the necessary temporary closure of non-essential businesses and stay-at-home orders. The remaining 85% of our portfolio was made up of more stable asset classes, such as multifamily, office and industrial, which appear to be less subject to performance risk from the pandemic. We have closely monitored the loans in our portfolio and have communicated with borrowers to ascertain their ability to collect rent from tenants and, therefore, the potential to fulfill their loan obligations.
As of July 31, 2020, $458.1 million of our loan portfolio was pledged as collateral for approximately $324.3 million of borrowings. In July 2020, all borrowers, except for one, made their monthly debt service payments in accordance with the current terms of their respective loans.
We have recorded a $4.3 million loan loss reserve for our non-performing loan, which is secured by the Renaissance Chicago O’Hare Suites Hotel, a full-service 362-room hotel located in Chicago, Illinois. See “Note 3 – Commercial Mortgage Loans Held for Investment” in the notes to our consolidated financial statements above. We have declared the loan in default and are pursuing all possible remedies and negotiating with the borrower, which we think is likely to result in our owning and operating the property securing the loan. The loan is secured by the borrower’s ground lease interest, as opposed to fee title to the land. Current annual rent under the ground lease is approximately $1.6 million on a net basis, with the tenant responsible for all operating expenses, including property taxes. The lease has a 10% rental increase every five years with the next increase scheduled to occur in April 2023. This ground lease runs through March 2098.
We believe the property is well-located, and it underwent an extensive renovation in 2015 and 2016. Along with the hospitality sector as a whole, the property has been negatively impacted by the COVID-19 pandemic. We believe the property in its current operating condition has a value of approximately $20.2 million which should appreciate, assuming economic activity returns to pre-pandemic levels. We estimate that initial operations in the COVID-19 environment will produce a net quarterly operating loss of approximately $750,000 but should return to a positive cash flow when travel returns to normal levels.
We fund our first mortgage loan portfolio with our two master repurchase agreements. See “Note 5 – Repurchase Agreements” in the notes to our consolidated financial statements above. During the COVID-19 pandemic we have continued to access our master repurchase agreement financing and anticipate we will continue to do so.
CMBS and Master Repurchase Facilities.
As of June 30, 2020, we held CMBS with a par value of $93.0 million and a fair value of $73.9 million. The COVID-19 pandemic significantly impacted the price and volatility of price changes for CMBS during the first quarter of 2020. In June, we observed the price volatility had declined and we observed some improvement in the value of our CMBS.
Throughout the CMBS market volatility, we continued to have access to financing under our master repurchase agreements. As of June 30, 2020, our borrowings on master repurchase agreements were $45.3 million. As of July 31, 2020, we held CMBS with a par value of $93.0 million and had outstanding repurchase agreement balances of $37.4 million. As part of our financing relationships, we were required to meet certain financial covenants and, at times, have been required to post additional cash or securities as margin to secure our borrowing positions. We were in compliance with our debt covenants and have posted any required margin as may have been required through August 12, 2020, the date we filed this Quarterly Report on Form 10-Q.
Cash and Unencumbered Assets.
As of June 30, 2020 we held cash of $39.5 million and $41.0 million of unencumbered assets that are free and clear of any lender claims. As of July 31, 2020, we held cash of $33.8 million and $41.0 million of unencumbered assets.
23
Significant Accounting Policies and Use of Estimates
Disclosures discussing all significant accounting policies are set forth in our Annual Report, as filed with the SEC on March 11, 2020, under the heading “Note 2 – Summary of Significant Accounting Policies.” There have been no changes to our significant accounting policies for the six-months ended June 30, 2020.
Portfolio
We began operations in October 2016 and our objective is to originate, acquire and manage an investment portfolio of CRE debt and CRE securities that is primarily floating rate and diversified based on the type and location of collateral securing the underlying CRE debt and CRE securities. We anticipate our investment portfolio will be less diversified and have higher concentrations in asset class, collateral type and geographic location until our capital raise reaches levels that will allow for greater diversification.
The charts below summarize our portfolio as a percentage of par value by type of rate, loan type, collateral type and geographical region as of June 30, 2020 and December 31, 2019:
Floating Vs. Fixed Rate:
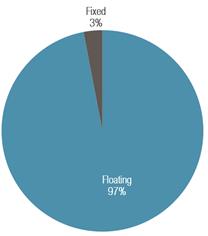
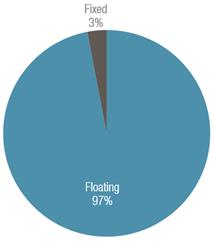
Investments by Loan Type:
|
June 30, 2020 |
December 31, 2019 |
|
|
|
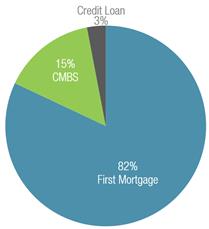
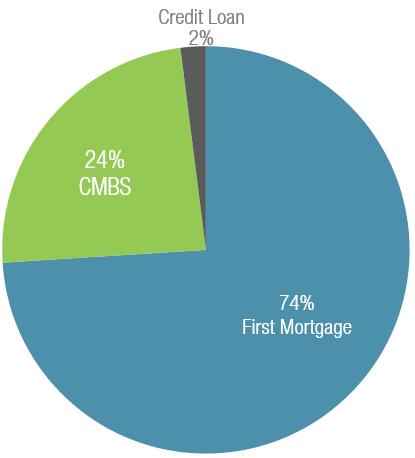
24
|
June 30, 2020 |
December 31, 2019 |
|
|
|
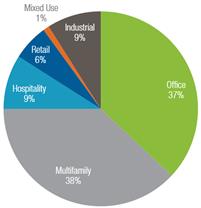
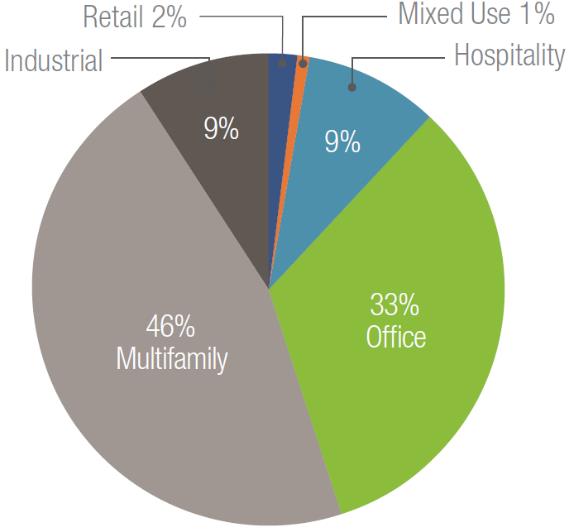
Investments by Region:
|
June 30, 2020 |
December 31, 2019
|
|
|
|
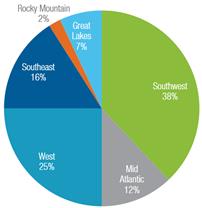
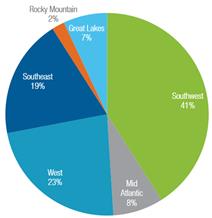
25
An investment’s region is defined according to the below map based on the location of underlying property.
The changes in our portfolio as of June 30, 2020 compared to December 31, 2019 were primarily due to loans that were paid off and sold during the period, partially offset by the new loans originated during the period. Due to the small number of investments in our portfolio, the changes in the portfolio composition may be significant. We anticipate that these changes will become less significant as our portfolio increases in size.
Commercial Mortgage Loans Held for Investment
|
|
As of June 30, 2020 |
|
|
As of December 31, 2019 |
|
||
|
|
|
|
|
|
|
|
|
|
Principal balance of first mortgage loans |
$ |
488,012 |
|
|
$ |
489,902 |
|
|
Number of first mortgage loans |
|
30 |
|
|
|
29 |
|
|
Principal balance of credit loans |
$ |
16,500 |
|
|
$ |
16,500 |
|
|
Number of credit loans |
|
3 |
|
|
|
3 |
|
|
Total balance of loans |
$ |
504,512 |
|
|
$ |
506,402 |
|
|
Total number of loans |
|
33 |
|
|
|
32 |
|
|
All-in yield (1) |
|
5.3 |
% |
|
|
5.7 |
% |
|
____________ |
|
|
|
|
|
|
|
|
(1) |
All-in yield is the present value of all future principal and interest payments on the loan and does not include any origination fees or deferred commitment fees. |
The increase in the size of our portfolio is due to investing capital received from the IPO and from increased leverage as we executed on our business strategy. The change in the all-in yield was not significant.
26
The table below presents information for each of our commercial mortgage loans as of June 30, 2020:
|
|
|
Origination Date |
|
Loan Type (1) |
|
Principal Balance |
|
|
Cash Coupon (2) |
|
|
All-in Yield (2) |
|
|
Original Maturity (3) |
|
Maximum Maturity (3) |
|
State |
|
Property Type |
|
LTV (4) |
|
|
Risk Rating (5) |
|
||||
|
1 |
|
12/12/17 |
|
First mortgage |
|
$ |
14,650 |
|
|
L+4.70% |
|
|
5.9% |
|
|
1/9/21 |
|
1/9/23 |
|
HI |
|
Office |
|
|
67 |
% |
|
|
2 |
|
|
|
2 |
|
12/13/17 |
|
First mortgage |
|
|
16,293 |
|
|
L+4.50% |
|
|
5.7% |
|
|
12/9/20 |
|
12/9/22 |
|
VA |
|
Office |
|
|
55 |
% |
|
|
4 |
|
|
|
3 |
|
3/22/18 |
|
First mortgage |
|
|
12,336 |
|
|
L+3.75% |
|
|
5.1% |
|
|
4/9/21 |
|
4/9/23 |
|
CO |
|
Retail |
|
|
74 |
% |
|
|
3 |
|
|
|
4 |
|
5/4/18 |
|
First mortgage |
|
|
31,000 |
|
|
L+4.00% |
|
|
5.5% |
|
|
5/9/21 |
|
5/9/23 |
|
PA |
|
Industrial |
|
|
64 |
% |
|
|
2 |
|
|
|
5 |
|
5/17/18 |
|
First mortgage |
|
|
6,962 |
|
|
L+4.50% |
|
|
6.2% |
|
|
6/9/21 |
|
6/9/23 |
|
NC |
|
Multifamily |
|
|
54 |
% |
|
|
3 |
|
|
|
6 |
|
8/21/18 |
|
First mortgage |
|
|
16,584 |
|
|
L+3.65% |
|
|
5.5% |
|
|
9/9/21 |
|
9/9/23 |
|
AZ |
|
Multifamily |
|
|
80 |
% |
|
|
2 |
|
|
|
7 |
|
9/7/18 |
|
First mortgage |
|
|
24,142 |
|
|
L+3.75% |
|
|
5.6% |
|
|
9/9/21 |
|
9/9/23 |
|
TX |
|
Office |
|
|
73 |
% |
|
|
2 |
|
|
|
8 |
|
9/19/18 |
|
First mortgage |
|
|
8,531 |
|
|
L+3.70% |
|
|
5.7% |
|
|
10/9/21 |
|
10/9/23 |
|
TX |
|
Multifamily |
|
|
69 |
% |
|
|
2 |
|
|
|
9 |
|
10/30/18 |
|
First mortgage |
|
|
6,860 |
|
|
L+3.85% |
|
|
5.7% |
|
|
11/9/21 |
|
11/9/23 |
|
TX |
|
Multifamily |
|
|
76 |
% |
|
|
2 |
|
|
|
10 |
|
11/16/18 |
|
First mortgage |
|
|
5,200 |
|
|
L+3.90% |
|
|
5.9% |
|
|
12/9/21 |
|
12/9/23 |
|
CA |
|
Multifamily |
|
|
64 |
% |
|
|
3 |
|
|
|
11 (6) |
|
12/13/18 |
|
First mortgage |
|
|
24,500 |
|
|
L+5.30% |
|
|
0.0% |
|
|
12/9/20 |
|
12/9/21 |
|
IL |
|
Hospitality |
|
|
72 |
% |
|
|
5 |
|
|
|
12 (7) |
|
12/20/18 |
|
First mortgage |
|
|
16,278 |
|
|
L+4.20% |
|
|
6.2% |
|
|
1/9/22 |
|
1/9/24 |
|
AL |
|
Hospitality |
|
|
64 |
% |
|
|
4 |
|
|
|
13 |
|
1/24/19 |
|
First mortgage |
|
|
14,543 |
|
|
L+3.40% |
|
|
5.7% |
|
|
2/9/22 |
|
2/9/24 |
|
NV |
|
Multifamily |
|
|
76 |
% |
|
|
2 |
|
|
|
14 |
|
1/25/19 |
|
First mortgage |
|
|
11,013 |
|
|
L+3.45% |
|
|
5.4% |
|
|
2/9/22 |
|
2/9/24 |
|
IL |
|
Multifamily |
|
|
78 |
% |
|
|
2 |
|
|
|
15 |
|
4/11/19 |
|
First mortgage |
|
|
15,760 |
|
|
L+3.30% |
|
|
5.7% |
|
|
4/9/22 |
|
4/9/24 |
|
CA |
|
Industrial |
|
|
79 |
% |
|
|
2 |
|
|
|
16 |
|
4/25/19 |
|
First mortgage |
|
|
7,030 |
|
|
L+4.00% |
|
|
6.4% |
|
|
5/9/21 |
|
5/9/24 |
|
TX |
|
Multifamily |
|
|
58 |
% |
|
|
2 |
|
|
|
17 |
|
5/29/19 |
|
First mortgage |
|
|
24,000 |
|
|
L+3.25% |
|
|
5.7% |
|
|
6/9/22 |
|
6/9/24 |
|
TX |
|
Multifamily |
|
|
68 |
% |
|
|
3 |
|
|
|
18 |
|
5/31/19 |
|
First mortgage |
|
|
12,650 |
|
|
L+3.25% |
|
|
5.6% |
|
|
6/9/22 |
|
6/9/24 |
|
CA |
|
Multifamily |
|
|
70 |
% |
|
|
3 |
|
|
|
19 |
|
6/18/19 |
|
First mortgage |
|
|
43,045 |
|
|
L+2.75% |
|
|
4.7% |
|
|
7/9/22 |
|
7/9/24 |
|
TX |
|
Office |
|
|
72 |
% |
|
|
2 |
|
|
|
20 |
|
6/18/19 |
|
First mortgage |
|
|
6,350 |
|
|
L+3.60% |
|
|
5.7% |
|
|
7/9/22 |
|
7/9/24 |
|
CA |
|
Mixed Use |
|
|
54 |
% |
|
|
2 |
|
|
|
21 |
|
7/24/19 |
|
First mortgage |
|
|
14,000 |
|
|
L+3.95% |
|
|
5.9% |
|
|
8/9/21 |
|
8/9/22 |
|
CA |
|
Office |
|
|
77 |
% |
|
|
2 |
|
|
|
22 |
|
8/15/19 |
|
First mortgage |
|
|
7,374 |
|
|
L+4.20% |
|
|
6.6% |
|
|
9/9/22 |
|
9/9/24 |
|
TN |
|
Office |
|
|
45 |
% |
|
|
2 |
|
|
|
23 |
|
9/27/19 |
|
First mortgage |
|
|
14,900 |
|
|
L+3.10% |
|
|
4.6% |
|
|
10/9/23 |
|
10/9/24 |
|
CA |
|
Office |
|
|
75 |
% |
|
|
2 |
|
|
|
24 |
|
9/30/19 |
|
First mortgage |
|
|
30,000 |
|
|
L+3.30% |
|
|
5.0% |
|
|
10/9/22 |
|
10/9/24 |
|
TX |
|
Multifamily |
|
|
77 |
% |
|
|
2 |
|
|
|
25 |
|
10/4/19 |
|
First mortgage |
|
|
20,650 |
|
|
L+2.90% |
|
|
4.6% |
|
|
10/9/22 |
|
10/9/24 |
|
NC |
|
Office |
|
|
61 |
% |
|
|
2 |
|
|
|
26 |
|
10/30/19 |
|
First mortgage |
|
|
13,574 |
|
|
L+3.00% |
|
|
4.9% |
|
|
11/9/22 |
|
11/9/24 |
|
CA |
|
Multifamily |
|
|
80 |
% |
|
|
2 |
|
|
|
27 |
|
11/22/19 |
|
First mortgage |
|
|
32,632 |
|
|
L+3.00% |
|
|
4.9% |
|
|
12/9/23 |
|
12/9/24 |
|
AZ |
|
Multifamily |
|
|
80 |
% |
|
|
2 |
|
|
|
28 |
|
2/6/20 |
|
First mortgage |
|
|
19,835 |
|
|
L+3.30% |
|
|
4.9% |
|
|
2/9/23 |
|
2/9/25 |
|
NJ |
|
Office |
|
|
69 |
% |
|
|
2 |
|
|
|
29 |
|
2/20/20 |
|
First mortgage |
|
|
8,000 |
|
|
L+3.85% |
|
|
5.4% |
|
|
3/9/23 |
|
3/9/25 |
|
CA |
|
Retail |
|
|
57 |
% |
|
|
2 |
|
|
|
30 |
|
2/28/20 |
|
First mortgage |
|
|
9,320 |
|
|
L+3.50% |
|
|
5.0% |
|
|
3/9/23 |
|
3/9/25 |
|
FL |
|
Retail |
|
|
78 |
% |
|
|
2 |
|
|
|
31 |
|
9/29/17 |
|
Credit |
|
|
7,500 |
|
|
9.20% |
|
|
9.2% |
|
|
10/11/27 |
|
10/11/27 |
|
NJ |
|
Office |
|
|
80 |
% |
|
|
2 |
|
|
|
32 |
|
3/27/18 |
|
Credit |
|
|
3,000 |
|
|
9.35% |
|
|
9.3% |
|
|
4/1/23 |
|
4/1/23 |
|
FL |
|
Hospitality |
|
|
68 |
% |
|
|
5 |
|
|
|
33 |
|
10/4/19 |
|
Credit |
|
|
6,000 |
|
|
10.00% |
|
|
10.0% |
|
|
10/6/24 |
|
10/6/24 |
|
NV |
|
Office |
|
|
75 |
% |
|
|
2 |
|
|
|
|
|
|
|
|
|
$ |
504,512 |
|
|
|
|
|
|
5.3% |
|
|
|
|
|
|
|
|
|
|
|
71 |
% |
|
|
|
|
|
(1) |
First mortgage loans are first position mortgage loans and credit loans are mezzanine and subordinated loans. |
|
(2) |
Cash coupon is the stated rate on the loan. All-in yield is the present value of all future principal and interest payments on the loan and does not include any origination fees or deferred commitment fees. The total is the weighted average rate as of June 30, 2020. Our first mortgage loans are all floating rate and each contains a minimum LIBOR floor. The weighted average LIBOR floor for these loans is 1.89%. |
|
(3) |
Original maturity is the first maturity on the loan and maximum maturity assumes all extension options are exercised. |
|
(4) |
Loan-to-value (“LTV”) was determined at loan origination and is not updated for subsequent property valuations or loan modifications. The total is the weighted average LTV. |
|
(5) |
Risk rating is the internal risk rating assigned by the Sub-Advisor. See “Note 3 – Commercial Mortgage Loans Held for Investment” which is included in our notes to consolidated financial statements included in this Quarterly Report on Form 10-Q. |
|
(6) |
Loan is currently non-performing. |
|
(7) |
Loan has been modified to capitalize a portion of its interest payment for a temporary period of time. The all-in yield assumes the timely payment of interest and principal through maturity. |
27
The table below provides a summary of our real estate securities portfolio:
|
|
|
As of June 30, 2020 |
|
|
As of December 31, 2019 |
|
||
|
Outstanding balance (fair market value) |
|
$ |
73,903 |
|
|
$ |
157,869 |
|
|
Number of real estate securities |
|
11 |
|
|
17 |
|
||
|
Weighted average interest rate (1) |
|
|
3.4 |
% |
|
|
5.0 |
% |
|
Average years to maturity |
|
|
0.8 |
|
|
|
1.0 |
|
|
Weighted average yield (2) |
|
|
4.9 |
% |
|
|
6.2 |
% |
|
Portfolio ratings % of total outstanding: |
|
|
|
|
|
|
|
|
|
AAA |
|
|
16 |
% |
|
|
12 |
% |
|
AA- |
|
|
2 |
% |
|
|
1 |
% |
|
BB- |
|
|
52 |
% |
|
|
46 |
% |
|
BBB- |
|
|
0 |
% |
|
|
6 |
% |
|
Unrated |
|
|
30 |
% |
|
|
35 |
% |
|
(1) |
The weighted average interest rate is based off the balance of the bonds outstanding and the applicable rates. |
|
(2) |
The weighted average yield is calculated as interest income divided by the average carrying value. |
The decrease in the size of our portfolio is due to the sale of CMBS and a decrease in fair value of the securities. The change in weighted average interest rate and weighted average yield dropped due to a decrease in LIBOR. The average years to maturity decreased due to the passage of time.
Our credit process evaluates the underlying quality of the loans securing the CMBS at the time of purchase and we continually review the credit performance while we own the CMBS. Our Sub-Advisor performs a quarterly asset review of all our investments and assigns an internal risk rating to each. As of June 30, 2020, three of the CMBS had an internal risk rating of 2, seven had an internal risk rating of 3 and one had an internal risk rating of 4. As of December 31, 2019, each CMBS had an internal risk rating of 2. See “Note 4 – Real Estate Securities” which is included in our notes to consolidated financial statements included in this Quarterly Report on Form 10-Q for further information. Ratings by national rating agencies are subject to change and may not be continuously updated, and therefore we do not place reliance on these ratings.
We entered into master repurchase agreements to fund our investment portfolio. As of June 30, 2020 and December 31, 2019, we had total borrowings of $373,256 (which is net of $67 of unamortized debt issuance costs) and $443,294 (which is net of $80 of unamortized debt issuance costs), respectively. During the six-months ended June 30, 2020 and the year ended December 31, 2019, we had weighted average borrowings of $436,711 and $329,037 and weighted average borrowing costs of 3.0% and 4.2%, respectively. The increase in borrowings combined with the proceeds from the Private Offering and the IPO (collectively, the “Offerings”) were used to fund the growth in our investment portfolio. The decrease in the weighted average borrowing costs was primarily due to the change in LIBOR during the period.
28
Comparison of the Three-Months Ended June 30, 2020 to the Three-Months Ended June 30, 2019
Net Interest Income
Net interest income is generated on our interest-earning assets less related interest-bearing liabilities. The following table presents the average balance of interest-earning assets less related interest-bearing liabilities, associated interest income and expense and corresponding yield earned and incurred for the periods indicated.
|
|
|
Three-Months Ended June 30, |
|||||||||||||||||||||||
|
|
|
2020 |
|
|
2019 |
||||||||||||||||||||
|
|
|
Average Carrying Value (1) |
|
|
Interest Income/ Expense (2)(3) |
|
|
Weighted Average Yield/Financing Cost (4) |
|
|
Average Carrying Value (1) |
|
|
Interest Income/ Expense (2) |
|
|
Weighted Average Yield/Financing Cost (4) |
|
|
||||||
|
Interest-earning assets: |
|
|
|
|
|
|
|
|
|
|
|
|
|
|
|
|
|
|
|
|
|
|
|
|
|
|
Real estate securities |
|
$ |
101,356 |
|
|
$ |
1,077 |
|
|
4.2% |
|
|
$ |
105,681 |
|
|
$ |
1,756 |
|
|
6.6% |
|
|
||
|
Commercial mortgage loans |
|
|
532,422 |
|
|
|
7,691 |
|
|
5.7% |
|
|
|
364,194 |
|
|
|
6,477 |
|
|
7.0% |
|
|
||
|
Total/Weighted Average |
|
$ |
633,778 |
|
|
$ |
8,768 |
|
|
5.5% |
|
|
$ |
469,875 |
|
|
$ |
8,233 |
|
|
6.9% |
|
|
||
|
Interest-bearing liabilities: |
|
|
|
|
|
|
|
|
|
|
|
|
|
|
|
|
|
|
|
|
|
|
|
|
|
|
Repurchase agreements—securities |
|
$ |
58,954 |
|
|
$ |
525 |
|
|
3.5% |
|
|
$ |
75,516 |
|
|
$ |
732 |
|
|
3.8% |
|
|
||
|
Repurchase agreements—commercial mortgage loans |
|
|
351,559 |
|
|
|
2,158 |
|
|
2.4% |
|
|
|
235,163 |
|
|
|
2,777 |
|
|
4.7% |
|
|
||
|
Total/Weighted Average |
|
$ |
410,513 |
|
|
$ |
2,683 |
|
|
2.6% |
|
|
$ |
310,679 |
|
|
$ |
3,509 |
|
|
4.5% |
|
|
||
|
Net interest income/spread |
|
|
|
|
|
$ |
6,085 |
|
|
2.9% |
|
|
|
|
|
|
$ |
4,724 |
|
|
2.5% |
|
|
||
|
Average leverage %(5) |
|
|
183.9 |
% |
|
|
|
|
|
|
|
|
|
|
195.2 |
% |
|
|
|
|
|
|
|
|
|
|
Weighted average levered yield(6) |
|
|
|
|
|
|
|
|
|
10.8% |
|
|
|
|
|
|
|
|
|
|
11.7% |
|
|
||
|
(1) |
Based on amortized cost for real estate securities and principal amount for repurchase agreements. Amounts are calculated based on the average daily balance. |
|
(2) |
Includes the effect of amortization of premium or accretion of discount. |
|
(3) |
Interest income excludes $(9) and $223 for the three-months ended June 30, 2020 and 2019, respectively, related to bank deposits and Treasury bills not included in the investment portfolio. |
|
(4) |
Calculated as annualized interest income or expense divided by average carrying value. |
|
(5) |
Calculated by dividing total average interest-bearing liabilities by total average equity (total average interest-earning assets less total average liabilities). |
|
(6) |
Calculated by taking the sum of (i) the net interest spread multiplied by the average leverage and (ii) the weighted average yield on interest-earning assets. |
29
The increase in our weighted average interest-earning assets and interest-bearing liabilities was due to the investment of proceeds from the Offerings and through increased leverage as we executed our business strategy. The change in the weighted average yield and finance cost was due to the change in the portfolio composition as we invest the proceeds from the Offerings and the changes in interest rates tied to LIBOR.
Operating Expenses
Operating expenses for the three-months ended June 30, 2020 and 2019 consisted of the following:
|
|
|
Three-Months Ended June 30, |
|
|||||
|
|
|
2020 |
|
|
2019 |
|
||
|
Advisory fee |
|
$ |
1,557 |
|
|
$ |
1,954 |
|
|
Debt finance costs |
|
|
304 |
|
|
|
226 |
|
|
Directors compensation |
|
|
24 |
|
|
|
23 |
|
|
Professional service fees |
|
|
1,294 |
|
|
|
159 |
|
|
Other expenses |
|
|
247 |
|
|
|
83 |
|
|
Total operating expenses |
|
$ |
3,426 |
|
|
$ |
2,445 |
|
Total operating expenses for the three-months ended June 30, 2020 and 2019 were $3,426 and $2,445, respectively. The decrease in the advisory fee during the three-months ended June 30, 2020, compared to the three-months ended June 30, 2019 was due to a change to the manner that the advisory fee is calculated that was effective July 17, 2019, concurrent with the termination of the Private Offering and commencement of the IPO. We, through our wholly owned subsidiary, have entered into master repurchase agreements and incurred costs which are deferred over the loan term. Debt finance costs increased due to extension fees paid for the CF Repo Facility (defined below) and the addition of the JPM Repo Facility (defined below) in Q2 2019 and the associated amortization of debt finance costs for both in 2020 compared to 2019. The increase in professional service fees was primarily due to the write off of deferred costs related to the issuance of a collateralized loan obligation we did not complete due to the economic impact of COVID-19. The increase in other expenses was due to higher mortgage servicing fees due to additional loans added to the portfolio. For the three-months ended June 30, 2020 our total operating expenses were 0.5% of our average invested assets.
Other (Loss) Income
For the three-months ended June 30, 2020 and 2019, we had net unrealized gain (loss) in value of real estate securities of $19,284 and $(18), respectively. During the three-months ended June 30, 2020, there was also an offsetting realized loss on the sale of real estate securities of $19,288, an additional provision for loan losses of $1,265 and a realized loss on the sale of a commercial loan of $375.
Net Income
For the three-months ended June 30, 2020 and 2019, our net income was $1,006 and $2,484, or $0.09 and $0.30 per share (basic and diluted), respectively. The decrease in net income was primarily due to higher professional service fees, a provision for loan losses and a realized loss on the sale of a commercial loan, partially offset by the decrease in the advisory fee and the increase in net interest income as our investment portfolio increased due to investing the proceeds from the Offerings and borrowings.
30
Comparison of the Six-Months Ended June 30, 2020 to the Six-Months Ended June 30, 2019
Net Interest Income
Net interest income is generated on our interest-earning assets less related interest-bearing liabilities. The following table presents the average balance of interest-earning assets less related interest-bearing liabilities, associated interest income and expense and corresponding yield earned and incurred for the periods indicated.
|
|
|
Six-Months Ended June 30, |
|
|||||||||||||||||||||
|
|
|
2020 |
|
|
2019 |
|
||||||||||||||||||
|
|
|
Average Carrying Value (1) |
|
|
Interest Income/ Expense (2)(3) |
|
|
Weighted Average Yield/Financing Cost (4) |
|
|
Average Carrying Value (1) |
|
|
Interest Income/ Expense (2) |
|
|
Weighted Average Yield/Financing Cost (4) |
|
||||||
|
Interest-earning assets: |
|
|
|
|
|
|
|
|
|
|
|
|
|
|
|
|
|
|
|
|
|
|
|
|
|
Real estate securities |
|
$ |
129,275 |
|
|
$ |
3,202 |
|
|
4.9% |
|
|
$ |
100,838 |
|
|
$ |
3,309 |
|
|
6.5% |
|
||
|
Commercial mortgage loans |
|
|
532,711 |
|
|
|
15,771 |
|
|
5.9% |
|
|
|
321,391 |
|
|
|
11,417 |
|
|
7.1% |
|
||
|
Total/Weighted Average |
|
$ |
661,986 |
|
|
$ |
18,973 |
|
|
5.7% |
|
|
$ |
422,229 |
|
|
$ |
14,726 |
|
|
6.9% |
|
||
|
Interest-bearing liabilities: |
|
|
|
|
|
|
|
|
|
|
|
|
|
|
|
|
|
|
|
|
|
|
|
|
|
Repurchase agreements—securities |
|
$ |
84,083 |
|
|
$ |
1,358 |
|
|
3.2% |
|
|
$ |
71,371 |
|
|
$ |
1,374 |
|
|
3.8% |
|
||
|
Repurchase agreements—commercial mortgage loans |
|
|
352,628 |
|
|
|
5,287 |
|
|
3.0% |
|
|
|
206,003 |
|
|
|
4,890 |
|
|
4.7% |
|
||
|
Total/Weighted Average |
|
$ |
436,711 |
|
|
$ |
6,645 |
|
|
3.0% |
|
|
$ |
277,374 |
|
|
$ |
6,264 |
|
|
4.5% |
|
||
|
Net interest income/spread |
|
|
|
|
|
$ |
12,328 |
|
|
2.7% |
|
|
|
|
|
|
$ |
8,462 |
|
|
2.4% |
|
||
|
Average leverage %(5) |
|
|
193.9 |
% |
|
|
|
|
|
|
|
|
|
|
191.5 |
% |
|
|
|
|
|
|
|
|
|
Weighted average levered yield (6) |
|
|
|
|
|
|
|
|
|
10.8% |
|
|
|
|
|
|
|
|
|
|
11.6% |
|
||
|
(1) |
Based on amortized cost for real estate securities and principal amount for repurchase agreements. Amounts are calculated based on the average daily balance. |
|
(2) |
Includes the effect of amortization of premium or accretion of discount. |
|
(3) |
Interest income excludes $142 and $321 for the six-months ended June 30, 2020 and 2019, respectively, related to bank deposits and Treasury bills not included in the investment portfolio. |
|
(4) |
Calculated as annualized interest income or expense divided by average carrying value. |
|
(5) |
Calculated by dividing total average interest-bearing liabilities by total average equity (total average interest-earning assets less total average liabilities). |
|
(6) |
Calculated by taking the sum of (i) the net interest spread multiplied by the average leverage and (ii) the weighted average yield on interest-earning assets. |
31
The increase in our weighted average interest-earning assets and interest-bearing liabilities was due to the investment of proceeds from the Offerings and through increased leverage as we executed our business strategy. The change in the weighted average yield and finance cost was due to the change in the portfolio composition as we invest the proceeds from the Offerings and the changes in interest rates tied to LIBOR. For the six-months ended June 30, 2020, the ratio of the cost of raising equity capital to the gross amount of equity capital raised was approximately 7.8%.
Operating Expenses
Operating expenses for the six-months ended June 30, 2020 and 2019 consisted of the following:
|
|
|
Six-Months Ended June 30, |
|
|||||
|
|
|
2020 |
|
|
2019 |
|
||
|
Advisory fee |
|
$ |
2,401 |
|
|
$ |
3,485 |
|
|
Debt finance costs |
|
|
558 |
|
|
|
422 |
|
|
Directors compensation |
|
|
48 |
|
|
|
43 |
|
|
Professional service fees |
|
|
1,512 |
|
|
|
309 |
|
|
Other expenses |
|
|
472 |
|
|
|
166 |
|
|
Total operating expenses |
|
$ |
4,991 |
|
|
$ |
4,425 |
|
Total operating expenses for the six-months ended June 30, 2020 and 2019 were $4,991 and $4,425, respectively. The decrease in the advisory fee during the six-months ended June 30, 2020, compared to the six-months ended June 30, 2019 was due to a voluntary waiver by our Advisor of $874 of the advisory fees incurred during 2020 and a change to the manner that the advisory fee is calculated that was effective July 17, 2019, concurrent with the termination of the Private Offering and commencement of the IPO. We, through our wholly owned subsidiary, have entered into master repurchase agreements and incurred costs which are deferred over the loan term. Debt finance costs increased due to extension fees paid for the CF Repo Facility (defined below) and the addition of the JPM Repo Facility (defined below) in Q2 2019 and the associated amortization of debt finance costs for both in 2020 compared to 2019. The increase in professional service fees was primarily due to the write off of deferred costs related to the issuance of a collateralized loan obligation we did not complete due to the economic impact of COVID-19. The increase in other expenses was due to higher mortgage servicing fees due to additional loans added to the portfolio. For the six-months ended June 30, 2020 our total operating expenses were 0.8% of our average invested assets.
Other (Loss) Income
For the six-months ended June 30, 2020 and 2019, we had net unrealized (loss) gain in value of real estate securities of $(18,903) and $1,790, respectively. The CMBS market has experienced significant disruption beginning in March 2020 due to the economic decline related to COVID-19. The value of the CMBS we held was impacted by the overall market decline, with those securities secured by hospitality properties being severely impacted. For the six-months ended June 30, 2020 and 2019, we had realized losses on the sale of real estate securities of $19,288 and $43, respectively. During the six-months ended June 30, 2020, we also recorded a provision for loan losses of $5,765 for impairment on one first mortgage loan and one credit loan and recorded a realized loss on the sale of a commercial loan for $375. See further discussion in “Note 3 – Commercial Mortgage Loans Held for Investment”.
Net (Loss) Income
For the six-months ended June 30, 2020 and 2019, our net (loss) income was $(36,852) and $6,105, or $(3.21) and $0.82 per share (basic and diluted), respectively. The decrease in net income was primarily due to significant realized and unrealized losses on real estate securities resulting from the COVID-19 pandemic in 2020, a provision for loan losses in 2020, partially offset by the decrease in the advisory fee and the increase in net interest income as our investment portfolio increased due to investing the proceeds from the Offerings and borrowings.
Non-GAAP Financial Measures
Funds from Operations and Modified Funds from Operations
We use Funds from Operations (“FFO”), a widely accepted metric, to evaluate our performance. FFO provides a supplemental measure to compare our performance and operations to other REITs. Due to certain unique operating characteristics of real estate companies, the National Association of Real Estate Investment Trusts (“NAREIT”) has promulgated a standard known as FFO, which it believes more accurately reflects the operating performance of a REIT. As defined by NAREIT, FFO means net income computed in accordance with generally accepted accounting principles (“GAAP”), excluding gains (or losses) from sales of operating property, plus depreciation and amortization and after adjustments for unconsolidated entities. In addition, NAREIT has further clarified the
32
FFO definition to add-back impairment write-downs of depreciable real estate or of investments in unconsolidated entities that are driven by measurable decreases in the fair value of depreciable real estate and to exclude the earnings impacts of cumulative effects of accounting changes. We have adopted the NAREIT definition for computing FFO.
Our business plan is to operate as a mortgage REIT with our portfolio consisting of CRE debt and CRE securities. We will typically have no FFO adjustments to our net income or loss computed in accordance with GAAP. Although we have the ability to acquire real property, we have not acquired any at this time and as such have not had any FFO adjustments to our net income or loss computed in accordance with GAAP.
Due to the unique features of publicly registered, non-listed REITs, the Institute for Portfolio Alternatives (“IPA”), an industry trade group, published a standardized measure known as Modified Funds from Operations (“MFFO”), which the IPA has promulgated as a supplemental measure for publicly registered non-listed REITs and which may be another appropriate supplemental measure to reflect the operating performance of a non-listed REIT.
The IPA defines MFFO as FFO adjusted for acquisition fees and expenses, amounts relating to straight line rents and amortization of premiums on debt investments, non-recurring impairments of real estate-related investments, mark-to-market adjustments included in net income, non-recurring gains or losses included in net income from the extinguishment or sale of debt, hedges, foreign exchange, derivatives or securities holdings where trading of such holdings is not a fundamental attribute of the business plan, unrealized gains or losses resulting from consolidation from, or deconsolidation to, equity accounting, and after adjustments for consolidated and unconsolidated partnerships and joint ventures.
We define MFFO in accordance with the concepts established by the IPA and adjust FFO for certain items, such as amortization of premium and discounts on real estate securities. We purchase real estate securities at a premium or discount to par value, and in accordance with GAAP, record the amortization of premium/accretion of the discount to interest income. We believe that excluding the amortization of premiums and discounts provides better insight to the expected contractual cash flows. In addition, we adjust FFO for unrealized gains or losses on real estate securities. Any mark-to-market or fair value adjustments are based on general market or overall industry conditions and may be temporary in nature.
Because MFFO may be a recognized measure of operating performance within the non-listed REIT industry, MFFO and the adjustments used to calculate it may be useful in order to evaluate our performance against other non-listed REITs. Like FFO, MFFO is not equivalent to our net income or loss as determined under GAAP, as detailed in the table below, and MFFO may not be a useful measure of the impact of long-term operating performance on value if we continue to acquire a significant amount of investments.
Our presentation of FFO and MFFO may not be comparable to other similarly titled measures presented by other REITs. We believe that the use of FFO and MFFO provides a more complete understanding of our operating performance to stockholders and to management, and when compared year over year, reflects the impact on our operations from trends in operating costs, general and administrative expenses, and interest costs. Neither FFO nor MFFO is intended to be an alternative to “net income” or to “cash flows from operating activities” as determined by GAAP as a measure of our capacity to pay distributions. Management uses FFO and MFFO to compare our operating performance to that of other REITs and to assess our operating performance.
Neither the SEC, any other regulatory body nor NAREIT has passed judgment on the acceptability of the adjustments that we use to calculate FFO or MFFO. In the future, the SEC, another regulatory body or NAREIT may decide to standardize the allowable adjustments across the non-listed REIT industry and we would have to adjust our calculation and characterization of FFO or MFFO.
33
Our FFO and MFFO are calculated as follows:
|
|
Three-months ended June 30, |
|
|
Six-months ended June 30, |
|
||||||||||
|
|
2020 |
|
|
2019 |
|
|
2020 |
|
|
2019 |
|
||||
|
GAAP net income (loss) |
$ |
1,006 |
|
|
$ |
2,484 |
|
|
$ |
(36,852 |
) |
|
$ |
6,105 |
|
|
Funds from operations |
$ |
1,006 |
|
|
$ |
2,484 |
|
|
$ |
(36,852 |
) |
|
$ |
6,105 |
|
|
|
|
|
|
|
|
|
|
|
|
|
|
|
|
|
|
|
Amortization of discount on real estate securities |
|
(88 |
) |
|
|
(206 |
) |
|
|
(309 |
) |
|
|
(383 |
) |
|
Amortization of debt financing costs |
|
304 |
|
|
|
226 |
|
|
|
558 |
|
|
|
422 |
|
|
Provision for loan losses |
|
1,265 |
|
|
|
— |
|
|
|
5,765 |
|
|
|
— |
|
|
Realized loss on sale of commercial loan |
|
375 |
|
|
|
— |
|
|
|
375 |
|
|
|
— |
|
|
Unrealized (gain) loss on real estate securities |
|
(19,284 |
) |
|
|
18 |
|
|
|
18,903 |
|
|
|
(1,790 |
) |
|
Realized loss on sale of real estate securities |
|
19,288 |
|
|
|
— |
|
|
|
19,288 |
|
|
|
43 |
|
|
Modified funds from operations |
$ |
2,866 |
|
|
$ |
2,522 |
|
|
$ |
7,728 |
|
|
$ |
4,397 |
|
Net Asset Value
Prior to the NAV Pricing Date, the purchase price for each class of our common stock was $25.00 per share, plus applicable upfront selling commissions and dealer manager fees. Following the NAV Pricing Date, the purchase price per share for each class of our common stock will generally equal our prior month’s NAV per share, as determined monthly, plus applicable selling commissions and dealer manager fees. Our NAV for each class of shares is based on the net asset values of our investments, the addition of any other assets (such as cash on hand) and the deduction of any liabilities, including the allocation/accrual of any performance participation and any stockholder servicing fees applicable to such class of shares.
On March 24, 2020, our Board suspended (i) the sale of shares in our IPO, (ii) the operation of the SRP, (iii) the payment of distributions to our stockholders, and (iv) the operation of the DRP, effective as of April 6, 2020. These changes were made to allow us to maintain fiscal responsibility and respond accordingly to the unprecedented economic disruption resulting from the COVID-19 pandemic.
In determining to suspend our IPO, the SRP, the payment of distributions and the DRP, our Board considered various factors, including the impact of the global COVID-19 pandemic on the economy, the inability to accurately calculate our NAV per share due to uncertainty, volatility and lack of liquidity in the market, our need for liquidity due to financing challenges related to additional collateral required by the banks that regularly finance our assets and these uncertain and rapidly changing economic conditions. While we did not calculate the NAV for the months of March through May 2020, our Advisor has determined since then that there has been reduced volatility in the market for the Company’s investments and some improvement in the U.S. economic outlook, and our Advisor resumed calculation of the NAV beginning as of June 30, 2020 and our Board authorized a distribution on July 30, 2020 to stockholders of record as of July 31, 2020. However, our IPO, the DRP and the SRP remained suspended. We are working toward and intend to restart the IPO and the DRP subject to receiving the required regulatory approvals to do so. We will continue to closely monitor the pandemic, the economy and the markets for the Company’s investments in order to determine an appropriate time to resume our IPO, the DRP and the SRP. Please refer to “Note 13 – Subsequent Events” and Part II, “Item 1A – Risk Factors” for updates on our business after June 30, 2020 and discussion of risk factors related to the COVID-19 pandemic, respectively.
34
The following table provides a breakdown of the major components of our NAV:
|
Components of NAV |
As of June 30, 2020 |
|
|
|
Commercial mortgage loans |
$ |
505,446 |
|
|
Real estate securities |
|
73,903 |
|
|
Cash and cash equivalents and restricted cash |
|
39,937 |
|
|
Other assets |
|
6,548 |
|
|
Repurchase agreements - commercial mortgage loans |
|
(327,928 |
) |
|
Repurchase agreements - real estate securities |
|
(45,328 |
) |
|
Due to related parties |
|
(1,988 |
) |
|
Interest payable |
|
(341 |
) |
|
Accrued stockholder servicing fees(1) |
|
(18 |
) |
|
Other liabilities |
|
(817 |
) |
|
Net asset value |
$ |
249,414 |
|
|
Number of outstanding shares |
|
11,631 |
|
|
(1) |
Stockholder servicing fees only apply to Class T, Class S, and Class D shares. For purposes of NAV, we recognize the stockholder servicing fee as a reduction of NAV on a monthly basis as such fee is paid. Under GAAP, we accrue the full cost of the stockholder servicing fee as an offering cost at the time we sell Class T, Class S, and Class D shares. As of June 30, 2020, we have accrued under GAAP $615 of stockholder servicing fees payable to the Dealer Manager related to the Class T shares sold and $108 of stockholder servicing fees payable to the Dealer Manager related to the Class D shares sold. As of June 30, 2020, we have not sold any Class S shares and, therefore, we have not accrued any stockholder servicing fees payable to the Dealer Manager related to Class S shares. The Dealer Manager does not retain any of these fees, all of which are retained by, or reallowed (paid) to, participating broker-dealers and servicing broker-dealers for ongoing stockholder services performed by such broker-dealers. |
The table below outlines our total NAV and NAV per share by share class as of June 30, 2020 ($ and shares in thousands except for per share data):
|
|
Common Stock |
|
|||||||||||||||||||||||||
|
NAV Per Share |
Class P |
|
|
Class A |
|
|
Class T |
|
|
Class S |
|
|
Class D |
|
|
Class I |
|
|
Total |
|
|||||||
|
Monthly NAV |
$ |
217,633 |
|
|
$ |
14,043 |
|
|
$ |
8,535 |
|
|
$ |
— |
|
|
$ |
1,076 |
|
|
$ |
8,129 |
|
|
$ |
249,414 |
|
|
Number of outstanding shares |
|
10,152 |
|
|
|
654 |
|
|
|
397 |
|
|
|
— |
|
|
|
50 |
|
|
|
378 |
|
|
|
11,631 |
|
|
NAV per share as of June 30, 2020 |
$ |
21.4379 |
|
|
$ |
21.4868 |
|
|
$ |
21.4857 |
|
|
$ |
— |
|
|
$ |
21.4818 |
|
|
$ |
21.4874 |
|
|
$ |
21.4439 |
|
The following table reconciles stockholders’ equity per our consolidated balance sheet to our NAV:
|
Reconciliation of Stockholders’ Equity to NAV |
As of June 30, 2020 |
|
|
|
Stockholders' equity per GAAP |
$ |
237,530 |
|
|
Adjustments: |
|
|
|
|
Unamortized stockholder servicing fee |
|
710 |
|
|
Unamortized offering costs |
|
3,871 |
|
|
Fair market value loan adjustment |
|
7,303 |
|
|
Net asset value |
$ |
249,414 |
|
35
Liquidity and Capital Resources
Liquidity is a measurement of our ability to meet potential cash requirements, including ongoing commitments to pay distributions to our stockholders, fund investments, originate loans, repay borrowings, and other general business needs including the payment of our operating and administrative expenses. Our primary sources of funds for liquidity consist of the net proceeds from the Offerings, net cash provided by operating activities, proceeds from repurchase agreements and other financing arrangements and future issuances of equity and/or debt securities.
Cash Flow Analysis
|
|
|
Six-months Ended June 30, |
|
|
Change |
|
||||||
|
|
|
2020 |
|
|
2019 |
|
|
2020 vs. 2019 |
|
|||
|
Net cash provided by operating activities |
|
$ |
8,459 |
|
|
$ |
3,426 |
|
|
$ |
5,033 |
|
|
Net cash provided by (used in) investing activities |
|
$ |
47,727 |
|
|
$ |
(199,471 |
) |
|
$ |
247,198 |
|
|
Net cash (used in) provided by financing activities |
|
$ |
(53,888 |
) |
|
$ |
215,464 |
|
|
$ |
(269,352 |
) |
We held cash, cash equivalents and restricted cash of $39,937 and $37,639 as of June 30, 2020 and December 31, 2019, respectively. Our cash, cash equivalents and restricted cash increased due to normal fluctuations and were primarily related to the net proceeds from the Offerings and from the net proceeds from our repurchase agreements that were not used to purchase investments.
Our operating activities generated net cash of $8,459 and $3,426 for the six-months ended June 30, 2020 and 2019, respectively. The increase in cash from operating activities was due to the increase in the size of our investment portfolio.
Our investing activities generated and used net cash of $47,727 and $199,471 for the six-months ended June 30, 2020 and 2019, respectively. The primary driver of the change was due to larger originations of mortgage loans during the six-months ended June 30, 2019 as compared to the six-months ended June 30, 2020. There also were purchases of CMBS during the six-months ended June 30, 2019. In 2020, our purchases of CMBS halted beginning in February and March because of the uncertainty created by the impact of the COVID-19 pandemic on the market. We also sold CMBS and a credit loan during 2020 generating proceeds of $43,928 and $9,625, respectively.
Our financing activities used net cash of $53,888 for the six-months ended June 30, 2020, compared to providing net cash of $215,464 for the six-months ended June 30, 2019. The net cash used during the six-months ended June 30, 2020 was driven by $70,051 net paydowns on our repurchase agreement financing offset partially by $22,794 in net proceeds from the issuance of our common stock. For the six-months ended June 30, 2019, the net cash came from $135,580 in net proceeds from our repurchase agreement financing and $87,995 in net proceeds from the issuance of our common stock.
Repurchase Agreements
Commercial Mortgage Loans
On February 15, 2018, we, through our wholly owned subsidiary, entered into a master repurchase agreement (the “CF Repo Facility”) with Column Financial, Inc. as administrative agent for certain of its affiliates. The CF Repo Facility had an initial advance amount of $100,000 subject to a maximum advance amount of $250,000. We increased the advance amount in August 2018 to $175,000, and in January 2019 to the maximum of $250,000. In March 2020, we increase the maximum advance amount to $300,000 with this increase as amended set to expire on June 30, 2020. The initial term of the CF Repo Facility was 12 months and we extended the maturity date in March 2020 to February 2021. Advances under the CF Repo Facility accrue interest at a per annum rate equal to LIBOR plus 2.0%. The CF Repo Facility is generally subject to certain financial covenants. We were in compliance with all financial covenant requirements as of June 30, 2020 and December 31, 2019.
On May 6, 2019, we, through our wholly owned subsidiary, entered into an uncommitted master repurchase agreement (the “JPM Repo Facility”) with JPMorgan Chase Bank, National Association. The JPM Repo Facility provides up to $150,000 in advances that we expect to use to finance the acquisition or origination of eligible loans and participation interests therein. Advances under the JPM Repo Facility accrue interest at per annum rates equal to the sum of (i) the applicable LIBOR index rate plus (ii) a margin of between 1.75% to 2.50%, depending on the attributes of the purchased assets. The initial maturity date of the JPM Repo Facility is May 6, 2021, with two successive one-year extensions at our option, which may be exercised upon the satisfaction of certain conditions. The JPM Repo Facility is subject to certain financial covenants. We were in compliance with all financial covenant requirements as of June 30, 2020.
36
The JPM Repo Facility and CF Repo Facility (collectively, the “Repo Facilities”) are used to finance eligible loans and act in the manner of a revolving credit facility that can be repaid as our assets are paid off and re-drawn as advances against new assets.
The tables below show our Repo Facilities as of June 30, 2020 and December 31, 2019:
|
June 30, 2020 |
|
|
|
|
|
|
|
|
|
|
|
|
|
|
|
|
Weighted Average |
|
|||||
|
|
Committed Financing |
|
|
Amount Outstanding(1) |
|
|
Accrued Interest Payable |
|
|
Collateral Pledged |
|
|
Interest Rate |
|
|
Days to Maturity |
|
||||||
|
CF Repo Facility |
$ |
300,000 |
|
|
$ |
183,042 |
|
|
$ |
145 |
|
|
$ |
257,451 |
|
|
|
2.18 |
% |
|
|
227 |
|
|
JPM Repo Facility |
|
150,000 |
|
|
|
144,953 |
|
|
|
110 |
|
|
|
206,061 |
|
|
|
2.10 |
% |
|
|
310 |
|
|
|
$ |
450,000 |
|
|
$ |
327,995 |
|
|
$ |
255 |
|
|
$ |
463,512 |
|
|
|
2.15 |
% |
|
|
264 |
|
|
December 31, 2019 |
|
|
|
|
|
|
|
|
|
|
|
|
|
|
|
|
Weighted Average |
|
|||||
|
|
Committed Financing |
|
|
Amount Outstanding(1) |
|
|
Accrued Interest Payable |
|
|
Collateral Pledged |
|
|
Interest Rate |
|
|
Days to Maturity |
|
||||||
|
|
|
|
|
|
|
|
|
|
|
|
|
|
|
|
|
|
|
|
|
|
|
|
|
|
CF Repo Facility |
$ |
250,000 |
|
|
$ |
224,590 |
|
|
$ |
327 |
|
|
$ |
304,708 |
|
|
|
3.74 |
% |
|
|
318 |
|
|
JPM Repo Facility |
|
150,000 |
|
|
|
111,295 |
|
|
|
157 |
|
|
|
153,194 |
|
|
|
3.63 |
% |
|
|
492 |
|
|
|
$ |
400,000 |
|
|
$ |
335,885 |
|
|
$ |
484 |
|
|
$ |
457,902 |
|
|
|
3.70 |
% |
|
|
376 |
|
|
(1) |
Excludes $67 and $80 of unamortized debt issuance costs at June 30, 2020 and December 31, 2019, respectively. |
Real Estate Securities
As of June 30, 2020 and December 31, 2019, we had entered into two master repurchase agreements for real estate securities with separate counterparties and had the following balances outstanding as described in the table below:
|
|
|
|
|
|
|
|
|
|
|
|
|
|
|
Weighted Average |
|
|||||
|
|
|
Amount Outstanding |
|
|
Accrued Interest Payable |
|
|
Collateral Pledged |
|
|
Interest Rate |
|
|
Days to Maturity |
|
|||||
|
As of June 30, 2020 |
|
$ |
45,328 |
|
|
$ |
86 |
|
|
$ |
93,464 |
|
|
|
4.07 |
% |
|
|
34 |
|
|
As of December 31, 2019 |
|
$ |
107,489 |
|
|
$ |
168 |
|
|
$ |
149,164 |
|
|
|
3.14 |
% |
|
|
11 |
|
Distributions
For the period from January 1, 2019 to July 31, 2019, we paid distributions on Class P Shares based on daily record dates, payable in arrears the following month, equal to a daily amount of 1/365th of $1.92 per share. Distributions declared on or after August 1, 2019 through February 29, 2020 on Class P Shares were based on monthly record dates, payable in arrears the following month, equal to a monthly amount of 1/12th of $1.92 per share.
For each class of common stock offered in the IPO through February 29, 2020, we paid the same gross distribution based on monthly record dates, payable in arrears the following month, equal to a monthly amount of 1/12th of $1.62 per share.
During the six-months ended June 30, 2020, we paid a monthly gross distribution of 1/12th of $1.62 per share on our Class A, Class T, Class D and Class I common stock to stockholders of record for the months of January and February 2020. We did not have shares outstanding of Class S common stock. During the six-months ended June 30, 2019, we did not have shares outstanding of Class A, Class T, Class S, Class D or Class I common stock.
37
|
|
Six-Months Ended June 30, |
|
||||||
|
|
|
2020 |
|
|
2019 |
|
||
|
Distributions |
|
|
|
|
|
|
|
|
|
Paid in cash |
|
$ |
5,098 |
|
|
$ |
6,684 |
|
|
Reinvested in shares |
|
|
127 |
|
|
|
— |
|
|
Total distributions |
|
$ |
5,225 |
|
|
$ |
6,684 |
|
|
Cash flows from operating activities |
|
$ |
8,459 |
|
|
$ |
3,426 |
|
|
(1) |
For the six-months ended June 30, 2020 and 2019, none and 48.7% of distributions were paid from the net combined proceeds of our IPO and Private Offering, respectively. |
On March 24, 2020, our Board suspended the payment of distributions to our stockholders.
On July 14, 2020, in anticipation of the potential future reinstatement of the distribution reinvestment plan, our Board approved an amended and restated DRP, which became effective on August 7, 2020. As amended, stockholders who hold Class P Shares may now elect to participate in the DRP, and cash distributions with respect to Class P Shares will be applied to the purchase of Class I shares once we resume the DRP, which remains suspended.
In determining to suspend the payment of distributions and the DRP, our Board considered various factors, including the impact of the global COVID-19 pandemic on the economy, the inability to accurately calculate our NAV per share due to uncertainty, volatility and lack of liquidity in the market, our need for liquidity due to financing challenges related to additional collateral required by the banks that regularly finance our assets and these uncertain and rapidly changing economic conditions. While we did not calculate the NAV for the months of March, April and May 2020, our Advisor has determined since then that there has been reduced volatility in the market for our investments and some improvement in the U.S. economic outlook, and our Advisor resumed calculation of the NAV beginning as of June 30, 2020 and our Board authorized a distribution on July 30, 2020 equal to 1/12th of $0.8576 per share on all classes of shares to stockholders of record as of July 31, 2020. Please refer to “Note 13 – Subsequent Events” and Part II, “Item 1A – Risk Factors” for updates on our business after June 30, 2020 and discussion of risk factors related to the COVID-19 pandemic, respectively.
Contractual Obligations and Commitments
Our contractual obligations, excluding expected interest payments, as of June 30, 2020 and December 31, 2019 are summarized as follows:
|
As of June 30, 2020 |
|
Less than 1 Year |
|
|
1 to 3 Years |
|
|
3 to 5 Years |
|
|
More than 5 Years |
|
|
Total |
|
|||||
|
Borrowings under repurchase agreements - real estate securities |
|
$ |
45,328 |
|
|
|
— |
|
|
|
— |
|
|
|
— |
|
|
$ |
45,328 |
|
|
Borrowings under repurchase agreements - commercial mortgage loans (1) |
|
|
327,995 |
|
|
|
— |
|
|
|
— |
|
|
|
— |
|
|
|
327,995 |
|
|
Total |
|
$ |
373,323 |
|
|
|
— |
|
|
|
— |
|
|
|
— |
|
|
$ |
373,323 |
|
|
|
|
|
|
|
|
|
|
|
|
|
|
|
|
|
|
|
|
|
|
|
|
As of December 31, 2019 |
|
|
|
|
|
|
|
|
|
|
|
|
|
|
|
|
|
|
|
|
|
Borrowings under repurchase agreements - real estate securities |
|
$ |
107,489 |
|
|
|
— |
|
|
|
— |
|
|
|
— |
|
|
$ |
107,489 |
|
|
Borrowings under repurchase agreements - commercial mortgage loans (1) |
|
|
335,885 |
|
|
|
— |
|
|
|
— |
|
|
|
— |
|
|
|
335,885 |
|
|
Total |
|
$ |
443,374 |
|
|
|
— |
|
|
|
— |
|
|
|
— |
|
|
$ |
443,374 |
|
|
(1) |
Excludes $67 and $80 of unamortized debt issuance costs at June 30, 2020 and December 31, 2019, respectively. |
38
We have made a commitment to advance additional funds under certain of our CRE loans if the borrower meets certain conditions. As of June 30, 2020, we had 22 of such loans with a total remaining future funding commitment of $59,278. As of December 31, 2019, we had 22 of such loans with a total remaining future funding commitment of $54,620. The future funding commitments are advanced if the borrower has met certain loan specific requirements.
Critical Accounting Policies
Disclosures discussing all critical accounting policies are set forth in our Annual Report under the heading “Summary of Critical Accounting Policies.” There have been no changes to our critical accounting policies during the six-months ended June 30, 2020.
Off-Balance Sheet Arrangements
We currently have no off-balance sheet arrangements that are reasonably likely to have a material current or future effect on our financial condition, changes in financial condition, revenues or expenses, results of operations, liquidity, capital expenditures or capital resources.
Subsequent Events
For information related to subsequent events, reference is made to “Note 13 – Subsequent Events” which is included in our notes to consolidated financial statements included in this Quarterly Report on Form 10-Q.
Our Corporate Information
Our principal executive offices are located at 2901 Butterfield Rd., Oak Brook, Illinois 60523, our telephone number is (800) 826-8228 and our website is www.inland-investments.com/inpoint. From time to time, we may use our website as a distribution channel for material company information. Our website is not incorporated by reference in or otherwise a part of this Quarterly Report on Form 10-Q. We will provide without charge a copy of this Quarterly Report on Form 10-Q upon written request delivered to our principal executive offices. We electronically file our Annual Report on Form 10-K, Quarterly Reports on Form 10-Q, Current Reports on Form 8-K, proxy statements and all amendments to those reports with the SEC. The SEC maintains an Internet site at www.sec.gov that contains reports, proxy and information statements and other information regarding issuers that file electronically.
Item 3. Quantitative and Qualitative Disclosures About Market Risk
Credit Risk
Our investments are subject to a high degree of credit risk. Credit risk is the exposure to loss from loan defaults. Default rates are subject to a wide variety of factors, including, but not limited to, borrower financial condition, property performance, property management, supply/demand factors, construction trends, consumer behavior, regional economics, interest rates, the strength of the U.S. economy, and other factors beyond our control. All loans are subject to a certain probability of default. We manage credit risk through the underwriting and investment structuring process, acquiring our investments at the appropriate discount to face value, if any, and establishing loss assumptions.
We also carefully monitor the performance of the loans, as well as external factors that may affect their level of risk and accordingly their value and the market prices of mortgage-related securities such as CMBS that are collateralized by borrower payments under mortgage loans. Adverse economic conditions could negatively impact hotels or tenants at commercial properties underlying our investments resulting in potential borrower delinquencies or defaults or declines in the values of properties that secure our investments, which could in turn impact the fundamental performance of mortgage-backed securities. Further, credit rating agencies may reassess transactions that are negatively impacted by these adverse changes, which may result in CMBS investments being downgraded and temporarily or permanently losing value. In particular, the COVID-19 pandemic and actions taken to try to contain its spread have caused severe volatility, dislocation and illiquidity in certain fixed income markets amidst forced selling of securities by market participants, including CMBS, at depressed market prices. The amount of financing we receive under our CMBS repurchase agreements is directly related to our counterparties' valuation of our assets that serve as collateral for our outstanding repurchase agreement financing. Our CMBS repurchase agreements are typically short-term in nature, are renewable at the discretion of our lenders and do not contain guaranteed roll-over terms and have been periodically refinanced at current market rates. If we fail to repay the lender at maturity, the lender has the right to immediately sell the collateral and pursue us for any shortfall if the sales proceeds are inadequate to cover the repurchase agreement financing. If adverse market conditions such as those described above stemming from the pandemic recur, valuations will likely be reduced, and margin call risk under repurchase agreements will likely be elevated. We may manage these risks by decreasing the use of leverage with respect to our CMBS investments and focusing our
39
investments more on floating-rate first mortgage loans backed by multifamily, industrial and office properties while continuing to assess the ongoing and potential effects of the pandemic on the hospitality and retail sectors.
Interest Rate Risk
Our market risk arises primarily from interest rate risk relating to interest rate fluctuations. Many factors including governmental monetary and tax policies, domestic and international economic and political considerations and other factors beyond our control contribute to interest rate risk. To meet our short and long-term liquidity requirements, we may borrow funds at fixed and variable rates. Our interest rate risk management objectives are to limit the impact of interest rate changes in earnings and cash flows and to lower our overall borrowing costs. To achieve these objectives, from time to time, we may enter into interest rate hedge contracts such as swaps, collars and treasury lock agreements in order to mitigate our interest rate risk with respect to various debt instruments. While hedging activities may insulate us against adverse changes in interest rates, they may also limit our ability to participate in benefits of lower interest rates with respect to our portfolio of investments with fixed interest rates. During the six-months ended June 30, 2020 and 2019, we did not engage in interest rate hedging activities. We do not hold or issue derivative contracts for trading or speculative purposes. We do not have any foreign denominated investments, and thus, we are not exposed to foreign currency fluctuations.
As of both June 30, 2020, and December 31, 2019, our investment portfolio was 97% variable rate investments based on LIBOR for various terms. Borrowings under our master services agreements were short-term and at a variable rate. The following table quantifies the potential changes in interest income net of interest expense should interest rates increase or decrease by 25 or 50 basis points, assuming that our current balance sheet was to remain constant and no actions were taken to alter our existing interest rate sensitivity:
|
|
|
Estimated Percentage Change in Interest Income Net of Interest Expense |
|
|||||
|
Change in Rates |
|
June 30, 2020 |
|
|
December 31, 2019 |
|
||
|
(-) 50 Basis Points |
|
|
2.19 |
% |
|
|
11.33 |
% |
|
(-) 25 Basis Points |
|
|
2.19 |
% |
|
|
8.23 |
% |
|
Base Interest Rate |
|
|
0.00 |
% |
|
|
0.00 |
% |
|
(+) 25 Basis Points |
|
|
(3.38 |
)% |
|
|
4.60 |
% |
|
(+) 50 Basis Points |
|
|
(6.76 |
)% |
|
|
5.74 |
% |
For this analysis, LIBOR was assumed to not fall below zero.
Item 4. Controls and Procedures
Controls and Procedures
Our management has evaluated, with the participation of our principal executive and principal financial officers, the effectiveness of our disclosure controls and procedures (as defined in Rules 13a-15(e) and 15d-15(e) under the Exchange Act) as of the end of the period covered by this Quarterly Report on Form 10-Q. Based on that evaluation, the principal executive and principal financial officers have concluded that our disclosure controls and procedures were effective as of the end of the period covered by this Quarterly Report on Form 10-Q.
Changes in Internal Control over Financial Reporting
There were no changes to our internal control over financial reporting (as defined in Exchange Act Rule 13a-15(f) or Rule 15d-15(f)) during the three-months ended June 30, 2020 that have materially affected, or are reasonably likely to materially affect, our internal control over financial reporting.
In the ordinary course of business, we may become subject to litigation. We have no knowledge of material legal proceedings pending or known to be contemplated against us at this time.
40
The following risk factors amend and supplement the risk factors set forth in our Annual Report and Quarterly Report for the Quarterly Period Ended March 31, 2020, mostly to reflect updates related to the effects of the COVID-19 pandemic.
Risks Related to an Investment in Our Shares
There is no public trading market for shares of our common stock; therefore, our stockholders’ ability to dispose of their shares will likely be limited to repurchase by us through our SRP, which is currently suspended. We may choose to repurchase fewer shares than have been requested to be repurchased, in our discretion at any time, and the amount of shares we may repurchase is subject to caps. Further our Board may modify, suspend or terminate our SRP if it deems such action to be in our best interest and the best interest of our stockholders. If our stockholders do sell their shares to us, they may receive less than the price they paid.
There is no current public trading market for shares of our common stock, and we do not expect that such a market will ever develop. Therefore, repurchase of shares by us pursuant to our SRP will likely be the only way for our stockholders to dispose of their shares, and there can be no assurance that our SRP will be available at any given time, as our Board may determine to suspend the plan based on economic conditions or for any other reason it deems appropriate. Our SRP was suspended by our Board on March 24, 2020 and there is no assurance that the plan will be reinstated on or before any certain date, if at all. When our SRP is in effect, our stockholders who have held their shares for at least one year have the opportunity to request that we repurchase their shares on a monthly basis. The total amount of aggregate repurchases of shares will be limited to no more than 2% of our aggregate NAV per month as of the last day of the previous calendar month and no more than 5% of our aggregate NAV per calendar quarter as of the last day of the previous calendar month. We repurchase shares from requesting stockholders who have held their shares for at least one year on a monthly basis at a price equal to our most recently determined NAV per share for the applicable class of share on the date the repurchase request is processed, and not based on the price at which the stockholder initially purchased his or her shares. As a result, our stockholders may receive less than the price they paid for their shares when they sell them to us pursuant to our repurchase program.
Due to the illiquid nature of investment in real estate, we may not have sufficient liquid resources to fund repurchase requests. When the SRP is in effect, we may choose to repurchase all, some or none of the shares that have been requested to be repurchased at the end of any particular month, in our discretion, subject to any limitations in our SRP. Further, our Board may modify, suspend or terminate our SRP if it deems such action to be in our best interest and the best interest of our stockholders. If the full amount of all shares of our common stock requested to be repurchased in any given month are not repurchased, funds will be allocated pro rata based on the total number of shares of common stock being repurchased without regard to class and subject to the volume limitation.
Economic events that may cause our stockholders to request that we repurchase their shares may materially adversely affect our cash flow and our results of operations and financial condition.
Economic events affecting the U.S. economy, such as the general negative performance of the real estate sector, could cause our stockholders to seek to sell their shares to us pursuant to our SRP at a time when such events are adversely affecting the performance of our assets. Our SRP has been suspended and may be suspended again in the future. Even if our SRP is reinstated and we decide to satisfy all repurchase requests within the limits of our SRP, our cash flow could be materially adversely affected. In addition, if we determine to sell assets to satisfy repurchase requests, we may not be able to realize the return on such assets that we may have been able to achieve had we sold at a more favorable time, and our results of operations and financial condition, including, without limitation, breadth of our portfolio by property type and location, could be materially adversely affected.
The amount and source of distributions we may make to our stockholders is uncertain, and we may be unable to generate sufficient cash flows from our operations to make distributions to our stockholders at any time in the future.
We have not established a minimum distribution payment level, and our ability to make distributions to our stockholders may be adversely affected by a number of factors, including the risk factors described herein. Because we have a limited operating history and have not identified all of the assets we may acquire with the proceeds of our Offerings, we may not generate sufficient income to make distributions to our stockholders. Our Board will make determinations regarding distributions based upon, among other factors, our financial performance, debt service obligations, debt covenants and capital expenditure requirements. Among the factors that could impair our ability to make distributions to our stockholders are:
|
|
• |
the limited size of our portfolio in the early stages of our development; |
|
|
• |
our inability to invest the proceeds from sales of our shares on a timely basis in income-producing CRE loans, CRE securities and select CRE equity investments; |
|
|
• |
our inability to realize attractive risk-adjusted returns on our investments; |
|
|
• |
unanticipated expenses or reduced revenues that reduce our cash flow or non-cash earnings; |
41
|
|
• |
defaults in our investment portfolio or decreases in the value of our investments, including as a result of the COVID-19 pandemic; and |
|
|
• |
the fact that anticipated operating expense levels may not prove accurate, as actual results may vary from estimates. |
As a result, we may not be able to make distributions to our stockholders at any time in the future, and the level of any distributions we do make to our stockholders may not increase or even be maintained over time, any of which could materially and adversely affect the value of our stockholders’ investments. While we paid distributions to our stockholders on a monthly basis from December 5, 2016 to March 24, 2020, our Board suspended distributions from March 24, 2020 to July 30, 2020 as a result of the COVID-19 pandemic and may do so again in the future.
It may be difficult to reflect, fully and accurately, material events that may impact our monthly NAV.
The Advisor’s determination of our monthly NAV per share for each class of our common stock is based in part on estimates of the values of our illiquid assets in accordance with valuation guidelines approved by our Board. As a result, our most recently published NAV per share may not fully reflect any or all changes in value that may have occurred since the most recent valuation. We suspended the calculation of our NAV from March 24, 2020 to July 20, 2020 as a result of uncertainty caused by the COVID-19 pandemic, and we may do so again in the future. The Advisor reviews our CRE debt and CRE securities investments for the occurrence of any asset-specific or market-driven event it believes may cause a material valuation change in the asset valuation, but it may be difficult to reflect fully and accurately rapidly changing market conditions or material events that may impact the value of our illiquid assets or liabilities between valuations, or to obtain quickly complete information regarding any such events. As a result, the NAV per share may not reflect a material event until such time as sufficient information is available and analyzed, and the financial impact is fully evaluated, such that our NAV may be appropriately adjusted in accordance with our valuation guidelines. Depending on the circumstances, the resulting potential disparity in our NAV may negatively affect stockholders who have their shares repurchased, or stockholders who buy new shares, or our existing stockholders.
If we are unable to raise substantial funds, we will be limited in the number and type of investments we make and the value of our stockholders’ investments in us will fluctuate with the performance of the specific assets we acquire.
Our IPO is being made on a “best efforts” basis, meaning that the Dealer Manager and participating dealers are only required to use their best efforts to sell our shares and have no firm commitment or obligation to purchase any shares of our common stock in our IPO. As a result, the amount of proceeds we raise in our IPO may be substantially less than the amount we would need to create a diversified portfolio of investments. If we are unable to raise substantial funds, we will make fewer investments resulting in less diversification in terms of the type, number and size of investments that we make. Moreover, the potential impact of any single asset’s performance on the overall performance of our portfolio increases. Further, we have certain fixed operating expenses, including certain expenses as a public reporting company, regardless of whether we are able to raise substantial funds in our IPO. Our inability to raise substantial funds would increase our fixed operating expenses as a percentage of gross income, reducing our net income and limiting our ability to make distributions to our stockholders. Certain participating broker-dealers suspended the sale of public, non-listed REITs, including our shares, as a result of the COVID-19 pandemic. Although most of those suspensions occurred during the period when our IPO was suspended by our Board, there is no assurance that our participating dealers’ sales efforts will return to pre-suspension levels or resume at all, which increases the risk that we are unable to raise substantial funds in our IPO.
Compliance with the SEC’s Regulation Best Interest by participating broker-dealers may negatively impact our ability to raise capital in our IPO, which would harm our ability to achieve our investment objectives.
Commencing June 30, 2020, broker-dealers must comply with Regulation Best Interest, which, among other requirements, establishes a new standard of conduct for broker-dealers and natural persons who are associated persons of a broker-dealer when making a recommendation of any securities transaction or investment strategy involving securities to a retail customer. The impact of Regulation Best Interest on participating dealers cannot be determined at this time, and it may negatively impact whether participating dealers and their associated persons recommend our continuous public offering to certain retail customers. If Regulation Best Interest reduces our ability to raise capital in our IPO, it would harm our ability to create a diversified portfolio of investments and ability to achieve our investment objectives.
Risks Related to Our Industry
The continuing spread of a new strain of coronavirus, which causes the viral disease known as COVID-19, has adversely affected our investments and operations and may have additional adverse effects in the future.
Since its discovery in December 2019, a new strain of coronavirus, which causes the viral disease known as COVID-19, has spread from China to most other countries, including the United States. The World Health Organization declared the COVID-19 outbreak a pandemic, the Health and Human Services Secretary declared a public health emergency in the United States and the President of the
42
United States declared a national emergency. Considerable uncertainty still surrounds the COVID-19 pandemic and its potential effects, and the extent of and effectiveness of any responses taken on a national and local level. The impact of the COVID-19 pandemic on the U.S. and world economies is uncertain and could result in a world-wide economic downturn that may lead to corporate bankruptcies in the most affected industries and has caused an increase in unemployment.
As a result of our investments being secured entirely by properties located in the United States, the COVID-19 pandemic has adversely impacted and may further adversely impact our investments and operating results to the extent that its continued spread within the United States reduces occupancy, increases the cost of operation or results in limited hours or necessitates the closure of such properties. In addition, quarantines, states of emergencies and other measures taken to curb the spread of the coronavirus may negatively impact the ability of such properties to continue to obtain necessary goods and services or provide adequate staffing, which may also adversely affect our investments and operating results. In particular, with respect to our investments in or secured by hospitality properties, a variety of factors related to the COVID-19 pandemic have caused, and are expected to continue to cause, a decline in business and leisure travel, including but not limited to (i) restrictions in travel, including those imposed by governmental entities and employers, (ii) the postponement or cancellation of industry conventions and conferences, music and arts festivals, sporting events and other large public gatherings, (iii) the closure or limited reopening of amusement parks, museums and other tourist attractions, (iv) the closure of colleges and universities, and (v) negative public perceptions of travel and public gatherings in light of the perceived risks associated with the coronavirus. The borrower under one of our CRE loans secured by a hospitality property defaulted during May 2020 and we expect to take ownership of the hotel through a deed-in-lieu of foreclosure. We have also modified one loan secured by a hospitality property to assist the borrower in dealing with the effects of the pandemic. In addition, with respect to our investments secured by retail properties, individual stores and shopping malls have been, and may continue to be, closed for an extended period of time or only open certain hours of the day.
To the extent the COVID-19 pandemic results in a world-wide economic downturn, there will likely be widespread corporate bankruptcies and a continued increase in unemployment, which could negatively impact our investments and operations, as well as our ability to make distributions to our stockholders. The extent to which the coronavirus further impacts our investments and operations will depend on future developments, which are highly uncertain and cannot be predicted with confidence, including the duration of the outbreak, new information that may emerge concerning the severity of the coronavirus and the actions taken to contain the coronavirus or treat its impact, among others.
Risks Related to Our Investments
Delays in liquidating defaulted CRE debt investments could reduce our investment returns.
The occurrence of a default on a CRE debt investment could result in our taking title to collateral. The borrower under one of our CRE loans secured by the Renaissance Chicago O’Hare Suites Hotel in Chicago, Illinois, defaulted during May 2020, and we expect to take ownership of the hotel through a deed-in-lieu of foreclosure. When there is a default on a CRE debt investment, we may not be able to take title to and sell the collateral securing the loan quickly. Taking title to collateral can be an expensive and lengthy process that could have a negative effect on the return on our investment. Borrowers often resist when lenders, such as us, seek to take title to collateral by asserting numerous claims, counterclaims and defenses, including but not limited to lender liability claims, in an effort to prolong the foreclosure action. In some states, taking title to collateral can take several years or more to resolve. At any time during a foreclosure proceeding, for instance, the borrower may file for bankruptcy, which would have the effect of staying the foreclosure action and further delaying the foreclosure process. The resulting time delay could reduce the value of our investment in the defaulted loans. Furthermore, an action to take title to collateral securing a loan is regulated by state statutes and regulations and is subject to the delays and expenses associated with lawsuits if the borrower raises defenses, counterclaims or files for bankruptcy. In the event of default by a borrower, these restrictions, among other things, may impede our ability to take title to and sell the collateral securing the loan or to obtain proceeds sufficient to repay all amounts due to us on the loan. In addition, we may be forced to operate any collateral for which we take title for a substantial period of time, which could be a distraction for our management team and may require us to pay significant costs associated with such collateral. We may not recover any of our investment even if we take title to collateral.
Because we expect to acquire a hotel through foreclosure and may acquire additional hotels, we will be directly exposed to the unique risks of the hospitality sector, including seasonality, volatility and the severe reduction in occupancy caused by the COVID-19 pandemic.
We expect to acquire a hotel, the Renaissance Chicago O’Hare Suites Hotel, in Chicago, Illinois, through foreclosure or a deed-in-lieu of foreclosure, and we may foreclose upon or otherwise own other hospitality properties in the future. The hospitality market is seasonal, highly competitive and influenced by factors such as general and local economic conditions, location, room rates, quality, service levels, reputation and reservation systems, among many other factors. The hospitality market generally experiences seasonal slowdown in the third quarter and, to a lesser extent, in the fourth quarter of each year. As a result of such seasonality, there will likely be quarterly fluctuations in results of operations of any hospitality properties that we own. There are many competitors in this market, and these competitors may have substantially greater marketing and financial resources than those available to us. This competition, along with other factors, such as over-building in the hospitality market, may increase the number of rooms available and may
43
decrease the average occupancy and room rates of our hospitality properties. The demand for rooms at any hospitality properties that we may acquire will change much more rapidly than the demand for space at other properties that we acquire. In addition, any such properties we may own may be adversely affected by factors outside our control, such as extreme weather conditions or natural disasters, terrorist attacks or alerts, outbreaks of contagious diseases, airline strikes, economic factors and other considerations affecting travel. For example, the hospitality market has been severely impacted by the COVID-19 pandemic. These factors could have a material adverse effect on the performance of our hotels and our results of operations and ability to pay distributions to stockholders.
The following factors should be considered since the COVID-19 pandemic has been significantly adversely affecting the ability of hotel managers to successfully operate hotels and has had, and the continued and prolonged effects of the COVID-19 may have, a significant adverse effect on the financial condition, results of operations and cash flows of hotels due to, among other factors:
|
|
• |
a variety of factors related to the COVID-19 pandemic have caused, and are expected to continue to cause, a sharp decline in group, business and leisure travel, including but not limited to (i) restrictions on travel mandated by governmental entities or voluntarily imposed by employers, (ii) the postponement or cancellation of conventions and conferences, music and arts festivals, sporting events and other large public gatherings, (iii) the closure of amusement parks, museums and other tourist attractions, (iv) the closure of colleges and universities, and (v) negative public perceptions of travel and public gatherings in light of the perceived risks associated with COVID-19; |
|
|
• |
travelers are, and may continue to be, wary to travel where, or because, they may view the risk of contagion as increased and contagion or virus-related deaths linked or alleged to be linked to travel to our properties, whether accurate or not, may injure our reputation; |
|
|
• |
travelers may be dissuaded from traveling due to possible enhanced COVID-19-related screening measures which are being implemented across multiple markets; |
|
|
• |
travelers may be dissuaded from traveling due to the concern that additional travel restrictions implemented between their departure and return may affect their ability to return to their homes; |
|
|
• |
commercial airline service has at various times been reduced or suspended to many areas in the U.S., and if airline service does not increase or return to normal pre-pandemic levels, it could negatively affect our hotel revenues, particularly at hotels that are located near major airports and convention centers outside the central business district, such as the Renaissance Chicago O’Hare Suites Hotel, which depend heavily on the volume of air travel and meetings and other events, particularly those of businesses, for their revenues; |
|
|
• |
the reduced economic activity could also result in an economic recession, and increased unemployment, which could negatively impact future ability or desire to travel lodging demand and, therefore, our revenues, even after the temporary restrictions are lifted; |
|
|
• |
a decrease in the ancillary revenue from amenities at our properties; |
|
|
• |
the potential negative impact on the health of hotel personnel, particularly if a significant number of them are impacted, could result in a deterioration in our ability to ensure business continuity during and after this disruption; and |
|
|
• |
we or our hotel managers may be subject to increased risks related to employee matters, including increased employment litigation and claims for severance or other benefits tied to termination or furloughs as a result of reduced operations prompted by the effects of the pandemic. |
We expect to own a ground lease interest in, as opposed to fee title to, the Renaissance Chicago O’Hare Suites Hotel. This ground lease runs through March 2098. If we are unable or otherwise fail to comply with the terms of the ground lease, for example, because the hotel and our other investments fail to generate enough cash to allow us to make our rent payments, we may lose our interest in the hotel or suffer other adverse outcomes under the lease.
We invest in CRE securities, including CMBS, CRE CLOs and other subordinate securities, which entail certain heightened risks.
We invest in a variety of CRE securities, including CMBS, CRE CLOs and other subordinate securities, which may be subject to the first risk of loss if any losses are realized on the underlying mortgage loans. CMBS and CRE CLOs entitle the holders thereof to receive payments that depend primarily on the cash flow from a specified pool of commercial or multifamily mortgage loans. Consequently, CMBS, CRE CLOs and other CRE securities will be adversely affected by payment defaults, delinquencies and losses on the underlying mortgage loans, which increase during times of economic stress and uncertainty. For example, in April 2020, we sold six CMBS positions with values negatively impacted in the wake of the COVID-19 pandemic with a total par value of $63.3 million and realized losses on those sales of approximately $19.3 million. Furthermore, if the rental and leasing markets deteriorate, including by decreasing occupancy rates and decreasing market rental rates, it could reduce cash flow from the mortgage loan pools
44
underlying our CMBS and CRE CLO investments. The market for CRE securities is dependent upon liquidity for refinancing and may be negatively impacted by a slowdown in new issuance.
Additionally, CRE securities such as CMBS and CRE CLOs may be subject to particular risks, including lack of standardized terms and payment of all or substantially all of the principal only at maturity rather than regular amortization of principal. The value of CRE securities may change due to shifts in the market’s perception of issuers and regulatory or tax changes adversely affecting the CRE debt market as a whole. Additional risks may be presented by the type and use of a particular commercial property, as well as the general risks relating to the net operating income from and value of any commercial property. The exercise of remedies and successful realization of liquidation proceeds relating to CRE securities may be highly dependent upon the performance of the servicer or special servicer. Expenses of enforcing the underlying mortgage loan (including litigation expenses) and expenses of protecting the properties securing the loan may be substantial. Consequently, in the event of a default or loss on one or more loans contained in a securitization, we may not recover a portion or all of our investment. Ratings for CRE securities can also adversely affect their value.
Risks Related to Our Financing Strategy
We use short-term borrowings to finance our investments and may need to use such borrowings for extended periods of time to the extent we are unable to access long-term financing. This may expose us to increased risks associated with decreases in the fair value of the underlying collateral, which could have an adverse impact on our financial condition and results of operations.
While we seek nonrecourse, non-mark-to-market, long-term financing through securitization financing transactions or other structures, such financing may be unavailable to us on favorable terms or at all. Consequently, we may be dependent on short-term financing arrangements that are not matched in duration to our financial assets. Short-term borrowing through repurchase arrangements, credit facilities and other types of borrowings may put our assets and financial condition at risk. Furthermore, the cost of borrowings may increase substantially if lenders view us as having increased credit risk during periods of market distress. Any such short-term financing may also be recourse to us, which will increase the risk of our investments.
In addition, the value of assets underlying any such short-term financing may be marked-to-market periodically by the lender, including on a daily basis. To the extent these financing arrangements contain mark-to-market provisions, if the market value of the investments pledged by us declines due to credit quality deterioration, we may be required by our lenders to provide additional collateral or pay down a portion of our borrowings. In a weakening economic environment, we would generally expect credit quality and the value of the investment that serves as collateral for our financing arrangements to decline, and in such a scenario, it is likely that the terms of our financing arrangements would require partial repayment from us, which could be substantial. In the wake of the COVID-19 pandemic, the purchasers of our CMBS under our master repurchase agreements required us to post additional assets as margin to secure our repurchase obligations. As of June 30, 2020, we had $0.4 million in restricted cash posted as additional collateral for our master repurchase agreement borrowings. In April 2020, we sold six CMBS positions with values negatively impacted in the wake of the pandemic with a total par value of $63.3 million and realized losses on those sales of approximately $19.3 million.
The repurchase agreements, secured loans and other financing arrangements that we use to finance our investments have required, and in the future may continue to require, us to provide additional collateral and may restrict us from leveraging our assets as fully as desired.
The amount of financing we receive, or may in the future receive, under our repurchase agreements, secured loans and other financing arrangements, is directly related to the lenders’ valuation of the assets that secure the outstanding borrowings. Lenders under our repurchase agreements and secured loans typically have the absolute right to reevaluate the market value of the assets that secure outstanding borrowings at any time. If a lender determines in its sole discretion that the value of the assets has decreased, it has the right to initiate a margin call or increase collateral requirements. A margin call or increased collateral requirements would require us to transfer additional assets to such lender without any advance of funds from the lender for such transfer or to repay a portion of the outstanding borrowings. Any such margin call or increased collateral requirements could have a material adverse effect on our results of operations, financial condition, business, liquidity and ability to make distributions to our stockholders, and could cause the value of our capital stock to decline. In the wake of the COVID-19 pandemic, the purchasers of our CMBS under our master repurchase agreements required us to post additional assets as margin to secure our repurchase obligations. As of June 30, 2020, we had $0.4 million in restricted cash posted as additional collateral for our master repurchase agreement borrowings. In April 2020, we sold six CMBS positions with values negatively impacted in the wake of the pandemic with a total par value of $63.3 million and realized losses on those sales of approximately $19.3 million. We may be forced to sell assets at significantly depressed prices to meet such margin calls and to maintain adequate liquidity, which could cause us to incur losses. Moreover, to the extent we are forced to sell assets at such time, given market conditions, we may be selling at the same time as others facing similar pressures, which could exacerbate a difficult market environment and which could result in our incurring significantly greater losses on our sale of such assets. In an extreme case of market duress, a market may not even be present for certain of our assets at any price. Such a situation would likely result in a rapid deterioration of our financial condition and possibly necessitate a filing for bankruptcy protection.
45
Further, financial institutions providing the repurchase facilities may require us to maintain a certain amount of cash uninvested or to set aside non-levered assets sufficient to maintain a specified liquidity position which would allow us to satisfy our collateral obligations. As a result, we may not be able to leverage our assets as fully as desired, which could reduce our return on equity. If we are unable to meet these collateral obligations, our financial condition could deteriorate rapidly.
Risks Related to Our Operations
Our distribution policy is subject to change.
We cannot guarantee the amount of distributions paid, if any. Our Board will determine an appropriate common stock distribution based upon numerous factors, including our targeted distribution rate, REIT qualification requirements, the amount of cash flow generated from operations, availability of existing cash balances, borrowing capacity under existing credit agreements, access to cash in the capital markets and other financing sources, our view of our ability to realize gains in the future through appreciation in the value of our assets, general economic conditions and economic conditions that more specifically impact our business or prospects. Future distribution levels are subject to adjustment based upon any one or more of the risk factors set forth herein, as well as other factors that our Board may, from time-to-time, deem relevant to consider when determining an appropriate common stock distribution. The amount of distributions we may pay in the future is not certain.
On March 24, 2020, our Board suspended the payment of distributions to our stockholders, after considering various factors, including the impact of the global COVID-19 pandemic on the economy and the inability to accurately calculate our NAV. On July 30, 2020, our Board authorized a distribution on our common stock to be paid to stockholders of record as of July 31, 2020, but our board may determine to formally suspend or otherwise not authorize monthly or any distributions in the future.
The success of our continuous public offering is dependent, in part, on the ability of the Dealer Manager to retain key employees and to successfully build and maintain a network of licensed broker-dealers and on the efforts of those participating broker-dealers to promote our IPO.
The dealer manager for our continuous public offering is Inland Securities Corporation. The success of our IPO and our ability to implement our business strategy is dependent upon the ability of the Dealer Manager to retain key employees and to build and maintain a network of licensed securities broker-dealers and other agents. If the Dealer Manager is unable to retain qualified employees or build and maintain a sufficient network of participating broker-dealers to distribute shares in our IPO, we may not be able to raise adequate proceeds through our IPO to implement our investment strategy. Certain participating broker-dealers suspended the sale of public, non-listed REITs, including our shares, as a result of the economic effects and uncertainty surrounding the onset COVID-19 pandemic. Although most of those suspensions have since been lifted, there is no assurance that our participating dealers’ sales efforts will return to pre-suspension levels or resume at all, which increases the risk that we are unable to raise substantial funds in our IPO.
Participating dealers may choose not to promote our IPO even if they resume the sale of other public, non-listed REITs because of the previous suspension of our IPO by our Board and the continued suspension of our SRP. In addition, the Dealer Manager currently serves and may serve as dealer manager for other issuers. As a result, the Dealer Manager may experience conflicts of interest in allocating its time between our IPO and such other issuers, which could adversely affect our ability to raise adequate proceeds through our IPO and implement our investment strategy. Further, the participating broker-dealers retained by the Dealer Manager may have numerous competing investment products, some with similar or identical investment strategies and areas of focus as us, which they may elect to emphasize to their retail clients.
Risks Related to our REIT Status and Certain Other Tax Items
Foreclosures may impact our ability to qualify as a REIT and minimize tax liabilities.
If we foreclose, or consider foreclosing, on properties securing defaulted loans that we hold, we will have to consider the impact that taking ownership of such properties would have on our ability to continue to qualify to be taxed as a REIT and any tax liabilities attributable thereto if we continue to qualify as a REIT. In certain cases, operation of real property will not generate qualifying rents from real property for purposes of the REIT gross income tests, e.g., income from operation of a hotel. In certain circumstances, we will be able to make an election with the IRS to treat property we take possession of in a foreclosure as “foreclosure property.” If, and for so long as, such property qualifies as “foreclosure property,” income therefrom is treated as qualifying income for purposes of both REIT gross income tests and gain from the sale of such property will not be subject to the 100% prohibited transaction tax for dealer sales, regardless of our how short our holding period in such property is when we sell such property or other dealer sales considerations. On the other hand, net income with respect to a property for which we have made a foreclosure property election that would not otherwise be qualifying income for purposes of the gross income tests will be subject to corporate income tax. In certain circumstances, the IRS might argue that a particular property did not qualify for a foreclosure property election or that its status as
46
foreclosure property terminated while we believed it continued to qualify, possibly causing us to fail one or both gross income tests or causing any gain from sale of such property to be subject to the prohibited transaction tax.
We may choose to pay dividends in a combination of cash and our own common stock, in which case stockholders may be required to pay income taxes in excess of the cash dividends they receive.
We may choose to pay dividends in a combination of cash and our own common stock. Under IRS Revenue Procedures 2017-45 and 2020-19, as a publicly offered REIT, we may give stockholders a choice, subject to various limits and requirements, of receiving a dividend in cash or in our common stock. As long as at least 20% (10% for dividends declared on or after April 1, 2020 and on or before December 31, 2020) of the total dividend is available in cash and certain other requirements are satisfied, the IRS will treat the stock distribution as a dividend (to the extent applicable rules treat such distribution as being made out of our earnings and profits). As a result, U.S. stockholders may be required to pay income taxes with respect to such dividends in excess of the cash dividends they receive. In the case of non-U.S. stockholders, we generally will be required to withhold tax with respect to the entire dividend, which withholding tax may exceed the amount of cash such non-U.S. stockholder would otherwise receive.
Item 2. Unregistered Sales of Equity Securities and Use of Proceeds
Recent Sales of Unregistered Equity Securities (Dollar amounts in thousands)
On October 25, 2016, we commenced the Private Offering of up to $500,000 in our Class P Shares. The Class P Shares were offered and sold pursuant to an exemption from the registration requirements of the Securities Act, in accordance with Rule 506(b) of Regulation D, and in compliance with any applicable state securities laws. On June 28, 2019, we terminated the Private Offering. We continued to accept Private Offering subscription proceeds through July 16, 2019. As of July 16, 2019, we issued 10,258,094 Class P Shares resulting in gross offering proceeds of $276,681. Inland Securities Corporation served as our dealer manager for the Private Offering.
We have not sold any securities which were not registered under the Securities Act during the period covered by this report.
Use of Proceeds
On May 3, 2019, our Registration Statement on Form S-11 (File No. 333-230465), covering the IPO of up to $2,350,000 in shares of Class A, Class T, Class S, Class D and Class I common stock, was declared effective under the Securities Act. Inland Securities Corporation serves as our dealer manager for the IPO.
The offering price for each class of our common stock is determined monthly and is made available on our website and in prospectus supplement filings. As of June 30, 2020, we received net offering proceeds of $36,314 from the IPO. The following table summarizes certain information about the IPO proceeds ($ in thousands except for share data):
|
|
|
Class A Shares |
|
|
Class T Shares |
|
|
Class S Shares |
|
|
Class D Shares |
|
|
Class I Shares |
|
|
Total |
|
||||||
|
Primary shares sold |
|
|
653,566 |
|
|
|
397,251 |
|
|
|
— |
|
|
|
50,081 |
|
|
|
377,105 |
|
|
|
1,478,003 |
|
|
Gross proceeds from primary offering |
|
$ |
17,308 |
|
|
$ |
10,206 |
|
|
$ |
— |
|
|
$ |
1,237 |
|
|
$ |
9,410 |
|
|
$ |
38,161 |
|
|
Reinvestments of distributions |
|
|
73 |
|
|
|
33 |
|
|
|
— |
|
|
|
18 |
|
|
|
40 |
|
|
|
164 |
|
|
Total gross proceeds |
|
|
17,381 |
|
|
|
10,239 |
|
|
|
— |
|
|
|
1,255 |
|
|
|
9,450 |
|
|
|
38,325 |
|
|
Selling commissions and dealer manager fees |
|
|
1,004 |
|
|
|
284 |
|
|
|
— |
|
|
|
— |
|
|
|
— |
|
|
|
1,288 |
|
|
Stockholder servicing fees |
|
|
— |
|
|
|
615 |
|
|
|
— |
|
|
|
108 |
|
|
|
— |
|
|
|
723 |
|
|
Total expenses |
|
|
1,004 |
|
|
|
899 |
|
|
|
— |
|
|
|
108 |
|
|
|
— |
|
|
|
2,011 |
|
|
Net offering proceeds(1) |
|
$ |
16,377 |
|
|
$ |
9,340 |
|
|
$ |
— |
|
|
$ |
1,147 |
|
|
$ |
9,450 |
|
|
$ |
36,314 |
|
|
(1) |
Excludes fund level offering costs of $3,339. |
We primarily used the net offering proceeds from the IPO to originate commercial real estate loans and purchase real estate securities on a levered basis, subject to our investment guidelines and to the extent consistent with maintaining our REIT qualification, and other general corporate purposes.
On March 24, 2020, our Board suspended our IPO, effective immediately, and the DRP, effective April 6, 2020. The IPO and DRP will remain suspended until such time as our Board approves their resumption.
47
In determining to suspend the IPO and the DRP, our Board considered various factors, including the impact of the global COVID-19 pandemic on the economy, the inability to accurately calculate our NAV per share due to uncertainty, volatility and lack of liquidity in the market, our need for liquidity due to financing challenges related to additional collateral required by the banks that regularly finance our assets and these uncertain and rapidly changing economic conditions. While we did not calculate the NAV for the months of March through May 2020, our Advisor has determined that there has been reduced volatility in the market for the Company’s investments and some improvement in the U.S. economic outlook, and our Advisor has resumed calculation of the NAV beginning as of June 30, 2020 and our Board authorized a distribution on July 30, 2020 to stockholders of record as of July 31, 2020. However, our IPO and DRP remained suspended. We are working toward and intend to restart the IPO and the DRP subject to receiving the required regulatory approvals to do so. We will continue to closely monitor the pandemic, the economy and the markets for the Company’s investments in order to determine an appropriate time to resume our IPO. Please refer to “Note 13 – Subsequent Events” and Part II, “Item 1A – Risk Factors” for updates on our business after June 30, 2020 and discussion of risk factors related to the COVID-19 pandemic, respectively.
Repurchases of Common Stock
We have adopted the SRP, whereby on a monthly basis, stockholders may request that we repurchase all or any portion of their shares. The total amount of aggregate repurchases of shares will be limited to no more than 2% of our aggregate NAV per month as of the last day of the previous calendar month and no more than 5% of our aggregate NAV per calendar quarter as of the last day of the previous calendar month. Stockholders may not request that we repurchase their shares for at least one year, provided we can waive the holding period in the event of death. As of the commencement of the IPO, holders of Class P Shares from the Private Offering could not submit requests to have their shares repurchased prior to the NAV Pricing Date, except in the event of a death or qualifying disability.
Due to the illiquid nature of investments in real estate, we may not have sufficient liquid resources to fund repurchase requests. We may choose to repurchase all, some or none of the shares that have been requested to be repurchased at the end of any particular month, in our discretion, subject to any limitations in the SRP. Further, our Board may modify, suspend or terminate the SRP.
On March 24, 2020, our Board suspended our SRP. The SRP will remain suspended until such time as our Board approves its resumption. During the three months ended June 30, 2020, we did not repurchase any shares of our common stock due to the suspension of the SRP in March.
In determining to suspend the SRP, our Board considered various factors, including the impact of the global COVID-19 pandemic on the economy, the inability to accurately calculate our NAV per share due to uncertainty, volatility and lack of liquidity in the market, our need for liquidity due to financing challenges related to additional collateral required by the banks that regularly finance our assets and uncertain and rapidly changing economic conditions. While we did not calculate the NAV for the months of March through May 2020, our Advisor has determined since then that there has been reduced volatility in the market for our investments and some improvement in the U.S. economic outlook, and our Advisor resumed calculation of the NAV beginning as of June 30, 2020. However, the SRP remained suspended. We will continue to closely monitor this situation in order to determine an appropriate time to resume the SRP. Please refer to “Note 13 – Subsequent Events” and Part II, “Item 1A – Risk Factors” for updates on our business after June 30, 2020 and discussion of risk factors related to the COVID-19 pandemic, respectively.
Item 3. Defaults Upon Senior Securities
None.
Item 4. Mine Safety Disclosures
Not Applicable.
Not Applicable.
48
The representations, warranties and covenants made by us in any agreement filed as an exhibit to this Quarterly Report on Form 10-Q are made solely for the benefit of the parties to the agreement, including, in some cases, for the purpose of allocating risk among the parties to the agreement, and should not be deemed to be representations, warranties or covenants to, or with, you. Moreover, these representations, warranties and covenants should not be relied upon as accurately describing or reflecting the current state of our affairs.
The exhibits filed in response to Item 601 of Regulation S-K are listed on the Exhibit Index attached hereto and are incorporated herein by reference.
|
Exhibit No. |
|
Description |
|
|
|
|
|
3.1 |
|
|
|
3.2 |
|
|
|
3.3 |
|
|
|
3.4 |
|
|
|
3.5 |
|
|
|
4.1 |
|
|
|
31.1* |
|
|
|
31.2* |
|
|
|
32.1* |
|
|
|
32.2* |
|
|
|
101 |
|
The following financial information from our Quarterly Report on Form 10-Q for the period ended June 30, 2020, filed with the Securities and Exchange Commission on August 12, 2020 is formatted in Extensible Business Reporting Language (“XBRL”): (i) Consolidated Balance Sheets; (ii) Consolidated Statements of Operations; (iii) Consolidated Statements of Changes in Stockholders’ Equity; (iv) Consolidated Statements of Cash Flows; and (v) Notes to Consolidated Financial Statements (tagged as blocks of text) |
|
* |
Filed as part of this Quarterly Report on Form 10-Q |
49
Pursuant to the requirements of the Securities Exchange Act of 1934, as amended, the registrant has duly caused this report to be signed on its behalf by the undersigned, thereunto duly authorized.
|
INPOINT COMMERCIAL REAL ESTATE INCOME, INC.
|
|
|
|
|
|
By: |
/s/ Mitchell A. Sabshon |
|
Name: |
Mitchell A. Sabshon |
|
Title: |
Chief Executive Officer and Chairman |
|
|
(principal executive officer) |
|
Date: |
August 12, 2020 |
|
|
|
|
By: |
/s/ Catherine L. Lynch |
|
Name: |
Catherine L. Lynch |
|
Title: |
Chief Financial Officer |
|
|
(principal financial officer) |
|
Date: |
August 12, 2020 |
50