Attached files
| file | filename |
|---|---|
| EX-32.2 - EX-32.2 - InPoint Commercial Real Estate Income, Inc. | ck0001690012-ex322_7.htm |
| EX-32.1 - EX-32.1 - InPoint Commercial Real Estate Income, Inc. | ck0001690012-ex321_6.htm |
| EX-31.2 - EX-31.2 - InPoint Commercial Real Estate Income, Inc. | ck0001690012-ex312_9.htm |
| EX-31.1 - EX-31.1 - InPoint Commercial Real Estate Income, Inc. | ck0001690012-ex311_8.htm |
UNITED STATES
SECURITIES AND EXCHANGE COMMISSION
Washington, D.C. 20549
FORM 10-Q
☑ QUARTERLY REPORT PURSUANT TO SECTION 13 OR 15(d) OF THE SECURITIES EXCHANGE ACT OF 1934
For the quarterly period ended June 30, 2018
OR
☐ TRANSITION REPORT PURSUANT TO SECTION 13 OR 15(d) OF THE SECURITIES EXCHANGE ACT OF 1934
For the transition period from to
Commission file number 000-55782
INPOINT COMMERCIAL REAL ESTATE INCOME, INC.
(Exact name of registrant as specified in its charter)
|
Maryland |
32-0506267 |
|
(State or other jurisdiction of incorporation or organization) |
(I.R.S. Employer Identification No.) |
|
2901 Butterfield Road Oak Brook, Illinois |
60523 |
|
(Address of principal executive offices) |
(Zip Code) |
(800) 826-8228
(Registrant’s telephone number, including area code)
Indicate by check mark whether the registrant (1) has filed all reports required to be filed by Section 13 or 15(d) of the Securities Exchange Act of 1934 during the preceding 12 months (or for such shorter period that the registrant was required to file such reports), and (2) has been subject to the filing requirements for the past 90 days. Yes ☒ No ☐
Indicate by check mark whether the registrant has submitted electronically and posted on its corporate Web site, if any, every Interactive Data File required to be submitted and posted pursuant to Rule 405 of Regulation S-T (§232.405 of this chapter) during the preceding 12 months (or for such shorter period that the registrant was required to submit and post such files). Yes ☒ No ☐
Indicate by check mark whether the registrant is a large accelerated filer, an accelerated filer, a non-accelerated filer, a smaller reporting company, or an emerging growth company. See the definitions of “large accelerated filer,” “accelerated filer,” “smaller reporting company,” and “emerging growth company” in Rule 12b-2 of the Exchange Act.
|
Large accelerated filer |
☐ |
Accelerated filer |
☐ |
|
|
|
|
|
|
Non-accelerated filer |
☐ (Do not check if a smaller reporting company) |
Smaller Reporting Company |
☒ |
|
|
|
|
|
|
Emerging Growth Company |
☒ |
|
|
If an emerging growth company, indicate by check mark if the registrant has elected not to use the extended transition period for complying with any new or revised financial accounting standards provided pursuant to Section 13(a) of the Exchange Act. ☒
Indicate by check mark whether the registrant is a shell company (as defined in Rule 12b-2 of the Exchange Act). Yes ☐ No ☒
As of August 8, 2018, there were 4,106,749 shares of the Registrant’s Class P Common Stock outstanding.
|
PART I FINANCIAL INFORMATION |
|
||
|
Item 1. |
Financial Statements |
|
|
|
|
|
|
|
|
|
Consolidated Balance Sheets as of June 30, 2018 (unaudited) and December 31, 2017 |
1 |
|
|
|
|
|
|
|
|
2 |
||
|
|
|
|
|
|
|
3 |
||
|
|
|
|
|
|
|
Unaudited Consolidated Statements of Cash Flows for the six-months ended June 30, 2018 and 2017 |
4 |
|
|
|
|
|
|
|
|
5 |
||
|
|
|
|
|
|
Item 2. |
Management’s Discussion and Analysis of Financial Condition and Results of Operations |
15 |
|
|
|
|
|
|
|
Item 3. |
26 |
||
|
|
|
|
|
|
Item 4. |
27 |
||
|
|
|
|
|
|
PART II OTHER INFORMATION |
|
||
|
|
|
|
|
|
Item 1. |
27 |
||
|
|
|
|
|
|
Item 1A. |
27 |
||
|
|
|
|
|
|
Item 2. |
27 |
||
|
|
|
|
|
|
Item 3. |
27 |
||
|
|
|
|
|
|
Item 4. |
27 |
||
|
|
|
|
|
|
Item 5. |
27 |
||
|
|
|
|
|
|
Item 6. |
28 |
||
|
|
|
||
|
29 |
|||
INPOINT COMMERCIAL REAL ESTATE INCOME, INC.
|
|
|
June 30, 2018 (unaudited) |
|
|
December 31, 2017 |
|
||
|
ASSETS |
|
|
|
|
|
|||
|
Cash and cash equivalents |
|
$ |
12,903,500 |
|
|
$ |
1,406,331 |
|
|
Real estate securities at fair value |
|
|
64,273,965 |
|
|
|
25,993,258 |
|
|
Commercial mortgage loans at cost, net of allowance for loan loss of $0 |
|
|
114,722,620 |
|
|
|
32,094,441 |
|
|
Deferred debt finance costs |
|
|
445,298 |
|
|
|
— |
|
|
Deferred offering costs |
|
|
1,168,194 |
|
|
|
1,502,901 |
|
|
Accrued interest receivable |
|
|
453,117 |
|
|
|
142,138 |
|
|
Prepaid expenses |
|
|
14,321 |
|
|
|
2,553 |
|
|
Other assets |
|
|
500 |
|
|
|
500 |
|
|
Total assets |
|
$ |
193,981,515 |
|
|
$ |
61,142,122 |
|
|
LIABILITIES AND EQUITY |
|
|
|
|
|
|
|
|
|
Liabilities: |
|
|
|
|
|
|
|
|
|
Repurchase agreements—real estate securities |
|
|
45,296,000 |
|
|
|
17,113,000 |
|
|
Repurchase agreements—commercial mortgage loans |
|
|
62,222,250 |
|
|
|
— |
|
|
Due to related parties |
|
|
1,712,802 |
|
|
|
1,511,679 |
|
|
Loan fees payable |
|
|
125,000 |
|
|
|
40,000 |
|
|
Interest payable |
|
|
131,147 |
|
|
|
23,518 |
|
|
Distributions payable |
|
|
516,693 |
|
|
|
258,470 |
|
|
Accrued expenses |
|
|
187,477 |
|
|
|
210,479 |
|
|
Total liabilities |
|
|
110,191,369 |
|
|
|
19,157,146 |
|
|
Stockholders’ Equity: |
|
|
|
|
|
|
|
|
|
Class P common stock, $0.001 par value, 450,000,000 shares authorized, 3,458,608 and 1,733,392 shares issued and outstanding at June 30, 2018 and December 31, 2017, respectively |
|
|
3,458 |
|
|
|
1,733 |
|
|
Additional paid in capital (net of offering costs of $6,573,086 and $2,918,704 at June 30, 2018 and December 31, 2017, respectively) |
|
|
86,603,168 |
|
|
|
43,428,043 |
|
|
Distributions in excess of earnings |
|
|
(2,816,480 |
) |
|
|
(1,444,800 |
) |
|
Total stockholders’ equity |
|
|
83,790,146 |
|
|
|
41,984,976 |
|
|
Total liabilities and stockholders’ equity |
|
$ |
193,981,515 |
|
|
$ |
61,142,122 |
|
The accompanying notes are an integral part of these consolidated financial statements
1
INPOINT COMMERCIAL REAL ESTATE INCOME, INC.
CONSOLIDATED STATEMENTS OF OPERATIONS
(unaudited)
|
|
|
Three-months ended June 30, |
|
|
Six-months ended June 30, |
|
||||||||||
|
|
|
2018 |
|
|
2017 |
|
|
2018 |
|
|
2017 |
|
||||
|
Interest income: |
|
|
|
|
|
|
|
|
|
|
|
|
|
|
|
|
|
Interest income |
|
|
1,986,407 |
|
|
|
148,305 |
|
|
|
2,816,611 |
|
|
|
250,044 |
|
|
Less: Interest expense |
|
|
(705,333 |
) |
|
|
(41,323 |
) |
|
|
(808,277 |
) |
|
|
(51,738 |
) |
|
Net interest income |
|
|
1,281,074 |
|
|
|
106,982 |
|
|
|
2,008,334 |
|
|
|
198,306 |
|
|
Operating expenses: |
|
|
|
|
|
|
|
|
|
|
|
|
|
|
|
|
|
Advisory fee |
|
|
539,466 |
|
|
|
— |
|
|
|
539,466 |
|
|
|
— |
|
|
Debt finance costs |
|
|
121,728 |
|
|
|
— |
|
|
|
186,712 |
|
|
|
— |
|
|
Administration expense |
|
|
— |
|
|
|
28,750 |
|
|
|
— |
|
|
|
57,500 |
|
|
Directors compensation |
|
|
20,750 |
|
|
|
19,850 |
|
|
|
42,350 |
|
|
|
40,600 |
|
|
Professional service fees |
|
|
90,070 |
|
|
|
209,522 |
|
|
|
206,569 |
|
|
|
230,334 |
|
|
Other expenses |
|
|
55,291 |
|
|
|
7,257 |
|
|
|
114,505 |
|
|
|
29,809 |
|
|
Total operating expenses |
|
|
827,305 |
|
|
|
265,379 |
|
|
|
1,089,602 |
|
|
|
358,243 |
|
|
Other income: |
|
|
|
|
|
|
|
|
|
|
|
|
|
|
|
|
|
Unrealized gain (loss) in value of real estate securities |
|
|
89,694 |
|
|
|
(18,520 |
) |
|
|
120,522 |
|
|
|
70,913 |
|
|
Total other income |
|
|
89,694 |
|
|
|
(18,520 |
) |
|
|
120,522 |
|
|
|
70,913 |
|
|
Net income (loss) |
|
$ |
543,463 |
|
|
$ |
(176,917 |
) |
|
$ |
1,039,254 |
|
|
$ |
(89,024 |
) |
|
Net income (loss) per share basic and diluted |
|
$ |
0.19 |
|
|
$ |
(0.40 |
) |
|
$ |
0.41 |
|
|
$ |
(0.25 |
) |
|
Weighted average number of shares |
|
|
|
|
|
|
|
|
|
|
|
|
|
|
|
|
|
Basic |
|
|
2,920,697 |
|
|
|
442,029 |
|
|
|
2,522,468 |
|
|
|
361,740 |
|
|
Diluted |
|
|
2,920,781 |
|
|
|
442,029 |
|
|
|
2,522,535 |
|
|
|
361,740 |
|
The accompanying notes are an integral part of these consolidated financial statements
2
INPOINT COMMERCIAL REAL ESTATE INCOME, INC.
CONSOLIDATED STATEMENT OF CHANGES IN STOCKHOLDERS’ EQUITY
Six-months ended June 30, 2018
(unaudited)
|
|
|
Common Stock |
|
|
|
|
|
|
|
|
|
|
|
|
|
|||||
|
|
|
Number of Shares |
|
|
Par Value |
|
|
Additional Paid in Capital |
|
|
Distributions in Excess of Earnings |
|
|
Total Stockholders’ Equity |
|
|||||
|
Balance as of December 31, 2017 |
|
|
1,733,392 |
|
|
$ |
1,733 |
|
|
$ |
43,428,043 |
|
|
$ |
(1,444,800 |
) |
|
$ |
41,984,976 |
|
|
Proceeds from offering |
|
|
1,725,216 |
|
|
|
1,725 |
|
|
|
46,826,174 |
|
|
|
— |
|
|
|
46,827,899 |
|
|
Offering costs |
|
|
— |
|
|
|
— |
|
|
|
(3,654,382 |
) |
|
|
— |
|
|
|
(3,654,382 |
) |
|
Net income |
|
|
— |
|
|
|
— |
|
|
|
— |
|
|
|
1,039,254 |
|
|
|
1,039,254 |
|
|
Distributions declared |
|
|
— |
|
|
|
— |
|
|
|
— |
|
|
|
(2,410,934 |
) |
|
|
(2,410,934 |
) |
|
Equity based compensation |
|
|
— |
|
|
|
— |
|
|
|
3,333 |
|
|
|
— |
|
|
|
3,333 |
|
|
Balance as of June 30, 2018 |
|
|
3,458,608 |
|
|
$ |
3,458 |
|
|
$ |
86,603,168 |
|
|
$ |
(2,816,480 |
) |
|
$ |
83,790,146 |
|
The accompanying notes are an integral part of these consolidated financial statements
3
INPOINT COMMERCIAL REAL ESTATE INCOME, INC.
CONSOLIDATED STATEMENTS OF CASH FLOWS
(unaudited)
|
|
|
For the six-months ended June 30, |
|
|||||
|
|
|
2018 |
|
|
2017 |
|
||
|
Cash flows from operating activities |
|
|
|
|
|
|
|
|
|
Net income (loss) |
|
|
1,039,254 |
|
|
|
(89,024 |
) |
|
Adjustments to reconcile net income to cash provided by operations: |
|
|
|
|
|
|
|
|
|
Net unrealized gain on real estate securities |
|
|
(120,522 |
) |
|
|
(70,913 |
) |
|
Amortization of equity based compensation |
|
|
3,333 |
|
|
|
— |
|
|
Amortization of debt finance costs |
|
|
186,712 |
|
|
|
— |
|
|
Amortization of bond (discount) premium |
|
|
(51,541 |
) |
|
|
45,533 |
|
|
Amortization of deferred exit fees |
|
|
(26,901 |
) |
|
|
— |
|
|
Changes in assets and liabilities: |
|
|
|
|
|
|
|
|
|
Accrued interest receivable |
|
|
(310,979 |
) |
|
|
(18,394 |
) |
|
Deferred debt finance costs |
|
|
(632,010 |
) |
|
|
— |
|
|
Prepaid expenses |
|
|
(11,768 |
) |
|
|
(17,875 |
) |
|
Interest payable |
|
|
107,629 |
|
|
|
7,680 |
|
|
Loan fees payable |
|
|
85,000 |
|
|
|
— |
|
|
Accrued expenses |
|
|
(23,001 |
) |
|
|
127,485 |
|
|
Due to related parties |
|
|
535,830 |
|
|
|
(27,750 |
) |
|
Other assets |
|
|
— |
|
|
|
(500 |
) |
|
Net cash provided by (used in) operating activities |
|
$ |
781,036 |
|
|
$ |
(43,758 |
) |
|
Cash flows from investing activities: |
|
|
|
|
|
|
|
|
|
Origination of commercial loans |
|
|
(82,601,279 |
) |
|
|
— |
|
|
Purchase of real estate securities |
|
|
(41,341,375 |
) |
|
|
(5,125,000 |
) |
|
Real estate securities sold |
|
|
2,996,250 |
|
|
|
— |
|
|
Real estate securities principal pay-down |
|
|
236,482 |
|
|
|
— |
|
|
Net cash used in investing activities |
|
$ |
(120,709,922 |
) |
|
$ |
(5,125,000 |
) |
|
Cash flows from financing activities: |
|
|
|
|
|
|
|
|
|
Proceeds from issuance of common stock |
|
|
46,827,899 |
|
|
|
10,180,261 |
|
|
Payment of offering costs |
|
|
(3,654,382 |
) |
|
|
(678,398 |
) |
|
Proceeds from repurchase agreements |
|
|
232,475,250 |
|
|
|
26,291,000 |
|
|
Principal repayments of repurchase agreements |
|
|
(142,070,000 |
) |
|
|
(19,921,000 |
) |
|
Distributions paid |
|
|
(2,152,712 |
) |
|
|
(297,462 |
) |
|
Net cash provided by financing activities |
|
$ |
131,426,055 |
|
|
$ |
15,574,401 |
|
|
Net change in cash and cash equivalents |
|
|
11,497,169 |
|
|
|
10,405,643 |
|
|
Cash and cash equivalents beginning of period |
|
|
1,406,331 |
|
|
|
511,854 |
|
|
Cash and cash equivalents end of period |
|
$ |
12,903,500 |
|
|
$ |
10,917,497 |
|
|
Supplemental disclosure of cash flow information: |
|
|
|
|
|
|
|
|
|
Change in deferred offering costs and accrued offering expenses, included in due to related parties |
|
$ |
(334,707 |
) |
|
$ |
579,616 |
|
|
Cash paid for interest |
|
$ |
700,648 |
|
|
$ |
44,058 |
|
|
Distributions payable |
|
$ |
516,693 |
|
|
$ |
82,179 |
|
The accompanying notes are an integral part of these consolidated financial statements
4
InPoint Commercial Real Estate Income, Inc.
Notes to Consolidated Financial Statements
June 30, 2018
(unaudited)
Note 1 – Organization and Business Operations
InPoint Commercial Real Estate Income, Inc. (the “Company”) was incorporated in Maryland on September 13, 2016 to originate, acquire and manage a diversified portfolio of commercial real estate (“CRE”) investments primarily comprised of (i) CRE debt, including first mortgage loans, subordinate mortgage and mezzanine loans (“Credit Loans”), and participations in such loans and (ii) CRE securities, such as commercial mortgage-backed securities, senior unsecured debt of publicly traded real estate investment trusts (“REITs”), and collateralized debt obligation notes. The Company may also invest in select equity investments in single-tenant, net leased properties. Substantially all of the Company’s business is conducted through InPoint REIT Operating Partnership, LP (the “OP”), a Delaware limited partnership. The Company is the sole general partner and directly or indirectly holds all of the limited partner interests in the OP.
The Company is externally managed by Inland InPoint Advisor, LLC (the “Advisor”), a Delaware limited liability company formed in August 2016 that is a wholly-owned indirect subsidiary of Inland Real Estate Investment Corporation, a member of The Inland Real Estate Group of Companies, Inc. The Advisor is responsible for coordinating the management of the day-to-day operations and originating, acquiring and managing the Company’s CRE investment portfolio, subject to the supervision of the Company’s board of directors. The Advisor performs its duties and responsibilities as the Company’s fiduciary pursuant to an advisory agreement dated October 25, 2016 among the Company, the Advisor and the OP (the “Advisory Agreement”).
The Advisor has delegated certain of its duties to SPCRE InPoint Advisors, LLC (the “Sub-Advisor”), a Delaware limited liability company formed in September 2016 that is a wholly-owned subsidiary of Sound Point CRE Management, LP, pursuant to a sub-advisory agreement between the Advisor and the Sub-Advisor. Among other duties, the Sub-Advisor has the authority to identify, negotiate, acquire and originate the Company’s investments and provide portfolio management, disposition, property management and leasing services to the Company. Notwithstanding such delegation to the Sub-Advisor or affiliates of the Sub-Advisor or Advisor, the Advisor retains ultimate responsibility for the performance of all the matters entrusted to it under the Advisory Agreement, including those duties which the Advisor has not delegated to the Sub-Advisor such as (i) valuation of the Company’s assets and calculation of the Company’s net asset value; (ii) management of the Company’s day-to-day operations, including the hiring and supervising of its employees, if any; (iii) preparation of stockholder reports and communications and arrangement of the Company’s annual stockholder meeting; and (iv) advising the Company regarding its qualification as a REIT for U.S. federal income tax purposes and monitoring its ongoing compliance with the REIT qualification requirements thereafter.
5
InPoint Commercial Real Estate Income, Inc.
Notes to Consolidated Financial Statements (continued)
June 30, 2018
(unaudited)
Note 2 – Summary of Significant Accounting Policies
Disclosures discussing all significant accounting policies are set forth in the Company’s Annual Report on Form 10-K for the year ended December 31, 2017 (the “Annual Report”), as filed with the Securities and Exchange Commission (the “SEC”) on March 14, 2018, under the heading Note 2 - Summary of Significant Accounting Policies. There have been no changes to the Company’s significant accounting policies for the three and six months ended June 30, 2018, except as noted below.
Equity-Based Compensation
In accordance with the Company’s Independent Director Restricted Share Plan (the “RSP”), restricted shares are issued to independent directors as compensation. The Company recognizes expense related to the fair value of equity-based compensation awards as operating expense in the consolidated statements of operations. The Company recognizes expense based on the fair value at the grant date on a straight-line basis over the vesting period representing the requisite service period. See Note 10 – "Equity-Based Compensation" for further information.
Basis of Accounting
The accompanying consolidated financial statements and related footnotes have been prepared in conformity with U.S. generally accepted accounting principles (“GAAP”) and require management to make estimates and assumptions that affect the reported amounts of assets and liabilities as of the date of the financial statements and the reported amounts of income and expenses during the reported periods. Actual results could differ from such estimates.
Commercial Mortgage Loans Held for Investment and Allowance for Loan Losses
Commercial mortgage loans are held for investment purposes and are anticipated to be held until maturity. Accordingly, they are carried at cost, net of unamortized loan fees and origination costs, and premiums or discounts. Commercial mortgage loans that are deemed to be impaired will be carried at amortized cost less a specific allowance for loan losses. Interest income is recorded on the accrual basis and related discounts, premiums and net deferred fees or costs on investments are amortized over the life of the investment using the effective interest method. Amortization is reflected as an adjustment to interest income in the Company’s consolidated statements of operations. Upon measurement of impairment, the Company records an allowance for loan losses to reduce the carrying value of the loan with a corresponding charge through the provision for loan losses on the Company’s consolidated statements of operations.
The allowance for loan losses reflects management's estimate of loan losses inherent in the loan portfolio as of the balance sheet date. The Company uses a uniform process for determining its allowance for loan losses. The allowance for loan losses includes an asset-specific component and may include a general, formula-based component when the portfolio is determined to be of sufficient size to warrant such a reserve.
The asset-specific reserve component relates to reserves for losses on individual impaired loans. The Company considers a loan to be impaired when, based upon current information and events, it believes that it is probable that the Company will be unable to collect all amounts due under the contractual terms of the loan agreement. This assessment is made on an individual loan basis each quarter based on such factors as payment status, lien position, borrower financial resources and investment in collateral, collateral type, project economics and geographic location, as well as national and regional economic factors. A reserve is established for an impaired loan when the present value of payments expected to be received, observable market prices or the estimated fair value of the collateral (for loans that are dependent on the collateral for repayment) is lower than the carrying value of that loan.
For collateral dependent impaired loans, impairment is measured using the estimated fair value of collateral less the estimated cost to sell. Valuations are performed or obtained at the time a loan is determined to be impaired and designated non-performing, and they are updated if circumstances indicate that a significant change in value has occurred. The Advisor generally will use the income approach through internally developed valuation models to estimate the fair value of the collateral for such loans. In more limited cases, the Advisor will obtain external “as is” appraisals for loan collateral, generally when third party participations exist.
6
InPoint Commercial Real Estate Income, Inc.
Notes to Consolidated Financial Statements (continued)
June 30, 2018
(unaudited)
General reserves are recorded when (i) available information as of each balance sheet date indicates that it is probable a loss has occurred in the portfolio and (ii) the amount of the loss can be reasonably estimated. The Company’s policy is to estimate loss rates based on actual losses experienced, if any, or based on historical realized losses experienced in the industry if the Company has not experienced any losses. Current collateral and economic conditions affecting the probability and severity of losses are taken into account when establishing the allowance for loan losses.
The Company performs a comprehensive analysis of its loan portfolio and assigns risk ratings to loans that incorporate management's current judgments about their credit quality based on all known and relevant internal and external factors that may affect collectability. The Company considers, among other things, payment status, lien position, borrower financial resources and investment in collateral, collateral type, project economics and geographic location, as well as national and regional economic factors. This methodology results in loans being segmented by risk classification into risk rating categories that are associated with estimated probabilities of default and principal loss. Ratings range from “1” to “5” with “1” representing the lowest risk of loss and “5” representing the highest risk of loss.
Loans are generally placed on non-accrual status when principal or interest payments are past due 90 days or more or when there is reasonable doubt that principal or interest will be collected in full. Accrued and unpaid interest is generally reversed against interest income in the period the loan is placed on non-accrual status. Interest payments received on non-accrual loans may be recognized as income or applied to principal depending upon management's judgment regarding the borrower's ability to make pending principal and interest payments. Non-accrual loans are restored to accrual status when past due principal and interest is paid and, in management's judgment, are likely to remain current. The Company may make exceptions to placing a loan on non-accrual status if the loan has sufficient collateral value and is in the process of collection.
As of June 30, 2018 and December 31, 2017, the Company has not recorded any allowance for loan losses as the Company did not consider a loan loss to be probable.
Income Taxes
The Company operated in a manner that allowed the Company to qualify as a REIT for U.S. federal income tax purposes commencing with the tax year ending December 31, 2017. As a REIT, the Company generally will not be subject to federal income tax to the extent it distributes its REIT taxable income, subject to certain adjustments, to its stockholders. Subsequently, if the Company fails to qualify as a REIT in any taxable year, the Company will be subject to federal income tax on its taxable income at regular corporate tax rates. Even if the Company qualifies for taxation as a REIT, the Company may be subject to certain state and local taxes on its income, property or net worth and federal income and excise taxes on its undistributed income.
The Company had no uncertain tax positions as of June 30, 2018 or December 31, 2017. The Company expects no significant increases or decreases in uncertain tax positions due to changes in tax positions within one year of June 30, 2018. The Company had no interest or penalties relating to income taxes recognized in the consolidated statements of operations for the three and six-months ended June 30, 2018 or 2017. As of June 30, 2018, returns for the calendar years 2016 and 2017 remain subject to examination by U.S. and various state and local tax jurisdictions. For the three and six months ended June 30, 2018 and 2017, the Company incurred no current income tax expense.
Accounting Pronouncements Recently Issued but Not Yet Effective
In June 2016, the Financial Accounting Standards Board issued ASU 2016-13, “Financial Instruments – Credit Losses (Topic 326): Measurement of Credit Losses on Financial Instruments” (“ASU 2016-13”), which changes how entities measure credit losses for financial assets carried at amortized cost. ASU 2016-13 eliminates the requirement that a credit loss must be probable before it can be recognized and instead requires an entity to recognize the current estimate of all expected credit losses. ASU 2016-13 is effective for SEC filers for reporting periods beginning after December 15, 2019. The amendments may be adopted early for reporting periods beginning after December 15, 2018. The Company is currently evaluating the impact ASU 2016-13 will have on its allowance for loan losses estimate.
Note 3 – Real Estate Securities
7
InPoint Commercial Real Estate Income, Inc.
Notes to Consolidated Financial Statements (continued)
June 30, 2018
(unaudited)
The Company classified its real estate securities as available-for-sale. These investments are reported at fair value in the consolidated balance sheets with changes in fair value recorded in other income or loss in the consolidated statements of operations. The following table summarizes the Company’s real estate securities as of June 30, 2018 and December 31, 2017:
|
As of |
|
Weighted Average Coupon |
|
|
Weighted Average Years to Maturity |
|
Par Value |
|
|
Amortized Cost |
|
|
Unrealized Gains |
|
|
Unrealized Losses |
|
|
Fair Value |
|
||||||
|
June 30, 2018 |
|
|
5.5 |
% |
|
1.6 |
|
$ |
65,421,350 |
|
|
$ |
64,118,016 |
|
|
$ |
170,807 |
|
|
$ |
(14,858 |
) |
|
$ |
64,273,965 |
|
|
December 31, 2017 |
|
|
2.9 |
% |
|
1.7 |
|
$ |
25,957,831 |
|
|
$ |
25,957,831 |
|
|
$ |
35,935 |
|
|
$ |
(508 |
) |
|
$ |
25,993,258 |
|
As of December 31, 2017, amortized cost equaled par value since there were no discounts or premiums on real estate securities. There were no real estate securities in an unrealized loss position for greater than one year as of June 30, 2018 or December 31, 2017. The Company did not have any realized gains or losses during the three and six months ended June 30, 2018 and 2017.
Note 4 – Commercial Mortgage Loans Held for Investment
The following is a summary of the Company’s commercial mortgage loans held for investment as of June 30, 2018:
|
|
|
Number of Loans |
|
|
Principal Balance |
|
|
Unamortized (fees)/costs, net |
|
|
Carrying Value |
|
|
Weighted Average Coupon |
|
|
Weighted Average Years to Maturity |
|
||||||
|
First mortgage loans |
|
|
7 |
|
|
$ |
105,186,957 |
|
|
$ |
(964,336 |
) |
|
$ |
104,222,620 |
|
|
|
6.00 |
% |
|
|
2.6 |
|
|
Credit loans |
|
|
2 |
|
|
|
10,500,000 |
|
|
|
— |
|
|
|
10,500,000 |
|
|
|
9.20 |
% |
|
|
8.0 |
|
|
Total and average |
|
|
9 |
|
|
$ |
115,686,957 |
|
|
$ |
(964,336 |
) |
|
$ |
114,722,620 |
|
|
|
6.30 |
% |
|
|
3.1 |
|
The following is a summary of the Company’s commercial mortgage loans held for investment as of December 31, 2017:
|
|
|
Number of Loans |
|
|
Principal Balance |
|
|
Unamortized (fees)/costs, net |
|
|
Carrying Value |
|
|
Weighted Average Coupon |
|
|
Weighted Average Years to Maturity |
|
||||||
|
First mortgage loans |
|
|
2 |
|
|
$ |
24,950,941 |
|
|
$ |
(356,500 |
) |
|
$ |
24,594,441 |
|
|
|
6.08 |
% |
|
|
3.0 |
|
|
Credit loans |
|
|
1 |
|
|
|
7,500,000 |
|
|
|
— |
|
|
|
7,500,000 |
|
|
|
9.20 |
% |
|
|
9.8 |
|
|
Total and average |
|
|
3 |
|
|
$ |
32,450,941 |
|
|
$ |
(356,500 |
) |
|
$ |
32,094,441 |
|
|
|
6.80 |
% |
|
|
4.6 |
|
8
InPoint Commercial Real Estate Income, Inc.
Notes to Consolidated Financial Statements (continued)
June 30, 2018
(unaudited)
As part of the Company’s process for monitoring the credit quality of its loans, it performs a quarterly asset review of the loan portfolio and assigns risk ratings to each of its loans. Risk factors include payment status, lien position, borrower financial resources and investment in collateral, collateral type, project economics and geographic location, as well as national and regional economic factors. To determine the likelihood of loss, the loans are rated on a 5-point scale as follows:
|
Investment Grade |
Investment Grade Definition |
|
1 |
Investment exceeding fundamental performance expectations and/or capital gain expected. Trends and risk factors since time of investment are favorable. |
|
2 |
Performing consistent with expectations and a full return of principal and interest expected. Trends and risk factors are neutral to favorable. |
|
3 |
Performing loan requiring closer monitoring. Trends and risk factors show some deterioration. Collection of principal and interest is still expected. |
|
4 |
Underperforming investment with the potential of some interest loss but still expecting a positive return on investment. Trends and risk factors are negative. |
|
5 |
Underperforming investment with expected loss of interest and some principal. |
All commercial mortgage loans are assigned an initial risk rating of 2 at origination. The Company performed the quarterly asset review and assigned a risk rating of 2 to all loans as of June 30, 2018 and December 31, 2017. The Company has not recorded any allowance for loan losses as the Company did not consider a loan loss to be probable.
Note 5 – Repurchase Agreements
Commercial Mortgage Loans
On February 15, 2018, a wholly-owned subsidiary of the Company entered into a master repurchase agreement (the “Repo Facility”) with Column Financial, Inc. as administrative agent for certain of its affiliates. The Repo Facility provides up to $100.0 million in advances, subject to adjustment up to $250.0 million, which the Company expects to use to finance the acquisition or origination of eligible loans. The Repo Facility acts in the manner of a revolving credit facility that can be repaid as the Company's assets are paid off and re-drawn as advances against new assets. Advances under the Repo Facility accrue interest at a per annum rate equal to LIBOR plus 2.25%. The maturity date of the Repo Facility is May 13, 2019, which was extended in June 2018 from its initial maturity date of February 15, 2019 and which remains subject to further extensions which may be exercised upon the satisfaction of certain conditions.
The details of the Repo Facility as of June 30, 2018 are as follows:
|
|
|
|
|
|
|
|
|
|
|
|
|
|
|
|
|
Weighted Average |
|
|||||
|
Committed Financing |
|
|
Amount Outstanding |
|
|
Accrued Interest Payable |
|
|
Collateral Pledged |
|
|
Interest Rate |
|
|
Days to Maturity |
|
||||||
|
|
|
|
|
|
|
|
|
|
|
|
|
|
|
|
|
|
|
|
|
|
|
|
|
$ |
100,000,000 |
|
|
$ |
62,222,250 |
|
|
$ |
88,638 |
|
|
$ |
82,963,000 |
|
|
|
4.32 |
% |
|
|
317 |
|
The Company had not entered into the Repo Facility or any master repurchase agreement for commercial mortgage loans as of December 31, 2017.
9
InPoint Commercial Real Estate Income, Inc.
Notes to Consolidated Financial Statements (continued)
June 30, 2018
(unaudited)
Real Estate Securities
As of June 30, 2018 and December 31, 2017, the Company had entered into one master repurchase agreement for real estate securities with a counterparty (the “CRE Securities MRA”) and had eight and two transactions under the CRE Securities MRA outstanding, respectively, as described in the table below.
|
|
|
|
|
|
|
|
|
|
|
|
|
|
|
Weighted Average |
|
|||||
|
|
|
Amount Outstanding |
|
|
Accrued Interest Payable |
|
|
Collateral Pledged |
|
|
Interest Rate |
|
|
Days to Maturity |
|
|||||
|
|
|
|
|
|
|
|
|
|
|
|
|
|
|
|
|
|
|
|
|
|
|
As of June 30, 2018 |
|
$ |
45,296,000 |
|
|
$ |
42,509 |
|
|
$ |
62,646,000 |
|
|
|
3.49 |
% |
|
|
18 |
|
|
As of December 31, 2017 |
|
$ |
17,113,000 |
|
|
$ |
23,518 |
|
|
$ |
19,946,000 |
|
|
|
2.27 |
% |
|
|
7 |
|
Note 6 – Stockholders’ Equity
During the six-months ended June 30, 2018, pursuant to a private offering (the “Offering”), the Company issued 1,725,216 shares of Class P common stock (“Class P Shares”) at an average price of $27.14 per share with total net proceeds of $43,173,517 after offering costs of $3,654,382. In addition, the Company incurred $276,227 in reimbursable deferred offering costs that are payable to the Advisor and Sub-Advisor from future stock issuances.
Distributions
The Company currently pays distributions based on daily record dates, payable in arrears the following month, equal to a daily amount of $0.005260274 per Class P Share based on a 365-day year. The table below presents the distributions paid and declared during the three and six months ended June 30, 2018 and 2017. As of June 30, 2018, distributions declared but not yet paid amounted to $516,693.
|
|
|
Three-months ended June 30, |
|
|
Six-months ended June 30, |
|
||||||||||
|
|
|
2018 |
|
|
2017 |
|
|
2018 |
|
|
2017 |
|
||||
|
Distributions paid |
|
$ |
1,271,134 |
|
|
$ |
182,999 |
|
|
$ |
2,152,712 |
|
|
$ |
297,462 |
|
|
Distributions declared |
|
$ |
1,403,258 |
|
|
$ |
212,905 |
|
|
$ |
2,410,934 |
|
|
$ |
346,411 |
|
Note 7 – Net Income (Loss) Per Share
The following table is a summary of the basic and diluted net income (loss) per share computation for the three and six-months ended June 30, 2018 and 2017:
|
|
|
Three-months ended June 30, |
|
|
Six-months ended June 30, |
|
||||||||||
|
|
|
2018 |
|
|
2017 |
|
|
2018 |
|
|
2017 |
|
||||
|
Net income (loss) |
|
$ |
543,463 |
|
|
$ |
(176,917 |
) |
|
$ |
1,039,254 |
|
|
$ |
(89,024 |
) |
|
Weighted average shares outstanding, basic |
|
|
2,920,697 |
|
|
|
442,029 |
|
|
|
2,522,468 |
|
|
|
361,740 |
|
|
Weighted average shares outstanding, diluted |
|
|
2,920,781 |
|
|
|
442,029 |
|
|
|
2,522,535 |
|
|
|
361,740 |
|
|
Net income (loss) per share, basic and diluted |
|
$ |
0.19 |
|
|
$ |
(0.40 |
) |
|
$ |
0.41 |
|
|
$ |
(0.25 |
) |
10
InPoint Commercial Real Estate Income, Inc.
Notes to Consolidated Financial Statements (continued)
June 30, 2018
(unaudited)
Note 8 – Commitments and Contingencies
Litigation and Regulatory Matters
In the ordinary course of business, the Company may become subject to litigation, claims and regulatory matters. The Company has no knowledge of material legal or regulatory proceedings pending or known to be contemplated against the Company at this time.
Note 9 – Transactions with Related Parties
As of June 30, 2018, the Advisor had invested $1.0 million in the Company through the purchase of 40,040 Class P Shares. The purchase price per Class P Share for the Advisor’s investment was $25.00 (the “Transaction Price”), with no payment of selling commissions, dealer manager fees or organization and offering expenses. The Advisor has agreed pursuant to its subscription agreement that, for so long as it or its affiliate is serving as the Advisor, (i) it will not sell or transfer at least 8,000 of the Class P Shares that it has purchased, accounting for $200,000 of its investment, to an unaffiliated third party; (ii) it will not be eligible to submit a request for these 40,040 Class P Shares pursuant to the Company’s share repurchase program prior to the fifth anniversary of the date on which such shares were purchased; and (iii) repurchase requests made for these shares will only be accepted (a) on the last business day of a calendar quarter, (b) after all repurchase requests from all other stockholders for such quarter have been accepted and (c) to the extent that such repurchases do not cause total repurchases in the quarter in which they are being repurchased to exceed that quarter’s repurchase cap.
As of June 30, 2018, Sound Point Capital Management, LP (“Sound Point”), an affiliate of the Sub-Advisor, had invested $3.0 million in the Company through the purchase of 120,000 Class P Shares. The purchase price per Class P Share for this investment was the Transaction Price, with no payment of selling commissions, dealer manager fees or organization and offering expenses. Sound Point has agreed pursuant to its subscription agreement that, for so long as the Sub-Advisor or its affiliate is serving as the Sub-Advisor, (i) it will not be eligible to submit a request for the repurchase of these 120,000 shares pursuant to the Company’s share repurchase program prior to the fifth anniversary of the date on which such shares were purchased; and (ii) repurchase requests made for these shares will only be accepted (a) on the last business day of a calendar quarter, (b) after all repurchase requests from all other stockholders for such quarter have been accepted and (c) to the extent that such repurchases do not cause total repurchases in the quarter in which they are being repurchased to exceed that quarter’s repurchase cap.
The following table summarizes the Company’s related party transactions for the three and six-months ended June 30, 2018 and 2017:
|
|
|
Three-months ended June 30, |
|
|
Six-months ended June 30, |
|
|
Payable as of |
|
|||||||||||||||
|
|
|
2018 |
|
|
2017 |
|
|
2018 |
|
|
2017 |
|
|
June 30, 2018 |
|
|
December 31, 2017 |
|
||||||
|
Organization and offering expense reimbursement(1) |
|
$ |
154,284 |
|
|
$ |
432,433 |
|
|
$ |
276,227 |
|
|
$ |
645,784 |
|
|
$ |
1,168,194 |
|
|
$ |
1,502,901 |
|
|
Selling commissions and dealer manager fee(2) |
|
|
1,747,416 |
|
|
|
469,863 |
|
|
|
3,043,448 |
|
|
|
612,229 |
|
|
|
— |
|
|
|
— |
|
|
Advisory fee(3) |
|
|
539,466 |
|
|
|
— |
|
|
|
539,466 |
|
|
|
— |
|
|
|
539,466 |
|
|
|
— |
|
|
Operating expense reimbursement(4) |
|
|
3,606 |
|
|
|
144,904 |
|
|
|
5,142 |
|
|
|
213,053 |
|
|
|
5,142 |
|
|
|
8,778 |
|
|
Total |
|
$ |
2,444,772 |
|
|
$ |
1,047,200 |
|
|
$ |
3,864,283 |
|
|
$ |
1,471,066 |
|
|
$ |
1,712,802 |
|
|
$ |
1,511,679 |
|
|
(1) |
The Company reimburses the Advisor, the Sub-Advisor and their respective affiliates for costs and other expenses related to the Offering, provided that aggregate reimbursements of such costs and expenses shall not exceed the organization and offering expenses paid by investors in connection with the sale of Class P Shares in the Offering. Offering costs are offset against stockholders’ equity when paid. Unpaid amounts are recorded as deferred offering costs and included in due to related parties in these consolidated balance sheets. |
|
(2) |
Inland Securities Corporation, the Company’s dealer manager and an affiliate of the Advisor, receives selling commissions up to 5%, and a dealer manager fee up to 3%, of the Transaction Price for each Class P Share sold in the Offering, the majority of which is paid to third-party broker-dealers. |
11
InPoint Commercial Real Estate Income, Inc.
Notes to Consolidated Financial Statements (continued)
June 30, 2018
(unaudited)
|
the Company’s valuation policies or, if such value has not yet been determined, the book value of the asset. The performance component of the advisory fee is calculated and paid annually with respect to the Class P Shares, such that for any year in which the Company’s total return per Class P Share exceeds 7% per annum, the Advisor will receive 20% of the excess total return allocable to the Class P Shares; provided that in no event will the performance component of the advisory fee exceed 15% of the aggregate total return allocable to Class P Shares for such year. The Advisor waived the advisory fee for the three months ended March 31, 2018 and the three and six months ended June 30, 2017. The Advisor did not waive the advisory fee for the three months ended June 30, 2018. |
|
(4) |
The Company reimburses the Advisor or its affiliates for out-of-pocket expenses that it incurs in connection with providing services to the Company, provided that the Company does not reimburse overhead costs, including rent and utilities or personnel costs (including salaries, bonuses, benefits and severance payments). |
Note 10 – Equity-Based Compensation
On March 1, 2018, the Company granted each of its three independent directors 400 restricted Class P Shares for a total of 1,200 Class P Shares with a total value of $30,000. The restricted Class P Shares will vest in equal one-third increments on March 1, 2019, 2020 and 2021.
Under the RSP, restricted shares generally vest over a three year vesting period from the date of the grant, subject to the specific terms of the grant. Restricted shares are included in common stock outstanding on the date of vesting. The grant-date value of the restricted shares is amortized over the vesting period representing the requisite service period. Compensation expense associated with the restricted shares issued to the independent directors was $2,500 and $3,333, in the aggregate, for the three and six-months ended June 30, 2018, respectively. As of June 30, 2018, the Company had $26,667 of unrecognized compensation expense related to the unvested restricted shares, in the aggregate. The weighted average remaining period that compensation expense related to unvested restricted shares will be recognized is 2.67 years.
Note 11 – Fair Value of Financial Instruments
The following table presents the Company’s financial instruments carried at fair value in the consolidated balance sheets by its level in the fair value hierarchy (see Note 2 – Summary of Significant Accounting Policies included in the Annual Report) as of June 30, 2018 and December 31, 2017:
|
|
|
June 30, 2018 |
|
|
December 31, 2017 |
|
||||||||||||||||||||||||||
|
|
|
Total |
|
|
Level I |
|
|
Level II |
|
|
Level III |
|
|
Total |
|
|
Level I |
|
|
Level II |
|
|
Level III |
|
||||||||
|
Real estate securities |
|
$ |
64,273,965 |
|
|
|
— |
|
|
$ |
64,273,965 |
|
|
|
— |
|
|
$ |
25,993,258 |
|
|
|
— |
|
|
$ |
25,993,258 |
|
|
|
— |
|
The Company did not transfer any assets within fair value levels during the six months ended June 30, 2018 or during the year ended December 31, 2017.
As discussed in Note 2 of the Annual Report, GAAP requires the disclosure of fair value information about financial instruments, whether or not recognized in the consolidated balance sheets, for which it is practicable to estimate that value. The following table details the carrying amount and fair value of the financial instruments described in Note 2 of the Annual Report:
12
InPoint Commercial Real Estate Income, Inc.
Notes to Consolidated Financial Statements (continued)
June 30, 2018
(unaudited)
|
June 30, 2018 |
|
|
December 31, 2017 |
|
|||||||||||
|
|
Carrying Amount |
|
|
Estimated Fair Value |
|
|
Carrying Amount |
|
|
Estimated Fair Value |
|
||||
|
Financial assets |
|
|
|
|
|
|
|
|
|
|
|
|
|
|
|
|
Cash and cash equivalents |
$ |
12,903,500 |
|
|
$ |
12,903,500 |
|
|
$ |
1,406,331 |
|
|
$ |
1,406,331 |
|
|
Commercial mortgage loans, net |
|
114,722,620 |
|
|
|
115,906,222 |
|
|
|
32,094,441 |
|
|
|
32,094,441 |
|
|
Total |
$ |
127,626,120 |
|
|
$ |
128,809,722 |
|
|
$ |
33,500,772 |
|
|
$ |
33,500,772 |
|
|
Financial liabilities |
|
|
|
|
|
|
|
|
|
|
|
|
|
|
|
|
Repurchase agreements - real estate securities |
$ |
45,296,000 |
|
|
$ |
45,296,000 |
|
|
$ |
17,113,000 |
|
|
$ |
17,113,000 |
|
|
Repurchase agreements - commercial mortgage loans |
|
62,222,250 |
|
|
|
62,222,250 |
|
|
|
— |
|
|
|
— |
|
|
Total |
$ |
107,518,250 |
|
|
$ |
107,518,250 |
|
|
$ |
17,113,000 |
|
|
$ |
17,113,000 |
|
The following describes our methods for estimating the fair value for financial instruments:
|
• |
The estimated fair value of cash and cash equivalents was based on the bank balance and was a Level 1 fair value measurement. |
|
• |
The estimated fair value of commercial mortgage loans, net is a Level 3 fair value measurement. The Sub-Advisor estimates the fair values of commercial loans by analyzing interest rate spreads on loans based on various factors including capitalization rates, occupancy rates, sponsorship, geographic concentration, collateral type, market conditions and actions of other lenders. |
|
• |
The estimated fair value of repurchase agreements is a Level 3 fair value measurement based on an expected present value technique. This method discounts future estimated cash flows using rates we determined best reflect current market interest rates that would be offered for repurchase agreements with similar characteristics and credit quality. |
Note 12 – Subsequent Events
The Company has evaluated subsequent events through August 9, 2018, the date the financial statements were issued, and determined that there have not been any events that have occurred that would require adjustments to disclosures in the consolidated financial statements except for the following transactions:
Sale of Common Stock
As of August 8, 2018, the Company had 4,106,749 shares of common stock outstanding and had raised proceeds from the Offering since June 30, 2018 and since inception as follows:
|
Source of Capital |
|
July 1, 2018 through August 8, 2018 |
|
|
Total |
|
||
|
Class P Shares |
|
$ |
17,546,200 |
|
|
$ |
110,722,669 |
|
Distributions
The Company’s board of directors declared distributions payable to stockholders of record of Class P Shares each day beginning on the close of business September 1, 2018 through the close of business November 30, 2018. Through that date distributions were declared in a daily amount equal to $0.005260274 per Class P Share, based on a 365-day period.
The table below sets forth the distributions paid in cash monthly in arrears:
13
InPoint Commercial Real Estate Income, Inc.
Notes to Consolidated Financial Statements (continued)
June 30, 2018
(unaudited)
|
|
Month Distribution Paid |
|
Distribution Amount |
|
|
||
|
June 2018 |
|
July 2018 |
|
$ |
516,693 |
|
|
|
July 2018 |
|
August 2018 |
|
$ |
604,889 |
|
|
14
Item 2. Management’s Discussion and Analysis of Financial Condition and Results of Operations
Certain statements in this Quarterly Report on Form 10-Q constitute “forward-looking statements” within the meaning of Section 27A of the Securities Act of 1933, as amended (the “Securities Act”), and Section 21E of the Securities Exchange Act of 1934, as amended (the “Exchange Act”). Words such as “may,” “could,” “should,” “expect,” “intend,” “plan,” “goal,” “seek,” “anticipate,” “believe,” “estimate,” “predict,” “variables,” “potential,” “continue,” “expand,” “maintain,” “create,” “strategies,” “likely,” “will,” “would” and variations of these terms and similar expressions, or the negative of these terms or similar expressions, are intended to identify forward-looking statements.
These forward-looking statements are not historical facts but reflect the intent, belief or current expectations of the management of InPoint Commercial Real Estate Income, Inc. (which we refer to herein as the “Company,” “we,” “our” or “us”) based on their knowledge and understanding of the business and industry, the economy and other future conditions. These statements are not guarantees of future performance, and we caution stockholders not to place undue reliance on forward-looking statements. Actual results may differ materially from those expressed or forecasted in the forward-looking statements due to a variety of risks, uncertainties and other factors, including but not limited to the factors described below:
|
|
• |
Market disruptions may adversely impact many aspects of our operating results and operating condition; |
|
|
• |
If we cannot generate sufficient cash flow from operations to fully fund distributions, some or all of our distributions may be paid from other sources, including from the proceeds from sales of our Class P common stock (our “Class P Shares”), which will reduce the amount of cash we ultimately have to invest in assets; |
|
|
• |
There is no current public trading market for our Class P Shares, and we do not expect that such a market will ever develop. Therefore, repurchase of shares by us will likely be the only way for stockholders to dispose of their shares and even if our stockholders are able to sell their shares by our share repurchase program, or otherwise, they may not be able to recover the amount of their investment in our shares; |
|
|
• |
Our charter generally limits the total amount we may borrow to 300% of our net assets, equivalent to 75% of the costs of our assets; |
|
|
• |
Inland InPoint Advisor, LLC (our “Advisor”) and SPCRE InPoint Advisors, LLC (our “Sub-Advisor”) may face conflicts of interest in allocating personnel and resources between their affiliates; |
|
|
• |
We do not have arm’s-length agreements with our Advisor, our Sub-Advisor or any affiliates of our Advisor or Sub-Advisor; and |
|
|
• |
If we fail to continue to qualify as a real estate investment trust (“REIT”), our operations and distributions to stockholders will be adversely affected. |
Forward-looking statements in this Quarterly Report on Form 10-Q reflect our management’s view only as of the date of this Quarterly Report, and may ultimately prove to be incorrect or false. We undertake no obligation to update or revise forward-looking statements to reflect changed assumptions, the occurrence of unanticipated events or changes to future operating results except as required by applicable law. We intend for these forward-looking statements to be covered by the applicable safe harbor provisions created by Section 27A of the Securities Act and Section 21E of the Exchange Act.
The following discussion and analysis relates to the three and six-months ended June 30, 2018 and 2017 and as of June 30, 2018 and December 31, 2017. You should read the following discussion and analysis along with our consolidated financial statements and the related notes included in this report.
Overview
We are a Maryland corporation formed on September 13, 2016 to originate, acquire and manage a diversified portfolio of commercial real estate (“CRE”) investments primarily comprised of (i) CRE debt, including first mortgage loans, subordinate mortgage and mezzanine loans, and participations in such loans and (ii) CRE securities, such as commercial mortgage-backed securities (“CMBS”), senior unsecured debt of publicly traded REITs, and collateralized debt obligation notes. We may also invest in select equity investments in single-tenant, net leased properties. Substantially all of our business is conducted through our operating partnership, of which we are the sole general partner. We are externally managed by Inland InPoint Advisor, LLC, an indirect subsidiary of Inland Real Estate Investment Corporation. Our Advisor has engaged SPCRE InPoint Advisors, LLC, a subsidiary of Sound Point CRE Management, LP, to perform certain services on behalf of the Advisor for us.
15
We operate in a manner that will allow us to qualify as a REIT for U.S. federal income tax purposes commencing with the taxable year ending December 31, 2017. Among other requirements, REITs are required to distribute to stockholders at least 90% of their annual REIT taxable income (computed without regard to the dividends-paid deduction and excluding net capital gain).
On October 25, 2016, we commenced a private offering (the “Offering”) of up to $500,000,000 in our Class P Shares, pursuant to a private placement memorandum dated October 25, 2016. The purchase price per Class P Share currently equals $25.00 plus applicable selling commissions, dealer manager fees and organization and offering expenses, resulting in a total purchase price of $27.38 per Class P Share if maximum selling commissions, dealer manager fees and organization and offering expenses are paid. Inland Securities Corporation, an affiliate of our Advisor, is our dealer manager for the Offering. As of August 8, 2018, we had received and accepted investors’ subscriptions for and issued 4,106,749 Class P Shares in the Offering, resulting in gross proceeds of $110,722,669. As of August 8, 2018, $389,277,331 of Class P Shares remained to be sold in the Offering.
Significant Accounting Policies and Use of Estimates
Disclosures discussing all significant accounting policies are set forth in the Company’s Annual Report on Form 10-K for the year ended December 31, 2017 (the “Annual Report”), as filed with the Securities and Exchange Commission (the “SEC”) on March 14, 2018, under the heading “Note 2 – Summary of Significant Accounting Policies.” There have been no changes to the Company’s significant accounting policies for the three and six months ended June 30, 2018, except as noted in Note 2 – “Summary of Significant Accounting Policies” which is included in our notes to consolidated financial statements included in this Quarterly Report on Form 10-Q.
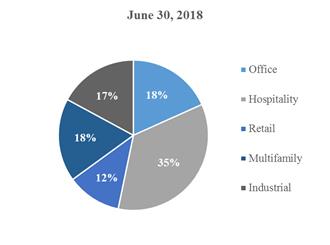
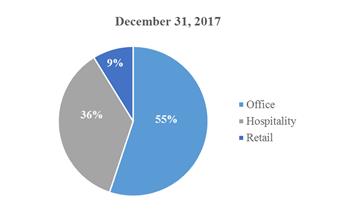
Portfolio
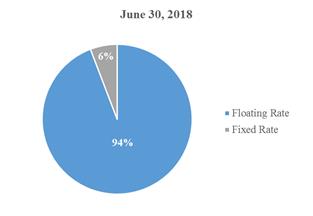
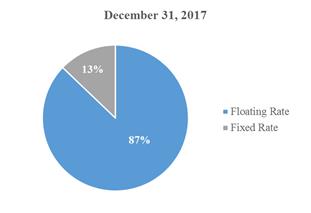
We began operations in October 2016 and our objective is to originate, acquire and manage an investment portfolio of CRE debt and CRE securities that is primarily floating rate and diversified based on the type and location of collateral securing the underlying CRE debt and CRE securities. We anticipate our investment portfolio will be less diversified and have higher concentrations in asset class, collateral type and geographic location until our capital raise reaches levels that will allow for greater diversification.
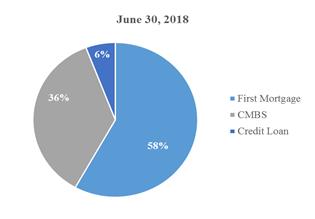
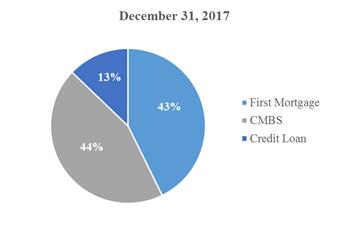
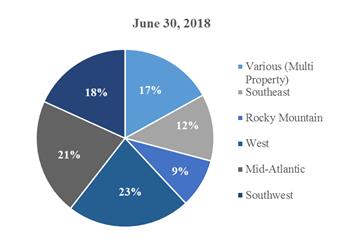
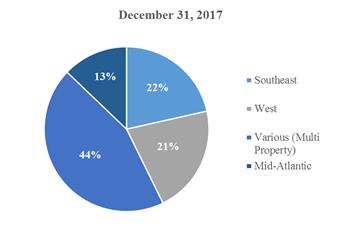
The charts below summarize our portfolio as a percentage of par value by type of rate, loan type, collateral type and geographical region as of June 30, 2018 and December 31, 2017:
Floating vs. Fixed Rate:
16
Investments by Property Type:
Investments by Region:
17
An investment’s region is defined according to the below map based on the location of underlying property.

The changes in our portfolio as of June 30, 2018 compared to December 31, 2017 were primarily due to the new loans originated during the period. Due to the small number of investments in our portfolio, the changes in the portfolio composition may be significant. We anticipate that these changes will become less significant as our portfolio increases in size.
Real Estate Securities
As of June 30, 2018 and December 31, 2017, our portfolio of real estate securities consisted of seven and three investments in CMBS, respectively. Our CMBS investments had a fair value of $64,273,965 and $25,993,258 as of June 30, 2018 and December 31, 2017, respectively. The increase in the size of our portfolio of real estate securities is due to investing capital received from the Offering and increased leverage arising from a master repurchase agreement (the “Repo Facility”) that we, through a wholly-owned subsidiary, entered into with Column Financial, Inc. on February 15, 2018 as administrative agent for certain of its affiliates.
As of June 30, 2018 and December 31, 2017, our CMBS investments had a weighted average coupon of 5.5% and 2.9% and a remaining life of 1.6 and 1.7 years, respectively. As of June 30, 2018, 32% of our real estate securities portfolio based on fair value was rated AAA, 15% was rated BB-, 3% was rated AA- and 50% was not rated from at least one national rating agency. As of December 31, 2017, 80% of our portfolio based on fair value had a rating by a national rating agency of AAA and 20% BB-. The change in the ratings was due to the purchase of additional assets as we invested capital received from the Offering. Our credit process evaluates the underlying quality of the loans securing the CMBS at the time of purchase and we continually review the credit performance while we own the CMBS. Ratings by national rating agencies are subject to change and may not be continuously updated, and therefore we do not place reliance on these ratings.
Commercial Mortgage Loans Held for Investment
As of June 30, 2018 and December 31, 2017, our portfolio of commercial mortgage loans held for investment consisted of nine and three loans, respectively, with outstanding principal balance of $115,686,957 and $32,450,941, respectively. The increase in the size of our portfolio is due to investing capital received from the Offering. The portfolio had a weighted average interest rate of 6.30% and 6.80% as of June 30, 2018 and December 31, 2017, respectively. The change in weighted average interest rate was due to change in portfolio composition through the additional loans originated. Due to the small number of loans in our portfolio, the weighted average interest rate may change significantly as we continue to originate loans in the future.
18
Select Loan Information
The table below presents information for each of our commercial mortgage loans as of June 30, 2018. (Dollar amounts in thousands):
|
|
|
Origination Date |
|
Loan Type (1) |
|
Principal Balance |
|
|
Cash Coupon (2) |
|
|
All-in Yield (2) |
|
|
Original Maturity (3) |
|
Maximum Maturity (3) |
|
State |
|
Property Type |
|
LTV (4) |
|
|
Risk Rating (5) |
|
|||
|
1 |
|
12/12/17 |
|
Senior |
|
$ |
12,400 |
|
|
L+4.70% |
|
|
7.3% |
|
|
1/9/21 |
|
1/9/23 |
|
HI |
|
Office |
|
67% |
|
|
|
2 |
|
|
|
2 |
|
12/13/17 |
|
Senior |
|
|
13,224 |
|
|
L+4.50% |
|
|
7.1% |
|
|
12/9/20 |
|
12/9/22 |
|
VA |
|
Office |
|
55% |
|
|
|
2 |
|
|
|
3 |
|
3/22/18 |
|
Senior |
|
|
16,163 |
|
|
L+3.75% |
|
|
6.2% |
|
|
4/9/21 |
|
4/9/23 |
|
CO |
|
Retail |
|
74% |
|
|
|
2 |
|
|
|
4 |
|
4/10/18 |
|
Senior |
|
|
5,600 |
|
|
L+3.50% |
|
|
6.0% |
|
|
4/9/21 |
|
4/9/23 |
|
OR |
|
Multifamily |
|
73% |
|
|
|
2 |
|
|
|
5 |
|
5/4/18 |
|
Senior |
|
|
31,000 |
|
|
L+4.00% |
|
|
6.3% |
|
|
5/9/21 |
|
5/9/23 |
|
PA |
|
Industrial |
|
64% |
|
|
|
2 |
|
|
|
6 |
|
5/17/18 |
|
Senior |
|
|
5,800 |
|
|
L+4.50% |
|
|
7.1% |
|
|
6/9/21 |
|
6/9/23 |
|
NC |
|
Multifamily |
|
54% |
|
|
|
2 |
|
|
|
7 |
|
6/26/18 |
|
Senior |
|
|
21,000 |
|
|
L+3.10% |
|
|
5.7% |
|
|
7/9/20 |
|
7/9/23 |
|
TX |
|
Multifamily |
|
60% |
|
|
|
2 |
|
|
|
8 |
|
9/29/17 |
|
Credit |
|
|
7,500 |
|
|
9.20% |
|
|
9.2% |
|
|
10/11/27 |
|
10/11/27 |
|
NJ |
|
Office |
|
80% |
|
|
|
2 |
|
|
|
9 |
|
3/27/18 |
|
Credit |
|
|
3,000 |
|
|
9.35% |
|
|
9.4% |
|
|
4/1/23 |
|
4/1/23 |
|
FL |
|
Hospitality |
|
68% |
|
|
|
2 |
|
|
|
|
|
|
|
|
|
$ |
115,687 |
|
|
|
|
|
|
6.7% |
|
|
|
|
|
|
|
|
|
|
65% |
|
|
|
2 |
|
|
(1) |
Senior loans are first position mortgage loans and credit loans are mezzanine and subordinated loans. |
|
(2) |
Cash coupon is the stated rate on the loan. All-in yield includes the amortization of origination fees and the accrual of deferred commitment fees. The total is the weighted average rate as of June 30, 2018 using LIBOR of 2.09025%. |
|
(3) |
Original maturity is the first maturity on the loan and the maximum maturity assumes all extension options are exercised. |
|
(4) |
Loan-to-value (LTV) was determined at loan origination and is not updated for subsequent property valuations or loan modifications. The total is the weighted average LTV. |
|
(5) |
Risk rating is the internal risk rating assigned by the Sub-Advisor. The total is the average rating for the portfolio. See Note 4 – “Commercial Mortgage Loans Held for Investment" which is included in our notes to consolidated financial statements included in this Quarterly Report on Form 10-Q. |
Allowance for Loan Losses
As of June 30, 2018 and December 31, 2017, we have not recorded any allowance for loan losses as the loans in the portfolio were not impaired and were performing in compliance with the contractual terms and no losses were probable. See Note 2 - “Summary of Significant Accounting Policies” which is included in our notes to consolidated financial statements included in the Annual Report for further description of our allowance for loan loss policy.
19
Comparison of the Three-Months Ended June 30, 2018 to the Three-Months Ended June 30, 2017
Net Interest Income
Net interest income is generated on our interest-earning assets less related interest-bearing liabilities. The following table presents the average balance of interest-earning assets less related interest-bearing liabilities, associated interest income and expense and corresponding yield earned and incurred for the periods indicated.
|
|
|
Three-Months Ended June 30, |
|
|||||||||||||||||||||
|
|
|
2018 |
|
|
2017 |
|
||||||||||||||||||
|
|
|
Average Carrying Value (1) |
|
|
Interest Income/ Expense (2) |
|
|
Weighted Average Yield/Financing Cost (3) |
|
|
Average Carrying Value (1) |
|
|
Interest Income/ Expense (2) |
|
|
Weighted Average Yield/Financing Cost (3) |
|
||||||
|
Interest-earning assets: |
|
|
|
|
|
|
|
|
|
|
|
|
|
|
|
|
|
|
|
|
|
|
|
|
|
Real estate securities |
|
$ |
45,694,811 |
|
|
$ |
580,505 |
|
|
5.0% |
|
|
$ |
10,538,347 |
|
|
$ |
148,305 |
|
|
|
5.6 |
% |
|
|
Commercial mortgage loans |
|
|
80,872,105 |
|
|
|
1,405,902 |
|
|
6.9% |
|
|
|
— |
|
|
|
— |
|
|
|
— |
|
|
|
Total/Weighted Average |
|
$ |
126,566,916 |
|
|
$ |
1,986,407 |
|
|
6.2% |
|
|
$ |
10,538,347 |
|
|
$ |
148,305 |
|
|
|
5.6 |
% |
|
|
Interest-bearing liabilities: |
|
|
|
|
|
|
|
|
|
|
|
|
|
|
|
|
|
|
|
|
|
|
|
|
|
Repurchase agreements—securities |
|
$ |
30,949,912 |
|
|
$ |
238,187 |
|
|
3.0% |
|
|
$ |
5,579,033 |
|
|
$ |
41,323 |
|
|
|
2.9 |
% |
|
|
Repurchase agreements—commercial mortgage loans |
|
|
43,121,266 |
|
|
|
467,146 |
|
|
4.3% |
|
|
|
— |
|
|
|
— |
|
|
|
— |
|
|
|
Total/Weighted Average |
|
$ |
74,071,178 |
|
|
$ |
705,333 |
|
|
3.8% |
|
|
$ |
5,579,033 |
|
|
$ |
41,323 |
|
|
|
2.9 |
% |
|
|
Net interest income/spread |
|
|
|
|
|
$ |
1,281,074 |
|
|
2.4% |
|
|
|
|
|
|
$ |
106,982 |
|
|
|
2.6 |
% |
|
|
Average leverage %(4) |
|
|
141.1 |
% |
|
|
|
|
|
|
|
|
|
|
112.5 |
% |
|
|
|
|
|
|
|
|
|
Weighted average levered yield(5) |
|
|
|
|
|
|
|
|
|
9.7% |
|
|
|
|
|
|
|
|
|
|
|
8.5 |
% |
|
|
(1) |
Based on amortized cost for real estate securities and principal amount for repurchase agreements. Amounts are calculated based on the average daily balance. |
|
(2) |
Includes the effect of amortization of premium or accretion of discount. |
|
(3) |
Calculated as interest income or expense divided by average carrying value. |
|
(4) |
Calculated by dividing total average interest-bearing liabilities by total average equity (total average interest-earning assets less total average liabilities). |
|
(5) |
Calculated by taking the sum of (i) the net interest spread multiplied by the average leverage and (ii) the weighted average yield on interest-earning assets. |
The increase in our weighted average interest-earning assets and interest-bearing liabilities was due to the investment of proceeds from the Offering and through increased leverage as we executed our business strategy. The change in the weighted average yield and finance cost was due to the change in the portfolio composition as we invested the proceeds from the Offering.
Operating Expenses
Operating expenses for the three-months ended June 30, 2018 and 2017 consisted of the following:
|
|
|
Three-Months Ended June 30, |
|
|||||
|
|
|
2018 |
|
|
2017 |
|
||
|
Advisory fee |
|
$ |
539,466 |
|
|
$ |
— |
|
|
Debt finance costs |
|
|
121,728 |
|
|
|
— |
|
|
Administration expense |
|
|
— |
|
|
|
28,750 |
|
|
Directors compensation |
|
|
20,750 |
|
|
|
19,850 |
|
|
Professional service fees |
|
|
90,070 |
|
|
|
209,522 |
|
|
Other expenses |
|
|
55,291 |
|
|
|
7,257 |
|
|
Total operating expenses |
|
$ |
827,305 |
|
|
$ |
265,379 |
|
20
Total operating expenses for the three-months ended June 30, 2018 and 2017 were $827,305 and $265,379, respectively. Advisory fee represents the amounts payable to the Advisor. The increase in the advisory fee during the three-months ended June 30, 2018 compared to the three-months ended June 30, 2017 was due to the Advisor waiving the fee for all periods prior to the three-months ended June 30, 2018. The increase in debt finance costs was due to the amortization of costs related to the Repo Facility. The professional service fees decreased during the three-months ended June 30, 2018 compared to the three-months ended June 30, 2017 due to fewer audit, tax and legal expenses.
Other Income
For the three-months ended June 30, 2018 and 2017, our real estate securities increased (decreased) in value by $89,694 and $(18,520), respectively. The changes in valuation were unrealized and were the result of the changes in market conditions that affected the price of our securities.
Net Income
For the three-months ended June 30, 2018 and 2017, our net income (loss) was $543,463 and $(176,917), or $0.19 and $(0.40) per share (basic and diluted), respectively. The increase in net income was primarily due to the increase in net interest income as our investment portfolio increased due to investing the proceeds from the Offering and borrowings.
Comparison of the Six-Months Ended June 30, 2018 to the Six-Months Ended June 30, 2017
Net Interest Income
Net interest income is generated on our interest-earning assets less related interest-bearing liabilities. The following table presents the average balance of interest-earning assets less related interest-bearing liabilities, associated interest income and expense and corresponding yield earned and incurred for the periods indicated.
|
|
|
Six-Months Ended June 30, |
|
|||||||||||||||||||||
|
|
|
2018 |
|
|
2017 |
|
||||||||||||||||||
|
|
|
Average Carrying Value (1) |
|
|
Interest Income/ Expense (2) |
|
|
Weighted Average Yield/Financing Cost (3) |
|
|
Average Carrying Value (1) |
|
|
Interest Income/ Expense (2) |
|
|
Weighted Average Yield/Financing Cost (3) |
|
||||||
|
Interest-earning assets: |
|
|
|
|
|
|
|
|
|
|
|
|
|
|
|
|
|
|
|
|
|
|
|
|
|
Real estate securities |
|
$ |
36,745,973 |
|
|
$ |
796,491 |
|
|
4.3% |
|
|
$ |
9,230,172 |
|
|
$ |
250,044 |
|
|
|
5.4 |
% |
|
|
Commercial mortgage loans |
|
|
57,836,477 |
|
|
|
2,020,120 |
|
|
6.9% |
|
|
|
— |
|
|
|
— |
|
|
|
— |
% |
|
|
Total/Weighted Average |
|
$ |
94,582,450 |
|
|
$ |
2,816,611 |
|
|
5.9% |
|
|
$ |
9,230,172 |
|
|
$ |
250,044 |
|
|
|
5.4 |
% |
|
|
Interest-bearing liabilities: |
|
|
|
|
|
|
|
|
|
|
|
|
|
|
|
|
|
|
|
|
|
|
|
|
|
Repurchase agreements—securities |
|
$ |
23,105,221 |
|
|
$ |
327,347 |
|
|
2.8% |
|
|
$ |
3,674,387 |
|
|
$ |
51,738 |
|
|
|
2.8 |
% |
|
|
Repurchase agreements—commercial mortgage loans |
|
|
22,347,709 |
|
|
|
480,930 |
|
|
4.3% |
|
|
|
— |
|
|
|
— |
|
|
|
— |
% |
|
|
Total/Weighted Average |
|
$ |
45,452,930 |
|
|
$ |
808,277 |
|
|
3.5% |
|
|
$ |
3,674,387 |
|
|
$ |
51,738 |
|
|
|
2.8 |
% |
|
|
Net interest income/spread |
|
|
|
|
|
$ |
2,008,334 |
|
|
2.4% |
|
|
|
|
|
|
$ |
198,306 |
|
|
|
2.6 |
% |
|
|
Average leverage %(4) |
|
|
92.5 |
% |
|
|
|
|
|
|
|
|
|
|
66.1 |
% |
|
|
|
|
|
|
|
|
|
Weighted average levered yield (5) |
|
|
|
|
|
|
|
|
|
8.1% |
|
|
|
|
|
|
|
|
|
|
|
7.1 |
% |
|
|
(1) |
Based on amortized cost for real estate securities and principal amount for repurchase agreements. Amounts are calculated based on the average daily balance. |
|
(2) |
Includes the effect of amortization of premium or accretion of discount. |
|
(3) |
Calculated as interest income or expense divided by average carrying value. |
|
(4) |
Calculated by dividing total average interest-bearing liabilities by total average equity (total average interest-earning assets less total average liabilities). |
|
(5) |
Calculated by taking the sum of (i) the net interest spread multiplied by the average leverage and (ii) the weighted average yield on interest-earning assets. |
21
The increase in our weighted average interest-earning assets and interest-bearing liabilities was due to the investment of proceeds from the Offering and through increased leverage as we executed our business strategy. The change in the weighted average yield and finance cost was due to the change in the portfolio composition as we invested the proceeds from the Offering.
Operating Expenses
Operating expenses for the six-months ended June 30, 2018 and 2017 consisted of the following:
|
|
|
Six-Months Ended June 30, |
|
|||||
|
|
|
2018 |
|
|
2017 |
|
||
|
Advisory fee |
|
$ |
539,466 |
|
|
$ |
— |
|
|
Debt finance costs |
|
|
186,712 |
|
|
|
— |
|
|
Administration expense |
|
|
— |
|
|
|
57,500 |
|
|
Directors compensation |
|
|
42,350 |
|
|
|
40,600 |
|
|
Professional service fees |
|
|
206,569 |
|
|
|
230,334 |
|
|
Other expenses |
|
|
114,505 |
|
|
|
29,809 |
|
|
Total operating expenses |
|
$ |
1,089,602 |
|
|
$ |
358,243 |
|
Total operating expenses for the six-months ended June 30, 2018 and 2017 were $1,089,602 and $358,243, respectively. Advisory fee represents the amounts payable to the Advisor. The increase in the advisory fee during the six-months ended June 30, 2018 compared to the six-months ended June 30, 2017 was due to the Advisor waiving the fee for periods prior to the three-months ended June 30, 2018. The increase in debt finance costs was due to the amortization of costs related to the Repo Facility. The professional service fees decreased during the six-months ended June 30, 2018 compared to the six-months ended June 30, 2017 due to fewer audit, tax and legal expenses.
Other Income
For the six-months ended June 30, 2018 and 2017, our real estate securities increased in value by $120,522 and $70,913, respectively. The changes in valuation were unrealized and were the result of the changes in market conditions that affected the price of our securities.
Net Income
For the six-months ended June 30, 2018 and 2017, our net income (loss) was $1,039,254 and $(89,024), or $0.41 and $(0.25) per share (basic and diluted), respectively. The increase in net income was primarily due to the increase in net interest income as our investment portfolio increased due to investing the proceeds from the Offering and borrowings.
Non-GAAP Financial Measures
Funds from Operations and Modified Funds from Operations
We use Funds from Operations (“FFO”), a widely accepted metric, to evaluate our performance. FFO provides a supplemental measure to compare our performance and operations to other REITs. Due to certain unique operating characteristics of real estate companies, the National Association of Real Estate Investment Trusts (“NAREIT”) has promulgated a standard known as FFO, which it believes more accurately reflects the operating performance of a REIT. As defined by NAREIT, FFO means net income computed in accordance with generally accepted accounting principles (“GAAP”), excluding gains (or losses) from sales of operating property, plus depreciation and amortization and after adjustments for unconsolidated entities. In addition, NAREIT has further clarified the FFO definition to add-back impairment write-downs of depreciable real estate or of investments in unconsolidated entities that are driven by measurable decreases in the fair value of depreciable real estate and to exclude the earnings impacts of cumulative effects of accounting changes. We have adopted the NAREIT definition for computing FFO.
Our business plan is to operate as a mortgage REIT with our portfolio consisting of CRE debt and CRE securities. We will typically have no FFO adjustments to our net income or loss computed in accordance with GAAP. Although we have the ability to acquire real property, we have not acquired any at this time and as such have not had any FFO adjustments to our net income or loss computed in accordance with GAAP.
Under GAAP, acquisition related costs are treated as operating expenses reducing our income. Publicly registered, non-listed REITs typically engage in a significant amount of acquisition activity in the early years of their operations, and thus incur significant acquisition related costs during these initial years. Although other start up entities may engage in significant acquisition activity during
22
their initial years, REITs such as us that are not listed on an exchange are unique in that they typically have a limited timeframe during which they acquire a significant number of investments and thus incur significant acquisition related costs. Due to the above factors and other unique features of publicly registered, non-listed REITs, the Institute for Portfolio Alternatives (“IPA”), an industry trade group, published a standardized measure known as Modified Funds from Operations (“MFFO”), which the IPA has promulgated as a supplemental measure for publicly registered non-listed REITs and which may be another appropriate supplemental measure to reflect the operating performance of a non-listed REIT.
The IPA defines MFFO as FFO adjusted for acquisition fees and expenses, amounts relating to straight line rents and amortization of premiums on debt investments, non-recurring impairments of real estate-related investments, mark-to-market adjustments included in net income, non-recurring gains or losses included in net income from the extinguishment or sale of debt, hedges, foreign exchange, derivatives or securities holdings where trading of such holdings is not a fundamental attribute of the business plan, unrealized gains or losses resulting from consolidation from, or deconsolidation to, equity accounting, and after adjustments for consolidated and unconsolidated partnerships and joint ventures.
We define MFFO in accordance with the concepts established by the IPA and adjust FFO for certain items, such as amortization of premium and discounts on real estate securities. We purchase real estate securities at a premium or discount to par value, and in accordance with GAAP, record the amortization of premium/accretion of the discount to interest income. We believe that excluding the amortization of premiums and discounts provides better insight to the expected contractual cash flows. In addition, we adjust FFO for unrealized gains or losses on real estate securities. Any mark-to-market or fair value adjustments are based on general market or overall industry conditions and may be temporary in nature.
Because MFFO may be a recognized measure of operating performance within the non-listed REIT industry, MFFO and the adjustments used to calculate it may be useful in order to evaluate our performance against other non-listed REITs. Like FFO, MFFO is not equivalent to our net income or loss as determined under GAAP, as detailed in the table below, and MFFO may not be a useful measure of the impact of long-term operating performance on value if we continue to acquire a significant amount of investments.
Our presentation of FFO and MFFO may not be comparable to other similarly titled measures presented by other REITs. We believe that the use of FFO and MFFO provides a more complete understanding of our operating performance to stockholders and to management, and when compared year over year, reflects the impact on our operations from trends in occupancy rates, rental rates, operating costs, general and administrative expenses, and interest costs. Neither FFO nor MFFO is intended to be an alternative to “net income” or to “cash flows from operating activities” as determined by GAAP as a measure of our capacity to pay distributions. Management uses FFO and MFFO to compare our operating performance to that of other REITs and to assess our operating performance.
Neither the SEC, any other regulatory body nor NAREIT has passed judgment on the acceptability of the adjustments that we use to calculate FFO or MFFO. In the future, the SEC, another regulatory body or NAREIT may decide to standardize the allowable adjustments across the non-listed REIT industry and we would have to adjust our calculation and characterization of FFO or MFFO.
Our FFO and MFFO are calculated as follows:
|
|
|
Six-months ended June 30, |
|
|||||
|
|
|
2018 |
|
|
2017 |
|
||
|
GAAP net income (loss) |
|
$ |
1,039,254 |
|
|
$ |
(89,024 |
) |
|
Funds from operations |
|
$ |
1,039,254 |
|
|
$ |
(89,024 |
) |
|
|
|
|
|
|
|
|
|
|
|
Amortization of (discount) premium on real estate securities |
|
|
(51,541 |
) |
|
|
45,533 |
|
|
Unrealized gain on real estate securities |
|
|
(120,522 |
) |
|
|
(70,913 |
) |
|
Debt financing costs |
|
|
186,712 |
|
|
|
— |
|
|
Modified funds from operations |
|
$ |
1,053,903 |
|
|
$ |
(114,404 |
) |
Liquidity and Capital Resources
Liquidity is a measurement of our ability to meet potential cash requirements, including ongoing commitments to pay distributions to our stockholders, fund investments, originate loans, repay borrowings, and other general business needs including the payment of our operating and administrative expenses. Our primary sources of funds for liquidity consist of the net proceeds from the Offering, net cash provided by operating activities, proceeds from repurchase agreements and other financing arrangements and future issuances of equity and/or debt securities.
23
We currently believe that we have sufficient liquidity and capital resources available for all anticipated uses, including the acquisition of additional investments, required debt service and the payment of distributions to stockholders.
Cash Flow Analysis
|
|
|
Six-Months Ended June 30, |
|
|
Change |
|
||||||
|
|
|
2018 |
|
|
2017 |
|
|
2018 vs. 2017 |
|
|||
|
Net cash provided by (used in) operating activities |
|
$ |
781,036 |
|
|
$ |
(43,758 |
) |
|
$ |
824,794 |
|
|
Net cash used in investing activities |
|
$ |
(120,709,922 |
) |
|
$ |
(5,125,000 |
) |
|
$ |
(115,584,922 |
) |
|
Net cash provided by financing activities |
|
$ |
131,426,055 |
|
|
$ |
15,574,401 |
|
|
$ |
115,851,654 |
|
We held cash and cash equivalents of $12,903,500 and $1,406,331 as of June 30, 2018 and December 31, 2017, respectively. Our cash and cash equivalents increased due to normal fluctuations and were primarily related to the net proceeds from the Offering and from the net proceeds from our repurchase agreements that were not used to purchase investments.
Our operating activities generated (used) net cash of $781,036 and $(43,758) for the six-months ended June 30, 2018 and 2017, respectively. The increase in cash from operating activities was due to the increase in the size of our investment portfolio.
Our investing activities used $120,709,922 and $5,125,000 for the six-months ended June 30, 2018 and 2017, respectively, for the origination of commercial mortgage loans and the purchase of CMBS. The change in the cash flow from our investing activities was due to investing the capital from the Offering.
Our financing activities provided net cash of $131,426,055 and $15,574,401 for the six-months ended June 30, 2018 and 2017, respectively. The contributions came from $90,405,250 in net proceeds from our repurchase agreement financing and $43,173,517 in net proceeds from the issuance of our common stock for the six-months ended June 30, 2018. For the six-months ended June 30, 2017, the contributions came from $6,370,000 in net proceeds from our repurchase agreement financing and $9,501,843 in net proceeds from the issuance of our common stock.
Repurchase Agreements
Commercial Mortgage Loans
The Repo Facility provides up to $100.0 million in advances, subject to adjustment up to $250.0 million, which we expect to use to finance the acquisition or origination of eligible loans. The Repo Facility acts in the manner of a revolving credit facility that can be repaid as our assets are paid off and re-drawn as advances against new assets. Advances under the Repo Facility accrue interest at a per annum rate equal to LIBOR plus 2.25%. The maturity date of the Repo Facility is May 13, 2019, which was extended in June 2018 from its initial maturity date of February 15, 2019 and which remains subject to further extensions which may be exercised upon the satisfaction of certain conditions.
The details of the Repo Facility as of June 30, 2018 are as follows:
|
|
|
|
|
|
|
|
|
|
|
|
|
|
|
|
|
Weighted Average |
|
|||||
|
Committed Financing |
|
|
Amount Outstanding |
|
|
Accrued Interest Payable |
|
|
Collateral Pledged |
|
|
Interest Rate |
|
|
Days to Maturity |
|
||||||
|
|
|
|
|
|
|
|
|
|
|
|
|
|
|
|
|
|
|
|
|
|
|
|
|
$ |
100,000,000 |
|
|
$ |
62,222,250 |
|
|
$ |
88,638 |
|
|
$ |
82,963,000 |
|
|
|
4.32 |
% |
|
|
317 |
|
24
We had not entered into the Repo Facility or any master repurchase agreement for commercial mortgage loans as of December 31, 2017.
Real Estate Securities
As of June 30, 2018 and December 31, 2017, we had entered into one master repurchase agreement for real estate securities with a counterparty (the “CRE Securities MRA”) and had eight and two transactions under the CRE Securities MRA outstanding, respectively, as described in the table below.
|
|
|
|
|
|
|
|
|
|
|
|
|
|
|
Weighted Average |
|
|||||
|
|
|
Amount Outstanding |
|
|
Accrued Interest Payable |
|
|
Collateral Pledged |
|
|
Interest Rate |
|
|
Days to Maturity |
|
|||||
|
|
|
|
|
|
|
|
|
|
|
|
|
|
|
|
|
|
|
|
|
|
|
As of June 30, 2018 |
|
$ |
45,296,000 |
|
|
$ |
42,509 |
|
|
$ |
62,646,000 |
|
|
|
3.49 |
% |
|
|
18 |
|
|
As of December 31, 2017 |
|
$ |
17,113,000 |
|
|
$ |
23,518 |
|
|
$ |
19,946,000 |
|
|
|
2.27 |
% |
|
|
7 |
|
Distributions
We currently pay distributions based on daily record dates, payable in arrears the following month, equal to a daily amount of $0.005260274 per Class P Share based on a 365-day year. The table below presents the distributions paid and declared during the six months ended June 30, 2018 and 2017.
|
|
|
Distributions |
|
|
|
|
|
|||||
|
Year |
|
Paid (1) |
|
|
Declared |
|
|
Cash Flow From Operations |
|
|||
|
2018 |
|
$ |
2,152,712 |
|
|
$ |
2,410,934 |
|
|
$ |
781,036 |
|
|
2017 |
|
$ |
297,462 |
|
|
$ |
346,411 |
|
|
$ |
(43,758 |
) |
|
|
(1) |
For the six months ended June 30, 2018 and 2017, 62.5% and 100% of distributions were paid from the net proceeds of our Offering, respectively. |
Contractual Obligations and Commitments
Our contractual obligations, excluding expected interest payments, as of June 30, 2018 and December 31, 2017 are summarized as follows:
|
As of June 30, 2018 |
|
Less than 1 Year |
|
|
1 to 3 Years |
|
|
3 to 5 Years |
|
|
More than 5 Years |
|
|
Total |
|
|||||
|
Borrowings under repurchase agreements - real estate securities |
|
$ |
45,296,000 |
|
|
|
— |
|
|
|
— |
|
|
|
— |
|
|
$ |
45,296,000 |
|
|
Borrowings under repurchase agreements - commercial mortgage loans |
|
|
62,222,250 |
|
|
|
— |
|
|
|
— |
|
|
|
— |
|
|
|
62,222,250 |
|
|
Total |
|
$ |
107,518,250 |
|
|
$ |
— |
|
|
$ |
— |
|
|
$ |
— |
|
|
$ |
107,518,250 |
|
|
|
|
|
|
|
|
|
|
|
|
|
|
|
|
|
|
|
|
|
|
|
|
As of December 31, 2017 |
|
|
|
|
|
|
|
|
|
|
|
|
|
|
|
|
|
|
|
|
|
Borrowings under repurchase agreements - real estate securities |
|
$ |
17,113,000 |
|
|
|
— |
|
|
|
— |
|
|
|
— |
|
|
$ |
17,113,000 |
|
|
Total |
|
$ |
17,113,000 |
|
|
|
— |
|
|
|
— |
|
|
|
— |
|
|
$ |
17,113,000 |
|
We have made a commitment to advance additional funds under certain of our real estate loans if the borrower meets certain conditions. As of June 30, 2018, we had 6 commercial mortgage loans with a total remaining future funding commitment of $14.4 million.
25
Disclosures discussing all critical accounting policies are set forth in our Annual Report under the heading “Summary of Critical Accounting Policies.” There have been no changes to our critical accounting policies during the six-months ended June 30, 2018.
Off-Balance Sheet Arrangements
We currently have no off-balance sheet arrangements that are reasonably likely to have a material current or future effect on our financial condition, changes in financial condition, revenues or expenses, results of operations, liquidity, capital expenditures or capital resources.
Subsequent Events
For information related to subsequent events, reference is made to Note 12 – “Subsequent Events” which is included in our notes to consolidated financial statements included in this Quarterly Report on Form 10-Q.
Item 3. Quantitative and Qualitative Disclosures About Market Risk
Credit Risk
Our investments are subject to a high degree of credit risk. Credit risk is the exposure to loss from loan defaults. Default rates are subject to a wide variety of factors, including, but not limited to, borrower financial condition, property performance, property management, supply/demand factors, construction trends, consumer behavior, regional economics, interest rates, the strength of the U.S. economy, and other factors beyond our control. All loans are subject to a certain probability of default. We manage credit risk through the underwriting and investment structuring process, acquiring our investments at the appropriate discount to face value, if any, and establishing loss assumptions. We also carefully monitor the performance of the loans, as well as external factors that may affect their value.
Interest Rate Risk
Our market risk arises primarily from interest rate risk relating to interest rate fluctuations. Many factors including governmental monetary and tax policies, domestic and international economic and political considerations and other factors beyond our control contribute to interest rate risk. To meet our short and long-term liquidity requirements, we may borrow funds at fixed and variable rates. Our interest rate risk management objectives are to limit the impact of interest rate changes in earnings and cash flows and to lower our overall borrowing costs. To achieve these objectives, from time to time, we may enter into interest rate hedge contracts such as swaps, collars and treasury lock agreements in order to mitigate our interest rate risk with respect to various debt instruments. While hedging activities may insulate us against adverse changes in interest rates, they may also limit our ability to participate in benefits of lower interest rates with respect to our portfolio of investments with fixed interest rates. During the six-months ended June 30, 2018 and 2017, we did not engage in interest rate hedging activities. We do not hold or issue derivative contracts for trading or speculative purposes. We do not have any foreign denominated investments, and thus, we are not exposed to foreign currency fluctuations.
As of June 30, 2018, and December 31, 2017, our investment portfolio was 94% and 87% variable rate investments, respectively, based on LIBOR for various terms. Borrowings under our CRE Securities MRA and Repo Facility were short-term and at a variable rate. The following table quantifies the potential changes in interest income net of interest expense should interest rates increase by 50 or 100 basis points or decrease by 25 basis points, assuming that our current balance sheet was to remain constant and no actions were taken to alter our existing interest rate sensitivity:
|
|
|
Estimated Percentage Change in Interest Income Net of Interest Expense |
|
|||||
|
Change in Rates |
|
June 30, 2018 |
|
|
December 31, 2017 |
|
||
|
(-) 25 Basis Points |
|
|
(2.19 |
)% |
|
|
(3.27 |
)% |
|
Base Interest Rate |
|
|
0.00 |
% |
|
|
0.00 |
% |
|
(+) 50 Basis Points |
|
|
4.76 |
% |
|
|
6.53 |
% |
|
(+) 100 Basis Points |
|
|
9.53 |
% |
|
|
13.06 |
% |
26
Item 4. Controls and Procedures
Controls and Procedures
Our management has evaluated, with the participation of our principal executive and principal financial officers, the effectiveness of our disclosure controls and procedures (as defined in Rules 13a-15(e) and 15d-15(e) under the Exchange Act) as of the end of the period covered by this report. Based on that evaluation, the principal executive and principal financial officers have concluded that our disclosure controls and procedures were effective as of the end of the period covered by this report.
Changes in Internal Control over Financial Reporting
There were no changes to our internal control over financial reporting (as defined in Exchange Act Rule 13a-15(f) or Rule 15d-15(f)) during the three months ended June 30, 2018 that have materially affected, or are reasonably likely to materially affect, our internal control over financial reporting.
In the ordinary course of business, we may become subject to litigation. We have no knowledge of material legal proceedings pending or known to be contemplated against us at this time.
Not applicable as we are a smaller reporting company.
Item 2. Unregistered Sales of Equity Securities and Use of Proceeds
Recent Sales of Unregistered Equity Securities
On October 25, 2016, we commenced the Offering of up to $500,000,000 in our Class P Shares. The Class P Shares are being offered and sold pursuant to an exemption from the registration requirements of the Securities Act, in accordance with Rule 506(b) of Regulation D, and in compliance with any applicable state securities laws. During the three-months ended June 30, 2018, we received and accepted investors’ subscriptions for and issued 982,363 Class P Shares in the Offering resulting in gross offering proceeds of $26,679,477. During the period from June 30, 2018 to August 8, 2018, we received and accepted investors’ subscriptions for and issued 648,141 Class P Shares in the Offering resulting in gross offering proceeds of $17,546,200. As of August 8, 2018, we have issued 4,106,749 Class P Shares resulting in gross offering proceeds of $110,722,669 and had $389,277,331 of Class P Shares remaining to be sold in the Offering.
Except as set forth above, we have not sold any securities which were not registered under the Securities Act during the period covered by this report.
Repurchases of Common Stock
As of the date of this Quarterly Report on Form 10-Q, we have not repurchased any shares of our common stock.
Item 3. Defaults Upon Senior Securities
None.
Item 4. Mine Safety Disclosures
Not Applicable.
Not Applicable.
27
The representations, warranties and covenants made by us in any agreement filed as an exhibit to this Form 10-Q are made solely for the benefit of the parties to the agreement, including, in some cases, for the purpose of allocating risk among the parties to the agreement, and should not be deemed to be representations, warranties or covenants to, or with, you. Moreover, these representations, warranties and covenants should not be relied upon as accurately describing or reflecting the current state of our affairs.
The exhibits filed in response to Item 601 of Regulation S-K are listed on the Exhibit Index attached hereto and are incorporated herein by reference.
|
Exhibit No. |
|
Description |
|
|
|
|
|
3.1 |
|
|
|
3.2 |
|
|
|
31.1* |
|
|
|
31.2* |
|
|
|
32.1* |
|
|
|
32.2* |
|
|
|
101 |
|
The following financial information from our Quarterly Report on Form 10-Q for the period ended June 30, 2018, filed with the Securities and Exchange Commission on August 9, 2018 is formatted in Extensible Business Reporting Language (“XBRL”): (i) Consolidated Balance Sheets; (ii) Consolidated Statements of Operations; (iii) Consolidated Statement of Changes in Stockholders’ Equity; (iv) Consolidated Statements of Cash Flows; and (v) Notes to Consolidated Financial Statements (tagged as blocks of text) |
*Filed as part of this Quarterly Report on Form 10-Q
28
Pursuant to the requirements of the Securities Exchange Act of 1934, as amended, the registrant has duly caused this report to be signed on its behalf by the undersigned, thereunto duly authorized.
|
INPOINT COMMERCIAL REAL ESTATE INCOME, INC. |
|
|
|
|
|
By: |
/s/ Mitchell A. Sabshon |
|
Name: |
Mitchell A. Sabshon |
|
Title: |
Chief Executive Officer and Chairman |
|
|
(principal executive officer) |
|
Date: |
August 9, 2018 |
|
|
|
|
By: |
/s/ Catherine L. Lynch |
|
Name: |
Catherine L. Lynch |
|
Title: |
Chief Financial Officer |
|
|
(principal financial officer) |
|
Date: |
August 9, 2018 |
29