Attached files
| file | filename |
|---|---|
| EX-32.1 - GULF RESOURCES, INC. | e617977_ex32-1.htm |
| EX-31.2 - GULF RESOURCES, INC. | e617977_ex31-2.htm |
| EX-31.1 - GULF RESOURCES, INC. | e617977_ex31-1.htm |
UNITED STATES
SECURITIES AND EXCHANGE COMMISSION
Washington, D.C. 20549
FORM 10-Q
| x | QUARTERLY REPORT PURSUANT TO SECTION 13 OR 15(d) OF THE SECURITIES EXCHANGE ACT OF 1934 |
| For the quarterly period ended March 31, 2018 | |
| Or | |
| o | TRANSITION REPORT PURSUANT TO SECTION 13 OR 15(d) OF THE SECURITIES EXCHANGE ACT OF 1934 |
| For the transition period from _________ to _________ |
Commission File Number: 001-34499
GULF RESOURCES, INC.
(Exact name of registrant as specified in its charter)
| Nevada | 13-3637458 | |
| (State or other jurisdiction of incorporation or organization) | (I.R.S. Employer Identification No.) | |
|
Level 11,Vegetable Building, Industrial Park of the East City, Shouguang City, Shandong, |
262700 | |
| (Address of principal executive offices) | (Zip Code) |
Registrant’s telephone number, including area code: +86 (536) 567 0008
Indicate by check mark whether the registrant (1) has filed all reports required to be filed by Section 13 or 15(d) of the Securities Exchange Act of 1934 during the preceding 12 months (or for such shorter period that the registrant was required to file such reports), and (2) has been subject to such filing requirements for the past 90 days. Yes x No o
Indicate by check mark whether the registrant has submitted electronically and posted on its corporate Web site, if any, every, Interactive Data File required to be submitted and posted pursuant to Rule 405 of Regulation S-T (§232.405 of this chapter) during the preceding 12 months (or for such shorter period that the registrant was required to submit and post such files). Yes x No o
Indicate by check mark whether the registrant is a large accelerated filer, an accelerated filer, a non-accelerated filer, a smaller reporting company or an emerging growth company. See the definitions of “large accelerated filer,” “accelerated filer”, “smaller reporting company” and “emerging growth company” in Rule 12b-2 of the Exchange Act.
| Large accelerated filer o | Accelerated filer o | Emerging Growth Company o |
| Non-accelerated filer (Do not check if a smaller reporting company) x | Smaller reporting company o | |
Indicate by check mark whether the registrant is a shell company (as defined in Rule 12b-2 of the Exchange Act).
Yes o No x
As of May 1, 2018, the registrant had outstanding 46,803,791 shares of common stock.
Item 1. Financial Statements
| GULF RESOURCES, INC. |
| AND SUBSIDIARIES |
| CONDENSED CONSOLIDATED BALANCE SHEETS |
| (Expressed in U.S. dollars) |
March
31, 2018 | December 31, 2017 Audited | |||||||
| Current Assets | ||||||||
| Cash | $ | 236,720,969 | $ | 208,906,759 | ||||
| Accounts receivable | 10,246,518 | 29,765,884 | ||||||
| Inventories, net | 193,801 | 1,196,785 | ||||||
| Prepayments and deposits | 1,598,858 | 1,395,289 | ||||||
| Prepaid land leases | 607,396 | 246,640 | ||||||
| Other receivable | 2,149 | 2,089 | ||||||
| Total Current Assets | 249,369,691 | 241,513,446 | ||||||
| Non-Current Assets | ||||||||
| Property, plant and equipment, net | 94,051,877 | 95,114,504 | ||||||
| Property, plant and equipment under capital leases, net | 484,860 | 492,238 | ||||||
| Prepaid land leases, net of current portion | 14,919,014 | 14,477,771 | ||||||
| Deferred tax assets | 7,989,879 | 6,526,555 | ||||||
| Goodwill | 30,524,646 | 29,374,909 | ||||||
| Total non-current assets | 147,970,276 | 145,985,977 | ||||||
| Total Assets | $ | 397,339,967 | $ | 387,499,423 | ||||
| Liabilities and Stockholders’ Equity | ||||||||
| Current Liabilities | ||||||||
| Accounts payable and accrued expenses | $ | 991,221 | $ | 1,032,083 | ||||
| Retention payable | 993,782 | 956,351 | ||||||
| Capital lease obligation, current portion | 254,829 | 203,206 | ||||||
| Taxes payable-current | 2,204,954 | 1,474,592 | ||||||
| Total Current Liabilities | 4,444,786 | 3,666,232 | ||||||
| Non-Current Liabilities | ||||||||
| Capital lease obligation, net of current portion | 2,394,174 | 2,303,995 | ||||||
| Taxes payable-non-current | 4,969,000 | 4,969,000 | ||||||
| Total Non-Current Liabilities | 7,363,174 | 7,272,995 | ||||||
| Total Liabilities | $ | 11,807,960 | $ | 10,939,227 | ||||
| Stockholders’ Equity | ||||||||
| PREFERRED STOCK; $0.001 par value; 1,000,000 shares authorized; none outstanding | $ | — | $ | — | ||||
| COMMON STOCK; $0.0005 par value; 80,000,000 shares authorized; 47,052,940 shares issued and 46,803,791 shares outstanding as of March 31, 2018 and December 31, 2017, respectively | 23,525 | 23,525 | ||||||
| Treasury stock; 249,149 shares as of March 31, 2018 and December 31, 2017 at cost | (554,870 | ) | (554,870 | ) | ||||
| Additional paid-in capital | 94,524,608 | 94,524,608 | ||||||
| Retained earnings unappropriated | 243,193,331 | 250,170,431 | ||||||
| Retained earnings appropriated | 24,233,544 | 24,233,544 | ||||||
| Accumulated other comprehensive income | 24,111,869 | 8,162,958 | ||||||
| Total Stockholders’ Equity | 385,532,007 | 376,560,196 | ||||||
| Total Liabilities and Stockholders’ Equity | $ | 397,339,967 | $ | 387,499,423 | ||||
See accompanying notes to the condensed consolidated financial statements.
1
GULF RESOURCES, INC.
AND SUBSIDIARIES
CONDENSED CONSOLIDATED STATEMENTS OF INCOME AND COMPREHENSIVE INCOME
(Expressed in U.S. dollars)
(UNAUDITED)
| Three-Month Period Ended March 31, | ||||||||
| 2018 | 2017 | |||||||
| NET REVENUE | ||||||||
| Net revenue | $ | 2,247,267 | $ | 32,788,493 | ||||
| OPERATING INCOME (EXPENSE) | ||||||||
| Cost of net revenue | (1,241,809 | ) | (20,213,863 | ) | ||||
| Sales, marketing and other operating expenses | (34,974 | ) | (75,833 | ) | ||||
| Research and development cost | — | (61,898 | ) | |||||
| Direct labor and factory overheads incurred during plant shutdown | (5,695,519 | ) | — | |||||
| General and administrative expenses | (3,571,945 | ) | (1,728,460 | ) | ||||
| Other operating income | — | 104,558 | ||||||
| (10,544,247 | ) | (21,975,496 | ) | |||||
| INCOME/(LOSS) FROM OPERATIONS | (8,296,980 | ) | 10,812,997 | |||||
| OTHER INCOME (EXPENSE) | ||||||||
| Interest expense | (43,344 | ) | (41,911 | ) | ||||
| Interest income | 169,478 | 125,860 | ||||||
| INCOME/(LOSS) BEFORE TAXES | (8,170,846 | ) | 10,896,946 | |||||
| INCOME TAX (EXPENSE) BENEFIT | 1,193,746 | (2,821,826 | ) | |||||
| NET INCOME/(LOSS) | $ | (6,977,100 | ) | $ | 8,075,120 | |||
| COMPREHENSIVE INCOME: | ||||||||
| NET INCOME/(LOSS) | $ | (6,977,100 | ) | $ | 8,075,120 | |||
| OTHER COMPREHENSIVE INCOME | ||||||||
| - Foreign currency translation adjustments | 15,948,911 | 2,037,272 | ||||||
| COMPREHENSIVE INCOME | $ | 8,971,811 | $ | 10,112,392 | ||||
| EARNINGS (LOSS) PER SHARE: | ||||||||
| BASIC | $ | (0.15 | ) | $ | 0.17 | |||
| DILUTED | $ | (0.15 | ) | $ | 0.17 | |||
| WEIGHTED AVERAGE NUMBER OF SHARES: | ||||||||
| BASIC | 46,803,791 | 46,793,791 | ||||||
| DILUTED | 46,826,388 | 46,804,241 | ||||||
See accompanying notes to the condensed consolidated financial statements.
2
| GULF RESOURCES, INC. |
| AND SUBSIDIARIES |
| CONDENSED CONSOLIDATED STATEMENT OF STOCKHOLDERS’ EQUITY |
| THREE-MONTH PERIOD ENDED MARCH 31, 2018 |
| (Expressed in U.S. dollars) |
| Common stock | Accumulated | |||||||||||||||||||||||||||||||||||||||
| Number | Number | Number | Additional | Retained | Retained | other | ||||||||||||||||||||||||||||||||||
| of shares | of shares | of treasury | Treasury | paid-in | earnings | earnings | comprehensive | |||||||||||||||||||||||||||||||||
| issued | outstanding | stock | Amount | stock | capital | unappropriated | appropriated | income | Total | |||||||||||||||||||||||||||||||
| BALANCE AT DECEMBER 31, 2017 (Audited) | 47,052,940 | 46,803,791 | 249,149 | $ | 23,525 | $ | (554,870 | ) | $ | 94,524,608 | $ | 250,170,431 | 24,233,544 | $ | 8,162,958 | $ | 376,560,196 | |||||||||||||||||||||||
| Translation adjustment | — | — | — | — | — | — | — | 15,948,911 | 15,948,911 | |||||||||||||||||||||||||||||||
| Net loss for three-month period ended March 31, 2018 | — | — | — | — | — | — | (6,977,100 | ) | — | — | (6,977,100 | ) | ||||||||||||||||||||||||||||
| Transfer to statutory common reserve fund | — | — | — | — | — | — | — | — | — | — | ||||||||||||||||||||||||||||||
| BALANCE AT MARCH 31, 2018 (Unaudited) | 47,052,940 | 46,803,791 | 249,149 | $ | 23,525 | $ | (554,870 | ) | $ | 94,524,608 | $ | 243,193,331 | $ | 24,233,544 | $ | 24,111,869 | $ | 385,532,007 | ||||||||||||||||||||||
See accompanying notes to the condensed consolidated financial statements.
3
| GULF RESOURCES, INC. |
| AND SUBSIDIARIES |
| CONDENSED CONSOLIDATED STATEMENTS OF CASH FLOWS |
| (Expressed in U.S. dollars) |
| (UNAUDITED) |
| Three-Month Period Ended March 31, | ||||||||
| 2018 | 2017 | |||||||
| CASH FLOWS FROM OPERATING ACTIVITIES | ||||||||
| Net income/(loss) | $ | (6,977,100 | ) | $ | 8,075,120 | |||
| Adjustments to reconcile net income(loss) to net cash provided by operating activities: | ||||||||
| Interest on capital lease obligation | 41,797 | 41,753 | ||||||
| Amortization of prepaid land leases | 144,097 | 107,461 | ||||||
| Depreciation and amortization | 4,757,530 | 5,439,098 | ||||||
| Unrealized exchange loss on translation of inter-company balances | 1,058,852 | 137,255 | ||||||
| Deferred tax asset | (1,193,746 | ) | — | |||||
| Stock-based compensation expense | — | 9,000 | ||||||
| Changes in assets and liabilities | ||||||||
| Accounts receivable | 20,442,483 | (8,523,139 | ) | |||||
| Inventories | 1,039,959 | 767,825 | ||||||
| Prepayments and deposits | (81,635 | ) | (29,129 | ) | ||||
| Other receivables | — | (580 | ) | |||||
| Accounts payable and accrued expenses | (68,833 | ) | 1,641,677 | |||||
| Retention payable | — | (736,894 | ) | |||||
| Taxes payable | 735,426 | 1,493,322 | ||||||
| Net cash provided by operating activities | 19,898,830 | 8,422,769 | ||||||
| CASH FLOWS USED IN INVESTING ACTIVITIES | ||||||||
| Additions of prepaid land leases | (367,143 | ) | (324,743 | ) | ||||
| Purchase of property, plant and equipment | (121,710 | ) | (59,975 | ) | ||||
| Net cash used in investing activities | (488,853 | ) | (384,718 | ) | ||||
| EFFECTS OF EXCHANGE RATE CHANGES ON CASH AND CASH EQUIVALENTS | 8,404,233 | 881,453 | ||||||
| NET INCREASE IN CASH AND CASH EQUIVALENTS | 27,814,210 | 8,919,504 | ||||||
| CASH AND CASH EQUIVALENTS - BEGINNING OF PERIOD | 208,906,759 | 163,884,574 | ||||||
| CASH AND CASH EQUIVALENTS - END OF PERIOD | $ | 236,720,969 | $ | 172,804,078 | ||||
| SUPPLEMENTAL DISCLOSURE OF CASH FLOW INFORMATION | ||||||||
| Cash paid during the period for: | ||||||||
| Income taxes | $ | — | $ | 1,798,807 | ||||
See accompanying notes to the condensed consolidated financial statements.
4
GULF RESOURCES, INC.
AND SUBSIDIARIES
NOTES TO CONDENSED CONSOLIDATED FINANCIAL STATEMENTS
MARCH 31, 2018
(Expressed in U.S. dollars)
(UNAUDITED)
NOTE 1 – BASIS OF PRESENTATION AND SUMMARY OF SIGNIFICANT ACCOUNTING POLICIES
(a) Basis of Presentation and Consolidation
The accompanying condensed financial statements have been prepared by Gulf Resources, Inc (“Gulf Resources”) a Nevada corporation and its subsidiaries (collectively, the “Company”), without audit, in accordance with the instructions to Form 10-Q and, therefore, do not necessarily include all information and footnotes necessary for a fair statement of its financial position, results of operations and cash flows in accordance with accounting principles generally accepted in the United States (“US GAAP”).
In the opinion of management, the unaudited financial information for the quarter ended March 31, 2018 presented reflects all adjustments, which are only normal and recurring, necessary for a fair statement of results of operations, financial position and cash flows. These condensed financial statements should be read in conjunction with the financial statements included in the Company’s 2017 Form 10-K. Operating results for the interim periods are not necessarily indicative of operating results for an entire fiscal year.
The preparation of financial statements in conformity with US GAAP requires management to make estimates and assumptions that affect the amounts that are reported in the financial statements and accompanying disclosures. Although these estimates are based on management’s best knowledge of current events and actions that the Company may undertake in the future, actual results may be different from the estimates. The Company also exercises judgments in the preparation of these condensed financial statements in the areas including classification of leases and related party transactions.
On September 2, 2016, the Company announced the planned merger of two of its 100% owned subsidiaries, Shouguan Yuxin Chemical Co., Limited (“SYCI”) and Shouguan Rongyuan Chemical Co., Ltd (“SCRC”). On March 24, 2017, the legal process of the merger was completed and SCRC was officially deregistered on March 28, 2017. The results of these two subsidiaries were reported as SYCI in the three months ended March 31, 2018.
The consolidated financial statements include the accounts of Gulf Resources, Inc. and its wholly-owned subsidiary, Upper Class Group Limited, a company incorporated in the British Virgin Islands, which owns 100% of Hong Kong Jiaxing Industrial Limited, a company incorporated in Hong Kong (“HKJI”). HKJI owns 100% of Shouguang City Haoyuan Chemical Company Limited ("SCHC") which owns 100% of Shouguang Yuxin Chemical Industry Co., Limited (“SYCI”) and Daying County Haoyuan Chemical Company Limited (“DCHC”). All material intercompany transactions have been eliminated on consolidation.
(b) Nature of the Business
The Company manufactures and trades bromine and crude salt through its wholly-owned subsidiary, Shouguang City Haoyuan Chemical Company Limited ("SCHC") and manufactures chemical products for use in the oil industry, pesticides, paper manufacturing industry and for human and animal antibiotics through its wholly-owned subsidiary, Shouguang Yuxin Chemical Industry Co., Limited ("SYCI") in the People’s Republic of China (“PRC”). DCHC was established to further explore and develop natural gas and brine resources (including bromine and crude salt) in the PRC. DCHC’s business was not fully operational as of March 31, 2018.
On September 1, 2017, the Company received notification from the Government of Yangkou County, Shouguang City of PRC that production at all its factories should be halted with immediate effect in order for the Company to perform rectification and improvement in accordance with the county’s new safety and environmental protection requirements.
The Company has been working closely with the county authorities to develop rectification plans for both its bromine and crude salt businesses and had agreed on a plan in October 2017. SCHC is currently under rectification process. The Company believes this rectification and improvement process will cost approximately $35 million in total. The Company incurred rectification and improvements in the amount of $18,046,005 and $17,938,652 as of March 31, 2018 and December 31, 2017.
Originally, six bromine factories completed their rectification process and passed the inspection by local governments and were scheduled for production commencement by April 2018. Subsequently, the Provincial government required the local government to conduct “four rating and one comprehensive evaluation” for all of the chemical companies within its jurisdiction. This has delayed the production commencement schedule of the six factories.
The Company is currently actively working on the rectification of the remaining four factories. The Company expects to complete the rectification and improvements of the bromine and crude salt factories and be ready for the government inspection, rating and evaluation by June 2018, and will resume operation for those when they have approval from the government.
5
Four of the remaining bromine and crude salt factories have a slightly more complex issue that needs to be resolved. All bromine factories now require paired crude salt pans to prevent the halogen water resulting from the production process from flowing into the sea. Four of these bromine factories do not have a designated crude salt pan where the wastewater could be channeled. The Company has four alternatives for these four factories which do not have paired crude salt pans: 1. It can form partnerships with adjacent bromine facilities that do have crude salt pans. The nature of these partnerships could take many forms. 2. The company could petition the government for a zoning change so that additional land for salt pans could be obtained. This might be difficult but is worth pursuing. 3. The Company could negotiate a different method of dealing with this issue. 4. Or these factories could conceivably be forced to close. At the present time, the Company is working with the government on these issues and did not reach the final solution yet.
On November 24, 2017, the Company received a letter from the Government of Yangkou County, Shouguang City notifying the Company to relocate its two chemical production plants located in the second living area of the Qinghe Oil Extraction Plant to the Bohai Marine Fine Chemical Industrial Park (“Bohai Park”). This is because the two plants are located in a residential area and their production activities will impact the living environment of the residents. This is as a result of the country’s effort to improve the development of the chemical industry, manage safe production and curb environmental pollution accidents effectively, and ensure the quality of the living environment of residents. All chemical enterprises which do not comply with the requirements of the safety and environmental protection regulations will be ordered to shut down. The Company believes this relocation process will cost approximately $60 million in total. The Company incurred relocation cost in the amount of $9,732,118 as of March 31, 2018 and December 31, 2017 and estimated that the new factory will be fully operational by the beginning of 2020.
During the first quarter, the Company continued its related environmental and planning preparation work for the new factory. Since the Company has paid for the lease of a piece of land at the Bohai Park, it does not see any potential delay with the construction of the new factory. The Company has signed several contracts for the new factory (see subsequent event in Note 18).
As previously disclosed, during the course of drilling for more bromine and crude salt resources, the Company found natural gas resources under our bromine well in the Sichuan area. DCHC was established to further explore and develop natural gas and brine resources (including bromine and crude salt). On January 2017, the Company completed the first brine water and natural gas well field construction in Sichuan Province and announced the commencement of trial production. The Company has been working with Xinan Shiyou Daxue (Southwest Petroleum University) and developed a solution to DHCH’s technical drilling problem. In resolving the problem, the Company needs customized equipment. The customized equipment has been ordered and is now being manufactured. Once the equipment arrives, it will be installed and production will commence. While the Company hopes this will occur during the second quarter of 2018, the company has no control over the exact timing of the delivery of the equipment. It is possible the commencement of production might not occur until early in the third quarter in 2018.
(c) Allowance for Doubtful Accounts
As of March 31, 2018 and December 31, 2017, allowances for doubtful accounts were nil. No allowances for doubtful accounts were charged to the condensed consolidated statements of income for the three-month periods ended March 31, 2018 and 2017.
(d) Concentration of Credit Risk
The Company is exposed to credit risk in the normal course of business, primarily related to accounts receivable and cash and cash equivalents. Substantially all of the Company’s cash and cash equivalents are maintained with financial institutions in the PRC, namely, Industrial and Commercial Bank of China Limited, China Merchants Bank Company Limited and Sichuan Rural Credit Union, which are not insured or otherwise protected. The Company placed $236,720,969 and $208,906,759 with these institutions as of March 31, 2018 and December 31, 2017, respectively. The Company has not experienced any losses in such accounts in the PRC.
Concentrations of credit risk with respect to accounts receivable exists as the Company sells a substantial portion of its products to a limited number of customers. However, such concentrations of credit risks are limited since the Company performs ongoing credit evaluations of its customers’ financial condition. Approximately 24% and 13% of the balance of accounts receivable as of March 31, 2018 and December 31, 2017, respectively, are outstanding for less than three months. For the balances of accounts receivable aged more than 90 days as of March 31, 2018, approximately 41% were collected by April 30, 2018.
The rate of collection in April 2018 for accounts receivable aged more than 90 days as of March 31, 2018 was analyzed as follows:
| Accounts Receivable Aging | Percent Collected |
| 90-120 days | 0% |
| 121-150 days | 12% |
| 151-180 days | 0% |
| 181-210 days | 16% |
| 211-240 days | 100% |
6
GULF RESOURCES, INC.
AND SUBSIDIARIES
NOTES TO CONDENSED CONSOLIDATED FINANCIAL STATEMENTS
MARCH 31, 2018
(Expressed in U.S. dollars)
(UNAUDITED)
NOTE 1 – BASIS OF PRESENTATION AND SUMMARY OF SIGNIFICANT ACCOUNTING POLICIES – Continued
(e) Property, Plant and Equipment
Property, plant and equipment are stated at cost less accumulated depreciation and any impairment losses. Expenditures for new facilities or equipment, and major expenditures for betterment of existing facilities or equipment are capitalized and depreciated using the straight-line method at rates sufficient to depreciate such costs less 5% residual value over the estimated productive lives. All other ordinary repair and maintenance costs are expensed as incurred.
Mineral rights are recorded at cost less accumulated depreciation and any impairment losses. Mineral rights are amortized ratably over the term of the lease, or the equivalent term under the units of production method, whichever is shorter.
Construction in process primarily represents direct costs of construction of plant, machinery and equipment. Costs incurred are capitalized and transferred to property and equipment upon completion, at which time depreciation commences.
The Company’s depreciation and amortization policies on property, plant and equipment, other than mineral rights and construction in process, are as follows:
|
Useful life (in years) |
||
| Buildings (including salt pans) | 8 - 20 | |
| Plant and machinery (including protective shells, transmission channels and ducts) | 3 - 8 | |
| Motor vehicles | 5 | |
| Furniture, fixtures and equipment | 3-8 |
Property, plant and equipment under the capital lease are depreciated over their expected useful lives on the same basis as owned assets, or where shorter, the term of the lease, which is 20 years.
Producing oil and gas properties are depreciated on a unit-of-production basis over the proved developed reserves. Common facilities that are built specifically to service production directly attributed to designated oil and gas properties are depreciated based on the proved developed reserves of the respective oil and gas properties on a pro-rata basis. Common facilities that are not built specifically to service identified oil and gas properties are depreciated using the straight-line method over their estimated useful lives. Costs associated with significant development projects are not depreciated until commercial production commences and the reserves related to those costs are excluded from the calculation of depreciation.
(f) Retirement Benefits
Pursuant to the relevant laws and regulations in the PRC, the Company participates in a defined contribution retirement plan for its employees arranged by a governmental organization. The Company makes contributions to the retirement plan at the applicable rate based on the employees’ salaries. The required contributions under the retirement plans are charged to the condensed consolidated statement of income on an accrual basis when they are due. The Company’s contributions totaled $302,418 and $255,216 for the three-month periods ended March 31, 2018 and 2017, respectively.
(g) Revenue Recognition
Net revenue is net of discount and value added tax and comprises the sale of bromine, crude salt and chemical products. Revenue is recognized when the control of the promised goods is transferred to the customers in an amount that reflects the consideration that the Company expects to receive from the customers in exchange for those goods. The acknowledgement of receipt of goods by the customers is when control of the product is deemed to be transferred. Invoicing occurs upon acknowledgement of receipt of the goods by the customers. Customers have no rights to return the goods upon acknowledgement of receipt of goods.
(h) Recoverability of Long-lived Assets
In accordance with Financial Accounting Standards Board (“FASB”) Accounting Standards Codification (“ASC”) 360-10-35 “Impairment or Disposal of Long-lived Assets” , long-lived assets to be held and used are analyzed for impairment whenever events or changes in circumstances indicate that the carrying amount of an asset may not be fully recoverable or that the useful lives of those assets are no longer appropriate. The Company evaluates at each balance sheet date whether events and circumstances have occurred that indicate possible impairment.
7
GULF RESOURCES, INC.
AND SUBSIDIARIES
NOTES TO CONDENSED CONSOLIDATED FINANCIAL STATEMENTS
MARCH 31, 2018
(Expressed in U.S. dollars)
(UNAUDITED)
NOTE 1 – BASIS OF PRESENTATION AND SUMMARY OF SIGNIFICANT ACCOUNTING POLICIES – Continued
(h) Recoverability of Long-lived Assets – Continued
The Company determines the existence of such impairment by measuring the expected future cash flows (undiscounted and without interest charges) and comparing such amount to the carrying amount of the assets. An impairment loss, if one exists, is then measured as the amount by which the carrying amount of the asset exceeds the discounted estimated future cash flows. Assets to be disposed of are reported at the lower of the carrying amount or fair value of such assets less costs to sell. Asset impairment charges are recorded to reduce the carrying amount of the long-lived asset that will be sold or disposed of to their estimated fair values. Charges for the asset impairment reduce the carrying amount of the long-lived assets to their estimated salvage value in connection with the decision to dispose of such assets.
To comply with the new safety and environmental regulations (see Note 1 (b)), the Company started the rectification and improvement program for the bromine and crude salt factories towards the end of the third quarter of fiscal year 2017, and as a result recorded an impairment loss of $216,181 and a write-off of $728,740 for certain property, plant and equipment in the year ended December 31, 2017.
With the relocation of the chemical factories and the length of time required to set up the new factory building in the Bohai Marine Fine Chemical Industrial Park (see Note 1 (b)), the Company believes that it is not beneficial to move the existing plant and equipment to the new premises. This is because of the age of the plant and equipment and the impact on the production efficiency at the new plant using plant and equipment that are idle for a substantial amount of time. In addition, the Company also risks the possibility of not passing the inspection by the government at the new plant if existing plant and equipment are used. Therefore, an impairment loss of $16,636,322 equivalent to the net book values of all the property, plant and equipment at the two chemical factories was recorded in the year ended December 31, 2017.
For the three-month period ended March 31, 2018 and 2017, the Company determined that there were no events or circumstances indicating possible additional impairment of its long-lived assets.
(i) Basic and Diluted Net Income per Share of Common Stock
Basic earnings per common share are based on the weighted average number of shares outstanding during the periods presented. Diluted earnings per share are computed using weighted average number of common shares plus dilutive common share equivalents outstanding during the period. Potential common shares that would have the effect of increasing diluted earnings per share are considered to be anti-dilutive, i.e. the exercise prices of the outstanding stock options were greater than the market price of the common stock. Anti-dilutive common stock equivalents which were excluded from the calculation of number of dilutive common stock equivalents amounted to 75,614 and 25,000 shares for the three-month periods ended March 31, 2018 and 2017, respectively.
The following table sets forth the computation of basic and diluted earnings per share:
| Three-Month Period Ended March 31, | ||||||||
| 2018 | 2017 | |||||||
| Numerator | ||||||||
| Net income/(loss) | $ | (6,977,100 | ) | $ | 8,075,120 | |||
| Denominator | ||||||||
| Basic: Weighted-average common shares outstanding during the period | 46,803,791 | 46,793,791 | ||||||
| Add: Dilutive effect of stock options | 22,597 | 10,450 | ||||||
| Diluted | 46,826,388 | 46,804,241 | ||||||
| Net income/(loss) per share | ||||||||
| Basic | $ | (0.15 | ) | $ | 0.17 | |||
| Diluted | $ | (0.15 | ) | $ | 0.17 | |||
8
(j) Reporting Currency and Translation
The financial statements of the Company’s foreign subsidiaries are measured using the local currency, Renminbi (“RMB”), as the functional currency; whereas the functional currency and reporting currency of the Company is the United States dollar (“USD” or “$”).
As such, the Company uses the “current rate method” to translate its PRC operations from RMB into USD, as required under FASB ASC 830 “Foreign Currency Matters”. The assets and liabilities of its PRC operations are translated into USD using the rate of exchange prevailing at the balance sheet date. The capital accounts are translated at the historical rate. Adjustments resulting from the translation of the balance sheets of the Company’s PRC subsidiaries are recorded in stockholders’ equity as part of accumulated other comprehensive income. The statement of income and comprehensive income is translated at average rate during the reporting period. Gains or losses resulting from transactions in currencies other than the functional currencies are recognized in net income for the reporting periods as part of general and administrative expense. The statement of cash flows is translated at average rate during the reporting period, with the exception of the consideration paid for the acquisition of business which is translated at historical rates.
(k) Foreign Operations
All of the Company’s operations and assets are located in PRC. The Company may be adversely affected by possible political or economic events in this country. The effect of these factors cannot be accurately predicted.
(l) Exploration Costs
Exploration costs, which included the cost of researching appropriate places to drill wells and the cost of well drilling in search of potential natural brine or other resources, are charged to the income statement as incurred. Once the commercial viability of a project has been confirmed, all subsequent costs are capitalized.
For oil and gas properties, the successful efforts method of accounting is adopted. The Company carries exploratory well costs as an asset when the well has found a sufficient quantity of reserves to justify its completion as a producing well and where the Company is making sufficient progress assessing the reserves and the economic and operating viability of the project. Exploratory well costs not meeting these criteria are charged to expenses. Exploratory wells that discover potentially economic reserves in areas where major capital expenditure will be required before production would begin and when the major capital expenditure depends upon the successful completion of further exploratory work remain capitalized and are reviewed periodically for impairment.
(m) Goodwill
Goodwill represents the excess of the purchase price over the net of the fair value of the identifiable tangible and intangible assets acquired and the fair value of liabilities assumed in business acquisitions. Goodwill impairment is assessed based on qualitative factors to determine whether it is more likely than not that the fair value of a reporting entity is less than its carrying amount, including goodwill. If the Company determines that it is more likely than not that the fair value of a reporting entity is less than its carrying amount, the two-step goodwill impairment test will be performed. The Company performs its impairment assessment annually and between annual tests in certain circumstances and determined that the two-step goodwill impairment test is not required to be carried out as of March 31, 2018.
(n) New Accounting Pronouncements
Recently Adopted Accounting Pronouncements
In May 2014 and April 2016, the FASB issued ASU No. 2014-09 and ASU No. 2016-10, Revenue from Contracts with Customers (Topic 606). The core principle of the guidance is that an entity should recognize revenue to depict the transfer of promised goods or services to customers in an amount that reflects the consideration to which the entity expects to be entitled in exchange for those goods or services. In August 2015, FASB issued ASU 2015-14, which deferred the effective date of Update 2014-09 to annual reporting periods beginning after December 15, 2017. The Company adopted this Update as of January 1, 2018. This adoption did not have a material impact on the Company’s condensed consolidated financial statements as of and for the three months ended March 31, 2018 as the amount and timing of all the Company’s revenue will continue to be recognized at a point in time. As required by the Update, the Company disclosed its revenues from contracts with customers into disaggregated categories in Note 13.
In August 2016, the FASB issued ASU No. 2016-15, Statement of Cash Flows (Topic 230), Classification of Certain Cash Receipts and Cash Payments. The Update addresses eight specific changes to how cash receipts and cash payments are presented and classified in the statement of cash flows. The amendments in this Update are effective for public business entities for fiscal years beginning after December 15, 2017, and interim periods within those fiscal years. Early adoption is permitted. An entity that elects early adoption must adopt all of the amendments in the same period. The amendments in this Update should be applied using a retrospective transition method to each period presented. If it is impracticable to apply the amendments retrospectively for some of the issues, the amendments for those issues would be applied prospectively as of the earliest date practicable. The Company adopted this Update as of January 1, 2018 with no material impact on the condensed consolidated financial statements as of and for the three months ended March 31, 2018.
9
In May 2017, the FASB issued ASU No. 2017-09, Compensation – Stock Compensation (Topic 718), Scope of Modification Accounting. The amendments in this Update provide guidance about which changes to the terms or conditions of a share-based payment award require an entity to apply modification accounting. The amendments in this Update are effective for all entities for annual periods, and interim periods within those annual periods, beginning after December 15, 2017. The amendments in this Update should be applied prospectively to an award modified on or after the adoption date. The Company adopted this Update as of January 1, 2018 with no material impact on the condensed consolidated financial statements as of and for the three months ended March 31, 2018.
Recently Issued Accounting Pronouncements Not Yet Adopted
In February 2016, the FASB issued ASU No. 2016-02, Leases (Topic 842). The amendments in this Update specify the accounting for leases. The core principle of Topic 842 is that a lessee should recognize the assets and liabilities that arise from leases. For public business entities, the amendments in this Update are effective for fiscal years beginning after December 15, 2018, including interim periods within those fiscal years. The Company is currently evaluating the effect of this on the consolidated financial statements and related disclosure.
In June 2016, the FASB issued ASU No. 2016-13, Financial Instruments – Credit Losses (Topic 326), Measurement of Credit Losses on Financial Instruments. The amendments in this Update affect loans, debt securities, trade receivables, and any other financial assets that have the contractual right to receive cash. The ASU requires an entity to recognize expected credit losses rather than incurred losses for financial assets. For public entities, the amendments are effective for fiscal years beginning after December 15, 2019, including interim periods within those fiscal years. The Company is currently evaluating the effect of this on the consolidated financial statements and related disclosure.
In January 2017, the FASB issued ASU No. 2017-04, Intangibles – Goodwill and Other (Topic 350), Simplifying the Test for Goodwill Impairment. To simplify the subsequent measurement of goodwill, the Board eliminated Step 2 from the goodwill impairment test. Instead, under the amendments in this Update, an entity should perform its annual, or interim, goodwill impairment test by comparing the fair value of a reporting unit with its carrying amount. An entity should recognize an impairment charge for the amount by which the carrying amount exceeds the reporting unit’s fair value; however, the loss recognized should not exceed the total amount of goodwill allocated to that reporting unit. A public business entity that is a U.S. Securities and Exchange Commission (SEC) filer should adopt the amendments in this Update for its annual or any interim goodwill impairment tests in fiscal years beginning after December 15, 2019. The Company is currently evaluating effect of this on the consolidated financial statements and related disclosure.
10
GULF RESOURCES, INC.
AND SUBSIDIARIES
NOTES TO CONDENSED CONSOLIDATED FINANCIAL STATEMENTS
MARCH 31, 2018
(Expressed in U.S. dollars)
(UNAUDITED)
NOTE 2 – INVENTORIES
Inventories consist of:
| March 31, 2018 | December 31, 2017 | |||||||
| Raw materials | $ | 23,893 | $ | 396,482 | ||||
| Finished goods | 175,381 | 844,224 | ||||||
| Allowance for obsolete and slow-moving inventory | (5,473 | ) | (43,921 | ) | ||||
| $ | 193,801 | $ | 1,196,785 | |||||
NOTE 3 – PREPAID LAND LEASES
The Company prepaid for land leases with lease terms for periods ranging from one to fifty years to use the land on which the production facilities and warehouses of the Company are situated. The prepaid land lease is amortized on a straight line basis.
The Company paid $9,732,118 for a 50-year lease of a parcel of land for the new factory at Bohai Marine Fine Chemical Industrial Park in December, 2017. The land use certificate is being processed by the government and the commencement date of the lease will be known upon completion of the application process.
During the three-month period ended March 31, 2018, amortization of prepaid land lease totaled $144,097, which amount was recorded as direct labor and factory overheads incurred during plant shutdown.
During the three-month period ended March 31, 2017, amortization of prepaid land leases totaled $107,461, which amount was recorded as cost of net revenue.
The Company has the rights to use certain parcels of land located in Shouguang, the PRC, through lease agreements signed with local townships or the government authority. For parcels of land that are collectively owned by local townships, the Company cannot obtain land use rights certificates. The parcels of land of which the Company cannot obtain land use rights certificates covers a total of approximately 54.97 square kilometers of aggregate carrying value of $916,059 and approximately 54.97 square kilometers of aggregate carrying value of $645,761 as at March 31, 2018 and December 31, 2017, respectively.
11
GULF RESOURCES, INC.
AND SUBSIDIARIES
NOTES TO CONDENSED CONSOLIDATED FINANCIAL STATEMENTS
MARCH 31, 2018
(Expressed in U.S. dollars)
(UNAUDITED)
NOTE 4 – PROPERTY, PLANT AND EQUIPMENT, NET
Property, plant and equipment, net consist of the following:
| March 31, 2018 | December 31, 2017 | |||||||
| At cost: | ||||||||
| Mineral rights | $ | 4,896,244 | $ | 4,711,822 | ||||
| Buildings | 70,400,195 | 67,748,512 | ||||||
| Plant and machinery | 208,538,996 | 200,742,652 | ||||||
| Motor vehicles | 9,136 | 8,792 | ||||||
| Furniture, fixtures and office equipment | 4,313,043 | 4,150,588 | ||||||
| Construction in process | 190,200 | 183,036 | ||||||
| Total | 288,347,814 | 277,545,402 | ||||||
| Less: Accumulated depreciation and amortization | (174,767,162 | ) | (163,597,407 | ) | ||||
| Impairment | (19,528,775 | ) | (18,833,491 | ) | ||||
| Net book value | $ | 94,051,877 | $ | 95,114,504 | ||||
The Company has certain buildings and salt pans erected on parcels of land located in Shouguang, PRC, and such parcels of land are collectively owned by local townships or the government authority. The Company has not been able to obtain property ownership certificates over these buildings and salt pans. The aggregate carrying values of these properties situated on parcels of the land are $28,025,014 and $27,432,351 as at March 31, 2018 and December 31, 2017, respectively.
During the three-month period ended March 31, 2018, depreciation and amortization expense totaled $4,688,248, of which $4,504,249 and $183,999 were recorded in direct labor and factory overheads incurred during plant shutdown and administrative expenses, respectively.
During the three-month period ended March 31, 2017, depreciation and amortization expense totaled $5,360,103, of which $5,068,503 and $291,600 were recorded as cost of net revenue and administrative expenses, respectively.
NOTE 5 – PROPERTY, PLANT AND EQUIPMENT UNDER CAPITAL LEASES, NET
Property, plant and equipment under capital leases, net consist of the following:
| March 31, 2018 | December 31, 2017 | |||||||
| At cost: | ||||||||
| Buildings | $ | 130,868 | $ | 125,939 | ||||
| Plant and machinery | 2,404,774 | 2,314,196 | ||||||
| Total | 2,535,642 | 2,440,135 | ||||||
| Less: Accumulated depreciation and amortization | (2,050,782 | ) | (1,947,897 | ) | ||||
| Net book value | $ | 484,860 | $ | 492,238 | ||||
The above buildings erected on parcels of land located in Shouguang, PRC, are collectively owned by local townships. The Company has not been able to obtain property ownership certificates over these buildings as the Company could not obtain land use rights certificates on the underlying parcels of land.
During the three-month period ended March 31, 2018, depreciation and amortization expense totaled $69,282, which was recorded in direct labor and factory overheads incurred during plant shutdown. During the three-month period ended March 31, 2017, depreciation and amortization expense totaled $78,996, which was recorded as cost of net revenue.
12
GULF RESOURCES, INC.
AND SUBSIDIARIES
NOTES TO CONDENSED CONSOLIDATED FINANCIAL STATEMENTS
MARCH 31, 2018
(Expressed in U.S. dollars)
(UNAUDITED)
NOTE 6 – ACCOUNTS PAYABLE AND ACCRUED EXPENSES
Accounts payable and accrued expenses consist of the following:
| March 31, | December 31, | |||||||
| 2018 | 2017 | |||||||
| Accounts payable | $ | — | $ | — | ||||
| Salary payable | 270,901 | 393,617 | ||||||
| Social security insurance contribution payable | 140,671 | 135,203 | ||||||
| Other payables | 579,649 | 503,263 | ||||||
| Total | $ | 991,221 | $ | 1,032,083 | ||||
NOTE 7 – RELATED PARTY TRANSACTIONS
During the three-month period ended March 31, 2018, the Company borrowed a sum of $185,912 from Jiaxing Lighting Appliance Company Limited (Jiaxing Lighting”), in which Mr. Ming Yang, a shareholder and the Chairman of the Company, has a 100% equity interest. The amount due to Jiaxing Lighting was unsecured, interest free and repayable on demand and was fully settled in the three-month period ended March 31, 2018. There was no balance owing to Jiaxing Lighting as of March 31, 2018 and December 31, 2017.
On September 25, 2012, the Company purchased five floors of a commercial building in the PRC, through SYCI, from Shandong Shouguang Vegetable Seed Industry Group Co., Ltd. (the “Seller”) at a cost of approximately $5.7 million in cash, of which Mr. Ming Yang, the Chairman of the Company, had a 99% equity interest in the Seller. During the first quarter of 2018, the Company entered into an agreement with the Seller, a related party, to provide property management services for an annual amount of approximately $99,200 for five years from January 1, 2018 to December 31, 2022. The expense associated with this agreement for the three months ended March 31, 2018 was approximately $24,500.
NOTE 8 – TAXES PAYABLE
| Taxes payable consists of the following: |
| March 31, | December 31, | |||||||
| 2018 | 2017 | |||||||
| Income tax payable | $ | 433,000 | $ | 433,000 | ||||
| Natural resource tax | — | 156,147 | ||||||
| Land use tax payable | 1,698,290 | 810,841 | ||||||
| Other tax payables | 73,664 | 74,604 | ||||||
| Total current taxes payable | 2,204,954 | 1,474,592 | ||||||
| Non-current taxes payable | 4,969,000 | 4,969,000 | ||||||
| Total | $ | 7,173,954 | $ | 6,443,592 | ||||
The non-current taxes payable of $4,969,000 relates to the one-time mandatory transition tax on accumulated foreign earnings that are payable in the following periods (See Note 12(a)):
| Year ending December 31 | |||||||||
| Current | |||||||||
| 2018 | $ | 433,000 | |||||||
| Non-current | |||||||||
| 2019 | $ | 433,000 | |||||||
| 2020 | 433,000 | ||||||||
| 2021 | 433,000 | ||||||||
| 2022 | 433,000 | ||||||||
| 2023 and after | 3,237,000 | 4,969,000 | |||||||
| Total | $ | 5,402,000 | |||||||
NOTE 9 – CAPITAL LEASE OBLIGATIONS
The components of capital lease obligations are as follows:
| Imputed | March 31, | December 31, | |||||||||
| Interest rate | 2018 | 2017 | |||||||||
| Total capital lease obligations | 6.7% | $ | 2,649,003 | $ | 2,507,201 | ||||||
| Less: Current portion | (254,829 | ) | (203,206 | ) | |||||||
| Capital lease obligations, net of current portion | $ | 2,394,174 | $ | 2,303,995 | |||||||
Interest expenses from capital lease obligations amounted to $41,797 and $41,753 for the three-month periods ended March 31, 2018 and 2017, respectively, were charged to the condensed consolidated statement of income. See Note 17 for future minimum lease payments disclosure.
13
GULF RESOURCES, INC.
AND SUBSIDIARIES
NOTES TO CONDENSED CONSOLIDATED FINANCIAL STATEMENTS
MARCH 31, 2018
(Expressed in U.S. dollars)
(UNAUDITED)
NOTE 10 –EQUITY
| (a) | Authorized shares |
During the annual general meeting held on June 18, 2013, the shareholders of the Company approved the amendment to the Certificate of Incorporation to decrease the number of the authorized shares of the Company’s common stock to 80,000,000. The Company filed an amended and restated Certificate of Incorporation with the Secretary of the State of Delaware to decrease the number of authorized shares of the Company’s common stock. Accordingly, 80,000,000 is disclosed as the authorized shares of the Company’s common stock in the consolidated balance sheets as of March 31, 2018 and December 31, 2017.
| (b) | Retained Earnings - Appropriated |
In accordance with the relevant PRC regulations and the PRC subsidiaries’ Articles of Association, the Company’s PRC subsidiaries are required to allocate its profit after tax to the following reserve:
Statutory Common Reserve Funds
SCHC, SYCI and DCHC are required each year to transfer at least 10% of the profit after tax as reported under the PRC statutory financial statements to the Statutory Common Reserve Funds until the balance reaches 50% of the registered share capital. This reserve can be used to make up any loss incurred or to increase share capital. Except for the reduction of losses incurred, any other application should not result in this reserve balance falling below 25% of the registered capital. The Statutory Common Reserve Fund as of March 31, 2018 for SCHC, SYCI and DCHC is 46%, 14% and 0% of its registered capital respectively.
NOTE 11 – STOCK-BASED COMPENSATION
Pursuant to the Company’s Amended and Restated 2007 Equity Incentive Plan approved in 2011(“Plan”), the aggregate number shares of the Company’s common stock available for grant of stock options and issuance is 4,341,989 shares. On October 5, 2015, during the annual meeting of the Company’s stockholders, the aggregate number of shares reserved and available for grant and issuance pursuant to the Plan was increased to 10,341,989. As of March 31, 2018, the number of shares of the Company’s common stock available for issuance under the Plan is 6,714,989.
The fair value of each option award is estimated on the date of grant using the Black-Scholes option-pricing model. The risk free rate is based on the yield-to-maturity in continuous compounding of the US Government Bonds with the time-to-maturity similar to the expected tenor of the option granted, volatility is based on the annualized historical stock price volatility of the Company, and the expected life is based on the historical option exercise pattern.
During the three months ended March 31, 2018, there were no options issued to employees or non-employees.
The following table summarizes all Company stock option transactions between January 1, 2018 and March 31, 2018.
| Number of Option and Warrants Outstanding and exercisable | Weighted- Average Exercise price of Option and Warrants | Range of Exercise Price per Common Share | ||||||||||
| Balance, January 1, 2018 | 808,500 | $ | 1.61 | $1.44 - $4.80 | ||||||||
| Granted and vested during the period ended March 31, 2018 | — | — | — | |||||||||
| Expired during the period ended March 31, 2018 | — | — | — | |||||||||
| Balance, March 31, 2018 | 808,500 | $ | 1.61 | $1.44 - $4.80 | ||||||||
| Stock and Warrants Options Exercisable and Outstanding | ||||||||||||
| Weighted Average | ||||||||||||
| Remaining | ||||||||||||
| Outstanding at March 31, 2018 | Range of Exercise Prices | Contractual Life (Years) | ||||||||||
| Exercisable and outstanding | 808,500 | $1.44 - $4.80 | 2.86 | |||||||||
The aggregate intrinsic value of options outstanding and exercisable as of March 31, 2018 was $0.
14
GULF RESOURCES, INC.
AND SUBSIDIARIES
NOTES TO CONDENSED CONSOLIDATED FINANCIAL STATEMENTS
MARCH 31, 2018
(Expressed in U.S. dollars)
(UNAUDITED)
NOTE 12 – INCOME TAXES
The Company utilizes the asset and liability method of accounting for income taxes in accordance with FASB ASC 740-10.
(a) United States (“US”)
Gulf Resources, Inc. may be subject to the United States of America Tax laws at a tax rate of 21%. No provision for the US federal income taxes has been made as the Company had no US taxable income for the three-month periods ended March 31, 2018 and 2017, and management believes that its earnings are permanently invested in the PRC.
On December 22, 2017, the Tax Cuts and Jobs Act (“TCJA”) was enacted in law. With the new tax law, the corporation income tax rate is reduced from 35% to 21% and there is a one-time mandatory transition tax on accumulated foreign earnings. The Company is allowed under TCJA to settle the tax liabilities over a period of eight years. The Company accrued a provisional amount of $5,402,000 (See Note 8) for the one-time mandatory transition as of and for the year ended December 31, 2017. On December 22, 2017, the Securities and Exchange Commission (“SEC”), staff issued Staff Accounting Bulletin (SAB) 118 which allows the Company to record a provisional amount of the one-time mandatory transition tax on accumulated foreign earning during a measurement period not to exceed one year of the enactment date.
(b) British Virgin Islands (“BVI”)
Upper Class Group Limited, a subsidiary of Gulf Resources, Inc., was incorporated in the BVI and, under the current laws of the BVI, it is not subject to tax on income or capital gain in the BVI. Upper Class Group Limited did not generate assessable profit for the three-month periods ended March 31, 2018 and 2017.
(c) Hong Kong
Hong Kong Jiaxing Industrial Limited, a subsidiary of Upper Class Group Limited, was incorporated in Hong Kong and is subject to Hong Kong profits tax. The Company is subject to Hong Kong taxation on its activities conducted in Hong Kong and income arising in or derived from Hong Kong. No provision for profits tax has been made as the Company has no assessable income for the three-month periods ended March 31, 2018 and 2017. The applicable statutory tax rates for the three-month periods ended March 31, 2018 and 2017 are 16.5%.
(d) PRC
Enterprise income tax (“EIT”) for SCHC, SYCI and DCHC in the PRC is charged at 25% of the assessable profits.
The operating subsidiaries SCHC, SYCI and DCHC are wholly foreign-owned enterprises (“FIE”) incorporated in the PRC and are subject to PRC Local Income Tax Law.
On February 22, 2008, the Ministry of Finance (“MOF”) and the State Administration of Taxation (“SAT”) jointly issued Cai Shui [2008] Circular 1 (“Circular 1”). According to Article 4 of Circular 1, distributions of accumulated profits earned by a FIE prior to January 1, 2008 to foreign investor(s) in 2008 will be exempted from withholding tax (“WHT”) while distribution of the profit earned by an FIE after January 1, 2008 to its foreign investor(s) shall be subject to WHT at 5% effective tax rate.
As of March 31, 2018 and December 31, 2017, the accumulated distributable earnings under the Generally Accepted Accounting Principles (GAAP”) of PRC that are subject to WHT are $286,732,938 and $282,660,981, respectively. Since the Company intends to reinvest its earnings to further expand its businesses in mainland China, its foreign invested enterprises do not intend to declare dividends to their immediate foreign holding companies in the foreseeable future. Accordingly, as of March 31, 2018 and December 31, 2017, the Company has not recorded any WHT on the cumulative amount of distributable retained earnings of its foreign invested enterprises that are subject to WHT in China. As of March 31, 2018 and December 31, 2017, the unrecognized WHT are $14,336,647 and $14,133,049, respectively.
The Company’s tax returns are subject to the various tax authorities’ examination. The federal, state and local authorities of the United States may examine the Company’s tax returns filed in the United States for three years from the date of filing. The Company’s US tax returns since 2014 are currently subject to examination. Inland Revenue Department of Hong Kong may examine the Company’s tax returns filed in Hong Kong for seven years from date of filing. The Company’s Hong Kong tax returns since incorporation in year 2010 are currently subject to examination. The tax authorities of the PRC may examine the Company’s PRC tax returns for three years from the date of filing.
The components of the provision for income tax expense (benefit) from continuing operations are:
| Three-Month Period Ended March31, | ||||||||
| 2018 | 2017 | |||||||
| Current taxes – PRC | $ | — | $ | 2,821,826 | ||||
| Deferred tax – PRC | (1,193,746 | ) | — | |||||
| $ | (1,193,746 | ) | $ | 2,821,826 | ||||
15
GULF RESOURCES, INC.
AND SUBSIDIARIES
NOTES TO CONDENSED CONSOLIDATED FINANCIAL STATEMENTS
MARCH 31, 2018
(Expressed in U.S. dollars)
(UNAUDITED)
NOTE 12 – INCOME TAXES – Continued
The effective income tax expenses differ from the PRC statutory income tax rate of 25% from continuing operations in the PRC as follows:
| Three-Month Period Ended March 31, | ||||||||
| Reconciliations | 2018 | 2017 | ||||||
| Statutory income tax rate | 25 | % | 25 | % | ||||
| Non-deductible expense and change in valuation allowance | (7 | %) | 1 | % | ||||
| Non-taxable items | (3 | %) | — | |||||
| Effective tax rate | 15 | % | 26 | % | ||||
Significant components of the Company’s deferred tax assets and liabilities at March 31, 2018 and December 31, 2017 are as follows:
| March 31, | December 31, | |||||||
| 2018 | 2017 | |||||||
| Deferred tax liabilities | $ | — | $ | — | ||||
| Deferred tax assets: | ||||||||
| Allowance for obsolete and slow-moving inventories | $ | 1,368 | $ | 10,980 | ||||
| Impairment on property, plant and equipment | 4,076,604 | 4,610,228 | ||||||
| Exploration costs | 1,979,924 | 1,905,347 | ||||||
| Compensation costs of unexercised stock options | 98,088 | 98,092 | ||||||
| PRC tax losses | 1,931,983 | — | ||||||
| US federal net operating loss | 7,106,400 | 7,080,000 | ||||||
| Total deferred tax assets | 15,194,367 | 13,704,647 | ||||||
| Valuation allowance | (7,204,488 | ) | (7,178,092 | ) | ||||
| Net deferred tax asset | $ | 7,989,879 | $ | 6,526,555 | ||||
The increase in valuation allowance for the three-month period ended March 31, 2018 is $26,396.
The increase in valuation allowance for the three-month period ended March 31, 2017 is $40,800.
There were no unrecognized tax benefits and accrual for uncertain tax positions as of March 31, 2018 and December 31, 2017.
NOTE 13 – BUSINESS SEGMENTS
The Company has four reportable segments: bromine, crude salt, chemical products and natural gas. The reportable segments are consistent with how management views the markets served by the Company and the financial information that is reviewed by its chief operating decision maker.
16
GULF RESOURCES, INC.
AND SUBSIDIARIES
NOTES TO CONDENSED CONSOLIDATED FINANCIAL STATEMENTS
MARCH 31, 2018
(Expressed in U.S. dollars)
(UNAUDITED)
NOTE 13 – BUSINESS SEGMENTS – Continued
An operating segment’s performance is primarily evaluated based on segment operating income, which excludes share-based compensation expense, certain corporate costs and other income not associated with the operations of the segment. These corporate costs (income) are separately stated below and also include costs that are related to functional areas such as accounting, treasury, information technology, legal, human resources, and internal audit. The Company believes that segment operating income, as defined above, is an appropriate measure for evaluating the operating performance of its segments. All the customers are located in PRC.
| Three-Month Period Ended March 31, 2018 | Bromine * | Crude Salt * | Chemical Products | Natural Gas | Segment Total | Corporate | Total | |||||||||||||||||||||
| Net revenue (external customers) | $ | — | $ | 1,638,493 | $ | 608,774 | $ | — | $ | 2,247,267 | $ | — | $ | 2,247,267 | ||||||||||||||
| Net revenue (intersegment) | — | — | — | — | — | — | — | |||||||||||||||||||||
| Income (loss) from operations before income taxes(benefit) | (5,590,555 | ) | (807,884 | ) | (674,771 | ) | (35,655 | ) | (7,108,865 | ) | (1,188,115 | ) | (8,296,980 | ) | ||||||||||||||
| Income tax expense (benefit) | (1,391,152 | ) | (201,971 | ) | 399,377 | — | (1,193,746 | ) | — | (1,193,746 | ) | |||||||||||||||||
| Income (loss) from operations after income taxes(benefit) | (4,199,403 | ) | (605,913 | ) | (1,074,148 | ) | (35,655 | ) | (5,915,119 | ) | (1,188,115 | ) | (7,103,234 | ) | ||||||||||||||
| Total assets | 149,458,703 | 52,746,108 | 192,807,722 | 2,162,119 | 397,174,652 | 165,315 | 397,339,967 | |||||||||||||||||||||
| Depreciation and amortization | 3,719,712 | 913,350 | 124,468 | — | 4,757,530 | — | 4,757,530 | |||||||||||||||||||||
| Capital expenditures | 93,174 | 14,179 | — | 14,357 | 121,710 | — | 121,710 | |||||||||||||||||||||
| Goodwill | — | — | 30,524,646 | — | 30,524,646 | — | 30,524,646 | |||||||||||||||||||||
| Three-Month Period Ended March 31, 2017 | Bromine * | Crude Salt * | Chemical Products | Natural Gas | Segment Total | Corporate | Total | |||||||||||||||||||||
| Net revenue (external customers) | $ | 13,922,394 | $ | 1,813,778 | $ | 17,052,321 | $ | — | $ | 32,788,493 | $ | — | $ | 32,788,493 | ||||||||||||||
| Net revenue (intersegment) | 2,178,493 | — | — | — | 2,178,493 | — | 2,178,493 | |||||||||||||||||||||
| Income (loss) from operations before income taxes | 5,271,933 | 885,888 | 4,946,177 | (23,758 | ) | 11,080,240 | (267,243 | ) | 10,812,997 | |||||||||||||||||||
| Income taxes | 1,330,103 | 223,582 | 1,268,141 | — | 2,821,826 | — | 2,821,826 | |||||||||||||||||||||
| Income (loss) from operations after income taxes | 3,941,830 | 662,306 | 3,678,036 | (23,758 | ) | 8,258,414 | (267,243 | ) | 7,991,171 | |||||||||||||||||||
| Total assets | 155,178,113 | 28,641,633 | 192,675,503 | 1,802,854 | 378,298,103 | 37,109 | 378,335,212 | |||||||||||||||||||||
| Depreciation and amortization | 3,998,581 | 454,447 | 986,070 | — | 5,439,098 | — | 5,439,098 | |||||||||||||||||||||
| Capital expenditures | — | — | — | 59,975 | 59,975 | — | 59,975 | |||||||||||||||||||||
| Goodwill | — | — | 27,820,174 | — | 27,820,174 | — | 27,820,174 | |||||||||||||||||||||
* Certain common production overheads, operating and administrative expenses and asset items (mainly cash and certain office equipment) of bromine and crude salt segments in SCHC were split by reference to the average selling price and production volume of respective segment.
17
GULF RESOURCES, INC.
AND SUBSIDIARIES
NOTES TO CONDENSED CONSOLIDATED FINANCIAL STATEMENTS
MARCH 31, 2018
(Expressed in U.S. dollars)
(UNAUDITED)
NOTE 13 – BUSINESS SEGMENTS – Continued
| Three-Month Period Ended March 31, | ||||||||
| Reconciliations | 2018 | 2017 | ||||||
| Total segment operating income (loss) | $ | (7,108,865 | ) | $ | 11,080,240 | |||
| Corporate costs | (129,263 | ) | (129,988 | ) | ||||
| Unrealized loss on translation of intercompany balance | (1,058,852 | ) | (137,255 | ) | ||||
| Income (loss) from operations | (8,296,980 | ) | 10,812,997 | |||||
| Other income | 126,134 | 83,949 | ||||||
| Income (loss) before income taxes | $ | (8,170,846 | ) | $ | 10,896,946 | |||
The following table shows the major customer(s) (10% or more) for the three-month period ended March 31, 2018.
| Number | Customer | Bromine (000’s) | Crude Salt (000’s) | Chemical Products (000’s) | Total Revenue (000’s) | Percentage of Total Revenue (%) | ||||||||||||||||||
| 1 | Shandong Morui Chemical Company Limited | $ | — | $ | 534 | $ | 155 | $ | 689 | 30.6 | % | |||||||||||||
| 2 | Shandong Brother Technology Limited, Kuerle Xingdong Trading Limited | $ | — | $ | 670 | $ | — | $ | 670 | 29.8 | % | |||||||||||||
| 3 | Shouguang Weidong Chemical Company Limited | $ | — | $ | 435 | $ | — | $ | 435 | 19.3 | % | |||||||||||||
The following table shows the major customer(s) (10% or more) for the three-month period ended March 31, 2017.
| Number | Customer | Bromine (000’s) | Crude Salt (000’s) | Chemical Products (000’s) | Total Revenue (000’s) | Percentage of Total Revenue (%) | ||||||||||||||||||
| 1 | Shandong Morui Chemical Company Limited | $ | 2,594 | $ | 497 | $ | 1,085 | $ | 4,176 | 12.7 | % | |||||||||||||
NOTE 14– CUSTOMER CONCENTRATION
During the three-month periods ended March 31, 2018 and 2017, the Company sold 88.8% and 36.4% of its products to its top five customers, respectively. As of March 31, 2018 and 2017, amounts due from these customers were $8,831,030 and $30,263,356, respectively. This concentration makes the Company vulnerable to a near-term severe impact, should the relationships be terminated.
NOTE 15 – MAJOR SUPPLIERS
During the three-month period ended March 31, 2018 and 2017, the Company purchased 0% and 69.7% of its raw materials from its top five suppliers, respectively. As of March 31, 2018 and 2017, amounts due to those suppliers included in accounts payable were $0 and $5,639,164, respectively. This concentration makes the Company vulnerable to a near-term severe impact, should the relationships be terminated.
18
GULF RESOURCES, INC.
AND SUBSIDIARIES
NOTES TO CONDENSED CONSOLIDATED FINANCIAL STATEMENTS
MARCH 31, 2018
(Expressed in U.S. dollars)
(UNAUDITED)
NOTE 16 – FAIR VALUE OF FINANCIAL INSTRUMENTS
The carrying values of financial instruments, which consist of cash, accounts receivable and accounts payable and other payables, approximate their fair values due to the short-term nature of these instruments. There were no material unrecognized financial assets and liabilities as of March 31, 2018 and December 31, 2017.
NOTE 17 – CAPITAL COMMITMENT AND OPERATING LEASE COMMITMENTS
As of March 31, 2018, the Company has leased a real property adjacent to Factory No. 1, with the related production facility, channels and ducts, other production equipment and the buildings located on the property, under a capital lease. The future minimum lease payments required under the capital lease, together with the present value of such payments, are included in the table show below.
The Company has leased nine parcels of land under non-cancelable operating leases, which are fixed rentals and expire through December 2021, December 2023, December 2030, December 2031, December 2032, December 2040, February 2059, August 2059 and June 2060, respectively.
The Company has no purchase commitments as of March 31, 2018.
The following table sets forth the Company’s contractual obligations as of March 31, 2018:
| Capital Lease Obligations | Operating Lease Obligations | Property Management Fees | Capital Expenditure | |||||||||||||
| Payable within: | ||||||||||||||||
| the next 12 months | $ | 298,499 | $ | 1,045,795 | $ | 99,213 | $ | 167,016 | ||||||||
| the next 13 to 24 months | 298,499 | 1,069,473 | 99,213 | — | ||||||||||||
| the next 25 to 36 months | 298,499 | 1,094,416 | 99,213 | — | ||||||||||||
| the next 37 to 48 months | 298,499 | 942,133 | 99,213 | — | ||||||||||||
| the next 49 to 60 months | 298,499 | 960,539 | 99,213 | — | ||||||||||||
| thereafter | 2,387,996 | 16,951,287 | — | — | ||||||||||||
| Total | 3,880,491 | $ | 22,063,643 | $ | 496,065 | $ | 167,016 | |||||||||
| Less: Amount representing interest | (1,231,488 | ) | ||||||||||||||
| Present value of net minimum lease payments | $ | 2,649,003 | ||||||||||||||
Rental expenses related to operating leases of the Company amounted to $281,613 and $255,120, which were charged to the condensed consolidated statements of income for the three months ended March 31, 2018 and 2017, respectively.
NOTE 18 – SUBSEQUENT EVENTS
In April 2018, SYCI signed several contracts (preliminary design, investigative work and assessment and evaluation of safety) related to the SYCI’s relocation project. The total of these contracts amounted to approximately $1.3 million (RMB8.0 million).
In April 2018, SYCI and Shouguang City Rongyuan Pharmaceutical Co., Ltd signed a land lease contract for a 20-year term commencing May 1, 2018 in the Bohai Park for an annual rent of approximately $13,000. This is for an area of 26.89 mou (approximately 1.79 hectares) and for the construction of the new chemical factory.
In April 2018, SCHC signed a purchase agreement for rectification equipment for an amount of approximately $260,000 (RMB1.7 million).
19
Item 2. Management’s Discussion and Analysis of Financial Condition and Results of Operations
Cautionary Note Regarding Forward-Looking Statements
The discussion below contains “forward-looking statements” within the meaning of the Private Securities Litigation Reform Act of 1995, Section 27A of the Securities Act, and Section 21E of the Exchange Act. We have used words such as “believes,” “intends,” “anticipates,” “expects” and similar expressions to identify forward-looking statements. These statements are based on information currently available to us and are subject to a number of risks and uncertainties that may cause our actual results of operations, financial condition, cash flows, performance, business prospects and opportunities and the timing of certain events to differ materially from those expressed in, or implied by, these statements. These risks, uncertainties and other factors include, without limitation, those matters discussed in Item 1A of Part I of our 2017 Form 10-K. Except as expressly required by the federal securities laws, we undertake no obligation to update such factors or to publicly announce the results of any of the forward-looking statements contained herein to reflect future events, developments, or changed circumstances, or for any other reason. The following discussion should be read in conjunction with our consolidated financial statements and notes thereto appearing in our 2017 Form 10-K and Item 1A, “Risk Factors” for the year ended December 31, 2017.
Overview
We are a holding company which conducts operations through our wholly-owned China-based subsidiaries. Our business is conducted and reported in four segments, namely, bromine, crude salt, chemical products and natural gas.
Through our wholly-owned subsidiary, SCHC, we produce and trade bromine and crude salt. We are one of the largest producers of bromine in China, as measured by production output. Elemental bromine is used to manufacture a wide variety of bromine compounds used in industry and agriculture. Bromine also is used to form intermediary chemical compounds such as Tetramethylbenzidine. Bromine is commonly used in brominated flame retardants, fumigants, water purification compounds, dyes, medicines and disinfectants. Crude salt is the principal material in alkali production as well as chlorine alkali production and is widely used in the chemical, food and beverage, and other industries.
Through our wholly-owned subsidiary, SYCI, we manufacture and sell chemical products used in oil and gas field exploration, oil and gas distribution, oil field drilling, papermaking chemical agents, inorganic chemicals and materials that are used for human and animal antibiotics.
As disclosed in the Company’s Current Report on Form 8-K filed on September 8, 2017 the Company disclosed that on September 1, 2017, the Company received letters from the Yangkou County, Shouguang City government addressed to each of its subsidiaries, SCHC and SYCI, which stated that in an effort to improve the safety and environmental protection management level of chemical enterprises, the plants are requested to immediately stop production and perform rectification and improvements in accordance with the country's new safety and environmental protection requirements. In the Company’s press release of August 11, 2017 and on its conference call of August 14, 2017, the Company addressed concerns that increased government enforcement of stringent environmental rules that were adopted in early 2017 to insure corporations bring their facilities up to necessary standards so that pollution and other negative environmental issues are limited and remediated, could have an impact on our business in both the short and long-term.The Company also expressed that although it believed its facilities were fully compliant, the Company did not know how its facilities would fare under the new rules and that the Company expected to have a full understanding of the implications within the next two months. Teams of inspectors from the government were sent to many provinces to inspect all mining and manufacturing facilities. The local government requested that facilities be closed, so that the facilities can undergo the inspection and analysis in the most efficient manner by inspectors’ team. As a result, our facilities were closed on September 1, 2017.
Subsequently, the Safety Supervision and Administration Department and the Environmental Protection Departments of the local government conducted inspections of every bromine production enterprise within its jurisdiction, in order to improve security, environmental protections, pollution, and safety. The Company had been working closely with the County authorities to develop rectification plans for both its bromine and its chemical businesses. The Company and the government had agreed on a rectification plan for SCHC, the Company’s bromine and crude salt businesses which is currently under process.
Originally, six bromine factories completed their rectification process and passed the inspection by local governments, scheduled for production commencement by April 2018. Subsequently, the Provincial government required the local government to conduct “four rating and one comprehensive evaluation” for all of the chemical companies within its jurisdiction. This has delayed the production commencement schedule of the six factories.
The Company is currently actively working on the rectification of the remaining four factories. The Company expects to complete the rectification and improvements of the bromine and crude salt factories and be ready for the government inspection, rating and evaluation by June 2018, and will resume operation for those when they have approval from the government.
20
Four of the remaining bromine and crude salt factories have a slightly more complex issue that needs to be resolved. All bromine factories now require paired crude salt pans to prevent the halogen water resulting from the production process from flowing into the sea. Four of these bromine factories do not have a designated crude salt pan where the wastewater could be channeled. The Company has four alternatives for these four factories which do not have paired crude salt pans: 1. It can form partnerships with adjacent bromine facilities that do have crude salt pans. The nature of these partnerships could take many forms. 2. The company could petition the government for a zoning change so that additional land for salt pans could be obtained. This might be difficult but is worth pursuing. 3. The Company could negotiate a different method of dealing with this issue. 4. Or these factories could conceivably be forced to close. At the present time, the Company is working with the government on these issues and did not reach the final solution yet.
On November 24, 2017, the Company received a letter from the Government of Yangkou County, Shouguang City notifying the Company to relocate its two chemical production plants located in the second living area of the Qinghe Oil Extraction Plant to the Bohai Marine Fine Chemical Industrial Park (“Bohai Park”). This is because the two plants are located in a residential area and their production activities will impact the living environment of the residents. This is as a result of the country’s effort to improve the development of the chemical industry, manage safe production and curb environmental pollution accidents effectively, and ensure the quality of the living environment of residents. All chemical enterprises which do not comply with the requirements of the safety and environmental protection regulations will be ordered to shut down. The Company believes this relocation process will cost approximately $60 million in total. The Company incurred relocation cost in the amount of $9,732,118 as of March 31, 2018 and December 31, 2017 and estimated that the new factory will be fully operational by the beginning of 2020.
During the first quarter, the Company continued its related environmental and planning preparation work for the new factory. Since the Company has paid for the lease of a piece of land at the Bohai Park, it does not see any potential delay with the construction of the new factory.
As previously disclosed, during the course of drilling for more bromine and crude salt resources, the Company found natural gas resources under our bromine well in the Sichuan area. DCHC was established to further explore and develop natural gas and brine resources (including bromine and crude salt). On January 2017, the Company completed the first brine water and natural gas well field construction in Sichuan Province and announced the commencement of trial production. The Company has been working with Xinan Shiyou Daxue (Southwest Petroleum University) and developed a solution to DHCH’s technical drilling problem. In resolving the problem, the Company needs customized equipment. The customized equipment has been ordered and is now under manufacturing. Once the equipment arrives, it will be installed and production will commence. While the company hopes this will occur during the second quarter, the company has no control over the exact timing of the delivery of the equipment. It is possible the commencement of production might not occur until early in the third quarter in 2018.
Our current corporate structure chart is set forth in the following diagram:
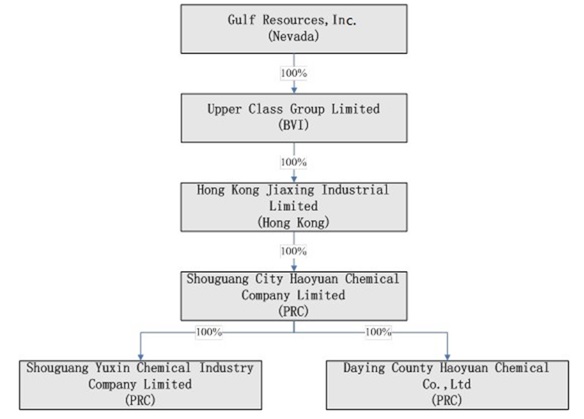
As a result of our acquisitions of SCHC and SYCI, our historical financial statements and the information presented below reflects the accounts of SCHC, SYCI and DCHC. The following discussion should be read in conjunction with our condensed consolidated financial statements and notes thereto appearing elsewhere in this report.
21
RESULTS OF OPERATIONS
The following table presents certain information derived from the condensed consolidated statements of income, cash flows and stockholders’ equity for the three-month periods ended March 31, 2018 and 2017.
Comparison of the Three-Month Periods Ended March 31, 2018 and 2017
| Three-Month Period Ended March 31, 2018 | Three-Month Period Ended March 31, 2017 | Percent Change Increase/ (Decrease) | ||||||||||
| Net revenue | $ | 2,247,267 | $ | 32,788,493 | (93 | %) | ||||||
| Cost of net revenue | $ | (1,241,809 | ) | $ | (20,213,863 | ) | (94 | %) | ||||
| Gross profit | $ | 1,005,458 | $ | 12,574,630 | (92 | %) | ||||||
| Sales, marketing and other operating expenses | $ | (34,974 | ) | $ | (75,833 | ) | (54 | %) | ||||
| Research and development costs | $ | — | $ | (61,898 | ) | (100 | %) | |||||
| Direct labor and factory overheads incurred during plant shutdown | $ | (5,695,519 | ) | — | — | |||||||
| General and administrative expenses | $ | (3,571,945 | ) | $ | (1,728,460 | ) | 107 | % | ||||
| Other operating income | $ | — | $ | 104,558 | (100 | %) | ||||||
| Income (loss) from operations | $ | (8,296,980 | ) | $ | 10,812,997 | (177 | %) | |||||
| Other income, net | $ | 126,134 | $ | 83,949 | 50 | % | ||||||
| Income (loss) before taxes | $ | (8,170,846 | ) | $ | 10,896,946 | (175 | %) | |||||
| Income (taxes) benefit | $ | 1,193,746 | $ | (2,821,826 | ) | (142 | %) | |||||
| Net income (loss) | $ | (6,977,100 | ) | $ | 8,075,120 | (186 | %) | |||||
Net revenue The table below shows the changes in net revenue in the respective segment of the Company for the three-month period ended March 31, 2018 compared to the same period in 2017:
| Net Revenue by Segment | ||||||||||||||||||||
| Three-Month Period Ended | Three-Month Period Ended | Percent Change | ||||||||||||||||||
| March 31, 2018 | March 31, 2017 | Decrease | ||||||||||||||||||
| Segment | % of total | % of total | ||||||||||||||||||
| Bromine | $ | — | — | $ | 13,922,394 | 42 | % | (100 | %) | |||||||||||
| Crude Salt | $ | 1,638,493 | 73 | % | $ | 1,813,778 | 6 | % | (10 | %) | ||||||||||
| Chemical Products | $ | 608,774 | 27 | % | $ | 17,052,321 | 52 | % | (96 | %) | ||||||||||
| Total sales | $ | 2,247,267 | 100 | % | $ | 32,788,493 | 100 | % | (93 | %) | ||||||||||
| Three-Month Period Ended | Percentage Change | |||||||||||
| Bromine and crude salt segments product sold in tonnes | March 31, 2018 | March 31, 2017 | Decrease | |||||||||
| Bromine (excluded volume sold to SYCI) | — | 3,420 | (100 | %) | ||||||||
| Crude Salt | 41,580 | 60,664 | (31 | %) | ||||||||
| Three-Month Period Ended | Percentage Change | |||||||||||
| Chemical products segment sold in tonnes | March 31, 2018 | March 31, 2017 | Decrease | |||||||||
| Oil and gas exploration additives | — | 2,105 | (100 | %) | ||||||||
| Paper manufacturing additives | — | 615 | (100 | %) | ||||||||
| Pesticides manufacturing additives | 14 | 416 | (97 | %) | ||||||||
| Pharmaceutical intermediates | — | 308 | (100 | %) | ||||||||
| By product | 96 | 2,647 | (96 | %) | ||||||||
| Overall | 110 | 6,091 | (98 | %) | ||||||||
22
Bromine segment
For the three-month period ended March 31, 2018, the net revenue for the bromine segment was $0 due to the closure of all of our plant and factories to perform rectification and improvement since September 1, 2017. As a result, there was no bromine in inventory for sale for the three-month period ended March 31, 2018.
Crude salt segment
The decrease in net revenue from our crude salt segment was due to the decrease in the sales volume of crude salt. The sales volume of crude salt decreased by 31% from 60,664 tonnes for the three-month period ended March 31, 2017 to 41,580 tonnes for the same period in 2017. This decrease was primarily attributable to the closure of all of our plant and factories to perform rectification and improvement since September 1, 2017. As a result, there was limited crude salt for sale for the three-month period ended March 31, 2018.
The average selling price of crude salt increased by 32% from $29.90 per tonne for the three-month period ended March 31, 2017 to $39.41 per tonne for the same period in 2018.
The table below shows the changes in the average selling price and changes in the sales volume of crude salt for three-month period ended March 31, 2018 from the same period in 2017.
| Three-Month Period Ended March 31, | ||||
| Decrease in net revenue of crude salt as a result of: | 2018 vs. 2017 | |||
| Increase in average selling price | $ | 486,040 | ||
| Decrease in sales volume | $ | (661,325 | ) | |
| Total effect on net revenue of crude salt | $ | (175,285 | ) | |
23
Chemical products segment
| Product Mix of Chemical Products Segment | Percent | |||||||||||||||||||
| Three-Month Period Ended | Three-Month Period Ended | Change of | ||||||||||||||||||
| March 31, 2018 | March 31, 2017 | Net Revenue | ||||||||||||||||||
| Chemical Products | % of total | % of total | ||||||||||||||||||
| Oil and gas exploration additives | $ | — | — | $ | 3,977,298 | 23 | % | (100 | %) | |||||||||||
| Paper manufacturing additives | $ | — | — | $ | 688,276 | 4 | % | (100 | %) | |||||||||||
| Pesticides manufacturing additives | $ | 98,200 | 16 | % | $ | 2,216,710 | 13 | % | (96 | %) | ||||||||||
| Pharmaceutical intermediates | $ | — | — | $ | 6,963,509 | 41 | % | (100 | %) | |||||||||||
| By products | $ | 154,666 | 25 | % | $ | 3,206,528 | 19 | % | (95 | %) | ||||||||||
| Raw materials | $ | 355,908 | 59 | % | $ | — | — | — | ||||||||||||
| Net Revenue | $ | 608,774 | 100 | % | $ | 17,052,321 | 100 | % | (96 | %) | ||||||||||
Net revenue from our chemical products segment decreased from $17,052,321 for the three-month period ended March 31, 2017 to $608,774 for the same period in 2018, a decrease of approximately 96%. This decrease was primarily attributable to the closure of our chemical factories since September 1, 2017. We are setting up a new factory in the Bohai Prak. As a result there were limited chemical products for sale for the three-month period ended March 31, 2018 and no chemical product in stock at the end of March 31, 2018. Net revenue from our pesticides manufacturing additives decreased from $2,216,710 for the three-month period ended March 31, 2017 to $98,200 for the same period in 2018, a decrease of approximately 96%.Net revenue from our by products decreased from $3,206,528 for the three-month period ended March 31, 2017 to $154,666 for the same period in 2018, a decrease of approximately 95%. Since we do not expect our new chemical factory to be fully operational until the beginning of 2020, we sold our raw materials in the amount of $355,908 for the three-month period ended March 31, 2018.
Cost of Net Revenue
| Cost of Net Revenue by Segment | Percent Change | |||||||||||||||||||
| Three-Month Period Ended | Three-Month Period Ended | of Cost of | ||||||||||||||||||
| March 31, 2018 | March 31, 2017 | Net Revenue | ||||||||||||||||||
| Segment | % of total | % of total | ||||||||||||||||||
| Bromine | $ | — | — | $ | 7,800,986 | 39 | % | (100 | %) | |||||||||||
| Crude Salt | $ | 697,488 | 56 | % | $ | 850,833 | 4 | % | (18 | %) | ||||||||||
| Chemical Products | $ | 544,321 | 44 | % | $ | 11,562,044 | 57 | % | (95 | %) | ||||||||||
| Total | $ | 1,241,809 | 100 | % | $ | 20,213,863 | 100 | % | (94 | %) | ||||||||||
Cost of net revenue reflects mainly the raw materials consumed and the direct salaries and benefits of staff engaged in the production process, electricity, depreciation and amortization of manufacturing plant and machinery and other manufacturing costs. Our cost of net revenue was $1,241,809 for the three-month period ended March 31, 2018, a decrease of $18,972,054 (or 94%) as compared to the same period in 2017.
24
Bromine production capacity and utilization of our factories
The table below represents the annual capacity and utilization ratios for all of our bromine producing properties:
| Annual Production Capacity (in tonnes) | Utilization Ratio (i) | ||||||||||||
| Three-month period ended March 31, 2017 | 42,808 | — | 37 | % | |||||||||
| Three-month period ended March 31, 2018 | 42,808 | — | — | ||||||||||
| Variance of the three-month periods ended March 31, 2018 and 2017 | — | (37 | %) | ||||||||||
(i) Utilization ratio is calculated based on the annualized actual production volume in tonnes for the periods divided by the annual production capacity in tonnes.
Our utilization ratio was 0% for the three-month period ended March 31, 2018 was due to the closure of all of our plant and factories to perform rectification and improvement since September 1, 2017.
In view of the trend of a decrease in the bromine concentration of the brine water being extracted at our production facilities as explained in 2017 Form 10-K, and in order to reduce the leakage rate and attempt to recover the annual production capacity of bromine and crude salt to a higher level in the future, we plan to carry out enhancement projects for the transmission channels and ducts and our existing bromine extraction in 2018. During the three-month period ended March 31, 2018, no such enhancement work was carried out due to the rectification and improvement of our factories. We expect to resume the enhancement work in the second and third quarters of 2018 when conditions permit.
Bromine segment
For the three-month period ended March 31, 2018, the cost of net revenue for the bromine segment was $0 due to the closure of all of our plant and factories to perform rectification and improvement since September 1, 2017. As a result, there was no bromine in inventory for sale for the three-month period ended March 31, 2018.
25
Crude salt segment
The cost of net revenue for our crude salt segment for the three-month period ended March 31, 2018 was $697,488, representing a decrease of $153,345, or 18%, compared to $850,833 for the same period in 2017. This was primarily attributable to lower volume of crude salt sold in the three-month period ended March 31, 2018 compared to the same period in 2017.
Chemical products segment
Cost of net revenue for our chemical products segment for the three-month period ended March 31, 2018 was $544,321, representing a decrease of $11,017,723 or 95% over the same period in 2017. This decrease was primarily attributable to the sale of lower margin raw material items as the chemical factories were closed in September 2017 for relocation and is not expected to resume operations until early 2020.
Gross Profit Gross profit was $1,005,458, or 45%, of net revenue for three-month period ended March 31, 2018, representing a decrease of $11,569,172 (or 92%), as compared to $12,574,630, or 38%, of net revenue for the same period in 2017.
26
| Gross Profit by Segment | % Point Change | |||||||||||||||||||
| Three-Month Period Ended | Three-Month Period Ended | of Gross | ||||||||||||||||||
| March 31, 2018 | March 31, 2017 | Profit Margin | ||||||||||||||||||
| Segment | Gross Profit Margin | Gross Profit Margin | ||||||||||||||||||
| Bromine | $ | — | — | $ | 6,121,408 | 44 | % | — | ||||||||||||
| Crude Salt | $ | 941,005 | 57 | % | $ | 962,945 | 53 | % | 4 | % | ||||||||||
| Chemical Products | $ | 64,453 | 11 | % | $ | 5,490,277 | 32 | % | (21 | %) | ||||||||||
| Total Gross Profit | $ | 1,005,458 | 45 | % | $ | 12,574,630 | 38 | % | 7 | % | ||||||||||
Bromine segment
For the three-month period ended March 31, 2018, the gross profit margin for our bromine segment was 0% due to the closure of all of our plant and factories to perform rectification and improvements since September 1, 2017. As a result, there was no bromine in inventory for sale for the three-month period ended March 31, 2018.
Crude salt segment
For the three-month period ended March 31, 2018, the gross profit margin for our crude salt segment was 57%, as compared to of 4% for the same period in 2017. This 4% increase is mainly due to the increased average selling price as mentioned in cost of net revenue of crude salt.
Chemical products segment
The gross profit margin for our chemical products segment for the three-month period ended March 31, 2018 was 11%, as compared to 32% for the same period in 2017. This 21% decrease was primarily attributable to the sale of lower margin raw materials as the chemical factories were closed in September 2017 for relocation and is not expected to resume operations in 2020.
Research and Development Costs The total research and development costs incurred for the three-month periods ended March 31, 2018 and 2017 were $0 and $61,898, respectively, a decrease of 100%. Due to the closure of our chemical factories, which have been relocated since September 1, 2017, there were no research and development costs incurred for the three-month period ended March 31, 2018. Research and development costs for the three-month period ended March 31, 2017 represented raw materials used by SYCI for testing the manufacturing routine.
Direct labor and factory overheads incurred during plant shutdown On September 1, 2017, the Company received notification from the government of Yangkou County, Shouguang City of PRC that production at all its factories be halted with immediate effect in order for the Company to perform rectification and improvement in accordance with the county’s new safety and environmental protection requirements. As such, direct labor and factory overhead costs (including depreciation of plant and machinery) of a total amount of $5,695,519 incurred for the three-month period end March 31, 2018 which would have been presented in the cost of net revenue were presented as part of the operating expense.
27
General and Administrative Expenses General and administrative expenses were $3,571,945 for the three-month period ended March 31, 2018, an increase of $1,843,485 (or 107%) as compared to $1,728,460 for the same period in 2017. The increase of $1,843,485 was primarily due to (i) the unrealized exchange loss in relation to the translation difference of inter-company balances in RMB to USD for the three-month period ended March 31, 2018 amounted to $1,058,852, as compared to the unrealized exchange loss for the same period in 2017 amounted to $137,255; and the increased property tax and land use right tax in the amount of $901,542 due to the increased tax rate by the government.
Other Operating Income Other operating income, which represented the sales of wastewater to some of our customers, was $0 for the three-month period ended March 31, 2018, as compared to $104,558 for the same period in 2017. Wastewater is generated from the production of bromine and eventually becomes crude salt when it evaporates. Not all of our bromine production plants have sufficient area on the property to allow for evaporation of wastewater to produce crude salt. Certain of our customers who have facilities located adjacent to our bromine production plants have agreed to channel our wastewater into brine pans on their properties for evaporation. These customers then are able to sell the resulting crude salt themselves. We signed agreements with four of our customers to sell them our wastewater at market prices. Due to the closure of all of our plant and factories to perform rectification and improvements since September 1, 2017, there was no wastewater for sale for the three-month period ended March 31, 2018. We have no commitments under the agreement which terminated by February 28, 2018 for the minimum amount that we must sell.
Income from Operations Loss from operations was $8,296,980 for the three-month period ended March 31, 2018, compared to an income of $10,812,997 in the same period in 2017.
| Income (Loss) from Operations by Segment | ||||||||||||||||
| Three-Month Period Ended March 31, 2018 | Three-Month Period Ended March 31, 2017 | |||||||||||||||
| Segment: | % of total | % of total | ||||||||||||||
| Bromine | $ | (5,590,555 | ) | 79 | % | $ | 5,271,933 | 47 | % | |||||||
| Crude Salt | (807,884 | ) | 11 | % | 885,888 | 8 | % | |||||||||
| Chemical Products | (674,771 | ) | 9 | % | 4,946,177 | 45 | % | |||||||||
| Natural Gas | (35,655 | ) | 1 | % | (23,758 | ) | — | |||||||||
| Income (Loss) from operations before corporate costs | (7,108,865 | ) | 100 | % | 11,080,240 | 100 | % | |||||||||
| Corporate cost | (129,263 | ) | (129,988 | ) | ||||||||||||
| Unrealized loss on translation of intercompany balance | (1,058,852 | ) | (137,255 | ) | ||||||||||||
| Income (Loss) from operations | $ | (8,296,980 | ) | $ | 10,812,997 | |||||||||||
Bromine segment
Loss from operations from our bromine segment was $5,590,555 for the three-month period ended March 31, 2018, compared to an income of $5,271,933 in the same period in 2017. This increase is mainly due to the closure of all of our plant and factories to perform rectification and improvement since September 1, 2017. The direct labor and factory overheads incurred during the plant shutdown were expensed off in the three-month period ended March 31, 2018.
Crude salt segment
Loss from operations from our crude salt segment was $807,884 for the three-month period ended March 31, 2018, a decrease of $1,693,772 (or approximately 191%) compared to the same period in 2017. This increase is mainly due to the closure of all of our plant and factories to perform rectification and improvement since September 1, 2017. The direct labor and factory overheads incurred during the plant shutdown were expensed off in the three-month period ended March 31, 2018.
Chemical products segment
Loss from operations from our chemical products segment was $674,771 for the three-month period ended March 31, 2018, compared to an income of $4,946,177 in the same period in 2017. This decrease was primarily attributable to the closure of our chemical factories since September 1, 2017. We are setting up a new factory in the Bohai Park. As a result, there were limited chemical products for sale for the three-month period ended March 31, 2018.
28
Other Income Net Other income, net of $129,134 represented bank interest income, net of capital lease interest expense for the three -month period ended March 31, 2018, an increase of $42,185 (or approximately 50%) as compared to the same period in 2017.
Net Income Net loss was $6,977,100 for the three-month period ended March 31, 2018, compared to an net income of $8,075,120 an in the same period in 2017. This increase was primarily attributable to the closure of all of our plant and factories to perform rectification and improvement since September 1, 2017, there are no bromine and not much chemical products in stock for selling for the three-month period ended March 31, 2018.
Effective Tax Rate Our effective tax rate for the three-month periods ended March 31, 2018 and 2017 was 15% and 26% respectively. The effective tax rate for the three-month period ended March 31, 2018 was 10% lower than the PRC statutory income tax rate of 25%, due to non-deductible expense and non-taxable items. The effective tax rate for the three-month period ended March 31, 2017 was 1% higher than the PRC statutory income tax rate of 25%, due to non-deductible expense and change in valuation allowance.
LIQUIDITY AND CAPITAL RESOURCES
As of March 31, 2018, cash and cash equivalents were $236,720,969 as compared to $208,906,759 as of December 31, 2017. The components of this increase of $27,814,210 are reflected below.
Statement of Cash Flows
| Three-Month Period Ended March 31, | ||||||||
| 2018 | 2017 | |||||||
| Net cash provided by operating activities | $ | 19,898,830 | $ | 8,422,769 | ||||
| Net cash used in investing activities | $ | (488,853 | ) | $ | (384,718 | ) | ||
| Effects of exchange rate changes on cash and cash equivalents | $ | 8,404,233 | $ | 881,453 | ||||
| Net increase in cash and cash equivalents | $ | 27,814,210 | $ | 8,919,504 | ||||
For the three-month period ended March 31, 2018, we met our working capital and capital investment requirements mainly by using cash flow from operations and cash on hand.
Net Cash Provided by Operating Activities
During the three-month periods ended March 31, 2018 and 2017, we had positive cash flow from operating activities of approximately $19.9 million and $8.5 million, respectively.
During the three-month period ended March 31, 2018, cash flow from operating activities of approximately $19.9 million, mainly due to (i) substantial non-cash charges in the amounts of approximately $4.8 million, mainly in the form of depreciation and amortization of property, plant and equipment and exchange loss on intercompany balances; partially offset by deferred tax assets; and (ii)cash generated from working capital of approximately $22.1 million, which mainly consisted of the decrease in accounts receivable and inventories and an increase in taxes payable.
During the three-month period ended March 31, 2017, cash flow from operating activities of approximately $8.4 million exceeded our net income of approximately $8.1 million, mainly due to substantial non-cash charges in the amounts of approximately $5.7 million, mainly in the form of depreciation and amortization of property, plant and equipment and exchange loss on intercompany balances; partially offset cash used in working capital of approximately $5.4 million, which mainly consisted of an increase in accounts receivable and decreased retention payable, partially offset by the decrease in inventories and an increase in accounts payable and accrued expenses and taxes payable.
29
Accounts receivable
Cash collections on our accounts receivable had a major impact on our overall liquidity. The following table presents the aging analysis of our accounts receivable as of March 31, 2018 and December 31, 2017.
| March 31, 2018 | December 31, 2017 | |||||||||||||||
| % of total | % of total | |||||||||||||||
| Aged 1-30 days | $ | — | — | $ | 1,955,296 | 7 | % | |||||||||
| Aged 31-60 days | $ | — | — | $ | 1,284,013 | 4 | % | |||||||||
| Aged 61-90 days | $ | 2,505,235 | 25 | % | $ | 692,781 | 2 | % | ||||||||
| Aged 91-120 days | $ | 2,031,828 | 20 | % | $ | 2,675,960 | 9 | % | ||||||||
| Aged 121-150 days | $ | 1,334,270 | 13 | % | $ | 8,783,405 | 30 | % | ||||||||
| Aged 151-180 days | $ | 447,815 | 4 | % | $ | 5,079,545 | 17 | % | ||||||||
| Aged 181-210 days | $ | 1,046,254 | 10 | % | $ | 5,983,997 | 20 | % | ||||||||
| Aged 211-240 days | $ | 2,881,116 | 28 | % | $ | 3,310,887 | 11 | % | ||||||||
| Total | $ | 10,246,518 | 100 | % | $ | 29,765,884 | 100 | % | ||||||||
The overall accounts receivable balance as of March 31, 2018 decreased by $19,519,366 (or 66%), as compared to those of December 31, 2017. Approximately 41% of the balances of accounts receivable as of March 31, 2018 aged more than 90 days were settled by April 30, 2018. We have policies in place to ensure that sales are made to customers with an appropriate credit history. We perform ongoing credit evaluation on the financial condition of our customers. No allowance for doubtful debts for the three-month period ended March 31, 2018 is required.
Inventory
Our inventory consists of the following:
| March 31, 2018 | December 31, 2017 | |||||||||||||||
| % of total | % of total | |||||||||||||||
| Raw materials | $ | 23,893 | 12 | % | $ | 396,482 | 33 | % | ||||||||
| Finished goods | 175,381 | 91 | % | 844,224 | 71 | % | ||||||||||
| Work-in-progress | — | — | — | — | % | |||||||||||
| $ | 199,274 | 103 | % | $ | 1,240,706 | 104 | % | |||||||||
| Allowance for obsolete and slowing-moving inventory | (5,473 | ) | (3 | %) | (43,921 | ) | (4 | %) | ||||||||
| Total | $ | 193,801 | 100 | % | $ | 1,196,785 | 100 | % | ||||||||
The net inventory level as of March 31, 2018 decreased by $1,002,984 (or 84%), as compared to the net inventory level as of December 31, 2017.
Raw materials decreased by 94% as of March 31, 2018 as compared to December 31, 2017 All of the raw materials are basic chemical industry materials, few of which have a possibility of loss over time, or major fluctuations in their prices. So, we concluded that all of our raw materials as of March 31, 2018 are fully realizable for production of finished goods without any impairment.
Our finished goods consist of bromine, crude salt and chemical products. There are no bromine and chemical products in stock at the end of the first quarter of 2018.
As of March 31, 2018, the crude salt included in the inventory is approximately $0.2 million. The annual loss of crude salt due to evaporation is approximately 3%. The average selling price of crude salt per tonne increased from $29.90 for the first quarter of 2017 to $39.41 for the same period of 2018. The gross profit also increased from 53% for the first quarter of 2017 to 57% for the same period in 2018. We believe that there will be no realization problem for crude salt as we do not expect selling price to be lower than the current price.
Net Cash Used in Investing Activities
For the three-month period ended March 31, 2018, we used approximately $0.4 million cash for the prepayment of land leases. We also used approximately $0.1 million to acquire property, plant and equipment in the first quarter of 2018.
For the three-month period ended March 31, 2017, we used approximately $0.3 million cash for the prepayment of land leases. We also used approximately $0.06 million to acquire property, plant and equipment in the first quarter of 2017.
30
Net Cash Used in Financing Activities
We have no major financing activities for the three-month period ended March 31, 2018.
We believe that our available funds and cash flows generated from operations will be sufficient to meet our anticipated ongoing operating needs for the next twelve (12) months.
Working capital was approximately $244.9 million at March 31, 2018 as compared to approximately $247.8 million at December 31, 2017.
We had available cash of approximately $236.7 million at March 31, 2018, most of which is in highly liquid current deposits which earn no or little interest. We intend to retain the cash for the rectification and improvements of our bromine and crude salt factories, the relocation of our chemical factories (See note 1(b) in the notes to the consolidated financial statements), future expansion of our bromine and crude salt businesses through acquisition, enhancements to our existing bromine and crude salt business, and further development of the new resources in Sichuan Province. We do not anticipate paying cash dividends in the foreseeable future.
In the future we intend to focus our efforts on the activities of SCHC, SYCI and DCHC as these segments continue to expand within the Chinese market.
We may not be able to identify, successfully integrate or profitably manage any businesses or business segment we may acquire, or any expansion of our business. An expansion may involve a number of risks, including possible adverse effects on our operating results, diversion of management’s attention, inability to retain key personnel, risks associated with unanticipated events and the financial statement effect of potential impairment of acquired intangible assets, any of which could have a materially adverse effect on our condition and results of operations. In addition, if competition for acquisition candidates or operations were to increase, the cost of acquiring businesses could increase materially. We may effect an acquisition with a target business which may be financially unstable, under-managed, or in its early stages of development or growth. Our inability to implement and manage our expansion strategy successfully may have a material adverse effect on our business and future prospects.
Contractual Obligations and Commitments
We have no significant contractual obligations not fully recorded on our consolidated balance sheets or fully disclosed in the notes to our consolidated financial statements. Additional information regarding our contractual obligations and commitments at March 31, 2018 is provided in the notes to our consolidated financial statements. See “Notes to Condensed Consolidated Financial Statements, Note 17 – Capital Commitment and Operating Lease Commitments”.
Material Off-Balance Sheet Arrangements
We do not currently have any off -balance sheet arrangements falling within the definition of Item 303(a) of Regulation S-K.
Critical Accounting Policies and Estimates
Our consolidated financial statements have been prepared in accordance with accounting principles generally accepted in the United States of America and this requires management to make estimates and assumptions that affect the reported amounts of assets and liabilities at the date of the consolidated financial statements and the reported amounts of revenues and expenses during the reporting period. We base its estimates on historical experience and on various other assumptions that are believed to be reasonable under the circumstances. Accordingly, actual results may differ significantly from these estimates under different assumptions or conditions. We have identified the following critical accounting policies and estimates used by us in the preparation of our financial statements: accounts receivable and allowance for doubtful accounts, assets retirement obligation, property, plant and equipment, recoverability of long lived assets, mineral rights, revenue recognition, income taxes, and stock-based compensation. These policies and estimates are described in the Company’s 2017 Form 10-K.
31
Item 3. Quantitative and Qualitative Disclosures About Market Risk
Credit Risk
The Company is exposed to credit risk from its cash at bank and fixed deposits and accounts receivable. The credit risk on cash at bank and fixed deposits is limited because the counterparties are recognized financial institutions. Accounts receivable are subjected to credit evaluations. An allowance has been made for estimated irrecoverable amounts which have been determined by reference to past default experience and the current economic environment.
Foreign Exchange Risk
The value of the RMB against the U.S. dollar and other currencies is affected by, among other things, changes in China’s political and economic conditions. Since July 2005, the RMB has no longer been pegged to the U.S. Dollar at a constant exchange rate. Although the People’s Bank of China regularly intervenes in the foreign exchange market to prevent significant short-term fluctuations in the exchange rate, the RMB may appreciate or depreciate within a flexible peg range against the U.S. dollar in the medium to long term. Moreover, it is possible that in the future, PRC authorities may lift restrictions on fluctuations in the RMB exchange rate and lessen intervention in the foreign exchange market.
Because substantially all of our earnings and cash assets are denominated in RMB, but our reporting currency is the U.S. dollar, fluctuations in the exchange rate between the U.S. dollar and the RMB will affect our balance sheet and our earnings per share in U.S. dollars. In addition, appreciation or depreciation in the value of the RMB relative to the U.S. dollar would affect our financial results reported in U.S. dollar terms without giving effect to any underlying change in our business or results of operations. Fluctuations in the exchange rate will also affect the relative value of any dividend we issue in the future that will be exchanged into U.S. dollars and earnings from, and the value of, any U.S. dollar-denominated investments we make in the future.
Very limited hedging transactions are available in China to reduce our exposure to exchange rate fluctuations. To date, we have not entered into any hedging transactions in an effort to reduce our exposure to foreign currency exchange risk. While we may enter into hedging transactions in the future, the availability and effectiveness of these transactions may be limited, and we may not be able to successfully hedge our exposure at all. In addition, our foreign currency exchange losses may be magnified by PRC exchange control regulations that restrict our ability to convert RMB into foreign currencies.
Most of the transactions of the Company are settled in RMB and U.S. dollars. In the opinion of the directors, the Company is not exposed to significant foreign currency risk.
Impact of Inflation
Inflationary factors, such as increases in the cost of our product and overhead costs, may adversely affect our operating results. Based on the Consumer Price Index in the PRC, the average annual rate of inflation over the three-year period from 2014 to 2016 was 2.0%, 1.4% and 2.0%. As of April 30, 2018, the rate of inflation was 1.8%. The Company believes that in the long run the selling prices of its products could be increased at a similar level to compensate the adverse effect. In the foreseeable future, a high rate of inflation may have an adverse effect on our ability to maintain current levels of gross margin and selling, general and administrative expenses as a percentage of net revenues if the selling prices of our products do not increase with these increased costs.
Company’s Operations are Substantially in Foreign Countries
Substantially all of our operations are conducted in China and are subject to various political, economic, and other risks and uncertainties inherent in conducting business in China. Among other risks, the Company and its subsidiaries’ operations are subject to the risks of restrictions on transfer of funds; export duties, quotas, and embargoes; domestic and international customs and tariffs; changing taxation policies; foreign exchange restrictions; and political conditions and governmental regulations.
Item 4. Controls and Procedures
(a) Evaluation of Disclosure Controls and Procedures
We maintain disclosure controls and procedures (as such term is defined in Exchange Act Rules 13a-15(e) and 15d-15(e)) that are designed to ensure that information required to be disclosed in our reports filed pursuant to the Exchange Act is recorded, processed, summarized and reported within the time periods specified in the SEC’s rules, regulations and related forms, and that such information is accumulated and communicated to our management, including our Chief Executive Officer (“CEO”) and Chief Financial Officer (“CFO”), as appropriate, to allow timely decisions regarding required disclosure.
Under the supervision and with the participation of our management, including our CEO and CFO, we conducted an evaluation of the effectiveness of the design and operation of our disclosure controls and procedures as of the end of the period covered by this report. Based on this evaluation, our CEO and CFO concluded that our disclosure controls and procedures were effective as of the end of the period covered by this Form 10-Q.
(b) Changes in internal controls
There were no changes in our internal control over financial reporting (as such term is defined in Rules 13a-15(f) under the Exchange Act) during our most recently completed fiscal quarter that have materially affected, or are reasonably likely to materially affect, our internal control over financial reporting.
32
Item 1. Legal Proceedings
None.
Item 1A. Risk Factors
Investing in our common stock involves a high degree of risk. Before you invest you should carefully review our Management’s Discussion and Analysis of Financial Condition and Results of Operations set forth in Item 2 of Part I of this Quarterly Report on Form 10-Q, our consolidated financial statements and related notes included in Item 1 of Part I of this Quarterly Report on Form 10-Q and our consolidated financial statements and related notes, as well as our Management’s Discussion and Analysis of Financial Condition and Results of Operations and the other information in our 2017 Form 10-K. Readers should carefully review risks described in other documents we file from time to time with the Securities and Exchange Commission.
Item 2. Unregistered Shares of Equity Securities and Use of Proceeds
None.
Item 3. Defaults Upon Senior Securities
None.
Item 4. Mine Safety Disclosures
Not applicable.
Item 5. Other Information
None.
33
| Exhibit No. |
Description |
| 31.1 | Certification of Chief Executive Officer pursuant to Rule 13a-14(a) and 15d-14(a), as adopted pursuant to Section 302 of the Sarbanes-Oxley Act of 2002. |
| 31.2 | Certification of Chief Financial Officer pursuant to Rule 13a-14(a) and 15d-14(a), as adopted pursuant to Section 302 of the Sarbanes-Oxley Act of 2002. |
| 32.1 | Certification pursuant to 18 U.S.C. Section 1350, as adopted pursuant to Section 906 of the Sarbanes-Oxley Act of 2002. |
| 101.1 | The following financial statements from Gulf Resources, Inc.’s Quarterly Report on Form 10-Q for the quarterly period ended March 31, 2018 formatted in XBRL (eXtensible Business Reporting Language): (i) the Consolidated Balance Sheets; (ii) the Consolidated Statements of Operations and Other Comprehensive Income (Loss); (iii) the Consolidated Statements of Changes in Equity; (iv) the Consolidated Statement of Cash Flows; and, (v) the Notes to Consolidated Financial Statements, tagged as blocks of text. |
34
Pursuant to the requirements of Section 13 or 15(d) of the Securities Exchange Act of 1934, the registrant has duly caused this report to be signed on its behalf by the undersigned, thereunto duly authorized.
| GULF RESOURCES, INC. | ||
| Dated: May 10, 2018 | By: | /s/ Xiaobin Liu |
| Xiaobin Liu | ||
| Chief Executive Officer | ||
| (principal executive officer) | ||
| Dated: May 10, 2018 | By: | /s/ Min Li |
| Min Li | ||
| Chief Financial Officer | ||
| (principal financial and accounting officer) | ||
35