Attached files
| file | filename |
|---|---|
| EX-23.1 - GULF RESOURCES, INC. | e613413_ex23-1.htm |
| EX-32.1 - GULF RESOURCES, INC. | e613413_ex32-1.htm |
| EX-31.1 - GULF RESOURCES, INC. | e613413_ex31-1.htm |
| EX-31.2 - GULF RESOURCES, INC. | e613413_ex31-2.htm |
| EXCEL - IDEA: XBRL DOCUMENT - GULF RESOURCES, INC. | Financial_Report.xls |
UNITED STATES
SECURITIES AND EXCHANGE COMMISSION
Washington, D.C. 20549
FORM 10-K
(Mark One)
x ANNUAL REPORT PURSUANT TO SECTION 13 OR 15(d) OF THE SECURITIES EXCHANGE ACT OF 1934
For the fiscal year ended December 31, 2014
Or
o TRANSITION REPORT PURSUANT TO SECTION 13 OR 15(d) OF THE SECURITIES EXCHANGE ACT OF 1934
For the transition period from ________________ to ________________
Commission file number 001-34499
Gulf Resources, Inc.
(Exact name of registrant as specified in its charter)
|
Delaware
|
13-3637458
|
|
|
(State or other jurisdiction of incorporation or organization)
|
(I.R.S. Employer Identification No.)
|
|
|
Level 11,Vegetable Building, Industrial Park of the East Shouguang City, Shandong, China
|
262700
|
|
|
(Address of principal executive offices)
|
(Zip Code)
|
+86 (536) 567-0008
Registrant’s telephone number, including area code
Securities registered pursuant to Section 12(b) of the Act:
|
Title of each class
|
Name of each exchange on which registered
|
|
Common Stock, $0.0005 par value
|
NASDAQ Global Select Market
|
Securities registered pursuant to section 12(g) of the Act:
Indicate by check mark if the registrant is a well-known seasoned issuer, as defined in Rule 405 of the Securities Act. Yes o No x
Indicate by check mark if the registrant is not required to file reports pursuant to Section 13 or Section 15(d) of the Act. Yes o No x
Indicate by check mark whether the registrant (1) has filed all reports required to be filed by Section 13 or 15(d) of the Securities Exchange Act of 1934 during the preceding 12 months (or for such shorter period that the registrant was required to file such reports), and (2) has been subject to such filing requirements for the past 90 days. Yes x No o
Indicate by check mark if disclosure of delinquent filers pursuant to Item 405 of Regulation S-K (§ 229.405 of this chapter) is not contained herein, and will not be contained, to the best of registrant’s knowledge, in definitive proxy or information statements incorporated by reference in Part III of this Form 10-K or any amendment to this Form 10-K o
Indicate by check mark whether the registrant is a large accelerated filer, an accelerated filer, a non-accelerated filer, or a smaller reporting company. See definitions of “large accelerated filer," "accelerated filer,” and "smaller reporting company" in Rule 12b-2 of the Exchange Act. (Check one):
|
Large accelerated filer o
|
Accelerated filer o
|
|
Non-accelerated filer o
|
Smaller reporting company x
|
(Do not check if a smaller reporting company)
Indicate by check mark whether the registrant is a shell company (as defined in Rule 12b-2 of the Act).
Yes o No x
State the aggregate market value of the voting and non-voting common equity held by non-affiliates computed by reference to the price at which the common equity was last sold, or the average bid and asked price of such common equity, as of the last business day of the registrant’s most recently completed second fiscal quarter. As of June 30, 2014, the aggregate market value of the common stock of the registrant held by non-affiliates (excluding shares held by directors, officers and others holding more than 5% of the outstanding shares of the class) was $ $50,455,066 based upon a closing sale price of $ $2.14.
APPLICABLE ONLY TO REGISTRANTS INVOLVED IN BANKRUPTCY PROCEEDINGS DURING THE PRECEDING FIVE YEARS:
Indicate by check mark whether the registrant has filed all documents and reports required to be filed by Section 12, 13 or 15 of the Securities Exchange Act of 1934 subsequent to the distribution of securities under a plan confirmed by a court.
Yes o No o
(APPLICABLE ONLY TO CORPORATE REGISTRANTS)
As of March 12, 2015, the registrant had outstanding 45,909,876 shares of common stock.
DOCUMENTS INCORPORATED BY REFERENCE
Portions of the Registrant’s Proxy Statement relating to the Registrant’s 2015 Annual Meeting of Shareholders are incorporated by reference into Part III of this Annual Report on Form 10-K.
Table of Contents
|
PART I
|
||||
|
Item 1.
|
|
Business
|
|
1
|
|
Item 1A.
|
|
Risk Factors
|
|
10
|
|
Item 1B
|
Unresolved Staff Comments
|
23
|
||
|
Item 2.
|
|
Properties
|
|
23
|
|
Item 3.
|
|
Legal Proceedings
|
|
32
|
|
Item 4.
|
|
Mine Safety Disclosures
|
|
32
|
|
PART II
|
||||
|
Item 5.
|
|
Market for Registrant’s Common Equity, Related Stockholder Matters and Issuer Purchases of Equity Securities
|
|
33
|
|
Item 6.
|
|
Selected Financial Data
|
|
34
|
|
Item 7.
|
|
Management’s Discussion and Analysis of Financial Condition and Results of Operations
|
|
35
|
|
Item 7A.
|
|
Quantitative and Qualitative Disclosures About Market Risk
|
|
48
|
|
Item 8.
|
|
Financial Statements and Supplementary Data
|
|
48
|
|
Item 9.
|
|
Changes In and Disagreements With Accountants on Accounting and Financial Disclosure
|
|
49
|
|
Item 9A.
|
|
Controls and Procedures
|
|
50
|
|
Item 9B.
|
|
Other Information
|
|
52
|
|
PART III
|
||||
|
Item 10.
|
|
Directors, Executive Officers and Corporate Governance
|
|
52
|
|
Item 11.
|
|
Executive Compensation
|
|
52
|
|
Item 12.
|
|
Security Ownership of Certain Beneficial Owners and Management and Related Stockholder Matters
|
|
52
|
|
Item 13.
|
|
Certain Relationships and Related Transactions, and Director Independence
|
|
52
|
|
Item 14.
|
|
Principal Accounting Fees and Services
|
|
52
|
|
PART IV
|
||||
|
Item 15.
|
|
Exhibits and Financial Statement Schedules
|
|
53
|
|
Signatures
|
|
57
|
||
Special Note Regarding Forward Looking Information
This report contains forward-looking statements that reflect management's current views and expectations with respect to our business, strategies, future results and events, and financial performance. All statements made in this report other than statements of historical fact, including statements that address operating performance, events or developments that management expects or anticipates will or may occur in the future, including statements related to future reserves, cash flows, revenues, profitability, adequacy of funds from operations, statements expressing general optimism about future operating results and non-historical information, are forward-looking statements. In particular, the words "believe", "expect", "intend", "anticipate", "estimate", "plan", "may", "will", variations of such words and similar expressions identify forward-looking statements, but are not the exclusive means of identifying such statements and their absence does not mean that the statement is not forward-looking. Readers should not place undue reliance on forward-looking statements which are based on management's current expectations and projections about future events, are not guarantees of future performance, are subject to risks, uncertainties and assumptions. Our actual results, performance or achievements could differ materially from the results expressed in, or implied by, these forward-looking statements. Factors that could cause or contribute to such differences include those discussed in this report, particularly under the caption "Risk Factors". Except as required under the federal securities laws, we do not undertake any obligation to update the forward-looking statements in this report.
PART I
Item 1. Business.
Introduction
We manufacture and trade bromine and crude salt, and manufacture and sell chemical products used in oil and gas field exploration, oil and gas distribution, oil field drilling, wastewater processing, papermaking chemical agents and inorganic chemicals. To date, our products have been sold only within the People’s Republic of China. As used in this report, the terms "we," "our," "Company" and "Gulf Resources" refers to Gulf Resources, Inc. and its wholly-owned subsidiaries, and the terms “ton” and “tons” refers to metric tons, in each case, unless otherwise stated or the context requires otherwise. All information in this report gives retroactive effect to a 4-for-1 reverse stock split of our common stock effected on October 12, 2009.
The functional currency of the Company’s operating foreign subsidiaries is the Renminbi (“RMB”), which had an average exchange rate of $0.16142 and $0.16281 during fiscal year 2013 and 2014, respectively. The functional and reporting currency of the Company is the United States dollar (“USD” or $”).
Our Corporate History
We were incorporated in Delaware on February 28, 1989. From November 1993 through August 2006, we were engaged in the business of owning, leasing and operating coin and debit card pay-per copy photocopy machines, fax machines, microfilm reader-printers and accessory equipment under the name “Diversifax, Inc.”. Due to the increased use of internet services, demand for our services declined sharply, and in August 2006, our Board of Directors decided to discontinue our operations.
Upper Class Group Limited, incorporated in the British Virgin Islands in July 2006, acquired all the outstanding stock of Shouguang City Haoyuan Chemical Company Limited ("SCHC"), a company incorporated in Shouguang City, Shandong Province, the People's Republic of China (the “PRC”), in May 2005. At the time of the acquisition, members of the family of Mr. Ming Yang, our president and former chief executive officer, owned approximately 63.20% of the outstanding shares of Upper Class Group Limited. Since the ownership of Upper Class Group Limited and SCHC was then substantially the same, the acquisition was accounted for as a transaction between entities under common control, whereby Upper Class Group Limited recognized the assets and liabilities transferred at their carrying amounts.
1
On December 12, 2006, our Company, then known as Diversifax, Inc., a public "shell" company, acquired Upper Class Group Limited and SCHC. Under the terms of the agreement, the stockholders of Upper Class Group Limited received 13,250,000 (restated for the 2-for-1 stock split in 2007 and the 1-for-4 stock split in 2009) shares of voting common stock of Gulf Resources, Inc. in exchange for all outstanding shares of Upper Class Group Limited. Members of the Yang family received approximately 62% of our common stock as a result of the acquisition. Under accounting principles generally accepted in the United States, the share exchange is considered to be a capital transaction rather than a business combination. That is, the share exchange is equivalent to the issuance of stock by Upper Class Group Limited for the net assets of Gulf Resources, Inc., accompanied by a recapitalization, and is accounted for as a change in capital structure. Accordingly, the accounting for the share exchange is identical to that resulting from a reverse acquisition, except no goodwill is recorded. Under reverse takeover accounting, the post reverse acquisition comparative historical financial statements of the legal acquirer, Gulf Resources, Inc., are those of the legal acquiree, Upper Class Group Limited. Share and per share amounts stated have been retroactively adjusted to reflect the share exchange. On February 20, 2007, we changed our corporate name to Gulf Resources, Inc.
On February 5, 2007, we acquired Shouguang Yuxin Chemical Industry Co., Limited ("SYCI"), a company incorporated in the People's Republic of China, in October 2000. Under the terms of the acquisition agreement, the stockholders of SYCI received a total of 8,094,059 (restated for the 2-for-1 stock split in 2007 and the 1-for-4 stock split in 2009) shares of common stock of Gulf Resources, Inc. in exchange for all outstanding shares of SYCI's common stock. Simultaneously with the completion of the acquisition, a dividend of $2,550,000 was paid to the former stockholders of SYCI. At the time of the acquisition, approximately 49.1% of the outstanding shares of SYCI were owned by Ms. Yu, Mr. Yang’s wife, and the remaining 50.9% of the outstanding shares of SYCI were owned by SCHC, all of whose outstanding shares were owned by Mr. Yang and his wife. Since the ownership of Gulf Resources, Inc. and SYCI are substantially the same, the acquisition was accounted for as a transaction between entities under common control, whereby Gulf Resources, Inc. recognized the assets and liabilities of SYCI at their carrying amounts. Share and per share amounts have been retroactively adjusted to reflect the acquisition.
To satisfy certain ministerial requirements necessary to confirm certain government approvals required in connection with the acquisition of SCHC by Upper Class Group Limited, all of the equity interest of SCHC were transferred to a newly formed Hong Kong corporation named Hong Kong Jiaxing Industrial Limited (“Hong Kong Jiaxing”) all of the outstanding shares of which are owned by Upper Class Group Limited. The transfer of all of the equity interest of SCHC to Hong Kong Jiaxing received approval from the local State Administration of Industry and Commerce on December 10, 2007.
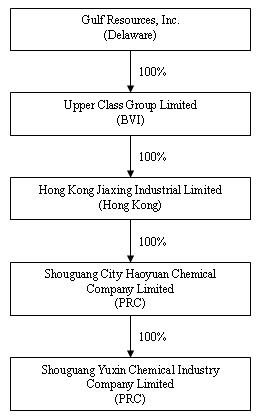
As a result of the transactions described above, our corporate structure is linear. That is Gulf Resources owns 100% of the outstanding shares of Upper Class Group Limited, which owns 100% of the outstanding shares of Hong Kong Jiaxing, which owns 100% of the outstanding shares of SCHC, which owns 100% of the outstanding shares of SYCI. Further, as a result of our acquisitions of SCHC and SYCI, our historical financial statements, as contained in our Condensed Consolidated Financial Statements and Management's Discussion and Analysis, appearing elsewhere in the report, reflect the accounts of SCHC and SYCI.
On October 12, 2009, we completed a 1-for-4 reverse stock split of our common stock, such that for each four shares outstanding prior to the stock split there was one share outstanding after the reverse stock split. All shares of common stock referenced in this report have been adjusted to reflect the stock split figures. On October 27, 2009, our shares began trading on the NASDAQ Global Select Market under the ticker symbol “GFRE” and on June 30, 2011 we changed our ticker symbol to “GURE” to better reflect our corporate name.
2
Our current corporate structure chart is set forth in the following diagram:
Our executive offices are located in China at Level 11,Vegetable Building, Industrial Park of the East in Shouguang City, Shandong Province, P.R.C. Our telephone number is +86 (536) 5670008. Our website address is www.gulfresourcesinc.com. The information contained on or accessed through our website is not intended to constitute and shall not be deemed to constitute part of this Form 10-K.
Business Acquisitions
On January 12, 2015, the Company’s wholly owned subsidiary, Shouguang City Haoyuan Chemical Company Limited (“SCHC”) signed an equity interest transfer agreement with the four individual shareholders of Shouguang City Rongyuan Chemical Co., Ltd. (“SCRC”). Consideration for this transaction consists of $66.2 million in cash and the issuance of shares of approximately 7.27 million shares of common stock at a price of $2.00 per share, which represents a 73% premium over the previous 10 day closing price, bringing the total consideration for the purchase of SCRC to $80.8 million. The shareholders of SCRC have guaranteed that SCRC’s audited 2014 net income will not be less than approximately $11.4 million, otherwise the purchase price shall be proportionally adjusted based on a percentage less than the $11.4 million threshold.
Leased Facility
On November 5, 2010, SCHC entered into a lease (the “Lease Contract”) with State-Operated Shouguang Qingshuibo Farm (the “Lessor”). Pursuant to the Lease Contract, SCHC shall lease certain property with an area of 3,192 square meters and buildings adjacent to the Company’s Factory No. 1. There are currently non-operating bromine production facilities on the property which have not been in production for more than 12 months. The annual lease payment for the property is RMB5 million, approximately US$755,000, per year and shall be paid by SCHC no later than June 30th of each year. The term of the Lease Contract is for twenty years commencing from January 1, 2011. The Lease Contract may be renewed by SCHC for an additional twenty-year period on the same terms. The Lessor has agreed to permit SCHC to reconstruct and renovate the existing bromine production facilities on the property.
Our Business Segments
Our business operations are conducted in three segments, bromine, crude salt, and chemical products. We manufacture and trade bromine and crude salt, and manufacture and sell chemical products used in oil and gas field exploration, oil and gas distribution, oil field drilling, wastewater processing, papermaking chemical agents and inorganic chemicals. We conduct all of our operations in China in close proximity to China’s petrochemical and oil refinery manufacturing base and its rapidly growing market.
3
Bromine and Crude Salt
We manufacture and distribute bromine through our wholly-owned subsidiary, Shouguang City Haoyuan Chemical Company Limited, or SCHC. Bromine (Br2) is a halogen element and it is a red volatile liquid at standard room temperature which has reactivity between chlorine and iodine. Elemental bromine is used to manufacture a wide variety of bromine compounds used in industry and agriculture. Bromine is also used to form intermediates in organic synthesis, in which it is somewhat preferable over iodine due to its lower cost. Our bromine is commonly used in brominated flame retardants, fumigants, water purification compounds, dyes, medicines and disinfectants.
The extraction of bromine in the Shandong Province is limited by the Provincial Government to licensed operations. We hold one such license. As part of our business strategy, it is our plan to continue acquiring smaller scaled and unlicensed producers and to use our bromine to expand our downstream chemical operations.
Location of Production Sites
Our production sites are located in the Shandong Province in northeastern China. The productive formation (otherwise referred to as the “working region”), extends from latitude N 36°56’ to N 37°20’ and from longitude E 118°38’ to E 119°14’, in the north region of Shouguang city, from the Xiaoqing River of Shouguang city to the west of the Dan River, bordering on Hanting District in the east, from the main channel of “Leading the Yellow River to Supply Qingdao City Project” in the south to the coastline in the north. The territory is classified as coastal alluvial – marine plain with an average height two to seven meters above the sea level. The terrain is relatively flat.
Geological background of this region
The Shandong Province working region is located to the east of Lubei Plain and on the south bank of Bohai Laizhou Bay. The geotectonic location bestrides on the North China Platte (I) and north three-level structure units, from west to east including individually the North China Depression, Luxi Plate, and Jiaobei Plate. Meanwhile, 4 V-level structure units including the Dongying Sag of Dongying Depression (IV) of North China Depression, the Buried Lifting Area of Guangrao, Niutou sag and Buried Lifting Area of Shuanghe and are all on two V-level structure units including Xiaying Buried Lifting Area of Weifang Depression (IV) of Luxi Plate and Chuangyi Sag, as well as on a V-level structure units of Jiaobei Buried Lifting Area of Jiaobei Plate.
Processing of Bromine
Natural brine is a complicated salt-water system, containing many ionic compositions in which different ions have close interdependent relationships and which can be reunited to form many dissolved soluble salts such as sodium chloride, potassium chloride, calcium sulfate, potassium sulfate and other similar soluble salts. The goal of natural brine processing is to separate and precipitate the soluble salts or ions away from the water. Due to the differences in the physical and chemical characteristics of brine samples, the processing methods are varied, and can result in inconsistency of processing and varied technical performance for the different useful components from the natural brine.
Bromine is the first component extracted during the processing of natural brine. In natural brine, the bromine exists in the form of bromine sodium and bromine magnesium and other soluble salts.
The bromine production process is as follows:
|
1.
|
natural brine is pumped from underground through extraction wells by subaqueous pumps;
|
|
2.
|
the natural brine then passes through transmission pipelines to storage reservoirs;
|
|
3.
|
the natural brine is sent to the bromine refining plant where bromine is extracted from the natural brine. In neutral or acidic water, the bromine ion is easily oxidized by adding the oxidative of chlorine, which generates the single bromine away from the brine. Thereafter the extracted single bromine is blown out by forced air, then absorbed by sulfur dioxide or soda by adding acid, chlorine and sulfur. Extracted bromine is stored in containers of different sizes; and
|
|
4.
|
the wastewater from this refining process is then transported by pipeline to brine pans.
|
Our production feeds include (i) natural brine; (ii) vitriol; (iii) chlorine; (iv) sulfur; and (v) coal.
4
Crude Salt
We also produce crude salt, which is produced from the evaporation of the wastewater after our bromine production process. Once the brine is returned to the surface and the bromine is removed, the remaining brine is pumped to on-site containing pools and then exposed to natural sunshine. This causes the water to evaporate from the brine, resulting in salt being left over afterwards. Crude salt is the principal material in alkali production as well as chlorine alkali production and is widely used in the chemical, food and beverage, and other industries.
Chemical Products
We produce chemical products through our wholly-owned subsidiary, Shouguang Yuxin Chemical Industry Company Limited, or SYCI. The products we produce and the markets in which they are sold include, among others:
|
Product name
|
Application sector
|
|
Hydroxyl guar gum
|
Oil Exploration & Production
|
|
Demulsified agent
|
Oil Exploration & Production
|
|
Corrosion inhibitor for acidizing
|
Oil Exploration & Production
|
|
Bactericide
|
Oil Exploration / Agricultural
|
|
Chelant
|
Paper Making
|
|
Iron ion stabilizer
|
Oil Exploration & Production
|
|
Clay stabilizing agent
|
Oil Exploration & Production
|
|
Flocculants agent
|
Paper Making
|
|
Remaining agent
|
Paper Making
|
|
Expanding agent with enhanced gentleness
|
Paper Making
|
|
Bromopropane
|
Agricultural
|
|
Environmental friendly additive products
|
Oil Exploration & Production
|
|
Solid lubricant
|
Oil Exploration & Production
|
|
Polyether lubricant
|
Oil Exploration & Production
|
|
Benzaldehyde dibromide
|
Agricultural
|
|
Chlorantraniliprole
|
Agricultural
|
SYCI concentrates its efforts on the production and sale of chemical products that are used in oil and gas field explorations, oil and gas distribution, oil field drilling, wastewater processing, papermaking chemical agents, and inorganic chemicals. SYCI also engages in research and development of commonly used chemical products as well as medicine intermediates. Currently, SYCI's annual production of oil and gas field exploration products and related chemicals is over 26,000 tons, and its production of papermaking-related chemical products is over 5,000 tons. These products are mainly distributed to large domestic papermaking manufacturers and major oilfields such as Shengli Oilfield and Talimu Oilfields.
SYCI’s factories are located in Shouguang City at 2nd Living District, Qinghe Oil Factory, Shouguang City, Shandong Province, China. The company has been certified as ISO9001-2000 compliant and received the Quality Products and Services Guarantee Certificate from China Association for Quality. SYCI has been accredited by Shandong as a Provincial Credit Enterprises and is a Class One supplier for both China Petroleum & Chemical Corporation (“SINOPEC”) and Petro China Company Limited.
Segment disclosure
We have three reportable segments: bromine, crude salt and chemical products.
5
The amounts set forth below are based upon on an average RMB to USD exchange rates of $0.16142 and $0.16281 during fiscal years 2013 and 2014, respectively.
|
Net Revenue by Segment
|
||||||||||||||||
|
Year Ended December 31, 2014
|
Year Ended December 31, 2013
|
|||||||||||||||
|
Segment:
|
% of total
|
% of total
|
||||||||||||||
|
Bromine
|
$ | 57,949,824 | 51 | % | $ | 60,488,886 | 51 | % | ||||||||
|
Crude Salt
|
$ | 10,752,226 | 9 | % | $ | 13,790,128 | 12 | % | ||||||||
|
Chemical Products
|
$ | 44,958,281 | 40 | % | $ | 44,112,769 | 37 | % | ||||||||
|
Total sales
|
$ | 113,660,331 | 100 | % | $ | 118,391,783 | 100 | % | ||||||||
|
Segment:
|
Percentage Increase/Decrease in Net Revenue
from fiscal year 2013 to 2014
|
|||
|
Bromine
|
(4 | %) | ||
|
Crude Salt
|
(22 | %) | ||
|
Chemical Products
|
2 | % | ||
|
SCHC’s products sold in metric tons
|
Year ended
December 31, 2014
|
Year ended
December 31, 2013
|
Percentage Change
|
|||||||||
|
Bromine
|
20,077 | 20,149 | (0.4 | %) | ||||||||
|
Crude Salt
|
342,127 | 340,943 | 0.3 | % | ||||||||
|
SYCI’s products sold in metric tons
|
Year ended
December 31, 2014
|
Year ended
December 31, 2013
|
Percentage Change
|
|||||||||
|
Oil and gas exploration additives
|
13,685 | 13,074 | 4.7 | % | ||||||||
|
Paper manufacturing additives
|
3,936 | 4,159 | (5.4 | %) | ||||||||
|
Pesticides manufacturing additives
|
3,110 | 3,122 | (0.4 | %) | ||||||||
| 20,731 | 20,355 | 1.8 | % | |||||||||
|
Income from Operations by Segment
|
||||||||||||||||
|
Year ended December 31, 2014
|
Year ended December 31, 2013
|
|||||||||||||||
|
Segment:
|
% of total
|
% of total
|
||||||||||||||
|
Bromine
|
$
|
9,500,428
|
38
|
%
|
$
|
13,152,092
|
45
|
%
|
||||||||
|
Crude Salt
|
$
|
719,226
|
3
|
%
|
3,831,272
|
13
|
%
|
|||||||||
|
Chemical Products
|
$
|
14,432,851
|
59
|
%
|
$
|
13,371,119
|
42
|
%
|
||||||||
|
Income from operations before corporate costs
|
$
|
24,652,505
|
100
|
%
|
$
|
30,354,483
|
100
|
%
|
||||||||
|
Corporate costs
|
$
|
(834,284
|
)
|
$
|
(1,910,990
|
)
|
||||||||||
|
Income from operations
|
$
|
23,818,221
|
$
|
28,443,493
|
||||||||||||
|
Year Ended
December 31, 2014
|
Bromine *
|
Crude
Salt *
|
Chemical
Products
|
Segment
Total
|
Corporate
|
Total
|
||||||||||||||||||
|
Net revenue
(external customers)
|
$
|
57,949,824
|
$
|
10,752,226
|
$
|
44,958,281
|
$
|
113,660,331
|
$
|
-
|
$
|
113,660,331
|
||||||||||||
|
Net revenue (intersegment)
|
3,013,295
|
-
|
-
|
3,013,295
|
-
|
3,013,295
|
||||||||||||||||||
|
Income (loss) from operations before taxes
|
9,500,428
|
719,226
|
14,432,851
|
24,652,505
|
(834,284
|
)
|
23,818,221
|
|||||||||||||||||
|
Income taxes
|
2,214,988
|
370,974
|
3,640,053
|
6,226,015
|
-
|
6,226,015
|
||||||||||||||||||
|
Income (loss) from operations after taxes
|
7,285,440
|
348,252
|
10,792,798
|
18,426,490
|
(834,284
|
)
|
17,592,206
|
|||||||||||||||||
|
Total assets
|
195,539,637
|
51,632,485
|
75,748,241
|
322,920,363
|
61,789
|
322,982,152
|
||||||||||||||||||
|
Depreciation and amortization
|
18,011,790
|
6,076,042
|
3,554,390
|
27,642,222
|
-
|
27,642,222
|
||||||||||||||||||
|
Capital expenditures
|
5,414,738
|
1,123,873
|
-
|
6,538,611
|
-
|
6,538,611
|
||||||||||||||||||
6
|
Year Ended
December 31, 2013
|
Bromine *
|
Crude
Salt *
|
Chemical
Products
|
Segment
Total
|
Corporate
|
Total
|
||||||||||||||||||
|
Net revenue
(external customers)
|
$
|
60,488,886
|
$
|
13,790,128
|
$
|
44,112,769
|
$
|
118,391,783
|
$
|
-
|
$
|
118,391,783
|
||||||||||||
|
Net revenue (intersegment)
|
2,947,350
|
-
|
-
|
2,947,350
|
-
|
2,947,350
|
||||||||||||||||||
|
Income (loss) from operations before taxes
|
13,152,092
|
3,831,272
|
13,371,119
|
30,354,483
|
(1,910,990
|
)
|
28,443,493
|
|||||||||||||||||
|
Income taxes
|
3,459,256
|
785,879
|
3,362,548
|
7,607,683
|
-
|
7,607,683
|
||||||||||||||||||
|
Income (loss) from operations after taxes
|
9,692,836
|
3,045,393
|
10,008,571
|
22,746,800
|
(1,910,990
|
)
|
20,835,810
|
|||||||||||||||||
|
Total assets
|
181,490,011
|
61,138,301
|
66,479,395
|
309,107,707
|
137,098
|
309,244,805
|
||||||||||||||||||
|
Depreciation and amortization
|
17,384,351
|
6,547,844
|
3,528,498
|
27,460,693
|
-
|
27,460,693
|
||||||||||||||||||
|
Capital expenditures
|
2,780,023
|
406,586
|
6,072
|
3,192,681
|
-
|
3,192,681
|
||||||||||||||||||
Sales and Marketing
We have an in-house sales staff of 8 persons. Our customers send their orders to us first. Our in-house sales staff then attempts to satisfy these orders based on our actual production schedules and inventories on hand. Many of our customers have a long term relationship with us.We expect this to continue due to continuing high demand for mineral products, however, these relationship can not be guaranteed in the future.
Principal Customers
We sell a substantial portion of our products to a limited number of PRC customers. Our principal customers during 2014 were Shandong Morui Chemical Company Limited, Shandong Brother Technology Limited, Kuerle Xingdong Trading Limited, Shouguang Shen Runfa Ocean Chemical Company Limited, Shouguang Weidong Chemical Company Limited, Shouguang City Rongyuan Chemical Company Limited. We have ongoing policies in place to ensure that sales are made to customers who are credit-worthy. We are not aware of any allowances for doubtful debts required for each of the years ended December 31, 2014 and 2013.
During each of the years ended December 31, 2014 and 2013, sales to our three largest bromine customers, based on net revenue from such customers, aggregated $19,919,942 and $17,629,437, respectively, or approximately 34.4% and 29.1% of total net revenue from sale of bromine; and sales to our largest customer represented approximately 14.7% and 11.5%, respectively, of total net revenue from the sale of bromine.
During each of the years ended December 31, 2014 and 2013, sales to our three largest crude salt customers, based on net revenue from such customers, aggregated $9,171,621 and $11,243,907, respectively, or approximately 85.3% and 81.6% of total net revenue from sale of crude salt; and sales to our largest customer represented approximately 37.8% and 37.5%, respectively, of total net revenue from the sale of crude salt.
During each of the years ended December 31, 2014 and 2013, sales to our three largest chemical products customers, based on net revenue from such customers, aggregated $20,649,995 and $18,848,545, respectively, or approximately 45.9% and 42.7% of total net revenue from sale of chemical products; and sales to our largest customer represented approximately 20.7% and 21.5%, respectively, of total net revenue from the sale of chemical products.
This concentration of customers for all three segments makes us vulnerable to an adverse near-term impact, should one or more of these relationships be terminated.
Principal Suppliers
Our principal external suppliers are Shandong Xinlong Biological Technology Company limited, Shouguang City Rongguang Trading Company Limited and Shandong Xinlong Group Company limited, Shandong Haihua Chlorine & Alkali Colophony Chemicals Company Limited, Shouguang Hongye Trading Company Limited.
During each of the years ended December 31, 2014 and 2013, we purchased 62.1% and 59.2%, respectively, of raw materials for our bromine production from three suppliers.
During each of the years ended December 31, 2014 and 2013, we purchased 92% and 91.6%, respectively, of raw materials for our chemical products production from three suppliers. We purchased a portion of the bromine produced by the Company internally as well, at cost totaling $3,013,294 and $2,947,350, for the years ended December 31, 2014 and 2013 respectively, for the production of chemical products.
This supplier concentration makes us vulnerable to a near-term adverse impact, should the relationships be terminated.
7
Business Strategy
Expansion of Production Capacity to Meet Demand
▼ Bromine and Crude Salt
|
In view of keen competition and the trend of less bromine contraction of brine water being extracted in Shouguang City, Shandong Province, in recent years, the Company had announced its intent to access more bromine and crude salt resources by finding new underground brine water resources in the Sichuan Province. The Company completed the drilling of its first exploratory well in December 2011 and announced in mid-January 2012 that the Company discovered underground brine water resources in Daying County. It has provided preliminary concentration results after testing by a third-party independent expert. According to the third-party independent report, the bromine concentration in the underground brine water resources is 1.53 grams per liter, which is approximately six to seven times higher than the average bromine concentration from its brine water resources at our bromine factories in Shouguang City. In September 2014, the Company started deeper drilling exploration under its existing well and did an exploration analysis on the resources from different levels. We incurred a total of $488,880 in exploration costs during 2014. On January 30, 2015 we announced that we had found natural gas resources under our bromine well in the Sichuan area. The company will hire a third party to conduct a survey of the geological structure and complexity analysis and the economics of the natural gas under this well. The Company is in the final stage of discussion with the expert company to finalize the service agreement. The company intends to invest approximately $10 million for further development in 2015, if the project is commercially viable.
In order to improve the bromine and crude salt production capacity, the Company will continue to enhance its existing bromine and crude salt production facilities. From August through September 2014, the Company carried out third phase enhancement projects at a cost of approximately $6.4 million for parts of its transmission channels and ducts in Factories No. 10 and No. 11. The Company expects to carry out enhancement projects for the rest of its transmission channels and ducts in Factories No. 10 to No. 11 in 2015, which will cost approximately $10 million. The Company expects such enhancement expenditures will be funded by the Company’s cash on hand. The Company also estimated that the amount of ordinary repair and maintenance expense will be approximately $1.0 million in 2015.
|
8
▼ Chemical Products
|
To expand its chemical production capacity, on January 12, 2015, the Company entered into an Equity Interest Transfer Agreement (the “Agreement”) with SCRC and its shareholders with total consideration of approximately $80.8 million. On February 4, 2015, the transactions contemplated by the Acquisition Agreement (the "Agreement") dated January 12, 2015 closed. Pursuant to the Agreement, SCHC acquired all rights, title and interest in and to all assets owned by SCRC, a leading manufacturer of materials for human and animal antibiotics in China and other parts of Asia.
|
Competition
The markets for our products have been experiencing increased levels of demand as China continues its recent pace of accelerated growth. Nevertheless, the markets for our products are highly competitive. To date, our sales have been limited to customers within the PRC and we expect that our sales will remain primarily domestic for the immediate future. Our marketing strategy involves developing long term ongoing working relationships with customers based on large multi-year agreements which foster mutually advantageous relationships.
We compete with PRC domestic private companies and state-owned companies. Certain state-owned and state backed competitors are more established and have more control of certain resources in terms of pricing than we do. We compete in our business based on price, our reputation for quality and on-time delivery, our relationship with suppliers and our geographical proximity to natural brine deposits in the PRC for bromine, crude salt and chemical productions. Management believes that our stable quality, manufacturing processes and plant capacity for the production of bromine, crude salt and chemical products are key considerations in awarding contracts in the PRC.
Our principal competitors in the bromine business are Shandong Yuyuan Group Company Limited, Shandong Haihua Group Company Limited, Shandong Dadi Salt Chemical Group Company Limited and Shandong Haiwang Chemical Company Limited, all of which produce bromine principally for use in their chemicals businesses and sell part of the bromine produced to customers. These companies may switch to selling bromine to the market if they no longer use bromine in their chemical businesses.
Our principal competitors in the crude salt business are Shandong Haiwang Chemical Company Limited, Shandong Haihua Group Company Limited, Shandong Weifang Longwei Industrial Company Limited, Shandong Yuyuan Group Company Limited and Shandong Caiyangzi Saltworks.
Our principal competitors in the chemical business are Beijing Tianqing Chemical Company Limited, Shandong Weifang Shuangxing Pesticides Company Limited, Zibo Dacheng Pesticides Company Limited, Befar Group Company Limited, China Eastar (Group) Chemical Industry Company Limited and Pecome Technologies Limited.
Government Regulation
The following is a summary of the principal governmental laws and regulations that are or may be applicable to our operations in the PRC. The scope and enforcement of many of the laws and regulations described below are uncertain. We cannot predict the effect of further developments in the Chinese legal system, including the promulgation of new laws, changes to existing laws or the interpretation or enforcement of laws.
In the natural resources sector, the PRC and the various provinces have enacted a series of laws and regulations over the past 20 years, including laws and regulations designed to improve safety and decrease environmental degradation. The "China Mineral Resources Law" declares state ownership of all mineral resources in the PRC. However, mineral exploration rights can be purchased, sold and transferred to foreign owned companies. Mineral resource rights are granted by the Central Government permitting recipients to conduct mineral resource activities in a specific area during the license period. These rights entitle the licensee to undertake mineral resource activities and infrastructure and ancillary work, in compliance with applicable laws and regulations, within the specific area covered by the license during the license period. The licensee is required to submit a proposal and feasibility studies to the relevant authority and to pay the Central Government a natural resources fee in an amount equal to a percent of annual sales. Shandong Province has determined that bromine is to be extracted only by licensed entities and we hold one of such licenses. Despite the province desire to limit extraction to licensed entities hundreds of smaller operations continue to extract bromine without licenses.
The Ministry of Land and Resources (“MLR”) is the principal regulator of mineral rights in China. The Ministry has authority to grant licenses for land-use and exploration rights, issue permits for mineral rights and leases, oversee the fees charged for them and their transfer, and review reserve evaluations.
9
All of our operating activities in China have been authorized by or obtained written consent from land and resources departments of local governments. In addition, all of our operations are subject to and have passed government safety inspections. We also have been granted environmental certification from the PRC Bureau of Environmental Protection.
Employees
As of December 31, 2014, we employed approximately 595 full-time employees, of whom approximately 78% are with SCHC and 21% are with SYCI. Approximately 6% of our employees are management personnel and 3% are sales and procurement staff. None of our employees are represented by a union.
Our employees in China participate in a state pension arrangement organized by Chinese municipal and provincial governments. We are required to contribute to the arrangement at the rate of 15% of the average monthly salary. In addition, we are required by Chinese law to cover employees in China with other types of social insurance. Our total contribution amounts to 24% of the average monthly salary. We have purchased social insurance for almost all of our employees. Expense related to social insurance was approximately $707,086 for fiscal year 2014.
Available Information
We make available free of charge on or through our internet website, www.gulfresourcesinc.com, our Annual Reports on Form 10-K, Quarterly Reports on Form 10-Q, Current Reports on Form 8-K, and all amendments to those reports, if any, filed or furnished pursuant to Section 13(a) or 15(d) of the Securities Exchange Act of 1934 as soon as reasonably practicable after they are electronically filed with, or furnished to, the Securities and Exchange Commission. The information contained on our website is not intended to be incorporated into this Annual Report on Form 10-K.
Item 1A. Risk Factors.
You should consider carefully each of the following business and investment risk factors and all of the other information in this report. If any of the following risks and uncertainties develops into actual events, the business, financial condition or results of our operations could be materially adversely affected. If that happens, the trading price of our shares of common stock could decline significantly. The risk factors below contain forward-looking statements regarding our business. Actual results could differ materially from those set forth in the forward-looking statements. See "Special Note Regarding Forward-Looking Information".
Risks Relating to Our Business
The unsuccessful integration of a business or business segment we acquire could have a material adverse effect on our results.
As part of our business strategy, we expect to acquire assets and businesses relating to or complementary to our operations. These acquisitions will involve risks commonly encountered in acquisitions. These risks include exposure to unknown liabilities of the acquired assets, right, additional acquisition costs and unanticipated expenses. Our quarterly and annual operating results could fluctuate due to the costs and expenses of acquiring and integrating new assets and businesses. We may also experience difficulties in assimilating the operations of acquired businesses. Our ongoing business may be disrupted and our management's time and attention diverted from existing operations. Our acquisition strategy will likely require additional equity or debt financing, resulting in additional leverage or dilution of ownership. We cannot assure you that any future acquisition will be consummated, or that if consummated, that we will be able to integrate such acquisition successfully.
10
We depend on revenues from a few significant relationships, and any loss, cancellation, reduction, or interruption in these relationships could harm our business.
In general, we have derived a material portion of our revenue from a limited number of customers. If sales to such customers were terminated or significantly reduced, our revenues and net income could significantly decline. Our success will depend on our continued ability to develop and manage relationships with significant customers and suppliers. Any adverse change in our relationship with our customers and suppliers may have a material adverse effect on our business. Although we are attempting to expand our customer base, we expect that our customer concentration will not change significantly in the near future. We cannot be sure that we will be able to retain our largest customers and suppliers or that we will be able to attract additional customers and suppliers, or that our customers and suppliers will continue to buy our products in the same amounts as in prior years. The loss of one or more of our largest customers or suppliers, any reduction or interruption in sales to these customers or suppliers, our inability to successfully develop relationships with additional customers or suppliers or future price concessions that we may have to make could significantly harm our business.
Attracting and retaining key personnel is an essential element of our future success.
Our future success depends to a significant extent upon the continued service of our executive officers and other key management and technical personnel and on our ability to continue to attract, retain and motivate executive and other key employees, including those in managerial, technical, marketing and information technology support positions. Experienced management and technical, marketing and support personnel are in demand and competition for their talents is intense. The loss of the services of one or more of our key employees or our failure to attract, retain and motivate qualified personnel could have a material adverse effect on our business, financial condition and results of operations.
If we lose the services of our chairman and chief executive officer, our business may suffer.
We are dependent on Mr. Ming Yang, our chairman and Mr. Liu Xiaobin, our chief executive officer. The loss of their services could materially harm our business because of the cost and time necessary to retain and train a replacement. Such a loss would also divert management attention away from operational issues.
If we do not pass the review and approval for renewing our bromine and salt production license, our bromine business may suffer.
We are required to hold a bromine and salt production license in order to operate our bromine and salt production business in the PRC. Our bromine and salt production license is subject to a yearly audit. If we do not successfully pass the yearly approval by relevant government authorities, our bromine and salt production operations may be suspended until we are able to comply with the license requirements which could have a material adverse effect on our business, financial condition and results of operations.
Because we do not have any proven or probable reserves of brine water, we may not be able to continue to produce bromine and crude salt at existing levels in the future which could harm our business, results or operations and financial condition
The SEC’s Industry Guide 7, which relates to businesses with mining operations such as ours defines “reserves” as: “that part of a mineral deposit which could be economically and legally extracted or produced at the time of the reserve determination.” In addition, Industry Guide 7 provides the following definitions with respect to the classification of reserves for mining companies:
|
l
|
“Proven (Measured) Reserves” - Reserves for which (a) quantity is computed from dimensions revealed in outcrops, trenches, workings or drill holes; grade and/or quality are computed from the results of detailed sampling and (b) the sites for inspection, sampling and measurement are spaced so closely and the geologic character is so well defined that size, shape, depth and mineral content of reserves are well-established.
|
|
|
l
|
“Probable (Indicated) Reserves” - Reserves for which quantity and grade and/or quality are computed form information similar to that used for proven (measure) reserves, but the sites for inspection, sampling, and measurement are farther apart or are otherwise less adequately spaced. The degree of assurance, although lower than that for proven (measured) reserves, is high enough to assume continuity between points of observation.
|
We do not have any proven or probable reserves of brine water on our mining properties. Therefore, we cannot provide investors with any assurance that there will be adequate volume or concentration of brine water on our mining properties to continue our bromine and crude salt operations at existing levels or to expand our production capacity of bromine and crude salt. If we experience decreases in the volume and/or concentration of brine water we are able to extract from our mining properties, our business, results of operations and financial condition may be adversely affected.
11
We do not have mining permits for some of our bromine factories which we have acquired. Our operations depend on our existing permits and approvals already obtained from government authorities.
We hold government permits or operations permits and for each of our bromine factories. However, we do not currently hold valid mining permits issued by the State Land and Resources Bureau for our Factories No. 5, 6, 7, 8, 9, 10 and 11. We have already filed applications for these mining permits, however we are not able to confirm when such mining permits will be issued, if at all.
We received a letter from the Shouguang Municipal State Land and Resources Bureau on March 10, 2011, stating that our Factories No. 5, 6, 7, 8, and 9 “are permitted to continue mining and can operate in a standard manner and carry out mining activities in a reasonable way pursuant to the requirements of the relevant mineral resources authorities, and are free of any illegal acts of exceeding layer or boundary limits and any violations of relevant laws and regulations of the State.”
A decision made by relevant government agency(ies) to reject or delay the issuance of a new permit or to repeal or modify an existing permits or approval could prevent or limit our ability to continue operations at the affected facilities and harm our business, financial condition and operating results. Expansion of our existing operations would also require securing the necessary permits and approvals which we may not be able to obtain in a timely manner, if at all.
We do not have a certificate of land use rights for the land relating to certain bromine assets and crude salt production. We will not be able to obtain the property certificates for the relevant buildings attached to the land.
We do not have certificates of land use rights for land leased by SCHC. As a result, we have not been able to obtain the relevant property certificates for buildings on such leased land which are normally required as security in obtaining financing from financial institutions. Although we believe that this is a common occurrence with respect to property leases in the PRC, the property certificates confirm legal ownership of the buildings. Because we do not have certificate of land use rights for the leased land, we might be required by the government to demolish our buildings and/or restore the land back to its original state. If such event occurs, it will have major impact on our operations, financial status and performance results.
Because we have not been able to obtain property certificates to certain of our properties we may not be able to borrow money from banks in the PRC and as a result, could face liquidity problems.
As discussed above, we have not been able to obtain property certificates for certain of our properties. In the PRC banks normally require a company’s property certificates to be pledged as security before they will provide a loan to a company. In the past several years we have financed our operations with loans from third-party companies, cash from operations and equity financing. However, if these sources of funds are not available in the future and we need to find an alternate source of financing to maintain our operations, we may not be able to borrow money from a bank to meet our cash needs. This could materially harm our business and have a major impact on our operations, financial status and performance results.
Our inability to successfully manage the growth of our business may have a material adverse effect on our business, results or operations and financial condition.
We expect to experience growth in the number of employees and the scope of our operations as a result of internal growth and acquisitions. Such activities could result in increased responsibilities for management. Our future success will be highly dependent upon our ability to manage successfully the expansion of operations. Our ability to manage and support our growth effectively will be substantially dependent on our ability to implement adequate improvements to financial, inventory, management controls, reporting, order entry systems and other procedures, and hire sufficient numbers of financial, accounting, administrative, and management personnel.
Our future success depends on our ability to address potential market opportunities and to manage expenses to match our ability to finance operations. The need to control our expenses will place a significant strain on our management and operational resources. If we are unable to control our expenses effectively, our business, results of operations and financial condition may be adversely affected.
12
Our management is comprised almost entirely of individuals residing in the PRC with very limited English skills.
Our management is comprised almost entirely of individuals born and raised in the PRC. As a result of differences in culture, educational background and business experiences, our management may analyze, evaluate and present business opportunities and results of operations differently from the way they are analyzed, evaluated and presented by management teams of public companies in Europe and the United States. In addition, our management has very limited skills in English. Consequently, it is possible that our management team will emphasize or fail to emphasize aspects of our business that might customarily be emphasized in a different manner by comparable public companies from different geographical and political areas.
We will face many of the difficulties that companies in the early stage may face.
We have a limited operating history as a bromine produce and chemical processing company, which may make it difficult for you to assess our ability to identify merger or acquisition candidates and our growth and earnings potential. Therefore, we may face many of the difficulties that companies in the early stages of their development in new and evolving markets often face. We may continue to face these difficulties in the future, some of which may be beyond our control. If we are unable to successfully address these problems, our future growth and earnings will be negatively affected.
We cannot accurately forecast our future revenues and operating results, which may fluctuate.
Our short operating history and the rapidly changing nature of the markets in which we compete make it difficult to accurately forecast our revenues and operating results. Furthermore, our revenues and operating results may fluctuate in the future due to a number of factors, including the following:
|
l
|
the success of identifying and completing mergers and acquisitions;
|
|
|
l
|
the introduction of competitive products by different or new competitors;
|
|
|
l
|
reduced demand for any given product;
|
|
|
l
|
difficulty in keeping current with changing technologies;
|
|
|
l
|
increased or uneven expenses, whether related to sales and marketing, product development or administration;
|
|
|
l
|
deferral of recognition of our revenue in accordance with applicable accounting principles due to the time required to complete projects; and
|
|
|
l
|
costs related to possible acquisitions of technology or businesses.
|
Due to these factors, forecasts may not be achieved, either because expected revenues do not occur or because they occur at lower prices or on terms that are less favorable to us. In addition, these factors increase the chances that our results could be lower than the expectations of investors and analysts. If so, the market price of our stock would likely decline.
Mr. Ming Yang, our Chairman and a substantial shareholder, has potential conflicts of interest with us, which may adversely affect our business.
Mr. Ming Yang, our chairman, was a substantial owner of SCHC and SCYI before their acquisition by us, and remains, with the shares held by him, both individually and through Shandong Haoyuan Industry Group Ltd., and by his wife and son, Wenxiang Yu and Zhi Yang, a substantial owner of our securities. There may have been conflicts of interest between Mr. Yang and our Company as a result of such ownership interests. The terms on which we acquired SCHC and SCYI may have been different from those that would have been obtained if SCHC and SCYI were owned by unrelated parties. In addition, conflicts of interest between Mr. Yang’s dual roles as our shareholder and our director may arise. We cannot assure you that, when conflicts of interest arise, Mr. Yang will act in the best interests of the Company or that conflicts of interest will be resolved in our favor.
Currently, we do not have existing arrangements to address potential conflicts of interest between Mr. Yang and us. We rely on that Mr. Yang to abide by the laws of the State of Delaware, which provide that directors owe a fiduciary duty to the Company, and which require them to act in good faith and in the best interests of the Company, and not use their positions for personal gain. If we cannot resolve any conflicts of interest or disputes between us and Mr. Yang, we would have to rely on legal proceedings, which could result in disruption of our business and substantial uncertainty as to the outcome of any such legal proceedings.
13
Because of the uncertainties regarding the feasibility of producing bromine from brine water resources in Sichuan province, there may not be a return on our investment in certain related exploration costs.
Although we announced that we have discovered underground brine water resources in Daying County with high concentration, to date there has be no bromine produced from the brine water resources in Sichuan province. We cannot be certain that that there will be sufficient brine water resources reserve and exploitable amount in the brine water in the area where we are drilling in Sichuan province to make the production of bromine there feasible. In addition, we cannot be certain that the local authorities in Sichuan province will issue a mining permit to us. As a result of these uncertainties, we cannot assure you that there will be a return on our investment in such exploration costs.
Risks Related to Doing Business in the People's Republic of China.
Our business operations take place primarily in the People's Republic of China. Because Chinese laws, regulations and policies are changing, our Chinese operations will face several risks summarized below.
|
-
|
Limitations on Chinese economic market reforms may discourage foreign investment in Chinese businesses.
|
The value of investments in Chinese businesses could be adversely affected by political, economic and social uncertainties in China. The economic reforms in China in recent years are regarded by China’s central government as a way to introduce economic market forces into China. Given the overriding desire of the central government leadership to maintain stability in China amid rapid social and economic changes in the country, the economic market reforms of recent years could be slowed, or even reversed.
Any change in policy by the Chinese government could adversely affect investments in Chinese businesses.
Changes in policy could result in imposition of restrictions on currency conversion, imports or the source of supplies, as well as new laws affecting joint ventures and foreign-owned enterprises doing business in China. Although China has been pursuing economic reforms, events such as a change in leadership or social disruptions that may occur upon the proposed privatization of certain state-owned industries, could significantly affect the government's ability to continue with its reform.
|
-
|
We face economic risks in doing business in China.
|
As a developing nation, China’s economy is more volatile than that of developed Western industrial economies. It differs significantly from that of the U.S. or a Western European country in such respects as structure, level of development, capital reinvestment, legal recourse, resource allocation and self-sufficiency. Only in recent years has the Chinese economy moved from what had been a command economy through the 1970s to one that during the 1990s encouraged substantial private economic activity. In 1993, the Constitution of China was amended to reinforce such economic reforms. The trends of the 1990s indicate that future policies of the Chinese government will emphasize greater utilization of market forces. For example, in 1999 the Government announced plans to amend the Chinese Constitution to recognize private property, although private business will officially remain subordinate to state-owned companies, which are the mainstay of the Chinese economy. However, we cannot assure you that, under some circumstances, the government's pursuit of economic reforms will not be restrained or curtailed. Actions by the central government of China could have a significant adverse effect on economic conditions in the country as a whole and on the economic prospects for our Chinese operations.
|
-
|
We are subject to comprehensive regulation by the PRC legal system, which is uncertain. As a result, it may limit the legal protections available to you and us and we may not now be, or remain in the future, in compliance with PRC laws and regulations.
|
SCHC and SYCI, our PRC operating companies, are incorporated under and are governed by the laws of the PRC; all of our operations are conducted in the PRC; and our suppliers and customers are all located in the PRC. The PRC government exercises substantial control over virtually every sector of the PRC economy, including the production, distribution and sale of bromine, brominated chemical products and crude salt. In particular, we are subject to regulation by local and national branches of the Ministry of Land and Resources, as well as the State Administration of Foreign Exchange, and other regulatory bodies. In order to operate under PRC law, we require valid licenses, certificates and permits, which must be renewed from time to time. If we were to fail to obtain the necessary renewals for any reason, including sudden or unexplained changes in local regulatory practice, we could be required to shut down all or part of our operations temporarily or permanently.
14
SCHC and SYCI are subject to PRC accounting laws, which require that an annual audit be performed in accordance with PRC accounting standards. The PRC foreign-invested enterprise laws require that our subsidiary, SCHC, submit periodic fiscal reports and statements to financial and tax authorities and maintain its books of account in accordance with Chinese accounting laws. If PRC authorities were to determine that we were in violation of these requirements, we could lose our business license and be unable to continue operations temporarily or permanently.
The legal and judicial systems in the PRC are still rudimentary. The laws governing our business operations are sometimes vague and uncertain and enforcement of existing laws is inconsistent. Thus, we can offer no assurance that we are, or will remain, in compliance with PRC laws and regulations.
|
-
|
The Chinese legal and judicial system may negatively impact foreign investors.
|
In 1982, the National People’s Congress amended the Constitution of China to authorize foreign investment and guarantee the "lawful rights and interests" of foreign investors in China. However, China's system of laws is not yet comprehensive. The legal and judicial systems in China are still under development, and enforcement of existing laws is inconsistent. Many judges in China lack the depth of legal training and experience that would be expected of a judge in a more developed country. Because the Chinese judiciary is relatively inexperienced in enforcing the laws that exist, anticipation of judicial decision-making is more uncertain than would be expected in a more developed country. It may be impossible to obtain swift and equitable enforcement of laws that do exist, or to obtain enforcement of the judgment of one court by a court of another jurisdiction. China's legal system is based on written statutes; a decision by one judge does not set a legal precedent that is required to be followed by judges in other cases. In addition, the interpretation of Chinese laws may shift to reflect domestic political changes.
The promulgation of new laws, changes to existing laws and the pre-emption of local regulations by national laws may adversely affect foreign investors. However, the trend of legislation over the last 20 years has significantly enhanced the protection of foreign investment and allowed for more control by foreign parties of their investments in Chinese enterprises. We cannot assure you that a change in leadership, social or political disruption, or unforeseen circumstances affecting China's political, economic or social life, will not affect the Chinese government's ability to continue to support and pursue these reforms. Such a shift could have a material adverse effect on our business and prospects.
The practical effect of the People’s Republic of China’s legal system on our business operations in China can be viewed from two separate but intertwined considerations. First, as a matter of substantive law, the Foreign Invested Enterprise laws provide significant protection from government interference. In addition, these laws guarantee the full enjoyment of the benefits of corporate articles and contracts to Foreign Invested Enterprise participants. These laws, however, do impose standards concerning corporate formation and governance, which are not qualitatively different from the general corporation laws of the several states. Similarly, the accounting laws and regulations of the People’s Republic of China mandate accounting practices which are not consistent with U.S. Generally Accepted Accounting Principles. China's accounting laws require that an annual "statutory audit" be performed in accordance with People’s Republic of China’s accounting standards and that the books of account of Foreign Invested Enterprises are maintained in accordance with Chinese accounting laws. Article 14 of the People’s Republic of China Wholly Foreign-Owned Enterprise Law requires a Wholly Foreign-Owned Enterprise to submit certain periodic fiscal reports and statements to designated financial and tax authorities, at the risk of business license revocation. Second, while the enforcement of substantive rights may appear less clear than United States procedures, Foreign Invested Enterprises and Wholly Foreign-Owned Enterprises are Chinese registered companies, which enjoy the same status as other Chinese registered companies in business-to-business dispute resolution. Generally, the Articles of Association provide that all business disputes pertaining to Foreign Invested Enterprises are to be resolved by the Arbitration Institute of the Stockholm Chamber of Commerce in Stockholm, Sweden, applying Chinese substantive law. Any award rendered by this arbitration tribunal is, by the express terms of the respective Articles of Association, enforceable in accordance with the "United Nations Convention on the Recognition and Enforcement of Foreign Arbitral Awards (1958)". Therefore, as a practical matter, although no assurances can be given, the Chinese legal infrastructure, while different in operation from its United States counterpart, should not present any significant impediment to the operation of Foreign Invested Enterprises.
Because our principal assets are located outside of the United States and some of our directors and all of our executive officers reside outside of the United States, it may be difficult for you to enforce your rights based on the United States Federal securities laws against us and our officers and directors in the United States or to enforce judgments of United States courts against us or them in the People's Republic of China.
15
In addition, our operating subsidiaries and substantially all of our assets are located outside of the United States. You will find it difficult to enforce your legal rights based on the civil liability provisions of the United States Federal securities laws against us in the courts of either the United States or the People's Republic of China and, even if civil judgments are obtained in courts of the United States, to enforce such judgments in the courts of the People's Republic of China. In addition, it is unclear if extradition treaties in effect between the United States and the People's Republic of China would permit effective enforcement against us or our officers and directors of criminal penalties, under the United States Federal securities laws or otherwise.
|
-
|
Issues associated with increased rate of inflation as a result of economic reform
|
Although the Chinese government owns the majority of productive assets in China, during the past several years the government has implemented economic reform measures that emphasize decentralization and encourage private economic activity. Because these economic reform measures may be inconsistent or ineffectual, we are unable to assure you that:
|
l
|
We will be able to capitalize on economic reforms;
|
|
|
l
|
The Chinese government will continue its pursuit of economic reform policies;
|
|
|
l
|
The economic policies, even if pursued, will be successful;
|
|
|
l
|
Economic policies will not be significantly altered from time to time; and
|
|
|
l
|
Business operations in China will not become subject to the risk of nationalization.
|
Since 1979, the Chinese government has reformed its economic systems. Because many reforms are unprecedented or experimental, they are expected to be refined and improved. Other political, economic and social factors, such as political changes, changes in the rates of economic growth, unemployment or inflation, or in the disparities in per capita wealth between regions within China, could lead to further readjustment of the reform measures. This refining and readjustment process may negatively affect our operations.
Over the last few years, China's economy has registered a high growth rate. Recently, there have been indications that rates of inflation have increased. In response, the Chinese government recently has taken measures to curb this excessively expansive economy. These measures have included revaluations of the Chinese currency, the RMB, restrictions on the availability of domestic credit, and limited re-centralization of the approval process for purchases of some foreign products. These austerity measures alone may not succeed in slowing down the economy's excessive expansion or control inflation, and may result in severe dislocations in the Chinese economy. The Chinese government may adopt additional measures to further combat inflation, including the establishment of freezes or restraints on certain projects or markets.
To date, reforms to China's economic system have not adversely impacted our operations and are not expected to adversely impact operations in the foreseeable future; however, there can be no assurance that the reforms to China's economic system will continue or that we will not be adversely affected by changes in China's political, economic, and social conditions and by changes in policies of the Chinese government, such as changes in laws and regulations, measures which may be introduced to control inflation, changes in the rate or method of taxation, imposition of additional restrictions on currency conversion and remittance abroad, and reduction in tariff protection and other import restrictions.
|
-
|
Fluctuations in the value of the RMB may reduce the value of your investment
|
The value of the RMB against the U.S. dollar and other currencies is affected by, among other things, changes in China's political and economic conditions and China's foreign exchange policies. The conversion of RMB into foreign currencies, including U.S. dollars, has been based on exchange rates set by the People's Bank of China. On July 21, 2005, the PRC government changed its decade-old policy of pegging the value of the RMB solely to the U.S. dollar. Under this revised policy, the RMB is permitted to fluctuate within a narrow and managed band against a basket of certain foreign currencies. Following the removal of the U.S. dollar peg, the RMB appreciated more than 20% against the U.S. dollar over the following three years. However, the People’s Bank of China regularly intervenes in the foreign exchange market to prevent significant short-term fluctuations in the exchange rate and achieve policy goals. For almost two years after July 2008, the RMB traded within a narrow range against the U.S. dollar. As a consequence, the RMB fluctuated significantly during that period against other freely traded currencies, in tandem with the U.S. dollar. In June 2010, the PRC government announced that it would increase RMB exchange rate flexibility. However, it remains unclear how this flexibility might be implemented. There remains significant international pressure on the PRC government to adopt a more flexible currency policy, which could result in a further and more significant appreciation of the RMB against the U.S. dollar.
16
Because substantially all of our revenues and expenditures are denominated in RMB and our cash is denominated in U.S. dollars, fluctuations in the exchange rate between the U.S. dollar and RMB will affect the relative purchasing power of such amounts and our balance sheet and earnings per share in U.S. dollars. In addition, we report financial results in U.S. dollars, and appreciation or depreciation in the value of the RMB relative to the U.S. dollar would affect our financial results reported in U.S. dollars terms without giving effect to any underlying change in our business or results of operations. Fluctuations in the exchange rate will also affect the relative value of earnings from and the value of any U.S. dollar-denominated investments we make in the future.
Very limited hedging transactions are available in China to reduce our exposure to exchange rate fluctuations. To date, we have not entered into any hedging transactions in an effort to reduce our exposure to foreign currency exchange risk. While we may decide to enter into hedging transactions in the future, the availability and effectiveness of these hedging transactions may be limited and we may not be able to successfully hedge our exposure at all. In addition, our currency exchange losses may be magnified by PRC exchange control regulations that restrict our ability to convert RMB into foreign currency.
|
-
|
Failure of our PRC resident shareholders to comply with regulations on foreign exchange registration of overseas investment by PRC residents could cause us to lose our ability to contribute capital to SCHC and remit profits out of the PRC as dividends
|
The SAFE has promulgated regulations, including the Notice on Relevant Issues Relating to Domestic Residents’ Investment and Financing and Round-Trip Investment through Special Purpose Vehicles, or SAFE Circular No. 37, effective on July 14, 2014, and its appendixes, that require PRC residents, including PRC institutions and individuals, to register with local branches of the SAFE in connection with their direct establishment or indirect control of an offshore entity, for the purpose of overseas investment and financing, with such PRC residents’ legally owned assets or equity interests in domestic enterprises or offshore assets or interests, referred to in SAFE Circular No. 37 as a “special purpose vehicle.” SAFE Circular No. 37 further requires amendment to the registration in the event of any significant changes with respect to the special purpose vehicle, such as increase or decrease of capital contributed by PRC individuals, share transfer or exchange, merger, division or other material event. In the event that a PRC shareholder holding interests in a special purpose vehicle fails to fulfill the required SAFE registration, the PRC subsidiaries of that special purpose vehicle may be prohibited from making profit distributions to the offshore parent and from carrying out subsequent cross-border foreign exchange activities, and the special purpose vehicle may be restricted in their ability to contribute additional capital into its PRC subsidiary. Further, failure to comply with the various SAFE registration requirements described above could result in liability under PRC law for foreign exchange evasion.
We have requested our current PRC resident shareholders and/or beneficial owners to disclose whether they or their shareholders or beneficial owners fall within the scope of the Circular 37 and urges PRC residents to register with the local SAFE branch as required under the Circular 37. Our affiliates subject to the SAFE registration requirements, including Mr. Ming Yang, our Chairman, Ms. Wenxiang Yu, the wife of Mr. Yang, and Mr. Zhi Yang, Mr. Yang’s son, have informed us that they have not made their initial registrations with SAFE. The failure of our PRC resident shareholders and/or beneficial owners to timely furnish or amend their SAFE registrations pursuant to the Circular 37 or the failure of our future shareholders and/or beneficial owners who are PRC residents to comply with the registration requirement set forth in the Circular 37 may subject such shareholders, beneficial owners and/or SCHC to fines and legal sanctions. Any such failure may also limit our ability to contribute additional capital into SCHC, limit SCHC’s ability to distribute dividends to us or otherwise adversely affect our business.
The PRC government could restrict access in the future to foreign currencies for current account transactions. If the foreign exchange control system prevents us from obtaining sufficient foreign currency to satisfy our currency demands, we may not be able to pay certain expenses as they come due or may restrict which limit the payment of dividends from the Company.
17
|
-
|
We may be treated as a resident enterprise for PRC tax purposes under the currently effective EIT Law, which may subject us to PRC income tax on our taxable global income
|
On March 16, 2007, the National People’s Congress approved and promulgated a new tax law, the PRC Enterprise Income Tax Law (“EIT Law”). On November 28, 2007, the PRC State Council passed the implementing rules of the EIT Law. Both the EIT Law and the implementing rules of the EIT Law took effect on January 1, 2008. Under the EIT Law, enterprises are classified as “resident enterprises” and “non-resident enterprises.” An enterprise established outside of China with “de facto management bodies” within China is considered a “resident enterprise,” meaning that it can be treated in a manner similar to a Chinese enterprise for enterprise income tax purposes. The implementing rules of the EIT Law define “de facto management bodies” as a managing body that in practice exercises “substantial and overall management and control over the production and operations, personnel, accounting, and properties” of the enterprise; however, it remains unclear whether the PRC tax authorities would deem our managing body as being located within China. Due to the short history of the EIT Law and lack of applicable legal precedents, the PRC tax authorities determine the PRC tax resident treatment of a foreign (non-PRC) company on a case-by-case basis.
If the PRC tax authorities determine that we are a “resident enterprise” for PRC enterprise income tax purposes, a number of PRC tax consequences could follow. First, we may be subject to the enterprise income tax at a rate of 25% on our global taxable income, as well as PRC enterprise income tax reporting obligations. Second, under the EIT Law and its implementing rules, dividends paid between “qualified resident enterprises” are exempt from enterprise income tax. It is unclear whether the dividends we receive will constitute dividends between “qualified resident enterprises” and would therefore qualify for tax exemption, because the definition of qualified resident enterprises is unclear and the relevant PRC governmental authorities have not yet issued guidance with respect to the processing of outbound remittances to entities that are treated as resident enterprises for PRC enterprise income tax purposes.
In addition to the uncertainty as to the application of the “resident enterprise” classification, there can be no assurance that the PRC governmental authorities will not amend or revise the taxation laws, rules and regulations to impose stricter tax requirements, higher tax rates or retroactively apply the EIT Law, or any subsequent changes in PRC tax laws, rules or regulations. If such changes occur and/or if such changes are applied retroactively, such changes could materially and adversely affect our results of operations and financial condition.
|
-
|
Restricted power supply could disrupt our production and have an adverse effect on our business, financial position and results of operations
|
All of our products are produced at our manufacturing facilities in Shouguang, Shandong province, China. A significant disruption at those facilities, such as electricity power control, even on a short-term basis, could impair our ability to timely produce and deliver products, which could have an adverse effect on our business, financial position and results of operations. We have encountered power shortages historically due to restrictions on the power supply provided to industrial users when the usage of electricity is high and the supply is limited or as a result of damage to the electricity supply network. Interruptions of electricity supply could result in lengthy production shutdowns, increased costs associated with restarting production and the loss of production in progress. Any major suspension or termination of electricity or other unexpected business interruptions could have an adverse impact on our business, financial condition and results of operations.
Risks Associated with Bromine Extraction
We are subject to risks associated with our operations which may affect our results.
The resource industry in the PRC has drawbacks that the resource industry does not have within the United States. For instance:
|
l
|
In China, insurance coverage is a relatively new concept compared to that of the United States and for certain aspects of a business operation, insurance coverage is restricted or expensive. Workers compensation for employees in the PRC may be unavailable or, if available, insufficient to adequately cover such employees.
|
|
l
|
The environmental laws and regulations in the PRC set various standards regulating certain aspects of health and environmental quality, including, in some cases, the obligation to rehabilitate current and former facilities and locations where operations are or were conducted. Violation of those standards could result in a temporary or permanent restriction by the PRC of our bromine operations.
|
We cannot assure you that we will be able to adequately address any of these or other limitations.
18
Our earnings and, therefore our profitability, may be affected by price volatility.
We anticipate that the majority of our future revenues will be derived from the sale of bromine and products derived from bromine and, as a result, our earnings are directly related to the prices of these products. There are many factors influencing the price of these products including expectations for inflation; global and regional demand and production; political and economic conditions; and production costs. These factors are beyond our control and are impossible for us to predict. As a result, price changes may adversely affect our operating results.
We may become subject to numerous risks and hazards associated with our chemical processing business.
Bromine is highly corrosive and must be handled carefully in order to avoid leakage and damage to containers, transportation equipment and other facilities. The risks associated with bromine include:
|
l
|
environmental hazards; and
|
|
|
l
|
Industrial accidents, including personal injury.
|
Such risks could result in:
|
l
|
damage to or destruction of properties or production facilities;
|
|
|
l
|
personal injury or death;
|
|
|
l
|
environmental damage;
|
|
|
l
|
monetary losses; and
|
|
|
l
|
Legal liability.
|
Our business operations and related activities may be subject to PRC government regulations concerning environmental protection.
We may have to make a significant financial commitment for the construction of environmental protection facilities and the establishment of a sound environmental protection management and monitoring system. Compliance with existing and future environmental protection regulations may increase our operating costs and may adversely affect our operating results.
Our operations and business activities may involve dangerous materials.
Although we may establish stringent rules relating to the storage, handling and use of dangerous materials, there is no assurance that accidents will not occur. Should we be held liable for any such accident, we may be subject to penalties and possible criminal proceedings may be brought against our employees.
We may have to reduce our bromine production volumes based on guidelines issued by the Shouguang Bromine Professional Association.
We are a member of the Shouguang Bromide Professional Association (the “Association”), whose members are bromine producers in the Shouguang region of Shandong province. Members of the Association are required to follow production guidelines recommended by the Association. If the Association asks its members to reduce production volumes in the future, we may be required to limit our bromine production volume which could adversely affect our business, financial condition and results of operations.
We may have to temporarily halt production at our facilities in order to prepare for environmental inspections made by the local government.
In the past two years we have experienced an increase in the number of environmental inspections of our factories made by the local government in order to renew our mining licenses, which we have successfully passed. As a result of these inspections, we may be required to temporarily halt production at our factories in order to prepare for and pass the inspections made by the local government. If we are required to close some or all of our factories in order to prepare for these inspections, our business, financial condition and results of operations could be adversely affected.
19
Decreases in the bromine yield from our brine water could have an adverse effect on our business, financial position and results of operations.
In recent years, we have been able to extract less bromine from brine water during the production process due to a decrease in the bromine concentration of brine water being extracted. In an effort to address this issue, we carried out enhancement projects to our extraction wells in May 2012 by increasing the depth of our brine water wells to extract brine water from a lower second layer which we believe will have a higher bromine concentration. However, we cannot be certain that this will improve the bromine yield from our production facilities in the long run. If we are not able to improve the bromine yield at our production facilities or if the bromine concentration in the brine water we extract continues to decline, our business, financial condition and results of operations could be adversely affected.
Taking of leased land by the Chinese government could disrupt our production facilities and capacity, and have a material adverse effect on our business, financial position and results of operations.
Most of our bromine and crude salt manufacturing facilities are located on land leased by SCHC. Any taking of leased land by the Chinese government could impair our carrying value of production facilities and our ability to timely produce and deliver products, which could have an adverse effect on our business, financial position and results of operations. In mid-May 2011, one of our leased parcels of land was taken by the Chinese government for civil redevelopment, which caused suspension of the operations of Factory No. 4 in early July 2011 for relocation, which took four months. In September 2013, one of our leased parcels of land was taken by the Chinese government for railway construction, which caused suspension of the operations of Factory No.3 in September 2013 for relocation, which took four months. Any future taking of our leased lands will adversely affect our existing business and productivity.
Risks Relating to our Common Stock and our status as a Public Company
The price of our common stock may be affected by a limited trading volume and may fluctuate significantly.
There has been a limited public market for our common stock and we cannot assure you that an active trading market for our stock will develop or if developed, will be maintained. The absence of an active trading market may adversely affect our stockholders' ability to sell our common stock in short time periods, or possibly at all. In addition, we cannot assure you that you will be able to sell shares of common stock that you have purchased without incurring a loss. The market price of our common stock may not necessarily bear any relationship to our book value, assets, past operating results, financial condition or any other established criteria of value, and may not be indicative of the market price for the common stock in the future. In addition, the market price for our common stock may be volatile depending on a number of factors, including business performance, industry dynamics, and news announcements or changes in general economic conditions.
We have not and do not anticipate paying any dividends on our common stock; because of this our securities could face devaluation in the market.
We have paid no dividends on our common stock to date and it is not anticipated that any dividends will be paid to holders of our common stock in the foreseeable future. While our dividend policy will be based on the operating results and capital needs of the business, it is anticipated that any earnings will be retained to finance our future expansion and for the implementation of our business plan. As an investor, you should take note of the fact that a lack of a dividend can further affect the market value of our stock, and could significantly affect the value of any investment in our Company.
We will continue to incur significant increased costs as a result of operating as a public company, and our management will be required to devote substantial time to new compliance requirements.
As a public company we incur significant legal, accounting and other expenses under the Sarbanes-Oxley Act of 2002, together with rules implemented by the Securities and Exchange Commission and applicable market regulators. These rules impose various requirements on public companies, including requiring certain corporate governance practices. Our management and other personnel will need to devote a substantial amount of time to these new compliance requirements. Moreover, these rules and regulations will increase our legal and financial compliance costs and will make some activities more time-consuming and costly.
20
In addition, the Sarbanes-Oxley Act requires, among other things, that we maintain effective internal controls for financial reporting and disclosure controls and procedures. In particular, commencing in 2007, we must perform system and process evaluations and testing of our internal controls over financial reporting to allow management and our independent registered public accounting firm to report on the effectiveness of our internal controls over financial reporting, as required by Section 404 of the Sarbanes-Oxley Act. Our testing, or the subsequent testing by our independent registered public accounting firm, may reveal deficiencies in our internal controls over financial reporting that are deemed to be material weaknesses. Compliance with Section 404 may require that we incur substantial accounting expenses and expend significant management efforts. If we are not able to comply with the requirements of Section 404 in a timely manner, or if our accountants later identify deficiencies in our internal controls over financial reporting that are deemed to be material weaknesses, the market price of our stock could decline and we could be subject to sanctions or investigations by the SEC or other applicable regulatory authorities.
Lack of management control by purchasers of our common stock
As of the date of this report, Mr. Ming Yang, our chairman and former chief executive officer, and his affiliates, may be deemed to beneficially own approximately 30.4% of our common stock. As a result of this concentration of ownership, our public stockholders, acting alone, may not have the ability to influence the outcome of matters requiring stockholder approval, including the election of our directors or significant corporate transactions. In addition, this concentration of ownership, which is not subject to any voting restrictions, may discourage or thwart efforts by third parties to take-over or effect a change in control of our Company that may be desirable for our stockholders, and may limit the price that investors are willing to pay for our common stock.
Our Board of Directors has the authority, without stockholder approval, to issue preferred stock with terms that may not be beneficial to common stock holders and with the ability to adversely affect stockholder voting power and perpetuate the board's control over the Company.
Our certificate of incorporation authorizes the issuance of up to 1,000,000 shares of preferred stock. Our Board of Directors by resolution may authorize the issuance of up to 1,000,000 shares of preferred stock in one or more series with such limitations and restrictions as it may determine, in its sole discretion, with no further authorization by security holders required for the issuance thereof. The Board may determine the specific terms of the preferred stock, including: designations; preferences; conversions rights; cumulative; relative; participating; and optional or other rights, including: voting rights; qualifications; limitations; or restrictions of the preferred stock.
The issuance of preferred stock may adversely affect the voting power and other rights of the holders of common stock. Preferred stock may be issued quickly with terms calculated to discourage, make more difficult, delay or prevent a change in control of our company or make removal of management more difficult. As a result, the Board of Directors' ability to issue preferred stock may discourage the potential hostile acquirer, possibly resulting in beneficial negotiations. Negotiating with an unfriendly acquirer may result in terms more favorable to us and our stockholders. Conversely, the issuance of preferred stock may adversely affect any market price of, and the voting and other rights of the holders of the common stock. We presently have no plans to issue any preferred stock.
Future sales of our common stock, or the perception that such sales could occur, could have an adverse effect on the market price of our common stock.
We had approximately 38,672,865 shares of our common stock outstanding as of December 31, 2014. There are a limited number of holders of our common stock. Future sales of our common stock, pursuant to a registration statement or Rule 144 under the Securities Act, or the perception that such sales could occur, could have an adverse effect on the market price of our common stock. The number of our shares available for sale pursuant to registration statements or Rule 144 is very large relative to the trading volume of our shares. Any attempt to sell a substantial number of our shares could severely depress the market price of our common stock. In addition, we may use our capital stock in the future to finance acquisitions and to compensate employees and management, which will further dilute the interests of our existing shareholders and could also depress the trading price of our common stock.
21
Techniques employed by manipulative short sellers in Chinese small cap stocks may drive down the market price of our common stock.
Short selling is the practice of selling securities that the seller does not own but rather has, supposedly, borrowed from a third party with the intention of buying identical securities back at a later date to return to the lender. The short seller hopes to profit from a decline in the value of the securities between the sale of the borrowed securities and the purchase of the replacement shares, as the short seller expects to pay less in that purchase than it received in the sale. As it is therefore in the short seller’s best interests for the price of the stock to decline, many short sellers (sometime known as “disclosed shorts”) publish, or arrange for the publication of, negative opinions regarding the relevant issuer and its business prospects in order to create negative market momentum and generate profits for themselves after selling a stock short. While traditionally these disclosed shorts were limited in their ability to access mainstream business media or to otherwise create negative market rumors, the rise of the Internet and technological advancements regarding document creation, videotaping and publication by weblog (“blogging”) have allowed many disclosed shorts to publicly attack a company’s credibility, strategy and veracity by means of so-called research reports that mimic the type of investment analysis performed by large Wall Street firm and independent research analysts. These short attacks have, in the past, led to selling of shares in the market, on occasion in large scale and broad base. Issuers with business operations based in China and who have limited trading volumes and are susceptible to higher volatility levels than U.S. domestic large-cap stocks, can be particularly vulnerable to such short attacks.
These short seller publications are not regulated by any governmental, self-regulatory organization or other official authority in the U.S., are not subject to the certification requirements imposed by the Securities and Exchange Commission in Regulation AC (Regulation Analyst Certification) and, accordingly, the opinions they express may be based on distortions of actual facts or, in some cases, fabrications of facts. In light of the limited risks involved in publishing such information, and the enormous profit that can be made from running just one successful short attack, unless the short sellers become subject to significant penalties, it is more likely than not that disclosed shorts will continue to issue such reports.
While we intend to strongly defend our public filings against any such short seller attacks, oftentimes we are constrained, either by principles of freedom of speech, applicable state law (often called “Anti-SLAPP statutes”), or issues of commercial confidentiality, in the manner in which we can proceed against the relevant short seller. You should be aware that in light of the relative freedom to operate that such persons enjoy – oftentimes blogging from outside the U.S. with little or no assets or identity requirements – should we be targeted for such an attack, our stock will likely suffer from a temporary, or possibly long term, decline in market price should the rumors created not be dismissed by market participants.
22
Item 1B. Unresolved Staff Comments.
None.
Item 2. Properties.
FIGURE 2.1 - REGIONAL MAP OF MINING PROPERTIES
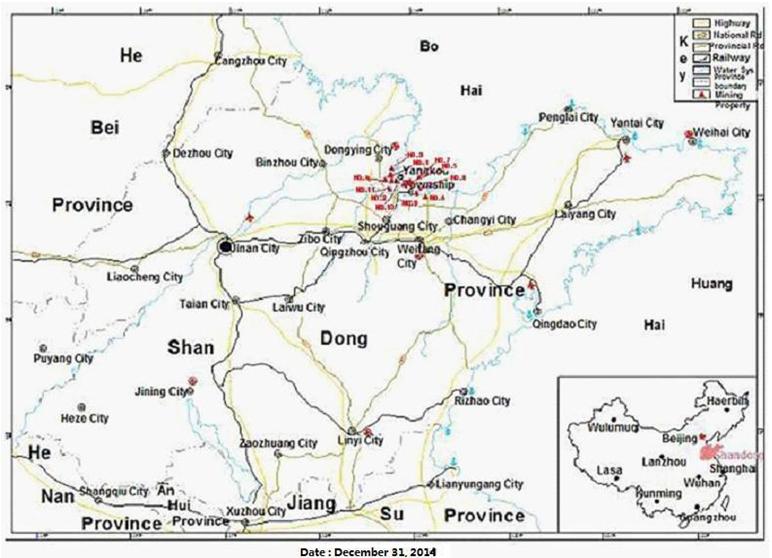
23
FIGURE 2.2 - DETAILED MAP OF MINING PROPERTIES
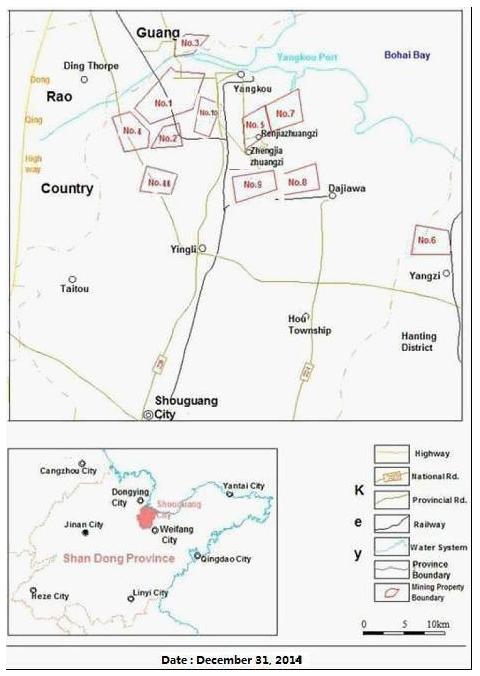
We do not own any land, though we do own some of the buildings on land we lease. Our executive offices are located in China at Level 11,Vegetable Building, Industrial Park of the East in Shouguang City, Shandong Province, P.R.C, which also is the headquarters of SCHC and SYCI. These offices were purchased from Shandong Shouguang Vegetable Seed industry Group Co., Ltd, in which Mr. Ming Yang, the Chairman of the Company, had 99% equity interest.
SYCI's factories are located in the 2nd Living District, Shouguang City, Shandong Province, the People's Republic of China which is located on approximately 18,768 square meters of land owned by Shouguang City Houxin village. There are three buildings owned by SYCI located on the property. Two of the buildings are operational plants of steel structure with an aggregate of approximately 1,560 square meters of production space and a total of 4,000 square meters for pump rooms, boiler rooms, finished products and raw materials storage. The third building is primarily for administration and has approximately 795 square meters. The Company has a 50 year lease on the land from April 1, 1998 to March 31, 2048 at an annual rent of RMB 4,000 or $619.
24
The Company operates its bromine and crude salt production facilities through its wholly-owned subsidiary SCHC. SCHC has land use rights to one property (10,790 square meters, or approximately 3 acre) as bromine production area for Factory No. 1 and land lease contracts to eleven properties (approximately 26,821 acre), totaling nearly 26,824 acre, located on the south bank of Laizhou Bay on the Shandong Peninsula of the People’s Republic of China (“China”). Each of the properties is accessible by road. The Yiyang railway line is within 50 kilometers and the Yangkou port is five kilometers away.
Each of the eleven properties contains natural brine deposits which are extracted through wells and are used to extract bromine and produce crude salt. Bromine is a simple molecular element which is produced by extracting the bromine ion from natural brine. Crude salt is sodium chloride. Bromine is an important chemical raw material in flame retardants, fire extinguishing agents, refrigerants, photographic materials, pharmaceuticals, pesticides, and oil and other industries. Crude salt, also known as industrial salt, is used in a wide range of chemical industries, is the major raw material in the soda and chlor-alkali industries and can be widely used in agricultural, animal husbandry, fisheries and food processing industries. Crude salt is also the main raw material for edible salt.
Nature of Ownership Interest in the Properties
All of the land in the PRC is owned by the State. Individuals and companies are permitted to acquire rights to use land or land use rights for specific purposes at no cost. In the case of land used for industrial purposes, the land use rights are granted for a period of 50 years. This period may be renewed at the expiration of the initial and any subsequent terms. Granted land use rights are transferable and may be used as security for borrowings and other obligations. The Company does not own any land but has entered into contracts with the local government and original owners of the land use rights to acquire their rights for a period of 50 years. The contracts required us to pay a one-time fee plus an annual rent.
Mineral Rights
The Chinese and provincial governments have enacted a series of laws and regulations relating to the natural resources sector over the past 20 years, including laws and regulations designed to improve safety and decrease environmental degradation. The “China Mineral Resources Law” declares state ownership of all mineral resources in China. However, mineral exploration rights can be purchased, sold and transferred to both domestic and foreign owned companies. Mineral resource rights are granted by the central government permitting recipients to conduct mineral resource activities in a specific area during the license period. These rights entitle the licensee to undertake mineral resource activities and infrastructure and ancillary work, in compliance with applicable laws and regulations, within the specific area covered by the license during the license period. The licensee is required to submit a proposal and feasibility studies to the relevant authority and to pay the central government a natural resources fee in an amount equal to 2% of annual bromine sales. The Company was exempt from paying the fee prior to January 1, 2008. Shandong province has determined that bromine is to be extracted only by licensed entities.
Our mineral rights are issued by the local government and allow for a one year period of mining. The rights provide us with the exclusive rights to explore and extract natural brine under the leased land and produce bromine and crude salt. The government performs an annual inspection of the company’s previous year’s state of production & operations at beginning of each year. The annual inspection reviews: (1) whether the production is safe and if any accidents occurred during the previous year; (2) whether the mineral resources compensation fees and other taxes were timely paid; (3) whether employees’ salary and welfare benefits were timely paid; and (4) whether the Company meets environment protection meet standards. Only those companies who pass the inspection receive mineral rights for another one year term. For those companies who do not pass the inspection, additional mineral rights are not allocated until they can meet the requirements. If there is major safety accident, the government may revoke the mining permit. All of the relevant documentation to apply for renewal of mining rights must be filed with the Land and Resources Bureau before March 31st each year.
All of our bromine and crude salt production facilities have been authorized by the local land and resources departments, of which Factories No. 1 to No. 4 are included under a single permit, which was originally issued in January 2005. For Factories No. 5 to No. 11, the related mining permit applications are under review by the local land and resources departments, nevertheless we have obtained written consent from the local land and resources department to commence the production for Factories No. 5 to No. 9. In addition, all of our operations are subject to and have passed government safety inspections. We also have been granted environmental certification from the PRC Bureau of Environmental Protection.
Factories No. 1 to No. 11 are in their production stage and operate bromine extraction and crude salt production facilities. The facilities each include wells, which are used to extract natural brine from underground, natural brine transmission pipelines, natural brine storage reservoirs, bromine refining equipment, wastewater transport pipes, and drying brine drying pans.
25
The equipment and facilities described above were constructed within three months after the acquisition of each of our respective properties using the latest technology and equipment and do not currently require modernization. Because bromine is a highly corrosive liquid, the equipment undergoes inspection and maintenance each year, especially the subaqueous pumps which need to be regularly inspected and maintained or replaced. Also, enhancements to certain protective shells to the crude salt fields, extraction wells and transmission channels and ducts are carried out every 5 to 8 years, depending on the erosion rate, which is affected by different weather conditions and the change in acid components of brine water over time.
As of December 31, 2014, the Company had invested approximately $107.26 million in its eleven production factories and facilities and paid approximately $8.5 million in prepaid land lease payments and mineral rights. The Company incurred approximately $6.4 million in enhancements to protection shells to transmission channels and ducts in Factory No 10 and 11, for the fiscal year 2014. Certain eroded protection shells for transmission channels and ducts, with net carrying value of $673,705 (original cost of $1,183,581) were replaced in 2014 as part of our enhancement work. In light of the increased labor and raw materials costs of construction projects in recent years, the cost to replace those eroded parts increased the overall cost of the enhancement project to its current level.
26
Each of the eleven bromine production facilities is provided with electricity and water by local government utilities.
The following is a description of the land use and mineral rights related to each of the eleven properties held by SCHC as of December 31, 2014.
|
Property
|
Factory No. 1 – Haoyuan General Factory
|
|
Area
|
6,442 acres
|
|
Date of Acquisition
|
February 5, 2007
|
|
Land Use Rights Lease Term
|
Fifty Years
|
|
Land Use Rights Expiration Date
|
2054 (for mining areas only)
|
|
The number of remaining years to expiration of the of the land lease as of December 31, 2013
|
39.25 Years
|
|
Prior fees paid for land use rights
|
RMB8.6 million
|
|
Annual Rent
|
RMB186,633
|
|
Mining Permit No.:
|
C3707002009056220022340
|
|
Date of Permission:
|
January 2005, subject to annual renewal
|
|
Period of Permission:
|
One year
|
|
Property
|
Factory No. 2 – Yuwenbo
|
|
Area
|
1,846 acres
|
|
Date of Acquisition
|
April 7, 2007
|
|
Land Use Rights Lease Term
|
Fifty Years
|
|
Land Use Rights Expiration Date
|
2052
|
|
The number of remaining years to expiration of the of the land lease as of December 31, 2013
|
38 Years
|
|
Prior Fees Paid For Land Use Rights
|
RMB7.5 million
|
|
Annual Rent
|
RMB162,560
|
|
Mining Permit No.:
|
C3707002009056220022340
|
|
Date of Permission:
|
January 2005, subject to annual renewal
|
|
Period of Permission:
|
One year
|
|
Property
|
Factory No. 3 – Yangdonghua
|
|
Area
|
2,318 acres
|
|
Date of Acquisition
|
June 8, 2007
|
|
Land Use Rights Lease Term
|
Fifty Years
|
|
Land Use Rights Expiration Date
|
2052
|
|
The number of remaining years to expiration of the of the land lease as of December 31, 2013
|
37.3 Years
|
|
Prior Fees Paid For Land Use Rights
|
RMB5 million
|
|
Annual Rent
|
RMB111,317
|
|
Mining Permit No.:
|
C3707002009056220022340
|
|
Date of Permission:
|
January 2005, subject to annual renewal
|
|
Period of Permission:
|
One year
|
27
|
Property
|
Factory No. 4 – Liuxingji
|
|
Area
|
2,310 acres
|
|
Date of Acquisition
|
October 26, 2007
|
|
Land Use Rights Lease Term
|
Fifty Years
|
|
Land Use Rights Expiration Date
|
2054
|
|
The number of remaining years to expiration of the of the land lease as of December 31, 2013
|
39.83 Years
|
|
Annual Rent
|
RMB139,255
|
|
Prior Fees Paid For Land Use Rights
|
RMB6.5 million
|
|
Mining Permit No.:
|
C3707002009056220022340
|
|
Date of Permission:
|
January 2005, subject to annual renewal
|
|
Period of Permission:
|
One year
|
|
Property
|
Factory No. 5 – Wangjiancai
|
|
Area
|
2,165 acres
|
|
Date of Acquisition
|
October 25, 2007
|
|
Land Use Rights Lease Term
|
Fifty Years
|
|
Land Use Rights Expiration Date
|
2054
|
|
The number of remaining years to expiration of the of the land lease as of December 31, 2013
|
40 Years
|
|
Annual Rent
|
RMB176,441
|
|
Prior Fees Paid for Land Use Rights
|
RMB8.3 million
|
|
Mining Permit No.:
|
Under application, written consent obtained from local land and resources departments
|
|
Property
|
Factory No. 6 – Yangxiaodong
|
|
Area
|
2,641 acres
|
|
Date of Acquisition
|
January 8, 2008
|
|
Land Use Rights Lease Term
|
Fifty Years
|
|
Land Use Rights Expiration Date
|
2055
|
|
The number of remaining years to expiration of the of the land lease as of December 31, 2013
|
40.5 Years
|
|
Prior Fees Paid for Land Use Rights
|
RMB9.1 million
|
|
Annual Rent
|
RMB191,295
|
|
Mining Permit No.:
|
Under application, written consent obtained from local land and resources departments
|
|
Property
|
Factory No. 7 – Qiufen Yuan
|
|
Area
|
1,611 acres
|
|
Date of Acquisition
|
January 7, 2009
|
|
Land Use Rights Lease Term
|
Fifty Years
|
|
Land Use Rights Expiration Date
|
2059
|
|
The number of remaining years to expiration of the of the land lease as of December 31, 2013
|
44.17 Years
|
|
Prior Fees Paid for Land Use Rights
|
Not applicable
|
|
Annual Rent
|
RMB171,150
|
|
Mining Permit No.:
|
Under application, written consent obtained from local land and resources departments
|
28
|
Property
|
Factory No. 8 – Fengxia Yuan
|
|
Area
|
2,723 acres
|
|
Date of Acquisition
|
September 7, 2009
|
|
Land Use Rights Lease Term
|
Fifty Years
|
|
Land Use Rights Expiration Date
|
2059
|
|
The number of remaining years to expiration of the of the land lease as of December 31, 2013
|
44.66 Years
|
|
Prior Fees Paid for Land Use Rights
|
Not applicable
|
|
Annual Rent
|
RMB347,130
|
|
Mining Permit No.:
|
Under application, written consent obtained from local land and resources departments
|
|
Property
|
Factory No. 9 – Jinjin Li
|
|
Area
|
759 acres
|
|
Date of Acquisition
|
June 7, 2010
|
|
Land Use Rights Lease Term
|
Fifty Years
|
|
Land Use Rights Expiration Date
|
2060
|
|
The number of remaining years to expiration of the of the land lease as of December 31, 2013
|
45.5 Years
|
|
Prior Fees Paid for Land Use Rights
|
Not applicable
|
|
Annual Rent
|
RMB184,000
|
|
Mining Permit No.:
|
Under application, written consent obtained from local land and resources departments
|
|
Property
|
Factory No. 10 – Liangcai Zhang
|
|
Area
|
1,700 acres
|
|
Date of Acquisition
|
December 22, 2011
|
|
Land Use Rights Lease Term
|
Ten Years
|
|
Land Use Rights Expiration Date
|
2021
|
|
The number of remaining years to expiration of the of the land lease as of December 31, 2013
|
7.0 Years
|
|
Prior Fees Paid for Land Use Rights
|
Not applicable
|
|
Annual Rent
|
RMB688,000
|
|
Mining Permit No.:
|
Under application
|
|
Property
|
Factory No. 11 – Chengyong Zhao
|
|
Area
|
1,730 acres
|
|
Date of Acquisition
|
November 26, 2012
|
|
Land Use Rights Lease Term
|
Twenty Years
|
|
Land Use Rights Expiration Date
|
2032
|
|
The number of remaining years to expiration of the of the land lease as of December 31, 2013
|
18.0 Years
|
|
Prior Fees Paid for Land Use Rights
|
Not applicable
|
|
Annual Rent
|
RMB918,800
|
|
Mining Permit No.:
|
Under application
|
29
Leased Facility
On November 5, 2010, SCHC entered into a Lease Contract with State-Operated Shouguang Qingshuibo Farm. Pursuant to the Lease Contract, SCHC shall lease certain property with an area of 3,192 square meters (or 0.8 acres) or and buildings adjacent to the Company’s Factory No. 1. There are currently non-operating bromine production facilities on the property which have not been in production for more than 12 months. The annual lease payment for the property is RMB 5.0 million, approximately $794,550, per year and shall be paid by SCHC no later than June 30th of each year. The term of the Lease Contract is for twenty years commencing from January 1, 2011. The Lease Contract may be renewed by SCHC for an additional twenty year period on the same terms. The Lessor has agreed to permit SCHC to reconstruct and renovate the existing bromine production facilities on the property.
30
The chart below represents the annual production capacity and annualized utilization ratios for our bromine producing properties currently leased by the Company, which are all located in Shouguang City, Shandong Province, China. There are no proven and probable reserves located on our properties.
|
Bromine Property
|
Facility
Acquisition Date
|
Acres
|
Annual Production
Capacity #
(in tons)
|
2014
Utilization
Ratio
|
2013
Utilization
Ratio
|
|||||||||||||||
|
Factory No. 1
|
- | 6,442 | 6,681 | 44 | % | 47 | % | |||||||||||||
|
Factory No. 2
|
April 7, 2007
|
1,846 | 4,844 | 46 | % | 44 | % | |||||||||||||
|
Factory No. 3
|
June 8, 2007
|
2,318 | 4,701 | 43 | % | 40 | % | |||||||||||||
|
Factory No. 4
|
October 26, 2007
|
2,310 | 3,801 | 44 | % | 50 | % | |||||||||||||
|
Factory No. 5 and
Factory No. 7 *
|
October 25, 2007/
January 7, 2009
|
3,776 | 6,986 | 46 | % | 48 | % | |||||||||||||
|
Factory No. 6
|
January 8, 2008
|
2,641 | 4,539 | 47 | % | 50 | % | |||||||||||||
|
Factory No. 8
|
September 7, 2009
|
2,723 | 4,016 | 45 | % | 45 | % | |||||||||||||
|
Factory No. 9
|
June 7, 2010
|
759 | 2,793 | 45 | % | 50 | % | |||||||||||||
|
Subdivision of Factory No. 1
|
January 1, 2011
|
1 | 3,186 | 41 | % | 38 | % | |||||||||||||
|
Factory No. 10
|
December 22, 2011
|
1,700 | 3,000 | 44 | % | 46 | % | |||||||||||||
|
Factory No. 11
|
November 26, 2012
|
1,730 | 2,800 | 42 | % | 44 | % | |||||||||||||
|
*
|
Bromine production for Factory No. 5 and Factory No. 7 were combined in early 2010 as both factories are located adjacent to each other.
|
|
#
|
Except for Factory No. 10 and No.11 which were acquired after the assessment performed, annual production capacities for other factories were reassessed by Grant Sherman Appraisal Limited on October 28, 2011.
|
Each of the properties described above was not in operation when the Company acquired the asset. The owners of each of the properties did not hold the proper license for the exploration and production of bromine, and production at each of the assets acquired had been previously halted by the government. With respect to Factory No. 2, the property had not been operational for nine months; with respect to Factory No. 3, the property had not been operational for eleven months; with respect to Factory No. 4 and No. 5, the property had not been operational for fifteen months; with respect to Factory No. 6, the property had not been operational for eighteen months; with respect to Factory No. 7, the property had not been operational for thirteen months; with respect to Factory No. 8, the property had not been operational for fourteen months; and with respect to Factories No. 9 No. 10 and No.11, the assets had not been operational for six months.
The following table shows the annual bromine produced and sold for each of our production facilities and the weighted average price received for all products sold for the last two years.
|
2014
|
2013
|
|||||||||||||||||||||||
|
Bromine
Facility
|
Produced
(in tons)
|
Sold
(in tons)
|
Selling price (RMB/ton)
|
Produced
(in tons)
|
Sold
(in tons)
|
Selling price (RMB/ton)
|
||||||||||||||||||
|
Factory No. 1
|
2,962 | 2,980 | 17,748 | 3,131 | 3,118 | 18,572 | ||||||||||||||||||
|
Factory No. 2
|
2,227 | 2,234 | 17,734 | 2,118 | 2,149 | 18,496 | ||||||||||||||||||
|
Factory No. 3
|
2,042 | 2,022 | 17,748 | 1,265 | 1,317 | 18,853 | ||||||||||||||||||
|
Factory No. 4
|
1,668 | 1,676 | 17,713 | 1,884 | 1,886 | 18,598 | ||||||||||||||||||
|
Factory No. 5 and
Factory No. 7 *
|
3,211 | 3,211 | 17,744 | 3,361 | 3,374 | 18,596 | ||||||||||||||||||
|
Factory No. 6
|
2,135 | 2,112 | 17,727 | 2,284 | 2,280 | 18,596 | ||||||||||||||||||
|
Factory No. 8
|
1,822 | 1,829 | 17,703 | 1,818 | 1,817 | 18,550 | ||||||||||||||||||
|
Factory No. 9
|
1,252 | 1,254 | 17,686 | 1,383 | 1,393 | 18,598 | ||||||||||||||||||
|
Subdivision of
Factory No. 1
|
1,322 | 1,322 | 17,730 | 1,213 | 1,217 | 18,510 | ||||||||||||||||||
|
Factory No. 10
|
1,312 | 1,309 | 17,778 | 1,379 | 1,379 | 18,547 | ||||||||||||||||||
|
Factory No. 11
|
1,177 | 1,170 | 17,782 | 1,233 | 1,204 | 18,534 | ||||||||||||||||||
|
Total
|
21,132 | 21,120 | 21,069 | 21,135 | ||||||||||||||||||||
|
*
|
Bromine production for Factory No. 5 and Factory No. 7 were combined in early 2010 as both factories are located adjacent to each other.
|
31
The following table shows the annual crude salt produced and sold for each of our production facilities and the weighted average price received for all products sold for the last two years.
|
2014
|
2013
|
|||||||||||||||||||||||
|
Crude Salt
Facility
|
Produced
(in tons)
|
Sold
(in tons)
|
Selling price (RMB/ton)
|
Produced
(in tons)
|
Sold
(in tons)
|
Selling price (RMB/ton)
|
||||||||||||||||||
|
Factory No. 1
|
7,045 | 7,017 | 189 | 7,300 | 6,908 | 253 | ||||||||||||||||||
|
Factory No. 2
|
28,000 | 28,587 | 191 | 27,950 | 27,321 | 254 | ||||||||||||||||||
|
Factory No. 5 and
Factory No. 7 *
|
126,850 | 135,144 | 194 | 117,700 | 138,132 | 248 | ||||||||||||||||||
|
Factory No. 6
|
35,400 | 37,362 | 195 | 38,700 | 36,845 | 247 | ||||||||||||||||||
|
Factory No. 8
|
85,300 | 90,495 | 195 | 87,400 | 88,639 | 255 | ||||||||||||||||||
|
Factory No. 9
|
42,950 | 43,523 | 189 | 51,350 | 43,098 | 249 | ||||||||||||||||||
|
Total
|
325,545 | 342,127 | 330,400 | 340,943 | ||||||||||||||||||||
|
*
|
Bromine production for Factory No. 5 and Factory No. 7 were combined in early 2010 as both factories are located adjacent to each other.
|
The following table shows the chemical products produced and sold for our SYCI’s production facilities and the weighted average price received for all products sold for the last two years.
|
2014
|
2013
|
|||||||||||||||||||||||
|
Chemical
Products
|
Produced
(in tons)
|
Sold
(in tons)
|
Selling price (RMB/ton)
|
Produced
(in tons)
|
Sold
(in tons)
|
Selling price (RMB/ton)
|
||||||||||||||||||
|
Oil and gas exploration additives
|
13,714 | 13,685 | 11,533 | 13,054 | 13,074 | 11,816 | ||||||||||||||||||
|
Paper manufacturing additives
|
3,947 | 3,936 | 7,034 | 4,159 | 4,159 | 7,068 | ||||||||||||||||||
|
Pesticides manufacturing additives
|
3,132 | 3,110 | 29,161 | 3,119 | 3,122 | 28,543 | ||||||||||||||||||
|
Total
|
20,793 | 20,731 | 20,332 | 20,355 | ||||||||||||||||||||
Item 3. Legal Proceedings.
None
Item 4. Mine Safety Disclosures.
Not applicable.
32
PART II
Item 5. Market for Registrant’s Common Equity, Related Stockholder Matters and Issuer Purchases of Equity Securities.
Market for Our Common Stock
Our common stock is listed for trading on the NASDAQ Global Select Market, or NASDAQ, under the symbol “GURE”. The prices set forth below reflect the quarterly high and low sales prices per share for our common stock, as reported by the NASDAQ:
|
High
|
Low
|
|||||||
|
2015
|
||||||||
|
First Quarter (through March 10)
|
$
|
1.96
|
$
|
1.15
|
||||
|
2014
|
||||||||
|
First Quarter
|
$
|
2.87
|
$
|
2.06
|
||||
|
Second Quarter
|
$
|
2.57
|
$
|
1.78
|
||||
|
Third Quarter
|
$
|
2.17
|
$
|
1.43
|
||||
|
Fourth Quarter
|
$
|
1.53
|
$
|
1.02
|
||||
|
2013
|
||||||||
|
First Quarter
|
$
|
1.24
|
$
|
1.03
|
||||
|
Second Quarter
|
$
|
1.29
|
$
|
0.92
|
||||
|
Third Quarter
|
$
|
1.98
|
$
|
1.15
|
||||
|
Fourth Quarter
|
$
|
2.84
|
$
|
1.70
|
||||
Holders
As of March 12, 2015, our common stock was held of record by approximately 37 stockholders, some of whom may hold shares for beneficial owners and have not been polled to determine the extent of beneficial ownership.
Dividends
We have never paid cash dividends on our common stock. Holders of our common stock are entitled to receive dividends, if any, declared and paid from time to time by the Board of Directors out of funds legally available. We intend to retain any earnings for the operation and expansion of our business and do not anticipate paying cash dividends in the foreseeable future. Any future determination as to the payment of cash dividends will depend upon future earnings, results of operations, future expansion of bromine and crude salt business and other, capital requirements, our financial condition and other factors that our Board of Directors may consider.
Our Equity Compensation Plans
The following table provides information as of December 31, 2014 about our equity compensation plans and arrangements.
Equity Compensation Plan Information - December 31, 2014
|
Plan category
|
Number of securities to
be issued upon exercise
of outstanding options,
warrants and rights
|
Weighted-average
exercise price of
outstanding options,
warrants and rights
|
Number of securities remaining available for future issuance under equity compensation plans (excluding securities reflected in column (a))
|
|
|
(a)
|
(b)
|
(c)
|
|
Equity compensation plans approved by security holders
|
2,744,000
|
$2.38
|
843,489
|
|
Equity compensation plans not approved by security holders
|
-
|
-
|
-
|
|
Total
|
2,744,000
|
$2.38
|
843,489
|
33
Purchases of Equity Securities by the Company and Affiliated Purchasers
The Company's Board of Directors approved a new share repurchase program under which the Company is authorized to purchase up to $2.0 million of its issued and outstanding shares of common stock from December 23, 2014 to December 22, 2015 at the price less than $1.2 per share. The following table presents the shares acquired during the quarter ended December 31, 2014:
|
Total number of
shares (or units)
purchased
|
Average price
paid per share
(or unit)
|
Total number of
shares (or units)
purchased as
part of publicly
announced plans or
programs
|
Maximum number
(or appropriate
dollar value)
of shares (or units)
that may
yet be purchased
under the plans or
programs
|
|||||||||||||
|
October 1, 2014 to October 31, 2014
|
- | $ | - | - | $ | - | ||||||||||
|
November 1, 2014 to November 30, 2014
|
- | $ | - | - | $ | - | ||||||||||
|
December 1, 2014 to December 31, 2014
|
53,550 | $ | 1.13 | 53,550 | $ | 1,939,358 | ||||||||||
|
TOTAL
|
53,550 | $ | 1.13 | 53,550 | $ | 1,939,358 | ||||||||||
Recent Sales of Unregistered Securities
We have reported all sales of our unregistered equity securities that occurred during 2014 in our Reports on Form 10-Q or Form 8-K, as applicable.
Item 6. Selected Financial Data.
Pursuant to Item 301(c) of Regulation S-K (§ 229.301(c)), the Company is not required to provide the information required by this Item as it is a “smaller reporting company,” as defined by Rule 229.10(f)(1).
34
Item 7. Management’s Discussion and Analysis of Financial Condition and Results of Operations.
Overview
We are a holding company which conducts operations through our wholly-owned China subsidiaries. Our business is conducted and reported in three segments, namely, bromine, crude salt and chemical products.
Through our wholly-owned subsidiary, SCHC, we produce and trade bromine and crude salt. We are one of the largest producers of bromine in China, as measured by production output. Elemental bromine is used to manufacture a wide variety of bromine compounds used in industry and agriculture. Bromine also is used to form intermediary chemical compounds such as T.M.B. Bromine is commonly used in brominated flame retardants, fumigants, water purification compounds, dyes, medicines and disinfectants. Crude salt is the principal material in alkali production as well as chlorine alkali production and is widely used in the chemical, food and beverage, and other industries.
Through our wholly-owned subsidiary, SYCI, we manufacture and sell chemical products used in oil and gas field exploration, oil and gas distribution, oil field drilling, wastewater processing, papermaking chemical agents and inorganic chemicals.
On December 12, 2006, we acquired, through a share exchange, Upper Class Group Limited, a British Virgin Islands holding corporation which then owned all of the outstanding shares of SCHC. Under accounting principles generally accepted in the United States, the share exchange is considered to be a capital transaction in substance, rather than a business combination. That is, the share exchange is equivalent to the issuance of stock by Upper Class for the net assets of our Company, accompanied by a recapitalization, and is accounted for as a change in capital structure. Accordingly, the accounting for the share exchange was identical to that resulting from a reverse acquisition, except no goodwill was recorded. Under reverse takeover accounting, the post reverse acquisition comparative historical financial statements of the legal acquirer, our company, are those of the legal acquiree, Upper Class Group Limited, which is considered to be the accounting acquirer. Share and per share amounts reflected in this report have been retroactively adjusted to reflect the merger.
On February 5, 2007, the Compnay, acting through SCHC, acquired SYCI. Since the ownership of the Company and SYCI was then substantially the same, the transaction was accounted for as a transaction between entities under common control, whereby we recognized the assets and liabilities of SYCI at their carrying amounts. Share and per share amounts stated in this report have been retroactively adjusted to reflect the merger.
On August 31, 2008, SYCI completed the construction of a new chemical production line. It passed the examination by Shouguang City Administration of Work Safety and local fire department. This new production line focuses on producing environmental friendly additive products, solid lubricant and polyether lubricant, for use in oil and gas exploration. The line has an annual production capacity of 5,000 tons. Formal production of this chemical production line started on September 15, 2008.
On October 12, 2009 we completed a 1-for-4 reverse stock split of our common stock, such that for each four shares outstanding prior to the stock split there was one share outstanding after the reverse stock split. All shares of common stock referenced in this report have been adjusted to reflect the stock split figures. On October 27, 2009 our shares began trading on the NASDAQ Global Select Market under the ticker symbol “GFRE” and on June 30, 2011 we changed our ticker symbol to “GURE” to better reflection of our corporate name.
As a result of our acquisitions of SCHC and SYCI, our historical financial statements and the information presented below reflects the accounts of SCHC and SYCI. The following discussion should be read in conjunction with our consolidated financial statements and notes thereto appearing elsewhere in this report.
35
RESULTS OF OPERATIONS
Year ended December 31, 2014 as compared to year ended December 31, 2013
|
Years ended
|
||||||||||||
|
December 31, 2014
|
December 31, 2013
|
% Change
|
||||||||||
|
Net Revenue
|
$
|
113,660,331
|
$
|
118,391,783
|
(4%)
|
|||||||
|
Cost of Net Revenue
|
$
|
(81,737,610
|
)
|
$
|
(84,209,136
|
)
|
(3%)
|
|||||
|
Gross Profit
|
$
|
31,922,721
|
$
|
34,182,647
|
(7%)
|
|||||||
|
Sales, Marketing and Other Operating Expense
|
$
|
(105,588
|
)
|
$
|
(96,372
|
)
|
10%
|
|||||
|
Research and Development Costs
|
$
|
(134,292
|
)
|
$
|
(140,445
|
)
|
(4%)
|
|||||
|
Exploration cost
|
(488,880
|
)
|
-
|
-
|
||||||||
|
Write-off / Impairment on
property, plant and equipment
|
$
|
(673,705
|
)
|
$
|
(27,964
|
)
|
2309%
|
|||||
|
Loss from disposal of property, plant and equipment
|
(9,866
|
)
|
-
|
-
|
||||||||
|
General and Administrative Expenses
|
$
|
(7,161,047
|
)
|
$
|
(8,563,282
|
)
|
(16%)
|
|||||
|
Gain on relocation of factory
|
$
|
-
|
$
|
2,501,336
|
(100%)
|
|||||||
|
Other Operating Income
|
$
|
468,878
|
$
|
587,573
|
(20%)
|
|||||||
|
Income from Operations
|
$
|
23,818,221
|
$
|
28,443,493
|
(16%)
|
|||||||
|
Other Income, Net
|
$
|
279,589
|
$
|
131,548
|
113%
|
|||||||
|
Income before Taxes
|
$
|
24,097,810
|
$
|
28,575,041
|
(16%)
|
|||||||
|
Income Taxes
|
$
|
(6,226,015
|
)
|
$
|
(7,607,683
|
)
|
(18%)
|
|||||
|
Net Income
|
$
|
17,871,795
|
$
|
20,967,358
|
(15%)
|
|||||||
Net Revenue Net revenue for the fiscal year 2014, was $113,660,331, representing a decrease of $4,731,452 or 4% over the same period in 2013. This decrease was attributable to the decrease in our bromine and crude salt segments.Revenue from our bromine segment decreased from $60,488,886 for the fiscal year 2013 to $57,949,824 for the same period in 2014, a decrease of approximately 4%. Revenue from our crude salt segment decreased from $13,790,128 for the fiscal year 2013 to $10,752,226 for the same period in 2014, a decrease of approximately 22%.
Revenue from our chemical products segment increased from $44,112,769 for the fiscal year 2013 to $44,958,281 for the same period in 2014, an increase of approximately 2%.
|
Net Revenue by Segment
|
2014 vs. 2013
|
|||||||||||||||||||
|
Year Ended
|
Year Ended
|
Percent Change
|
||||||||||||||||||
|
December 31, 2014
|
December 31, 2013
|
of Net Revenue
|
||||||||||||||||||
|
Segment
|
Percent of total
|
Percent of total
|
||||||||||||||||||
|
Bromine
|
$ | 57,949,824 | 51 | % | $ | 60,488,886 | 51 | % | (4 | %) | ||||||||||
|
Crude Salt
|
$ | 10,752,226 | 9 | % | $ | 13,790,128 | 12 | % | (22 | %) | ||||||||||
|
Chemical Products
|
$ | 44,958,281 | 40 | % | $ | 44,112,769 | 37 | % | 2 | % | ||||||||||
|
Total sales
|
$ | 113,660,331 | 100 | % | $ | 118,391,783 | 100 | % | (4 | %) | ||||||||||
|
Years Ended December 31
|
Percentage Change
|
|||||||||||
|
Bromine and crude salt segments product sold in tonnes
|
2014
|
2013
|
Decrease
|
|||||||||
|
Bromine (excluded volume sold to SYCI)
|
20,077 | 20,149 | (0.4 | %) | ||||||||
|
Crude Salt
|
342,127 | 340,943 | (0.3 | %) | ||||||||
|
Years Ended December 31
|
Percentage Change
|
|||||||||||
|
Chemical products segment sold in tonnes
|
2014
|
2013
|
Increase/(Decrease)
|
|||||||||
|
Oil and gas exploration additives
|
13,685 | 13,074 | 4.7 | % | ||||||||
|
Paper manufacturing additives
|
3,936 | 4,159 | (5.4 | %) | ||||||||
|
Pesticides manufacturing additives
|
3,110 | 3,122 | (0.4 | %) | ||||||||
| 20,731 | 20,355 | 1.8 | % | |||||||||
36
Bromine segment
The decrease in net revenue from our bromine segment was mainly due to the decrease in the selling price. The selling price of bromine decreased from $3,002 per tonne for the fiscal year 2013 to $2,866 per tonne for the same period in 2014, a decrease of 4%.The major reason for the decrease in the selling price of bromine was mainly attributable to the macro-economic tightening policy imposed by the PRC government beginning in the second half of 2011 to slow down the economy, which has affected our customers’ industries. As a result, we needed to offer competitive selling prices to our customers to compete with other bromine manufacturers.
The average selling price remained relatively stable at around $2,900 per tonne from the third quarter of 2013 to the fourth quarter of 2014. We expect the average selling price of bromine to remain at current levels through the first quarter of 2015 should the PRC government’s macro-economic tightening policy remain in place. The table below shows the changes in the average selling price and changes in the sales volume of bromine for the fiscal year 2014 from the same period in 2013.
|
Fiscal Year
|
||||
|
Decrease in net revenue of bromine as a result of:
|
2014 vs. 2013
|
|||
|
Decrease in average selling price
|
$
|
(2,326,721
|
)
|
|
|
Decrease in sales volume
|
$
|
(212,341
|
)
|
|
|
Total effect on net revenue of bromine
|
$
|
(2,539,062
|
)
|
|
Crude salt segment
The decrease in net revenue from our crude salt segment was due to the decrease in the selling price of crude salt. The average selling price of crude salt decreased from $40.45 per tonne for the fiscal year 2013 to $31.43 per tonne for the same period in 2014, a decrease of 22%. The decrease in the selling price was mainly due to the macro-economic tightening policy imposed by the PRC government to slow down the economy, which has affected our customers’ industries.
We noted a downward trend in the average selling price of crude salt since the fourth quarter of 2013. The average selling price decreased 24% from the fourth quarter of 2013 to the fourth quarter of 2014. We expect the average selling price of crude salt to remain at current levels through the first quarter of 2015.
The table below shows the changes in the average selling price and changes in the sales volume of crude salt for the fiscal year 2014 from the same period in 2013.
|
Fiscal Year
|
||||
|
Increase/(Decrease) in net revenue of crude salt as a result of:
|
2014 vs. 2013
|
|||
|
Decrease in average selling price
|
$
|
(3,080,434
|
)
|
|
|
Increase in sales volume
|
$
|
42,532
|
||
|
Total effect on net revenue of crude salt
|
$
|
(3,037,902
|
)
|
|
37
Chemical products segment
|
Product Mix of Chemical Product Segment
|
2014 vs. 2013
|
|||||||||||||||||||
|
Year Ended
|
Year Ended
|
Percent Change
|
||||||||||||||||||
|
December 31, 2014
|
December 31, 2013
|
of Net Revenue
|
||||||||||||||||||
|
Chemical Products
|
Percent of total
|
Percent of total
|
||||||||||||||||||
|
Oil and gas exploration additives
|
$
|
25,689,310
|
57
|
%
|
$
|
24,964,035
|
56
|
%
|
3
|
%
|
||||||||||
|
Paper manufacturing additives
|
$
|
4,506,581
|
10
|
%
|
$
|
4,748,932
|
11
|
%
|
(5
|
%)
|
||||||||||
|
Pesticides manufacturing additives
|
$
|
14,762,389
|
33
|
%
|
$
|
14,399,803
|
33
|
%
|
3
|
%
|
||||||||||
|
Total sales
|
$
|
44,958,281
|
100
|
%
|
$
|
44,112,770
|
100
|
%
|
2
|
%
|
||||||||||
Net revenue from our chemical products segment increased from $44,112,770 for the fiscal year 2013 to $44,958,281 for the same period in 2014, an increase of approximately 2%. The increase was mainly attributable to the strong demand for our oil and gas exploration additives. Our oil and gas exploration chemicals are the most popular products within the chemical products segment, which contributed $25,689,310 (or 57%) and $24,964,035 (or 56%) of our chemical segment revenue for the fiscal year 2014 and 2013, respectively, with an increase of $725,275, or 3%. Net revenue from our paper manufacturing additives decreased from $4,748,932 for the fiscal year 2013 to $4,506,581 for the same period in 2014, a decrease of approximately 5%. Net revenue from our pesticides manufacturing additives increased from $14,399,803 for the fiscal year 2013 to $14,762,389 for the same period in 2014, an increase of approximately 3%.
The table below shows the changes in the average selling price and sales volume of major chemical products for the fiscal year 2014 as compared to the same period in 2013.
|
Increase / (Decrease) in net revenue of major chemical products, for fiscal year 2014 vs. 2013, as a result of:
|
Oil and Gas Exploration Additives
|
Paper Manufacturing Additives
|
Pesticides Agricultural Additives
|
Total
|
||||||||||||
|
Increase / (Decrease) in average selling price
|
$
|
(431,540
|
)
|
$
|
12,628
|
$
|
418,741
|
$
|
(171
|
)
|
||||||
|
Increase /(Decrease) in sales volume
|
$
|
1,156,815
|
$
|
(254,979)
|
$
|
(56,155
|
)
|
$
|
845,681
|
|||||||
|
Total effect on net revenue of chemical products
|
$
|
725,275
|
$
|
(242,351)
|
$
|
362,586
|
$
|
845,510
|
||||||||
Cost of Net Revenue
|
Cost of Net Revenue by Segment
|
% Change
|
|||||||||||||||||||
|
Year Ended
|
Year Ended
|
of Cost of
|
||||||||||||||||||
|
December 31, 2014
|
December 31, 2013
|
Net Revenue
|
||||||||||||||||||
|
Segment
|
Percent of total
|
Percent of total
|
||||||||||||||||||
|
Bromine
|
$
|
43,356,606
|
53
|
%
|
$
|
45,172,235
|
54
|
%
|
(4
|
%)
|
||||||||||
|
Crude Salt
|
$
|
9,124,596
|
11
|
%
|
$
|
9,527,910
|
11
|
%
|
(4
|
%)
|
||||||||||
|
Chemical Products
|
$
|
29,256,408
|
36
|
%
|
$
|
29,508,991
|
35
|
%
|
(1
|
%)
|
||||||||||
|
Total Cost of Net Revenue
|
$
|
81,737,610
|
100
|
%
|
$
|
84,209,136
|
100
|
%
|
(3
|
%)
|
||||||||||
38
Cost of net revenue reflects mainly the raw materials consumed and the direct salaries and benefits of staff engaged in the production process, electricity, depreciation and amortization of manufacturing plant and machinery and other manufacturing costs. Our cost of net revenue was $81,737,610 for fiscal year 2014, a decrease of $2,471,526 (or approximately 3%) compared to fiscal year 2013. The decrease in overall cost of net revenue was mainly attributable to the decrease in purchase price of raw materials of bromine and chemical product segments.
Bromine production capacity and utilization of our factories
The table below represents the annual capacity and utilization ratios for all of our bromine producing properties:
|
Annual Production Capacity (in tonnes)
|
Utilization
Ratio (i)
|
|||||||
|
Fiscal year 2013
|
47,347
|
46%
|
||||||
|
Fiscal year 2014
|
47,347
|
45%
|
||||||
|
Variance of the fiscal year 2014 and 2013
|
-
|
(1%
|
)
|
|||||
(i) Utilization ratio is calculated based on the actual production volume in tonnes for the year divided by the annual production capacity in tonnes.
Our utilization ratio decreased by 1% for the fiscal year 2014 as compared with the same period in 2013.
In view of the trend of a decrease in the bromine concentration of the brine water being extracted at our production facilities, and in order to reduce the leakage rate and attempt to recover the annual production capacity of bromine and crude salt to a higher level in the future, we are carrying out large scale enhancements to replace all the eroded protective shells within a four year timeframe, which commenced in the second quarter of 2011. The Company carried out third phase enhancement projects at a cost of approximately $6.4 million for part of its transmission channels and ducts in Factories No. 10 and No. 11. The Company expects to carry out enhancement projects for its remaining transmission channels and ducts in Factories No. 10 to No. 11 in 2015, which will cost approximately $10 million. The Company expects such enhancement expenditures to be funded by the Company’s cash on hand. The Company also estimated that the amount of ordinary repair and maintenance expense will be approximately $1.0 million in 2015.
Bromine segment
For the fiscal year 2014, the cost of net revenue for our bromine segment was $43,356,606, a decrease of $1,185,629 (or 4%) compared to $45,172,235 for the fiscal year 2013. The most significant components of our cost of net revenue for the bromine segment were cost of raw materials and finished goods consumed of $17,390,927 (or 40%), depreciation and amortization of manufacturing plant and machinery of $17,362,450 (or 40%) and electricity of $3,420,683 (or 8%) for fiscal year 2014. The most significant components of our cost of net revenue for the bromine segment were cost of raw materials and finished goods consumed of $20,759,875 (or 46%), depreciation and amortization of manufacturing plant and machinery of $16,472,169 (or 37%) and electricity of $3,225,340 (or 7%) for fiscal year 2013, a similar cost structure as compared with the same in 2014. The decrease in net cost of net revenue was attributable mainly to the decrease in purchase price of raw material, which was partially offset by the increase in depreciation and amortization of manufacturing plant and machinery due to the enhancement projects carried out for our extraction wells and transmission channels and ducts which commenced in August 2014 and completed in September 2014. The depreciation of these enhancement projects commenced in October 2014.
|
Year Ended
|
Year Ended
|
|||||||||||||||||||
|
December 31, 2014
|
December 31, 2013
|
% Change
|
||||||||||||||||||
|
Percent of total
|
Percent of total
|
|||||||||||||||||||
|
Raw materials
|
$
|
866
|
40
|
%
|
$
|
1,030
|
46
|
%
|
(16
|
%)
|
||||||||||
|
Depreciation and amortization
|
$
|
865
|
40
|
%
|
$
|
818
|
37
|
%
|
6
|
%
|
||||||||||
|
Electricity
|
$
|
171
|
8
|
%
|
$
|
160
|
7
|
%
|
6
|
%
|
||||||||||
|
Others
|
$
|
258
|
12
|
%
|
$
|
234
|
10
|
%
|
10
|
%
|
||||||||||
|
Production cost of bromine per ton
|
$
|
2,160
|
100
|
%
|
$
|
2,242
|
100
|
%
|
(4
|
%)
|
||||||||||
39
Crude salt segment
For the fiscal year 2014, the cost of net revenue for our crude salt segment was $9,124,596, representing a decrease of $403,314, or 4%, over the same period in 2013. The decrease in cost was mainly due to the decrease in the allocation of common costs shared between crude salt segment and bromine segment, which decreased from 11.7% for the fourth quarter of 2013 to 9.2% for the same period in 2014, which in turn resulted in a decrease in the depreciation and amortization of manufacturing plant and machinery allocated to crude salt segment. We distribute the total costs shared among bromine and crude salt by reference to the average selling price and production volume of respective segment. The significant costs were depreciation and amortization of $6,352,513 (or 70%), resource tax calculated based on the crude salt sold of $1,039,095 (or 12%) and electricity of $619,572 (or 7%) for the fiscal year 2014. The significant costs were depreciation and amortization of $6,637,155 (or 70%), resource tax calculated based on the crude salt sold of $1,102,260 (or 12%) and electricity of $699,333 (or 7%) for the fiscal year 2013. The table below represents the major production cost components of crude salt per ton for respective periods:
|
Year Ended
|
Year Ended
|
|||||||||||||||||||
|
December 31, 2014
|
December 31, 2013
|
% Change
|
||||||||||||||||||
|
Percent of total
|
Percent of total
|
|||||||||||||||||||
|
Depreciation and amortization
|
$
|
18.6
|
68
|
%
|
$
|
19.5
|
68
|
%
|
(5
|
%)
|
||||||||||
|
Resource tax
|
$
|
3.3
|
13
|
%
|
$
|
3.2
|
13
|
%
|
1
|
%
|
||||||||||
|
Electricity
|
$
|
1.8
|
7
|
%
|
$
|
2.1
|
7
|
%
|
12
|
%
|
||||||||||
|
Others
|
$
|
3.0
|
12
|
%
|
$
|
3.2
|
12
|
%
|
(6
|
%)
|
||||||||||
|
Production cost of crude salt per ton
|
$
|
26.7
|
100
|
%
|
$
|
28.0
|
100
|
%
|
(5
|
%)
|
||||||||||
Chemical products segment
For the fiscal year 2014, the cost of net revenue for our chemical products segment was $29,256,408, representing a decrease of $252,583, or 1%, over the same period in 2013.The significant costs were costs of raw material and finished goods consumed of $24,713,251 (or 84%) and $25,395,868 (or 86%) and depreciation and amortization of manufacturing plant and machinery of $2,839,734 (or 10%) and $2,819,911 (or 10%) for each of the fiscal years 2014 and 2013, respectively. As the components of our cost of net revenue are fixed levels of depreciation and amortization of our manufacturing plant and machinery, the rate of decrease for the cost of net revenue for our chemical products segment was less than that of net revenue.
Gross Profit. Gross profit was $31,922,721, or 28%, of net revenue for fiscal year 2014 as compared to $34,182,647, or 29%, of net revenue for fiscal year 2013. The decrease in gross profit percentage was primarily attributable to a drop in the margin percentage in our crude salt segment, which was offset by an increase in the margin percentage of the chemical products segment.
|
Gross Profit by Segment
|
% Point
|
|||||||||||||||||||
|
Year Ended
|
Year Ended
|
Change of
|
||||||||||||||||||
|
December 31, 2014
|
December 31, 2013
|
Gross Profit
|
||||||||||||||||||
|
Segment
|
Percent of Net Revenue
|
Percent of Net Revenue
|
||||||||||||||||||
|
Bromine
|
$
|
14,593,218
|
25
|
%
|
$
|
15,316,651
|
25
|
%
|
-
|
|||||||||||
|
Crude Salt
|
$
|
1,627,630
|
15
|
%
|
$
|
4,262,218
|
31
|
%
|
(16
|
%)
|
||||||||||
|
Chemical Products
|
$
|
15,701,873
|
35
|
%
|
$
|
14,603,778
|
33
|
%
|
2
|
%
|
||||||||||
|
Total Gross Profit
|
$
|
31,922,721
|
28
|
%
|
$
|
34,182,647
|
29
|
%
|
(1
|
%)
|
||||||||||
40
Bromine segment
For the fiscal year 2014, the gross profit margin for our bromine segment was 25%, as the same to 25% for the fiscal year 2013. As mentioned in the net revenue discussion above, due to the PRC government’s macro-economic tightening policy to slow down the economy, our selling price in the fiscal year2014 was affected. We cut the average selling price of bromine from $3,002 per tonne for the fiscal year2013 to $2,886 per tonne for the same period in 2014, a decrease of 4%, in order to compete with other bromine manufacturers. Since the purchase price of raw material also decreased, the gross profit margin for our bromine remained stable. We expect that the average selling price and gross profit margin of bromine will remain at current levels towards the first quarter of 2015 should the PRC government’s macro-economic tightening policy remain in place.
Crude salt segment
For the fiscal year 2014, the gross profit margin for our crude salt segment was 15% as compared to 31% for the same period in 2013. This 16% is mainly attributable to the selling price decreased from $40.45 per tonne for the fiscal year 2013 to $31.43 per tonne for the same period in 2014, a decrease of 22%, due to the macro-economic tightening policy imposed by the PRC government, which has affected our customers’ industries
Chemical products segment
The gross profit margin for our chemical products segment for the fiscal year 2014 was 35% as compared to 33% for the same period in 2013, an increase of 2%. This increase in gross profit margin was mainly a result of the increase in the sales volume for our oil and gas exploration additives. As sales of oil and gas exploration additives contributed to more than 57% of our total chemical products segment’s net revenue, the increase in demand increased the gross profit margin of our chemical products segment.
Research and Development Costs The total research and development costs incurred for the fiscal years 2014 and 2013 were $134,292 and $140,445, respectively, a decrease of 33%. Research and development costs for the fiscal year 2014 and 2013 represented raw materials used by SYCI for testing the manufacturing routine.
Exploration Costs To explore natural brine resources in Sichuan Province, SCHC incurred exploration costs in the amount of $7,034,153 for the fiscal year 2011. These costs consisted of the drilling of exploratory wells and associated facilities in order to confirm and measure the brine water resources in the province. We charged the exploration costs to the income statement as incurred. We completed the drilling of the first exploratory well in December 2011 and announced in mid-January 2012 that we have discovered underground brine water resources in Daying County, and provided preliminary concentration results after the testing by a third-party independent testing expert. According to the third-party independent testing report, the bromine concentration in the underground brine water resources is 1.53 grams per liter, which is approximately six to seven times higher than the average bromine concentration from its brine water resources at our bromine factories in Shouguang City. In September 2014, the Company started deeper drilling exploration for new resource under its existing well and performed an exploration analysis on the resources from different levels. The company incurred a total of $488,880 in exploration costs during 2014. On January 30, 2015, the Company announced that it found natural gas resources under its bromine well in the Sichuan area. The Company is optimistic about this opportunity and will hire a third party to conduct a survey of the geological structure and complexity analysis and the economics of the natural gas under this well. The Company is in the final stage of discussion with the expert company to finalize the service agreement.
Write-off/Impairment on property, plant and equipment. Write-off on property, plant and equipment for the fiscal year 2014 and 2013 were $673,705 and $27,964. Write-off on property, plant and equipment of $673,705 for the fiscal year 2014 represented the write-off of certain protective shells to transmission pipelines and ducts replaced during the third phase enhancement project that started in August 2014.
General and Administrative Expenses. General and administrative expenses were $7,161,047 for the fiscal year 2014, a decrease of $1,402,235 (or 16%) as compared to $8,563,282 for the same period in 2013. The decrease was primarily due to (i) the unrealized exchange loss in relation to the translation difference of inter-company balances in USD and RMB for the fiscal year 2013 in the amount of $774,405, as compared to the unrealized exchange gain for the same period in 2014 in the amount of $92,412 (ii) a non-cash expense related to stock options granted to employees decreased from $544,900 for the fiscal year 2013 to $346,100 for the same period of 2014 (iii) SCHC incurred in the amount of $382,814 of depreciation of property, plant and equipment for Factory No. 3, whose operations were temporarily suspended due to relocation in fiscal year 2013, offset by an amount of $196,260 of depreciation of property, plant and equipment for Factory No. 10 and 11, whose operations were temporarily suspended in the third quarter of fiscal year 2014 due to enhancement projects carried out for our transmission channels and ducts in fiscal year 2014 compared to previous year in which the depreciation was classified as cost of goods sold.
Gain on relocation of factory. Gain on relocation of factory was $2,501,336 for the fiscal year 2013. In late September 2013, the Transportation Bureau of Dongying City and other local government agencies requested the requisition of land where the original Factory No. 3 was located for railway construction.
41
Other Operating Income. Other operating income for the fiscal year 2014 represented the sales of wastewater to some of our customers in the amount of $468,878. The other operating income was $587,573 for the fiscal year 2013, which represented (i) a sum of $416,481for sales of wastewater and (ii) a sum of $171,092 for insurance compensation received in 2013 for legal fees incurred in 2012.
Income from Operations. Income from operations was $23,818,221 for the fiscal year 2014 (or 21% of net revenue), a decrease of $4,625,271 (or approximately 16%) over income from operations for the fiscal year 2013. The decrease resulted primarily from the decrease in the demand for our bromine and crude salt segments products and we recognized gain on the relocation of original Factory No.3 in the amount of $2,501,336 for the fiscal year 2013.
|
Income from Operations by Segment
|
||||||||||||||||
|
Year Ended December 31, 2014
|
Year Ended December 31, 2013
|
|||||||||||||||
|
Percent of total
|
Percent of total
|
|||||||||||||||
|
Segment:
|
||||||||||||||||
|
Bromine
|
$ | 9,500,428 | 38 | % | $ | 13,152,092 | 43 | % | ||||||||
|
Crude Salt
|
$ | 719,226 | 3 | % | $ | 3,831,272 | 13 | % | ||||||||
|
Chemical Products
|
$ | 14,432,851 | 59 | % | $ | 13,371,119 | 44 | % | ||||||||
|
Income from operations before corporate costs
|
$ | 24,652,505 | 100 | % | $ | 30,354,483 | 100 | % | ||||||||
|
Corporate costs
|
$ | (834,284 | ) | $ | (1,910,990 | ) | ||||||||||
|
Income from operations
|
$ | 23,818,221 | $ | 28,443,493 | ||||||||||||
Bromine segment
Income from operations from our bromine segment was $9,500,428 for the fiscal year 2014, a decrease of $3,651,664 (or approximately 28%) compared to the same period in 2013. This significant decrease resulted primarily from the decrease in selling price (approximately $2.3 million) as a result of the PRC government’s macro-economic tightening policy and gain on the relocation of original Factory No.3 of approximately $2.0million for fiscal year 2013, which was partially offset by the decrease in the purchase price of raw materials.
42
Crude salt segment
Income from operations from our crude salt segment was $719,226 for the fiscal year 2014, a decrease of $3,112,046 (or approximately 81%) as compared to the same period in 2013. This significant decrease was mainly due to the decrease in the average selling price (approximately $3.1 million).
Chemical products segment
Income from operations from our chemical products segment was $14,432,851 for the fiscal year 2014, an increase of $1,061,732 (or approximately 8%) over same period in 2013. This increase was primarily due to the increase in demand for our oil and gas exploration additives and the increase selling price of pesticides manufacturing additive, which was partially offset by the decrease in purchase of raw material.
Other Income, Net. Other income, net ,which represent bank interest income, net of capital lease interest expense was $279,589 for the fiscal year 2014, an increase of $148,041 (or approximately113%) as compared to the same period in 2013, mainly due to a higher average bank balance held during the fiscal year 2014 compared to the same period in 2013.
Net Income. Net income was $17,871,795 for the fiscal year 2014, a decrease of $3,095,562 (or approximately 15%) as compared to the same period in 2013. This decrease was primarily attributable to the decrease in the selling price of bromine and crude salt.
Effective Tax Rate. Our effective tax rates for the fiscal years 2014 and 2013 were 26% and 27%, respectively. The effective tax rate for the fiscal year 2014 of 26% differs from the PRC statutory income tax rate of 25% due to change in valuation allowance related to the US federal net operating loss incurred by the Company (contributed 1% gap). The effective tax rate for the fiscal year 2013 of 27% differs from the PRC statutory income tax rate of 25% due to (i) the change in valuation allowance related to the US federal net operating loss incurred by the Company (contributed 1% gap). and (ii) non-deductible expense in connection with the unrealized exchange loss for the Company (contributed 1% gap).
LIQUIDITY AND CAPITAL RESOURCES
As of December 31, 2014, cash and cash equivalents were $146,585,601 as compared to $107,828,800 as of December 31, 2013. The components of this increase of $38,756,801 are reflected below.
|
Statement of Cash Flows
|
||||||||
|
Years Ended December 31
|
||||||||
|
2014
|
2013
|
|||||||
|
Net cash provided by operating activities
|
$
|
46,573,777
|
$
|
40,151,272
|
||||
|
Net cash provided by (used in) investing activities
|
$
|
(7,181,203
|
)
|
$
|
37,869
|
|||
|
Net cash used in financing activities
|
$
|
(366,534
|
)
|
$
|
(302,497
|
)
|
||
|
Effects of exchange rate changes on cash and cash equivalents
|
$
|
(269,239
|
)
|
$
|
2,701,121
|
|||
|
Net cash inflow /(outflow)
|
$
|
38,756,801
|
$
|
42,587,765
|
||||
For the fiscal years 2014 and 2013, we met our working capital and capital investment requirements mainly by using cash flows from operations and cash on hand.
Net Cash Provided by Operating Activities
During the years ended December 31, 2014 and 2013, we had positive cash flow from operating activities of $46.6 million and $40.2 million respectively, primarily attributable to net income.
43
During the year ended December 31, 2014, cash flow from operating activities of $46.6 million exceeded our net income of $17.9 million due to non-cash charges in the amount of $29.3 million, mainly in the form of depreciation and amortization of property, plant and equipment, write-off/impairment on property, plant and equipment and amortization of prepaid expenses; partially offset by cash used in working capital of $0.6 million, which mainly consisted of decrease in accounts payable and accrued expenses and tax payable, partially offset by the decrease in accounts receivable.
During the year ended December 31, 2013, cash flow from operating activities of $40.2 million exceeded our net income of $21.0 million due to non-cash charges in the amount of $26.1 million, mainly in the form of depreciation and amortization of property, plant and equipment, exchange loss on intercompany balances and stock-based compensation; partially offset by cash used in working capital of $6.9 million, which mainly consisted of increase in accounts receivable and a decrease in retention payable and accounts payable, partially offset by the increase in taxes payable.
Accounts receivable
Cash collections on our accounts receivable had a major impact on our overall liquidity. The following table presents the aging analysis of our accounts receivable as of December 31, 2014 and 2013.
|
December 31, 2014
|
December 31, 2013
|
|||||||||||||||
|
% of total
|
% of total
|
|||||||||||||||
|
Aged 1-30 days
|
$
|
9,323,910
|
22
|
%
|
$
|
11,694,338
|
26
|
%
|
||||||||
|
Aged 31-60 days
|
$
|
9,974,381
|
24
|
%
|
$
|
11,199,632
|
25
|
%
|
||||||||
|
Aged 61-90 days
|
$
|
8,631,203
|
20
|
%
|
$
|
10,256,456
|
23
|
%
|
||||||||
|
Aged 91-120 days
|
$
|
9,188,133
|
22
|
%
|
$
|
8,687,636
|
19
|
|||||||||
|
Aged 121-150 days
|
$
|
4,880,235
|
12
|
%
|
$
|
3,047,293
|
7
|
|||||||||
|
Total
|
$
|
41,997,862
|
100
|
%
|
$
|
44,885,355
|
100
|
%
|
||||||||
The overall accounts receivable balance as of December 31, 2014 decreased by $2,887,493 (or 6%), as compared to those as of December 31, 2013. Such increase is mainly attributable to the decrease in net revenues as a result of the decrease selling price of bromine and crude salt segments. We are not aware of any allowances for doubtful debts required for the fiscal year 2014 as we have policies in place to ensure that sales are made to customers with an appropriate credit history. For the balances of accounts receivable as of December 31, 2014 aged more than 90 days, 84 % was settled in the two months ended February 28, 2015.
Inventory
Our inventory consists of the following:
|
December 31, 2014
|
December 31, 2013
|
|||||||||||||||
|
Percent of total
|
Percent of total
|
|||||||||||||||
|
Raw materials
|
$ | 625,160 | 11.7 | % | $ | 651,810 | 12.3 | % | ||||||||
|
Finished goods
|
$ | 4,746,163 | 88.4 | % | $ | 4,656,814 | 87.8 | % | ||||||||
| 5,371,323 | 100.1 | % | 5,308,624 | 100.1 | % | |||||||||||
|
Allowance for obsolete and slowing-moving inventory
|
$ | (3,455 | ) | (0.1 | %) | $ | (6,629 | ) | (0.1 | %) | ||||||
|
Total
|
$ | 5,367,868 | 100.0 | % | $ | 5,301,995 | 100.0 | % | ||||||||
The net inventory levels as of December 31, 2014 increased by $65,873 (or 1%), as compared to the net inventory levels as of December 31, 2013.
Raw materials decreased by 4% as of December 31, 2014 as compared to December 31, 2013. All of the raw materials are basic chemical industry materials, few of which have a possibility of loss over time, or major fluctuations in their prices. As a result, we concluded that all of our raw materials as of December 31, 2014 are fully realizable for production of finished goods with no write down necessary.
44
Our finished goods consist of bromine, crude salt and chemical products. Our chemical products are similar to raw materials. There is no loss over time and a stable market price exists with a positive gross profit margin of 35% for the fiscal year 2014 (33% for fiscal year 2013). Therefore, we believe that the realization of the chemical products is 100%. Similarly, as there is no depletion of bromine, we believe that the realization of it is also 100%. Although the gross profit margin for the fiscal year 2014 remains 25%, the same as in fiscal year 2013, we anticipate that the price in fiscal year of 2015 will not fluctuate significantly to impair the cost of bromine.
The annual loss of crude salt due to evaporation is approximately 3%. The average selling price of crude salt per tonne decreased from $40.45 for the fiscal year 2013 to $31.43 for the same period in 2014. In the same period, gross profit also decreased from 31% for the fiscal year 2013 to 15% for the same period in 2014. If the selling price continues to decrease, there will be an impact on our crude salt realization value.
Net Cash provided by (Used In) Investing Activities
In the fiscal year 2014, we used approximately $0.66 million cash for the payment of land leases. In the same period, we also used approximately $6.46 million cash in the third phase enhancement project related to the protective shells to transmission channels and ducts in Factory No. 10 and 11.
In the fiscal year 2013, we received compensation proceeds of approximately $3.9 million from the Transportation Bureau of Dongying City and other local government agencies for the requisition of land where the original Factory No.3 was located for railway construction..
In the fiscal year 2013, we used approximately $0.6 million for the prepayment of land leases.
We also used approximately $3.2 million for the construction of our new Factory No.3 due to the resumption of leased land by the Transportation Bureau of Dongying City and other local government agencies for railway construction.
The above investing activities were financed by the opening cash balances as of December 31, 2013 and cash generated from operation during the fiscal year 2014.
Net Cash Used In Financing Activities
In the fiscal year 2014, we repaid approximately $0.3 million for our capital lease obligation and used another $0.06 million to repurchase 53,550 shares of common stock of the Company under the approval of the Board of Directors.
We repaid approximately $0.3 million for our capital lease obligation for the fiscal year 2013.
We believe that our available funds and cash flows generated from operations will be sufficient to meet our anticipated ongoing operating needs for the next twelve months.
Working capital was approximately $186.0 million at December 31, 2014 as compared to approximately $146.8 million at December 31, 2013. The increase was mainly attributable to the cash provided by operating activities and the decrease in tax payable during the fiscal year 2014.
45
We had available cash of approximately $146.6 million at December 31, 2014, most of which is in highly liquid current deposits which earn no or little interest. We intend to retain the cash for future expansion of our bromine and crude salt businesses through acquisition, enhancements to our existing bromine and crude salt business, and further development of the new resources in Sichuan Province. We do not anticipate paying cash dividends in the foreseeable future.
In the future we intend to focus our efforts on the activities of SCHC, SYCI and SCRC as these segments continue to expand within the Chinese market.
We may not be able to identify, successfully integrate or profitably manage any businesses or business segment we may acquire, or any expansion of our business. An expansion may involve a number of risks, including possible adverse effects on our operating results, diversion of management’s attention, inability to retain key personnel, risks associated with unanticipated events and the financial statement effect of potential impairment of acquired intangible assets, any of which could have a materially adverse effect on our condition and results of operations. In addition, if competition for acquisition candidates or operations were to increase, the cost of acquiring businesses could increase materially. We may effect an acquisition with a target business which may be financially unstable, under-managed, or in its early stages of development or growth. Our inability to implement and manage our expansion strategy successfully may have a material adverse effect on our business and future prospects.
Contractual Obligations and Commitments
We have no significant contractual obligations not fully recorded on our consolidated balance sheets or fully disclosed in the notes to our consolidated financial statements. Additional information regarding our contractual obligations and commitments at December 31, 2014 is provided in the notes to our consolidated financial statements. See “Notes to Consolidated Financial Statements, Note 19 - Capital Commitment and Operating Lease Commitments.”
Material Off-Balance Sheet Arrangements
We do not currently have any off-balance sheet arrangements falling within the definition of Item 303(a) of Regulation S-K.
Critical Accounting Policies and Estimates
Our Consolidated Financial Statements are prepared in accordance with accounting principles generally accepted in the United States of America (U.S. GAAP), which requires us to make judgments, estimates and assumptions. See “Note 1 – Nature of Business and Summary of Significant Accounting Policies,” in Notes to the Consolidated Financial Statements, which is included in “Item 8. Financial Statements and Supplementary Data,” which describes our significant accounting policies and methods used in the preparation of our Consolidated Financial Statements. The methods, estimates and judgments that we use in applying our accounting policies require us to make difficult and subjective judgments, often as a result of the need to make estimates regarding matters that are inherently uncertain.
46
Our most critical estimates include:
|
|
• allowance for doubtful accounts, which impacts revenue;
|
|
|
• the valuation of inventory, which impacts gross margins;
|
|
|
• impairment of long-lived assets;
|
|
|
• the valuation and recognition of share-based compensation, which impacts operating expenses; and
|
|
|
• the recognition and measurement of current and deferred income taxes, which impact our provision for taxes.
|
Allowance for Doubtful Accounts
We makes estimates of the uncollectibility of accounts receivable, especially analyzing accounts receivable and historical bad debts, customer concentrations, customer credit-worthiness, current economic trends and changes in customer payment terms, when evaluating the adequacy of the allowance for doubtful accounts. Credit evaluations are undertaken for all major sale transactions before shipment is authorized. On a quarterly basis, we evaluate aged items in the accounts receivable aging report and provide an allowance in an amount we deem adequate for doubtful accounts. If management were to make different judgments or utilize different estimates, material differences in the amount of our reported operating expenses could result.
Inventory Valuation
Inventory is stated at the lower of cost or market, with cost determined on a first-in first-out basis. The carrying value of inventory is reduced for estimated obsolescence by the difference between its cost and the estimated market value based upon assumptions about future demand. We evaluate the inventory carrying value for potential excess and obsolete inventory exposures by analyzing historical and anticipated demand. If actual future demand or market conditions are less favorable than those projected by management, additional inventory write-downs may be required in the future, which could have a material adverse effect on our results of operations.
Depreciation of Property, Plant and Equipment
Property, plant and equipment are stated at cost less accumulated depreciation and any impairment losses. Expenditures for new facilities or equipment, and major expenditures for betterment of existing facilities or equipment are capitalized and depreciated using the straight-line method at rates sufficient to depreciate such costs over the estimated productive lives. All other ordinary repair and maintenance costs are expensed as incurred. Mineral rights are recorded at cost less accumulated depreciation and any impairment losses. Mineral rights are amortized ratably over the term of the lease, or the equivalent term under the units of production method, whichever is shorter. In some situations, the life of the asset may be extended or shortened if circumstances arise that would lead us to believe that the estimated life of the asset has changed. The life of leasehold improvements may change based on the extension of lease contracts with our landlords. Changes in the estimated lives of assets will result in an increase or decrease in the amount of depreciation recognized in future periods.
Impairment of Long Lived Assets
We periodically evaluate whether events or circumstances have occurred that indicate long-lived assets may not be recoverable or that the remaining useful life may warrant revision. When such events or circumstances are present, we assess the recoverability of long-lived assets by determining whether the carrying value will be recovered through the expected undiscounted future cash flows resulting from the use of the asset. In the event the sum of the expected undiscounted future cash flows is less than the carrying value of the asset, an impairment loss equal to the excess of the asset’s carrying value over its fair value is recorded.
Valuation Allowance on Deferred Tax Assets
We evaluate our deferred income tax assets to determine if valuation allowances are required or should be adjusted. A valuation allowance is established against our deferred tax assets based on consideration of all available evidence, both positive and negative, using a “more likely than not” standard. This assessment considers, among other matters, the nature, frequency and severity of recent losses, forecasts of future profitability, the duration of statutory carry forward periods, our experience with expiring unused tax attributes and tax planning alternatives. In making such judgments, significant weight is given to evidence that can be objectively verified.
47
Stock-based compensation
We account for stock-based compensation in accordance with the fair value recognition provisions of U.S. GAAP. We use the Black-Scholes model which requires the input of highly subjective assumptions. These assumptions include estimating the length of time employees will retain their vested stock options before exercising them, the estimated volatility of our common stock price over the expected term and the number of options that will ultimately not complete their vesting requirements. The assumptions for expected volatility and expected term are the two assumptions that significantly affect the grant date fair value. Changes in expected risk-free rate of return do not significantly impact the calculation of fair value, and determining this input is not highly subjective.
We use annualized historical stock price volatility which is deemed to be appropriate to serve as the expected volatility of our stock price and is assumed to be constant and prevailing. The expected term represents the weighted-average period that our stock options are expected to be outstanding. The expected life is based on the estimated average of the life of options using the “simplified” method, as prescribed in FASB ASC 718, due to insufficient historical exercise activity during recent years as a basis from which to estimate future exercise patterns.
Recent Accounting Pronouncements
See “Note 1 – Nature of Business and Summary of Significant Accounting Policies” of the Notes to Consolidated Financial Statements in Item 8. Financial Statements and Supplementary Data for a full description of recent accounting pronouncements including the respective expected dates of adoption and effects on Consolidated Balance Sheets and Consolidated Statements of Income.
Item 7A. Quantitative and Qualitative Disclosures about Market Risk.
Pursuant to Item 305(e) of Regulation S-K (§ 229.305(e)), the Company is not required to provide the information required by this Item as it is a “smaller reporting company,” as defined by Rule 229.10(f)(1).
Item 8. Financial Statements and Supplementary Data
The financial statements and supplementary data required by this item are included in a separate section of this Report. See “Index to Consolidated Financial Statements” on Page F-1.
48
GULF RESOURCES, INC.
AND SUBSIDIARIES
CONSOLIDATED FINANCIAL STATEMENTS
DECEMBER 31, 2014 and 2013
C O N T E N T S
|
PAGE
|
|
|
REPORT OF INDEPENDENT REGISTERED PUBLIC ACCOUNTING FIRMS
|
F-2
|
|
CONSOLIDATED BALANCE SHEETS
|
F-3
|
|
CONSOLIDATED STATEMENTS OF INCOME AND COMPREHENSIVE INCOME
|
F-4
|
|
CONSOLIDATED STATEMENT OF STOCKHOLDERS' EQUITY
|
F-5
|
|
CONSOLIDATED STATEMENTS OF CASH FLOWS
|
F-6 – F-7
|
|
NOTES TO CONSOLIDATED FINANCIAL STATEMENTS
|
F-8 – F-25
|
|
FINANCIAL STATEMENT SCHEDULE:
|
|
|
SCHEDULE I – PARENT ONLY FINANCIAL INFORMATION
|
S-1 – S-2
|
REPORT OF INDEPENDENT REGISTERED PUBLIC ACCOUNTING FIRM
To the Board of Directors and Stockholders of
Gulf Resources, Inc. and Subsidiaries
We have audited the accompanying consolidated balance sheets of Gulf Resources, Inc. and Subsidiaries (the "Company") as of December 31, 2014 and 2013, and the related consolidated statements of income and comprehensive income, stockholders’ equity, and cash flows for the years then ended. Our audits also included the financial statement schedule as of and for the years ended December 31, 2014 and 2013 listed in the Index at Item 15(a)2. These consolidated financial statements and financial statement schedule are the responsibility of the Company's management. Our responsibility is to express an opinion on these consolidated financial statements and financial statement schedule based on our audits.
We conducted our audits in accordance with the standards of the Public Company Accounting Oversight Board (United States). Those standards require that we plan and perform the audit to obtain reasonable assurance about whether the consolidated financial statements are free of material misstatement. The Company is not required to have, nor were we engaged to perform, an audit of its internal control over financial reporting. Our audits included consideration of internal control over financial reporting as a basis for designing audit procedures that are appropriate in the circumstances, but not for the purpose of expressing an opinion on the effectiveness of the Company’s internal control over financial reporting. Accordingly, we express no such an opinion. An audit includes examining, on a test basis, evidence supporting the amounts and disclosures in the financial statements. An audit also includes assessing the accounting principles used and significant estimates made by management, as well as evaluating the overall financial statement presentation. We believe that our audits provide a reasonable basis for our opinion.
In our opinion, the consolidated financial statements referred to above present fairly, in all material respects, the consolidated financial position of the Company at December 31, 2014 and 2013, and the consolidated results of their operations and their cash flows for the years then ended, in conformity with accounting principles generally accepted in the United States of America. Also, in our opinion, the related financial statement schedule as of and for the years ended December 31, 2014 and 2013, when considered in relation to the basic consolidated financial statements taken as a whole, presents fairly in all material respects the information set forth therein.
/s/ Morison Cogen LLP
Bala Cynwyd, Pennsylvania
March 13, 2015
F-2
|
GULF RESOURCES, INC.
|
|
|
AND SUBSIDIARIES
|
|
|
CONSOLIDATED BALANCE SHEETS
|
|
|
(Expressed in U.S. dollars)
|
|
As of December 31,
|
||||||||
|
2014
|
2013
|
|||||||
|
Current Assets
|
||||||||
|
Cash
|
$
|
146,585,601
|
$
|
107,828,800
|
||||
|
Accounts receivable
|
41,997,862
|
44,885,354
|
||||||
|
Inventories
|
5,367,868
|
5,301,995
|
||||||
|
Prepayments and deposits
|
86,301
|
4,583
|
||||||
|
Prepaid land leases
|
51,024
|
50,548
|
||||||
|
Other receivables
|
38,272
|
-
|
||||||
|
Deferred tax assets
|
864
|
1,657
|
||||||
|
Total Current Assets
|
194,127,792
|
158,072,937
|
||||||
|
Non-Current Assets
|
||||||||
|
Property, plant and equipment, net
|
124,350,781
|
146,400,436
|
||||||
|
Property, plant and equipment under capital leases, net
|
1,339,602
|
1,701,328
|
||||||
|
Prepaid land leases, net of current portion
|
733,560
|
753,928
|
||||||
|
Deferred tax assets
|
2,430,417
|
2,316,176
|
||||||
|
Total non-current assets
|
128,854,360
|
151,171,868
|
||||||
|
Total Assets
|
$
|
322,982,152
|
$
|
309,244,805
|
||||
|
Liabilities and Stockholders’ Equity
|
||||||||
|
Current Liabilities
|
||||||||
|
Accounts payable and accrued expenses
|
$
|
4,004,728
|
$
|
5,645,831
|
||||
|
Retention payable
|
326,959
|
209,126
|
||||||
|
Capital lease obligation, current portion
|
205,128
|
202,392
|
||||||
|
Taxes payable
|
3,545,429
|
5,248,486
|
||||||
|
Total Current Liabilities
|
8,082,244
|
11,305,835
|
||||||
|
Non-Current Liabilities
|
||||||||
|
Capital lease obligation, net of current portion
|
2,826,495
|
2,943,878
|
||||||
|
Total Liabilities
|
$
|
10,908,739
|
$
|
14,249,713
|
||||
|
|
||||||||
|
Stockholders’ Equity
|
||||||||
|
PREFERRED STOCK; $0.001 par value; 1,000,000 shares authorized; none outstanding
|
$
|
$
|
||||||
|
COMMON STOCK; $0.0005 par value; 80,000,000 shares authorized; 38,911,014 and 38,765,201 shares issued; and 38,672,865 and 38,580,602 shares outstanding as of December 31, 2014 and 2013, respectively
|
19,456
|
19,383
|
||||||
|
Treasury stock; 238,149 and 184,599 shares as of December 31, 2014 and 2013
|
(561,728
|
)
|
(500,000
|
)
|
||||
|
Additional paid-in capital
|
80,380,008
|
80,033,981
|
||||||
|
Retained earnings unappropriated
|
183,480,402
|
166,421,427
|
||||||
|
Retained earnings appropriated
|
18,078,392
|
17,265,572
|
||||||
|
Cumulative translation adjustment
|
30,676,883
|
31,754,729
|
||||||
|
Total Stockholders’ Equity
|
312,073,413
|
294,995,092
|
||||||
|
Total Liabilities and Stockholders’ Equity
|
$
|
322,982,152
|
$
|
309,244,805
|
||||
The accompanying notes are an integral part of these consolidated financial statements.
F-3
|
GULF RESOURCES, INC.
|
|
AND SUBSIDIARIES
|
|
CONSOLIDATED STATEMENTS OF INCOME AND COMPREHENSIVE INCOME
|
|
(Expressed in U.S. dollars)
|
|
Years Ended December 31,
|
||||||||
|
2014
|
2013
|
|||||||
|
NET REVENUE
|
||||||||
|
Net revenue
|
$
|
113,660,331
|
$
|
118,391,783
|
||||
|
OPERATING EXPENSES / INCOME
|
||||||||
|
Cost of net revenue
|
(81,737,610
|
)
|
(84,209,136
|
)
|
||||
|
Sales, marketing and other operating expenses
|
(105,588
|
)
|
(96,372
|
)
|
||||
|
Research and development cost
|
(134,292
|
)
|
(140,445
|
)
|
||||
|
Exploration cost
|
(488,880
|
)
|
-
|
|||||
|
Write-off / Impairment on property, plant and equipment
|
(673,705
|
)
|
(27,964
|
)
|
||||
|
Loss from disposal of property, plant and equipment
|
(9,866
|
)
|
-
|
|||||
|
General and administrative expenses
|
(7,161,047
|
)
|
(8,563,282
|
)
|
||||
|
Gain on relocation of factory
|
-
|
2,501,336
|
||||||
|
Other operating income
|
468,878
|
587,573
|
||||||
|
(89,842,110
|
)
|
(89,948,290
|
)
|
|||||
|
INCOME FROM OPERATIONS
|
23,818,221
|
28,443,493
|
||||||
|
OTHER INCOME (EXPENSES)
|
|
|||||||
|
Interest expense
|
(203,296
|
)
|
(208,250
|
)
|
||||
|
Interest income
|
482,885
|
339,798
|
||||||
|
279,589
|
131,548
|
|||||||
|
INCOME BEFORE TAXES
|
24,097,810
|
28,575,041
|
||||||
|
INCOME TAXES
|
(6,226,015
|
)
|
(7,607,683
|
)
|
||||
|
NET INCOME
|
$
|
17,871,795
|
$
|
20,967,358
|
||||
|
COMPREHENSIVE INCOME:
|
||||||||
|
NET INCOME
|
17,871,795
|
20,967,358
|
||||||
|
OTHER COMPREHENSIVE INCOME
|
||||||||
|
- Foreign currency translation adjustments
|
(1,077,846
|
)
|
9,258,450
|
|||||
|
COMPREHENSIVE INCOME
|
$
|
16,793,949
|
$
|
30,225,808
|
||||
|
EARNINGS PER SHARE
|
||||||||
|
BASIC
|
$
|
0.46
|
$
|
0.55
|
||||
|
DILUTED
|
$
|
0.46
|
$
|
0.54
|
||||
|
WEIGHTED AVERAGE NUMBER OF SHARES
|
||||||||
|
BASIC
|
38,694,567
|
38,395,921
|
||||||
|
DILUTED
|
39,260,627
|
38,827,330
|
||||||
The accompanying notes are an integral part of these consolidated financial statements.
F-4
GULF RESOURCES, INC.
AND SUBSIDIARIES
CONSOLIDATED STATEMENTS OF STOCKHOLDERS’ EQUITY
YEARS ENDED DECEMBER 31, 2014 AND 2013
(Expressed in U.S. dollars)
|
Common stock
|
||||||||||||||||||||||||||||||||||||||||
|
Number
|
Number
|
Number
|
Additional
|
Retained
|
Retained
|
Cumulative
|
||||||||||||||||||||||||||||||||||
|
of shares
|
of shares
|
of treasury
|
Treasury
|
paid-in
|
earnings
|
earnings
|
translation
|
|||||||||||||||||||||||||||||||||
|
issued
|
outstanding
|
stock
|
Amount
|
stock
|
capital
|
appropriated
|
unappropriated
|
adjustment
|
Total
|
|||||||||||||||||||||||||||||||
|
$
|
$
|
$
|
$
|
$
|
$
|
$
|
||||||||||||||||||||||||||||||||||
|
BALANCE AT
JANUARY 1, 2013
|
38,552,070 | 38,367,471 | 184,599 | 19,276 | (500,000 | ) | 79,489,188 | 15,973,887 | 146,745,754 | 22,496,279 | 264,224,384 | |||||||||||||||||||||||||||||
|
Translation adjustment
|
-
|
- | - |
-
|
- |
-
|
-
|
-
|
9,258,450 | 9,258,450 | ||||||||||||||||||||||||||||||
|
Common stock issued for exercising stock options
|
213,131 | 213,131 | - | 107 | - | (107 | ) | - | - | - | - | |||||||||||||||||||||||||||||
|
Issuance of stock options to employees
|
- | - | - | - | - | 544,900 | - | - | - | 544,900 | ||||||||||||||||||||||||||||||
|
Net income for year ended
December 31, 2013
|
-
|
- | - |
-
|
- |
-
|
-
|
20,967,358 |
-
|
20,967,358 | ||||||||||||||||||||||||||||||
|
Transfer to statutory common reserve fund
|
-
|
- | - |
-
|
- |
-
|
1,291,685
|
(1,291,685 | ) |
-
|
- | |||||||||||||||||||||||||||||
|
BALANCE AT
DECEMBER 31, 2013
|
38,765,201 | 38,580,602 | 184,599 | 19,383 | (500,000 | ) | 80,033,981 | 17,265,572 | 166,421,427 | 31,754,729 | 294,995,092 | |||||||||||||||||||||||||||||
|
BALANCE AT
JANUARY 1, 2014
|
38,765,201 | 38,580,602 | 184,599 | 19,383 | (500,000 | ) | 80,033,981 | 17,265,572 | 166,421,427 | 31,754,729 | 294,995,092 | |||||||||||||||||||||||||||||
|
Translation adjustment
|
-
|
- | - |
-
|
-
|
-
|
-
|
(1,077,846 | ) | (1,077,846 | ) | |||||||||||||||||||||||||||||
|
Common stock repurchased
|
- | (53,550 | ) | 53,550 | (61,728 | ) | - | - | - | - | (61,728 | ) | ||||||||||||||||||||||||||||
|
Cashless exercise of stock options
|
145,813 | 145,813 | - | 73 | - | (73 | ) | - | - | - | - | |||||||||||||||||||||||||||||
|
Issuance of stock options to employees
|
- | - | - | - | - | 346,100 | - | - | - | 346,100 | ||||||||||||||||||||||||||||||
|
Net income for year ended
December 31, 2014
|
-
|
- | - |
-
|
- |
-
|
-
|
17,871,795 |
-
|
17,871,795 | ||||||||||||||||||||||||||||||
|
Transfer to statutory common reserve fund
|
-
|
- | - |
-
|
- |
-
|
812,820
|
(812,820 | ) |
-
|
- | |||||||||||||||||||||||||||||
|
BALANCE AT
DECEMBER 31, 2014
|
38,911,014 | 38,672,865 | 238,149 | 19,456 | (561,728 | ) | 80,380,008 | 18,078,392 | 183,480,402 | 30,676,883 | 312,073,413 | |||||||||||||||||||||||||||||
The accompanying notes are an integral part of these consolidated financial statements.
F-5
|
GULF RESOURCES, INC.
|
||||||||
|
AND SUBSIDIARIES
|
||||||||
|
CONSOLIDATED STATEMENTS OF CASH FLOWS
|
||||||||
|
(Expressed in U.S. dollars)
|
||||||||
|
Years Ended December 31,
|
||||||||
|
2014
|
2013
|
|||||||
|
CASH FLOWS FROM OPERATING ACTIVITIES
|
||||||||
|
Net income
|
$
|
17,871,795
|
$
|
20,967,358
|
||||
|
Adjustments to reconcile net income to
net cash provided by operating activities:
|
||||||||
|
Interest on capital lease obligation
|
202,656
|
207,393
|
||||||
|
Amortization of prepaid land leases
|
680,551
|
660,002
|
||||||
|
Depreciation and amortization
|
27,642,222
|
27,460,693
|
||||||
|
Allowance for obsolete and slow-moving inventories
|
(3,174
|
)
|
(21,265
|
)
|
||||
|
Write-off / Impairment loss on property, plant and equipment
|
673,705
|
27,964
|
||||||
|
Loss from disposal of property, plant and equipment
|
9,866
|
-
|
||||||
|
Gain on relocation of factory
|
-
|
(2,501,336
|
)
|
|||||
|
Demolition expenditure net off against gain on relocation of factory
|
-
|
(1,059,965
|
)
|
|||||
|
Currency translation adjustment on inter-company balances
|
(92,412
|
)
|
774,405
|
|||||
|
Deferred tax asset
|
(121,436
|
)
|
5,502
|
|||||
|
Stock-based compensation expense
|
346,100
|
544,900
|
||||||
|
Changes in assets and liabilities:
|
||||||||
|
Accounts receivable
|
2,751,676
|
(7,777,332
|
)
|
|||||
|
Inventories
|
(84,777
|
)
|
879,952
|
|||||
|
Prepayment and deposits
|
(80,673
|
)
|
(4,583
|
)
|
||||
|
Accounts payable and accrued expenses
|
(1,616,195
|
)
|
(1,057,016
|
)
|
||||
|
Retention payable
|
117,905
|
(1,233,988
|
)
|
|||||
|
Other receivables
|
(38,272
|
)
|
18,000
|
|||||
|
Taxes payable
|
(1,685,760
|
)
|
2,260,588
|
|||||
|
Net cash provided by operating activities
|
46,573,777
|
40,151,272
|
||||||
|
CASH FLOWS FROM INVESTING ACTIVITIES
|
||||||||
|
Additions of prepaid land leases
|
(664,106
|
)
|
(638,076
|
)
|
||||
|
Proceeds from sales of property, plant and equipment
|
21,514
|
143
|
||||||
|
Purchase of property, plant and equipment
|
(6,538,611
|
)
|
(3,192,681
|
)
|
||||
|
Compensation proceeds received
|
-
|
3,868,483
|
||||||
|
Net cash provided by (used in) investing activities
|
(7,181,203
|
)
|
37,869
|
|||||
|
CASH FLOWS FROM FINANCING ACTIVITIES
|
||||||||
|
Repurchase of common stock
|
(61,728
|
)
|
-
|
|||||
|
Repayment of capital lease obligation
|
(304,806
|
)
|
(302,497
|
)
|
||||
|
Net cash used in financing activities
|
(366,534
|
)
|
(302,497
|
)
|
||||
|
EFFECTS OF EXCHANGE RATE CHANGES
ON CASH AND CASH EQUIVALENTS
|
(269,239
|
)
|
2,701,121
|
|||||
|
NET INCREASE IN CASH AND CASH EQUIVALENTS
|
38,756,801
|
42,587,765
|
||||||
|
CASH AND CASH EQUIVALENTS - BEGINNING OF YEAR
|
107,828,800
|
65,241,035
|
||||||
|
CASH AND CASH EQUIVALENTS - END OF YEAR
|
$
|
146,585,601
|
$
|
107,828,800
|
||||
F-6
|
GULF RESOURCES, INC.
|
|
AND SUBSIDIARIES
|
|
CONSOLIDATED STATEMENTS OF CASH FLOWS (CONTINUED)
|
|
(Expressed in U.S. dollars)
|
|
Years Ended December 31,
|
||||||||
|
2014
|
2013
|
|||||||
|
SUPPLEMENTAL DISCLOSURE OF CASH FLOW INFORMATION
|
|
|
||||||
|
Cash paid during the year for:
|
|
|
||||||
|
Income taxes
|
$
|
7,604,071
|
$
|
5,605,116
|
||||
|
SUPPLEMENTAL DISCLOSURE OF NON-CASH INVESTING
AND FINANCING ACTIVITIES
|
||||||||
|
Issuance of common stock upon cashless exercise of options
|
$
|
73
|
$
|
107
|
||||
The accompanying notes are an integral part of these consolidated financial statements.
F-7
GULF RESOURCES, INC.
AND SUBSIDIARIES
NOTES TO CONSOLIDATED FINANCIAL STATEMENTS
DECEMBER 31, 2014
(Expressed in U.S. dollars)
NOTE 1 – NATURE OF BUSINESS AND SUMMARY OF SIGNIFICANT ACCOUNTING POLICIES
(a) Basis of Presentation
The accompanying audited consolidated financial statements have been prepared by Gulf Resources, Inc. a Delaware corporation and its subsidiaries (collectively, the “Company”).
Upper Class Group Limited was incorporated with limited liability in the British Virgin Islands on July 28, 2006 and was inactive until October 9, 2006 when Upper Class Group Limited acquired all the issued and outstanding stock of Shouguang City Haoyuan Chemical Company Limited (“SCHC”). SCHC is an operating company incorporated in Shouguang City, Shangdong Province, the People’s Republic of China (the “PRC”) on May 18, 2005. SCHC is engaged in manufacturing and trading bromine and crude salt in China. Since the ownership of Upper Class Group Limited and SCHC were the same, the merger was accounted for as a transaction between entities under common control, whereby Upper Class Group Limited recognized the assets and liabilities transferred at their carrying amounts.
On December 12, 2006, Gulf Resources, Inc. (formerly Diversifax, Inc.), a public “shell” company, acquired Upper Class Group Limited and its wholly-owned subsidiary, SCHC (together “Upper Class”). Under the terms of the agreement, all stockholders of Upper Class received a total amount of 13,250,000 (restated for the 2-for-1 stock split in 2007 and the 1-for-4 stock split in 2009) shares of voting common stock of Gulf Resources, Inc. in exchange for all shares of Upper Class’ common stock held by all stockholders. Under accounting principles generally accepted in the United States, the share exchange is considered to be a capital transaction in substance, rather than a business combination. That is, the share exchange is equivalent to the issuance of stock by Upper Class for the net monetary assets of Gulf Resources, Inc., accompanied by a recapitalization, and is accounted for as a change in capital structure. Accordingly, the accounting for the share exchange will be identical to that resulting from a reverse acquisition, except no goodwill will be recorded. Under reverse takeover accounting, the post reverse acquisition comparative historical financial statements of the legal acquirer, Gulf Resources, Inc., are those of the legal acquiree, Upper Class, which is considered to be the accounting acquirer. Share and per share amounts stated have been retroactively adjusted to reflect the merger.
On February 5, 2007, SCHC acquired Shouguang Yuxin Chemical Industry Co., Limited (“SYCI”), a company incorporated in PRC on October 30, 2000. SYCI manufactures chemical products utilized in oil and gas field explorations and as papermaking chemical agents. Under the terms of the merger agreement, all stockholders of SYCI received a total amount of 8,094,059 (restated for the 2-for-1 stock split in 2007 and the 1-for-4 stock split in 2009) shares of voting common stock of Gulf Resources, Inc. in exchange for all shares of SYCI’s common stock held by all stockholders. Also, upon the completion of the merger, Gulf Resources, Inc. paid a $2,550,000 dividend to the original stockholders of SYCI. Since the ownership of Gulf Resources, Inc. and SYCI are substantially the same, the merger was accounted for as a transaction between entities under common control, whereby Gulf Resources, Inc. recognized the assets and liabilities of the Company transferred at their carrying amounts. Share and per share amounts stated have been retroactively adjusted to reflect the merger.
On November 11, 2007, Upper Class formed Hong Kong Jiaxing Industrial Limited (formerly known as Jiaxing Technology Limited) (“HKJI”), a wholly-owned subsidiary of Upper Class, in Hong Kong. Upper Class transferred its equity interest in SCHC to HKJI.
(b) Nature of the Business
The Company manufactures and trades bromine and crude salt through SCHC, and manufactures chemical products for use in the oil industry and paper manufacturing industry through SYCI.
F-8
NOTE 1 – NATURE OF BUSINESS AND SUMMARY OF SIGNIFICANT ACCOUNTING POLICIES – Continued
(c) Basis of Consolidation
The consolidated financial statements include the accounts of Gulf Resources, Inc. and its wholly-owned subsidiaries, Upper Class, a company incorporated in the British Virgin Islands, which owns 100% of HKJI, a company incorporated in Hong Kong, which owns 100% of SCHC and SYCI, which is 100% owned by SCHC. All material intercompany transactions have been eliminated on consolidation.
(d) Use of Estimates
The Company’s consolidated financial statements have been prepared in accordance with accounting principles generally accepted in the United States of America and this requires management to make estimates and assumptions that affect the reported amounts of assets and liabilities at the date of the consolidated financial statements and the reported amounts of revenues and expenses during the reporting period. The Company bases its estimates on historical experience and on various other assumptions that are believed to be reasonable under the circumstances. The most significant accounting estimates with regard to these consolidated financial statements that require the most significant and subjective judgments include, but are not limited to, useful lives of property, plant and equipment, recoverability of long-lived assets, determination of impairment losses, assessment of market value of inventories and provision for inventory obsolescence, allowance for doubtful accounts, recognition and measurement of current and deferred income taxes, valuation allowance for deferred tax assets, and assumptions used for the valuation of share based payments. Accordingly, actual results may differ significantly from these estimates under different assumptions or conditions.
(e) Cash and Cash Equivalents
Cash and cash equivalents consist of all cash balances and highly liquid investments with original maturities of three months or less. Because of short maturity of these investments, the carrying amounts approximate their fair values.
(f) Accounts Receivable and Allowance of Doubtful Accounts
Accounts receivable is stated at cost, net of allowance for doubtful accounts. The normal credit term extended to customers ranges between 90 and 180 days. The company reviews all receivables that exceed the term. The Company establishes an allowance for doubtful accounts based on management’s assessment of the collectability of trade and other receivables. A considerable amount of judgment is required in assessing the amount of allowance and the Company considers the historical level of credit losses. The Company makes judgments about the credit worthiness of each customer based on ongoing credit evaluations, and monitors current economic trends that might impact the level of credit losses in the future. If the financial condition of the customer begins to deteriorate, resulting in their inability to make payments within credit term provided, a larger allowance may be required.
As of December 31, 2014 and 2013, allowances for doubtful accounts were nil. No allowances for doubtful accounts were charged to the income statement for the years ended December 31, 2014 and 2013.
(g) Concentration of Credit Risk
The Company is exposed to credit risk in the normal course of business, primarily related to accounts receivable and cash and cash equivalents. Substantially all of the Company’s cash and cash equivalents are maintained with financial institutions in the PRC, namely, Industrial and Commercial Bank of China Limited and China Merchants Bank Company Limited, which are not insured or otherwise protected. The Company placed $146,585,601 and $107,828,800 with these institutions as of December 31, 2014 and 2013, respectively. The Company has not experienced any losses in such accounts in the PRC.
Concentrations of credit risk with respect to accounts receivable exists as the Company sells a substantial portion of its products to a limited number of customers. However, such concentrations of credit risks are limited since the Company performs ongoing credit evaluations of its customers’ financial condition. About 66.5% and 73.9% of the balances of accounts receivable as of December 31, 2014 and December 31, 2013, respectively, were outstanding for those which are 90 days old or less. For the balances of accounts receivable aged more than 90 days as of December 31, 2014, 84% were settled in the two months ended February 28, 2015.
F-9
NOTE 1 – NATURE OF BUSINESS AND SUMMARY OF SIGNIFICANT ACCOUNTING POLICIES – Continued
(h) Inventories
Inventories are stated at the lower of cost, determined on a first-in first-out cost basis, or market. Costs of work-in-progress and finished goods comprise direct materials, direct labor and an attributable portion of manufacturing overhead. Net realizable value is based on estimated selling price less costs to complete and selling expenses.
(i) Property, Plant and Equipment
Property, plant and equipment are stated at cost less accumulated depreciation and any impairment losses. Expenditures for new facilities or equipment, and major expenditures for betterment of existing facilities or equipment are capitalized and depreciated using the straight-line method at rates sufficient to depreciate such costs less 5% residual value over the estimated productive lives. All other ordinary repair and maintenance costs are expensed as incurred.
Mineral rights are recorded at cost less accumulated depreciation and any impairment losses. Mineral rights are amortized ratably over the term of the lease, or the equivalent term under the units (in tonnes) of production method, whichever is shorter.
Construction in progress primarily represents direct costs of construction of property, plant and equipment. Costs incurred are capitalized and transferred to property, plant and equipment upon completion, at which time depreciation commences.
The Company’s depreciation and amortization policies on property, plant and equipment other than mineral rights and construction in progress are as follows:
|
Useful life
(in years)
|
|
|
Buildings (including salt pans)
|
8 - 20
|
|
Plant and machinery (including protective shells, transmission channels and ducts)
|
5 - 8
|
|
Motor vehicles
|
5
|
|
Furniture, fixtures and equipment
|
8
|
Property, plant and equipment under capital leases are depreciated over their expected useful lives on the same basis as owned assets, or where shorter, the term of the lease, which is 20 years.
(j) Asset Retirement Obligation
The Company follows FASB ASC 410, which established a uniform methodology for accounting for estimated reclamation and abandonment costs. FASB ASC 410 requires the fair value of a liability for an asset retirement obligation to be recognized in the period in which the legal obligation associated with the retirement of the long-lived asset is incurred. When the liability is initially recorded, the offset is capitalized by increasing the carrying amount of the related long-lived asset. Over time, the liability is accreted to its present value each period, and the capitalized cost is depreciated over the useful life of the related asset. To settle the liability, the obligation is paid, and to the extent there is a difference between the liability and the amount of cash paid, a gain or loss upon settlement is recorded.
Currently, there are no reclamation or abandonment obligations associated with the land being utilized for exploitation.
F-10
NOTE 1 – NATURE OF BUSINESS AND SUMMARY OF SIGNIFICANT ACCOUNTING POLICIES – Continued
(k) Recoverability of Long Lived Assets
In accordance with ASC 360-10-35 “Impairment or Disposal of Long-lived Assets”, long-lived assets to be held and used are analyzed for impairment whenever events or changes in circumstances indicate that the carrying amount of an asset may not be fully recoverable or that the useful lives of those assets are no longer appropriate. The Company evaluates at each balance sheet date whether events and circumstances have occurred that indicate possible impairment.
The Company determines the existence of such impairment by measuring the expected future cash flows (undiscounted and without interest charges) and comparing such amount to the carrying amount of the assets. An impairment loss, if one exists, is then measured as the amount by which the carrying amount of the asset exceeds the discounted estimated future cash flows. Assets to be disposed of are reported at the lower of the carrying amount or fair value of such assets less costs to sell. Asset impairment charges are recorded to reduce the carrying amount of the long-lived asset that will be sold or disposed of to their estimated fair values. Charges for the asset impairment reduce the carrying amount of the long-lived assets to their estimated salvage value in connection with the decision to dispose of such assets.
For the year ended December 31, 2014, certain property, plant and machinery, with net book values of $673,705, respectively, were replaced during the third phase enhancement project to protective shells for transmission channels and ducts for Factory No 10 and 11, write-offs of the same amounts, were made and included in write-off/impairment on property, plant and equipment.
There is no impairment loss in fiscal year 2014.
(l) Retirement Benefits
Pursuant to the relevant laws and regulations in the PRC, the Company participates in a defined contribution retirement plan for its employees arranged by a governmental organization. The Company makes contributions to the retirement scheme at the applicable rate based on the employees’ salaries. The required contributions under the retirement plans are charged to the consolidated income statement on an accrual basis when they are due. The Company’s contributions totaled $707,086 and $495,894 for the years ended December 31, 2014 and 2013, respectively.
(m) Mineral Rights
The Company follows FASB ASC 805 “Business Combinations” that certain mineral rights are considered tangible assets and that mineral rights should be accounted for based on their substance. Mineral rights are included in property, plant and equipment.
(n) Leasing arrangements
Rentals payable under operating leases are charged to the statements of income on a straight line basis over the term of the relevant lease. For capital leases, the present value of future minimum lease payments at the inception of the lease is reflected as an asset and a liability in the statement of financial position. Amounts due within one year are classified as short-term liabilities and the remaining balance as long-term liabilities.
F-11
NOTE 1 – NATURE OF BUSINESS AND SUMMARY OF SIGNIFICANT ACCOUNTING POLICIES – Continued
(o) Reporting Currency and Translation
The financial statements of the Company’s foreign subsidiaries are measured using the local currency, Renminbi (“RMB”), as the functional currency; whereas the functional currency and reporting currency of the Company is the United States dollar (“USD” or “$”).
As such, the Company uses the “current rate method” to translate its PRC operations from RMB into USD, as required under ASC 830 “Foreign Currency Matters”. The assets and liabilities of its PRC operations are translated into USD using the rate of exchange prevailing at the balance sheet date. The capital accounts are translated at the historical rate. Adjustments resulting from the translation of the balance sheets of the Company’s PRC subsidiaries are recorded in stockholders’ equity as part of accumulated comprehensive income. The statement of income and comprehensive income is translated at average rates during the reporting period. Gains or losses resulting from transactions in currencies other than the functional currencies are recognized in net income for the reporting periods as part of general and administrative expense. Included in the general and administrative expense is a foreign exchange gain of $92,412 and a foreign exchange loss of $774,405 for the years ended December 31, 2014 and 2013. The statement of cash flows is translated at average rates during the reporting period, with the exception of issuance of shares and payment of dividends which are translated at historical rates.
(p) Foreign Operations
All of the Company’s operations and assets are located in PRC. The Company may be adversely affected by possible political or economic events in this country. The effect of these factors cannot be accurately predicted.
(q) Revenue Recognition
The Company recognizes revenue, net of value-added tax, when persuasive evidence of an arrangement exists, delivery of the goods has occurred, customer acceptance has been obtained, which means the significant risks and ownership have been transferred to the customer, the price is fixed or determinable and collectability is reasonably assured.
(r) Income Taxes
The Company accounts for income taxes in accordance with the Income Taxes Topic of the FASB ASC, which requires the use of the liability method of accounting for deferred income taxes. Under this method, deferred income taxes are recorded to reflect the tax consequences on future years of temporary differences between the tax basis of assets and liabilities and their reported amounts at each period end. If it is more likely than not that some portion or all of a deferred tax asset will not be realized, a valuation allowance is recognized. The guidance also provides criteria for the recognition, measurement, presentation and disclosures of uncertain tax positions. A tax benefit from an uncertain tax position may be recognized if it is “more likely than not” that the position is sustainable based solely on its technical merits.
(s) Exploration Costs
Exploration costs, which included the cost of researching appropriate places to drill wells and the cost of actual drilling of potential natural brine or other resources, were charged to the income statement as incurred. The company incurred total $488,880 exploration cost during the fiscal year 2014.
(t) Contingencies
The Company accrues for costs relating to litigation, including litigation defense costs, claims and other contingent matters, including liquidated damage liabilities, when such liabilities become probable and reasonably estimable. Such estimates may be based on advice from third parties or on management’s judgment, as appropriate. Revisions to accruals are reflected in earnings (loss) in the period in which different facts or information become known or circumstances change that affect the Company’s previous assumptions with respect to the likelihood or amount of loss. Amounts paid upon the ultimate resolution of such liabilities may be materially different from previous estimates.
F-12
NOTE 1 – NATURE OF BUSINESS AND SUMMARY OF SIGNIFICANT ACCOUNTING POLICIES – Continued
(u) Stock-based Compensation
Common stock, stock options and stock warrants issued to employees or directors are recorded at their fair values estimated at grant date using the Black-Scholes model and the portion that is ultimately expected to vest is recognized as compensation cost over the requisite service period.
Common stock, stock options and stock warrants issued to other than employees or directors are recorded on the basis of their fair value using the Black-Scholes model on the basis of the market price of the underlying common stock on the “valuation date,” which for options and warrants related to contracts that have substantial disincentives to non-performance is the date of the contract, and for all other contracts the measurement date is the date that the service is complete. Expense related to the options and warrants is recognized on a straight-line basis over the shorter of the period over which services are to be received or the vesting period. Where expense must be recognized prior to a valuation date, the expense is computed under the Black-Scholes model on the basis of the market price of the underlying common stock at the end of the period, and any subsequent changes in the market price of the underlying common stock up through the valuation date is reflected in the expense recorded in the subsequent period in which that change occurs.
(v) Basic and Diluted Net Income per Share of Common Stock
Basic earnings per common share are based on the weighted average number of shares outstanding during the periods presented. Diluted earnings per share are computed using weighted average number of common shares plus dilutive common share equivalents outstanding during the period. Potential common shares that would have the effect of increasing diluted earnings per share are considered to be anti-dilutive, i.e. the exercise prices of the outstanding stock options were greater than the market price of the common stock. Anti-dilutive common stock equivalents which were excluded from the calculation of number of dilutive common stock equivalents amounted to 2,175,088 and 3,473,441 shares for the years ended December 31, 2014 and 2013, respectively.
The following table sets forth the computation of basic and diluted earnings per share:
|
Years ended December 31,
|
||||||||
|
2014
|
2013
|
|||||||
|
Numerator
|
||||||||
|
Net income
|
$ | 17,871,795 | $ | 20,967,358 | ||||
|
Denominator
|
||||||||
|
Basic: Weighted-average common shares
outstanding during the year
|
38,694,567 | 38,395,921 | ||||||
|
Add: Dilutive effect of stock options
|
566,060 | 431,409 | ||||||
|
Diluted
|
39,260,627 | 38,827,330 | ||||||
|
Net income per share
|
||||||||
|
Basic
|
$ | 0.46 | $ | 0.55 | ||||
|
Diluted
|
$ | 0.46 | $ | 0.54 | ||||
F-13
NOTE 1 – NATURE OF BUSINESS AND SUMMARY OF SIGNIFICANT ACCOUNTING POLICIES – Continued
(w) New Accounting Pronouncements
As of December 31,2014 and for the year then ended, there were no recently adopted accounting pronouncements that had a material effect on the Company’s consolidated financial statements. As of December 31, 2014, there were no recently issued accounting standards not yet adopted which would have a material effect on the Company’s consolidated financial statements through 2016.
F-14
NOTE 2 – INVENTORIES
Inventories consist of:
|
As of December 31,
|
||||||||
|
2014
|
2013
|
|||||||
|
Raw materials
|
$
|
625,160
|
$
|
651,810
|
||||
|
Finished goods
|
4,746,163
|
4,656,814
|
||||||
|
Allowance for obsolete and slow-moving inventories
|
(3,455
|
)
|
(6,629
|
)
|
||||
|
|
$
|
5,367,868
|
$
|
5,301,995
|
||||
NOTE 3 – PREPAID LAND LEASE
The Company prepaid for land leases with lease terms for periods ranging from one to fifty years to use the land on which the office premises, production facilities and warehouses of the Company are situated. The prepaid land lease is amortized on a straight line basis.
During the year ended December 31, 2014, amortization of prepaid land lease totaled $680,551, which was recorded as cost of net revenue.
During the year ended December 31, 2013, amortization of prepaid land lease totaled $660,002, which was recorded as cost of net revenue.
The Company has the rights to use certain parcels of land located in Shouguang, the PRC, through lease agreements signed with local townships. Such parcels of land are collectively owned by local townships and accordingly, the Company could not obtain land use rights certificates on these parcels of land. The parcels of land of which the Company could not obtain land use rights certificates covers a total of approximately 59.39 square kilometers of aggregate carrying value of $742,820 and approximately 59.39 square kilometers square meters of aggregate carrying value of $761,496 as at December 31, 2014 and 2013, respectively.
NOTE 4– PROPERTY, PLANT AND EQUIPMENT, NET
Property, plant and equipment, net consist of the following:
|
As of December 31,
|
||||||||
|
2014
|
2013
|
|||||||
|
At cost:
|
||||||||
|
Mineral rights
|
$
|
6,506,668
|
$
|
6,530,158
|
||||
|
Buildings
|
53,231,127
|
53,343,419
|
||||||
|
Plant and machinery
|
177,485,689
|
172,842,611
|
||||||
|
Motor vehicles
|
9,389
|
9,423
|
||||||
|
Furniture, fixtures and office equipment
|
4,884,991
|
4,902,627
|
||||||
|
Total
|
242,117,864
|
237,628,238
|
||||||
|
Less: accumulated depreciation and amortization
|
(117,767,083
|
)
|
(91,227,802
|
)
|
||||
|
Net book value
|
$
|
124,350,781
|
$
|
146,400,436
|
||||
The Company has certain buildings and salt pans erected on parcels of land located in Shouguang, PRC, and such parcels of land are collectively owned by local townships. The Company has not been able to obtain property ownership certificates over these buildings and salt pans as the Company could not obtain land use rights certificates on the underlying parcels of land. The Company could not obtain property ownership certificates covering certain properties of aggregate carrying value of $37,219,221 and $39,565,302 as at December 31, 2014 and 2013, respectively.
During the year ended December 31, 2014, depreciation and amortization expense totaled $27,287,976 of which $25,811,070 and $1,476,906 were recorded as cost of net revenue and administrative expenses, respectively.
During the year ended December 31, 2013, depreciation and amortization expense totaled $27,109,455 of which $25,311,885 and $1,797,570 were recorded as cost of net revenue and administrative expenses, respectively.
F-15
NOTE 4 – PROPERTY, PLANT AND EQUIPMENT, NET – Continued
In late September 2013, the Transportation Bureau of Dongying City and other local government agencies requested to requisition the land where the original Factory No. 3 of SCHC was located for railway construction.
The operations of the original Factory No. 3 were stopped in September 2013 to allow for the demolition and relocation of the factory. During the relocation, net book value of plant and machinery of $ 307,182 was written off and demolition costs of $1,059,965 were incurred. A new factory was constructed for the amount of $3,186,609 on the same piece of land near to the where the original factory was located. The relocation and the construction of the new factory were completed in December 2013 and the new Factory No. 3 started operations in the same month.
Upon completion of demolition and clearance of all ground fixtures in October 2013, a sum of $3,868,483 was received in the same month from the Transportation Bureau of Dongying City and other local government agencies as compensation for the demolition of original Factory No. 3. The write-off and demolition costs were offset against the compensation proceeds resulting in a net gain on location of factory of $2,501,336. This is included in the income statement for the year ended December 31, 2013 as gain on relocation of factory. This is accounted for in accordance with Financial Accounting Standards Board (“FASB”) Accounting Standards Codification (“ASC”) 605-40 “Revenue Recognition – Gains and Losses”.
In the third quarter of 2014, the Company incurred enhancement works in Factories No. 10 and 11 at costs of approximately $6,424,406 to the protective shells to transmission channels and ducts. The above enhancement projects have estimated useful lives of 5 to 8 years and are capitalized as buildings and plant and machinery.
For the years ended December 31, 2014 and 2013, ordinary repair and maintenance expenses were $1,050,204 and $1,566, respectively.
F-16
NOTE 5 – PROPERTY, PLANT AND EQUIPMENT UNDER CAPITAL LEASES, NET
Property, plant and equipment under capital leases, net consist of the following:
|
As of December 31,
|
||||||||
|
2014
|
2013
|
|||||||
|
At cost:
|
||||||||
|
Buildings
|
$
|
134,489
|
$
|
134,975
|
||||
|
Plant and machinery
|
2,528,007
|
2,537,133
|
||||||
|
Total
|
2,662,496
|
2,672,108
|
||||||
|
Less: accumulated depreciation and amortization
|
(1,322,894
|
)
|
(970,780
|
)
|
||||
|
Net book value
|
$
|
1,339,602
|
$
|
1,701,328
|
||||
The above buildings erected on parcels of land located in Shouguang, PRC, are collectively owned by local townships. The Company has not been able to obtain property ownership certificates over these buildings as the Company could not obtain land use rights certificates on the underlying parcels of land.
During the year ended December 31, 2014, depreciation and amortization expense totaled $354,246, which was recorded as cost of sales.
During the year ended December 31, 2013, depreciation and amortization expense totaled $351,238, which was recorded as cost of sales.
NOTE 6 – ACCOUNTS PAYABLE AND ACCRUED EXPENSE
Accounts payable and accrued expenses consist of the following:
|
As of December 31,
|
||||||||
|
2014
|
2013
|
|||||||
|
Accounts payable
|
$
|
3,181,465
|
$
|
3,998,660
|
||||
|
Salary payable
|
234,932
|
212,138
|
||||||
|
Social security insurance contribution payable
|
89,232
|
57,674
|
||||||
|
Price adjustment funds
|
-
|
861,071
|
||||||
|
Other payables
|
499,099
|
516,288
|
||||||
|
Total
|
$
|
4,004,728
|
$
|
5,645,831
|
||||
NOTE 7 – DUE TO A RELATED PARTY AND RELATED PARTY TRANSACTIONS
On September 25, 2012, the Company purchased five stories of a commercial building in the PRC, through SYCI, from Shandong Shouguang Vegetable Seed Industry Group Co., Ltd. (the “Seller”) at a cost of approximately $5.7 million in cash, of which Mr. Ming Yang, the Chairman of the Company, had a 99% equity interest in the Seller. The cost of the five stories of the commercial building was valued by an independent appraiser on September 17, 2012 to its fair value and recorded as property, plant and equipment. The Company commenced using the property as the new headquarters for the office in early January, 2013. During the fiscal year 2013, the Company entered into an agreement with the Seller to provide property management services for an annual amount of $100,704 for five years from January 1, 2013 to December 31, 2017. The company recorded in general and administrative expense an amount of $100,704 in the year ended December 31, 2014 and 2013.
During the fiscal year 2014 and 2013, the Company borrowed $459,974 and $905,449, and fully repaid later during the same period, from Jiaxing Lighting Appliance Company Limited (Jiaxing Lighting”), in which Mr. Ming Yang, a shareholder and the Chairman of the Company, has a 100% equity interest in Jiaxing Lighting. The amounts due to Jiaxing Lighting were unsecured, interest free and repayable on demand.
F-17
NOTE 8 – TAXES PAYABLE
|
Taxes payable consists of the following:
|
||||||||
|
As of December 31,
|
||||||||
|
2014
|
2013
|
|||||||
|
Income tax payable
|
$ | 1,388,341 | $ | 2,653,168 | ||||
|
Mineral resource compensation fee payable
|
292,026 | 300,856 | ||||||
|
Value added tax payable
|
724,915 | 1,079,143 | ||||||
|
Land use tax payable
|
949,544 | 952,972 | ||||||
|
Other tax payables
|
190,603 | 262,347 | ||||||
|
Total
|
$ | 3,545,429 | $ | 5,248,486 | ||||
NOTE 9 – CAPITAL LEASE OBLIGATIONS
The components of capital lease obligations are as follows:
|
Imputed
|
As of December 31,
|
||||||||
|
Interest rate
|
2014
|
2013
|
|||||||
|
Total capital lease obligations
|
6.7%
|
$
|
3,031,623
|
$
|
3,146,270
|
||||
|
Less: Current portion
|
(205,128
|
)
|
(202,392
|
)
|
|||||
|
Capital lease obligations, net of current portion
|
$
|
2,826,495
|
$
|
2,943,878
|
|||||
Interest expense from capital lease obligations amounted to $202,656 and $207,393, which were charged to the income statements for the year ended December 31, 2014 and 2013. See Note 19 for future minimum lease payments disclosure.
NOTE 10 –EQUITY
|
(a)
|
Authorized shares
|
During the annual general meeting held on June 18, 2013, the shareholders of the Company approved the amendment to the Certificate of Incorporation to decrease the number of the authorized shares of the Company’s comment stocks to 80,000,000. The Company has completed the filing of the amendment and restatement of the Certificate of Incorporation with the Secretary of the State of Delaware to decrease the number of authorized shares of the Company’s common stock and accordingly 80,000,000 is disclosed as the authorized shares of the Company’s common stock in the consolidated balance sheet as of December 31, 2014.
|
(b)
|
Retained Earnings - Appropriated
|
In accordance with the relevant PRC regulations and the PRC subsidiaries’ Articles of Association, the Company’s PRC subsidiaries are required to allocate its profit after tax to the following reserve:
Statutory Common Reserve Funds
SCHC and SYCI are required each year to transfer at least 10% of the profit after tax as reported under the PRC statutory financial statements to the Statutory Common Reserve Funds until the balance reaches 50% of the registered share capital. This reserve can be used to make up any loss incurred or to increase share capital. Except for the reduction of losses incurred, any other application should not result in this reserve balance falling below 25% of the registered capital. The Statutory Common Reserve Fund as of December 31, 2014 for SCHC and SYCI is 38% and 50% of its registered capital, respectively.
F-18
NOTE 11 – TREASURY STOCK
In December 2014, the Company repurchased 53,550 shares of common stock of the Company at an average price of $1.15 per share for a total cost of $61,728 under the approval of the Board of Directors. The Company recorded the entire purchase price of the treasury stock as a reduction of equity.
NOTE 12 – STOCK-BASED COMPENSATION
Pursuant to the Company’s Amended and Restated 2007 Equity Incentive Plan, the aggregate number shares of the Company’s common stock available for grant of stock options and issuance is 4,341,989 shares. As of December 31, 2014, the number of shares of the Company’s common stock available for issuance is 843,489.
The fair value of each option award below is estimated on the date of grant using the Black-Scholes option-pricing model. The risk free rate is based on the yield-to-maturity in continuous compounding of the US Government Bonds with the time-to-maturity similar to the expected tenor of the option granted, volatility is based on the annualized historical stock price volatility of the Company, and the expected life is based on the estimated average of the life of options using the “simplified” method, as prescribed in FASB ASC 718, due to insufficient historical exercise activity during recent years as a basis from which to estimate future exercise patterns.
In early March 2013, the Company granted to an independent director an option to purchase 12,500 shares of the Company’s common stock at an exercise price of $1.12 per share and the options vested immediately. The options were valued at $4,900 fair value, with assumed 74.73% volatility, a three-year expiration term with expected tenor of 1.49 years, a risk free rate of 0.19% and no dividend yield.
On May 7, 2013, the Company granted to an independent director an option to purchase 12,500 shares of the Company’s common stock at an exercise price of $1.06 per share and the options vested immediately. The options were valued at $3,700 fair value, with assumed 63.30% volatility, a three-year expiration term with expected tenor of 1.49 years, a risk free rate of 0.16% and no dividend yield.
On May 30, 2013, the Company granted to 3 executive officers and 17 management staff options to purchase 600,000 shares and 203,000 shares of the Company’s common stock, respectively, at an exercise price of $0.952 per share and the options vested immediately. The options were valued at $394,100 and $133,300 fair value, respectively, both with assumed 80.76% volatility, a four-year expiration term with expected tenor of 2 years, a risk free rate of 0.29% and no dividend yield.
On July 2, 2013, the Company granted to an independent director an option to purchase 12,500 shares of the Company’s common stock at an exercise price of $1.17 per share and the options vested immediately. The options were valued at $4,100 fair value, with assumed 61.56% volatility, a three-year expiration term with expected tenor of 1.49 years, a risk free rate of 0.24% and no dividend yield.
On November 8, 2013, the Company granted to an independent director an option to purchase 12,500 shares of the Company’s common stock at an exercise price of $2.12 per share and the options vested immediately. The options were valued at $8,500 fair value, with assumed 66.49% volatility, a three-year expiration term with expected tenor of 1.50 years, a risk free rate of 0.21% and no dividend yield.
In early March 2014, the Company granted to an independent director an option to purchase 12,500 shares of the Company’s common stock at an exercise price of $2.55 per share and the options vested immediately. The options were valued at $10,200 fair value, with assumed 67.14% volatility, a three-year expiration term with expected tenor of 1.49 years, a risk free rate of 0.21% and no dividend yield.
On May 7, 2014, the Company granted to an independent director an option to purchase 12,500 shares of the Company’s common stock at an exercise price of $1.83 per share and the options vested immediately. The options were valued at $7,900 fair value, with assumed 69.24% volatility, a three-year expiration term with expected tenor of 1.49 years, a risk free rate of 0.25% and no dividend yield.
On June 30, 2014, the Company granted to an independent director an option to purchase 12,500 shares of the Company’s common stock at an exercise price of $2.15 per share and the options vested immediately. The options were valued at $8,200 fair value, with assumed 64.48% volatility, a three-year expiration term with expected tenor of 1.50 years, a risk free rate of 0.27% and no dividend yield.
On November 10, 2014, the Company granted to an independent director an option to purchase 12,500 shares of the Company’s common stock at an exercise price of $1.39 per share and the options vested immediately. The options were valued at $4,600 fair value, with assumed 65.49% volatility, a three-year expiration term with expected tenor of 1.50 years, a risk free rate of 0.32% and no dividend yield.
On November 19, 2014, the Company granted to 20 management staff options to purchase 685,000 shares of the Company’s common stock, respectively, at an exercise price of $0.978 per share and the options vested immediately. The options were valued at $311,500 fair value, respectively, with assumed 63.20% volatility, a four-year expiration term with expected tenor of 2 years, a risk free rate of 0.52% and no dividend yield.
During the year ended December 31, 2013, 213,131 shares of common stock were issued upon cashless exercise of 344,000 options.
During the year ended December 31, 2014, 145,813 shares of common stock were issued upon cashless exercise of 223,000 options.
F-19
NOTE 12 – STOCK-BASED COMPENSATION – Continued
The following table summarizes all Company stock option transactions between January 1, 2013 and December 31, 2014.
|
Number of Option
and Warrants
Outstanding and exercisable
|
Weighted- Average Exercise price of Option
and Warrants
|
Range of
Exercise Price per Common Share
|
|||||||||
|
Balance, December 31, 2012
|
1,974,471 | $ | 4.00 | $0.95 - $12.60 | |||||||
|
Granted and vested during the year
ended December 31, 2013
|
853,000 | $ | 0.98 | $0.95 - $2.12 | |||||||
|
Exercised during the year ended
December 31, 2013
|
(344,000 | ) | $ | 0.95 | $0.95 | ||||||
|
Expired during the
year ended December 31, 2013
|
(12,500 | ) | $ | 10.43 | $10.43 | ||||||
|
Balance, December 31, 2013
|
2,470,971 | $ | 3.36 | $0.95 - $12.60 | |||||||
|
Granted and vested during the year
ended December 31, 2014
|
735,000 | $ | 1.05 | $0.98 - $2.55 | |||||||
|
Exercised during the year ended
December 31, 2014
|
(223,000 | ) | $ | 0.95 | $0.95 | ||||||
|
Expired during the
year ended December 31, 2014
|
(238,971 | ) | $ | 9.56 | $2.41 - $12.00 | ||||||
|
Balance, December 31, 2014
|
2,744,000 | $ | 2.38 | $0.95 - $12.60 | |||||||
|
Stock and Warrants Options Exercisable and Outstanding
|
||||||||
|
Weighted Average
|
Weighted Average
|
|||||||
|
Outstanding
|
Remaining
|
Exercise Price of
|
||||||
|
at December 31, 2014
|
Range of
Exercise Prices
|
Contractual Life
(Years)
|
Options Currently
Outstanding
|
|||||
|
Exercisable and outstanding
|
2,744,000
|
$0.95 - $12.60
|
1.95
|
$2.38
|
||||
The aggregate intrinsic value of options outstanding and exercisable as of December 31, 2014 was $345,652.
The total intrinsic value of options exercised during the year ended December 31, 2014 and 2013 was $400,954 and $542,202.
F-20
NOTE 13 – INCOME TAXES
The Company utilizes the asset and liability method of accounting for income taxes in accordance with FASB ASC 740-10.
(a) United States
Gulf Resources, Inc. is subject to the United States of America Tax law at tax rate of 35%. No provision for the US federal income taxes has been made as the Company had no US taxable income for the years ended December 31, 2014 and 2013, and management believes that its earnings are permanently invested in the PRC.
(b) BVI
Upper Class Group Limited was incorporated in the BVI and, under the current laws of the BVI, it is not subject to tax on income or capital gain in the BVI. Upper Class Group Limited did not generate assessable profit for the years ended 31 December 31, 2014 and 2013.
(c) Hong Kong
Hong Kong Jiaxing Industrial Limited was incorporated in Hong Kong and is subject to Hong Kong profits tax. The Company is subject to Hong Kong taxation on its activities conducted in Hong Kong and income arising in or derived from Hong Kong. No provision for profits tax has been made as the Company has no assessable income for the years. The applicable statutory tax rates for the years ended December 31, 2014 and 2013 are 16.5%.
(d) PRC
Enterprise income tax (“EIT”) for SCHC and SYCI in the PRC is charged at 25% of the assessable profits.
The operating subsidiaries SCHC and SYCI are wholly foreign-owned enterprises (“FIE”) incorporated in the PRC and are subject to PRC Foreign Enterprise Income Tax Law.
On February 22, 2008, the Ministry of Finance (“MOF”) and the State Administration of Taxation (“SAT”) jointly issued Cai Shui [2008] Circular 1 (“Circular 1”). According to Article 4 of Circular 1, distributions of accumulated profits earned by a FIE prior to January 1, 2008 to foreign investor(s) in 2008 will be exempted from withholding tax (“WHT”) while distribution of the profit earned by an FIE after January 1, 2008 to its foreign investor(s) shall be subject to WHT at 5% effective tax rate.
As of December 31, 2014 and 2013, the accumulated distributable earnings under the Generally Accepted Accounting Principles (“GAAP”) of PRC are $242,440,917 and $225,003,631, respectively. Since the Company intends to reinvest its earnings to further expand its businesses in mainland China, its foreign invested enterprises do not intend to declare dividends to their immediate foreign holding companies in the foreseeable future. Accordingly, as of December 31, 2014 and 2013, the Company has not recorded any WHT on the cumulative amount of distributable retained earnings of its foreign invested enterprises in China. As of December 31, 2014 and 2013, the unrecognized WHT are $11,008,938 and $10,133,056, respectively.
F-21
NOTE 13 – INCOME TAXES – Continued
The Company’s tax returns are subject to the various tax authorities’ examination. The federal, state and local authorities of the United States may examine the Company’s tax returns filed in the United States for three years from the date of filing. The Company’s US tax returns since 2011 are currently subject to examination. Inland Revenue Department of Hong Kong may examine the Company’s tax returns filed in Hong Kong for seven years from date of filing. The Company’s Hong Kong tax returns since incorporation are currently subject to examination. The tax authorities of the PRC may examine the Company’s PRC tax returns for three years from the date of filing. The Company’s PRC tax returns since 2011 are currently subject to examination.
The components of the provision for income taxes from continuing operations are:
|
Years ended December 31,
|
||||||||
|
2014
|
2013
|
|||||||
|
Current taxes – PRC
|
$
|
6,226,000
|
$
|
7,607,050
|
||||
|
Deferred tax – PRC
|
15
|
633
|
||||||
|
$
|
6,226,015
|
$
|
7,607,683
|
|||||
The effective income tax expenses differ from the PRC statutory income tax rate of 25% from continuing operations in the PRC as follows:-
|
Years ended December 31,
|
||||||||
|
2014
|
2013
|
|||||||
|
Statutory income tax rate
|
25 | % | 25 | % | ||||
|
Non-deductible items
|
- | 1 | % | |||||
|
Change in valuation allowance
|
1 | % | 1 | % | ||||
|
Effective tax rate
|
26 | % | 27 | % | ||||
As of December 31, 2014 and 2013, the Company had US federal net operating loss (“NOL”) of approximately $27.6 million and $26.5 million available to offset against future federal income tax liabilities, respectively. NOL can be carried forward up to 15 years from the year the loss is incurred. NOL of approximately $12.0 million expired at the beginning of 2014. The Company believes the realization of benefits from these losses remains uncertain due to the Company’s limited operating history and continuing losses. Accordingly, a 100% deferred tax asset valuation allowance has been provided.
Differences between the application of accounting principles and tax laws cause differences between the bases of certain assets and liabilities for financial reporting purposes and tax purposes. The tax effects of these differences, to the extent they are temporary, are recorded as deferred tax assets and liabilities. Significant components of the Company’s deferred tax assets and liabilities at December31, 2014 and 2013 are as follows:
|
As of December 31,
|
||||||||
|
2014
|
2013
|
|||||||
|
Deferred tax liabilities
|
$
|
-
|
$
|
-
|
||||
|
Deferred tax assets:
|
||||||||
|
Allowance for obsolete and slow-moving inventories
|
$
|
864
|
$
|
1,657
|
||||
|
Impairment on property, plant and equipment
|
477,427
|
479,151
|
||||||
|
Exploration costs
|
1,952,990
|
1,837,025
|
||||||
|
Repair and maintenance costs
|
-
|
-
|
||||||
|
Property, plant and equipment
|
-
|
-
|
||||||
|
Property, plant and equipment under capital leases
|
-
|
-
|
||||||
|
Compensation costs of unexercised stock options
|
1,427,296
|
2,053,310
|
||||||
|
US federal net operating loss
|
9,692,379
|
9,272,734
|
||||||
|
Total deferred tax assets
|
13,550,956
|
13,643,877
|
||||||
|
Valuation allowance
|
(11,119,675
|
)
|
(11,326,044
|
)
|
||||
|
Net deferred tax asset
|
$
|
2,431,281
|
$
|
2,317,833
|
||||
|
Current deferred tax asset
|
$
|
864
|
$
|
1,657
|
||||
|
Long-term deferred tax asset
|
$
|
2,430,417
|
$
|
2,316,176
|
||||
The increases in valuation allowance for the years ended December 31, 2013 was $706,731.
The decreases in valuation allowance for the years ended December 31, 2014 was $206,369.
There were no unrecognized tax benefits and accrual for uncertain tax positions as of December 31, 2014 and 2013.
F-22
NOTE 14 – BUSINESS SEGMENTS
The Company has three reportable segments: bromine, crude salt and chemical products. The reportable segments are consistent with how management views the markets served by the Company and the financial information that is reviewed by its chief operating decision maker.
An operating segment’s performance is primarily evaluated based on segment operating income, which excludes share-based compensation expense, certain corporate costs and other income not associated with the operations of the segment. These corporate costs (income) are separately stated below and also include costs that are related to functional areas such as accounting, treasury, information technology, legal, human resources, and internal audit. All intersegment transactions have been eliminated. The Company believes that segment operating income, as defined above, is an appropriate measure for evaluating the operating performance of its segments. All the customers are located in PRC.
|
Year Ended
December 31, 2014
|
Bromine *
|
Crude
Salt *
|
Chemical
Products
|
Segment
Total
|
Corporate
|
Total
|
||||||||||||||||||
|
Net revenue
(external customers)
|
$
|
57,949,824
|
$
|
10,752,226
|
$
|
44,958,281
|
$
|
113,660,331
|
$
|
-
|
$
|
113,660,331
|
||||||||||||
|
Net revenue (intersegment)
|
3,013,295
|
-
|
-
|
3,013,295
|
-
|
3,013,295
|
||||||||||||||||||
|
Income (loss) from operations before taxes
|
9,500,428
|
719,226
|
14,432,851
|
24,652,505
|
(834,284
|
)
|
23,818,221
|
|||||||||||||||||
|
Income taxes
|
2,214,988
|
370,974
|
3,640,053
|
6,226,015
|
-
|
6,226,015
|
||||||||||||||||||
|
Income (loss) from operations after taxes
|
7,285,440
|
348,252
|
10,792,798
|
18,426,490
|
(834,284
|
)
|
17,592,206
|
|||||||||||||||||
|
Total assets
|
195,539,637
|
51,632,485
|
75,748,241
|
322,920,363
|
61,789
|
322,982,152
|
||||||||||||||||||
|
Depreciation and amortization
|
18,011,790
|
6,076,042
|
3,554,390
|
27,642,222
|
-
|
27,642,222
|
||||||||||||||||||
|
Capital expenditures
|
5,414,738
|
1,123,873
|
-
|
6,538,611
|
-
|
6,538,611
|
||||||||||||||||||
|
Year Ended
December 31, 2013
|
Bromine *
|
Crude
Salt *
|
Chemical
Products
|
Segment
Total
|
Corporate
|
Total
|
||||||||||||||||||
|
Net revenue
(external customers)
|
$
|
60,488,886
|
$
|
13,790,128
|
$
|
44,112,769
|
$
|
118,391,783
|
$
|
-
|
$
|
118,391,783
|
||||||||||||
|
Net revenue (intersegment)
|
2,947,350
|
-
|
-
|
2,947,350
|
-
|
2,947,350
|
||||||||||||||||||
|
Income (loss) from operations before taxes
|
13,152,092
|
3,831,272
|
13,371,119
|
30,354,483
|
(1,910,990
|
)
|
28,443,493
|
|||||||||||||||||
|
Income taxes
|
3,459,256
|
785,879
|
3,362,548
|
7,607,683
|
-
|
7,607,683
|
||||||||||||||||||
|
Income (loss) from operations after taxes
|
9,692,836
|
3,045,393
|
10,008,571
|
22,746,800
|
(1,910,990
|
)
|
20,835,810
|
|||||||||||||||||
|
Total assets
|
181,490,011
|
61,138,301
|
66,479,395
|
309,107,707
|
137,098
|
309,244,805
|
||||||||||||||||||
|
Depreciation and amortization
|
17,384,351
|
6,547,844
|
3,528,498
|
27,460,693
|
-
|
27,460,693
|
||||||||||||||||||
|
Capital expenditures
|
2,780,023
|
406,586
|
6,072
|
3,192,681
|
-
|
3,192,681
|
||||||||||||||||||
|
Write-off / Impairment
|
24,503
|
3,247
|
214
|
27,964
|
-
|
27,964
|
||||||||||||||||||
F-23
NOTE 14 – BUSINESS SEGMENTS – Continued
|
|
* Certain common production overheads, operating and administrative expenses and asset items (mainly cash and certain office equipment) of bromine and crude salt segments in SCHC were split by reference to the average selling price and production volume of respective segment.
|
|
Years ended December 31,
|
||||||||
|
Reconciliations
|
2014
|
2013
|
||||||
|
Total segment operating income
|
$
|
24,652,505
|
$
|
30,354,483
|
||||
|
Corporate costs
|
(834,284
|
)
|
(1,910,990
|
)
|
||||
|
Income from operations
|
23,818,221
|
28,443,493
|
||||||
|
Other income
|
279,589
|
131,548
|
||||||
|
Income before taxes
|
$
|
24,097,810
|
$
|
28,575,041
|
||||
The following table shows the major customer(s) (10% or more) for the year ended December 31, 2014.
|
Number
|
Customer
|
Bromine
(000’s)
|
Crude Salt
(000’s)
|
Chemical Products
(000’s)
|
Total
Revenue
(000’s)
|
Percentage of
Total
Revenue (%)
|
||||||||||||||||
|
1
|
Shandong Morui Chemical Company Limited
|
$ | 8,519 | $ | 2,576 | $ | 6,477 | $ | 17,572 | 15.5 | % | |||||||||||
|
TOTAL
|
$ | 8,519 | $ | 2,576 | $ | 6,477 | $ | 17,572 | 15.5 | % | ||||||||||||
The following table shows the major customer(s) (10% or more) for the year ended December 31, 2013.
|
Number
|
Customer
|
Bromine
(000’s)
|
Crude Salt
(000’s)
|
Chemical Products
(000’s)
|
Total
Revenue
(000’s)
|
Percentage of
Total
Revenue (%)
|
||||||||||||||||
|
1
|
Shandong Morui Chemical Company Limited
|
$ | 6,955 | $ | 3,520 | $ | 4,556 | $ | 15,031 | 12.7 | % | |||||||||||
|
TOTAL
|
$ | 6,955 | $ | 3,520 | $ | 4,556 | $ | 15,031 | 12.7 | % | ||||||||||||
NOTE 15 – MAJOR SUPPLIERS
During the year ended December 31, 2014, the Company purchased 89.4% of its raw materials from its top five suppliers. At December 31, 2014, amounts due to those suppliers included in accounts payable were $2,794,998. During the year ended December 31, 2013, the Company purchased 87.6% of its raw materials from its top five suppliers. At December 31, 2013, amounts due to those suppliers included in accounts payable were $3,550,572.
NOTE 16 – CUSTOMER CONCENTRATION
The Company sells a substantial portion of its products to a limited number of customers. During the year ended December 31, 2014, the Company sold 43.3% of its products to its top five customers. At December 31, 2014, amount due from these customers were $23,035,195. During the year ended December 31, 2013, the Company sold 40.1% of its products to its top five customers. At December 31, 2013, amount due from these customers were $21,576,892.
NOTE 17 – FAIR VALUE OF FINANCIAL INSTRUMENTS
The carrying values of financial instruments, which consist of cash, accounts receivable and accounts payable and other payables, approximate their fair values due to the short-term nature of these instruments. There were no material unrecognized financial assets and liabilities as of December 31, 2014 and 2013.
NOTE 18 –RESEARCH AND DEVELOPMENT EXPENSES
The total research and development expenses recognized in the income statements during the years ended December 31, 2014 and 2013 were $134,292 and $140,445, respectively, of which the consumption of bromine produced by the company amounted to $34,677 and $36,158, respectively.
NOTE 19 – CAPITAL COMMITMENT AND OPERATING LEASE COMMITMENTS
As of December 31, 2014, the Company leased a real property adjacent to Factory No. 1, with the related production facility, channels and ducts, other production equipment and the buildings located on the property, under capital lease. The future minimum lease payments required under capital lease, together with the present value of such payments, are included in the table show below.
The Company has leased nine pieces of land under non-cancelable operating leases, which are fixed in rentals and expired through December 2021, December 2030, December 2031, December 2032, December 2040, February 2059, August 2059 and June 2060, respectively. The Company accounts for the leases as operating leases.
The Company has no purchase commitment as of December 31, 2014.
F-24
NOTE 19 – CAPITAL COMMITMENT AND OPERATING LEASE COMMITMENTS – Continued
The following table sets forth the Company’s contractual obligations as of December 31, 2014:
|
Capital Lease Obligations
|
Operating Lease Obligations
|
Property Management Fees
|
Exploration
Project Expenditure
|
|||||||||||||
|
Payable within:
|
||||||||||||||||
|
the next 12 months
|
$ | 306,758 | $ | 985,865 | $ | 101,958 | $ | 326,860 | ||||||||
|
the next 13 to 24 months
|
306,758 | 1,004,970 | 101,958 | - | ||||||||||||
|
the next 25 to 36 months
|
306,758 | 1,027,958 | 101,958 | - | ||||||||||||
|
the next 37 to 48 months
|
306,758 | 1,048,933 | - | - | ||||||||||||
|
the next 49 to 60 months
|
306,758 | 1,074,029 | - | - | ||||||||||||
|
thereafter
|
3,374,339 | 20,890,533 | - | - | ||||||||||||
|
Total
|
$ | 4,908,129 | $ | 26,032,288 | $ | 305,874 | $ | 326,860 | ||||||||
|
Less: Amount representing interest
|
(1,876,506 | ) | ||||||||||||||
|
Present value of net minimum lease payments
|
$ | 3,031,623 | ||||||||||||||
Rental expenses related to operating leases of the Company amounted to $978,047 and $951,465 were charged to the income statements for the years ended December 31, 2014 and 2013, respectively.
NOTE 20 – SUBSEQUENT EVENTS
In order to increase the Company’s profit margins, produce more consistent and reliable earnings and lessen dependence on the economically sensitive bromine industry, on January 12, 2015, the Company entered into an Equity Interest Transfer Agreement (the “Agreement”) with Shouguang City Rongyuan Chemical Co, Ltd. (“SCRC”) and its shareholders, pursuant to which SCHC shall, upon closing, acquire SCRC and all rights, title and interest in and to all assets owned by SCRC, a leading manufacturer of materials for human and animal antibiotics in China and other parts of Asia.
In consideration for SCRC, SCHC shall pay $66.2 million in cash and issue approximately 7.27 million shares of common stock at a price of $2.00 per share, which represents a 73% premium over the previous 10 day closing price. Total consideration for the purchase of SCRC is approximately $80.8 million.
On February 4, 2015 the Company closed the transactions contemplated by the Agreement between the Company, SCHC and SCRC.
On the Closing Date, the Company issued 7,268,011shares of its common stock, par value $0.0005 per share (the “Shares”), at a price of $2.00 per Share, to the four former equity owners of SCRC. The issuance of the Shares was exempt from registration pursuant to Regulation S of the Securities Act of 1933, as amended. On the Closing Date, the Company entered into a lock-up agreement with the four former equity owners of SCRC. In accordance with the terms of the lock-up agreement, the shareholders have agreed not to sell or transfer the Shares for five years from the date the stock certificates evidencing the Shares are issued.
As the initial accounting for the acquisition of SCRC is incomplete at the time the financial statements are issued, supplemental pro forma information as required by FASB ASC 805-10-50-2(h) is not available for disclosure.
On January, 30, 2015, the Company announced that the company has found natural gas resources under its bromine well in Sichuan area. The company will hire a third party to conduct a survey of the geological structure and complexity analysis and the economics of the natural gas under this well. The Company is in the final stage of discussion with the expert company to finalize the service agreement.
F-25
SCHEDULE I – PARENT ONLY FINANCIAL INFORMATION
The following presents condensed parent company only financial information of Gulf Resources, Inc.
Condensed Balance Sheets
|
As of December 31,
|
||||||||
|
2014
|
2013
|
|||||||
|
Current Assets
|
||||||||
|
Prepayments and deposits
|
$
|
4,586
|
$
|
4,583
|
||||
|
Total Current Assets
|
4,586
|
4,583
|
||||||
|
Non-Current Assets
|
||||||||
|
Interests in subsidiaries
|
258,919,660
|
241,210,655
|
||||||
|
Amounts due from group companies
|
55,117,354
|
55,647,841
|
||||||
|
Total non-current assets
|
314,037,014
|
296,858,496
|
||||||
|
Total Assets
|
$
|
314,041,600
|
$
|
296,863,079
|
||||
|
Liabilities and Stockholders’ Equity
|
||||||||
|
Current Liabilities
|
||||||||
|
Other payables and accrued expenses
|
$
|
322,694
|
$
|
333,852
|
||||
|
Amounts due to group companies
|
1,645,493
|
1,534,135
|
||||||
|
Total Liabilities
|
$
|
1,968,187
|
$
|
1,867,987
|
||||
|
|
||||||||
|
Stockholders’ Equity
|
||||||||
|
PREFERRED STOCK; $0.001 par value; 1,000,000 shares authorized; none outstanding
|
$
|
-
|
$
|
-
|
||||
|
COMMON STOCK; $0.0005 par value; 80,000,000 shares authorized; 38,911,014 and 38,765,201 shares issued; and 38,672,865 and 38,580,602 shares outstanding as of December 31, 2014 and 2013, respectively
|
19,456
|
19,383
|
||||||
|
Treasury stock; 238,149 and 184,599 shares as of December 31, 2014 and 2013
|
(561,728
|
)
|
(500,000
|
)
|
||||
|
Additional paid-in capital
|
80,380,008
|
80,033,981
|
||||||
|
Retained earnings unappropriated
|
183,480,402
|
166,421,427
|
||||||
|
Retained earnings appropriated
|
18,078,392
|
17,265,572
|
||||||
|
Cumulative translation adjustment
|
30,676,883
|
31,754,729
|
||||||
|
Total Stockholders’ Equity
|
312,073,413
|
294,995,092
|
||||||
|
Total Liabilities and Stockholders’ Equity
|
$
|
314,041,600
|
$
|
296,863,079
|
||||
Condensed Statements of Income
|
Years Ended December 31,
|
||||||||
|
2014
|
2013
|
|||||||
|
OPERATING (EXPENSES) INCOME
|
||||||||
|
General and administrative expenses
|
$
|
(914,502
|
)
|
$
|
(1,297,200
|
)
|
||
|
Other operating income
|
-
|
171,092
|
||||||
|
TOTAL OPERATING EXPENSES
|
(914,502
|
)
|
(1,126,108
|
)
|
||||
|
OTHER EXPENSES
|
||||||||
|
Interest expense
|
(554
|
)
|
(745
|
)
|
||||
|
TOTAL OTHER EXPENSES
|
(554
|
)
|
(745
|
)
|
||||
|
TOTAL EXPENSES
|
(915,056
|
)
|
(1,126,853
|
)
|
||||
|
Equity in net income of subsidiaries
|
18,786,851
|
22,094,211
|
||||||
|
INCOME BEFORE TAXES
|
17,871,795
|
20,967,358
|
||||||
|
INCOME TAXES
|
-
|
-
|
||||||
|
NET INCOME
|
$
|
17,781,795
|
$
|
20,967,358
|
||||
S-1
Condensed Statements of Cash Flows
|
Years Ended December 31,
|
||||||||
|
2014
|
2013
|
|||||||
|
CASH FLOWS FROM OPERATING ACTIVITIES
|
|
|
||||||
|
Net income
|
$
|
17,871,795
|
$
|
20,967,358
|
||||
|
Adjustments to reconcile net income to
net cash provided by operating activities:
|
||||||||
|
Equity earnings in unconsolidated subsidiaries
|
(18,786,851
|
)
|
(22,094,211
|
)
|
||||
|
Stock-based compensation expense
|
346,100
|
544,900
|
||||||
|
Changes in assets and liabilities:
|
||||||||
|
Prepayment and deposits
|
(3
|
)
|
(4,583
|
)
|
||||
|
Other payables and accrued expenses
|
(11,158
|
)
|
(337,522
|
)
|
||||
|
Net cash used in operating activities
|
(580,117
|
)
|
(924,059
|
)
|
||||
|
CASH FLOWS FROM FINANCING ACTIVITIES
|
||||||||
|
Advances from / (to) group companies
|
641,845
|
924,059
|
)
|
|||||
|
Repurchase of common stock
|
(61,728
|
)
|
-
|
|||||
|
Net cash provided by financing activities
|
580,117
|
924,059
|
||||||
|
NET INCREASE IN CASH AND CASH EQUIVALENTS
|
-
|
-
|
||||||
|
CASH AND CASH EQUIVALENTS - BEGINNING OF YEAR
|
-
|
-
|
||||||
|
CASH AND CASH EQUIVALENTS - END OF YEAR
|
$
|
-
|
$
|
-
|
||||
Notes:
|
(i)
|
Basis of presentation
|
In the condensed parent-company-only financial statements, the Company’s investment in subsidiaries is stated at cost plus equity in undistributed earnings of subsidiaries since the date of acquisition. The Company’s share of net income of its subsidiaries is included in condensed statements of income using the equity method. These condensed parent-company-only financial statements should be read in connection with the consolidated financial statements and notes thereto.
As of December 31, 2014, the Company itself has no purchase commitment, capital commitment and operating lease commitment for the condensed parent-company-only financial statements.
|
(ii)
|
Restricted Net Assets
|
Schedule I of Article 5-04 of Regulation S-X requires the condensed financial information of registrant shall be filed when the restricted net assets of consolidated subsidiaries exceed 25 percent of consolidated net assets as of the end of the most recently completed fiscal year. For purposes of the above test, restricted net assets of consolidated subsidiaries shall mean that amount of the registrant’s proportionate share of net assets of consolidated subsidiaries (after intercompany eliminations) which as of the end of the most recent fiscal year may not be transferred to the parent company by subsidiaries in the form of loans, advances or cash dividends without the consent of a third party (i.e., lender, regulatory agency, foreign government, etc.).
The condensed parent company financial statements have been prepared in accordance with Rule 12-04, Schedule I of Regulation S-X as the restricted net assets of the subsidiaries of Gulf Resources, Inc. exceed 25% of the consolidated net assets of Gulf Resources, Inc. The ability of the Company’s Chinese operating subsidiaries to pay dividends may be restricted due to the foreign exchange control policies and availability of cash balances of the Chinese operating subsidiaries. Because a significant portion of the Company’s operations and revenues are conducted and generated in China, a significant portion of the revenues being earned and currency received are denominated in RMB. RMB is subject to the exchange control regulation in China, and, as a result, the Company may be unable to distribute any dividends outside of China due to PRC exchange control regulations that restrict the Company’s ability to convert RMB into US Dollars.
S-2
Item 9. Changes in and Disagreements with Accountants on Accounting and Financial Disclosure.
None.
49
Item 9A. Controls and Procedures.
Evaluation of Disclosure Controls and Procedure We maintain “disclosure controls and procedures”, as such term is defined under Exchange Act Rule 13a-15(e), that are designed to ensure that information required to be disclosed in our Exchange Act reports is recorded, processed, summarized, and reported within the time periods specified in the SEC’s rules and forms, and that such information is accumulated and communicated to our management, including our Chief Executive Officer and Chief Financial Officer, as appropriate, to allow timely decisions regarding required disclosures. In designing and evaluating the disclosure controls and procedures, our management recognized that any controls and procedures, no matter how well designed and operated, can provide only reasonable assurance of achieving the desired control objectives and in reaching a reasonable level of assurance our management necessarily was required to apply its judgment in evaluating the cost-benefit relationship of possible controls and procedures. We have carried out an evaluation as required by Rule 13a-15(d) under the supervision and with the participation of our management, including our Chief Executive Officer and Chief Financial Officer, of the effectiveness of the design and operation of our disclosure controls and procedures as of December 31, 2014. Based upon their evaluation, the Chief Executive Officer and Chief Financial Officer concluded that, as of December 31, 2014, the Company’s disclosure controls and procedures were effective.
Management’s Report on Internal Control over Financial Reporting Our management is responsible for establishing and maintaining adequate internal control over financial reporting, as such term is defined in Exchange Act Rules 13a-15(f) and 15d-15(f). Internal control over financial reporting refers to the process designed by, or under the supervision of, our principal executive officer and principal financial officer, and effected by our Board of Directors, management and other personnel, to provide reasonable assurance regarding the reliability of financial reporting and the preparation of financial statements for external purposes in accordance with generally accepted accounting principles, and includes those policies and procedures that:
|
(1)
|
Pertain to the maintenance of records that in reasonable detail accurately and fairly reflect the transactions and dispositions of our assets;
|
|
(2)
|
Provide reasonable assurance that transactions are recorded as necessary to permit preparation of financial statements in accordance with generally accepted accounting principles, and that our receipts and expenditures are being made only in accordance with authorization of our management and directors; and
|
|
(3)
|
Provide reasonable assurance regarding prevention or timely detection of unauthorized acquisitions, use or disposition of our assets that could have a material effect on the financial statements.
|
Internal control over financial reporting cannot provide absolute assurance of achieving financial reporting objectives because of its inherent limitations. Internal control over financial reporting is a process that involves human diligence and compliance and is subject to lapses in judgment and breakdowns resulting from human failures. Internal control over financial reporting also can be circumvented by collusion or improper management override. Because of such limitations, there is a risk that material misstatements may not be prevented or detected on a timely basis by internal control over financial reporting. However, these inherent limitations are known features of the financial reporting process. Therefore, it is possible to design into the process safeguards to reduce, though not eliminate, this risk. Management is responsible for establishing and maintaining adequate internal control over financial reporting for the company.
Management has used the framework set forth in the report entitled Internal Control—Integrated Framework published by the Committee of Sponsoring Organizations of the Treadway Commission(2013 framework), known as COSO, to evaluate the effectiveness of our internal control over financial reporting.
A material weakness is a deficiency, or a combination of deficiencies, in internal control over financial reporting, such that there is a reasonable possibility that a material misstatement of the Company’s annual or interim financial statements will not be prevented or detected on a timely basis. Base on such evaluation our CEO and CFO have concluded that, as of December 31, 2014, our internal controls over financial reporting was effective.
This annual report does not include an attestation report of our registered public accounting firm regarding internal control over financial reporting. Management’s report was not subject to attestation by our registered public accounting firm pursuant to the Dodd-Frank Wall Street Reform and Consumer Protection Act, which permits us to provide only management’s report in this annual report.
50
Changes in Internal Control Over Financial Reporting
There were no changes in our internal control over financial reporting (as such term is defined in Rules 13a-15(f) under the Exchange Act) during our most recently completed fiscal quarter which is the subject of this report that have materially affected, or are reasonably likely to materially affect, our internal control over financial reporting.
51
Item 9B. Other Information.
None.
PART III
We are incorporating by reference the information required by Part III of this report on Form 10-K from our proxy statement relating to our 2015 annual meeting of stockholders (the “2015 Proxy Statement”), which will be filed with the Securities and Exchange Commission within 120 days after the end of our fiscal year ended December 31, 2014.
Item 10. Directors and Executive Officers and Corporate Governance.
The information required by this item is included under the captions “Election of Directors — Nominees,” “Information Concerning Executive Officers” and “Section 16(a) Beneficial Ownership Reporting Compliance” in the 2015 Proxy Statement and incorporated herein by reference.
Item 11. Executive Compensation.
The information required by this item is included under the captions “Election of Directors — Compensation of Non-Employee Directors,” “Election of Directors — Compensation Committee Interlocks and Insider Participation,” “Compensation Discussion and Analysis,” and “Compensation Committee Report” in the 2015 Proxy Statement and incorporated herein by reference.
Item 12. Security Ownership of Certain Beneficial Owners and Management and Related Stockholder Matters.
The information required by this item is included under the captions “Security Ownership of Certain Beneficial Owners and Management” and “Equity Compensation Plan Information” in the 2015 Proxy Statement and incorporated herein by reference.
Item 13. Certain Relationships and Related Transactions, and Director Independence.
The information required by this item is included under the captions “Certain Relationships and Related Person Transactions, and Director Independence” and “Election of Directors — Board Meetings and Committees” in the 2015 Proxy Statement and incorporated herein by reference.
Item 14. Principal Accounting Fees and Services.
The information required by this item is included under the caption “Audit Committee Report” in the 2015 Proxy Statement and incorporated herein by reference.
52
PART IV
Item 15. Exhibits and Financial Statement Schedules.
(a) Financial Statements and Schedules
|
|
(1)
|
Financial Statements – The financial statements filed as part of this filing are listed on the index to the Financial Statements and Supplementary Data, Item 8 of Part II, on page F-1.
|
|
|
(2)
|
Financial Statement Schedules – “Schedule I – Parent Only Financial Information” filed as part of this filing is listed on the Financial Statements and Supplementary Data, Item 8 of Part II, on pages S-1 and S-2. All other financial statement schedules have been omitted because they are not applicable, or the information required is set forth in the Consolidated Financial Statements or related notes thereto.
|
(b) Exhibit Index
|
2.1
|
Agreement and Plan of Merger dated December 10, 2006, among the Registrant, DFAX Acquisition vehicle, Inc., Upper Class Group Limited and the shareholders of UCG, incorporated herein by reference to Exhibit 10 to the Registrant's Current Report on Form 8-K filed on December 12, 2007.
|
|
|
2.2
|
Share Exchange Agreement among the Registrant, Upper Class Limited, Shouguang Yuxin Chemical Industry Company Limited and shareholders of Shouguang Yuxin Chemical Industry Company Limited, incorporated herein by reference to Exhibit 10.1 to the Registrant's Current Report on Form 8-K filed on February 9, 2007.
|
|
|
3.1
|
Restated Certificate of Incorporation, incorporated herein by reference to Exhibit 3.1 to the Registrant's Registration Statement on Form S-1 (No. 33-46580) declared effective on November 18, 1992.
|
|
|
3.2
|
Amendment to Restated Certificate of Incorporation., increasing the authorized capital stock, incorporated herein by reference to Exhibit A to the Registrant's definitive Schedule 14A filed in October, 1995.
|
|
|
3.3
|
Amendment to Restated Certificate of Incorporation., increasing the authorized capital stock, incorporated herein by reference to Exhibit B to the Registrant's definitive Schedule 14A filed on August 12, 1997.
|
|
|
3.4
|
Amendment to Restated Certificate of Incorporation., increasing the authorized capital stock, incorporated herein by reference to Exhibit A to the Registrant's definitive Schedule 14A filed on October 16, 1998.
|
|
|
3.5
|
Amendment to Restated Certificate of Incorporation, filed with the Secretary of the State of Delaware on October 16, 2006, effecting a reverse stock split.
|
|
|
3.6
|
Amendment to Restated Certificate of Incorporation, changing the name of the Registrant to Gulf Resources, Inc., incorporated herein by reference to Exhibit 3.1 of the Registrant's Current Report on Form 8-K filed on February 20, 2007.
|
|
|
3.7
|
Amendment to Restated Certificate of Incorporation, increasing the authorized capital stock of the Registrant and effecting a 2-for-1 forward stock split, incorporated herein by reference to Exhibit 3.1 of the Registrant's Current Report on Form 8-K filed on December 4, 2007.
|
|
|
3.8
|
Amendment to Restated Certificate of Incorporation, filed with the Secretary of the State of Delaware on October 6, 2009, effecting a reverse stock split, incorporated herein by reference to Appendix C to the Registrant’s Schedule 14A filed on July 30, 2009.
|
|
|
3.9
|
By-laws, incorporated herein by reference to Exhibit 3.2 to the Registrant's Registration Statement on Form S-1 (No. 33-46580) declared effective on November 18, 1992.
|
|
|
10.1
|
Lock-up Agreement by and among the Registrant, Top King Group Limited, Billion Gold Group Limited, Top good International Limited, Ming Yang, Wenxiang Yu, Zhi Yang and Shandong Haoyuan Industry Group Ltd., dated May 10, 2009, incorporated herein by reference to Exhibit 10.1 to the Registrant’s Current Report on Form 8-K filed on May 14, 2009.
|
53
|
10.2
|
Asset Purchase Agreement by and among the Registrant, Shouguang City Haoyuan Chemical Company Limited, Fengxia Yuan, Han Wang and Qing Yang, dated September 7, 2009, incorporated herein by reference to Exhibit 10.1 to the Registrant’s Current Report on Form 8-K filed on September 10, 2009.
|
|
|
10.3
|
Securities Purchase Agreement by and among the Registrant and institutional investors dated December 11, 2009, incorporated herein by reference to Exhibit 10.1 to the Registrant’s Current Report on Form 8-K filed on December 11, 2009.
|
|
54
|
10.4
|
Registration Rights Agreement by and among the Registrant and institutional investors dated December 11, 2009, incorporated herein by reference to Exhibit 10.1 to the Registrant’s Current Report on Form 8-K filed on December 11, 2009.
|
|
|
10.5
|
Asset Purchase Agreement by and between Shouguang Haoyuan Chemical Co., Ltd., Jinjin Li, and Qiuzhen Wang dated June 7, 2010, incorporated herein by reference to Exhibit 10.1 to the Registrant’s Amendment No. 3 on the Current Report on Form 8-K filed on February 22, 2011
|
|
|
10.6
|
Crude Salt Field Acquisition Agreement by and between Shouguang City Haoyuan Chemical Co., Ltd. and State-Operated Shouguang Qingshuibo Farm dated December 30, 2010, incorporated herein by reference to Exhibit 10.1 to the Registrant’s Current Report on Form 8-K filed on January 4, 2011.
|
|
|
10.7
|
Attachment to the Crude Salt Field Acquisition Agreement by and between Shouguang City Haoyuan Chemical Co., Ltd. and State-Operated Shouguang Qingshuibo Farm dated December 30, 2010, incorporated herein by reference to Exhibit 10.2 to the Registrant’s Current Report on Form 8-K filed on January 4, 2011
|
|
|
10.8
|
Lease Contract dated November 5, 2010 by and between Shouguang City Haoyuan Chemical Co., Ltd. and State-Operated Shouguang Qingshuibo Farm, incorporated by reference to Exhibit 10.1 to the Registrant’s Current Report on Form 8-K filed on March 4, 2011.
|
|
|
10.9
|
Supplementary Agreement dated March 1, 2011 by and between Shouguang City Haoyuan Chemical Co., Ltd. and State-Operated Shouguang Qingshuibo Farm, incorporated by reference to Exhibit 10.2 to the Registrant’s Current Report on Form 8-K filed on March 4, 2011.
|
|
|
10.10
|
Bromine Factory Relocation Compensation Agreement dated August 22, 2011 by and between Yangkou Township People’s Government of Shouguang Municipality and Shouguang City Haoyuan Chemical Co., Ltd., incorporated by reference to Exhibit 10.1 to the Registrant’s Current Report on Form 8-K filed on August 25, 2011.
|
|
|
10.11
|
Asset Purchase Agreement dated December 22, 2011 by and between Shouguang City Haoyuan Chemical Co., Ltd, Gulf Resources, Inc., and Liangcai Zhang, incorporated by reference to Exhibit 10.1 to the Registrant’s Current Report on Form 8-K filed on December 22, 2011.
|
|
|
10.12
|
Commercial Property Purchase Agreement dated September 25, 2012 by and between Shandong Shouguang Vegetable Seed Industry Group Co., Ltd. and Shouguang Yuxin Chemical Industry Co., Ltd., incorporated by reference to Exhibit 10.1 to the Registrant’s Current Report on Form 8-K filed on October 1, 2012.
|
|
|
10.13
|
Asset Purchase Agreement dated November 26, 2012 by and between Gulf Resources, Inc., Shouguang City Haoyuan Chemical Co., Ltd, and Chengyong Zhao, incorporated by reference to Exhibit 10.1 to the Registrant’s Current Report on Form 8-K filed on November 28, 2012.
|
|
|
10.14
|
Translation of Bromine Factory Relocation Compensation Agreement dated September 25, 2013, incorporated by reference to Exhibit 10.1 to Registrant’s Current Report on 8-K filed on September 26, 2013.
|
|
|
10.15
10.16
|
Acquisition Agreement, dated January 12, 2015, incorporated by reference to Exhibit 10.1 to the Registrant’s Current Report on Form 8-K filed on January 14, 2015.
Lock-Up Agreement, dated February 4, 2015 incorporated by reference to Exhibit 10.1 to the Registrant’s Current Report on Form 8-K filed on February 5, 2015.
|
|
|
14
|
Code of Ethics, incorporated herein by reference to Exhibit 14 to the Registrant’ annual report on Form 10-K filed on March 16, 2009.
|
|
|
21.1
|
List of Subsidiaries, incorporated herein by reference to Exhibit 21.1 to the Registrant’s Annual Report on Form 10-K filed on March 12, 2008.
|
|
|
23.1
|
Consent of Morison Cogen LLP, an independent registered public accounting firm.*
|
|
55
|
|
|
|
| 31.1 | Certification pursuant to Rule 13a-14(a) and 15d-14(a), as adopted pursuant to Section 302 of the Sarbanes-Oxley Act of 2002.* | |
|
|
|
|
| 31.2 | Certification pursuant to Rule 13a-14(a) and 15d-14(a), as adopted pursuant to Section 302 of the Sarbanes-Oxley Act of 2002.* | |
|
32.1
|
Certification pursuant to 18 U.S.C. Section 1350, as adopted pursuant to Section 906 of the Sarbanes-Oxley Act of 2002. *
|
|
* Filed herewith.
56
SIGNATURES
Pursuant to the requirements of Section 13 or 15(d) of the Securities and Exchange Act, the Company has duly caused this Report to be signed on its behalf by the undersigned thereunto duly authorized.
Pursuant to the requirements of the Securities Exchange Act of 1934, the Company has duly caused this Report to be signed on its behalf by the undersigned, thereunto duly authorized.
|
Date: March 13, 2015
|
By:
|
/s/ Xiaobin Liu
|
|
By: Xiaobin Liu
|
||
|
Title: President and Chief Executive Officer
(principal executive officer)
|
|
By:
|
/s/ Min Li
|
|
|
By: Min Li
|
||
|
Title: Chief Financial Officer
(principal financial and accounting officer)
|
Pursuant to the requirements of the Securities and Exchange Act of 1934, this Report has been signed below by the following person on behalf of the Company and in the capacities and on the dates indicated.
|
SIGNATURE
|
TITLE
|
DATE
|
||
|
/s/ Xiaobin Liu
|
March 13, 2015
|
|||
|
Xiaobin Liu
|
Chief Executive Officer and Director
|
|||
|
/s/ Min Li
|
March 13, 2015
|
|||
|
Min Li
|
Chief Financial Officer
|
|||
|
/s/ Ming Yang
|
March 13, 2015
|
|||
|
Ming Yang
|
Director
|
|||
|
/s/ Naihui Miao
|
March 13, 2015
|
|||
|
Naihui Miao
|
Director
|
|||
|
/s/ Tengfei Zhang
|
March 13, 2015
|
|||
|
Tengfei Zhang
|
Director
|
|||
|
/s/ Yang Zou
|
March 13, 2015
|
|||
|
Yang Zou
|
Director
|
|||
|
/s/ Nan Li
|
March 13, 2015
|
|||
|
Nan Li
|
Director
|
|||
|
/s/ Shi Tong Jiang
|
March 13, 2015
|
|||
|
Shi Tong Jiang
|
Director
|
57