Attached files
| file | filename |
|---|---|
| EX-32.1 - GULF RESOURCES, INC. | e617453_ex32-1.htm |
| EX-31.2 - GULF RESOURCES, INC. | e617453_ex31-2.htm |
| EX-31.1 - GULF RESOURCES, INC. | e617453_ex31-1.htm |
UNITED STATES
SECURITIES AND EXCHANGE COMMISSION
Washington, D.C. 20549
FORM 10-Q
| ☒ | QUARTERLY REPORT PURSUANT TO SECTION 13 OR 15(d) OF THE SECURITIES EXCHANGE ACT OF 1934 |
| For the quarterly period ended September 30, 2017 | |
| Or | |
| ☐ | TRANSITION REPORT PURSUANT TO SECTION 13 OR 15(d) OF THE SECURITIES EXCHANGE ACT OF 1934 |
| For the transition period from _________ to _________ |
Commission File Number: 001-34499
GULF RESOURCES, INC.
(Exact name of registrant as specified in its charter)
| Nevada | 13-3637458 | |
| (State or other jurisdiction of incorporation or organization) | (I.R.S. Employer Identification No.) | |
|
Level 11,Vegetable Building, Industrial Park of the East Shouguang City, Shandong, |
262700 | |
| (Address of principal executive offices) | (Zip Code) |
Registrant’s telephone number, including area code: +86 (536) 567 0008
Indicate by check mark whether the registrant (1) has filed all reports required to be filed by Section 13 or 15(d) of the Securities Exchange Act of 1934 during the preceding 12 months (or for such shorter period that the registrant was required to file such reports), and (2) has been subject to such filing requirements for the past 90 days.
Yes ☒ No ☐
Indicate by check mark whether the registrant has submitted electronically and posted on its corporate Web site, if any, every, Interactive Data File required to be submitted and posted pursuant to Rule 405 of Regulation S-T (§232.405 of this chapter) during the preceding 12 months (or for such shorter period that the registrant was required to submit and post such files).
Yes ☒ No ☐
Indicate by check mark whether the registrant is a large accelerated filer, an accelerated filer, a non-accelerated filer, or a smaller reporting company. See the definitions of “large accelerated filer,” “accelerated filer” and “smaller reporting company” in Rule 12b-2 of the Exchange Act.
| Large accelerated filer ☐ | Accelerated filer ☐ | Emerging Growth Company ☐ |
| Non-accelerated filer (Do not check if a smaller reporting company) ☐ | Smaller reporting company ☒ | |
If an emerging growth company, indicate by check mark if the registrant has elected not to use the extended transition period for complying with any new or revised financial accounting standards provided pursuant to Section 13(a) of the Exchange Act. ☐
Indicate by check mark whether the registrant is a shell company (as defined in Rule 12b-2 of the Exchange Act).
Yes ☐ No ☒
As of November 8, 2017, the registrant had outstanding 46,803,791 shares of common stock.
PART I—FINANCIAL INFORMATION
| GULF RESOURCES, INC. |
| AND SUBSIDIARIES |
| CONDENSED CONSOLIDATED BALANCE SHEETS |
| (Expressed in U.S. dollars) |
| September 30, 2017 Unaudited | December 31, 2016 Audited | |||||||
| Current Assets | ||||||||
| Cash | $ | 193,385,686 | $ | 163,884,574 | ||||
| Accounts receivable | 71,792,364 | 51,835,218 | ||||||
| Inventories, net | 2,431,079 | 5,881,681 | ||||||
| Prepayments and deposits | 575,013 | 117,338 | ||||||
| Prepaid land leases | 381,588 | 47,255 | ||||||
| Other receivable | 2,066 | 1,424 | ||||||
| Total Current Assets | 268,567,796 | 221,767,490 | ||||||
| Non-Current Assets | ||||||||
| Property, plant and equipment, net | 97,623,268 | 108,731,126 | ||||||
| Property, plant and equipment under capital leases, net | 345,705 | 554,257 | ||||||
| Prepaid land leases, net of current portion | 4,796,415 | 4,754,169 | ||||||
| Deferred tax assets | 2,315,993 | 2,215,772 | ||||||
| Goodwill | 28,920,005 | 27,668,539 | ||||||
| Total non-current assets | 134,001,386 | 143,923,863 | ||||||
| Total Assets | $ | 402,569,182 | $ | 365,691,353 | ||||
| Liabilities and Stockholders’ Equity | ||||||||
| Current Liabilities | ||||||||
| Accounts payable and accrued expenses | $ | 4,342,615 | $ | 8,682,318 | ||||
| Retention payable | — | 733,869 | ||||||
| Capital lease obligation, current portion | 160,027 | 187,678 | ||||||
| Taxes payable | 2,960,147 | 4,341,331 | ||||||
| Total Current Liabilities | 7,462,789 | 13,945,196 | ||||||
| Non-Current Liabilities | ||||||||
| Capital lease obligation, net of current portion | 2,268,315 | 2,284,959 | ||||||
| Total Liabilities | $ | 9,731,104 | $ | 16,230,155 | ||||
| Stockholders’ Equity | ||||||||
| PREFERRED STOCK; $0.001 par value; 1,000,000 shares authorized; none outstanding | $ | — | $ | — | ||||
| COMMON STOCK; $0.0005 par value; 80,000,000 shares authorized; 47,052,940 and 47,052,940 shares issued; and 46,803,791 and 46,793,791 shares outstanding as of September 30, 2017 and December 31, 2016, respectively | 23,525 | 23,525 | ||||||
| Treasury stock; 249,149 and 259,149 shares as of September 30, 2017 and December 31, 2016 at cost | (554,870 | ) | (577,141 | ) | ||||
| Additional paid-in capital | 94,509,908 | 94,156,679 | ||||||
| Retained earnings unappropriated | 271,367,728 | 248,941,696 | ||||||
| Retained earnings appropriated | 25,737,372 | 22,910,966 | ||||||
| Accumulated other comprehensive income/(loss) | 1,754,415 | (15,994,527 | ) | |||||
| Total Stockholders’ Equity | 392,838,078 | 349,461,198 | ||||||
| Total Liabilities and Stockholders’ Equity | $ | 402,569,182 | $ | 365,691,353 | ||||
See accompanying notes to the condensed consolidated financial statements.
1
GULF RESOURCES, INC.
AND SUBSIDIARIES
CONDENSED CONSOLIDATED STATEMENTS OF INCOME AND COMPREHENSIVE INCOME
(Expressed in U.S. dollars)
(UNAUDITED)
| Three-Month Period Ended September 30, | Nine-Month Period Ended September 30, | |||||||||||||||
| 2017 | 2016 | 2017 | 2016 | |||||||||||||
| NET REVENUE | ||||||||||||||||
| Net revenue | $ | 23,840,391 | $ | 38,811,622 | $ | 104,160,873 | $ | 120,907,839 | ||||||||
| OPERATING INCOME (EXPENSE) | ||||||||||||||||
| Cost of net revenue | (14,518,439 | ) | (23,107,921 | ) | (61,664,044 | ) | (76,184,822 | ) | ||||||||
| Sales, marketing and other operating expenses | (65,599 | ) | (83,087 | ) | (242,045 | ) | (269,357 | ) | ||||||||
| Research and development cost | (42,074 | ) | (68,115 | ) | (169,246 | ) | (198,330 | ) | ||||||||
| Write-off/Impairment on property, plant and equipment | — | (90,395 | ) | — | (90,395 | ) | ||||||||||
| General and administrative expenses | (4,451,027 | ) | (1,613,933 | ) | (8,236,430 | ) | (4,539,845 | ) | ||||||||
| Other operating income | 72,000 | 108,029 | 281,613 | 328,550 | ||||||||||||
| (19,005,139 | ) | (24,855,422 | ) | (70,030,152 | ) | (80,954,199 | ) | |||||||||
| INCOME FROM OPERATIONS | 4,835,252 | 13,956,200 | 34,130,721 | 39,953,640 | ||||||||||||
| OTHER INCOME (EXPENSE) | ||||||||||||||||
| Interest expense | (40,092 | ) | (42,012 | ) | (124,068 | ) | (134,150 | ) | ||||||||
| Interest income | 139,801 | 120,054 | 398,382 | 356,828 | ||||||||||||
| INCOME BEFORE TAXES | 4,934,961 | 14,034,242 | 34,405,035 | 40,176,318 | ||||||||||||
| INCOME TAXES | (1,509,321 | ) | (3,518,529 | ) | (9,152,597 | ) | (9,996,622 | ) | ||||||||
| NET INCOME | $ | 3,425,640 | $ | 10,515,713 | $ | 25,252,438 | $ | 30,179,696 | ||||||||
| COMPREHENSIVE INCOME: | ||||||||||||||||
| NET INCOME | $ | 3,425,640 | $ | 10,515,713 | $ | 25,252,438 | $ | 30,179,696 | ||||||||
| OTHER COMPREHENSIVE INCOME (LOSS) | ||||||||||||||||
| - Foreign currency translation adjustments | 8,450,433 | (2,637,763 | ) | 17,748,942 | (10,505,475 | ) | ||||||||||
| COMPREHENSIVE INCOME | $ | 11,876,073 | $ | 7,877,950 | $ | 43,001,380 | $ | 19,674,221 | ||||||||
| EARNINGS PER SHARE: | ||||||||||||||||
| BASIC | $ | 0.07 | $ | 0.23 | $ | 0.54 | $ | 0.65 | ||||||||
| DILUTED | $ | 0.07 | $ | 0.23 | $ | 0.54 | $ | 0.65 | ||||||||
| WEIGHTED AVERAGE NUMBER OF SHARES: | ||||||||||||||||
| BASIC | 46,794,443 | 46,301,217 | 46,794,011 | 46,106,194 | ||||||||||||
| DILUTED | 46,897,995 | 46,309,250 | 46,833,030 | 46,560,937 | ||||||||||||
See accompanying notes to the condensed consolidated financial statements.
2
| GULF RESOURCES, INC. |
| AND SUBSIDIARIES |
| CONDENSED CONSOLIDATED STATEMENT OF STOCKHOLDERS’ EQUITY |
| NINE-MONTH PERIOD ENDED SEPTEMBER 30, 2017 |
| (Expressed in U.S. dollars) |
| Common stock | Accumulated | |||||||||||||||||||||||||||||||||||||||
| Number | Number | Number | Additional | Retained | Retained | other | ||||||||||||||||||||||||||||||||||
| of shares | of shares | of treasury | Treasury | paid-in | earnings | earnings | comprehensive | |||||||||||||||||||||||||||||||||
| issued | outstanding | stock | Amount | stock | capital | unappropriated | appropriated | Income/(loss) | Total | |||||||||||||||||||||||||||||||
BALANCE AT DECEMBER 31, 2016 Audited | 47,052,940 | 46,793,791 | 259,149 | $ | 23,525 | $ | (577,141 | ) | $ | 94,156,679 | $ | 248,941,696 | $ | 22,910,966 | $ | (15,994,527 | ) | $ | 349,461,198 | |||||||||||||||||||||
| Translation adjustment | — | — | — | — | — | — | — | 17,748,942 | 17,748,942 | |||||||||||||||||||||||||||||||
Common stock issued | — | 10,000 | (10,000 | — | 22,271 | (4,471 | ) | — | — | — | 17,800 | |||||||||||||||||||||||||||||
| Issuance of stock options to employees and directors | — | — | — | — | — | 357,700 | — | — | — | 357,700 | ||||||||||||||||||||||||||||||
| Net income for nine-month period ended September 30, 2017 | — | — | — | — | — | — | 25,252,438 | — | — | 25,252,438 | ||||||||||||||||||||||||||||||
| Transfer to statutory common reserve fund | — | — | — | — | — | — | (2,826,406 | ) | 2,826,406 | — | — | |||||||||||||||||||||||||||||
BALANCE AT SEPTEMBER 30, 2017 Unaudited | 47,052,940 | 46,803,791 | 249,149 | $ | 23,525 | $ | (554,870 | ) | $ | 94,509,908 | $ | 271,367,728 | $ | 25,737,372 | $ | 1,754,415 | $ | 392,838,078 | ||||||||||||||||||||||
See accompanying notes to the condensed consolidated financial statements.
3
| GULF RESOURCES, INC. |
| AND SUBSIDIARIES |
| CONDENED CONSOLIDATED STATEMENTS OF CASH FLOWS |
| (Expressed in U.S. dollars) |
| (UNAUDITED) |
Nine-Month Period Ended September 30, | ||||||||
| 2017 | 2016 | |||||||
| CASH FLOWS FROM OPERATING ACTIVITIES | ||||||||
| Net income | $ | 25,252,438 | $ | 30,179,696 | ||||
| Adjustments to reconcile net income to net cash provided by operating activities: | ||||||||
| Interest on capital lease obligation | 123,795 | 133,504 | ||||||
| Amortization of prepaid land leases | 717,969 | 514,455 | ||||||
| Depreciation and amortization | 16,042,003 | 19,031,650 | ||||||
| Write-off/Impairment loss on property, plant and equipment | — | 90,395 | ||||||
| Unrealized translation difference | 1,140,363 | (729,764 | ) | |||||
| Stock-based compensation expense-options | 357,700 | 17,400 | ||||||
| Shares issued from treasury stock for services | 17,800 | 15,000 | ||||||
| Changes in assets and liabilities: | ||||||||
| Accounts receivable | (16,557,825 | ) | (23,296,361 | ) | ||||
| Inventories | 3,668,582 | 1,219,588 | ||||||
| Prepayments and deposits | (9,126 | ) | (20,850 | ) | ||||
| Other receivable | (580 | ) | — | |||||
| Accounts payable and accrued expenses | (4,866,247 | ) | 941,315 | |||||
| Retention payable | (739,329 | ) | (356,348 | ) | ||||
| Taxes payable | (1,670,121 | ) | 1,474,602 | |||||
| Net cash provided by operating activities | 23,477,422 | 29,214,282 | ||||||
| CASH FLOWS USED IN INVESTING ACTIVITIES | ||||||||
| Payment land leases | (859,219 | ) | (673,934 | ) | ||||
| Purchase of property, plant and equipment | (623,735 | ) | (16,749,192 | ) | ||||
| Net cash used in investing activities | (1,482,954 | ) | (17,423,126 | ) | ||||
| CASH FLOWS USED IN FINANCING ACTIVITIES | ||||||||
| Repayment of capital lease obligation | (273,873 | ) | (287,387 | ) | ||||
| Net cash used in financing activities | (273,387 | ) | (287,387 | ) | ||||
| EFFECTS OF EXCHANGE RATE CHANGES ON CASH AND CASH EQUIVALENTS | 7,780,517 | (4,026,574 | ) | |||||
| NET INCREASE IN CASH AND CASH EQUIVALENTS | 29,501,112 | 7,477,195 | ||||||
| CASH AND CASH EQUIVALENTS - BEGINNING OF PERIOD | 163,884,574 | 133,606,392 | ||||||
| CASH AND CASH EQUIVALENTS - END OF PERIOD | $ | 193,385,686 | $ | 141,083,587 | ||||
| SUPPLEMENTAL DISCLOSURE OF CASH FLOW INFORMATION | ||||||||
| Cash paid during the periods for: | ||||||||
| Income taxes | $ | 9,590,640 | $ | 8,740,519 | ||||
| SUPPLEMENTAL DISCLOSURE OF NON-CASH FLOW INVESTING AND FINANCING ACTIVITIES | ||||||||
| Par value of common stock issued upon cashless exercise of options | $ | — | $ | 386 | ||||
See accompanying notes to the condensed consolidated financial statements.
4
GULF RESOURCES, INC.
AND SUBSIDIARIES
NOTES TO CONDENSED CONSOLIDATED FINANCIAL STATEMENTS
SEPTEMBER 30, 2017
(Expressed in U.S. dollars)
(UNAUDITED)
NOTE 1 – BASIS OF PRESENTATION AND SUMMARY OF SIGNIFICANT ACCOUNTING POLICIES
(a) Basis of Presentation and Consolidation
The accompanying condensed financial statements have been prepared by Gulf Resources, Inc., a Nevada corporation and its subsidiaries (collectively, the “Company”), in accordance with the instructions to Form 10-Q and, therefore, do not necessarily include all information and footnotes necessary for a fair statement of its financial position, results of operations and cash flows in accordance with accounting principles generally accepted in the United States (“US GAAP”).
In the opinion of management, the unaudited financial information for the three and nine months ended September 30, 2017 presented reflects all adjustments, which are only normal and recurring, necessary for a fair statement of results of operations, financial position and cash flows. These condensed financial statements should be read in conjunction with the financial statements included in the Company’s 2016 Form 10-K. Operating results for the interim periods are not necessarily indicative of operating results for an entire fiscal year.
The preparation of financial statements in conformity with US GAAP requires management to make estimates and assumptions that affect the amounts that are reported in the financial statements and accompanying disclosures. Although these estimates are based on management’s best knowledge of current events and actions that the Company may undertake in the future, actual results may be different from the estimates. The Company also exercises judgments in the preparation of these condensed financial statements in certain areas, including classification of leases and related party transactions.
On September 2, 2016, the Company announced the planned merger of two of its 100% owned subsidiaries, Shouguan Yuxin Chemical Co., Limited (“SYCI”) and Shouguan Rongyuan Chemical Co., Ltd (“SCRC”). On March 24, 2017, the legal process of the merger was completed and SCRC was officially deregistered on March 28, 2017. The results of these two subsidiaries were reported as SYCI in the three and nine months ended September 30, 2017.
The consolidated financial statements include the accounts of Gulf Resources, Inc. and its wholly-owned subsidiary, Upper Class Group Limited, a company incorporated in the British Virgin Islands, which owns 100% of Hong Kong Jiaxing Industrial Limited, a company incorporated in Hong Kong (“HKJI”). HKJI owns 100% of Shouguang City Haoyuan Chemical Company Limited ("SCHC") which owns 100% of Shouguang Yuxin Chemical Industry Co., Limited (“SYCI”) and Daying County Haoyuan Chemical Company Limited (“DCHC”). All material intercompany transactions have been eliminated on consolidation.
(b) Nature of the Business
The Company manufactures and trades bromine and crude salt through its wholly-owned subsidiary, Shouguang City Haoyuan Chemical Company Limited ("SCHC"), manufactures chemical products for use in the oil industry, pesticides, paper manufacturing industry and antibiotics for use by human and animals through its wholly-owned subsidiary, Shouguang Yuxin Chemical Industry Co., Limited ("SYCI") in the People’s Republic of China (“PRC”). DCHC was established to further explore and develop natural gas and brine resources (including bromine and crude salt) in PRC.
On September 1, 2017, the Company received notification from the government of Yangkou County, Shouguang City of PRC that production at all its factories be halted with immediate effect in order for the Company to perform rectification and improvement in accordance with the county’s new safety and environmental protection requirements. As such, direct labor and factory overhead costs (including depreciation of plant and machinery) of a total amount of $1,876,462 incurred in September 2017 which would have been presented in the cost of net revenue were presented as part of general and administrative expense in the three-month and nine-month periods ended September 30, 2017 (Note 19).
(c) Allowance for Doubtful Accounts
As of September 30, 2017 and December 31, 2016, allowances for doubtful accounts were nil. No allowances for doubtful accounts were charged to the condensed consolidated statements of income for the three-month and nine-month periods ended September 30, 2017 and 2016.
(d) Concentration of Credit Risk
The Company is exposed to credit risk in the normal course of business, primarily related to accounts receivable and cash and cash equivalents. Substantially all of the Company’s cash and cash equivalents are maintained with financial institutions in the PRC, namely, Industrial and Commercial Bank of China Limited, China Merchants Bank Company Limited and Sichuan Rural Credit Union, which are not insured or otherwise protected. The Company placed $193,385,686 and $163,884,574 with these institutions as of September 30, 2017 and December 31, 2016, respectively. The Company has not experienced any losses in such accounts in the PRC.
Concentrations of credit risk with respect to accounts receivable exists as the Company sells a substantial portion of its products to a limited number of customers. However, such concentrations of credit risks are limited since the Company performs ongoing credit evaluations of its customers’ financial condition and extends credit terms as and when appropriate. Approximately 38.0% and 61.6% of the balances of accounts receivable as of September 30, 2017 and December 31, 2016, respectively, are outstanding for less than three months. All outstanding receivables as of September 30, 2017 and December 31, 2016 are within the credit terms which range between 90 and 240 days. For the balances of accounts receivable aged more than 90 days as of September 30, 2017, approximately 30% were settled in October 2017. For the balances of all accounts receivable as of September 30, 2017, approximately 22% were settled in October 2017.
The rate of collection in October 2017 for accounts receivable aged more than 90 days as of September 30, 2017 was analyzed as follows:
| Accounts Receivable Aging | Percent Collected |
| 90-120 days | 19% |
| 121-150 days | 34% |
| 151-180 days | 18% |
| 181-210 days | 34% |
| 211-240 days | 100% |
5
GULF RESOURCES, INC.
AND SUBSIDIARIES
NOTES TO CONDENSED CONSOLIDATED FINANCIAL STATEMENTS
SEPTEMBER 30, 2017
(Expressed in U.S. dollars)
(UNAUDITED)
NOTE 1 – BASIS OF PRESENTATION AND SUMMARY OF SIGNIFICANT ACCOUNTING POLICIES – Continued
(e) Property, Plant and Equipment ( including Oil and gas properties)
Property, plant and equipment are stated at cost less accumulated depreciation and any impairment losses. Expenditures for new facilities or equipment, and major expenditures for betterment of existing facilities or equipment are capitalized and depreciated using the straight-line method at rates sufficient to depreciate such costs less 5% residual value over the estimated productive lives. All other ordinary repair and maintenance costs are expensed as incurred.
Mineral rights are recorded at cost less accumulated depreciation and any impairment losses. Mineral rights are amortized ratably over the term of the lease, or the equivalent term under the units of production method, whichever is shorter.
Construction in process primarily represents direct costs of construction of plant, machinery and equipment. Costs incurred are capitalized and transferred to property and equipment upon completion, at which time depreciation commences.
The Company’s depreciation and amortization policies on property, plant and equipment, other than mineral rights are as follows:
| Useful life (in years) | ||||
| Buildings (including salt pans) | 8 - 20 | |||
| Plant and machinery (including protective shells, transmission channels and ducts) | 3 - 8 | |||
| Motor vehicles | 5 | |||
| Furniture, fixtures and equipment | 3-8 | |||
Property, plant and equipment under the capital lease are depreciated over the shorter of their expected useful lives or the remaining term of the lease.
Producing oil and gas properties are depreciated on a unit-of-production basis over the proved developed reserves. Common facilities that are built specifically to service production directly attributed to designated oil and gas properties are depreciated based on the proved developed reserves of the respective oil and gas properties on a pro-rata basis. Common facilities that are not built specifically to service identified oil and gas properties are depreciated using the straight-line method over their estimated useful lives. Costs associated with significant development projects are not depreciated until commercial production commences and the reserves related to those costs are excluded from the calculation of depreciation.
(f) Retirement Benefits
Pursuant to the relevant laws and regulations in the PRC, the Company participates in a defined contribution retirement plan for its employees arranged by a governmental organization. The Company makes contributions to the retirement plan at the applicable rate based on the employees’ salaries. The required contributions under the retirement plans are charged to the condensed consolidated statement of income on an accrual basis when they are due. The Company’s contributions totaled $288,779 and $269,254 for the three-month period ended September 30, 2017 and 2016, respectively, and totaled $801,655 and $768,870 for the nine-month period ended September 30, 2017 and 2016, respectively.
(g) Revenue Recognition
The Company recognizes revenue, net of value-added tax, when persuasive evidence of an arrangement exists, delivery of the goods has occurred and customer acceptance has been obtained, which means the significant risks and ownership have been transferred to the customer, the price is fixed or determinable and collectability is reasonably assured.
6
GULF RESOURCES, INC.
AND SUBSIDIARIES
NOTES TO CONDENSED CONSOLIDATED FINANCIAL STATEMENTS
SEPTEMBER 30, 2017
(Expressed in U.S. dollars)
(UNAUDITED)
NOTE 1 – BASIS OF PRESENTATION AND SUMMARY OF SIGNIFICANT ACCOUNTING POLICIES – Continued
(h) Recoverability of Long-lived Assets
In accordance with Financial Accounting Standards Board (“FASB”) Accounting Standards Codification (“ASC”) 360-10-35 “Impairment or Disposal of Long-lived Assets”, long-lived assets to be held and used are analyzed for impairment whenever events or changes in circumstances indicate that the carrying amount of an asset may not be fully recoverable or that the useful lives of those assets are no longer appropriate. The Company evaluates at each balance sheet date whether events and circumstances have occurred that indicate possible impairment.
The Company determines the existence of such impairment by measuring the expected future cash flows (undiscounted and without interest charges) and comparing such amount to the carrying amount of the assets. An impairment loss, if one exists, is then measured as the amount by which the carrying amount of the asset exceeds the discounted estimated future cash flows. Assets to be disposed of are reported at the lower of the carrying amount or fair value of such assets less costs to sell. Asset impairment charges are recorded to reduce the carrying amount of the long-lived asset that will be sold or disposed of to their estimated fair values. Charges for the asset impairment reduce the carrying amount of the long-lived assets to their estimated salvage value in connection with the decision to dispose of such assets.
Production in all the factories of the Company was temporarily suspended from September 1, 2017 to allow for rectification and improvement in accordance with PRC’s new safety and environmental protection requirements. Due to this, the Company reviewed the possibility of impairment of its property, plant and equipment and determined that there will be no material effect on the financial statements.
For the three-month and nine-month periods ended September 30, 2016, certain property, plant and machinery, with net book values of $90,395 were replaced during the enhancement project to protective shells for transmission channels, write-offs of the same amounts, were made and included in write-off/impairment on property, plant and equipment.
(i) Basic and Diluted Earnings per Share of Common Stock
Basic earnings per common share are based on the weighted average number of shares outstanding during the periods presented. Diluted earnings per share are computed using weighted average number of common shares outstanding during the period increased to include the number of additional shares of common stock that would have been outstanding if the potentially dilutive outstanding stock options had been exercised. Potentially dilutive outstanding stock options that would have the effect of increasing diluted earnings per share are considered to be anti-dilutive, i.e. the exercise prices of the outstanding stock options are greater than the market price of the common stock. The number of anti-dilutive outstanding stock options which were excluded from the calculation of diluted earnings was 41,944 and 75,000 for the three-month period ended September 30, 2017 and 2016 respectively, and 35,366 and 136,875 for the nine-month period ended September 30, 2017 and 2016 respectively. These awards could be dilutive in the future if the market price of the common stock increases and is greater than the exercise price of these awards.
7
GULF RESOURCES, INC.
AND SUBSIDIARIES
NOTES TO CONDENSED CONSOLIDATED FINANCIAL STATEMENTS
SEPTEMBER 30, 2017
(Expressed in U.S. dollars)
(UNAUDITED)
NOTE 1 – BASIS OF PRESENTATION AND SUMMARY OF SIGNIFICANT ACCOUNTING POLICIES – Continued
(i) Basic and Diluted Earnings per Share of Common Stock – Continued
The following table sets forth the computation of basic and diluted earnings per share:
| Three-Month Period Ended September 30, | Nine-Month Period Ended September 30, | |||||||||||||||
| 2017 | 2016 | 2017 | 2016 | |||||||||||||
| Numerator | ||||||||||||||||
| Net income | $ | 3,425,640 | $ | 10,515,713 | $ | 25,252,438 | $ | 30,179,696 | ||||||||
| Denominator | ||||||||||||||||
| Basic: Weighted-average common shares outstanding during the period | 46,794,443 | 46,301,217 | 46,794,011 | 46,106,194 | ||||||||||||
| Add: Dilutive effect of stock options | 103,552 | 8,033 | 39,019 | 454,743 | ||||||||||||
| Diluted | 46,897,995 | 46,309,250 | 46,833,030 | 46,560,937 | ||||||||||||
| Earnings per share | ||||||||||||||||
| Basic | $ | 0.07 | $ | 0.23 | $ | 0.54 | $ | 0.65 | ||||||||
| Diluted | $ | 0.07 | $ | 0.23 | $ | 0.54 | $ | 0.65 | ||||||||
(j) Reporting Currency and Translation
The financial statements of the Company’s foreign subsidiaries are measured using the local currency, Renminbi (“RMB”), as the functional currency; whereas the functional currency and reporting currency of the Company is the United States dollar (“USD” or “$”).
As such, the Company uses the “current rate method” to translate its PRC operations from RMB into USD, as required under FASB ASC 830 “Foreign Currency Matters”. The assets and liabilities of its PRC operations are translated into USD using the rate of exchange prevailing at the balance sheet date. The capital accounts are translated at the historical rate. Adjustments resulting from the translation of the balance sheets of the Company’s PRC subsidiaries are recorded in stockholders’ equity as part of accumulated other comprehensive income. The statement of income and comprehensive income is translated at average rates during the reporting period. Gains or losses resulting from transactions in currencies other than the functional currencies are recognized in net income for the reporting periods as part of general and administrative expense. The statement of cash flows is translated at average rates during the reporting period, with the exception of issuance of shares and payment of dividends which are translated at historical rates.
(k) Foreign Operations
All of the Company’s operations and assets are located in PRC. The Company may be adversely affected by possible political or economic events in this country. The effect of these factors cannot be accurately predicted.
(l) Exploration Costs
Exploration costs including the cost of researching for appropriate places to drill wells and the cost of well drilling in search of potential natural brine, are charged to the income statement as incurred. Once the commercial viability of a project has been confirmed, all subsequent costs are capitalized.
For oil and gas properties, the successful efforts method of accounting is adopted. The Company carries exploratory well costs as an asset when the well has found a sufficient quantity of reserves to justify its completion as a producing well and where the Company is making sufficient progress assessing the reserves and the economic and operating viability of the project. Exploratory well costs not meeting these criteria are charged to expenses. Exploratory wells that discover potentially economic reserves in areas where major capital expenditure will be required before production would begin and when the major capital expenditure depends upon the successful completion of further exploratory work remain capitalized and are reviewed periodically for impairment.
(m) Goodwill
Goodwill represents the excess of the purchase price over the net of the fair value of the identifiable tangible and intangible assets acquired and the fair value of liabilities assumed in business acquisitions. Goodwill impairment is assessed based on qualitative factors to determine whether it is more likely than not that the fair value of a reporting entity is less than its carrying amount, including goodwill. If the Company determines that it is more likely than not that the fair value of a reporting entity is less than its carrying amount, the two-step goodwill impairment test will be performed. The Company performs its impairment assessment annually and between annual tests in certain circumstances and determined that the two-step goodwill impairment test is not required to be carried out as of September 30, 2017.
(n) New Accounting Pronouncements
Recently Adopted Accounting Pronouncements
In March 2016, the FASB issued ASU No. 2016-09, Compensation – Stock Compensation (Topic 718): Improvements to Employee Share-Based Payment Accounting, which simplifies several aspects of the accounting for share-based payment award transactions, including: (1) income tax consequences; (2) classification of awards as either equity or liabilities, and (3) classification on the statement of cash flows. For public companies, the amendments in this ASU are effective for annual periods beginning after December 15, 2016, and interim periods within those annual periods. The Company adopted the amendments in this Update as of January 1, 2017. There is no impact on the financial statements since any excess tax benefits were fully offset by a valuation allowance and not recognized for financial statement purposes.
Recently Issued Accounting Pronouncements Not Yet Adopted
In May 2014, the FASB issued ASU No. 2014-09, Revenue from Contracts with Customers (Topic 606). The core principle of the guidance is that an entity should recognize revenue to depict the transfer of promised goods or services to customers in an amount that reflects the consideration to which the entity expects to be entitled in exchange for those goods or services. In August 2015, FASB issued ASU 2015-14 which deferred the effective date of Update 2014-09 to annual reporting periods beginning after December 15, 2017. Early application is permitted only as of annual reporting periods beginning after December 15, 2016. The Company expects to adopt the new standard in the first quarter of 2018. The Company does not expect the adoption of this Update to have a material effect on the financial statements.
In February 2016, the FASB issued ASU No. 2016-02, Leases (Topic 842). The amendments in this Update specify the accounting for leases. The core principle of Topic 842 is that a lessee should recognize the assets and liabilities that arise from leases. For public business entities, the amendments in this Update are effective for fiscal years beginning after December 15, 2018, including interim periods within those fiscal years. The Company is evaluating the impact of this on the consolidated financial statements and related disclosures.
In August 2016, the FASB issued ASU No. 2016-15, Statement of Cash Flows (Topic 230), Classification of Certain Cash Receipts and Cash Payments. The Update addresses eight specific changes to how cash receipts and cash payments are presented and classified in the statement of cash flows. The amendments in this Update are effective for public business entities for fiscal years beginning after December 15, 2017, and interim periods within those fiscal years. Early adoption is permitted. An entity that elects early adoption must adopt all of the amendments in the same period. The amendments in this Update should be applied using a retrospective transition method to each period presented. If it is impracticable to apply the amendments retrospectively for some of the issues, the amendments for those issues would be applied prospectively as of the earliest date practicable. The Company does not expect the adoption of this Update to have a material effect on the financial statements.
In January 2017, the FASB issued ASU No. 2017-01, Business Combinations (Topic 805), Clarifying the Definition of a Business. The amendments in this Update provide a more robust framework to use in determining when a set of assets and activities is a business. The amendments in this Update are effective for annual periods beginning after December 15, 2017, including interim periods within those periods. The Company does not expect the adoption of this Update to have a material effect on the financial statements.
In January 2017, the FASB issued ASU No. 2017-04, Intangibles – Goodwill and Other (Topic 350), Simplifying the Test for Goodwill Impairment. To simplify the subsequent measurement of goodwill, the Board eliminated Step 2 from the goodwill impairment test. Instead, under the amendments in this Update, an entity should perform its annual, or interim, goodwill impairment test by comparing the fair value of a reporting unit with its carrying amount. An entity should recognize an impairment charge for the amount by which the carrying amount exceeds the reporting unit’s fair value; however, the loss recognized should not exceed the total amount of goodwill allocated to that reporting unit. A public business entity that is a U.S. Securities and Exchange Commission (SEC) filer should adopt the amendments in this Update for its annual or any interim goodwill impairment tests in fiscal years beginning after December 15, 2019. The Company is currently evaluating the effect of the adoption of this Update.
In May 2017, the FASB issued ASU 2017-09, Compensation – Stock Compensation (Topic 718), Scope of Modification Accounting. The amendments in this Update provide guidance about which changes to the terms or conditions of a share-based payment award require an entity to apply modification accounting. The amendments in this Update are effective for all entities for annual periods, and interim periods within those annual periods, beginning after December 15, 2017. The amendments in this Update should be applied prospectively to an award modified on or after the adoption date.
8
GULF RESOURCES, INC.
AND SUBSIDIARIES
NOTES TO CONDENSED CONSOLIDATED FINANCIAL STATEMENTS
SEPTEMBER 30, 2017
(Expressed in U.S. dollars)
(UNAUDITED)
NOTE 2 – INVENTORIES
Inventories consist of:
| September 30, 2017 | December 31, 2016 | |||||||
| Raw materials | $ | 449,575 | $ | 818,500 | ||||
| Finished goods | 1,981,504 | 4,370,331 | ||||||
| Work-in-process | — | 692,850 | ||||||
| $ | 2,431,079 | $ | 5,881,681 | |||||
NOTE 3 – PREPAID LAND LEASES
The Company prepaid its land leases with lease terms for periods ranging from one to fifty years to use the land on which the production facilities and warehouses of the Company are situated. The prepaid land lease is amortized on a straight line basis.
During the three-month period ended September 30, 2017, amortization of prepaid land leases totaled $488,848, of which $400,605 and $88,243 were recorded as cost of net revenue and administrative expenses, respectively. During the three-month period ended September 30, 2016, amortization of prepaid land leases totaled $259,194, respectively, which amounts were recorded as cost of net revenue. During the nine-month period ended September 30, 2017, amortization of prepaid land leases totaled $717,969, of which $629,727 and $88,243 were recorded as cost of net revenue and administrative expenses, respectively. During the nine-month period ended September 30, 2016, amortization of prepaid land leases totaled $514,454, respectively, which amounts were recorded as cost of net revenue.
The Company has the rights to use certain parcels of land located in Shouguang, PRC, through lease agreements signed with local townships or the government authority. For parcels of land that are collectively owned by local townships, the Company cannot obtain land use rights certificates. The parcels of land that the Company cannot obtain land use rights certificates cover a total of approximately 54.97 square kilometers with an aggregate carrying value of $876,461 and approximately 54.97 square kilometers with an aggregate carrying value of $620,978 as at September 30, 2017 and December 31, 2016, respectively.
NOTE 4 – PROPERTY, PLANT AND EQUIPMENT, NET
Property, plant and equipment, net consist of the following:
| September 30, 2017 | December 31, 2016 | |||||||
| At cost: | ||||||||
| Mineral rights | $ | 4,638,854 | $ | 4,438,115 | ||||
| Buildings | 66,796,949 | 63,601,451 | ||||||
| Plant and machinery | 191,789,494 | 183,243,077 | ||||||
| Motor vehicles | 8,656 | 8,282 | ||||||
| Furniture, fixtures and office equipment | 4,086,312 | 3,909,483 | ||||||
| Construction in process | — | 374,790 | ||||||
| Total | 267,320,265 | 255,575,198 | ||||||
| Less: Accumulated depreciation and amortization | (169,696,997 | ) | (146,844,072 | ) | ||||
| Net book value | $ | 97,623,268 | $ | 108,731,126 | ||||
The Company has certain buildings and salt pans erected on parcels of land located in Shouguang, PRC, and such parcels of land are collectively owned by local townships or the government. The Company has not been able to obtain property ownership certificates over these buildings and salt pans. The aggregate carrying values of these properties situated on parcels of the land are $34,822,905 and $35,184,613 as at September 30, 2017 and December 31, 2016, respectively.
9
GULF RESOURCES, INC.
AND SUBSIDIARIES
NOTES TO CONDENSED CONSOLIDATED FINANCIAL STATEMENTS
SEPTEMBER 30, 2017
(Expressed in U.S. dollars)
(UNAUDITED)
NOTE 4 – PROPERTY, PLANT AND EQUIPMENT, NET – Continued
During the three-month period ended September 30, 2017, depreciation and amortization expense totaled $5,155,187, of which $3,356,534 and $1,798,653 were recorded as cost of net revenue and administrative expenses, respectively. During the three-month period ended September 30, 2016, depreciation and amortization expense totaled $5,435,740, of which $5,104,288 and $331,452 were recorded as cost of net revenue and administrative expenses, respectively. During the nine-month period ended September 30, 2017, depreciation and amortization expense totaled $15,814,006, of which $13,430,768 and $2,383,238 were recorded as cost of net revenue and administrative expenses respectively. During the nine-month period ended September 30, 2016, depreciation and amortization expense totaled $18,783,424, of which $17,765,477 and $1,017,948 were recorded as cost of net revenue and administrative expenses respectively.
NOTE 5 – PROPERTY, PLANT AND EQUIPMENT UNDER CAPITAL LEASES, NET
Property, plant and equipment under capital leases, net consist of the following:
| September 30, 2017 | December 31, 2016 | |||||||
| At cost: | ||||||||
| Buildings | $ | 123,988 | $ | 118,623 | ||||
| Plant and machinery | 2,330,629 | 2,229,775 | ||||||
| Total | 2,454,617 | 2,348,398 | ||||||
| Less: Accumulated depreciation and amortization | (2,108,912 | ) | (1,794,141 | ) | ||||
| Net book value | $ | 345,705 | $ | 554,257 | ||||
The above buildings erected on parcels of land located in Shouguang, PRC, are collectively owned by local townships. The Company has not been able to obtain property ownership certificates over these buildings as the Company could not obtain land use rights certificates on the underlying parcels of land.
During the three-month period ended September 30, 2017 and 2016, depreciation and amortization expense totaled $77,527 and $81,618, respectively, which was recorded as cost of net revenue. During the nine-month period ended September 30, 2017 and 2016, depreciation and amortization expense totaled $227,998 and $248,226, respectively, which was recorded as cost of net revenue.
NOTE 6 – ACCOUNTS PAYABLE AND ACCRUED EXPENSES
Accounts payable and accrued expenses consist of the following:
| September 30, 2017 | December 31, 2016 | |||||||
| Accounts payable | $ | 3,437,703 | $ | 7,513,075 | ||||
| Salary payable | 385,686 | 319,489 | ||||||
| Social security insurance contribution payable | 133,109 | 119,444 | ||||||
| Other payables | 386,117 | 730,310 | ||||||
| Total | $ | 4,342,615 | $ | 8,682,318 | ||||
10
GULF RESOURCES, INC.
AND SUBSIDIARIES
NOTES TO CONDENSED CONSOLIDATED FINANCIAL STATEMENTS
SEPTEMBER 30, 2017
(Expressed in U.S. dollars)
(UNAUDITED)
NOTE 7 – RELATED PARTY TRANSACTIONS
During the three-month and nine-month periods ended September 30, 2017, the Company borrowed $100,000 and $350,000, respectively, from Jiaxing Lighting Appliance Company Limited (Jiaxing Lighting”), in which Mr. Ming Yang, a shareholder and the Chairman of the Company, has a 100% equity interest in Jiaxing Lighting. The amounts due to Jiaxing Lighting were unsecured, interest free and repayable on demand and were fully settled in the three-month period ended September 30, 2017. There was no balance owing to Jiaxing Lighting as of September 30, 2017 and December 31, 2016.
During the fiscal year 2013, the Company entered into an agreement with the Shandong Shouguang Vegetable Seed Industry Group Co., Ltd, a related party, to provide property management services for an annual amount of approximately $100,000 for five years from January 1, 2013 to December 31, 2017. The expenses associated with this agreement for the three month period ended September 30, 2017 and 2016 were $23,395 and $23,401. The expenses associated with this agreement for the nine month period ended September 30, 2017 and 2016 were $68,801 and $71,170.
NOTE 8 – TAXES PAYABLE
| Taxes payable consists of the following: |
| September 30, 2017 | December 31, 2016 | |||||||
| Income tax payable | $ | 1,582,939 | $ | 1,849,535 | ||||
| Natural resource tax | 18,599 | 651,230 | ||||||
| Value added tax payable | 456,166 | 887,913 | ||||||
| Land use right tax payable | 798,285 | 818,921 | ||||||
| Other tax payables | 104,158 | 133,732 | ||||||
| Total | $ | 2,960,147 | $ | 4,341,331 | ||||
NOTE 9 – CAPITAL LEASE OBLIGATIONS
The components of capital lease obligations are as follows:
| Imputed | September 30, | December 31, | ||||||||||
| Interest rate | 2017 | 2016 | ||||||||||
| Total capital lease obligations | 6.7% | $ | 2,428,342 | $ | 2,472,637 | |||||||
| Less: Current portion | (160,027 | ) | (187,678 | ) | ||||||||
| Capital lease obligations, net of current portion | $ | 2,268,315 | $ | 2,284,959 | ||||||||
Interest expenses from capital lease obligations amounted to $40,667 and $41,740 for the three-month period ended September 30, 2017 and 2016, respectively, which were charged to the condensed consolidated statement of income. Interest expenses from capital lease obligations amounted to $123,795 and $133,504 for the nine-month period ended September 30, 2017 and 2016, respectively, which were charged to the condensed consolidated statement of income.
NOTE 10 –EQUITY
| (a) | Authorized shares |
During the annual general meeting held on June 18, 2013, the shareholders of the Company approved the amendment to the Certificate of Incorporation to decrease the number of the authorized shares of the Company’s common stock to 80,000,000. The Company has completed the filing of the amendment and restatement of the Certificate of Incorporation with the Secretary of the State of Delaware to decrease the number of authorized shares of the Company’s common stock. Accordingly, 80,000,000 is disclosed as the authorized shares of the Company’s common stock in the consolidated balance sheets as of September 30, 2017 and December 31, 2016.
| (b) | Retained Earnings - Appropriated |
In accordance with the relevant PRC regulations and the PRC subsidiaries’ Articles of Association, the Company’s PRC subsidiaries are required to allocate a portion of its profit after tax to the following reserve:
Statutory Common Reserve Funds
SCHC, SYCI and DCHC are required each year to transfer at least 10% of the profit after tax as reported under the PRC statutory financial statements to the Statutory Common Reserve Funds until the balance reaches 50% of the registered share capital. This reserve can be used to make up any loss incurred or to increase share capital. Except for the reduction of losses incurred, any other application should not result in this reserve balance falling below 25% of the registered capital. The Statutory Common Reserve Fund as of September 30, 2017 for SCHC, SYCI and DCHC is 47%, 17% and 0% of its registered capital respectively.
NOTE 11 – TREASURY STOCK
In September 2017, the Company issued 10,000 shares of common stock from the treasury shares to one of its consultants. The shares were valued at the closing market price on the date of the agreement and recorded as general and administrative expense in the condensed consolidated statements of income and comprehensive income for the three and nine months ended September 30, 2017. The shares issued were deducted from the treasury shares at weighted average cost and the excess of the cost over the closing market price was charged to additional paid-in-capital.
11
GULF RESOURCES, INC.
AND SUBSIDIARIES
NOTES TO CONDENSED CONSOLIDATED FINANCIAL STATEMENTS
SEPTEMBER 30, 2017
(Expressed in U.S. dollars)
(UNAUDITED)
NOTE 12 – STOCK-BASED COMPENSATION
Pursuant to the Company’s Amended and Restated 2007 Equity Incentive Plan approved in 2011(“Plan”), the aggregate number of shares of the Company’s common stock available for grant and issuance of stock options is 4,341,989 shares. On October 5, 2015, during the annual meeting of the Company’s stockholders, the aggregate number of shares reserved and available for grant and issuance pursuant to the Plan was increased to 10,341,989. As of September 30, 2017, the number of shares of the Company’s common stock available for issuance under the Plan is 6,757,489.
The fair value of each option award below is estimated on the date of grant using the Black-Scholes option-pricing model. The risk free rate is based on the yield-to-maturity in continuous compounding of the US Government Bonds with the time-to-maturity similar to the expected tenor of the option granted, volatility is based on the annualized historical stock price volatility of the Company, and the expected life is based on the historical option exercise pattern.
On March 2, 2017, the Company granted to an independent director an option to purchase 12,500 shares of the Company’s common stock at an exercise price of $1.98 per share and the options vested immediately. The options were valued at $9,000 fair value, with assumed 57.42% volatility, a three-year expiration term, with an expected tenor of 1.69 years, a risk free rate of 1.59% and no dividend yield. For the three-month period ended March 31, 2017, $9,000 was recognized as general and administrative expenses.
On May 7, 2017, the Company granted to an independent director an option to purchase 12,500 shares of the Company’s common stock at an exercise price of $1.90 per share and the options vested immediately. The options were valued at $5,700 fair value, with assumed 45.71% volatility, a three-year expiration term with an expected tenor of 1.70 years, a risk free rate of 1.25% and no dividend yield. For the three-month period ended June 30, 2017, $5,700 was recognized as general and administrative expenses.
On July 1, 2017, the Company granted to an independent director an option to purchase 12,500 shares of the Company’s common stock at an exercise price of $1.62 per share and the options vested immediately. The options were valued at $4,500 fair value, with assumed 43.45% volatility, a three-year expiration term with expected tenor of 1.70 years, a risk free rate of 1.34% and no dividend yield. For the three-month period ended September 30, 2017, $4,500 was recognized as general and administrative expenses.
On August 23, 2017, the Company granted to 28 members of the management staff options to purchase 281,000 shares of the Company’s common stock, at an exercise price of $1.454 per share and the options vested immediately. The options were valued at $146,700 fair value, with assumed 42.65% volatility, a four-year expiration term with an expected tenor of 1.41 years, a risk free rate of 1.26% and no dividend yield. For the three-month period ended September 30, 2017, $146,700 was recognized as general and administrative expenses
On August 23, 2017, the Company granted to three directors options to purchase 300,000 shares of the Company’s common stock, at an exercise price of $1.454 per share and the options vested immediately. The options were valued at $191,800 fair value, with assumed 46.47% volatility, a four-year expiration term with an expected tenor of 2.26 years, a risk free rate of 1.34% and no dividend yield. For the three-month period ended September 30, 2017, $191,800 was recognized as general and administrative expenses
The following table summarizes all Company stock option transactions between January 1, 2017 and September 30, 2017.
| Number of Option and Warrants Outstanding and exercisable | Weighted- Average Exercise price of Option and Warrants | Range of Exercise Price per Common Share | |||||||||||
| Balance, January 1, 2017 | 185,000 | $ | 2.19 | $1.54 - $4.80 | |||||||||
Granted and vested during the period Ended September 30, 2017 | 618,500 | $ | 1.48 | $1.45-$1.98 | |||||||||
Expired during the period ended September 30, 2017 | (37,500 | ) | $ | 2.18 | $1.83-$2.55 | ||||||||
| Balance, September 30, 2017 | 766,000 | $ | 1.62 | $1.45 - $4.80 | |||||||||
12
GULF RESOURCES, INC.
AND SUBSIDIARIES
NOTES TO CONDENSED CONSOLIDATED FINANCIAL STATEMENTS
SEPTEMBER 30, 2017
(Expressed in U.S. dollars)
(UNAUDITED)
NOTE 12 – STOCK-BASED COMPENSATION – Continued
| Stock and Warrants Options Exercisable and Outstanding | |||||||
| Weighted Average | |||||||
| Remaining | |||||||
| Outstanding at September 30, 2017 |
Range of Exercise Prices |
Contractual Life (Years) |
|||||
|
Exercisable and outstanding |
766,000 | $1.45 - $4.80 | 3.37 | ||||
The aggregate intrinsic value of options outstanding and exercisable as of September 30, 2017 was $267,966.
NOTE 13 – INCOME TAXES
The Company utilizes the asset and liability method of accounting for income taxes in accordance with FASB ASC 740-10.
(a) United States
Gulf Resources, Inc. may be subject to the United States of America Tax law at a tax rate of 35%. No provision for the US federal income taxes has been made as the Company had no US taxable income for the three-month and nine-month periods ended September 30, 2017 and 2016, and management believes that its earnings are permanently invested in the PRC.
(b) BVI
Upper Class Group Limited, a subsidiary of Gulf Resources, Inc., was incorporated in the BVI and, under the current laws of the BVI, it is not subject to tax on income or capital gain in the BVI. Upper Class Group Limited did not generate assessable profit for the three-month and nine-month periods ended September 30, 2017 and 2016.
(c) Hong Kong
Hong Kong Jiaxing Industrial Limited, a subsidiary of Upper Class Group Limited, was incorporated in Hong Kong and is subject to Hong Kong profits tax. The Company is subject to Hong Kong taxation on its activities conducted in Hong Kong and income arising in or derived from Hong Kong. No provision for profits tax has been made as the Company has no assessable income for the three-month and nine-month periods ended September 30, 2017 and 2016. The applicable statutory tax rates for the three-month and nine-month periods ended September 30, 2017 and 2016 are 16.5%. There is no dividend withholding tax in Hong Kong.
(d) PRC
Enterprise income tax (“EIT”) for SCHC, SYCI and DCHC in the PRC is charged at 25% of the assessable profits.
The operating subsidiaries SCHC, SYCI and DCHC are wholly foreign-owned enterprises (“FIE”) incorporated in the PRC and are subject to PRC Foreign Enterprise Income Tax Law.
On February 22, 2008, the Ministry of Finance (“MOF”) and the State Administration of Taxation (“SAT”) jointly issued Cai Shui [2008] Circular 1 (“Circular 1”). According to Article 4 of Circular 1, distributions of accumulated profits earned by a FIE prior to January 1, 2008 to foreign investor(s) in 2008 will be exempted from withholding tax (“WHT”) while distribution of the profit earned by an FIE after January 1, 2008 to its foreign investor(s) shall be subject to WHT at 5% effective tax rate.
As of September 30, 2017 and December 31, 2016, the accumulated distributable earnings under the Generally Accepted Accounting Principles (GAAP”) of PRC are $312,552,128 and $274,769,840, respectively. Since the Company intends to reinvest its earnings to further expand its businesses in mainland China, its foreign invested enterprises do not intend to declare dividends to their immediate foreign holding companies in the foreseeable future. Accordingly, as of September 30, 2017 and December 31, 2016, the Company has not recorded any WHT on the cumulative amount of distributable retained earnings of its foreign invested enterprises in China. As of September 30, 2017 and December 31, 2016, the unrecognized WHT are $14,601,406 and $12,756,698, respectively.
13
GULF RESOURCES, INC.
AND SUBSIDIARIES
NOTES TO CONDENSED CONSOLIDATED FINANCIAL STATEMENTS
SEPTEMBER 30, 2017
(Expressed in U.S. dollars)
(UNAUDITED)
NOTE 13 – INCOME TAXES – Continued
The Company’s tax returns are subject to the various tax authorities’ examination. The federal, state and local authorities of the United States may examine the Company’s tax returns filed in the United States for three years from the date of filing. The Company’s US tax returns since 2013 are currently subject to examination. Inland Revenue Department of Hong Kong may examine the Company’s tax returns filed in Hong Kong for seven years from date of filing. The Company’s Hong Kong tax returns since 2010 are currently subject to examination.
The components of the provision for income taxes from continuing operations are:
| Three-Month Period Ended September 30, | Nine-Month Period Ended September 30, | |||||||||||||||
| 2017 | 2016 | 2017 | 2016 | |||||||||||||
| Current taxes – PRC | $ | 1,509,321 | $ | 3,518,529 | $ | 9,152,597 | $ | 9,996,622 | ||||||||
| Deferred taxes – PRC | — | — | — | — | ||||||||||||
| $ | 1,509,321 | $ | 3,518,529 | $ | 9,152,597 | $ | 9,996,622 | |||||||||
The effective income tax expenses differ from the PRC statutory income tax rate of 25% from continuing operations in the PRC as follows:
| Three-Month Period Ended September 30, | Nine-Month Period Ended September 30, | |||||||||||||||
| Reconciliations | 2017 | 2016 | 2017 | 2016 | ||||||||||||
| Statutory income tax rate | 25 | % | 25 | % | 25 | % | 25 | % | ||||||||
| Non-deductible (Non-taxable)item | 3 | % | — | 1 | % | — | ||||||||||
| Change in valuation allowance - US federal net operating loss | 3 | % | — | 1 | % | — | ||||||||||
| Effective tax rate | 31 | % | 25 | % | 27 | % | 25 | % | ||||||||
Significant components of the Company’s deferred tax assets and liabilities at September 30, 2017 and December 30, 2016 are as follows:
| September 30, 2017 | December 31, 2016 | |||||||
| Deferred tax liabilities | $ | — | $ | — | ||||
| Deferred tax assets: | ||||||||
| Allowance for obsolete and slow-moving inventories | $ | — | $ | — | ||||
| Impairment on property, plant and equipment | 440,152 | 421,106 | ||||||
| Exploration costs | 1,875,841 | 1,794,666 | ||||||
| Compensation costs of unexercised stock options | 452,386 | 120,986 | ||||||
| US federal net operating loss | 11,723,000 | 11,575,000 | ||||||
| Total deferred tax assets | 14,491,379 | 13,911,758 | ||||||
| Valuation allowance | (12,175,386 | ) | (11,695,986 | ) | ||||
| Net deferred tax asset | $ | 2,315,993 | $ | 2,215,772 | ||||
14
GULF RESOURCES, INC.
AND SUBSIDIARIES
NOTES TO CONDENSED CONSOLIDATED FINANCIAL STATEMENTS
SEPTEMBER 30, 2017
(Expressed in U.S. dollars)
(UNAUDITED)
NOTE 13 – INCOME TAXES – Continued
The increase in valuation allowance for each of the three-month periods ended September 30, 2017 and 2016 is $406,000 and $227,574, respectively.
The increase in valuation allowance for the nine-month period ended September 30, 2017 is $479,400.
The increase in valuation allowance for the nine-month period ended September 30, 2016 is $127,424.
There were no unrecognized tax benefits and accrual for uncertain tax positions as of September 30, 2017 and December 31, 2016.
NOTE 14 – BUSINESS SEGMENTS
The Company has four reportable segments: bromine, crude salt, chemical products and natural gas. The reportable segments are consistent with how management views the markets served by the Company and the financial information that is reviewed by its chief operating decision maker.
An operating segment’s performance is primarily evaluated based on segment operating income, which excludes share-based compensation expense, certain corporate costs and other income not associated with the operations of the segment. These corporate costs (income) are separately stated below and also include costs that are related to functional areas such as accounting, treasury, information technology, legal, human resources, and internal audit. The Company believes that segment operating income, as defined above, is an appropriate measure for evaluating the operating performance of its segments. All the customers are located in PRC.
Three-Month Period Ended September 30, 2017 | Bromine* | Crude Salt* | Chemical Products | Natural Gas | Segment Total | Corporate | Total | |||||||||||||||||||||
| Net revenue (external customers) | $ | 9,549,777 | $ | 2,054,729 | $ | 12,235,885 | $ | — | $ | 23,840,391 | $ | — | $ | 23,840,391 | ||||||||||||||
| Net revenue (intersegment) | 1,216,406 | — | — | — | 1,216,406 | — | 1,216,406 | |||||||||||||||||||||
| Income from operations before taxes | 2,257,069 | 497,783 | 3,176,458 | (33,184 | ) | 5,898,126 | (1,062,874 | ) | 4,835,252 | |||||||||||||||||||
| Income taxes | 564,267 | 117,494 | 827,560 | — | 1,509,321 | — | 1,509,321 | |||||||||||||||||||||
| Income from operations after taxes | 1,692,802 | 380,289 | 2,348,898 | (33,184 | ) | 4,388,805 | (1,062,874 | ) | 3,325,931 | |||||||||||||||||||
| Total assets | 161,722,622 | 36,586,589 | 202,404,825 | 1,815,010 | 402,529,046 | 40,136 | 402,569,182 | |||||||||||||||||||||
| Depreciation and amortization | 3,556,296 | 765,183 | 911,235 | — | 5,232,714 | — | 5,232,714 | |||||||||||||||||||||
| Capital expenditures | 466,636 | 95,864 | — | 1,260 | 563,760 | — | 563,760 | |||||||||||||||||||||
| Goodwill | — | — | 28,920,005 | — | 28,920,005 | — | 28,920,005 | |||||||||||||||||||||
Three-Month Period Ended September 30, 2016 | Bromine* | Crude Salt* | Chemical Products | Natural Gas | Segment Total | Corporate | Total | |||||||||||||||||||||
| Net revenue (external customers) | $ | 15,971,847 | $ | 2,310,799 | $ | 20,528,976 | $ | — | $ | 38,811,622 | $ | — | $ | 38,811,622 | ||||||||||||||
| Net revenue (intersegment) | 2,008,397 | — | — | — | 2,008,397 | — | 2,008,397 | |||||||||||||||||||||
| Income from operations before taxes | 7,898,302 | (382,917 | ) | 6,442,708 | (2,476 | ) | 13,955,617 | 583 | 13,956,200 | |||||||||||||||||||
| Income taxes | 1,974,576 | (97,982 | ) | 1,641,935 | — | 3,518,529 | — | 3,518,529 | ||||||||||||||||||||
| Income from operations after taxes | 5,923,726 | (284,935 | ) | 4,800,773 | (2,476 | ) | 10,437,088 | 583 | 10,437,671 | |||||||||||||||||||
| Total assets | 150,950,225 | 32,757,666 | 192,128,326 | 1,687,960 | 377,524,177 | 183,416 | 377,707,593 | |||||||||||||||||||||
| Depreciation and amortization | 3,121,243 | 1,315,140 | 1,080,975 | — | 5,517,358 | — | 5,517,358 | |||||||||||||||||||||
| Capital expenditures | 12,890,713 | 2,336,309 | — | 651,295 | 15,878,317 | — | 15,878,317 | |||||||||||||||||||||
| Goodwill | — | — | 28,743,418 | — | 28,743,418 | — | 28,743,418 | |||||||||||||||||||||
15
GULF RESOURCES, INC.
AND SUBSIDIARIES
NOTES TO CONDENSED CONSOLIDATED FINANCIAL STATEMENTS
SEPTEMBER 30, 2017
(Expressed in U.S. dollars)
(UNAUDITED)
NOTE 14 – BUSINESS SEGMENTS – Continued
Nine-Month Period Ended September 30, 2017 | Bromine* | Crude Salt* | Chemical Products | Natural Gas | Segment Total | Corporate | Total | |||||||||||||||||||||
| Net revenue (external customers) | $ | 41,895,304 | $ | 6,390,390 | $ | 55,875,179 | $ | — | $ | 104,160,873 | $ | — | $ | 104,160,873 | ||||||||||||||
| Net revenue (intersegment) | 6,305,642 | — | — | — | 6,305,642 | — | 6,305,642 | |||||||||||||||||||||
| Income (loss) from operations before taxes | 17,269,984 | 2,434,872 | 16,441,115 | (90,471 | ) | 36,055,500 | (1,924,779 | ) | 34,130,721 | |||||||||||||||||||
| Income taxes | 4,358,455 | 586,240 | 4,207,902 | — | 9,152,597 | — | 9,152,597 | |||||||||||||||||||||
| Income (loss) from operations after taxes | 12,911,529 | 1,848,632 | 12,233,213 | (90,471 | ) | 26,902,903 | (1,924,779 | ) | 24,978,124 | |||||||||||||||||||
| Total assets | 161,722,622 | 36,586,589 | 202,404,825 | 1,815,010 | 402,529,046 | 40,136 | 402,569,182 | |||||||||||||||||||||
| Depreciation and amortization | 11,349,477 | 1,843,856 | 2,848,670 | — | 16,042,003 | — | 16,042,003 | |||||||||||||||||||||
| Capital expenditures | 466,636 | 95,864 | 61,235 | — | 623,735 | — | 623,735 | |||||||||||||||||||||
| Goodwill | — | — | 28,920,005 | — | 28,920,005 | — | 28,920,005 | |||||||||||||||||||||
Nine-Month Period Ended September 30, 2016 | Bromine* | Crude Salt* | Chemical Products | Natural Gas | Segment Total | Corporate | Total | |||||||||||||||||||||
| Net revenue (external customers) | $ | 47,621,980 | $ | 6,383,095 | $ | 66,902,764 | $ | — | $ | 120,907,839 | $ | — | $ | 120,907,839 | ||||||||||||||
| Net revenue (intersegment) | 6,501,530 | — | — | — | 6,501,530 | — | 6,501,530 | |||||||||||||||||||||
| Income (loss) from operations before taxes | 19,103,472 | (165,403 | ) | 20,698,116 | (2,501 | ) | 39,633,684 | 319,956 | 39,953,640 | |||||||||||||||||||
| Income taxes | 4,775,868 | (46,369 | ) | 5,267,123 | — | 9,996,622 | — | 9,996,622 | ||||||||||||||||||||
| Income (loss) from operations after taxes | 14,327,604 | (119,034 | ) | 15,430,993 | (2,501 | ) | 29,637,062 | 319,956 | 29,957,018 | |||||||||||||||||||
| Total assets | 150,950,225 | 32,757,666 | 192,128,326 | 1,687,960 | 377,524,177 | 183,416 | 377,707,593 | |||||||||||||||||||||
| Depreciation and amortization | 11,633,581 | 3,847,502 | 3,550,567 | — | 19,031,650 | — | 19,031,650 | |||||||||||||||||||||
| Capital expenditures | 12,943,491 | 2,340,817 | — | 1,464,884 | 16,749,192 | — | 16,749,192 | |||||||||||||||||||||
| Goodwill | — | — | 28,743,418 | — | 28,743,418 | — | 28,743,418 | |||||||||||||||||||||
* Common production overheads, operating and administrative expenses and asset items (mainly cash and certain office equipment) of bromine and crude salt segments in SCHC were split by reference to the average selling price and production volume of respective segment.
| Three-Month Period Ended September 30, | Nine-Month Period Ended September 30, | |||||||||||||||
| Reconciliations | 2017 | 2016 | 2017 | 2016 | ||||||||||||
| Total segment operating income | $ | 5,898,126 | $ | 13,955,617 | $ | 36,055,500 | $ | 39,633,684 | ||||||||
| Corporate costs | (526,421 | ) | (180,447 | ) | (784,416 | ) | (409,808 | ) | ||||||||
| Unrealized translation difference | (536,453 | ) | 181,030 | (1,140,363 | ) | 729,764 | ||||||||||
| Income from operations | 4,835,252 | 13,956,200 | 34,130,721 | 39,953,640 | ||||||||||||
| Other income, net of expense | 99,709 | 78,042 | 274,314 | 222,678 | ||||||||||||
| Income before taxes | $ | 4,934,961 | $ | 14,034,242 | $ | 34,405,035 | $ | 40,176,318 | ||||||||
16
GULF RESOURCES, INC.
AND SUBSIDIARIES
NOTES TO CONDENSED CONSOLIDATED FINANCIAL STATEMENTS
SEPTEMBER 30, 2017
(Expressed in U.S. dollars)
(UNAUDITED)
NOTE 14 – BUSINESS SEGMENTS – Continued
The following table shows the major customer(s) (10% or more) for the three-month period ended September 30, 2017.
| Number | Customer |
Bromine (000’s) |
Crude Salt (000’s) |
Chemical Products (000’s) |
Total Revenue (000’s) |
Percentage of Total Revenue (%) |
|||||||||||||||||
| 1 | Shandong Morui Chemical Company Limited | $ | 1,938 | $ | 809 | $ | 695 | $ | 3,442 | 14.4% | |||||||||||||
The following table shows the major customer(s) (10% or more) for the nine-month period ended September 30, 2017.
| Number | Customer |
Bromine (000’s) |
Crude Salt (000’s) |
Chemical Products (000’s) |
Total Revenue (000’s) |
Percentage of Total Revenue (%) |
|||||||||||||||||
| 1 | Shandong Morui Chemical Company Limited | $ | 7,643 | $ | 2,059 | $ | 3,463 | $ | 13,165 | 12.6% | |||||||||||||
The following table shows the major customer(s) (10% or more) for the three-month period ended September 30, 2016.
| Number | Customer |
Bromine (000’s) |
Crude Salt (000’s) |
Chemical Products (000’s) |
Total Revenue (000’s) |
Percentage of Total Revenue (%) |
|||||||||||||||||
| 1 | Shandong Morui Chemical Company Limited | $ | 2,538 | $ | 747 | $ | 1,324 | $ | 4,609 | 11.9% | |||||||||||||
The following table shows the major customer(s) (10% or more) for the nine-month period ended September 30, 2016.
| Number | Customer |
Bromine (000’s) |
Crude Salt (000’s) |
Chemical Products (000’s) |
Total Revenue (000’s) |
Percentage of Total Revenue (%) |
|||||||||||||||||
| 1 | Shandong Morui Chemical Company Limited | $ | 8,230 | $ | 1,919 | $ | 4,321 | $ | 14,470 | 12.0% | |||||||||||||
NOTE 15 – CUSTOMER CONCENTRATION
The Company sells a substantial portion of its products to a limited number of customers. During the three-month and nine-month periods ended September 30, 2017, the Company sold 36.0% and 35.2% of its products to its top five customers, respectively. As of September 30, 2017, amounts due from these customers were $39,124,728. During the three-month and nine-month periods ended September 30, 2016, the Company sold 34.6% and 34.3% of its products to its top five customers, respectively. As of September 30, 2016, amounts due from these customers were $31,621,828. This concentration makes the Company vulnerable to a near-term severe impact, should the relationships be terminated.
17
GULF RESOURCES, INC.
AND SUBSIDIARIES
NOTES TO CONDENSED CONSOLIDATED FINANCIAL STATEMENTS
SEPTEMBER 30, 2017
(Expressed in U.S. dollars)
(UNAUDITED)
NOTE 16 – MAJOR SUPPLIERS
During the three-month and nine-month periods ended September 30, 2017, the Company purchased 71.6% and 68.2% of its raw materials from its top five suppliers, respectively. As of September 30, 2017, amounts due to those suppliers included in accounts payable were $1,353,182. During the three-month and nine-month periods ended September 30, 2016, the Company purchased 56.2% and 55.2% of its raw materials from its top five suppliers, respectively. As of September 30, 2016, amounts due to those suppliers included in accounts payable were $4,104,237. This concentration makes the Company vulnerable to a near-term severe impact, should the relationships be terminated.
NOTE 17 – FAIR VALUE OF FINANCIAL INSTRUMENTS
The carrying values of financial instruments, which consist of cash, accounts receivable and accounts payable and other payables, approximate their fair values due to the short-term nature of these instruments. There were no material unrecognized financial assets and liabilities as of September 30, 2017 and December 31, 2016.
NOTE 18 – CAPITAL COMMITMENT AND OPERATING LEASE COMMITMENTS
As of September 30, 2017, the Company leased real property adjacent to Factory No. 1, with the related production facility, channels and ducts, other production equipment and the buildings located on the property, under a capital lease. The future minimum lease payments required under the capital lease, together with the present value of such payments, are included in the table shown below.
The Company has leased nine parcels of land under non-cancelable operating leases, which are fixed rentals and expire through December 2021, December 2023,December 2030, December 2031, December 2032, December 2040, February 2059, August 2059 and June 2060, respectively.
The following table sets forth the Company’s contractual obligations as of September 30, 2017:
| Capital Lease Obligations | Operating Lease Obligations | Property Management Fees | ||||||||||
| Payable within: | ||||||||||||
| the next 12 months | $ | 282,808 | $ | 973,544 | $ | 23,499 | ||||||
| the next 13 to 24 months | 282,808 | 996,682 | — | |||||||||
| the next 25 to 36 months | 282,808 | 1,017,918 | — | |||||||||
| the next 37 to 48 months | 282,808 | 1,043,191 | — | |||||||||
| the next 49 to 60 months | 282,808 | 897,662 | — | |||||||||
| thereafter | 2,262,459 | 16,326,743 | — | |||||||||
| Total | $ | 3,676,499 | $ | 21,255,740 | $ | 23,499 | ||||||
Less: Amount representing interest | (1,248,157 | ) | ||||||||||
| Present value of net minimum lease payments | $ | 2,428,342 | ||||||||||
18
GULF RESOURCES, INC.
AND SUBSIDIARIES
NOTES TO CONDENSED CONSOLIDATED FINANCIAL STATEMENTS
SEPTEMBER 30, 2017
(Expressed in U.S. dollars)
(UNAUDITED)
NOTE 18 – CAPITAL COMMITMENT AND OPERATING LEASE COMMITMENTS – Continued
Rental expenses related to operating leases of the Company amounted to $264,113 and $259,196, which were charged to the condensed consolidated statements of income for the three months ended September 30, 2017 and 2016, respectively. Rental expenses related to operating leases of the Company amounted to $775,680 and $783,820, which were charged to the income statements for the nine months ended September 30, 2017 and 2016, respectively.
NOTE 19 – SUBSEQUENT EVENTS
On September 1, 2017 the Company announced it received notification from the government of Yangkou County, Shouguang City that production at its factories had to be halted in order for the Company to perform rectification and improvement in accordance with the country's new safety, environmental protection requirements.
On October 27, 2017, the Company and the government agreed on a plan for SCHC which the Company believes will cost approximately US$35 million to undertake and complete all the rectification steps. The Company believes that the rectification for all of the bromine business will be completed and that operations will recommence by the end of March 2018. However, the Company will try its best to implement the measures quickly to commence production for part of its bromine factories before this date. As of the date of filing of this report, the Company is in discussion with the government to arrive at a rectification plan for its chemical business.
19
Item 2. Management’s Discussion and Analysis of Financial Condition and Results of Operations
Cautionary Note Regarding Forward-Looking Statements
The discussion below contains “forward-looking statements” within the meaning of the Private Securities Litigation Reform Act of 1995, Section 27A of the Securities Act, and Section 21E of the Exchange Act. We have used words such as “believes,” “intends,” “anticipates,” “expects” and similar expressions to identify forward-looking statements. These statements are based on information currently available to us and are subject to a number of risks and uncertainties that may cause our actual results of operations, financial condition, cash flows, performance, business prospects and opportunities and the timing of certain events to differ materially from those expressed in, or implied by, these statements. These risks, uncertainties and other factors include, without limitation, those matters discussed in Item 1A of Part I of our 2016 Form 10-K. Except as expressly required by the federal securities laws, we undertake no obligation to update such factors or to publicly announce the results of any of the forward-looking statements contained herein to reflect future events, developments, or changed circumstances, or for any other reason. The following discussion should be read in conjunction with our consolidated financial statements and notes thereto appearing in our 2016 Form 10-K and Item 1A, “Risk Factors” for the year ended December 31, 2016.
Overview
We are a holding company which conducts operations through our wholly-owned China-based subsidiaries. Our business is conducted and reported in four segments, namely, bromine, crude salt, chemical products and natural gas.
Through our wholly-owned subsidiary, SCHC, we produce and trade bromine and crude salt. We are one of the largest producers of bromine in China, as measured by production output. Elemental bromine is used to manufacture a wide variety of bromine compounds used in industry and agriculture. Bromine also is used to form intermediary chemical compounds such as Tetramethylbenzidine. Bromine is commonly used in brominated flame retardants, fumigants, water purification compounds, dyes, medicines and disinfectants. Crude salt is the principal material in alkali production as well as chlorine alkali production and is widely used in the chemical, food and beverage, and other industries.
Through our wholly-owned subsidiary, SYCI, we manufacture and sell chemical products used in oil and gas field exploration, oil and gas distribution, oil field drilling, wastewater processing, papermaking chemical agents, inorganic chemicals and manufacture and sell chemical products that are used for human and animal antibiotics.
On December 12, 2006, we acquired, through a share exchange, Upper Class Group Limited, a British Virgin Islands holding corporation which then owned all of the outstanding shares of SCHC. Under accounting principles generally accepted in the United States, the share exchange is considered to be a capital transaction in substance, rather than a business combination. That is, the share exchange is equivalent to the issuance of stock by Upper Class for the net assets of our Company, accompanied by a recapitalization, and is accounted for as a change in capital structure. Accordingly, the accounting for the share exchange was identical to that resulting from a reverse acquisition, except no goodwill was recorded. Under reverse takeover accounting, the post reverse acquisition comparative historical consolidated financial statements of the legal acquirer, our Company, are those of the legal acquiree, Upper Class Group Limited, which is considered to be the accounting acquirer. Share and per share amounts reflected in this report have been retroactively adjusted to reflect the merger.
On February 5, 2007, the Company, acting through SCHC, acquired SYCI. Since the ownership of the Company and SYCI was then substantially the same, the transaction was accounted for as a transaction between entities under common control, whereby we recognized the assets and liabilities of SYCI at their carrying amounts. Share and per share amounts stated in this report have been retroactively adjusted to reflect the merger.
On August 31, 2008, SYCI completed the construction of a new chemical production line. It passed the examination by Shouguang City Administration of Work Safety and local fire department. This new production line focuses on producing environmental friendly additive products, solid lubricant and polyether lubricant, for use in oil and gas exploration. The line has an annual production capacity of 5,000 tons. Formal production of this chemical production line started on September 15, 2008. The total annual production capacity of SYCI is 36,300 tons (exclude SCRC which was merged with SYCI on January 1, 2017).
20
On October 12, 2009 we completed a 1-for-4 reverse stock split of our common stock, such that for each four shares outstanding prior to the stock split there was one share outstanding after the reverse stock split. All shares of common stock referenced in this report have been adjusted to reflect the stock split figures. On October 27, 2009 our shares began trading on the NASDAQ Global Select Market under the ticker symbol “GFRE” and on June 30, 2011 we changed our ticker symbol to “GURE” to better reflection of our corporate name.
On January 12, 2015, the Company and SCHC entered into an Equity Interest Transfer Agreement with SCRC pursuant to which SCHC agreed to acquire SCRC and all rights, title and interest in and to all assets owned by SCRC, a leading manufacturer of materials for human and animal antibiotics in China and other parts of Asia.
On February 4, 2015 the Company closed the transactions contemplated by the agreement between the Company, SCHC and SCRC.
On the closing date, the Company issued 7,268,011 shares of its common stock, par value $0.0005 per share (the “Shares”), at the closing market price of $1.84 per Share on the closing date to the four former equity owners of SCRC .The issuance of the Shares was exempt from registration pursuant to Regulation S of the Securities Act of 1933, as amended. On the closing date, the Company entered into a lock-up agreement with the four former equity owners of SCRC. In accordance with the terms of the lock-up agreement, the shareholders agreed not to sell or transfer the Shares for five years from the date the stock certificates evidencing the Shares were issued.
The sellers of SCRC agreed as part of the purchase price to accept the Shares, based on a valuation of $2.00, which was a 73% premium to the price on the day the agreement was entered into. For accounting purposes, the Shares are now being valued at $1.84, which was the closing price of our stock on the day of the closing date of the agreement. The price difference between the original $2.00 and the current $1.84 is solely for accounting purposes. There has been no change in the number of shares issued.
On November 24, 2015, Gulf Resources, Inc., a Delaware corporation consummated a merger with and into its wholly-owned subsidiary, Gulf Resources, Inc., a Nevada corporation. As a result of the reincorporation, the Company is now a Nevada corporation.
On December 15, 2015, the Company registered a new subsidiary in the Sichuan Province of the PRC named Daying County Haoyuan Chemical Company Limited (“DCHC”) with registered Capital of RMB50,000,000, and there was RMB11,833,535 capital contributed by SCHC as of September 30, 2017. DCHC was established to further explore and develop natural gas and brine resources (including bromine and crude salt) in China.
On September 2, 2016, the Company announced the planned merger of two of its 100% owned subsidiaries, Shouguan Yuxin Chemical Co., Limited (“SYCI”) and Shouguan Rongyuan Chemical Co., Ltd (“SCRC”). On March 24, 2017, the legal process of the merger was completed and SCRC was officially deregistered on March 28, 2017. The results of these two subsidiaries were reported as SYCI in the three and nine months ended September 30, 2017. The total production capacity of the merged entity is 60,900 tons.
As disclosed in the Company’s Current Report on Form 8-K filed on September 8, 2017 the Company disclosed that on September 1, 2017, the Company received letters from the Yangkou County, Shouguang City government to each of its subsidiaries, SCHC and SYCI, which stated that in an effort to improve the safety and environmental protection management level of chemical enterprises, the plants are requested to immediately stop production and perform rectification and improvements in accordance with the country's new safety and environmental protection requirements. In the Company’s press release of August 11, 2017 and on its conference call of August 14, 2017, the Company addressed concerns that increased government enforcement of stringent environmental rules that were adopted in early 2017 to insure corporations bring their facilities up to necessary standards so that pollution and other negative environmental issues are limited and remediated, could have an impact on our business in both the short and long-term. The Company also expressed that although it believed its facilities were fully compliant, the Company did not know how its facilities would fare under the new rules and that the Company expected to have a full understanding of the implications within the next two months. Teams of inspectors from the government were sent to many provinces to inspect all mining and manufacturing facilities. The local government requested that facilities be closed, so that the facilities can undergo the inspection and analysis in the most efficient manner by inspectors’ team. As a result, our facilities were closed on September 1, 2017.
All direct labor and factory overhead costs including depreciation of plant and machinery incurred in September 2017 which would have been presented in the cost of net revenue were presented as part of the general and administrative expense in the three-month and nine-month periods ended September 30, 2017.
Our current corporate structure chart is set forth in the following diagram:
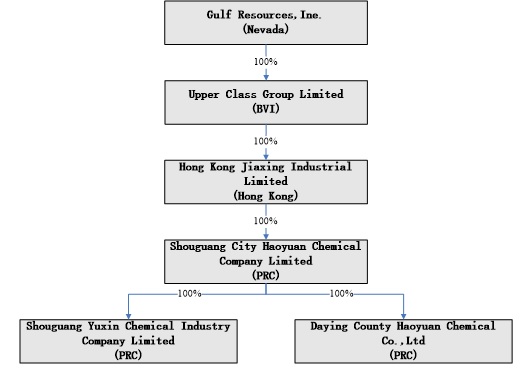
As a result of our acquisitions of SCHC and SYCI, our historical financial statements and the information presented below reflects the accounts of SCHC, SYCI and DCHC. The following discussion should be read in conjunction with our consolidated financial statements and notes thereto appearing elsewhere in this report.
21
RESULTS OF OPERATIONS
The following table presents certain information derived from the consolidated statements of operations, cash flows and stockholders equity for the three-month and nine-month periods ended September 30, 2017 and 2016.
Comparison of the Three-Month Period Ended September 30, 2017 and 2016
| Three-Month Period Ended September 30, 2017 | Three-Month Period Ended September 30, 2016 | Percent Change Increase/ (Decrease) | ||||||||||
| Net revenue | $ | 23,840,391 | $ | 38,811,622 | (39 | %) | ||||||
| Cost of net revenue | $ | (14,518,439 | ) | $ | (23,107,921 | ) | (37 | %) | ||||
| Gross profit | $ | 9,321,952 | $ | 15,703,701 | (41 | %) | ||||||
| Sales, marketing and other operating expenses | $ | (65,599 | ) | $ | (83,087 | ) | (21 | %) | ||||
| Research and development costs | $ | (42,074 | ) | $ | (68,115 | ) | (38 | %) | ||||
| Write-off/Impairment on property, plant and equipment | $ | — | $ | (90,395 | ) | (100 | %) | |||||
| General and administrative expenses | $ | (4,451,027 | ) | $ | (1,613,933 | ) | 176 | % | ||||
| Other operating income | $ | 72,000 | $ | 108,029 | (33 | %) | ||||||
| Income from operations | $ | 4,835,252 | $ | 13,956,200 | (65 | %) | ||||||
| Other income, net | $ | 99,709 | $ | 78,042 | 28 | % | ||||||
| Income before taxes | $ | 4,934,961 | $ | 14,034,242 | (65 | %) | ||||||
| Income taxes | $ | (1,509,321 | ) | $ | (3,518,529 | ) | (57 | %) | ||||
| Net income | $ | 3,425,640 | $ | 10,515,713 | (67 | %) | ||||||
Net revenue. The table below shows the changes in net revenue in the respective segment of the Company for the three-month period ended September, 2017 compared to the same period in 2016:
| Net Revenue by Segment | ||||||||||||||||||||
| Three-Month Period Ended | Three-Month Period Ended | Percent change (Decrease) | ||||||||||||||||||
| September 30, 2017 | September 30, 2016 | of Net Revenue | ||||||||||||||||||
| Segment | % of total | % of total | ||||||||||||||||||
| Bromine | $ | 9,549,777 | 40 | % | $ | 15,971,847 | 41 | % | (40 | %) | ||||||||||
| Crude Salt | $ | 2,054,729 | 9 | % | $ | 2,310,799 | 6 | % | (11 | %) | ||||||||||
| Chemical Products | $ | 12,235,885 | 51 | % | $ | 20,528,975 | 53 | % | (40 | %) | ||||||||||
| Total sales | $ | 23,840,391 | 100 | % | $ | 38,811,621 | 100 | % | (39 | %) | ||||||||||
| Bromine and crude salt segments | Three-Month Period Ended | Percentage Change | ||||||||||
| product sold in tonnes | September 30, 2017 | September 30, 2016 | (Decrease) | |||||||||
| Bromine (excluding volume sold to SYCI) | 2,592 | 4,511 | (43 | %) | ||||||||
| Crude Salt | 64,362 | 82,547 | (22 | %) | ||||||||
| Three-Month Period Ended | Percentage Change | |||||||||||
| Chemical products segment sold in tonnes | September 30, 2017 | September 30, 2016 | (Decrease) | |||||||||
| Oil and gas exploration additives | 1,361 | 2,914 | (53 | %) | ||||||||
| Paper manufacturing additives | 450 | 835 | (46 | %) | ||||||||
| Pesticides manufacturing additives | 239 | 606 | (61 | %) | ||||||||
| Pharmaceutical intermediates | 293 | 388 | (25 | %) | ||||||||
| By products | 1,435 | 3,045 | (53 | %) | ||||||||
| Overall | 3,778 | 7,788 | (51 | %) | ||||||||
22
Bromine segment
The table below shows the changes in the average selling price and changes in the sales volume of bromine for three-month period ended September 30, 2017 from the same period in 2016.
| Three-Month Period Ended September 30, | ||||
| Decrease in net revenue of bromine as a result of: | 2017 vs. 2016 | |||
| Increase in average selling price | $ | 509,270 | ||
| Decrease in sales volume | $ | (6,931,340 | ) | |
| Total effect on net revenue of bromine | $ | (6,422,070 | ) | |
The decrease in net revenue from our bromine segment was mainly due to the decrease in the sales volume. The sales volume of bromine decreased from 4,511 tonnes for the three-month period ended September 30, 2016 to 2,592 tonnes for the same period in 2017, a decrease of 43%. The major reasons for the decrease in the sales volume of bromine were (i) the slowdown in the Chinese economy, and (ii) the closure of all of our plant and factories to perform rectification and improvements since September 1, 2017. Some of our local customers were also requested to stop production, which affected our customers’ industries and our sales volume.
The average selling price of bromine increased from $3,541 per tonne for the three-month period ended September 30, 2016 to $3,684 per tonne for the same period in 2017, an increase of 4%.
Crude salt segment
The table below shows the changes in the average selling price and changes in the sales volume of crude salt for three-month period ended September 30, 2017 from the same period in 2016.
| Three-Month Period Ended September 30, | ||||
| Decrease in net revenue of crude salt as a result of: | 2017 vs. 2016 | |||
| Increase in average selling price | $ | 288,745 | ||
| Decrease in sales volume | $ | (544,815 | ) | |
| Total effect on net revenue of crude salt | $ | (256,070 | ) | |
The decrease in net revenue from our crude salt segment was due to the decrease in the sales volume of crude salt. The sales volume of crude salt decreased by 22% from 82,547 tonnes for the three-month period ended September 30, 2016 to 64,362 tonnes for the same period in 2017. The major reason for the decrease in the sales volume of crude salt were (i) the slowdown in the Chinese economy, and (ii) the closure of all of our plant and factories to perform rectification and improvements since September 1, 2017. Some of our local customers were also requested to stop production, which affected our customers’ industries and our sales volume.
The average selling price of crude salt increased from $27.99 per tonne for the three-month period ended September 30, 2016 to $31.92 per tonne for the same period in 2017, an increase of 14%.
23
Chemical products segment
| Product Mix of Chemical Products Segment | Percent | |||||||||||||||||||
| Three-Month Period Ended | Three-Month Period Ended | Change of | ||||||||||||||||||
| September 30, 2017 | September 30, 2016 | Net Revenue | ||||||||||||||||||
| Chemical Products | % of total | % of total | ||||||||||||||||||
| Oil and gas exploration additives | $ | 2,620,464 | 21 | % | $ | 5,362,309 | 26 | % | (51 | %) | ||||||||||
| Paper manufacturing additives | $ | 517,905 | 4 | % | $ | 930,262 | 4 | % | (44 | %) | ||||||||||
| Pesticides manufacturing additives | $ | 1,311,326 | 11 | % | $ | 3,010,391 | 15 | % | (56 | %) | ||||||||||
| Pharmaceutical intermediates | $ | 6,081,137 | 50 | % | $ | 7,586,616 | 37 | % | (20 | %) | ||||||||||
| By products | $ | 1,705,053 | 14 | % | $ | 3,639,397 | 18 | % | (53 | %) | ||||||||||
| Total sales | $ | 12,235,885 | 100 | % | $ | 20,528,975 | 100 | % | (40 | %) | ||||||||||
Net revenue from our chemical products segment decreased from $20,528,975 for the three-month period ended September 30, 2016 to $12,235,885 for the same period in 2017, a decrease of approximately 40%. This decrease was primarily attributable to the decreased sales volume of all our chemical products mainly due to (i) the slowdown in the Chinese economy, and (ii) the closure of all of our plant and factories to perform rectification and improvements since September 1, 2017. Some of our local customers were also requested to stop production, which affected our customers’ industries and our sales volume. Net revenue from our oil and gas exploration chemicals decreased from $5,362,309 for the three-month period ended September 30, 2016 to $2,620,464 for the same period in 2017, a decrease of approximately 51%. Net revenue from our paper manufacturing additives decreased from $930,262 for the three-month period ended September 30, 2016 to $517,905 for the same period in 2017, a decrease of approximately 44%. Net revenue from our pesticides manufacturing additives decreased from $3,010,391 for the three-month period ended September 30, 2016 to $1,311,326 for the same period in 2017, a decrease of approximately 56%. Net revenue from our pharmaceutical intermediates decreased from $7,586,616 for the three-month period ended September 30, 2016 to $6,081,137 for the same period in 2017, a decrease of approximately 20%. Net revenue from our by products decreased from $3,639,397 for the three-month period ended September 30, 2016 to $1,705,053 for the same period in 2017, a decrease of approximately 53%.
The table below shows the changes in the average selling price and changes in the sales volume of major chemical products of the chemical products segment for the three-month period ended September 30, 2017 from the same period in 2016.
| Decrease in net revenue, for the three-month period ended September 30, 2017 vs. 2016, as a result of: | Oil and gas exploration additives | Paper manufacturing additives | Pesticides manufacturing additives | Pharmaceutical intermediates | By products | Total | ||||||||||||||||||
| Increase/(Decrease) in average selling price | $ | 182,459 | $ | 23,003 | $ | 220,254 | $ | 414,274 | $ | (15,611 | ) | $ | 824,379 | |||||||||||
| Decrease in sales volume | $ | (2,924,304 | ) | $ | (435,360 | ) | $ | (1,919,319 | ) | $ | (1,919,753 | ) | $ | (1,918,733 | ) | $ | (9,117,469 | ) | ||||||
| Total effect on net revenue of chemical products | $ | (2,741,845 | ) | $ | (412,357 | ) | $ | (1,699,065 | ) | $ | (1,505,479 | ) | $ | (1,934,344 | ) | $ | (8,293,090 | ) | ||||||
24
Cost of Net Revenue.
| Cost of Net Revenue by Segment | percent Change | |||||||||||||||||||
| Three-Month Period Ended | Three-Month Period Ended | of Cost of | ||||||||||||||||||
| September 30, 2017 | September 30, 2016 | Net Revenue | ||||||||||||||||||
| Segment | % of total | % of total | ||||||||||||||||||
| Bromine | $ | 5,150,471 | 35 | % | $ | 7,106,210 | 31 | % | (28 | %) | ||||||||||
| Crude Salt | $ | 1,102,060 | 8 | % | $ | 2,498,817 | 11 | % | (56 | %) | ||||||||||
| Chemical Products | $ | 8,265,908 | 57 | % | $ | 13,502,894 | 58 | % | (39 | %) | ||||||||||
| Total | $ | 14,518,439 | 100 | % | $ | 23,107,921 | 100 | % | (37 | %) | ||||||||||
Cost of net revenue reflects mainly the raw materials consumed and the direct salaries and benefits of staff engaged in the production process, electricity, depreciation and amortization of manufacturing plant and machinery and other manufacturing costs. Our cost of net revenue was $14,518,439 for the three-month period ended September 30, 2017, a decrease of $8,589,482 (or 37%) as compared to the same period in 2016. This decrease was primarily attributable to the decrease volume of products sold due to (i) the slowdown in the Chinese economy, and (ii) the closure of all of our plant and factories to perform rectification and improvements since September 1, 2017. Some of our local customers were also requested to stop production, which affected our customers’ industries and our sales volume.
Bromine production capacity and utilization of our factories
The table below represents the annual capacity and utilization ratios for all of our bromine producing properties:
Annual Production Capacity (in tonnes) | Utilization Ratio (i) | ||||||||
| Three-month period ended September 30, 2016 | 47,347 | 46 | % | ||||||
| Three-month period ended September 30, 2017 | 42,808 | 37 | % | ||||||
| Variance of the three-month period ended September 30, 2017 and 2016 | (4,539 | ) | (9 | %) | |||||
(i) Utilization ratio is calculated based on the annualized actual production volume in tonnes for the period divided by the annual production capacity in tonnes.
Our utilization ratio decreased by 9% for the three-month period ended September 30, 2017 as compared with the same period in 2016. This decrease was mainly due to the slowdown in the Chinese economy.
25
Bromine segment
For the three-month period ended September 30, 2017, the cost of net revenue for the bromine segment was $5,150,471, a decrease of $1,955,739 or 28% over the same period in 2016. The major components of the costs of net revenue for the bromine segment were the cost of raw materials and finished goods consumed of $1,442,686 (or 28%), depreciation and amortization of manufacturing plant and machinery of $2,373,683 (or 46%) and Resource tax of $418,311 (or 8%) for the three-month period ended September 30, 2017. For the three-month period ended September 30, 2016, the major components of the cost of net revenue were the cost of raw materials and finished goods consumed of $2,150,607 (or 30%), depreciation and amortization of manufacturing plant and machinery of $3,012,969 (or 42%) and electricity of $738,926 (or 10%). The cost structure changed where the proportion of cost of raw materials and finished goods consumed over the total cost of net revenue decreased by 2% in the three-month period ended September 30, 2017 compared to the same period in 2016. The decrease in net cost of net revenue was the decrease in the sales volume of bromine as mentioned in net revenue of bromine and decrease in depreciation and amortization of manufacturing plant and machinery mainly due to (i) some plant and equipment related to the crude salt and bromine facilities were fully depreciated in June 2016; and (ii) the demolition Factory No.6 in December 2016 for bromine and crude salt segment, which partially offset by the increase in depreciation and amortization of manufacturing plant and machinery due to the enhancement projects carried out for our extraction wells and transmission channels and ducts which commenced in August 2016 and completed in September 2016 .
The table below represents the major production cost component of bromine per tonne for respective periods:
| Per tonne production cost | Three-Month Period Ended | Three-Month Period Ended | ||||||||||||||||||
| component of bromine segment | September 30, 2017 | September 30, 2016 | % Change | |||||||||||||||||
| % of total | % of total | |||||||||||||||||||
| Raw materials | $ | 909 | 42 | % | $ | 819 | 46 | % | 11 | % | ||||||||||
| Depreciation and amortization | $ | 811 | 37 | % | $ | 593 | 33 | % | 37 | % | ||||||||||
| Electricity | $ | 128 | 6 | % | $ | 146 | 8 | % | (12 | %) | ||||||||||
| Others | $ | 328 | 15 | % | $ | 237 | 13 | % | 38 | % | ||||||||||
| Production cost of bromine per tonne | $ | 2,176 | 100 | % | $ | 1,795 | 100 | % | 21 | % | ||||||||||
Our production cost of bromine per tonne was $2,176 for the three-month period ended September 30, 2017, an increase of 21% (or $381) as compared to the same period in 2016.
Crude salt segment
The cost of net revenue for our crude salt segment for the three-month period ended September 30, 2017 was $1,102,060, representing a decrease of $1,396,757, or 56%, compared to $2,498,817 for the same period in 2016. The decrease in cost was mainly due to the decrease in depreciation and amortization of manufacturing plant and machinery mainly due to (i) some plant and equipment related to the crude salt and bromine facilities were fully depreciated in June 2016; and (ii) the demolition Factory No.6 in December 2016 for bromine and crude salt segment, which partially offset by the increase in depreciation and amortization of manufacturing plant and machinery due to the enhancement projects carried out for our extraction wells and transmission channels and ducts which commenced in August 2016 and completed in September 2016. The significant cost components for the three-month period ended September 30, 2017 were depreciation and amortization of $612,699 (or 56%), resource taxes calculated based on crude salt sold of $205,473 (or 19%) and electricity of $89,961 (or 8%). The significant cost components for the three-month period ended September 30, 2016 were depreciation and amortization of $1,751,438 (or 70%), resource taxes calculated based on crude salt sold of $247,707 (or 10%) and electricity of $183,842 (or 7%). The table below represents the major production cost component of crude salt per ton for respective periods:
| Per tonne production cost | Three-Month Period Ended | Three-Month Period Ended | ||||||||||||||||||
| component of crude salt segment | September 30, 2017 | September 30, 2016 | % Change | |||||||||||||||||
| % of total | % of total | |||||||||||||||||||
| Depreciation and amortization | $ | 9.5 | 55 | % | $ | 21.2 | 70 | % | (55 | %) | ||||||||||
| Resource tax | $ | 3.2 | 19 | % | $ | 3.0 | 10 | % | 7 | % | ||||||||||
| Electricity | $ | 1.4 | 8 | % | $ | 2.3 | 7 | % | (39 | %) | ||||||||||
| Others | $ | 3.0 | 18 | % | $ | 3.8 | 13 | % | (21 | %) | ||||||||||
| Production cost of crude salt per tonne | $ | 17.1 | 100 | % | $ | 30.3 | 100 | % | (43 | %) | ||||||||||
26
Chemical products segment
Cost of net revenue for our chemical products segment for the three-month period ended September 30, 2017 was $8,265,908, representing a decrease of $5,236,986, or 39%, over the same period in 2016. This decrease was primarily attributable to the decrease in sales volume of all our chemical products due to (i) the slowdown in the Chinese economy, and (ii) the closure of all of our plant and factories to perform rectification and improvements since September 1, 2017. Some of our local customers were also requested to stop production, which affected our customers’ industries and our sales volume.
.
Gross Profit. Gross profit was $9,321,952, or 39%, of net revenue for three-month period ended September 30, 2017 compared to $15,703,701, or 40%, of net revenue for the same period in 2016.
| Gross Profit (Loss) by Segment | Percent Change | |||||||||||||||||||
| Three-Month Period Ended | Three-Month Period Ended | of Gross | ||||||||||||||||||
| September 30, 2017 | September 30, 2016 | Profit Margin | ||||||||||||||||||
| Segment | Gross Profit Margin | Gross Profit (Loss) Margin | ||||||||||||||||||
| Bromine | $ | 4,399,306 | 46 | % | $ | 8,865,637 | 56 | % | (10 | %) | ||||||||||
| Crude Salt | $ | 952,669 | 46 | % | $ | (188,018 | ) | (8 | %) | 54 | % | |||||||||
| Chemical Products | $ | 3,969,977 | 32 | % | $ | 7,026,082 | 34 | % | (2 | %) | ||||||||||
| Total Gross Profit | $ | 9,321,952 | 39 | % | $ | 15,703,701 | 40 | % | (1 | %) | ||||||||||
Bromine segment
For the three-month period ended September 30, 2017, the gross profit margin for our bromine segment was 46% compared to 56% for the same period in 2016. This 10% decrease was primarily attributable to the increase in factory overhead per unit produced due to lower volume of production.
Crude salt segment
For the three-month period ended September 30, 2017 the gross profit (loss) margin for our crude salt segment was 46% compared to (8)% for the same period in 2016. This 54% increase in our gross (loss) profit margin is mainly attributable to the decrease in depreciation and amortization of manufacturing plant and machinery as mentioned in cost of net revenue of crude salt.
27
Chemical products segment
The gross profit margin for our chemical products segment for the three-month period ended September 30, 2017 was 32% compared to 34% for the same period in 2016.
Research and Development Costs. The total research and development costs incurred for the three-month period ended September 30, 2017 and 2016 were $42,074 and $68,115, respectively, a decrease of 38%. Research and development costs for the three-month period ended September 30, 2017 represented raw materials used by SYCI for testing the manufacturing routine. Research and development costs for the three-month period ended September 30, 2016 represented raw materials used by SYCI and SCRC for testing the manufacturing routine.
Write-off/Impairment on property, plant and equipment. Write-offs on property, plant and equipment for the three-month period ended September 30, 2017 and 2016 were $0 and $90,395, respectively, a decrease of 100%. Write-offs on property, plant and equipment of $90,395 for the three-month period ended September 30, 2016 represented the write-offs of certain protective shells to transmission pipelines and ducts replaced that started in August 2016 and completed in September 2016.
General and Administrative Expenses. General and administrative expenses were $4,451,027 for the three-month period ended September 30, 2017, an increase of $2,837,094 (or 176%) as compared to $1,613,933 for the same period in 2016. This increase in general and administrative expenses was primarily due to (i) the unrealized exchange loss of $536,453 in relation to the translation of current portion of inter-company balance owing in RMB for the three-month period ended September 30, 2017, as compared to the unrealized exchange gain for the same period in 2016 in the amount of $181,030; and (ii) depreciation and amortization of manufacturing plant and machinery incurred in September 2017 classified in general and administrative expense as production in all factories was temporarily stopped from September 1, 2017 to allow for rectification and improvement to be made to the facilities to comply with the new safety and environmental protection requirements of PRC.
Other Operating Income. Other operating income was $72,000 for the three-month period ended September 30, 2017, a decrease of $36,029 (or 33%) as compared to $108,029 for the same period in 2016 for sales of wastewater. Wastewater is generated from the production of bromine and eventually becomes crude salt when it evaporates. Not all of our bromine production plants have sufficient area on the property to allow for evaporation of wastewater to produce crude salt. Certain of our customers who have facilities located adjacent to our bromine production plants have agreed to allow us to channel our wastewater into brine pans on their properties for evaporation. These customers then are able to sell the resulting crude salt themselves. We signed agreements with four of our customers to sell them our wastewater at market prices.
Income from Operations. Income from operations was $4,835,252 for the three-month period ended September 30, 2017 (or 20% of net revenue), a decrease of $9,120,948, or approximately 65%, over the income from operations for the same period in 2016.
| Income by Segment | ||||||||||||||||
| Three-Month Period Ended September 30, 2017 | Three-Month Period Ended September 30, 2016 | |||||||||||||||
| Segment: | % of total | % of total | ||||||||||||||
| Bromine | $ | 2,257,069 | 38 | % | $ | 7,898,302 | 57 | % | ||||||||
| Crude Salt | 497,783 | 8 | % | (382,917 | ) | (3 | %) | |||||||||
| Chemical Products | 3,176,458 | 54 | % | 6,442,708 | 46 | % | ||||||||||
| Natural Gas | (33,184 | ) | — | (2,476 | ) | — | ||||||||||
| Income from operations before corporate costs | 5,898,126 | 100 | % | 13,955,617 | 100 | % | ||||||||||
| Corporate costs | (526,421 | ) | (180,447 | ) | ||||||||||||
| Unrealized translation difference | (536,453 | ) | 181,030 | |||||||||||||
| Income from operations | $ | 4,835,252 | $ | 13,956,200 | ||||||||||||
28
Bromine segment
Income from operations from our bromine segment was $2,257,069 for the three-month period ended September 30, 2017, a decrease of $5,641,233 (or approximately 71%) compared to the same period in 2016. This decrease was primarily attributable to the decrease in sales volume of all our bromine segment products as mentioned in net revenue of bromine.
Crude salt segment
Income from operations from our crude salt segment was $497,783 for the three-month period ended September 30, 2017, compared to loss of $382,917 in the same period in 2016. This increase was primarily attributable to the decrease in depreciation and amortization of manufacturing plant and machinery as mentioned in cost of net revenue of crude salt.
Chemical products segment
Income from operations from our chemical products segment was $3,176,458 for the three-month period ended September 30, 2017, a decrease of $3,266,250 (or approximately 51%) compared to the same period in 2016. This decrease was primarily attributable to the decrease in sales volume of all of our chemical products as mentioned in net revenue of chemical products.
Other Income. Net Other income, net of $99,709 represented bank interest income, net of capital lease interest expense for the three -month period ended September 30, 2017, an increase of $21,667 (or approximately 28%) as compared to the same period in 2016.
Net Income. Net income was $3,425,640 for the three-month period ended September 30, 2017, a decrease of $7,090,073 (or approximately 67%) compared to the same period in 2016. This decrease was primarily attributable to the decrease in sales volume of all our product as mentioned in net revenue of bromine, crude and chemical products.
Effective Tax Rate. Our effective tax rate for the three-month period ended September 30, 2017 and 2016 was 31% and 25%, respectively. The effective tax rate of 31% for the three-month period ended September 30, 2017 differs from the PRC statutory income tax rate of 25% mainly due to non-taxable item in connection with the unrealized exchange loss for the Company. The effective tax rate of 25% for the three-month period ended September 30, 2016 is consistent with the PRC statutory income tax rate.
Comparison of the Nine-Month Period Ended September 30, 2017 and 2016
| Nine-Month Period Ended September 30, 2017 | Nine-Month Period Ended September 30, 2016 | Percent Change Increase/ (Decrease) | ||||||||||
| Net revenue | $ | 104,160,873 | $ | 120,907,839 | (14 | %) | ||||||
| Cost of net revenue | $ | (61,664,044 | ) | $ | (76,184,822 | ) | (19 | %) | ||||
| Gross profit | $ | 42,496,829 | $ | 44,723,017 | (5 | %) | ||||||
| Sales, marketing and other operating expenses | $ | (242,045 | ) | $ | (269,357 | ) | (10 | %) | ||||
| Research and development costs | $ | (169,246 | ) | $ | (198,330 | ) | (15 | %) | ||||
| Write-off/Impairment on property, plant and equipment | $ | — | $ | (90,395 | ) | (100 | %) | |||||
| General and administrative expenses | $ | (8,236,430 | ) | $ | (4,539,845 | ) | 81 | % | ||||
| Other operating income | $ | 281,613 | $ | 328,550 | (14 | %) | ||||||
| Income from operations | $ | 34,130,721 | $ | 39,953,640 | (15 | %) | ||||||
| Other income, net | $ | 274,314 | $ | 222,678 | 23 | % | ||||||
| Income before taxes | $ | 34,405,035 | $ | 40,176,318 | (14 | %) | ||||||
| Income taxes | $ | (9,152,597 | ) | $ | (9,996,622 | ) | (8 | %) | ||||
| Net income | $ | 25,252,438 | $ | 30,179,696 | (16 | %) | ||||||
29
Net revenue. The table below shows the changes in net revenue in the respective segment of the Company for the nine-month period ended September, 2017 compared to the same period in 2016:
| Net Revenue by Segment | ||||||||||||||||||||
| Nine-Month Period Ended | Nine-Month Period Ended | Percent change (Decrease) | ||||||||||||||||||
| September 30, 2017 | September 30, 2016 | of Net Revenue | ||||||||||||||||||
| Segment | % of total | % of total | ||||||||||||||||||
| Bromine | $ | 41,895,304 | 40 | % | $ | 47,621,980 | 40 | % | (12 | %) | ||||||||||
| Crude Salt | $ | 6,390,390 | 6 | % | $ | 6,383,095 | 5 | % | — | |||||||||||
| Chemical Products | $ | 55,875,179 | 54 | % | $ | 66,902,764 | 55 | % | (16 | %) | ||||||||||
| Total sales | $ | 104,160,873 | 100 | % | $ | 120,907,839 | 100 | % | (14 | %) | ||||||||||
| Bromine and crude salt segments | Nine-Month Period Ended | Percentage Change | ||||||||||
| product sold in tonnes | September 30, 2017 | September 30, 2016 | (Decrease) | |||||||||
| Bromine (excluding volume sold to SYCI) | 10,600 | 12,552 | (16 | %) | ||||||||
| Crude Salt | 206,289 | 222,124 | (7 | %) | ||||||||
| Nine-Month Period Ended | Percentage Change | |||||||||||
| Chemical products segment sold in tonnes | September 30, 2017 | September 30, 2016 | (Decrease) | |||||||||
| Oil and gas exploration additives | 6,751 | 8,461 | (20 | %) | ||||||||
| Paper manufacturing additives | 2,016 | 2,435 | (17 | %) | ||||||||
| Pesticides manufacturing additives | 1,309 | 1,760 | (26 | %) | ||||||||
| Pharmaceutical intermediates | 1,058 | 1,225 | (14 | %) | ||||||||
| By products | 7,638 | 9,324 | (18 | %) | ||||||||
| Overall | 18,772 | 23,205 | (19 | %) | ||||||||
Bromine segment
The decrease in net revenue from our bromine segment was mainly due to the decrease in the sales volume of bromine. The sales volume of bromine decreased from 12,552 tonnes for the nine-month period ended September 30, 2016 to 10,600 tonnes for the same period in 2017, a decrease of 16%. The major reason for the decrease in the sales volume of bromine was mainly due to (i) the slowdown in the Chinese economy, and (ii) the closure of all of our plant and factories to perform rectification and improvements since September 1, 2017. Some of our local customers were also requested to stop production, which affected our customers’ industries and our sales volume.
The average selling price of bromine increased from $3,794 per tonne for the nine-month period ended September 30, 2016 to $3,952 per tonne for the same period in 2017, an increase of 4%.
| Nine-Month Period Ended September 30, | ||||
| Decrease in net revenue of bromine as a result of: | 2017 vs. 2016 | |||
| Increase in average selling price | $ | 1,831,786 | ||
| Decrease in sales volume | $ | (7,558,462 | ) | |
| Total effect on net revenue of bromine | $ | (5,726,676 | ) | |
30
Crude salt segment
The increase in net revenue from our crude salt segment was due to the increase in the selling price of crude salt, which offset by the sales volume of crude salt. The sales volume of crude salt decreased by 7% from 222,124 tonnes for the nine-month period ended September 30, 2016 to 206,289 tonnes for the same period in 2017. The average selling price of crude salt increased from $28.74 per tonne for the nine-month period ended September 30, 2016 to $30.98 per tonne for the same period in 2017, an increase of 8%.
The table below shows the changes in the average selling price and changes in the sales volume of crude salt for nine-month period ended September 30, 2017 from the same period in 2016.
| Nine-Month Period Ended September 30, | ||||
| Increase in net revenue of crude salt as a result of: | 2017 vs. 2016 | |||
| Increase in average selling price | $ | 480,083 | ||
| Decrease in sales volume | $ | (472,788 | ) | |
| Total effect on net revenue of crude salt | $ | 7,295 | ||
Chemical products segment
| Product Mix of Chemical Products Segment | Percent | |||||||||||||||||||
| Nine-Month Period Ended | Nine-Month Period Ended | Change of | ||||||||||||||||||
| September 30, 2017 | September 30, 2016 | Net Revenue | ||||||||||||||||||
| Chemical Products | % of total | % of total | ||||||||||||||||||
| Oil and gas exploration additives | $ | 12,852,210 | 23 | % | $ | 16,125,700 | 24 | % | (20 | %) | ||||||||||
| Paper manufacturing additives | $ | 2,275,236 | 4 | % | $ | 2,799,108 | 4 | % | (19 | %) | ||||||||||
| Pesticides manufacturing additives | $ | 6,953,930 | 12 | % | $ | 9,062,903 | 14 | % | (23 | %) | ||||||||||
| Pharmaceutical intermediates | $ | 24,486,047 | 44 | % | $ | 27,370,395 | 41 | % | (11 | %) | ||||||||||
| By products | $ | 9,307,756 | 17 | % | $ | 11,544,658 | 17 | % | (19 | %) | ||||||||||
| Total sales | $ | 55,875,179 | 100 | % | $ | 66,902,764 | 100 | % | (16 | %) | ||||||||||
Net revenue from our chemical products segment decreased from $66,902,764 for the nine-month period ended September 30, 2016 to $55,875,179 for the same period in 2017, a decrease of approximately 16%. This decrease was primarily attributable to the decreased sales volume of all our chemical products due to (i) the slowdown in the Chinese economy, and (ii) the closure of all of our plant and factories to perform rectification and improvements since September 1, 2017. Some of our local customers were also requested to stop production, which affected our customers’ industries and our sales volume. Net revenue from our oil and gas exploration chemicals decreased from $16,125,700 for the nine-month period ended September 30, 2016 to $12,852,210 for the same period in 2017, a decrease of approximately 20%. Net revenue from our paper manufacturing additives decreased from $2,799,108 for the nine-month period ended September 30, 2016 to $2,275,236 for the same period in 2017, a decrease of approximately 19%. Net revenue from our pesticides manufacturing additives decreased from $9,062,903 for the nine-month period ended September 30, 2016 to $6,953,930 for the same period in 2017, a decrease of approximately 23%. Net revenue from our pharmaceutical intermediates decreased from $27,370,395 for the nine-month period ended September 30, 2016 to $24,486,047 for the same period in 2017, a decrease of approximately 11%. Net revenue from our by products decreased from $11,544,658 for the nine-month period ended September 30, 2016 to $9,307,756 for the same period in 2017, a decrease of approximately 19%.
31
The table below shows the changes in the average selling price and changes in the sales volume of major chemical products of the chemical products segment for the nine-month period ended September 30, 2017 from the same period in 2016.
| Decrease in net revenue, for the nine-month period ended September 30, 2017 vs. 2016, as a result of: | Oil and gas exploration additives | Paper manufacturing additives | Pesticides manufacturing additives | Pharmaceutical intermediates | By products | Total | ||||||||||||||||||
| Increase/(Decrease) in average selling price | $ | (16,016 | ) | $ | (47,108 | ) | $ | 250,772 | $ | 919,164 | $ | (166,082 | ) | $ | 940,730 | |||||||||
| Decrease in sales volume | $ | (3,257,474 | ) | $ | (476,764 | ) | $ | (2,359,745 | ) | $ | (3,803,512 | ) | $ | (2,070,820 | ) | $ | (11,968,315 | ) | ||||||
| Total effect on net revenue of chemical products | $ | (3,273,490 | ) | $ | (523,872 | ) | $ | (2,108,973 | ) | $ | (2,884,348 | ) | $ | (2,236,902 | ) | $ | (11,027,585 | ) | ||||||
Cost of Net Revenue.
| Cost of Net Revenue by Segment | Percent Change | |||||||||||||||||||
| Nine-Month Period Ended | Nine-Month Period Ended | of Cost of | ||||||||||||||||||
| September 30, 2017 | September 30, 2016 | Net Revenue | ||||||||||||||||||
| Segment | % of total | % of total | ||||||||||||||||||
| Bromine | $ | 20,833,351 | 34 | % | $ | 25,591,482 | 34 | % | (19 | %) | ||||||||||
| Crude Salt | $ | 3,297,064 | 5 | % | $ | 6,119,665 | 8 | % | (46 | %) | ||||||||||
| Chemical Products | $ | 37,533,629 | 61 | % | $ | 44,473,675 | 58 | % | (16 | %) | ||||||||||
| Total | $ | 61,664,044 | 100 | % | $ | 76,184,822 | 100 | % | (19 | %) | ||||||||||
Cost of net revenue reflects mainly the raw materials consumed and the direct salaries and benefits of staff engaged in the production process, electricity, depreciation and amortization of manufacturing plant and machinery and other manufacturing costs. Our cost of net revenue was $61,664,044 for nine-month period ended September 30, 2017, a decrease of $14,520,778 (or 19%) over the same period in 2016. This decrease was primarily attributable to the decrease in sales volume of products due to (i) the slowdown in the Chinese economy, and (ii) the closure of all of our plant and factories to perform rectification and improvements since September 1, 2017. Some of our local customers were also requested to stop production, which affected our customers’ industries and our sales volume.
Bromine production capacity and utilization of our factories
The table below represents the annual capacity and utilization ratios for all of our bromine producing properties:
Annual Production Capacity (in tonnes) | Utilization Ratio (i) | ||||||||
| Nine-month period ended September 30, 2016 | 47,347 | 40 | % | ||||||
| Nine-month period ended September 30, 2017 | 42,808 | 42 | % | ||||||
| Variance of the nine-month period ended September 30, 2017 and 2016 | (4,539 | ) | 2 | % | |||||
(i) Utilization ratio is calculated based on the annualized actual production volume in tonnes for the period divided by the annual production capacity in tonnes. The product produce below reflect the annualized production.
Our utilization ratio increased by 2% for the nine-month period ended September 30, 2017 as compared with the same period in 2016. This increase in utilization ratio was mainly due to the demolition Factory No.6 in December 2016, which reduced the total annual production capacity.
32
Bromine segment
For the nine-month period ended September 30, 2017, the cost of net revenue for the bromine segment was $20,833,351, a decrease of $4,758,131 or 19% over the same period in 2016. The major components of the costs of net revenue for the bromine segment were the cost of raw materials and finished goods consumed of $4,935,223 (or 24%), depreciation and amortization of manufacturing plant and machinery of $9,979,858 (or 48%) and electricity of $1,732,036 (or 8%) for the nine-month period ended September 30, 2017. For the nine-month period ended September 30, 2016, the major components of the cost of net revenue were the cost of raw materials and finished goods consumed of $8,455,261 (or 33%), depreciation and amortization of manufacturing plant and machinery of $11,289,541 (or 44%) and electricity of $2,183,710 (or 9%). The cost structure changed where the proportion of cost of raw materials and finished goods consumed over the total cost of net revenue decreased by 9% in the nine-month period ended September 30, 2017 compared to the same period in 2016. The decrease in net cost of net revenue was attributable mainly to the decrease in sales volume of products sold due to (i) the slowdown in the Chinese economy, and (ii) the closure of all of our plant and factories to perform rectification and improvements since September 1, 2017. Some of our local customers were also requested to stop production, which affected our customers’ industries and our sales volume.
| Per tonne production cost | Nine-Month Period Ended | Nine-Month Period Ended | ||||||||||||||||||
| component of bromine segment | September 30, 2017 | September 30, 2016 | % Change | |||||||||||||||||
| % of total | % of total | |||||||||||||||||||
| Raw materials | $ | 924 | 41 | % | $ | 1,049 | 47 | % | (12 | %) | ||||||||||
| Depreciation and amortization | $ | 821 | 37 | % | $ | 792 | 35 | % | 4 | % | ||||||||||
| Electricity | $ | 142 | 6 | % | $ | 153 | 7 | % | (7 | %) | ||||||||||
| Others | $ | 344 | 16 | % | $ | 257 | 11 | % | 34 | % | ||||||||||
| Production cost of bromine per tonne | $ | 2,231 | 100 | % | $ | 2,251 | 100 | % | (1 | %) | ||||||||||
Our production cost of bromine per tonne was $2,231 for the nine-month period ended September 30, 2017, a decrease of 1% (or $20) over the same period in 2016.
Crude salt segment
For the nine-month period ended September 30, 2017, the cost of net revenue for our crude salt segment was $3,297,064, representing a decrease of $2,822,601, or 46%, compared to $6,119,665 for the same period in 2016. The decrease in cost was mainly due to the decrease in depreciation and amortization of manufacturing plant and machinery mainly due to (i) some plant and equipment related to the crude salt and bromine facilities were fully depreciated in June 2016; and (ii) the demolition Factory No.6 in December 2016 for bromine and crude salt segment, which partially offset by the increase in depreciation and amortization of manufacturing plant and machinery due to the enhancement projects carried out for our extraction wells and transmission channels and ducts which commenced in August 2016 and completed in September 2016 .The significant cost components for the nine-month period ended September 30, 2017 were depreciation and amortization of $1,804,343 (or 55%), resource taxes calculated based on crude salt sold of $639,039 (or 19%) and electricity of $267,022 (or 8%). The significant cost components for the nine-month period ended September 30, 2016 were depreciation and amortization of $4,379,288 (or 71%), resource taxes calculated based on crude salt sold of $675,190 (or 11%) and electricity of $358,741 (or 6%). The table below represents the major production cost component of crude salt per ton for the respective periods:
| Per tonne production cost | Nine-Month Period Ended | Nine-Month Period Ended | ||||||||||||||||||
| component of crude salt segment | September 30, 2017 | September 30, 2016 | % Change | |||||||||||||||||
| % of total | % of total | |||||||||||||||||||
| Depreciation and amortization | $ | 8.8 | 55 | % | $ | 19.7 | 71 | % | (56 | %) | ||||||||||
| Resource tax | $ | 3.1 | 19 | % | $ | 3.0 | 11 | % | 3 | % | ||||||||||
| Electricity | $ | 1.3 | 8 | % | $ | 1.6 | 6 | % | (20 | %) | ||||||||||
| Others | $ | 2.8 | 18 | % | $ | 3.2 | 12 | % | (13 | %) | ||||||||||
| Production cost of crude salt per tonne | $ | 16.0 | 100 | % | $ | 27.5 | 100 | % | (42 | %) | ||||||||||
33
Our production cost of crude salt per tonne was $16.0 for the nine-month period ended September 30, 2017, a decrease of 42% (or $11.5) as compared to the same period in 2016.
Chemical products segment
For the nine-month period ended September 30, 2017, cost of net revenue for our chemical products segment was $37,533,629, representing a decrease of $6,940,045 or 16% over the same period in 2016. This decrease was primarily attributable to the decrease in sales volume of all our chemical products due (i) the slowdown in the Chinese economy, and (ii) the closure of all of our plant and factories to perform rectification and improvements since September 1, 2017. Some of our local customers were also requested to stop production, which affected our customers’ industries and our sales volume.
Gross Profit. Gross profit was $42,496,829, or 41%, of net revenue for nine-month period ended September 30, 2017 compared to $44,723,017, or 37%, of net revenue for the same period in 2016. The increase in gross profit percentage was primarily attributable to an increase in the margin percentage of bromine and crude salt.
| Gross Profit by Segment | % Point Change | |||||||||||||||||||
| Nine-Month Period Ended | Nine-Month Period Ended | of Gross | ||||||||||||||||||
| September 30, 2017 | September 30, 2016 | Profit Margin | ||||||||||||||||||
| Segment | Gross Profit Margin | Gross Profit Margin | ||||||||||||||||||
| Bromine | $ | 21,061,953 | 50 | % | $ | 22,030,498 | 46 | % | 4 | % | ||||||||||
| Crude Salt | $ | 3,093,326 | 48 | % | $ | 263,430 | 4 | % | 44 | % | ||||||||||
| Chemical Products | $ | 18,341,550 | 33 | % | $ | 22,429,089 | 34 | % | (1 | %) | ||||||||||
| Total Gross Profit | $ | 42,496,829 | 41 | % | $ | 44,723,017 | 37 | % | 4 | % | ||||||||||
Bromine segment
The gross profit margin for our bromine segment for the nine-month period ended September 30, 2017 was 50% compared to 46% for the same period in 2016. This 4% increase is mainly due to the increased average selling price and the decrease in the purchase price of raw material and the decrease in depreciation and amortization of manufacturing plant and machinery mainly due to (i) some plant and equipment related to the crude salt and bromine facilities were fully depreciated in June 2016; and (ii) the demolition Factory No.6 in December 2016 for bromine and crude salt segment, which partially offset by the increase in depreciation and amortization of manufacturing plant and machinery due to the enhancement projects carried out for our extraction wells and transmission channels and ducts which commenced in August 2016 and completed in September 2016 .
Crude salt segment
For the nine-month period ended September 30, 2017, the gross profit margin for our crude salt segment was 48% compared to 4% for the same period in 2016. This 44% increase is mainly due to the increase in crude salt price and decrease in depreciation and amortization of manufacturing plant and machinery as mentioned in cost of net revenue of crude salt.
34
Chemical products segment
The gross profit margin for our chemical products segment for the nine-month period ended September 30, 2017 was 33% compared to 34% for the same period in 2016.
Research and Development Costs. For the nine-month period ended September 30, 2017 and 2016, the total research and development costs incurred were $169,246 and $198,330, respectively, a decrease of 15%. Research and development costs for the nine-month period ended September 30, 2017 represented raw materials used by SYCI for testing the manufacturing routine. Research and development costs for the nine-month period ended September 30, 2016 represented raw materials used by SYCI and SCRC for testing the manufacturing routine.
Write-off/Impairment on property, plant and equipment. Write-offs on property, plant and equipment for the nine-month period ended September 30, 2017 and 2016 were $0 and $90,395, respectively, a decrease of 100%. Write-offs on property, plant and equipment of $90,395 for the nine-month period ended September 30, 2016 represented the write-offs of certain protective shells to transmission pipelines and ducts during the enhancement project that started in August 2016 and completed in September 2016.
General and Administrative Expenses. General and administrative expenses were $8,236,430 for the nine-month period ended September 30, 2017, an increase of $3,696,585 (or 81%) as compared to $4,539,845 for the same period in 2016. This increase in general and administrative expenses was primarily due to (i) a non-cash expense related to stock options granted to employees increased from $17,400 for the nine-month period ended September 30, 2016 to $357,700 for the same period of 2017; and (ii) the unrealized exchange gain in relation to the translation difference of inter-company balance in RMB for the nine-month period ended September 30,2017 amounted to $1,140,363, as compared to the unrealized exchange gain for the same period in 2016 of $729,764; and (iii) depreciation and amortization of manufacturing plant and machinery incurred in September 2017 classified in general and administrative expense as production in all factories was temporarily stopped from September 1, 2017 to allow for rectification and improvement to be made to the facilities to comply with the new safety and environmental protection requirements of PRC.
Other Operating Income. Other operating income was $281,613 for the nine-month period ended September 30, 2017, a decrease of $46,937(or 14%) as compared to $328,550 for the same period in 2016 for sales of wastewater. Wastewater is generated from the production of bromine and eventually becomes crude salt when it evaporates. Not all of our bromine production plants have sufficient area on the property to allow for evaporation of wastewater to produce crude salt. Certain of our customers who have facilities located adjacent to our bromine production plants have agreed to allow us to channel our wastewater into brine pans on their properties for evaporation. These customers then are able to sell the resulting crude salt themselves. We signed agreements with four of our customers to sell them our wastewater at market prices.
35
Income from Operations. Income from operations was $34,130,721 for the nine-month period ended September 30, 2017 (or 33% of net revenue), a decrease of $5,822,919, or approximately 15%, over income from operations for the same period in 2016.
| Income from Operations by Segment | ||||||||||||||||
| Nine-Month Period Ended September 30, 2017 | Nine-Month Period Ended September 30, 2016 | |||||||||||||||
| Segment: | % of total | % of total | ||||||||||||||
| Bromine | $ | 17,269,984 | 48 | % | $ | 19,103,472 | 48 | % | ||||||||
| Crude Salt | 2,434,872 | 7 | % | (165,403 | ) | — | ||||||||||
| Chemical Products | 16,441,115 | 45 | % | 20,698,116 | 52 | % | ||||||||||
| Natural Gas | (90,471 | ) | — | (2,501 | ) | — | ||||||||||
| Income from operations before corporate costs | 36,055,500 | 100 | % | 39,633,684 | 100 | % | ||||||||||
| Corporate costs | (784,416 | ) | (409,808 | ) | ||||||||||||
| Unrealized exchange difference | (1,140,363 | ) | 729,764 | |||||||||||||
| Income from operations | $ | 34,130,721 | $ | 39,953,640 | ||||||||||||
Bromine segment
Income from operations from our bromine segment was $17,269,984 for the nine-month period ended September 30, 2017, a decrease of $1,833,488 (or approximately 10%) compared to the same period in 2016. This decrease was primarily attributable to the decrease in sales volume as mentioned in net revenue of bromine partially offset by the increased average selling price.
Crude salt segment
For the nine-month period ended September 30, 2017, income from operations from our crude salt segment was $2,434,872, compared to loss of $165,403 in the same period in 2016. This increase was primarily attributable to the increase in crude salt price and decrease in depreciation and amortization of manufacturing plant and machinery as mentioned in cost of net revenue of crude salt.
Chemical products segment
For the nine-month period ended September 30, 2017, income from operations from our chemical products segment was $16,441,115, a decrease of $4,257,001 (or approximately 21%) over same period in 2016. This decrease was primarily attributable to the decrease in sales volume of all of our chemical products as mentioned in cost of net revenue of chemical products.
Other Income, Net. Other income, net of $274,314 represented bank interest income, net of capital lease interest expense for the nine -month period ended September 30, 2017, an increase of $51,636 (or approximately 23%) as compared to the same period in 2016.
Net Income. Net income was $25,252,438 for the nine-month period ended September 30, 2017, a decrease of $4,927,258 (or approximately 16%) compared to the same period in 2016. This decrease was primarily attributable to decrease in sales volume of all of our products as mentioned in cost of net revenue of bromine, crude and chemical products.
Effective Tax Rate. Our effective tax rate for the nine-month period ended September 30, 2017 and 2016 was 27% and 25%, respectively. The effective tax rate of 27% for the nine-month period ended September 30, 2017 differs from the PRC statutory income tax rate of 25% mainly due to non-taxable item in connection with the unrealized and the exchange loss for the Company.
36
LIQUIDITY AND CAPITAL RESOURCES
As of September 30, 2017, cash and cash equivalents were $193,385,686 as compared to $163,884,574 as of December 31, 2016. The components of this increase of $29,501,112 are reflected below.
Statement of Cash Flows
| Nine-Month Period Ended September 30, | ||||||||
| 2017 | 2016 | |||||||
| Net cash provided by operating activities | $ | 23,477,422 | $ | 29,214,282 | ||||
| Net cash used in investing activities | $ | (1,482,954 | ) | $ | (17,423,126 | ) | ||
| Net cash used in financing activities | $ | (273,873 | ) | $ | (287,387 | ) | ||
| Effects of exchange rate changes on cash and cash equivalents | $ | 7,780,517 | $ | (4,026,574 | ) | |||
| Net Increase in cash and cash equivalents | $ | 29,501,112 | $ | 7,477,195 | ||||
For the nine-month period ended September 30, 2017, we met our working capital and capital investment requirements mainly by using cash flow from operations and cash on hand.
Net Cash Provided by Operating Activities
During the nine-month period ended September 30, 2017 and 2016, we had positive cash flow from operating activities approximately of $23.5 million and $29.2 million, respectively, primarily attributable to net income.
During the nine-month period ended September 30, 2017, cash flow from operating activities of approximately $23.5 million was less than our net income of approximately $25.3 million, mainly due to (i) cash used in working capital of approximately $20.2 million, which mainly consisted of the increase in accounts receivable and decrease in accounts payable and accrued expenses and tax payable, partially offset by the decrease in inventories; partially offset by (ii) substantial non-cash charges of approximately $18.4 million, mainly in the form of depreciation and amortization of property, plant and equipment.
During the nine-month period ended September 30, 2016, cash flow from operating activities of approximately $29.2 million was less than our net income of approximately $30.2 million, mainly due to (i) cash used in working capital of approximately $20.0 million, which mainly consisted of the increase in accounts receivable, partially offset by the decrease in inventories, increase in accounts payable and accrued expenses and tax payable; partially offset by (ii) substantial non-cash charges of approximately $19.1 million, mainly in the form of depreciation and amortization of property, plant and equipment.
Accounts receivable
Cash collections on our accounts receivable had a major impact on our overall liquidity. The following table presents the aging analysis of our accounts receivable as of September 30, 2017 and December 31, 2016.
| September 30, 2017 | December 31, 2016 | |||||||||||||||
| % of total | % of total | |||||||||||||||
| Aged 1-30 days | $ | 3,077,055 | 4 | % | $ | 10,300,739 | 20 | % | ||||||||
| Aged 31-60 days | $ | 12,976,950 | 18 | % | $ | 11,074,573 | 21 | % | ||||||||
| Aged 61-90 days | $ | 11,197,750 | 16 | % | $ | 10,577,810 | 21 | % | ||||||||
| Aged 91-120 days | $ | 13,905,925 | 19 | % | $ | 7,919,209 | 15 | % | ||||||||
| Aged 121-150 days | $ | 12,707,546 | 18 | % | $ | 6,924,979 | 13 | % | ||||||||
| Aged 151-180 days | $ | 8,423,396 | 12 | % | $ | 5,037,908 | 10 | % | ||||||||
| Aged 181-210 days | $ | 6,982,162 | 10 | % | $ | — | — | |||||||||
| Aged 211-240 days | $ | 2,521,580 | 3 | % | $ | — | — | |||||||||
| Total | $ | 71,792,364 | 100 | % | $ | 51,835,218 | 100 | % | ||||||||
The overall accounts receivable balance as of September 30, 2017 increased by $19,957,146 (or 39%), as compared to those as of December 31, 2016. Such increase is mainly attributable to the extended settlement days by customers due to the macro-economic tightening policy imposed by PRC government to slow down the economy, which in turn lengthened the average turnover days of accounts receivable from 138 days for the nine-month period ended September 30, 2016 to 162 days for the nine-month period ended September 30, 2017. In fiscal year 2016, a 90 to 180-day credit period was granted to customers with good payment history. To maintain the source of the Company’s business and in view of the strong cash flow position that the Company is in, management has extended credit terms to some customers up to 240 days in the nine months ended September 30, 2017. Approximately 30% of the balances of accounts receivable as of September 30, 2017 aged more than 90 days in the amount of $13,319,887 were settled in October 2017. We have policies in place to ensure that sales are made to customers with an appropriate credit history. We perform ongoing credit evaluation on the financial condition of our customers.
Some of our customers’ production is also affected by the new safety and environmental protection rules. We have communicated with our customers who have stopped their production for inspection by the government and have not resumed production. They confirmed that they will make payments owing to our Company on time. Based on our knowledge of these customers, they appear to have the ability to settle the accounts receivable as of September 30, 2017 within the credit term. Therefore, we believe that no allowance for doubtful accounts for the nine-month period ended September 30, 2017 is required.
37
Inventory
Our inventory consists of the following:
| September 30, 2017 | December 31, 2016 | |||||||||||||||
| % of total | % of total | |||||||||||||||
| Raw materials | $ | 449,575 | 18 | % | $ | 818,500 | 14 | % | ||||||||
| Finished goods | $ | 1,981,504 | 82 | % | $ | 4,370,331 | 74 | % | ||||||||
| Work-in-process | — | — | 692,850 | 12 | % | |||||||||||
| $ | 2,431,079 | 100 | % | $ | 5,881,681 | 100 | % | |||||||||
| Allowance for obsolete and slowing-moving inventory | $ | — | — | $ | — | — | ||||||||||
| Total | $ | 2,431,079 | 100 | % | $ | 5,881,681 | 100 | % | ||||||||
The net inventory level as of September 30, 2017 decreased by $3,450,602 (or 59%), as compared to the net inventory level as of December 31, 2016.
Raw materials decreased by 45% as of September 30, 2017 as compared to December 31, 2016. All of the raw materials are basic chemical industry materials, few of which have a possibility of loss over time, or major fluctuations in their prices. We concluded that all of our raw materials as of September 30, 2017 are fully realizable for production of finished goods without any impairment.
Our finished goods consist of bromine, crude salt and chemical products. Our chemical products are similar to raw materials, with no loss over time, a relatively stable market price and a gross profit margin of 33% for the nine-month period ended September 30, 2017 as compared to 34% for the same period in fiscal year 2016. Therefore, we believe that the realization of the chemical products is 100%. Similarly, as there is no depletion of bromine, we believe that the realization of it is also 100%. The gross profit margin for bromine for the nine-month period ended September 30, 2017 increased to 50%, as compared with 46% for the same period in fiscal year 2016, we anticipated that the price through 2017 will not fluctuate significantly to impair the cost of bromine.
As of September 30, 2017, the crude salt included in the inventory is approximately $1.35 million. The annual loss of crude salt due to evaporation is approximately 3%. The average selling price of crude salt per tonne increased from $27.99 for the third quarter of 2016 to $31.92 for the same period of 2017. The gross (loss) profit also increased from (8)% for the third quarter of 2016 to 46% for the same period in 2017. We believe that there will be no realization problem for crude salt as we do not expect selling price to be lower than the current price. If the selling price continues to decrease, there will be an impact on our crude salt realization value.
Net Cash Used in Investing Activities
In the nine-month period ended September 30, 2017, we used approximately $0.86 million cash for the prepayment of land leases. We also used approximately $0.06 million to acquire property, plant and equipment for the nine-month period ended September 30, 2017.
In the nine-month period ended September 30, 2016, we used approximately $0.67 million cash for the prepayment of land leases. In the same period, we also used approximately $15.23 million cash to carry out enhancement projects to our existing bromine extraction and crude salt production facilities and $1.46 million cash for the construction of roads and related infrastructure needed to begin operations in the remote and mountainous region of Daying county.
The investing activities described above were financed by opening cash balances as of December 31, 2016, and 2015, and cash generated from operation during the nine-month period ended September 30, 2017.
Net Cash Used in Financing Activities
We repaid approximately $0.3 million cash for our capital lease obligation for the nine-month period ended September 30, 2017 and 2016.
We believe that our available funds and cash flows generated from operations will be sufficient to meet our anticipated ongoing operating needs for the next twelve (12) months.
38
Working capital was approximately $261.1 million at September 30, 2017 as compared to approximately $207.8 million at December 31, 2016. The increase was mainly attributable to the cash provided by operating activities during the nine-month period ended September 30, 2017.
We had available cash of approximately $193.4 million at September 30, 2017, most of which is in highly liquid current deposits which earn no or little interest. We anticipate to spend approximately $35 million of capital expenditure in the rectification and improvement of the facilities to comply with the new safety and environmental protection requirements of PRC and this will be funded from our cash balance.
We intend to retain the cash for future expansion of our bromine and crude salt businesses through acquisition, enhancements to our existing bromine and crude salt business, and further development of the new resources in Sichuan Province.
In the future we intend to focus our efforts on the activities of SCHC, SYCI and DCHC as these segments continue to expand within the Chinese market.
We may not be able to identify, successfully integrate or profitably manage any businesses or business segment we may acquire, or any expansion of our business. An expansion may involve a number of risks, including possible adverse effects on our operating results, diversion of management attention, inability to retain key personnel, risks associated with unanticipated events and the financial statement effect of potential impairment of acquired intangible assets, any of which could have a materially adverse effect on our condition and results of operations. In addition, if competition for acquisition candidates or operations were to increase, the cost of acquiring businesses could increase materially. We may effect an acquisition with a target business which may be financially unstable, under-managed, or in its early stages of development or growth. In addition, if competition for acquisition candidates or operations were to increase, the cost of acquiring businesses could increase materially. Our inability to implement and manage our expansion strategy successfully may have a material adverse effect on our business and future prospects.
Contractual Obligations and Commitments
We have no significant contractual obligations not fully recorded on our condensed consolidated balance sheets or fully disclosed in the notes to our condensed consolidated financial statements. Additional information regarding our contractual obligations and commitments at September 30, 2017 is provided in the notes to our condensed consolidated financial statements. See “Notes to Condensed Consolidated Financial Statements, Note 18 – Capital Commitment and Operating Lease Commitments”.
Material Off-Balance Sheet Arrangements
We do not currently have any off balance sheet arrangements falling within the definition of Item 303(a) of Regulation S-K.
Critical Accounting Policies and Estimates
Our consolidated financial statements have been prepared in accordance with accounting principles generally accepted in the United States of America and this requires management to make estimates and assumptions that affect the reported amounts of assets and liabilities at the date of the consolidated financial statements and the reported amounts of revenues and expenses during the reporting period. We base these estimates on historical experience and on various other assumptions that are believed to be reasonable under the circumstances. Accordingly, actual results may differ significantly from these estimates under different assumptions or conditions. We have identified the following critical accounting policies and estimates used by us in the preparation of our financial statements: accounts receivable and allowance for doubtful accounts, assets retirement obligation, property, plant and equipment, recoverability of long lived assets, mineral rights, revenue recognition, income taxes, and stock-based compensation. These policies and estimates are described in the Company’s 2016 Form 10-K.
39
Item 3. Quantitative and Qualitative Disclosures About Market Risk
Pursuant to Item 305(e) of Regulation S-K (§ 229.305(e)), the Company is not required to provide the information required by this Item as it is a “smaller reporting company,” as defined by Rule 229.10(f)(1).
Item 4. Controls and Procedures
(a) Evaluation of Disclosure Controls and Procedures
We maintain disclosure controls and procedures (as such term is defined in Exchange Act Rules 13a-15(e) and 15d-15(e)) that are designed to ensure that information required to be disclosed in our reports filed pursuant to the Exchange Act is recorded, processed, summarized and reported within the time periods specified in the SEC’s rules, regulations and related forms, and that such information is accumulated and communicated to our management, including our Chief Executive Officer (“CEO”) and Chief Financial Officer (“CFO”), as appropriate, to allow timely decisions regarding required disclosure.
Under the supervision and with the participation of our management, including our CEO and CFO, we conducted an evaluation of the effectiveness of the design and operation of our disclosure controls and procedures as of the end of the period covered by this report. Based on this evaluation, our CEO and CFO concluded that our disclosure controls and procedures were effective as of the end of the period covered by this Form 10-Q.
(b) Changes in internal controls
There were no changes in our internal control over financial reporting (as such term is defined in Rules 13a-15(f) under the Exchange Act) during our most recently completed fiscal quarter, which is the subject of this report, that have materially affected, or are reasonably likely to materially affect, our internal control over financial reporting.
PART II—OTHER INFORMATION
None.
40
As a smaller reporting company, the Company is not required to make disclosures under this Item 1A.
Item 2. Unregistered Shares of Equity Securities and Use of Proceeds
None.
Item 3. Defaults Upon Senior Securities
None.
Item 4. Mine Safety Disclosures
Not applicable.
None.
| Exhibit No. |
Description
|
| 31.1 | Certification of Chief Executive Officer pursuant to Rule 13a-14(a) and 15d-14(a), as adopted pursuant to Section 302 of the Sarbanes-Oxley Act of 2002. |
| 31.2 | Certification of Chief Financial Officer pursuant to Rule 13a-14(a) and 15d-14(a), as adopted pursuant to Section 302 of the Sarbanes-Oxley Act of 2002. |
| 32.1 | Certification pursuant to 18 U.S.C. Section 1350, as adopted pursuant to Section 906 of the Sarbanes-Oxley Act of 2002. |
| 101.1 | The following financial statements from Gulf Resources, Inc.’s Quarterly Report on Form 10-Q for the quarterly period ended September 30, 2017 formatted in XBRL (eXtensible Business Reporting Language): (i) the Consolidated Balance Sheets; (ii) the Consolidated Statements of Operations and Other Comprehensive Income (Loss); (iii) the Consolidated Statements of Changes in Equity; (iv) the Consolidated Statement of Cash Flows; and, (v) the Notes to Consolidated Financial Statements, tagged as blocks of text. |
41
Pursuant to the requirements of Section 13 or 15(d) of the Securities Exchange Act of 1934, the registrant has duly caused this report to be signed on its behalf by the undersigned, thereunto duly authorized.
| GULF RESOURCES, INC. | ||
| Dated: November 13, 2017 | By: | /s/ Xiaobin Liu |
| Xiaobin Liu | ||
| Chief Executive Officer | ||
| (principal executive officer) | ||
| Dated: November 13, 2017 | By: | /s/ Min Li |
| Min Li | ||
| Chief Financial Officer | ||
| (principal financial and accounting officer) | ||
| 42 |