Attached files
| file | filename |
|---|---|
| EXCEL - IDEA: XBRL DOCUMENT - GULF RESOURCES, INC. | Financial_Report.xls |
| EX-31.2 - GULF RESOURCES, INC. | e610894_ex31-2.htm |
| EX-31.1 - GULF RESOURCES, INC. | e610894_ex31-1.htm |
| EX-32.1 - GULF RESOURCES, INC. | e610894_ex32-1.htm |
UNITED STATES
SECURITIES AND EXCHANGE COMMISSION
Washington, D.C. 20549
FORM 10-Q
|
x
|
QUARTERLY REPORT PURSUANT TO SECTION 13 OR 15(d) OF THE SECURITIES EXCHANGE ACT OF 1934
|
|
For the quarterly period ended March 31, 2013
|
|
|
Or
|
|
|
o
|
TRANSITION REPORT PURSUANT TO SECTION 13 OR 15(d) OF THE SECURITIES EXCHANGE ACT OF 1934
|
|
For the transition period from _________ to _________
|
Commission File Number: 000-20936
GULF RESOURCES, INC.
(Exact name of registrant as specified in its charter)
|
Delaware
|
13-3637458
|
|
|
(State or other jurisdiction of incorporation or organization)
|
(I.R.S. Employer Identification No.)
|
|
|
Level 11,Vegetable Building, Industrial Park of the East City,
Shouguang City, Shandong,
|
262700
|
|
|
(Address of principal executive offices)
|
(Zip Code)
|
Registrant’s telephone number, including area code: +86 (536) 567 0008
Indicate by check mark whether the registrant (1) has filed all reports required to be filed by Section 13 or 15(d) of the Securities Exchange Act of 1934 during the preceding 12 months (or for such shorter period that the registrant was required to file such reports), and (2) has been subject to such filing requirements for the past 90 days.
Yes x No o
Indicate by check mark whether the registrant has submitted electronically and posted on its corporate Web site, if any, every, Interactive Data File required to be submitted and posted pursuant to Rule 405 of Regulation S-T (§232.405 of this chapter) during the preceding 12 months (or for such shorter period that the registrant was required to submit and post such files).
Yes x No o
Indicate by check mark whether the registrant is a large accelerated filer, an accelerated filer, a non-accelerated filer, or a smaller reporting company. See the definitions of “large accelerated filer,” “accelerated filer” and “smaller reporting company” in Rule 12b-2 of the Exchange Act.
|
Large accelerated filer o
|
Accelerated filer o
|
|
Non-accelerated filer (Do not check if a smaller reporting company) o
|
Smaller reporting company x
|
Indicate by check mark whether the registrant is a shell company (as defined in Rule 12b-2 of the Exchange Act).
Yes o No x
|
Part I – Financial Information
|
|
|
1
|
|
|
18
|
|
|
30
|
|
|
30
|
|
|
Part II – Other Information
|
|
|
31
|
|
|
31
|
|
|
31
|
|
|
31
|
|
|
31
|
|
|
31
|
|
|
32
|
|
|
33
|
Item 1. Financial Statements
|
GULF RESOURCES, INC.
|
|
AND SUBSIDIARIES
|
|
CONSOLIDATED BALANCE SHEETS
|
|
(Expressed in U.S. dollars)
|
|
(UNAUDITED)
|
|
March 31, 2013
Unaudited
|
December 31, 2012
Audited
|
|||||||
|
Current Assets
|
||||||||
|
Cash
|
$
|
78,491,652
|
$
|
65,241,035
|
||||
|
Accounts receivable
|
30,891,664
|
35,969,900
|
||||||
|
Inventories
|
5,403,973
|
5,993,598
|
||||||
|
Prepayments and deposits
|
28,125
|
-
|
||||||
|
Prepaid land leases
|
243,842
|
47,307
|
||||||
|
Deferred tax assets
|
6,992
|
6,973
|
||||||
|
Total Current Assets
|
115,066,248
|
107,258,813
|
||||||
|
Non-Current Assets
|
||||||||
|
Property, plant and equipment, net
|
159,649,208
|
165,942,542
|
||||||
|
Property, plant and equipment under capital leases, net
|
1,914,973
|
1,996,478
|
||||||
|
Prepaid land leases, net of current portion
|
746,170
|
748,502
|
||||||
|
Deferred tax assets
|
2,252,630
|
2,246,699
|
||||||
|
Total non-current assets
|
164,562,981
|
170,934,221
|
||||||
|
Total Assets
|
$
|
279,629,229
|
$
|
278,193,034
|
||||
|
Liabilities and Stockholders’ Equity
|
||||||||
|
Current Liabilities
|
||||||||
|
Accounts payable and accrued expenses
|
$
|
5,963,131
|
$
|
6,533,236
|
||||
|
Retention payable
|
379,811
|
1,432,690
|
||||||
|
Capital lease obligation, current portion
|
246,546
|
193,164
|
||||||
|
Taxes payable
|
3,199,029
|
2,856,658
|
||||||
|
Total Current Liabilities
|
9,788,517
|
11,015,748
|
||||||
|
Non-Current Liabilities
|
||||||||
|
Capital lease obligation, net of current portion
|
2,960,697
|
2,952,902
|
||||||
|
Total Liabilities
|
$
|
12,749,214
|
$
|
13,968,650
|
||||
|
|
||||||||
|
Stockholders’ Equity
|
||||||||
|
PREFERRED STOCK; $0.001 par value; 1,000,000 shares authorized; none outstanding
|
$
|
$
|
||||||
|
COMMON STOCK; $0.0005 par value; 400,000,000 shares authorized; 38,552,070 and 38,552,070 shares issued; and 38,367,471 and 38,367,471 shares outstanding as of March 31, 2013 and December 31, 2012, respectively
|
19,276
|
19,276
|
||||||
|
Treasury stock; 184,599 shares as of March 31, 2013 and December 31, 2012 at cost
|
(500,000
|
)
|
(500,000
|
)
|
||||
|
Additional paid-in capital
|
79,494,088
|
79,489,188
|
||||||
|
Retained earnings unappropriated
|
148,564,517
|
146,745,754
|
||||||
|
Retained earnings appropriated
|
16,038,089
|
15,973,887
|
||||||
|
Cumulative translation adjustment
|
23,264,045
|
22,496,279
|
||||||
|
Total Stockholders’ Equity
|
266,880,015
|
264,224,384
|
||||||
|
Total Liabilities and Stockholders’ Equity
|
$
|
279,629,229
|
$
|
278,193,034
|
||||
See accompanying notes to the condensed consolidated financial statements.
GULF RESOURCES, INC.
AND SUBSIDIARIES
CONSOLIDATED STATEMENTS OF INCOME AND COMPREHENSIVE INCOME
(Expressed in U.S. dollars)
(UNAUDITED)
|
Three-Month Period Ended
March 31,
|
||||||||
|
2013
|
2012
|
|||||||
|
NET REVENUE
|
||||||||
|
Net revenue
|
$
|
22,502,580
|
$
|
23,808,674
|
||||
|
OPERATING EXPENSES/INCOME
|
||||||||
|
Cost of net revenue
|
(17,985,472
|
)
|
(17,115,882
|
)
|
||||
|
Sales, marketing and other operating expenses
|
(20,303
|
)
|
(17,764
|
)
|
||||
|
Research and development cost
|
(17,702
|
)
|
(42,798
|
)
|
||||
|
General and administrative expenses
|
(1,969,217
|
)
|
(2,112,205
|
)
|
||||
|
Other operating income
|
95,562
|
57,074
|
||||||
|
(19,897,132
|
)
|
(19,231,575
|
)
|
|||||
|
INCOME FROM OPERATIONS
|
2,605,448
|
4,577,099
|
||||||
|
OTHER INCOME (EXPENSE)
|
||||||||
|
Interest expense
|
(53,006
|
)
|
(54,412
|
)
|
||||
|
Interest income
|
72,843
|
98,890
|
||||||
|
INCOME BEFORE TAXES
|
2,625,285
|
4,621,577
|
||||||
|
INCOME TAXES
|
(742,320
|
)
|
(1,334,470
|
)
|
||||
|
NET INCOME
|
$
|
1,882,965
|
$
|
3,287,107
|
||||
|
COMPREHENSIVE INCOME:
|
||||||||
|
NET INCOME
|
$
|
1,882,965
|
$
|
3,287,107
|
||||
|
OTHER COMPREHENSIVE INCOME
|
||||||||
|
- Foreign currency translation adjustments
|
767,766
|
277,898
|
||||||
|
COMPREHENSIVE INCOME
|
$
|
2,650,731
|
$
|
3,565,005
|
||||
|
EARNINGS PER SHARE:
|
||||||||
|
BASIC
|
$
|
0.05
|
$
|
0.10
|
||||
|
DILUTED
|
$
|
0.05
|
$
|
0.10
|
||||
|
WEIGHTED AVERAGE NUMBER OF SHARES:
|
||||||||
|
BASIC
|
38,367,471
|
34,560,743
|
||||||
|
DILUTED
|
38,500,958
|
34,561,520
|
||||||
See accompanying notes to the condensed consolidated financial statements.
|
GULF RESOURCES, INC.
|
|
AND SUBSIDIARIES
|
|
CONSOLIDATED STATEMENT OF STOCKHOLDERS’ EQUITY
|
|
THREE-MONTH PERIOD ENDED MARCH 31, 2013
|
|
(Expressed in U.S. dollars)
|
|
(UNAUDITED)
|
|
Common stock
|
||||||||||||||||||||||||||||||||||||||||
|
Number
|
Number
|
Number
|
Additional
|
Statutory
|
Cumulative
|
|||||||||||||||||||||||||||||||||||
|
of shares
|
of shares
|
of treasury
|
Treasury
|
paid-in
|
common
|
Retained
|
translation
|
|||||||||||||||||||||||||||||||||
|
issued
|
outstanding
|
stock
|
Amount
|
stock
|
capital
|
reserve
|
earnings
|
adjustment
|
Total
|
|||||||||||||||||||||||||||||||
| $ | $ | $ | $ | $ | $ | $ | ||||||||||||||||||||||||||||||||||
|
BALANCE AT DECEMBER 31, 2012
|
38,552,070
|
38,367,471
|
184,599
|
19,276
|
(500,000
|
) |
79,489,188
|
15,973,887
|
146,745,754
|
22,496,279
|
264,224,384
|
|||||||||||||||||||||||||||||
|
Translation adjustment
|
-
|
- | - |
-
|
-
|
-
|
-
|
767,766
|
767,766
|
|||||||||||||||||||||||||||||||
|
Issuance of stock options to employees
|
- | - | - | - | - |
4,900
|
- | - | - |
4,900
|
||||||||||||||||||||||||||||||
|
Net income for three-month period ended March 31, 2013
|
-
|
- | - |
-
|
- |
-
|
-
|
1,882,965
|
-
|
1,882,965
|
||||||||||||||||||||||||||||||
|
Transfer to statutory common reserve fund
|
- | - | - | - | - | - |
64,202
|
(64,202
|
) | - | - | |||||||||||||||||||||||||||||
|
BALANCE AT MARCH 31, 2013
|
38,552,070
|
38,367,471
|
184,599
|
19,276
|
(500,000 | ) |
79,494,088
|
16,038,089
|
148,564,517
|
23,264,045
|
266,880,015
|
|||||||||||||||||||||||||||||
See accompanying notes to the condensed consolidated financial statements.
|
GULF RESOURCES, INC.
|
|
AND SUBSIDIARIES
|
|
CONSOLIDATED STATEMENTS OF CASH FLOWS
|
|
(Expressed in U.S. dollars)
|
|
(UNAUDITED)
|
|
Three-Month Period Ended March 31,
|
||||||||
|
2013
|
2012
|
|||||||
|
|
|
|||||||
|
CASH FLOWS FROM OPERATING ACTIVITIES
|
|
|
||||||
|
Net income
|
$
|
1,882,965
|
$
|
3,287,107
|
||||
|
Adjustments to reconcile net income to net cash provided by operating activities:
|
||||||||
|
Interest on capital lease obligation
|
52,790
|
54,020
|
||||||
|
Amortization of prepaid land leases
|
98,215
|
54,871
|
||||||
|
Depreciation and amortization
|
6,807,488
|
5,683,163
|
||||||
|
Exchange loss on inter-company balances
|
65,119
|
24,322
|
||||||
|
Stock-based compensation expense
|
4,900
|
15,300
|
||||||
|
Deferred tax asset
|
-
|
78,204
|
||||||
|
Changes in assets and liabilities:
|
||||||||
|
Accounts receivable
|
5,165,084
|
(5,325,631
|
)
|
|||||
|
Inventories
|
604,499
|
(323,846
|
)
|
|||||
|
Prepayments and deposits
|
(28,125
|
)
|
(56,325
|
)
|
||||
|
Accounts payable and accrued expenses
|
(584,614
|
)
|
362,206
|
|||||
|
Retention payable
|
(1,055,005
|
)
|
(15,458
|
)
|
||||
|
Taxes payable
|
334,305
|
(523,983
|
)
|
|||||
|
Net cash provided by operating activities
|
13,347,621
|
3,313,950
|
||||||
|
CASH FLOWS USED IN INVESTING ACTIVITIES
|
||||||||
|
Additions of prepaid land leases
|
(290,017
|
)
|
(109,076
|
)
|
||||
|
Net cash used in investing activities
|
(290,017
|
)
|
(109,076
|
)
|
||||
|
EFFECTS OF EXCHANGE RATE CHANGES ON CASH AND CASH EQUIVALENTS
|
193,013
|
86,483
|
||||||
|
NET INCREASE IN CASH AND CASH EQUIVALENTS
|
13,250,617
|
3,291,357
|
||||||
|
CASH AND CASH EQUIVALENTS - BEGINNING OF PERIOD
|
65,241,035
|
78,576,060
|
||||||
|
CASH AND CASH EQUIVALENTS - END OF PERIOD
|
$
|
78,491,652
|
$
|
81,867,417
|
||||
|
SUPPLEMENTAL DISCLOSURE OF CASH FLOW INFORMATION
|
||||||||
|
Cash paid during the period for:
|
||||||||
|
Income taxes
|
$
|
536,144
|
$
|
1,689,197
|
||||
See accompanying notes to the condensed consolidated financial statements.
GULF RESOURCES, INC.
AND SUBSIDIARIES
NOTES TO CONDENSED CONSOLIDATED FINANCIAL STATEMENTS
MARCH 31, 2013
(Expressed in U.S. dollars)
(UNAUDITED)
NOTE 1 – BASIS OF PRESENTATION AND SUMMARY OF SIGNIFICANT ACCOUNTING POLICIES
(a) Basis of Presentation and Consolidation
The accompanying condensed financial statements have been prepared by Gulf Resources, Inc. a Delaware corporation and its subsidiaries (collectively, the “Company”), without audit, in accordance with the instructions to Form 10-Q and, therefore, do not necessarily include all information and footnotes necessary for a fair statement of its financial position, results of operations and cash flows in accordance with accounting principles generally accepted in the United States (“US GAAP”). The balance sheet at December 31, 2012 is derived from the audited balance sheet but does not include all disclosures required by US GAAP. In connection with the consolidated financial statements and notes included in this report, reference is made to the consolidated financial statements and notes contained in the Company’s Annual Report on Form 10-K for the fiscal year ended December 31, 2012 (the “2012 Form 10-K”).
In the opinion of management, the unaudited financial information for the quarter ended March 31, 2013 presented reflects all adjustments, which are only normal and recurring, necessary for a fair statement of results of operations, financial position and cash flows. These condensed financial statements should be read in conjunction with the financial statements included in the Company’s 2012 Form 10-K. Operating results for the interim periods are not necessarily indicative of operating results for an entire fiscal year.
The preparation of financial statements in conformity with US GAAP requires management to make estimates and assumptions that affect the amounts that are reported in the financial statements and accompanying disclosures. Although these estimates are based on management’s best knowledge of current events and actions that the Company may undertake in the future, actual results may be different from the estimates. The Company also exercises judgments in the preparation of these condensed financial statements in the areas including classification of leases and related party transactions.
The consolidated financial statements include the accounts of Gulf Resources, Inc. and its wholly-owned subsidiary, Upper Class Group Limited, a company incorporated in the British Virgin Islands, which owns 100% of Hong Kong Jiaxing Industrial Limited, a company incorporated in Hong Kong (“HKJI”). HKJI owns 100% of Shouguang City Haoyuan Chemical Company Limited ("SCHC") which owns 100% of Shouguang Yuxin Chemical Industry Co., Limited (“SYCI”). All material intercompany transactions have been eliminated on consolidation.
(b) Nature of the Business
The Company manufactures and trades bromine and crude salt through its wholly-owned subsidiary, Shouguang City Haoyuan Chemical Company Limited ("SCHC"), and manufactures chemical products for use in the oil industry and paper manufacturing industry through its wholly-owned subsidiary, Shouguang Yuxin Chemical Industry Co., Limited ("SYCI") in The People’s Republic of China (“PRC”).
(c) Allowance for Doubtful Accounts
As of March 31, 2013 and December 31, 2012, allowances for doubtful accounts were nil. No allowances for doubtful accounts were charged to the income statement for the three-month periods ended March 31, 2013 and 2012.
(d) Concentration of Credit Risk
The Company is exposed to credit risk in the normal course of business, primarily related to accounts receivable and cash and cash equivalents. Substantially all of the Company’s cash and cash equivalents are maintained with financial institutions in the PRC, namely, Industrial and Commercial Bank of China Limited and China Merchants Bank Company Limited, which are not insured or otherwise protected. The Company placed $78,491,652 and $65,241,035 with these institutions as of March 31, 2013 and December 31, 2012, respectively. The Company has not experienced any losses in such accounts in the PRC.
Concentrations of credit risk with respect to accounts receivable exists as the Company sells a substantial portion of its products to a limited number of customers. However, such concentrations of credit risks are limited since the Company performs ongoing credit evaluations of its customers’ financial condition. About 80% and 100% of the balance of accounts receivable as of March 31, 2013 and December 31, 2012, respectively, are outstanding for less than three months. For the balances of accounts receivable aged more than 90 days as of March 31, 2013, all were settled in April 2013.
GULF RESOURCES, INC.
AND SUBSIDIARIES
NOTES TO CONDENSED CONSOLIDATED FINANCIAL STATEMENTS
MARCH 31, 2013
(Expressed in U.S. dollars)
(UNAUDITED)
NOTE 1 – BASIS OF PRESENTATION AND SUMMARY OF SIGNIFICANT ACCOUNTING POLICIES – Continued
(e) Property, Plant and Equipment
Property, plant and equipment are stated at cost less accumulated depreciation and any impairment losses. Expenditures for new facilities or equipment, and major expenditures for betterment of existing facilities or equipment are capitalized and depreciated using the straight-line method at rates sufficient to depreciate such costs over the estimated productive lives. All other ordinary repair and maintenance costs are expensed as incurred.
Mineral rights are recorded at cost less accumulated depreciation and any impairment losses. Mineral rights are amortized ratably over the term of the lease, or the equivalent term under the units of production method, whichever is shorter.
Construction in progress primarily represents direct costs of construction of plant, machinery and equipment. Costs incurred are capitalized and transferred to property and equipment upon completion, at which time depreciation commences.
The Company’s depreciation and amortization policies on property, plant and equipment, other than mineral rights and construction in progress, are as follows:
|
Useful life
(in years)
|
|||||
|
Buildings (including salt pans)
|
8 - 20 | ||||
|
Plant and machinery (including protective shells, transmission channels and ducts)
|
5 - 8 | ||||
|
Motor vehicles
|
5 | ||||
|
Furniture, fixtures and equipment
|
8 | ||||
Property, plant and equipment under capital leases are depreciated over their expected useful lives on the same basis as owned assets, or where shorter, the term of the lease, which is 20 years.
(f) Retirement Benefits
Pursuant to the relevant laws and regulations in the PRC, the Company participates in a defined contribution retirement plan for its employees arranged by a governmental organization. The Company makes contributions to the retirement scheme at the applicable rate based on the employees’ salaries. The required contributions under the retirement plans are charged to the consolidated income statement on an accrual basis when they are due. The Company’s contributions totaled $119,755 and $130,118 for the three-month periods ended March 31, 2013 and 2012, respectively.
(g) Revenue Recognition
The Company recognizes revenue, net of value-added tax, when persuasive evidence of an arrangement exists, delivery of the goods has occurred, customer acceptance has been obtained, which means the significant risks and ownership have been transferred to the customer, the price is fixed or determinable and collectability is reasonably assured.
(h) Shipping and Handling Fees and Costs
The Company does not charge its customers for shipping and handling as all customers arrange their own transportation of finished goods. The Company classifies shipping and handling costs for purchase of raw materials as part of the cost of net revenue, which amounted to $0 and $80,607 for the three-month periods ended March 31, 2013 and 2012, respectively. There is no such shipping and handling costs for the three-month period ended March 31, 2013 as they are borne by the suppliers since April 2012.
(i) Recoverability of Long-lived Assets
In accordance with Financial Accounting Standards Board (“FASB”) Accounting Standards Codification (“ASC”) 360-10-35 “Impairment or Disposal of Long-lived Assets” , long-lived assets to be held and used are analyzed for impairment whenever events or changes in circumstances indicate that the carrying amount of an asset may not be fully recoverable or that the useful lives of those assets are no longer appropriate. The Company evaluates at each balance sheet date whether events and circumstances have occurred that indicate possible impairment.
GULF RESOURCES, INC.
AND SUBSIDIARIES
NOTES TO CONDENSED CONSOLIDATED FINANCIAL STATEMENTS
MARCH 31, 2013
(Expressed in U.S. dollars)
(UNAUDITED)
NOTE 1 – BASIS OF PRESENTATION AND SUMMARY OF SIGNIFICANT ACCOUNTING POLICIES – Continued
(i) Recoverability of Long-lived Assets – Continued
The Company determines the existence of such impairment by measuring the expected future cash flows (undiscounted and without interest charges) and comparing such amount to the carrying amount of the assets. An impairment loss, if one exists, is then measured as the amount by which the carrying amount of the asset exceeds the discounted estimated future cash flows. Assets to be disposed of are reported at the lower of the carrying amount or fair value of such assets less costs to sell. Asset impairment charges are recorded to reduce the carrying amount of the long-lived asset that will be sold or disposed of to their estimated fair values. Charges for the asset impairment reduce the carrying amount of the long-lived assets to their estimated salvage value in connection with the decision to dispose of such assets.
For the three-month period ended March 31, 2013 and 2012, the Company determined that there are no events or circumstances indicating possible impairment of its long-lived assets.
(j) Basic and Diluted Net Income per Share of Common Stock
Basic earnings per common share are based on the weighted average number of shares outstanding during the periods presented. Diluted earnings per share are computed using weighted average number of common shares plus dilutive common share equivalents outstanding during the period. Anti-dilutive common stock equivalents which were excluded from the calculation of number of dilutive common stock equivalents amounted to 5,096,075 and 1,662,044 shares for the three-month periods ended March 31, 2013 and 2012, respectively.
The following table sets forth the computation of basic and diluted earnings per share:
|
Three-Month Period Ended
March 31,
|
||||||||
|
2013
|
2012
|
|||||||
|
Numerator
|
||||||||
|
Net income
|
$
|
1,882,965
|
$
|
3,287,107
|
||||
|
Denominator
|
||||||||
|
Basic: Weighted-average common shares outstanding during the period
|
38,367,471
|
34,560,743
|
||||||
|
Add: Dilutive effect of stock options
|
133,487
|
777
|
||||||
|
Diluted
|
38,500,958
|
34,561,520
|
||||||
|
Net income per share
|
||||||||
|
Basic
|
$
|
0.05
|
$
|
0.10
|
||||
|
Diluted
|
$
|
0.05
|
$
|
0.10
|
||||
(k) Reporting Currency and Translation
The financial statements of the Company’s foreign subsidiaries are measured using the local currency, Renminbi (“RMB”), as the functional currency; whereas the functional currency and reporting currency of the Company is the United States dollar (“USD” or “$”).
As such, the Company uses the “current rate method” to translate its PRC operations from RMB into USD, as required under ASC 830 “Foreign Currency Matters”. The assets and liabilities of its PRC operations are translated into USD using the rate of exchange prevailing at the balance sheet date. The capital accounts are translated at the historical rate. Adjustments resulting from the translation of the balance sheets of the Company’s PRC subsidiaries are recorded in stockholders’ equity as part of accumulated comprehensive income. The statement of income and comprehensive income is translated at average rates during the reporting period. Gains or losses resulting from transactions in currencies other than the functional currencies are recognized in net income for the reporting periods as part of general and administrative expense. The statement of cash flows is translated at average rates during the reporting period, with the exception of issuance of shares and payment of dividends which are translated at historical rates.
(l) Foreign Operations
All of the Company’s operations and assets are located in PRC. The Company may be adversely affected by possible political or economic events in this country. The effect of these factors cannot be accurately predicted.
(m) New Accounting Pronouncements
No accounting standards and guidance with an effective date during the three-month period ended March 31, 2013 or issued during 2013 had or are expected to have a significant impact on the Company’s condensed consolidated financial statements.
GULF RESOURCES, INC.
AND SUBSIDIARIES
NOTES TO CONDENSED CONSOLIDATED FINANCIAL STATEMENTS
MARCH 31, 2013
(Expressed in U.S. dollars)
(UNAUDITED)
NOTE 2 – ASSETS ACQUISITIONS
On November 26, 2012, the Company acquired substantially all of the assets owned by Chengyong Zhao in Guantai Village located Shouguang City Yangkou Township area (the “Chengyong Zhao Property” or “Factory No. 11”). The Chengyong Zhao Property includes a 20-year land lease covering approximately 1,727 acres of real property, with the related production facility, wells, pipelines, other production equipment, and the buildings located on the property. The total purchase price for the acquired assets was RMB 62 million (approximately $9.80 million), consisting of RMB 31 million (approximately $4.93million) in cash and 3,806,728 shares of the Company’s Common Stock valued at approximately $4.87 million (fair value). The production line of Factory No. 11 was resumed in March 2013 after certain repair and adjustments.
The Factory No. 11 described above was not in operation when the Company acquired the assets. Production of Factory No. 11 had previously been halted by the government since the owners of the bromine factories did not hold the proper license for the exploration and production of bromine. The Factories No.11 had not been in operation for more than six months at the time of the acquisition. The Company recorded the above transactions as a purchase of assets.
NOTE 3 – INVENTORIES
Inventories consist of:
|
March 31,
2013
|
December 31,
2012
|
|||||||
|
Raw materials
|
$
|
729,048
|
$
|
773,453
|
||||
|
Finished goods
|
4,702,893
|
5,248,039
|
||||||
|
Allowance for obsolete and slow-moving inventory
|
(27,968
|
)
|
(27,894
|
)
|
||||
|
$
|
5,403,973
|
$
|
5,993,598
|
|||||
NOTE 4 – PREPAID LAND LEASES
The Company prepaid for land leases with lease terms for periods ranging from one to fifty years to use the land on which the office premises, production facilities and warehouses of the Company are situated. The prepaid land lease is amortized on a straight line basis.
During the three-month periods ended March 31, 2013 and 2012, amortization of prepaid land lease totaled $98,215 and $54,871, respectively, which were recorded as cost of net revenue.
The Company has the rights to use certain parcels of land located in Shouguang, the PRC, through lease agreements signed with local townships. Such parcels of land are collectively owned by local townships and accordingly, the Company could not obtain land use rights certificates on these parcels of land. The parcels of land of which the Company could not obtain land use rights certificates covers a total of approximately 59.39 square kilometers of aggregate carrying value of $947,435 and approximately 59.39 square kilometers of aggregate carrying value of $753,086 as at March 31, 2013 and December 31, 2012, respectively.
GULF RESOURCES, INC.
AND SUBSIDIARIES
NOTES TO CONDENSED CONSOLIDATED FINANCIAL STATEMENTS
MARCH 31, 2013
(Expressed in U.S. dollars)
(UNAUDITED)
NOTE 5 – PROPERTY, PLANT AND EQUIPMENT, NET
Property, plant and equipment, net consist of the following:
|
March 31,
2013
|
December 31,
2012
|
|||||||
|
At cost:
|
||||||||
|
Mineral rights
|
$
|
6,350,999
|
$
|
6,334,277
|
||||
|
Buildings
|
51,039,719
|
50,905,337
|
||||||
|
Plant and machinery
|
166,559,864
|
166,121,329
|
||||||
|
Motor vehicles
|
9,165
|
9,140
|
||||||
|
Furniture, fixtures and office equipment
|
4,789,655
|
4,777,044
|
||||||
|
Total
|
228,749,402
|
228,147,127
|
||||||
|
Less: Accumulated depreciation and amortization
|
(69,100,194
|
)
|
(62,204,585
|
)
|
||||
|
Net book value
|
$
|
159,649,208
|
$
|
165,942,542
|
||||
The Company has certain buildings and salt pans erected on parcels of land located in Shouguang, PRC, and such parcels of land are collectively owned by local townships. The Company has not been able to obtain property ownership certificates over these buildings and salt pans as the Company could not obtain land use rights certificates on the underlying parcels of land. The Company could not obtain property ownership certificates covering certain properties of aggregate carrying value of $39,141,687 and $39,563,438 as at March 31, 2013 and December 31, 2012, respectively.
During the three-month period ended March 31, 2013, depreciation and amortization expense totaled $6,720,849, of which $6,232,602 and $488,247 were recorded as cost of net revenue and administrative expenses, respectively. During the three-month period ended March 31, 2012, depreciation and amortization expense totaled $5,596,921, of which $5,242,333 and $354,588 were recorded as cost of net revenue and administrative expenses, respectively.
NOTE 6 – PROPERTY, PLANT AND EQUIPMENT UNDER CAPITAL LEASES, NET
Property, plant and equipment under capital leases, net consist of the following:
|
March 31,
2013
|
December 31,
2012
|
|||||||
|
At cost:
|
||||||||
|
Buildings
|
$
|
131,270
|
$
|
130,925
|
||||
|
Plant and machinery
|
2,467,525
|
2,461,028
|
||||||
|
Total
|
2,598,795
|
2,591,953
|
||||||
|
Less: Accumulated depreciation and amortization
|
(683,822
|
)
|
(595,475
|
)
|
||||
|
Net book value
|
$
|
1,914,973
|
$
|
1,996,478
|
||||
The above buildings erected on parcels of land located in Shouguang, PRC, are collectively owned by local townships. The Company has not been able to obtain property ownership certificates over these buildings as the Company could not obtain land use rights certificates on the underlying parcels of land.
During the three-month period ended March 31, 2013, depreciation and amortization expense totaled $86,639, which was recorded as cost of net revenue. During the three-month period ended March 31, 2012, depreciation and amortization expense totaled $86,242, which was recorded as cost of net revenue.
GULF RESOURCES, INC.
AND SUBSIDIARIES
NOTES TO CONDENSED CONSOLIDATED FINANCIAL STATEMENTS
MARCH 31, 2013
(Expressed in U.S. dollars)
(UNAUDITED)
NOTE 7 – ACCOUNTS PAYABLE AND ACCRUED EXPENSES
Accounts payable and accrued expenses consist of the following:
|
March 31,
|
December 31,
|
|||||||
|
2013
|
2012
|
|||||||
|
Accounts payable
|
$
|
4,630,712
|
$
|
3,797,552
|
||||
|
Salary payable
|
202,426
|
190,926
|
||||||
|
Social security insurance contribution payable
|
55,279
|
52,399
|
||||||
|
Price adjustment funds
|
158,732
|
1,758,828
|
||||||
|
Other payables
|
915,982
|
733,531
|
||||||
|
Total
|
$
|
5,963,131
|
$
|
6,533,236
|
||||
NOTE 8 – RELATED PARTY TRANSACTIONS
During the three-month period ended March 31, 2013, the Company borrowed a sum of $321,449, and fully repaid later during the same period, from Jiaxing Lighting Appliance Company Limited (Jiaxing Lighting”), in which Mr. Ming Yang, a shareholder and the Chairman of the Company, had a 100% equity interest in Jiaxing Lighting. The amounts due to Jiaxing Lighting were unsecured, interest free and repayable on demand.
NOTE 9 – TAXES PAYABLE
|
Taxes payable consists of the following:
|
|
March 31,
|
December 31,
|
|||||||
|
2013
|
2012
|
|||||||
|
Income tax payable
|
$
|
814,289
|
$
|
606,190
|
||||
|
Mineral resource compensation fee payable
|
247,370
|
239,776
|
||||||
|
Value added tax payable
|
1,028,622
|
771,673
|
||||||
|
Land use tax payable
|
926,827
|
888,349
|
||||||
|
Other tax payables
|
181,921
|
350,670
|
||||||
|
Total
|
$
|
3,199,029
|
$
|
2,856,658
|
||||
NOTE 10 – CAPITAL LEASE OBLIGATIONS
The components of capital lease obligations are as follows:
|
Imputed
|
March 31,
|
December 31,
|
|||||||
|
Interest rate
|
2013
|
2012
|
|||||||
|
Total capital lease obligations
|
6.7%
|
$
|
3,207,243
|
$
|
3,146,066
|
||||
|
Less: Current portion
|
(246,546
|
)
|
(193,164
|
)
|
|||||
|
Capital lease obligations, net of current portion
|
$
|
2,960,697
|
$
|
2,952,902
|
|||||
Interest expenses from capital lease obligations amounted to $52,790 and $54,020 for the three-month periods ended March 31, 2013 and 2012, respectively, were charged to the income statements. See Note 19 for future minimum lease payments disclosure.
GULF RESOURCES, INC.
AND SUBSIDIARIES
NOTES TO CONDENSED CONSOLIDATED FINANCIAL STATEMENTS
MARCH 31, 2013
(Expressed in U.S. dollars)
(UNAUDITED)
NOTE 11 – RETAINED EARNINGS - APPROPRIATED
In accordance with the relevant PRC regulations and the PRC subsidiaries’ Articles of Association, the Company’s PRC subsidiaries are required to allocate its profit after tax to the following reserve:
Statutory Common Reserve Funds
SCHC and SYCI are required each year to transfer at least 10% of the profit after tax as reported under the PRC statutory financial statements to the Statutory Common Reserve Funds until the balance reaches 50% of the registered share capital. This reserve can be used to make up any loss incurred or to increase share capital. Except for the reduction of losses incurred, any other application should not result in this reserve balance falling below 25% of the registered capital. The Statutory Common Reserve Fund as of March 31, 2013 for SCHC and SYCI is 34% and 50% of its registered capital respectively.
NOTE 12 – STOCK-BASED COMPENSATION
Pursuant to the Company’s Amended and Restated 2007 Equity Incentive Plan, the aggregate number shares of the Company’s common stock available for grant of stock options and issuance is 4,341,989 shares.
The fair value of each option award below is estimated on the date of grant using the Black-Scholes option-pricing model. The risk free rate is based on the yield-to-maturity in continuous compounding of the US Government Bonds with the time-to-maturity similar to the expected tenor of the option granted, volatility is based on the annualized historical stock price volatility of the Company, and the expected life is based on the estimated average of the life of options using the “simplified” method, as prescribed in FASB ASC 718, due to insufficient historical exercise activity during recent years as a basis from which to estimate future exercise patterns.
In early March 2013, the Company granted to an independent director an option to purchase 12,500 shares of the Company’s common stock at an exercise price of $1.12 per share and the options vested immediately. The options were valued at $4,900 fair value, with assumed 74.73% volatility, a three-year expiration term with expected tenor of 1.49 years, a risk free rate of 0.19% and no dividend yield. For the three-month period ended March 31, 2013, $4,900 was recognized as general and administrative expenses.
The following table summarizes all Company stock option transactions between January 1, 2013 and March 31, 2013.
|
Number of Option
and Warrants
Outstanding
|
Number of Option
and Warrants
Vested
|
Range of
Exercise Price per Common Share
|
||||||||||
|
Balance, January 1, 2013
|
1,974,471
|
1,974,471
|
$0.95 - $12.60
|
|||||||||
|
Granted and vested during the three-month period ended March 31, 2013
|
12,500
|
12,500
|
$1.12
|
|||||||||
|
Balance, March 31, 2013
|
1,986,971
|
1,986,971
|
$0.95 - $12.60
|
|||||||||
|
Stock and Warrants Options Exercisable and Outstanding
|
||||||||
|
Weighted Average
|
Weighted Average
|
|||||||
|
Remaining
|
Exercise Price of
|
|||||||
|
Outstanding at March 31, 2013
|
Range of
Exercise Prices
|
Contractual Life
(Years)
|
Options Currently
Outstanding
|
|||||
|
Exercisable and outstanding
|
1,986,971
|
$0.95 - $12.60
|
2.53
|
$ 3.98
|
||||
The weighted average grant-date fair values as at March 31, 2013 and December 31, 2012 were $4.60 and $4.62, respectively.
GULF RESOURCES, INC.
AND SUBSIDIARIES
NOTES TO CONDENSED CONSOLIDATED FINANCIAL STATEMENTS
MARCH 31, 2013
(Expressed in U.S. dollars)
(UNAUDITED)
NOTE 13 – INCOME TAXES
The Company utilizes the asset and liability method of accounting for income taxes in accordance with FASB ASC 740-10.
(a) United States
Gulf Resources, Inc. is subject to the United States of America Tax law at tax rate of 34%. No provision for the US federal income taxes has been made as the Company had no US taxable income for the three-month periods ended March 31, 2013 and 2012, and management believes that its earnings are permanently invested in the PRC.
(b) BVI
Upper Class Group Limited, a subsidiary of Gulf Resources, Inc., was incorporated in the BVI and, under the current laws of the BVI, it is not subject to tax on income or capital gain in the BVI. Upper Class Group Limited did not generate assessable profit for the three-month periods ended March 31, 2013 and 2012.
(c) Hong Kong
Hong Kong Jiaxing Industrial Limited, a subsidiary of Upper Class Group Limited, was incorporated in Hong Kong and is subject to Hong Kong profits tax. The Company is subject to Hong Kong taxation on its activities conducted in Hong Kong and income arising in or derived from Hong Kong. No provision for profits tax has been made as the Company has no assessable income for the three-month periods ended March 31, 2013 and 2012. The applicable statutory tax rates for the three-month periods ended March 31, 2013 and 2012 are 16.5%.
(d) PRC
Enterprise income tax (“EIT”) for SCHC and SYCI in the PRC is charged at 25% of the assessable profits.
The operating subsidiaries SCHC and SYCI are wholly foreign-owned enterprises (“FIE”) incorporated in the PRC and are subject to PRC Foreign Enterprise Income Tax Law.
On February 22, 2008, the Ministry of Finance (“MOF”) and the State Administration of Taxation (“SAT”) jointly issued Cai Shui [2008] Circular 1 (“Circular 1”). According to Article 4 of Circular 1, distributions of accumulated profits earned by a FIE prior to January 1, 2008 to foreign investor(s) in 2008 will be exempted from withholding tax (“WHT”) while distribution of the profit earned by an FIE after January 1, 2008 to its foreign investor(s) shall be subject to WHT at 5% effective tax rate.
As of March 31, 2013 and December 31, 2012, the accumulated distributable earnings under the Generally Accepted Accounting Principles (GAAP”) of PRC are $199,727,137 and $197,042,047, respectively. Since the Company intends to reinvest its earnings to further expand its businesses in mainland China, its foreign invested enterprises do not intend to declare dividends to their immediate foreign holding companies in the foreseeable future. Accordingly, as of March 31, 2013 and December 31, 2012, the Company has not recorded any WHT on the cumulative amount of distributable retained earnings of its foreign invested enterprises in China. As of March 31, 2013 and December 31, 2012, the unrecognized WHT are $8,899,880 and $8,768,486, respectively.
The components of the provision for income taxes from continuing operations are:
|
Three-Month Period Ended March 31,
|
||||||||
|
2013
|
2012
|
|||||||
|
Current taxes – PRC
|
$
|
742,320
|
$
|
1,256,266
|
||||
|
Deferred taxes – PRC
|
-
|
78,204
|
||||||
|
$
|
742,320
|
$
|
1,334,470
|
|||||
GULF RESOURCES, INC.
AND SUBSIDIARIES
NOTES TO CONDENSED CONSOLIDATED FINANCIAL STATEMENTS
MARCH 31, 2013
(Expressed in U.S. dollars)
(UNAUDITED)
NOTE 13 – INCOME TAXES – Continued
The effective income tax expenses differ from the PRC statutory income tax rate of 25% from continuing operations in the PRC as follows:
|
Three-Month Period Ended March 31,
|
|||||||||
|
Reconciliations
|
2013
|
2012
|
|||||||
|
Statutory income tax rate
|
25 | % | 25 | % | |||||
|
US federal net operating loss
|
3 | % | 4 | % | |||||
|
Effective tax rate
|
28 | % | 29 | % | |||||
Significant components of the Company’s deferred tax assets and liabilities at March 31, 2013 and December 30, 2012 are as follows:
|
March 31,
|
December 31,
|
|||||||
|
2013
|
2012
|
|||||||
|
Deferred tax liabilities
|
$
|
-
|
$
|
-
|
||||
|
Deferred tax assets:
|
||||||||
|
Allowance for obsolete and slow-moving inventories
|
$
|
6,992
|
$
|
6,973
|
||||
|
Impairment on property, plant and equipment
|
466,005
|
464,778
|
||||||
|
Exploration costs
|
1,786,625
|
1,781,921
|
||||||
|
Compensation costs of unexercised stock options
|
1,811,044
|
1,809,378
|
||||||
|
US federal net operating loss
|
8,907,654
|
8,809,935
|
||||||
|
Total deferred tax assets
|
12,978,320
|
12,872,985
|
||||||
|
Valuation allowance
|
(10,718,698
|
)
|
(10,619,313
|
)
|
||||
|
Net deferred tax asset
|
$
|
2,259,622
|
$
|
2,253,672
|
||||
|
Current deferred tax asset
|
$
|
6,992
|
$
|
6,973
|
||||
|
Long-term deferred tax asset
|
$
|
2,252,630
|
$
|
2,246,699
|
||||
The increase in valuation allowance for each of the three-month periods ended March 31, 2013 and 2012 is $99,385 and $223,930, respectively.
There were no unrecognized tax benefits and accrual for uncertain tax positions as of March 31, 2013 and December 31, 2012.
NOTE 14 – BUSINESS SEGMENTS
The Company has three reportable segments: bromine, crude salt and chemical products. The reportable segments are consistent with how management views the markets served by the Company and the financial information that is reviewed by its chief operating decision maker.
GULF RESOURCES, INC.
AND SUBSIDIARIES
NOTES TO CONDENSED CONSOLIDATED FINANCIAL STATEMENTS
MARCH 31, 2013
(Expressed in U.S. dollars)
(UNAUDITED)
NOTE 14 – BUSINESS SEGMENTS – Continued
An operating segment’s performance is primarily evaluated based on segment operating income, which excludes share-based compensation expense, certain corporate costs and other income not associated with the operations of the segment. These corporate costs (income) are separately stated below and also include costs that are related to functional areas such as accounting, treasury, information technology, legal, human resources, and internal audit. The Company believes that segment operating income, as defined above, is an appropriate measure for evaluating the operating performance of its segments. All the customers are located in PRC.
|
Three-Month Period
Ended March 31, 2013
|
Bromine *
|
Crude
Salt *
|
Chemical
Products
|
Segment
Total
|
Corporate
|
Total
|
||||||||||||||||||
|
Net revenue
(external customers)
|
$
|
11,734,367
|
$
|
2,450,786
|
$
|
8,317,427
|
$
|
22,502,580
|
$
|
-
|
$
|
22,502,580
|
||||||||||||
|
Net revenue
(intersegment)
|
614,730
|
-
|
-
|
614,730
|
-
|
614,730
|
||||||||||||||||||
|
Income (loss) from operations before taxes
|
327,813
|
538,220
|
2,096,679
|
2,962,712
|
(357,264
|
)
|
2,605,448
|
|||||||||||||||||
|
Income taxes
|
180,632
|
33,266
|
528,422
|
742,320
|
-
|
742,320
|
||||||||||||||||||
|
Income (loss) from operations after taxes
|
147,181
|
504,954
|
1,568,257
|
2,220,392
|
(357,264
|
)
|
1,863,128
|
|||||||||||||||||
|
Total assets
|
166,871,312
|
56,641,404
|
55,994,831
|
279,507,547
|
121,682
|
279,629,229
|
||||||||||||||||||
|
Depreciation and amortization
|
4,377,972
|
1,559,199
|
870,317
|
6,807,488
|
-
|
6,807,488
|
||||||||||||||||||
|
Capital expenditures
|
-
|
-
|
-
|
-
|
-
|
-
|
||||||||||||||||||
|
Write-off / Impairment
|
-
|
-
|
-
|
-
|
-
|
-
|
||||||||||||||||||
|
Three-Month Period
Ended March 31, 2012
|
Bromine *
|
Crude
Salt *
|
Chemical
Products
|
Segment
Total
|
Corporate
|
Total
|
||||||||||||||||||
|
Net revenue
(external customers)
|
$
|
13,453,882
|
$
|
2,274,924
|
$
|
8,079,868
|
$
|
23,808,674
|
$
|
-
|
$
|
23,808,674
|
||||||||||||
|
Net revenue
(intersegment)
|
754,557
|
-
|
-
|
754,557
|
-
|
754,557
|
||||||||||||||||||
|
Income (loss) from operations before taxes
|
2,468,304
|
548,450
|
2,242,895
|
5,259,649
|
(682,550
|
)
|
4,577,099
|
|||||||||||||||||
|
Income taxes
|
662,898
|
103,866
|
567,706
|
1,334,470
|
-
|
1,334,470
|
||||||||||||||||||
|
Income (loss) from operations after taxes
|
1,805,406
|
444,584
|
1,675,189
|
3,925,179
|
(682,550
|
)
|
3,242,629
|
|||||||||||||||||
|
Total assets
|
160,068,266
|
52,592,746
|
48,624,781
|
261,285,793
|
512,684
|
261,798,477
|
||||||||||||||||||
|
Depreciation and amortization
|
3,664,242
|
1,363,506
|
655,415
|
5,683,163
|
-
|
5,683,163
|
||||||||||||||||||
|
Capital expenditures
|
-
|
-
|
-
|
-
|
-
|
-
|
||||||||||||||||||
|
Write-off / Impairment
|
-
|
-
|
-
|
-
|
-
|
-
|
||||||||||||||||||
* Certain common production overheads, operating and administrative expenses and asset items (mainly cash and certain office equipment) of bromine and crude salt segments in SCHC were split by reference to the average selling price and production volume of respective segment.
GULF RESOURCES, INC.
AND SUBSIDIARIES
NOTES TO CONDENSED CONSOLIDATED FINANCIAL STATEMENTS
MARCH 31, 2013
(Expressed in U.S. dollars)
(UNAUDITED)
NOTE 14 – BUSINESS SEGMENTS – Continued
|
Three-Month Period Ended March 31,
|
||||||||
|
Reconciliations
|
2013
|
2012
|
||||||
|
Total segment operating income
|
$
|
2,962,712
|
$
|
5,259,649
|
||||
|
Corporate costs
|
(357,264
|
)
|
(682,550
|
)
|
||||
|
Income from operations
|
2,605,448
|
4,577,099
|
||||||
|
Other income
|
19,837
|
44,478
|
||||||
|
Income before taxes
|
$
|
2,625,285
|
$
|
4,621,577
|
||||
The following table shows the major customer(s) (10% or more) for the three-month period ended March 31, 2013.
|
Number
|
Customer
|
Bromine
(000’s)
|
Crude Salt
(000’s)
|
Chemical Products
(000’s)
|
Total
Revenue
(000’s)
|
Percentage of
Total
Revenue (%)
|
|||||
|
1
|
Shandong Morui Chemical Company Limited
|
$ 1,182
|
$ 743
|
$ 930
|
$ 2,855
|
12.7%
|
|||||
|
TOTAL
|
$ 1,182
|
$ 743
|
$ 930
|
$ 2,855
|
12.7%
|
The following table shows the major customer(s) (10% or more) for the three-month period ended March 31, 2012.
|
Number
|
Customer
|
Bromine
(000’s)
|
Crude Salt
(000’s)
|
Chemical Products
(000’s)
|
Total
Revenue
(000’s)
|
Percentage of
Total Revenue (%)
|
||||||||||||||||
|
1
|
Shandong Morui Chemical Company Limited
|
$
|
1,729
|
$
|
386
|
$
|
999
|
$
|
3,114
|
13.1%
|
||||||||||||
|
2
|
Shouguang City Rongyuan Chemical Company Limited
|
$
|
2,022
|
$
|
448
|
$
|
-
|
$
|
2,470
|
10.4%
|
||||||||||||
|
TOTAL
|
$
|
3,751
|
$
|
834
|
$
|
999
|
$
|
5,584
|
23.5%
|
|||||||||||||
NOTE 15 – MAJOR SUPPLIERS
During the three-month period ended March 31, 2013 and 2012, the Company purchased 83.6% and 80.8% of its raw materials from its top five suppliers, respectively. As of March 31, 2013 and 2012, amounts due to those suppliers included in accounts payable were $3,847,225 and $4,038,415, respectively. This concentration makes the Company vulnerable to a near-term severe impact, should the relationships be terminated.
NOTE 16 – CUSTOMER CONCENTRATION
The Company sells a substantial portion of its products to a limited number of customers. During the three-month periods ended March 31, 2013 and 2012, the Company sold 40.7% and 45.3% of its products to its top five customers, respectively. As of March 31, 2013 and 2012, amounts due from these customers were $14,093,381 and $13,710,553, respectively. This concentration makes the Company vulnerable to a near-term severe impact, should the relationships be terminated.
GULF RESOURCES, INC.
AND SUBSIDIARIES
NOTES TO CONDENSED CONSOLIDATED FINANCIAL STATEMENTS
MARCH 31, 2013
(Expressed in U.S. dollars)
(UNAUDITED)
NOTE 17 – FAIR VALUE OF FINANCIAL INSTRUMENTS
The carrying values of financial instruments, which consist of cash, accounts receivable and accounts payable and other payables, approximate their fair values due to the short-term nature of these instruments. There were no material unrecognized financial assets and liabilities as of March 31, 2013 and December 31, 2012.
NOTE 18 – RESEARCH AND DEVELOPMENT EXPENSES
The total research and development expenses recognized in the income statements during the three-month period ended March 31, 2013 was $17,702, of which the consumption of bromine produced by the Company amounted to $6,120. The total research and development expense recognized in the income statements during the three-month period ended March 31, 2012 was $42,798, of which the consumption of bromine produced by the Company amounted to $10,740.
NOTE 19 – CAPITAL COMMITMENT AND OPERATING LEASE COMMITMENTS
As of March 31, 2013, the Company has leased a real property adjacent to Factory No. 1, with the related production facility, channels and ducts, other production equipment and the buildings located on the property, under capital lease. The future minimum lease payments required under capital lease, together with the present value of such payments, are included in the table show below.
The Company has leased nine pieces of land under non-cancelable operating leases, which are fixed in rentals and expired through December 2021, December 2030, December 2031, December 2032, December 2040, February 2059, August 2059 and June 2060, respectively. The Company accounts for the leases as operating leases.
The Company has no purchase commitment as of March 31, 2013.
The following table sets forth the Company’s contractual obligations as of March 31, 2013:
|
Capital Lease Obligations
|
Operating Lease Obligations
|
Purchase Obligations
|
||||||||||
|
Payable within:
|
||||||||||||
|
the next 12 months
|
$
|
299,419
|
$
|
937,827
|
$
|
-
|
||||||
|
the next 13 to 24 months
|
299,419
|
956,900
|
-
|
|||||||||
|
the next 25 to 36 months
|
299,419
|
976,710
|
-
|
|||||||||
|
the next 37 to 48 months
|
299,419
|
997,586
|
-
|
|||||||||
|
the next 49 to 60 months
|
299,419
|
1,019,274
|
-
|
|||||||||
|
thereafter
|
3,892,448
|
22,097,164
|
-
|
|||||||||
|
Total
|
$
|
5,389,543
|
$
|
26,985,461
|
$
|
-
|
||||||
|
Less: Amount representing interest
|
(2,182,300
|
)
|
||||||||||
|
Present value of net minimum lease payments
|
$
|
3,207,243
|
||||||||||
Rental expenses related to operating leases of the Company amounted to $234,319 and $194,316, which were charged to the income statements for the three-month ended March 31, 2013 and 2012, respectively.
GULF RESOURCES, INC.
AND SUBSIDIARIES
NOTES TO CONDENSED CONSOLIDATED FINANCIAL STATEMENTS
MARCH 31, 2013
(Expressed in U.S. dollars)
(UNAUDITED)
NOTE 20 – CONTINGENCY
Class Action
The Company and certain of its officers and directors (Ming Yang, Xiaobin Liu, and Min Li, collectively, the “Individual Defendants”) have been named as defendants in a putative securities class action lawsuit alleging violations of the federal securities laws. That action, which is now captioned Lewy, et al. v. Gulf Resources, Inc., et al., No. 11-cv-3722 ODW (MRWx), was filed on April 29, 2011 in the United States District Court for the Central District of California. The lead plaintiffs, who seek to represent a class of all purchasers and acquirers of the Company’s common stock between March 16, 2009 and April 26, 2011 inclusive, filed an amended complaint on September 12, 2011. Lead plaintiffs assert claims for violations of Section 10(b) of the Securities Exchange Act of 1934, and Rule 10b-5 thereunder. The amended complaint alleges the defendants made false or misleading statements in the Company’s Annual Reports on Form 10-K for the years ended December 31, 2008, 2009, and 2010, and in interim quarterly reports by, among other things, overstating revenue and net income and failing to disclose material related party transactions and certain facts about the CEO’s prior employment at another company. The amended complaint also asserts claims against the Individual Defendants for violations of Section 20(a) of the Securities Exchange Act of 1934. The amended complaint seeks damages in an unspecified amount. The Company filed a motion to dismiss the amended complaint. On May 15, 2012, the Court denied the Company’s motion to dismiss the amended complaint. On April 30, 2013, the parties executed a stipulation and agreement of settlement. The proposed settlement is subject to review and approval of the Court. The Company currently cannot estimate the amount or range of the overall costs in connection with this litigation. The Company believes that such costs will be reimbursed by the insurance company to the extent covered by the insurance policies.
Cautionary Note Regarding Forward-Looking Statements
The discussion below contains “forward-looking statements” within the meaning of the Private Securities Litigation Reform Act of 1995, Section 27A of the Securities Act, and Section 21E of the Exchange Act. We have used words such as “believes,” “intends,” “anticipates,” “expects” and similar expressions to identify forward-looking statements. These statements are based on information currently available to us and are subject to a number of risks and uncertainties that may cause our actual results of operations, financial condition, cash flows, performance, business prospects and opportunities and the timing of certain events to differ materially from those expressed in, or implied by, these statements. These risks, uncertainties and other factors include, without limitation, those matters discussed in Item 1A of Part I of our 2012 Form 10-K. Except as expressly required by the federal securities laws, we undertake no obligation to update such factors or to publicly announce the results of any of the forward-looking statements contained herein to reflect future events, developments, or changed circumstances, or for any other reason. The following discussion should be read in conjunction with our consolidated financial statements and notes thereto appearing in our 2012 Form 10-K and Item 1A, “Risk Factors” for the year ended December 31, 2012.
Overview
Gulf Resources conducts operations through its two wholly-owned China subsidiaries, SCHC and SYCI. Our business is also reported in these three segments, Bromine, Crude Salt, and Chemical Products.
Through SCHC, we produce and sell bromine and crude salt. We are one of the largest producers of bromine in China, as measured by production output. Elemental bromine is used to manufacture a wide variety of brominated compounds used in industry and agriculture. Bromine is commonly used in brominated flame retardants, fumigants, water purification compounds, dyes, medicines, and disinfectants.
Through SYCI, we manufacture and sell chemical products that are used in oil and gas field exploration, oil and gas distribution, oil field drilling, wastewater processing, papermaking chemical agents and inorganic chemicals.
Our Corporate History
We were incorporated in Delaware on February 28, 1989. From November 1993 through August 2006, we were engaged in the business of owning, leasing and operating coin and debit card pay-per copy photocopy machines, fax machines, microfilm reader-printers and accessory equipment under the name “Diversifax, Inc.”. Due to the increased use of internet services, demand for our services declined sharply, and in August 2006, our Board of Directors decided to discontinue our operations.
Upper Class Group Limited, incorporated in the British Virgin Islands in July 2006, acquired all the outstanding stock of SCHC, a company incorporated in Shouguang City, Shandong Province, PRC, in May 2005. At the time of the acquisition, members of the family of Mr. Ming Yang, our president and former chief executive officer, owned approximately 63.20% of the outstanding shares of Upper Class Group Limited. Since the ownership of Upper Class Group Limited and SCHC was then substantially the same, the acquisition was accounted for as a transaction between entities under common control, whereby Upper Class Group Limited recognized the assets and liabilities transferred at their carrying amounts.
On December 12, 2006, we, then known as Diversifax, Inc., a public “shell” company, acquired Upper Class Group Limited and SCHC. Under the terms of the agreement, the stockholders of Upper Class Group Limited received 13,250,000 (restated for the 2-for-1 stock split in 2007 and the 1-for-4 stock split in 2009) shares of voting common stock of Gulf Resources, Inc. in exchange for all outstanding shares of Upper Class Group Limited. Members of the Yang family received approximately 62% of our common stock as a result of the acquisition. Under accounting principles generally accepted in the United States, the share exchange is considered to be a capital transaction rather than a business combination. That is, the share exchange is equivalent to the issuance of stock by Upper Class Group Limited for the net assets of Gulf Resources, Inc., accompanied by a recapitalization, and is accounted for as a change in capital structure. Accordingly, the accounting for the share exchange is identical to that resulting from a reverse acquisition, except no goodwill is recorded. Under reverse takeover accounting, the post reverse acquisition comparative historical financial statements of the legal acquirer, Gulf Resources, Inc., are those of the legal acquiree, Upper Class Group Limited. Share and per share amounts stated have been retroactively adjusted to reflect the share exchange. On February 20, 2007, we changed our corporate name to Gulf Resources, Inc.
On February 5, 2007, we acquired SYCI, a company incorporated in PRC, in October 2000. Under the terms of the acquisition agreement, the stockholders of SYCI received a total of 8,094,059 (restated for the 2-for-1 stock split in 2007 and the 1-for-4 stock split in 2009) shares of common stock of Gulf Resources, Inc. in exchange for all outstanding shares of SYCI's common stock. Simultaneously with the completion of the acquisition, a dividend of $2,550,000 was paid to the former stockholders of SYCI. At the time of the acquisition, approximately 49.1% of the outstanding shares of SYCI were owned by Ms. Yu, Mr. Yang’s wife, and the remaining 50.9% of the outstanding shares of SYCI were owned by SCHC, all of whose outstanding shares were owned by Mr. Yang and his wife. Since the ownership of Gulf Resources, Inc. and SYCI are substantially the same, the acquisition was accounted for as a transaction between entities under common control, whereby Gulf Resources, Inc. recognized the assets and liabilities of SYCI at their carrying amounts. Share and per share amounts have been retroactively adjusted to reflect the acquisition.
To satisfy certain ministerial requirements necessary to confirm certain government approvals required in connection with the acquisition of SCHC by Upper Class Group Limited, all of the equity interest of SCHC were transferred to a newly formed Hong Kong corporation named Hong Kong Jiaxing Industrial Limited (“Hong Kong Jiaxing”) all of the outstanding shares of which are owned by Upper Class Group Limited. The transfer of all of the equity interest of SCHC to Hong Kong Jiaxing received approval from the local State Administration of Industry and Commerce on December 10, 2007.
As a result of the transactions described above, our corporate structure is linear. That is Gulf Resources owns 100% of the outstanding shares of Upper Class Group Limited, which owns 100% of the outstanding shares of Hong Kong Jiaxing, which owns 100% of the outstanding shares of SCHC, which owns 100% of the outstanding shares of SYCI.
On October 12, 2009 we completed a 1-for-4 reverse stock split of our common stock, such that for each four shares outstanding prior to the stock split there was one share outstanding after the reverse stock split. All shares of common stock referenced in this report have been adjusted to reflect the stock split figures. On October 27, 2009 our shares began trading on the NASDAQ Global Select Market under the ticker symbol “GFRE” and on June 30, 2011 we changed our ticker symbol to “GURE” to better reflection of our corporate name.
Our current corporate structure chart is set forth in the following diagram:
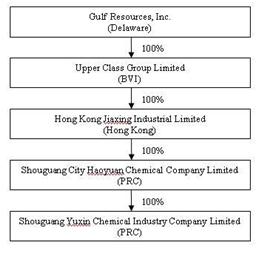
As a result of our acquisitions of SCHC and SYCI, our historical financial statements and the information presented below reflects the accounts of SCHC and SYCI. The following discussion should be read in conjunction with our consolidated financial statements and notes thereto appearing elsewhere in this report.
RESULTS OF OPERATIONS
The following table presents certain information derived from the consolidated statements of operations, cash flows and stockholders’ equity for the three-month periods ended March 31, 2013 and 2012.
Comparison of the Three-Month Periods Ended March 31, 2013 and 2012
|
Three-Month Period
Ended March 31, 2013
|
Three-Month Period
Ended March 31, 2012
|
% Change
|
|||||||||
|
Net revenue
|
$
|
22,502,580
|
$
|
23,808,674
|
|
(5
|
%)
|
||||
|
Cost of net revenue
|
$
|
(17,985,472
|
)
|
$
|
(17,115,882
|
)
|
|
5
|
%
|
||
|
Gross profit
|
$
|
4,517,108
|
$
|
6,692,792
|
|
(33
|
%)
|
||||
|
Sales, marketing and other operating expenses
|
$
|
(20,303
|
)
|
$
|
(17,764
|
)
|
14
|
%
|
|||
|
Research and development costs
|
$
|
(17,702
|
)
|
$
|
(42,798
|
)
|
|
(59
|
%)
|
||
|
General and administrative expenses
|
$
|
(1,969,217
|
)
|
$
|
(2,112,205
|
)
|
(7
|
%)
|
|||
|
Other operating income
|
$
|
95,562
|
$
|
57,074
|
|
67
|
%
|
||||
|
Income from operations
|
$
|
2,605,448
|
$
|
4,577,099
|
|
(43
|
%)
|
||||
|
Other income, net
|
$
|
19,837
|
$
|
44,478
|
|
(55
|
%)
|
||||
|
Income before taxes
|
$
|
2,625,285
|
$
|
4,621,577
|
|
(43
|
%)
|
||||
|
Income taxes
|
$
|
(742,320
|
)
|
$
|
(1,334,470
|
)
|
|
(44
|
%)
|
||
|
Net income
|
$
|
1,882,965
|
$
|
3,287,107
|
|
(43
|
%)
|
||||
Net revenue Net revenue was $22,502,580 for three-month period ended March 31, 2013, a decrease of approximately $1.3 million (or 5%) as compared to the same period in 2012. This decrease was primarily attributable to the reduction of our bromine segment products, which decreased from $13,453,882 for the three-month period ended March 31, 2012 to $11,734,367 for the same period in 2013, a decrease of approximately 13%.
Revenue from the crude salt segment increased from $2,274,924 for the three-month period ended March 31, 2012 to $2,450,786 for the same period in 2013, an increase of approximately 8%. Revenue from the chemical products segment slightly increased from $8,079,868 for the three-month period ended March 31, 2012 to $8,317,427 for the same period in 2013, an increase of approximately 3%.
|
Net Revenue by Segment
|
||||||||||||||||||||
|
Three-Month Period Ended
|
Three-Month Period Ended
|
Percent Increase/(Decrease)
|
||||||||||||||||||
|
March 31, 2013
|
March 31, 2012
|
of Net Revenue
|
||||||||||||||||||
|
Segment
|
% of total
|
% of total
|
||||||||||||||||||
|
Bromine
|
$
|
11,734,367
|
52
|
%
|
$
|
13,453,882
|
56
|
%
|
(13
|
%)
|
||||||||||
|
Crude Salt
|
$
|
2,450,786
|
11
|
%
|
$
|
2,274,924
|
10
|
%
|
8
|
%
|
||||||||||
|
Chemical Products
|
$
|
8,317,427
|
37
|
%
|
$
|
8,079,868
|
34
|
%
|
3
|
%
|
||||||||||
|
Total sales
|
$
|
22,502,580
|
100
|
%
|
$
|
23,808,674
|
100
|
%
|
(5
|
%)
|
||||||||||
|
Three-Month Period Ended
|
Percentage Change
|
|||||||||||
|
Bromine and crude salt segments product sold in tonnes
|
March 31, 2013
|
March 31, 2012
|
Increase
|
|||||||||
|
Bromine (excluded volume sold to SYCI)
|
3,843
|
3,770
|
2
|
%
|
||||||||
|
Crude Salt
|
62,007
|
59,836
|
4
|
%
|
||||||||
|
Three-Month Period Ended
|
Percentage Change
|
|||||||||||
|
Chemical products segment sold in tonnes
|
March 31, 2013
|
March 31, 2012
|
Increase/(Decrease)
|
|||||||||
|
Oil and gas exploration additives
|
2,491
|
2,344
|
6
|
%
|
||||||||
|
Paper manufacturing additives
|
839
|
482
|
74
|
%
|
||||||||
|
Pesticides manufacturing additives
|
684
|
798
|
(14
|
%)
|
||||||||
|
Overall
|
4,014
|
3,624
|
11
|
%
|
||||||||
Bromine segment
The decrease in net revenue from our bromine segment was mainly due to the decrease in the selling price of bromine. The selling price of bromine decreased from $3,569 per tonne for the three-month period ended March 31, 2012 to $3,053 tonnes for the same period in 2013, a decrease of 14%. The major reason for the decrease in the selling price of bromine was mainly attributable to the macro-economic tightening policy imposed by the PRC government beginning in the second half of 2011 to slow down the economy, which has affected our customers’ industries. As a result, we needed to offer competitive selling prices to our customers to compete with other bromine manufacturers. The average selling price for this quarter increased $99 per tonne, as compared with the three-month period ended December 31, 2012, which was $2,954 per tonne. We expect the average selling price of bromine to remain at the current level through the end of 2013 should the PRC government’s macro-economic tightening policy remain in place.
Due to an increase in the number of our bromine production plants in recent years, the sales volume of bromine increased from 3,770 tonnes for the three-month periods ended March 31, 2012 to 3,843 tonnes for the same period in 2013, an increase of 2%. The table below shows the changes in the average selling price and changes in the sales volume of bromine for three-month period ended March 31, 2013 from the same period in 2012.
|
Three-Month Period
Ended March 31,
|
||||
|
Increase / (Decrease) in net revenue of bromine as a result of:
|
2013 vs. 2012
|
|||
|
Decrease in average selling price
|
$
|
(1,962,395
|
)
|
|
|
Increase in sales volume
|
$
|
242,880
|
||
|
Total effect on net revenue of bromine
|
$
|
(1,719,515
|
)
|
|
Crude salt segment
The increase in net revenue from our crude salt segment was mainly due to the increase in both the average selling price and sales volume of crude salt. The average selling price of crude salt increased from $38.02 per tonne for the three-month period ended March 31, 2012 to $39.52 per tonne for the same period in 2013, an increase of 4%, and the sales volume of crude salt also increased by nearly 4% from 59,836 tonnes for the three-month period ended March 31, 2012 to 62,007 tonnes for the same period in 2013. The increase in both the average selling price and sales volume was mainly due to the stable demand as crude salt is a basic and elementary material for chemical industry.
We noted a upward trend in the average selling price of crude salt since the third quarter of 2011 as due to the stable demand of the crude salt. The average selling price increased from $37.19 per tonne in the third quarter of 2011 to $39.52 per tonne in the first quarter of 2013. We expect the average selling price of crude salt to remain at current levels through the end of 2013.
|
Three-Month Period
Ended March 31,
|
||||
|
Increase in net revenue of crude salt as a result of:
|
2013 vs. 2012
|
|||
|
Increase in average selling price
|
$
|
91,686
|
||
|
Increase in sales volume
|
$
|
84,176
|
||
|
Total effect on net revenue of crude salt
|
$
|
175,862
|
||
Chemical products segment
|
Product Mix of Chemical Products Segment
|
Percent
|
|||||||||||||||||||
|
Three-Month Period Ended
|
Three-Month Period Ended
|
Change of
|
||||||||||||||||||
|
March 31, 2013
|
March 31, 2012
|
Net Revenue
|
||||||||||||||||||
|
Chemical Products
|
% of total
|
% of total
|
||||||||||||||||||
|
Oil and gas exploration additives
|
$
|
4,621,678
|
55
|
%
|
$
|
4,161,559
|
52
|
%
|
11
|
%
|
||||||||||
|
Paper manufacturing additives
|
$
|
890,672
|
11
|
%
|
$
|
680,533
|
8
|
%
|
31
|
%
|
||||||||||
|
Pesticides manufacturing additives
|
$
|
2,805,077
|
34
|
%
|
$
|
3,237,776
|
40
|
%
|
(13
|
%)
|
||||||||||
|
Total sales
|
$
|
8,317,427
|
100
|
%
|
$
|
8,079,868
|
100
|
%
|
3
|
%
|
||||||||||
Net revenue from our chemical products segment increased from $8,079,868 for the three-month period ended March 31, 2012 to $8,317,427 for the same period in 2013, an increase of approximately 3%. The increase was mainly attributable to the increase in demand for our oil and gas exploration additives and paper manufacturing additives. Our oil and gas exploration chemicals are the most popular products within the chemical products segment, which contributed $4,621,678 (or 55%) and $4,161,559 (or 52%) of our chemical segment revenue for the three-month periods ended March 31, 2013 and 2012, respectively, with an increase of $460,119, or 11%. Net revenue from our paper manufacturing additives increased from $680,533 for the three-month period ended March 31, 2012 to $890,672 for the same period in 2013, an increase of approximately 31%.
However, the effect of the increase in net revenue from our chemical products segment was partially offset by the decrease in the sales volume for our pesticides manufacturing additives. The sales volume for our pesticides manufacturing additives decreased by 14% for the three-month period ended March 31, 2013 as compared with the same period in 2012.The table below shows the changes in the average selling price and changes in the sales volume of major chemical products for three-month period ended March 31, 2013 from the same period in 2012.
|
Increase / (Decrease) in net revenue,
for the three-month period ended March 31,
2013 vs. 2012, as a result of:
|
Oil and gas exploration additives
|
Paper manufacturing additives
|
Pesticides manufacturing additives
|
Total
|
||||||||||||
|
Increase / (Decrease) in average selling price
|
$
|
193,258
|
$
|
(231,377
|
)
|
$
|
32,327
|
$
|
(5,792
|
)
|
||||||
|
Increase / (Decrease) in sales volume
|
$
|
266,861
|
$
|
441,516
|
$
|
(465,026
|
)
|
$
|
243,351
|
|||||||
|
Total effect on net revenue of chemical products
|
$
|
460,119
|
$
|
210,139
|
$
|
(432,699
|
)
|
$
|
237,559
|
|||||||
Cost of Net Revenue
|
Cost of Net Revenue by Segment
|
% Change
|
|||||||||||||||||||
|
Three-Month Period Ended
|
Three-Month Period Ended
|
of Cost of
|
||||||||||||||||||
|
March 31, 2013
|
March 31, 2012
|
Net Revenue
|
||||||||||||||||||
|
Segment
|
% of total
|
% of total
|
||||||||||||||||||
|
Bromine
|
$
|
10,329,842
|
58
|
%
|
$
|
9,844,496
|
58
|
%
|
5
|
%
|
||||||||||
|
Crude Salt
|
$
|
1,696,679
|
9
|
%
|
$
|
1,538,741
|
9
|
%
|
10
|
%
|
||||||||||
|
Chemical Products
|
$
|
5,958,951
|
33
|
%
|
$
|
5,732,645
|
33
|
%
|
4
|
%
|
||||||||||
|
Total
|
$
|
17,985,472
|
100
|
%
|
$
|
17,115,882
|
100
|
%
|
5
|
%
|
||||||||||
Cost of net revenue reflects mainly the raw materials consumed and the direct salaries and benefits of staff engaged in the production process, electricity, depreciation and amortization of manufacturing plant and machinery and other manufacturing costs. Our cost of net revenue was $17,985,472 for three-month period ended March 31, 2013, an increase of $869,590 (or 5%) as compared to the same period in 2012. The increase in overall cost of net revenue was mainly attributable to the increase depreciation and amortization of manufacturing plant and machinery, which was partially offset by the decrease in purchase price of raw materials
Bromine production capacity and utilization of our factories
The table below represents the annual capacity and utilization ratios for all of our bromine producing properties:
|
Annual Production Capacity
(in tonnes)
|
Utilization
Ratio (i)
|
|||||||||
|
Three-month period ended March 31, 2012
|
44,547
|
37%
|
||||||||
|
Three-month period ended March 31, 2013
|
47,347
|
34%
|
||||||||
|
Variance of the three-month periods ended March 31, 2013 and 2012
|
2,800
|
(ii)
|
(3%
|
)
|
||||||
(i) Utilization ratio is calculated based on the annualized actual production volume in tonnes for the periods divided by the annual production capacity in tonnes.
(ii) The increase in 2,800 tonnes production capacity represents the management’s estimate of the capacity of Factory No. 11 acquired in late November 2012.
Our utilization ratio decreased by 3% for the three-month period ended March 31, 2013 as compared with the same period in 2012. The decrease in utilization was mainly attributable to the low demand for bromine as a result of the macro-economic tightening policy imposed by the PRC government to slow down the economy, which reduced our production volume since mid-2011.
In view of the trend of a decrease in the bromine concentration of the brine water being extracted at our production facilities as explained in 2012 Form 10-K, and in order to reduce the leakage rate and attempt to recover the annual production capacity of bromine and crude salt to a higher level in the future, we plan to carry out enhancement project for our transmission channels and ducts in Factories No.10 and No 11 in 2013. During the three-month period ended March 31, 2013, no such enhancement work was carried out due to unexpected weather conditions. We expect to resume the enhancement work in the second and third quarters of 2013 when weather conditions permit.
Bromine segment
For the three-month period ended March 31, 2013, the cost of net revenue for the bromine segment was $10,329,842, an increase of $485,346 or 5% over the same period in 2012. The most significant components of the costs of net revenue for the bromine segment were cost of raw materials and finished goods consumed of $4,607,118 (or 44%), depreciation and amortization of manufacturing plant and machinery of $4,113,259 (or 40%) and electricity of $580,524 (or 6%) for the three-month period ended March 31, 2013. For the three-month period ended March 31, 2012, the major components of the cost of net revenue were the cost of raw materials and finished goods consumed of $4,849,541 (or 49%), depreciation and amortization of manufacturing plant and machinery of $3,370,515 (or 34%) and electricity of $640,249 (or 7%), the cost structure changed as compared with the same period in 2013 where the contribution from cost of raw materials and finished goods consumed decreased by 5% and depreciation and amortization of manufacturing plant and machinery increased by 7%. The increase in net cost of net revenue was mainly attributable to the increase in depreciation and amortization of manufacturing plant and machinery, which was largely offset by the decrease in raw material prices,. The table below represents the major production cost component of bromine per tonne sold for respective periods:
|
Per tonne production cost
component of bromine segment
|
Three-Month Period Ended
|
Three-Month Period Ended
|
||||||||||||||||||||
|
March 31, 2013
|
March 31, 2012
|
% Change
|
||||||||||||||||||||
|
% of total
|
% of total
|
|||||||||||||||||||||
|
Raw materials
|
$
|
1,199
|
44
|
%
|
$
|
1,286
|
49
|
%
|
(7
|
%)
|
||||||||||||
|
Depreciation and amortization
|
$
|
1,070
|
40
|
%
|
$
|
894
|
34
|
%
|
20
|
%
|
||||||||||||
|
Electricity
|
$
|
151
|
6
|
%
|
$
|
170
|
7
|
%
|
(11
|
%)
|
||||||||||||
|
Others
|
$
|
268
|
10
|
%
|
$
|
262
|
10
|
%
|
3
|
%
|
||||||||||||
|
Production cost of bromine per tonne
|
$
|
2,688
|
100
|
%
|
$
|
2,612
|
100
|
%
|
3
|
%
|
||||||||||||
Our production cost of bromine per tonne sold was $2,688 for the three-month period ended March 31, 2013, an increase of 3% (or $76) as compared to the same period in 2012, which was attributable mainly to the component of depreciation and amortization of manufacturing plant and machinery. The significant percentage increase in depreciation and amortization per tonne by 20% was due to the enhancement projects in second quarter of 2012 to our extraction wells and transmission channels and ducts, which accelerated the depreciation and amortization of the plant and machinery. The cost of raw materials consumed per tonne slighted decreased by 7% as compared to the last comparison period, which was mainly attributable to the decrease in the purchase price of raw materials due to the macro-economic tightening policy imposed by the PRC government.
Crude salt segment
The cost of net revenue for our crude salt segment for the three-month period ended March 31, 2013 was $1,696,679, representing an increase of $157,938, or 10%, compared to $1,538,741 for the same period in 2012. The increase in cost was mainly due to the increase in the number of enhancement projects performed in second quarter of 2012, which in turn resulted in an increase in the depreciation and amortization of manufacturing plant and machinery. The significant cost components for the three-month period ended March 31, 2013 were depreciation and amortization of $1,221,409 (or 72%), resource taxes calculated based on crude salt sold of $197,518 (or 12%) and electricity of $86,452 (or 5%). The significant cost components for the three-month period ended March 31, 2012 were depreciation and amortization of $1,103,853 (or 72%), resource tax of $189,729 (or 12%) and electricity of $84,051 (5%). The table below represents the major production cost component of crude salt per ton for respective periods:
|
Per tonne production cost
component of crude salt segment
|
Three-Month Period Ended
|
Three-Month Period Ended
|
||||||||||||||||||||
|
March 31, 2013
|
March 31, 2012
|
% Change
|
||||||||||||||||||||
|
% of total
|
% of total
|
|||||||||||||||||||||
|
Depreciation and amortization
|
$
|
19.7
|
72
|
%
|
$
|
18.4
|
72
|
%
|
7
|
%
|
||||||||||||
|
Resource tax
|
$
|
3.2
|
12
|
%
|
$
|
3.2
|
12
|
%
|
1
|
%
|
||||||||||||
|
Electricity
|
$
|
1.4
|
5
|
%
|
$
|
1.4
|
5
|
%
|
1
|
%
|
||||||||||||
|
Others
|
$
|
3.1
|
11
|
%
|
$
|
2.7
|
11
|
%
|
18
|
%
|
||||||||||||
|
Production cost of crude salt per tonne
|
$
|
27.4
|
100
|
%
|
$
|
25.7
|
100
|
%
|
6
|
%
|
||||||||||||
Our production cost of crude salt per tonne was $27.4 for the three-month period ended March 31, 2013, an increase of 6% (or $1.7) as compared to the same period in 2012, which was attributable mainly to the components of depreciation and amortization of manufacturing plant and machinery. The significant percentage increase in depreciation and amortization per tonne by 7% was due to the enhancement projects in second quarter of 2012 to our extraction wells and transmission channels and ducts, which accelerated the depreciation and amortization of the plant and machinery. Other production costs represented mainly salaries and welfare of labor for the crude salt fields.
Chemical products segment
Cost of net revenue for our chemical products segment for the three-month period ended March 31, 2013 was $5,958,951, representing an increase of $226,306 or 4% over the same period in 2012. The significant costs were cost of raw material and finished goods consumed of $5,477,868 (or 92%) and $4,806,866 (or 84%) and depreciation and amortization of manufacturing plant and machinery of $695,532 (or 12%) and $640,577 (or 11%) for each of the three-month periods ended March 31, 2013 and 2012, respectively. As the components of our cost of net revenue are fixed levels of depreciation and amortization of our manufacturing plant and machinery, the rate of increase for the cost of net revenue for our chemical products segment was more than that of net revenue.
Gross Profit Gross profit was $4,517,108, or 20%, of net revenue for three-month period ended March 31, 2013 compared to $6,692,792, or 28%, of net revenue for the same period in 2012. The decrease in gross profit percentage was primarily attributable to a drop in the margin percentage in all of our three segments.
|
Gross Profit by Segment
|
% Point Change
|
|||||||||||||||||||
|
Three-Month Period Ended
|
Three-Month Period Ended
|
of Gross
|
||||||||||||||||||
|
March 31, 2013
|
March 31, 2012
|
Profit Margin
|
||||||||||||||||||
|
Segment
|
Gross Profit Margin
|
Gross Profit Margin
|
||||||||||||||||||
|
Bromine
|
$
|
1,404,525
|
12
|
%
|
$
|
3,609,386
|
27
|
%
|
(15
|
%)
|
||||||||||
|
Crude Salt
|
$
|
754,107
|
31
|
%
|
$
|
736,183
|
32
|
%
|
(1
|
%)
|
||||||||||
|
Chemical Products
|
$
|
2,358,476
|
28
|
%
|
$
|
2,347,223
|
29
|
%
|
(1
|
%)
|
||||||||||
|
Total Gross Profit
|
$
|
4,517,108
|
20
|
%
|
$
|
6,692,792
|
28
|
%
|
(8
|
%)
|
||||||||||
Bromine segment
For the three-month period ended March 31, 2013, the gross profit margin for our bromine segment was 12%, as compared to 27% for the same period in 2012. As mentioned in the net revenue discussion above, due to the PRC government’s macro-economic tightening policy to slow down the economy, our selling price in the three-month ended March 31, 2013 was adversely affected. We cut the average selling price of bromine from $3,569 per tonne for the three-month period ended March 31, 2012 to $3,053 per tonne for the same period in 2013, a decrease of 14%, in order to compete with other bromine manufacturers. Also, as mentioned in our 2012 annual report on Form 10-K, we completed certain enhancements of our facilities in the second quarter of 2012 to pump brine water from deeper underground in order to improve the quality of brine water being extracted from our wells, which in turn increased the depreciation and amortization of the plant and equipment and hence the cost of net revenue of bromine. We expect that the average selling price and gross profit margin of bromine will remain at current level towards the end of 2013 should the PRC government’s macro-economic tightening policy remain in place.
Crude salt segment
For the three-month period ended March 31, 2013 the gross profit margin for our crude salt segment was 31% compared to 32% for the same period in 2012. This 1% decrease in our gross profit margin is mainly attributable to the increase in depreciation and amortization of manufacturing facilities as a result of the enhancement projects in the second quarter of 2012 to our extraction wells and transmission channels and ducts as mentioned in our 2012 Form 10-K.
Chemical products segment
The gross profit margin for our chemical products segment for the three-month period ended March 31, 2013 was 28%, as compared to 29% for the same period in 2012. This 1% decrease in our gross profit margin was a result of the decrease in demand for our pesticides manufacturing additives which in turn reduced the sales volume of these chemical products.
Research and Development Costs The total research and development costs incurred for the three-month periods ended March 31, 2013 and 2012 were $17,702 and $42,798, respectively, a decrease of 59%. Research and development costs for the three-month period ended March 31, 2013and 2012 represented raw materials used by SYCI for testing the manufacturing routine.
General and Administrative Expenses General and administrative expenses were $1,969,217 for the three-month period ended March 31, 2013, a decrease of $142,988 (or 7%) as compared to $2,112,205 for the same period in 2012. The decrease of $142,988 was primarily due to the decrease in legal cost in connection with the Class Action case from $411,289 for the three-month period ended March 31, 2012 to $93,200 for the same period in 2013 since workload was reduced in settlement stage discussion, partially offset by an increase in the depreciation of the newly acquired office units in a commercial building in September 2012.
Other Operating Income Other operating income, which represented the sales of wastewater to some of our customers, was $95,562 for the three-month period ended March 31, 2013, representing an increase of $38,488(or 67%) from $57,074 for the same period in 2012. Wastewater is generated from the production of bromine and eventually becomes crude salt when it evaporates. Not all of our bromine production plants have sufficient area on the property to allow for evaporation of wastewater to produce crude salt. Certain of our customers who have facilities located adjacent to our bromine production plants have agreed to channel our wastewater into brine pans on their properties for evaporation. These customers then are able to sell the resulting crude salt themselves. We have signed agreements with three of our customers to sell them our wastewater at market prices.
Income from Operations Income from operations was $2,605,448 for the three-month period ended March 31, 2013 (or 12% of net revenue), a decrease of $1,971,651, or approximately 43%, over income from operations for the same period in 2012. The decrease resulted primarily from the decrease of selling price of our bromine segment and the increase in depreciation and amortization of the plant and machinery due to the enhancement projects from in the second quarter of 2012 to our extraction wells and transmission channels and ducts, which accelerated the depreciation and amortization of the plant and machinery.
|
Income from Operations by Segment
|
||||||||||||
|
Three-Month Period Ended
March 31, 2013
|
Three-Month Period Ended
March 31, 2012
|
|||||||||||
|
Segment:
|
% of total
|
% of total
|
||||||||||
|
Bromine
|
$
|
327,813
|
11%
|
$
|
2,468,304
|
47%
|
||||||
|
Crude Salt
|
538,220
|
18%
|
548,450
|
10%
|
||||||||
|
Chemical Products
|
2,096,679
|
71%
|
2,242,895
|
43%
|
||||||||
|
Income from operations before corporate costs
|
2,962,712
|
100%
|
5,259,649
|
100%
|
||||||||
|
Corporate costs
|
(357,264
|
)
|
(682,550
|
)
|
||||||||
|
Income from operations
|
$
|
2,605,448
|
$
|
4,577,099
|
||||||||
Bromine segment
Income from operations from our bromine segment was $327,813 for the three-month period ended March 31, 2013, a decrease of $2,140,491 (or approximately 87%) compared to the same period in 2012. This decrease was mainly due to (i) the decrease in average selling price (contributed a decrease of approximately $1.96 million); and (ii) the decrease in the gross profit margin due to the increase in the depreciation of manufacturing facilities resulting from the enhancement projects.
Crude salt segment
Income from operations from our crude salt segment was $538,220 for the three-month period ended March 31, 2013, a decrease of $10,230 (or approximately 2%) compared to the same period in 2012. This decrease was mainly due to the decrease in the gross profit margin due to the increase in the depreciation of manufacturing facilities resulting from the enhancement projects.
Chemical products segment
Income from operations from our chemical products segment was $2,096,679 for the three-month period ended March 31, 2013, a decrease of $146,216 (or approximately 7%) compared to the same period in 2012. This decrease primarily due to the increase of the depreciation from the newly acquired office units in September 2012.
Other Income, Net Other income, net of $19,837 represented bank interest income, net of capital lease interest expense for the three -month period ended March 31, 2013, a decrease of $24,641 (or approximately 55%) as compared to the same period in 2012, mainly due to lower average bank balance held in the period ended March 31, 2013 compared to period ended March 31,2012.
Net Income Net income was $1,882,965 for the three-month period ended March 31, 2013, a decrease of $1,404,142 (or approximately 43%) compared to the same period in 2012. This decrease was primarily attributable to the decrease of selling price for our bromine segment due to the macro-economic tightening policy imposed by the PRC government to slow down the economy.
Effective Tax Rate Our effective tax rate for the three-month periods ended March 31, 2013 and 2012 were 28% and 29% respectively. The effective tax rate for the three-month periods ended March 31, 2013 and 2012 was 3% and 4% higher than the PRC statutory income tax rate of 25%, due to the US federal net operating loss incurred by the Company during both periods in which a full valuation allowance was booked.
LIQUIDITY AND CAPITAL RESOURCES
As of March 31, 2013, cash and cash equivalents were $78,491,652 as compared to $65,241,035 as of December 31, 2012. The components of this increase of $13,250,617 are reflected below.
Statement of Cash Flows
|
Three-Month Period Ended March 31,
|
||||||||
|
2013
|
2012
|
|||||||
|
Net cash provided by operating activities
|
$
|
13,347,621
|
$
|
3,313,950
|
||||
|
Net cash used in investing activities
|
$
|
(290,017
|
)
|
$
|
(109,076
|
)
|
||
|
Net cash (used in)/provided by financing activities
|
$
|
-
|
$
|
-
|
||||
|
Effects of exchange rate changes on cash and cash equivalents
|
$
|
193,013
|
$
|
86,483
|
||||
|
Net increase in cash and cash equivalents
|
$
|
13,250,617
|
$
|
3,291,357
|
||||
For the three-month period ended March 31, 2013, we met our working capital and capital investment requirements mainly by using cash flow from operations and cash on hand. The Company intends to continue to explore opportunities relating to bromine asset purchases and new bromine resource development.
Net Cash Provided by Operating Activities
During the three-month periods ended March 31, 2013 and 2012, we had positive cash flow from operating activities of $13.3 million and $3.3 million, respectively.
During the three-month period ended March 31, 2013, cash flow from operating activities of $13.3 million exceeded our net income of $1.8 million, mainly due to (i) substantial non-cash charges of $7.0 million, mainly in the form of depreciation and amortization of property, plant and equipment; (ii) cash generated from working capital of $4.4 million, mainly consisting of account receivable and inventory.
.
During the three-month period ended March 31, 2012, cash flow from operating activities of $3.3 million approximated our net income of $3.3 million, mainly due to substantial non-cash charges of 5.9 million, mainly in the form of depreciation and amortization of property, plant and equipment, offset by cash used in working capital of $5.9 million, mainly consisting of account receivable, inventory and tax paid.
Accounts receivable
Cash collections on our accounts receivable had a major impact on our overall liquidity. The following table presents the aging analysis of our accounts receivable as of March 31, 2013 and December 31, 2012.
|
March 31, 2013
|
December 31, 2012
|
|||||||||||||||
|
% of total
|
% of total
|
|||||||||||||||
|
Aged 1-30 days
|
$
|
12,034,072
|
39
|
%
|
$
|
9,226,030
|
26
|
%
|
||||||||
|
Aged 31-60 days
|
$
|
5,912,235
|
19
|
%
|
$
|
8,668,189
|
24
|
%
|
||||||||
|
Aged 61-90 days
|
$
|
6,712,048
|
22
|
%
|
$
|
6,758,020
|
19
|
%
|
||||||||
|
Aged 91-120 days
|
$
|
6,154,937
|
20
|
%
|
$
|
6,535,738
|
18
|
%
|
||||||||
|
Aged 121-150 days
|
$
|
78,372
|
-
|
$
|
4,781,923
|
13
|
%
|
|||||||||
|
Total
|
$
|
30,891,664
|
100
|
%
|
$
|
35,969,900
|
100
|
%
|
||||||||
The overall accounts receivable balance as of March 31, 2013 decreased by $5,078,236 (or 14%), as compared to those of December 31, 2012. Such decrease was mainly due to the strengthened collection action on last year’s accounts receivable by our sales force. We are not aware of any allowances for doubtful debts required for the three-month period ended March 31, 2013 as we have policies in place to ensure that sales are made to customers with an appropriate credit history. All the balances of accounts receivable as of March 31, 2013 aged more than 90 days are subsequently settled in April 2013. We perform ongoing credit evaluation on the financial condition of our customers.
Inventory
Our inventory consists of the following:
|
March 31, 2013
|
December 31, 2012
|
|||||||||||||||
|
% of total
|
% of total
|
|||||||||||||||
|
Raw materials
|
$
|
729,048
|
13.5
|
%
|
$
|
773,453
|
12.9
|
%
|
||||||||
|
Finished goods
|
$
|
4,702,893
|
87
|
%
|
$
|
5,248,039
|
87.6
|
%
|
||||||||
|
$
|
5,431,941
|
100.5
|
%
|
$
|
6,021,492
|
100.5
|
%
|
|||||||||
|
Allowance for obsolete and slowing-moving inventory
|
$
|
(27,968
|
)
|
(0.5
|
%)
|
$
|
(27,894
|
)
|
(0.5
|
%)
|
||||||
|
Total
|
$
|
5,403,973
|
100.0
|
%
|
$
|
5,993,598
|
100.0
|
%
|
||||||||
The net inventory level as of March 31, 2012 decreased by $589,625 (or 10%), as compared to the net inventory level as of December 31, 2012.
Raw materials slightly decreased by 6% as of March 31, 2013 as compared to December 31, 2012. All of the raw materials are basic chemical industry materials, few of which have a possibility of loss over time, or major fluctuations in their prices. So, we concluded that all of our raw materials as of March 31, 2013 are fully realizable for production of finished goods without any impairment.
Our finished goods consist of bromine, crude salt and chemical products. Our chemical products are similar to raw materials, as there is no loss over time and a stable market price with a positive gross profit margin of 28% for the three-month period ended March 31, 2013 (29% for fiscal year 2012). Therefore, we believe that the realization of the chemical products is 100%. Similarly, as there is no depletion of bromine, we believe that the realization of it is also 100%. Although the gross profit margin for the three-month period ended March 31, 2013 decreased to 20%, as compared with 28% in fiscal year 2012, we anticipated that the price in the rest of 2013 will not fluctuate significantly to impair the cost of bromine.
The annual loss of crude salt due to evaporation is around 3%. As the market price of crude salt per ton increased from $38.02 in first quarter of 2012 to $39.52 in the first quarter of 2013, and the relative cost of production is low, we believe that there will be no realization problem for crude salt and its selling price should not be lower than its cost.
Net Cash Used in Investing Activities
For the three-month period ended March 31, 2013, we used approximately $0.3 million cash for the prepayment of land leases.
Net Cash Used in Financing Activities
We have no major financing activities for the three-month period ended March 31, 2013.
We believe that our available funds and cash flows generated from operations will be sufficient to meet our anticipated ongoing operating needs for the next twelve (12) months. However we will likely need to raise additional capital in order to fund the ongoing program of acquiring unlicensed bromine properties, increasing our chemical production capacity and developing new bromine and crude salt production line in Sichuan Province, PRC. We expect to raise those funds through credit facilities obtained with lending institutions. There can be no guarantee that we will be able to obtain such funding, whether through the issuance of debt or equity, on terms satisfactory to management and our board of directors.
Working capital was approximately $105.3 million at March 31, 2013 as compared to approximately $96.2 million at December 31, 2012. The increase was mainly attributable to the cash provided by operating activities during the three-month period ended March 31, 2013.
We had available cash of approximately $78.5 million at March 31, 2013, most of which is in highly liquid current deposits which earn no or little interest. We intend to retain the cash for future expansion of our bromine and crude salt businesses through acquisition, enhancement works to our existing bromine and crude salt business, and exploration cost of new brine water resources in Sichuan Province, and we do not anticipate paying cash dividends in the foreseeable future.
In the future we intend to focus our efforts on the activities of SCHC and SYCI as these segments continue to expand within the Chinese market. We also intend to explore the possibility of cooperation with overseas large-scale bromine manufacturers for expansion into overseas markets. As a result, we may issue additional shares of our capital stock and incur new debt in order to raise cash for acquisitions and other capital expenditures during the next twelve months.
We may not be able to identify, successfully integrate or profitably manage any businesses or business segment we may acquire, or any expansion of our business. An expansion may involve a number of risks, including possible adverse effects on our operating results, diversion of management attention, inability to retain key personnel, risks associated with unanticipated events and the financial statement effect of potential impairment of acquired intangible assets, any of which could have a materially adverse effect on our condition and results of operations. In addition, if competition for acquisition candidates or operations were to increase, the cost of acquiring businesses could increase materially. We may effect an acquisition with a target business which may be financially unstable, under-managed, or in its early stages of development or growth. In addition, if competition for acquisition candidates or operations were to increase, the cost of acquiring businesses could increase materially. Our inability to implement and manage our expansion strategy successfully may have a material adverse effect on our business and future prospects.
Contractual Obligations and Commitments
We have no significant contractual obligations not fully recorded on our consolidated balance sheets or fully disclosed in the notes to our consolidated financial statements. Additional information regarding our contractual obligations and commitments at March 31, 2013 is provided in the notes to our consolidated financial statements. See “Notes to Condensed Consolidated Financial Statements, Note 19 – Capital Commitment and Operating Lease Commitments”.
Material Off-Balance Sheet Arrangements
We do not currently have any off balance sheet arrangements falling within the definition of Item 303(a) of Regulation S-K.
Critical Accounting Policies and Estimates
Our consolidated financial statements have been prepared in accordance with accounting principles generally accepted in the United States of America and this requires management to make estimates and assumptions that affect the reported amounts of assets and liabilities at the date of the consolidated financial statements and the reported amounts of revenues and expenses during the reporting period. We base its estimates on historical experience and on various other assumptions that are believed to be reasonable under the circumstances. Accordingly, actual results may differ significantly from these estimates under different assumptions or conditions. We have identified the following critical accounting policies and estimates used by us in the preparation of our financial statements: accounts receivable and allowance for doubtful accounts, assets retirement obligation, property, plant and equipment, recoverability of long lived assets, mineral rights, revenue recognition, income taxes, and stock-based compensation. These policies and estimates are described in the Company’s 2012 Form 10-K.
Pursuant to Item 301(c) of Regulation S-K (§ 229.301(c)), the Company is not required to provide the information required by this Item as it is a “smaller reporting company,” as defined by Rule 229.10(f)(1).
Item 4. Controls and Procedures
(a) Evaluation of Disclosure Controls and Procedures
We maintain disclosure controls and procedures (as such term is defined in Exchange Act Rules 13a-15(e) and 15d-15(e)) that are designed to ensure that information required to be disclosed in our reports filed pursuant to the Exchange Act is recorded, processed, summarized and reported within the time periods specified in the SEC’s rules, regulations and related forms, and that such information is accumulated and communicated to our management, including our Chief Executive Officer (“CEO”) and Chief Financial Officer (“CFO”), as appropriate, to allow timely decisions regarding required disclosure.
Under the supervision and with the participation of our management, including our CEO and CFO, we conducted an evaluation of the effectiveness of the design and operation of our disclosure controls and procedures as of the end of the period covered by this report. Based on this evaluation, our CEO and CFO concluded that our disclosure controls and procedures were effective as of the end of the period covered by this Form 10-Q.
(b) Changes in internal controls
There were no changes in our internal control over financial reporting (as such term is defined in Rules 13a-15(f) under the Exchange Act) during our most recently completed fiscal quarter, which is the subject of this report, that have materially affected, or are reasonably likely to materially affect, our internal control over financial reporting.
PART II—OTHER INFORMATION
Item 1. Legal Proceedings
Class Action
The Company and certain of its officers and directors (Ming Yang, Xiaobin Liu, and Min Li, collectively, the “Individual Defendants”) have been named as defendants in a putative securities class action lawsuit alleging violations of the federal securities laws. That action, which is now captioned Lewy, et al. v. Gulf Resources, Inc., et al., No. 11-cv-3722 ODW (MRWx), was filed on April 29, 2011 in the United States District Court for the Central District of California. The lead plaintiffs, who seek to represent a class of all purchasers and acquirers of the Company’s common stock between March 16, 2009 and April 26, 2011 inclusive, filed an amended complaint on September 12, 2011. Lead plaintiffs assert claims for violations of Section 10(b) of the Securities Exchange Act of 1934, and Rule 10b-5 thereunder. The amended complaint alleges the defendants made false or misleading statements in the Company’s Annual Reports on Form 10-K for the years ended December 31, 2008, 2009, and 2010, and in interim quarterly reports by, among other things, overstating revenue and net income and failing to disclose material related party transactions and certain facts about the CEO’s prior employment at another company. The amended complaint also asserts claims against the Individual Defendants for violations of Section 20(a) of the Securities Exchange Act of 1934. The amended complaint seeks damages in an unspecified amount. The Company filed a motion to dismiss the amended complaint. On May 15, 2012, the Court denied the Company’s motion to dismiss the amended complaint. On April 30, 2013, the parties executed a stipulation and agreement of settlement. The proposed settlement is subject to review and approval of the Court. The Company currently cannot estimate the amount or range of the overall costs in connection with this litigation. The Company believes that such costs will be reimbursed by the insurance company to the extent covered by the insurance policies.
Item 1A. Risk Factors
There have been no changes with respect to risk factors as previously disclosed in our 2012 Form 10-K. Investing in our common stock involves a high degree of risk. Before you invest you should carefully consider the risks and uncertainties described below and in our 2012 Form 10-K, under the caption “Risk Factors”, our Management’s Discussion and Analysis of Financial Condition and Results of Operations set forth in Item 2 of Part I of this Quarterly Report on Form 10-Q, our consolidated financial statements and related notes included in Item 1 of Part I of this Quarterly Report on Form 10-Q and our consolidated financial statements and related notes, as well as our Management’s Discussion and Analysis of Financial Condition and Results of Operations and the other information in our 2012 Form 10-K. Readers should carefully review those risks, as well as additional risks described in other documents we file from time to time with the Securities and Exchange Commission.
Item 2. Unregistered Shares of Equity Securities and Use of Proceeds
None.
Item 3. Defaults Upon Senior Securities
None.
Item 4. Mine Safety Disclosures
No applicable.
Item 5. Other Information
None.
|
Exhibit No.
|
Description
|
|
31.1
|
Certification of Chief Executive Officer pursuant to Rule 13a-14(a) and 15d-14(a), as adopted pursuant to Section 302 of the Sarbanes-Oxley Act of 2002.
|
|
31.2
|
Certification of Chief Financial Officer pursuant to Rule 13a-14(a) and 15d-14(a), as adopted pursuant to Section 302 of the Sarbanes-Oxley Act of 2002.
|
|
32.1
|
Certification pursuant to 18 U.S.C. Section 1350, as adopted pursuant to Section 906 of the Sarbanes-Oxley Act of 2002.
|
|
101.1
|
The following financial statements from Gulf Resources, Inc.’s Quarterly Report on Form 10-Q for the quarterly period ended March 31, 2013 formatted in XBRL (eXtensible Business Reporting Language): (i) the Consolidated Balance Sheets; (ii) the Consolidated Statements of Operations and Other Comprehensive Income (Loss); (iii) the Consolidated Statements of Changes in Equity; (iv) the Consolidated Statement of Cash Flows; and, (v) the Notes to Consolidated Financial Statements, tagged as blocks of text.
|
Pursuant to the requirements of Section 13 or 15(d) of the Securities Exchange Act of 1934, the registrant has duly caused this report to be signed on its behalf by the undersigned, thereunto duly authorized.
|
GULF RESOURCES, INC.
|
||
|
Dated: May 9, 2013
|
By:
|
/s/ Xiaobin Liu
|
|
Xiaobin Liu
|
||
|
Chief Executive Officer
|
||
|
(principal executive officer)
|
||
|
Dated: May 9, 2013
|
By:
|
/s/ Min Li
|
|
Min Li
|
||
|
Chief Financial Officer
|
||
|
(principal financial and accounting officer)
|
||
33