Attached files
| file | filename |
|---|---|
| EX-31.1 - GULF RESOURCES, INC. | e614252_ex31-1.htm |
| EX-32.1 - GULF RESOURCES, INC. | e614252_ex32-1.htm |
| EX-32.2 - GULF RESOURCES, INC. | e614252_ex31-2.htm |
UNITED STATES
SECURITIES AND EXCHANGE COMMISSION
Washington, D.C. 20549
FORM 10-Q
|
x
|
QUARTERLY REPORT PURSUANT TO SECTION 13 OR 15(d) OF THE SECURITIES EXCHANGE ACT OF 1934
|
|
For the quarterly period ended September 30, 2015
|
|
|
Or
|
|
|
o
|
TRANSITION REPORT PURSUANT TO SECTION 13 OR 15(d) OF THE SECURITIES EXCHANGE ACT OF 1934
|
|
For the transition period from _________ to _________
|
Commission File Number: 001-34499
GULF RESOURCES, INC.
(Exact name of registrant as specified in its charter)
|
Delaware
|
13-3637458
|
|
|
(State or other jurisdiction of incorporation or organization)
|
(I.R.S. Employer Identification No.)
|
|
|
Level 11,Vegetable Building, Industrial Park of the East
Shouguang City, Shandong,
|
262700
|
|
|
(Address of principal executive offices)
|
(Zip Code)
|
Registrant’s telephone number, including area code: +86 (536) 567 0008
Indicate by check mark whether the registrant (1) has filed all reports required to be filed by Section 13 or 15(d) of the Securities Exchange Act of 1934 during the preceding 12 months (or for such shorter period that the registrant was required to file such reports), and (2) has been subject to such filing requirements for the past 90 days.
Yes x No o
Indicate by check mark whether the registrant has submitted electronically and posted on its corporate Web site, if any, every, Interactive Data File required to be submitted and posted pursuant to Rule 405 of Regulation S-T (§232.405 of this chapter) during the preceding 12 months (or for such shorter period that the registrant was required to submit and post such files).
Yes x No o
Indicate by check mark whether the registrant is a large accelerated filer, an accelerated filer, a non-accelerated filer, or a smaller reporting company. See the definitions of “large accelerated filer,” “accelerated filer” and “smaller reporting company” in Rule 12b-2 of the Exchange Act.
|
Large accelerated filer o
|
Accelerated filer o
|
|
Non-accelerated filer (Do not check if a smaller reporting company) o
|
Smaller reporting company x
|
Indicate by check mark whether the registrant is a shell company (as defined in Rule 12b-2 of the Exchange Act).
Yes o No x
As of November 4, 2015, the registrant had outstanding 46,007,120 shares of common stock.
|
Part I – Financial Information
|
|
|
1
|
|
|
20
|
|
|
40
|
|
|
40
|
|
|
Part II – Other Information
|
|
|
40
|
|
|
41
|
|
|
41
|
|
|
41
|
|
|
41
|
|
|
41
|
|
|
41
|
|
|
42
|
Item 1. Financial Statements
|
GULF RESOURCES, INC.
|
|
AND SUBSIDIARIES
|
|
CONDENSED CONSOLIDATED BALANCE SHEETS
|
|
(Expressed in U.S. dollars)
|
|
September 30, 2015
Unaudited
|
December 31, 2014
Audited
|
|||||||
|
Current Assets
|
||||||||
|
Cash
|
$
|
120,892,138
|
$
|
146,585,601
|
||||
|
Accounts receivable
|
74,279,887
|
41,997,862
|
||||||
|
Inventories
|
7,370,051
|
5,367,868
|
||||||
|
Prepayments and deposits
|
11,698
|
86,301
|
||||||
|
Prepaid land leases
|
311,895
|
51,024
|
||||||
|
Other receivable
|
559
|
38,272
|
||||||
|
Deferred tax assets
|
831
|
864
|
||||||
|
Total Current Assets
|
202,867,059
|
194,127,792
|
||||||
|
Non-Current Assets
|
||||||||
|
Property, plant and equipment, net
|
125,441,613
|
124,350,781
|
||||||
|
Property, plant and equipment under capital leases, net
|
1,031,997
|
1,339,602
|
||||||
|
Prepaid land leases, net of current portion
|
5,309,456
|
733,560
|
||||||
|
Deferred tax assets
|
2,416,369
|
2,430,417
|
||||||
|
Goodwill
|
30,173,391
|
-
|
||||||
|
Total non-current assets
|
164,372,826
|
128,854,360
|
||||||
|
Total Assets
|
$
|
367,239,885
|
$
|
322,982,152
|
||||
|
Liabilities and Stockholders’ Equity
|
||||||||
|
Current Liabilities
|
||||||||
|
Accounts payable and accrued expenses
|
$
|
19,763,798
|
$
|
4,004,728
|
||||
|
Retention payable
|
563,759
|
326,959
|
||||||
|
Capital lease obligation, current portion
|
155,296
|
205,128
|
||||||
|
Taxes payable
|
5,815,909
|
3,545,429
|
||||||
|
Total Current Liabilities
|
26,298,762
|
8,082,244
|
||||||
|
Non-Current Liabilities
|
||||||||
|
Capital lease obligation, net of current portion
|
2,609,023
|
2,826,495
|
||||||
|
Total Liabilities
|
$
|
28,907,785
|
$
|
10,908,739
|
||||
|
|
||||||||
|
Stockholders’ Equity
|
||||||||
|
PREFERRED STOCK; $0.001 par value; 1,000,000 shares authorized;
none outstanding
|
$
|
-
|
$
|
-
|
||||
|
COMMON STOCK; $0.0005 par value; 80,000,000 shares authorized;
46,276,269 and 38,911,014 shares issued; and 46,007,120 and
38,672,865 shares outstanding as of September 30, 2015 and
December 31, 2014, respectively
|
23,139
|
19,456
|
||||||
|
Treasury stock; 269,149 and 238,149 shares as of September 30, 2015 and
December 31, 2014 at cost
|
(599,441
|
)
|
(561,728
|
)
|
||||
|
Additional paid-in capital
|
94,102,765
|
80,380,008
|
||||||
|
Retained earnings unappropriated
|
208,580,627
|
183,480,402
|
||||||
|
Retained earnings appropriated
|
19,748,120
|
18,078,392
|
||||||
|
Accumulated other comprehensive income
|
16,476,890
|
30,676,883
|
||||||
|
Total Stockholders’ Equity
|
338,332,100
|
312,073,413
|
||||||
|
Total Liabilities and Stockholders’ Equity
|
$
|
367,239,885
|
$
|
322,982,152
|
||||
See accompanying notes to the condensed consolidated financial statements.
GULF RESOURCES, INC.
AND SUBSIDIARIES
CONDENSED CONSOLIDATED STATEMENTS OF INCOME AND COMPREHENSIVE INCOME
(Expressed in U.S. dollars)
(UNAUDITED)
|
Three-Month Period Ended
September 30,
|
Nine-Month Period Ended
September 30,
|
|||||||||||||||
|
2015
|
2014
|
2015
|
2014
|
|||||||||||||
|
NET REVENUE
|
||||||||||||||||
|
Net revenue
|
$
|
42,601,598
|
$
|
31,106,964
|
$
|
126,862,497
|
$
|
88,451,954
|
||||||||
|
OPERATING INCOME (EXPENSES)
|
||||||||||||||||
|
Cost of net revenue
|
(27,000,576
|
)
|
(21,901,056
|
)
|
(84,761,554
|
)
|
(63,202,383
|
)
|
||||||||
|
Sales, marketing and other operating expenses
|
(91,919
|
)
|
(29,064
|
)
|
(294,095
|
)
|
(78,793
|
)
|
||||||||
|
Research and development cost
|
(69,403
|
)
|
(30,985
|
)
|
(181,108
|
)
|
(94,323
|
)
|
||||||||
|
Exploration cost
|
-
|
-
|
(325,840
|
)
|
-
|
|||||||||||
|
Write-off/Impairment on property, plant and equipment
|
(819,701
|
)
|
(673,705
|
)
|
(819,701
|
)
|
(673,705
|
)
|
||||||||
|
Loss from disposal of property , plant and equipment
|
-
|
-
|
-
|
(9,866
|
)
|
|||||||||||
|
General and administrative expenses
|
(831,955
|
)
|
(1,894,507
|
)
|
(5,247,318
|
)
|
(4,916,626
|
)
|
||||||||
|
Other operating income
|
115,114
|
116,942
|
342,317
|
351,547
|
||||||||||||
|
(28,698,440
|
)
|
(24,412,375
|
)
|
(91,287,299
|
)
|
(68,624,149
|
)
|
|||||||||
|
INCOME FROM OPERATIONS
|
13,903,158
|
6,694,589
|
35,575,198
|
19,827,805
|
||||||||||||
|
OTHER INCOME (EXPENSE)
|
||||||||||||||||
|
Interest expense
|
(46,675
|
)
|
(48,950
|
)
|
(148,541
|
)
|
(154,090
|
)
|
||||||||
|
Interest income
|
113,311
|
125,625
|
348,454
|
351,271
|
||||||||||||
|
INCOME BEFORE TAXES
|
13,969,794
|
6,771,264
|
35,775,111
|
20,024,986
|
||||||||||||
|
INCOME TAXES
|
(3,290,372
|
)
|
(1,732,861
|
)
|
(9,005,158
|
)
|
(5,035,433
|
)
|
||||||||
|
NET INCOME
|
$
|
10,679,422
|
$
|
5,038,403
|
$
|
26,769,953
|
$
|
14,989,553
|
||||||||
|
COMPREHENSIVE INCOME:
|
||||||||||||||||
|
NET INCOME
|
$
|
10,679,422
|
$
|
5,038,403
|
$
|
26,769,953
|
$
|
14,989,553
|
||||||||
|
OTHER COMPREHENSIVE INCOME (LOSS)
|
||||||||||||||||
|
- Foreign currency translation adjustments
|
(14,565,025
|
)
|
24,054
|
(14,199,993
|
)
|
(2,915,066
|
)
|
|||||||||
|
COMPREHENSIVE INCOME/(LOSS)
|
$
|
(3,885,603
|
)
|
$
|
5,062,457
|
$
|
12,569,960
|
$
|
12,074,487
|
|||||||
|
EARNINGS PER SHARE:
|
||||||||||||||||
|
BASIC
|
$
|
0.23
|
$
|
0.13
|
$
|
0.60
|
$
|
0.39
|
||||||||
|
DILUTED
|
$
|
0.23
|
$
|
0.13
|
$
|
0.58
|
$
|
0.38
|
||||||||
|
WEIGHTED AVERAGE NUMBER OF SHARES:
|
||||||||||||||||
|
BASIC
|
46,007,120
|
38,726,415
|
44,884,268
|
38,684,220
|
||||||||||||
|
DILUTED
|
46,905,362
|
39,297,334
|
45,854,130
|
39,305,975
|
||||||||||||
See accompanying notes to the condensed consolidated financial statements.
|
GULF RESOURCES, INC.
|
|
AND SUBSIDIARIES
|
|
CONDENSED CONSOLIDATED STATEMENT OF STOCKHOLDERS’ EQUITY
|
|
NINE-MONTH PERIOD ENDED SEPTEMBER 30, 2015
|
|
(Expressed in U.S. dollars)
|
|
Common stock
|
Accumulated
|
|||||||||||||||||||||||||||||||||||||||
|
Number
|
Number
|
Number
|
Additional
|
Retained
|
Retained
|
other
|
||||||||||||||||||||||||||||||||||
|
of shares
|
of shares
|
of treasury
|
Treasury
|
paid-in
|
earnings
|
earnings
|
comprehensive
|
|||||||||||||||||||||||||||||||||
|
issued
|
outstanding
|
stock
|
Amount
|
stock
|
capital
|
unappropriated
|
appropriated
|
income
|
Total
|
|||||||||||||||||||||||||||||||
|
BALANCE AT
DECEMBER
31, 2014
Audited
|
38,911,014 | 38,672,865 | 238,149 | $ | 19,456 | $ | (561,728 | ) | $ | 80,380,008 | $ | 183,480,402 | $ | 18,078,392 | $ | 30,676,883 | $ | 312,073,413 | ||||||||||||||||||||||
|
Translation
adjustment
|
-
|
- | - |
-
|
-
|
-
|
-
|
(14,199,993 | ) | (14,199,993 | ) | |||||||||||||||||||||||||||||
|
Common stock
repurchased
|
- | (31,000 | 31,000 | - | (37,713 | ) | - | - | - | - | (37,713 | ) | ||||||||||||||||||||||||||||
|
Cashless
exercise of
stock options
|
97,244 | 97,244 | - | 49 | - | (49 | ) | - | - | - | - | |||||||||||||||||||||||||||||
|
Issuance of
stock options to
employees and
directors
|
- | - | - | - | - | 353,300 | - | - | - | 353,300 | ||||||||||||||||||||||||||||||
|
Common stock
issued for
business
acquisition
|
7,268,011 | 7,268,011 | - | 3,634 | - | 13,369,506 | - | - | - | 13,373,140 | ||||||||||||||||||||||||||||||
|
Net income for
nine-month
period ended
September 30,
2015
|
-
|
- | - |
-
|
- |
-
|
26,769,953
|
- |
-
|
26,769,953 | ||||||||||||||||||||||||||||||
|
Transfer to
statutory
common reserve
fund
|
- | - | - | - | - | - | (1,669,728 | ) | 1,669,728 | - | - | |||||||||||||||||||||||||||||
|
BALANCE AT
SEPTEMBER
30, 2015
Unaudited
|
46,276,269 | 46,007,120 | 269,149 | $ | 23,139 | $ | (599,441 | ) | $ | 94,102,765 | $ | 208,580,627 | $ | 19,748,120 | $ | 16,476,890 | $ | 338,332,100 | ||||||||||||||||||||||
See accompanying notes to the condensed consolidated financial statements.
|
GULF RESOURCES, INC.
|
|
AND SUBSIDIARIES
|
|
CONDENED CONSOLIDATED STATEMENTS OF CASH FLOWS
|
|
(Expressed in U.S. dollars)
|
|
(UNAUDITED)
|
|
Nine-Month Period Ended September 30,
|
||||||||
|
2015
|
2014
|
|||||||
|
|
|
|||||||
|
CASH FLOWS FROM OPERATING ACTIVITIES
|
|
|
||||||
|
Net income
|
$
|
26,769,953
|
$
|
14,989,553
|
||||
|
Adjustments to reconcile net income to net cash provided by operating activities:
|
||||||||
|
Interest on capital lease obligation
|
147,808
|
153,630
|
||||||
|
Amortization of prepaid land leases
|
510,506
|
435,642
|
||||||
|
Depreciation and amortization
|
21,954,512
|
20,602,061
|
||||||
|
Write-off/Impairment loss on property, plant and equipment
|
819,701
|
673,705
|
||||||
|
Loss from disposal of property, plant and equipment
|
-
|
9,866
|
||||||
|
Currency translation adjustment on inter-company balances
|
(1,037,429
|
)
|
(237,028
|
)
|
||||
|
Stock-based compensation expense
|
353,300
|
30,000
|
||||||
|
Deferred tax asset
|
(81,460
|
)
|
-
|
|||||
|
Changes in assets and liabilities:
|
||||||||
|
Accounts receivable
|
(15,762,057
|
)
|
(3,830,608
|
)
|
||||
|
Inventories
|
(623,454
|
)
|
(22,314
|
)
|
||||
|
Prepayments and deposits
|
80,711
|
(249,255
|
)
|
|||||
|
Other receivable
|
37,713
|
-
|
||||||
|
Accounts payable and accrued expenses
|
(56,477
|
)
|
747,789
|
|||||
|
Retention payable
|
248,266
|
113,935
|
||||||
|
Taxes payable
|
1,554,226
|
(940,835
|
)
|
|||||
|
Net cash provided by operating activities
|
34,915,819
|
32,476,141
|
||||||
|
CASH FLOWS USED IN INVESTING ACTIVITIES
|
||||||||
|
Additions of prepaid land leases
|
(683,129
|
)
|
(664,106
|
)
|
||||
|
Proceeds from sales of property, plant and equipment
|
-
|
21,514
|
||||||
|
Purchase of property, plant and equipment
|
(2,792,700
|
)
|
(6,459,250
|
)
|
||||
|
Consideration paid for business acquisition
|
(66,305,606
|
)
|
-
|
|||||
|
Cash acquired from acquisition
|
14,074,720
|
-
|
||||||
|
Net cash used in investing activities
|
(55,706,715
|
)
|
(7,101,842
|
)
|
||||
|
CASH FLOWS USED IN FINANCING ACTIVITIES
|
||||||||
|
Repayment of capital lease obligation
|
(306,683
|
)
|
(304,806
|
)
|
||||
|
Repurchase of common stock
|
(37,713
|
)
|
-
|
|||||
|
Net cash used in financing activities
|
(344,396
|
)
|
(304,806
|
)
|
||||
|
EFFECTS OF EXCHANGE RATE CHANGES ON CASH AND CASH EQUIVALENTS
|
(4,558,171
|
)
|
(1,031,745
|
)
|
||||
|
NET INCREASE/(DECREASE) IN CASH AND CASH EQUIVALENTS
|
(25,693,463
|
)
|
24,037,748
|
|||||
|
CASH AND CASH EQUIVALENTS - BEGINNING OF PERIOD
|
146,585,601
|
107,828,800
|
||||||
|
CASH AND CASH EQUIVALENTS - END OF PERIOD
|
$
|
120,892,138
|
$
|
131,866,548
|
||||
|
SUPPLEMENTAL DISCLOSURE OF CASH FLOW INFORMATION
|
||||||||
|
Cash paid during the period for:
|
||||||||
|
Income taxes
|
$
|
7,527,690
|
$
|
5,865,449
|
||||
|
SUPPLEMENTAL DISCLOSURE OF NON-CASH FLOW INVESTING
AND FINANCING ACTIVITIES
|
||||||||
|
Issuance of common stock upon cashless exercise of options
|
$
|
49
|
$
|
73
|
||||
|
Issuance of common stock for acquisition of business
|
$
|
13,373,140
|
-
|
|||||
See accompanying notes to the condensed consolidated financial statements.
GULF RESOURCES, INC.
AND SUBSIDIARIES
NOTES TO CONDENSED CONSOLIDATED FINANCIAL STATEMENTS
SEPTEMBER 30, 2015
(Expressed in U.S. dollars)
(UNAUDITED)
NOTE 1 – BASIS OF PRESENTATION AND SUMMARY OF SIGNIFICANT ACCOUNTING POLICIES
(a) Basis of Presentation and Consolidation
The accompanying condensed financial statements have been prepared by Gulf Resources, Inc., a Delaware corporation and its subsidiaries (collectively, the “Company”), without audit, in accordance with the instructions to Form 10-Q and, therefore, do not necessarily include all information and footnotes necessary for a fair statement of its financial position, results of operations and cash flows in accordance with accounting principles generally accepted in the United States (“US GAAP”).
In the opinion of management, the unaudited financial information for the three and nine months ended September 30, 2015 presented reflects all adjustments, which are only normal and recurring, necessary for a fair statement of results of operations, financial position and cash flows. These condensed financial statements should be read in conjunction with the financial statements included in the Company’s 2014 Form 10-K. Operating results for the interim periods are not necessarily indicative of operating results for an entire fiscal year.
The preparation of financial statements in conformity with US GAAP requires management to make estimates and assumptions that affect the amounts that are reported in the financial statements and accompanying disclosures. Although these estimates are based on management’s best knowledge of current events and actions that the Company may undertake in the future, actual results may be different from the estimates. The Company also exercises judgments in the preparation of these condensed financial statements in the areas including classification of leases and related party transactions.
The consolidated financial statements include the accounts of Gulf Resources, Inc. and its wholly-owned subsidiary, Upper Class Group Limited, a company incorporated in the British Virgin Islands, which owns 100% of Hong Kong Jiaxing Industrial Limited, a company incorporated in Hong Kong (“HKJI”). HKJI owns 100% of Shouguang City Haoyuan Chemical Company Limited ("SCHC") which owns 100% of ShouguangYuxin Chemical Industry Co., Limited (“SYCI”) and Shouguang City Rongyuan Chemical Co, Ltd (“SCRC”). All material intercompany transactions have been eliminated on consolidation.
(b) Nature of the Business
The Company manufactures and trades bromine and crude salt through its wholly-owned subsidiary, Shouguang City Haoyuan Chemical Company Limited ("SCHC"), manufactures chemical products for use in the oil industry, pesticides and paper manufacturing industry through its wholly-owned subsidiary, ShouguangYuxin Chemical Industry Co., Limited ("SYCI"), andmanufactures chemical products used for human and animal antibiotics through its wholly-owned subsidiary, Shouguang City Rongyuan Chemical Co, Ltd (“SCRC”) in the People’s Republic of China (“PRC”).
(c) Allowance for Doubtful Accounts
As of September 30, 2015 and December 31, 2014, allowances for doubtful accounts were nil. No allowances for doubtful accounts were charged to the income statement for the three-month and nine-month periods ended September 30, 2015 and 2014.
(d) Concentration of Credit Risk
The Company is exposed to credit risk in the normal course of business, primarily related to accounts receivable and cash and cash equivalents. Substantially all of the Company’s cash and cash equivalents are maintained with financial institutions in the PRC, namely, Industrial and Commercial Bank of China Limited and China Merchants Bank Company Limited, which are not insured or otherwise protected. The Company placed $120,892,138 and $146,585,601 with these institutions as of September 30, 2015 and December 31, 2014, respectively. The Company has not experienced any losses in such accounts in the PRC.
Concentrations of credit risk with respect to accounts receivable exists as the Company sells a substantial portion of its products to a limited number of customers. However, such concentrations of credit risks are limited since the Company performs ongoing credit evaluations of its customers’ financial condition and due to the generally short payment terms. Approximately 63.7% and 66.5% of the balances of accounts receivable as of September 30, 2015 and December 31, 2014, respectively, were outstanding for less than or equal to 90 days. For the balances of accounts receivable aged more than 90 days as of September 30, 2015, approximately 69% was settled in October 2015.
GULF RESOURCES, INC.
AND SUBSIDIARIES
NOTES TO CONDENSED CONSOLIDATED FINANCIAL STATEMENTS
SEPTEMBER 30, 2015
(Expressed in U.S. dollars)
(UNAUDITED)
NOTE 1 – BASIS OF PRESENTATION AND SUMMARY OF SIGNIFICANT ACCOUNTING POLICIES – Continued
(e) Property, Plant and Equipment
Property, plant and equipment are stated at cost less accumulated depreciation and any impairment losses. Expenditures for new facilities or equipment, and major expenditures for betterment of existing facilities or equipment are capitalized and depreciated using the straight-line method at rates sufficient to depreciate such costs over the estimated productive lives. All other ordinary repair and maintenance costs are expensed as incurred.
Mineral rights are recorded at cost less accumulated depreciation and any impairment losses. Mineral rights are amortized ratably over the term of the lease, or the equivalent term under the units of production method, whichever is shorter.
Construction in progress primarily represents direct costs of construction of plant, machinery and equipment. Costs incurred are capitalized and transferred to property and equipment upon completion, at which time depreciation commences.
The Company’s depreciation and amortization policies on property, plant and equipment, other than mineral rights and construction in progress, are as follows:
|
Useful life
(in years)
|
||
|
Buildings (including salt pans)
|
8 - 20
|
|
|
Plant and machinery (including protective shells, transmission channels and ducts)
|
3 - 8
|
|
|
Motor vehicles
|
5
|
|
|
Furniture, fixtures and equipment
|
8
|
Property, plant and equipment under capital leases are depreciated over their expected useful lives on the same basis as owned assets, or where shorter, the term of the lease, which is 20 years.
(f) Retirement Benefits
Pursuant to the relevant laws and regulations in the PRC, the Company participates in a defined contribution retirement plan for its employees arranged by a governmental organization. The Company makes contributions to the retirement scheme at the applicable rate based on the employees’ salaries. The required contributions under the retirement plans are charged to the consolidated income statement on an accrual basis when they are due. The Company’s contributions totaled $258,977 and $193,764 for the three-month period ended September 30, 2015 and 2014, respectively, and totaled $727,526 and $512,794 for the nine-month period ended September 30, 2015 and 2014, respectively.
(g) Revenue Recognition
The Company recognizes revenue, net of value-added tax, when persuasive evidence of an arrangement exists, delivery of the goods has occurred, customer acceptance has been obtained, which means the significant risks and ownership have been transferred to the customer, the price is fixed or determinable and collectability is reasonably assured.
GULF RESOURCES, INC.
AND SUBSIDIARIES
NOTES TO CONDENSED CONSOLIDATED FINANCIAL STATEMENTS
SEPTEMBER 30, 2015
(Expressed in U.S. dollars)
(UNAUDITED)
NOTE 1 – BASIS OF PRESENTATION AND SUMMARY OF SIGNIFICANT ACCOUNTING POLICIES – Continued
(h) Recoverability of Long-lived Assets
In accordance with Financial Accounting Standards Board (“FASB”) Accounting Standards Codification (“ASC”) 360-10-35 “Impairment or Disposal of Long-lived Assets”, long-lived assets to be held and used are analyzed for impairment whenever events or changes in circumstances indicate that the carrying amount of an asset may not be fully recoverable or that the useful lives of those assets are no longer appropriate. The Company evaluates at each balance sheet date whether events and circumstances have occurred that indicate possible impairment.
The Company determines the existence of such impairment by measuring the expected future cash flows (undiscounted and without interest charges) and comparing such amount to the carrying amount of the assets. An impairment loss, if one exists, is then measured as the amount by which the carrying amount of the asset exceeds the discounted estimated future cash flows. Assets to be disposed of are reported at the lower of the carrying amount or fair value of such assets less costs to sell. Asset impairment charges are recorded to reduce the carrying amount of the long-lived asset that will be sold or disposed of to their estimated fair values. Charges for the asset impairment reduce the carrying amount of the long-lived assets to their estimated salvage value in connection with the decision to dispose of such assets.
For the three-month and nine-month periods ended September 30, 2014, certain property, plant and machinery, with net book values of $673,705 were replaced during the third phase enhancement project to protective shells for transmission channels, write-offs of the same amounts, were made and included in write-off/impairment on property, plant and equipment.
For the three-month and nine-month periods ended September 30, 2015, certain property, plant and machinery, with net book values of $819,701 were replaced during the fourth phase enhancement project to protective shells for transmission channels and the enhancement work to bromine production facilities in Factory No.11, write-offs of the same amounts, were made and included in write-off/impairment on property, plant and equipment.
(i) Basic and Diluted Net Income per Share of Common Stock
Basic earnings per common share are based on the weighted average number of shares outstanding during the periods presented. Diluted earnings per share are computed using weighted average number of common shares plus dilutive common share equivalents outstanding during the period. Potential common shares that would have the effect of increasing diluted earnings per share are considered to be anti-dilutive, i.e. the exercise prices of the outstanding stock options were greater than the market price of the common stock. Anti-dilutive common stock equivalents which were excluded from the calculation of number of dilutive common stock equivalents amounted to 332,973 and 2,229,731 shares for the three-month period ended September 30, 2015 and 2014, respectively, and amounted to 307,012 and 1,931,556 shares for the nine-month period ended September 30, 2015 and 2014, respectively. These awards could be dilutive in the future if the market price of the common stock increases and is greater than the exercise price of these awards.
GULF RESOURCES, INC.
AND SUBSIDIARIES
NOTES TO CONDENSED CONSOLIDATED FINANCIAL STATEMENTS
SEPTEMBER 30, 2015
(Expressed in U.S. dollars)
(UNAUDITED)
NOTE 1 – BASIS OF PRESENTATION AND SUMMARY OF SIGNIFICANT ACCOUNTING POLICIES – Continued
(i) Basic and Diluted Net Income per Share of Common Stock – Continued
The following table sets forth the computation of basic and diluted earnings per share:
|
|
Three-Month Period Ended
September 30,
|
Nine-Month Period Ended
September 30,
|
||||||||||||||
|
2015
|
2014
|
2015
|
2014
|
|||||||||||||
|
Numerator
|
||||||||||||||||
|
Net income
|
$
|
10,679,422
|
$
|
5,038,403
|
$
|
26,769,953
|
$
|
14,989,553
|
||||||||
|
Denominator
|
||||||||||||||||
|
Basic: Weighted-average common shares outstanding during the period
|
46,007,120
|
38,726,415
|
44,884,268
|
38,684,220
|
||||||||||||
|
Add: Dilutive effect of stock options
|
898,242
|
570,919
|
969,862
|
621,755
|
||||||||||||
|
Diluted
|
46,905,362
|
39,297,334
|
45,854,130
|
39,305,975
|
||||||||||||
|
Net income per share
|
||||||||||||||||
|
Basic
|
$
|
0.23
|
$
|
0.13
|
$
|
0.60
|
$
|
0.39
|
||||||||
|
Diluted
|
$
|
0.23
|
$
|
0.13
|
$
|
0.58
|
$
|
0.38
|
||||||||
(j) Reporting Currency and Translation
The financial statements of the Company’s foreign subsidiaries are measured using the local currency, Renminbi (“RMB”), as the functional currency; whereas the functional currency and reporting currency of the Company is the United States dollar (“USD” or “$”).
As such, the Company uses the “current rate method” to translate its PRC operations from RMB into USD, as required under FASB ASC 830 “Foreign Currency Matters”. The assets and liabilities of its PRC operations are translated into USD using the rate of exchange prevailing at the balance sheet date. The capital accounts are translated at the historical rate. Adjustments resulting from the translation of the balance sheets of the Company’s PRC subsidiaries are recorded in stockholders’ equity as part of accumulated comprehensive income. The statement of income and comprehensive income is translated at average rates during the reporting period. Gains or losses resulting from transactions in currencies other than the functional currencies are recognized in net income for the reporting periods as part of general and administrative expense. The statement of cash flows is translated at average rates during the reporting period, with the exception of issuance of shares and payment of dividends which are translated at historical rates.
(k) Foreign Operations
All of the Company’s operations and assets are located in PRC. The Company may be adversely affected by possible political or economic events in this country. The effect of these factors cannot be accurately predicted.
(l) Exploration Costs
Exploration costs, which included the cost of researching for appropriate places to drill wells and the cost of well drilling in search of potential natural brine or other resources, are charged to the income statement as incurred.
(m) Goodwill
Goodwill represents the excess of the purchase price over the net of the fair value of the identifiable tangible and intangible assets acquired and the fair value of liabilities assumed in business acquisitions. Management of the Company evaluates the carrying value of goodwill annually or when a possible impairment is indicated. The Company performs its impairment assessment annually and between annual tests in certain circumstances and determined that there was no impairment of goodwill. Goodwill impairment is assessed using the expected present value of associated future cash flows.
(n) New Accounting Pronouncements
No accounting standards and guidance with an effective date during the three-month and nine-month periods ended September 30, 2015 or issued during 2015 had or are expected to have a significant impact on the Company’s consolidated financial statements through 2017.
GULF RESOURCES, INC.
AND SUBSIDIARIES
NOTES TO CONDENSED CONSOLIDATED FINANCIAL STATEMENTS
SEPTEMBER 30, 2015
(Expressed in U.S. dollars)
(UNAUDITED)
NOTE 2 – BUSINESS ACQUISITION
In order to increase the Company’s profit margins, produce more consistent and reliable earnings and lessen dependence on the economically sensitive bromine industry, on January 12, 2015, Gulf Resources, Inc. (the “Company” or “Gulf”) and Shouguang City Haoyuan Chemical Company Limited, a wholly owned subsidiary of the Company (“SCHC”), entered into an Equity Interest Transfer Agreement (the “Agreement”) to acquire 100% of SCRC for a total consideration of $79,678,746 to be settled in cash and in the shares of the commons stock of the Company.
On February 4, 2015, the Company closed the transactions contemplated by the Agreement between the Company, SCHC and SCRC. The Closing Date is deemed to be the acquisition date.
On the Closing Date, the Company issued 7,268,011 shares of its common stock, par value $0.0005 per share (the “Shares”), at a the closing market price of $1.84 per Share on the Closing Date to the four former equity owners of SCRC. The sellers of SCRC agreed as part of the purchase price to accept 7,268,011 shares of Gulf Resources stock, based on a valuation of $2.00, which was a 73% premium to the price on the day the agreement was reached. For accounting purposes, these shares are being valued at $1.84, which was the closing price of the Company’s stock on the day of the closing of the agreement. There is no change in the number of shares issued. The total purchase consideration consisted of $66,305,606 in cash and $13,373,140 in the shares of the common stock of the Company.
The issuance of the Shares was exempt from registration pursuant to Regulation S of the Securities Act of 1933, as amended. On the Closing Date, the Company entered into a lock-up agreement with the four former equity owners of SCRC. In accordance with the terms of the lock-up agreement, the shareholders have agreed not to sell or transfer the Shares for five years from the date the stock certificates evidencing the Shares are issued.
The following table represents the fair value of identifiable assets and liabilities of SCRC acquired and goodwill recognized at acquisition date.
|
Cash
|
$ | 14,074,720 | ||
|
Accounts receivable
|
19,365,259 | |||
|
Inventories
|
1,646,196 | |||
|
Other current assets
|
82,562 | |||
|
Property, plant and equipment, net
|
17,891,360 | |||
|
Prepaid land leases, net of current portion
|
4,800,404 | |||
|
Goodwill
|
30,173,391 | |||
|
Accounts payable and accrued expenses
|
(8,670,568 | ) | ||
|
Taxes payable
|
(963,458 | ) | ||
|
Cumulative translation adjustment
|
1,278,880 | |||
|
Total purchase price
|
$ | 79,678,746 |
The net revenue and net income of SCRC since the acquisition date that are included in the condensed consolidated statement of income for the three months ended September 30, 2015 are $11,829,929 and $3,003,994. The net revenue and net income of SCRC since the acquisition date that are included in the condensed consolidated statement of income for the nine months ended September 30, 2015 are $40,418,261 and $10,202,563.Goodwill is not expected to be deductible for tax purpose.
Costs of $121,512 related to the acquisition, which included audit fee and valuation fees, have been charged directly to operations and are included in general and administrative expenses in the condensed consolidated statement of income for the nine months ended September 30, 2015.
The following table shows supplemental information of the results of operations on a pro forma basis for the nine months ended September 31, 2015 and 2014, as if the acquisition of SCRC had been completed at the beginning of the Company’s interim periods presented.
|
For the nine months ended
|
||||||||
|
September 30, 2015
|
September 30, 2014
|
|||||||
|
Net Revenue
|
$ | 132,576,760 | $ | 127,327,152 | ||||
|
Net Income
|
$ | 28,239,987 | $ | 24,611,499 | ||||
|
EARNINGS PER SHARE
|
||||||||
|
-Basic
|
$ | 0.61 | $ | 0.54 | ||||
|
-Diluted
|
$ | 0.60 | $ | 0.53 | ||||
The pro forma information for all periods presented has been calculated after adjusting for results of SCRC to reflect the business combination accounting effect resulting from this acquisition including the elimination of intercompany sales, depreciation and amortization on the increase in valuation of property, plant and equipment and prepaid land lease. There are no nonrecurring items included in the pro forma results of operations presented.
NOTE 3 – INVENTORIES
Inventories consist of:
|
September 30, 2015
|
December 31, 2014
|
|||||||
|
Raw materials
|
$
|
1,022,750
|
$
|
625,160
|
||||
|
Finished goods
|
5,247,548
|
4,746,163
|
||||||
|
Work-in-process
|
1,103,076
|
-
|
||||||
|
Allowance for obsolete and slow-moving inventory
|
(3,323
|
)
|
(3,455
|
)
|
||||
|
$
|
7,370,051
|
$
|
5,367,868
|
|||||
NOTE 4 – PREPAID LAND LEASES
The Company prepaid its land leases with lease terms for periods ranging from one to fifty years to use the land on which the office premises, production facilities and warehouses of the Company are situated. The prepaid land lease is amortized on a straight line basis.
During the three-month period ended September 30, 2015 and 2014, amortization of prepaid land lease totaled $257,083 and $234,231, respectively, which were recorded as cost of net revenue. During the nine-month period ended September 30, 2015 and 2014, amortization of prepaid land lease totaled $511,170 and $435,642, respectively, which were recorded as cost of net revenue.
The Company has the rights to use certain parcels of land located in Shouguang, the PRC, through lease agreements signed with local townships or government authority. For parcels of land that are collectively owned by local townships, the Company could not obtain land use rights certificates. The parcels of land that the Company could not obtain land use rights certificates cover a total of approximately 59.43 square kilometers with an aggregate carrying value of $943,089 and approximately 59.39 square kilometers with an aggregate carrying value of $742,820 as at September 30, 2015 and December 31, 2014, respectively.
NOTE 5 – PROPERTY, PLANT AND EQUIPMENT, NET
Property, plant and equipment, net consist of the following:
|
September 30, 2015
|
December 31, 2014
|
|||||||
|
At cost:
|
||||||||
|
Mineral rights
|
$
|
6,258,632
|
$
|
6,506,668
|
||||
|
Buildings
|
70,127,755
|
53,231,127
|
||||||
|
Plant and machinery
|
187,202,515
|
177,485,689
|
||||||
|
Motor vehicles
|
9,031
|
9,389
|
||||||
|
Furniture, fixtures and office equipment
|
4,965,702
|
4,884,991
|
||||||
|
Total
|
268,563,635
|
242,117,864
|
||||||
|
Less: Accumulated depreciation and amortization
|
(143,122,022
|
)
|
(117,767,083
|
)
|
||||
|
Net book value
|
$
|
125,441,613
|
$
|
124,350,781
|
||||
The Company has certain buildings and salt pans erected on parcels of land located in Shouguang, PRC, and such parcels of land are collectively owned by local townships or the government. The Company has not been able to obtain property ownership certificates over these buildings and salt pans. The aggregate carrying values of these properties situated on parcels of the land are $44,165,130 and $37,219,221 as at September 30, 2015 and December 31, 2014, respectively.
GULF RESOURCES, INC.
AND SUBSIDIARIES
NOTES TO CONDENSED CONSOLIDATED FINANCIAL STATEMENTS
SEPTEMBER 30, 2015
(Expressed in U.S. dollars)
(UNAUDITED)
NOTE 5 – PROPERTY, PLANT AND EQUIPMENT, NET – Continued
During the three-month period ended September 30, 2015, depreciation and amortization expense totaled $6,960,873, of which $6,592,218 and $368,655 were recorded as cost of net revenue and administrative expenses, respectively. During the three-month period ended September 30, 2014, depreciation and amortization expense totaled $6,704,711, of which $6,189,046 and $515,665 were recorded as cost of net revenue and administrative expenses, respectively. During the nine-month period ended September 30, 2015, depreciation and amortization expense totaled $21,690,038, of which $20,585,226 and $1,104,812 were recorded as cost of sales and administrative expenses respectively. During the nine-month period ended September 30, 2014, depreciation and amortization expense totaled $20,336,460, of which $19,180,021 and $1,156,439 were recorded as cost of sales and administrative expenses respectively.
NOTE 6 – PROPERTY, PLANT AND EQUIPMENT UNDER CAPITAL LEASES, NET
Property, plant and equipment under capital leases, net consist of the following:
|
September 30, 2015
|
December 31, 2014
|
|||||||
|
At cost:
|
||||||||
|
Buildings
|
$
|
129,362
|
$
|
134,489
|
||||
|
Plant and machinery
|
2,431,638
|
2,528,007
|
||||||
|
Total
|
2,561,000
|
2,662,496
|
||||||
|
Less: Accumulated depreciation and amortization
|
(1,529,003
|
)
|
(1,322,894
|
)
|
||||
|
Net book value
|
$
|
1,031,997
|
$
|
1,339,602
|
||||
The above buildings erected on parcels of land located in Shouguang, PRC, are collectively owned by local townships. The Company has not been able to obtain property ownership certificates over these buildings as the Company could not obtain land use rights certificates on the underlying parcels of land.
During the three-month period ended September 30, 2015 and 2014, depreciation and amortization expense totaled $86,970 and $88,352, respectively, which was recorded as cost of net revenue. During the nine-month period ended September 30, 2015 and 2014, depreciation and amortization expense totaled $264,474 and $265,601, respectively, which was recorded as cost of net revenue.
NOTE 7 – ACCOUNTS PAYABLE AND ACCRUED EXPENSES
Accounts payable and accrued expenses consist of the following:
|
September 30, 2015
|
December 31, 2014
|
|||||||
|
Accounts payable
|
$
|
11,062,550
|
$
|
3,181,465
|
||||
|
Salary payable
|
273,410
|
234,932
|
||||||
|
Social security insurance contribution payable
|
116,914
|
89,232
|
||||||
|
Construction cost payable
|
7,666,742
|
-
|
||||||
|
Other payables
|
644,182
|
499,099
|
||||||
|
Total
|
$
|
19,763,798
|
$
|
4,004,728
|
||||
GULF RESOURCES, INC.
AND SUBSIDIARIES
NOTES TO CONDENSED CONSOLIDATED FINANCIAL STATEMENTS
SEPTEMBER 30, 2015
(Expressed in U.S. dollars)
(UNAUDITED)
NOTE 8 – RELATED PARTY TRANSACTIONS
During the three-month and nine-month periods ended September 30, 2015, the Company borrowed $220,000 and $740,000, respectively, from Jiaxing Lighting Appliance Company Limited (Jiaxing Lighting”), in which Mr. Ming Yang, a shareholder and the Chairman of the Company, had a 100% equity interest in Jiaxing Lighting. The amounts due to Jiaxing Lighting was unsecured, interest free and repayable on demand and was fully settled in the three-month period ended September 30, 2015. There was no balance owing to Jiaxing Lighting as of September 30, 2015 and December 31, 2014.
During the fiscal year 2013, the Company entered into an agreement with the Shandong Shouguang Vegetable Seed Industry Group Co., Ltd, a related party, to provide property management services for an annual amount of approximately $100,704 for five years from January 1, 2013 to December 31, 2017. The expense associated with this agreement for the three- month period ended September 30, 2015 and 2014 were $24,936 and $25,332. The expense associated with this agreement for the nine- month period ended September 30, 2015 and 2014 were $75,829 and $76,152.
NOTE 9 – TAXES PAYABLE
|
Taxes payable consists of the following:
|
|
September 30, 2015
|
December 31, 2014
|
|||||||
|
Income tax payable
|
$
|
3,304,992
|
$
|
1,388,341
|
||||
|
Mineral resource compensation fee payable
|
339,639
|
292,026
|
||||||
|
Value added tax payable
|
1,023,139
|
724,915
|
||||||
|
Land use right tax payable
|
923,146
|
949,544
|
||||||
|
Other tax payables
|
224,993
|
190,603
|
||||||
|
Total
|
$
|
5,815,909
|
$
|
3,545,429
|
||||
NOTE 10 – CAPITAL LEASE OBLIGATIONS
The components of capital lease obligations are as follows:
|
Imputed
|
September 30,
|
December 31,
|
|||||||
|
Interest rate
|
2015
|
2014
|
|||||||
|
Total capital lease obligations
|
6.7%
|
$
|
2,764,319
|
$
|
3,031,623
|
||||
|
Less: Current portion
|
(155,296
|
)
|
(205,128
|
)
|
|||||
|
Capital lease obligations, net of current portion
|
$
|
2,609,023
|
$
|
2,826,495
|
|||||
Interest expenses from capital lease obligations amounted to $46,348 and $48,863 for the three-month period ended September 30, 2015 and 2014, respectively, which were charged to the income statements. Interest expenses from capital lease obligations amounted to $147,808 and $153,630 for the nine-month period ended September 30, 2015 and 2014, respectively, which were charged to the income statements.
NOTE 11 –EQUITY
|
(a)
|
Authorized shares
|
During the annual general meeting held on June 18, 2013, the shareholders of the Company approved the amendment to the Certificate of Incorporation to decrease the number of the authorized shares of the Company’s comment stocks to 80,000,000. The Company has completed the filing of the amendment and restatement of the Certificate of Incorporation with the Secretary of the State of Delaware to decrease the number of authorized shares of the Company’s common stock and accordingly 80,000,000 is disclosed as the authorized shares of the Company’s common stock in the consolidated balance sheets as of September 30, 2015 and December 31, 2014.
|
(b)
|
Retained Earnings - Appropriated
|
In accordance with the relevant PRC regulations and the PRC subsidiaries’ Articles of Association, the Company’s PRC subsidiaries are required to allocate its profit after tax to the following reserve:
Statutory Common Reserve Funds
SCHC, SYCI and SCRC are required each year to transfer at least 10% of the profit after tax as reported under the PRC statutory financial statements to the Statutory Common Reserve Funds until the balance reaches 50% of the registered share capital. This reserve can be used to make up any loss incurred or to increase share capital. Except for the reduction of losses incurred, any other application should not result in this reserve balance falling below 25% of the registered capital. The Statutory Common Reserve Fund as of September 30, 2015 for SCHC, SYCI and SCRC is 39%, 50% and 7% of its registered capital respectively.
NOTE 12 – TREASURY STOCK
In January 2015, the Company repurchased 31,000 shares of common stock of the Company at an average price of $1.22 per share for a total cost of $37,713 under the approval of the Board of Directors. The Company recorded the entire purchase price of the treasury stock as a reduction of equity.
GULF RESOURCES, INC.
AND SUBSIDIARIES
NOTES TO CONDENSED CONSOLIDATED FINANCIAL STATEMENTS
SEPTEMBER 30, 2015
(Expressed in U.S. dollars)
(UNAUDITED)
NOTE 13 – STOCK-BASED COMPENSATION
Pursuant to the Company’s Amended and Restated 2007 Equity Incentive Plan, the total aggregate number of shares of the Company’s common stock reserved for issuance is 4,341,989 shares. As of September 30, 2015, the number of shares of the Company’s common stock available for issuance is 1,048,489.
The fair value of each option award below is estimated on the date of grant using the Black-Scholes option-pricing model. The risk free rate is based on the yield-to-maturity in continuous compounding of the US Government Bonds with the time-to-maturity similar to the expected tenor of the option granted, volatility is based on the annualized historical stock price volatility of the Company, and the expected life is estimated based on historical share option exercise experience as prescribed in FASB ASC 718.
In early March 2015, the Company granted to an independent director an option to purchase 12,500 shares of the Company’s common stock at an exercise price of $1.66 per share and the options vested immediately. The options were valued at $7,400 fair value, with assumed 73.55% volatility, a three-year expiration term with an expected tenor of 1.49 years, a risk free rate of 0.42% and no dividend yield. For the three-month period ended March 31, 2015, $7,400 was recognized as general and administrative expenses.
On April 8, 2015, the Company granted to 17 management staff options to purchase 275,000 shares of the Company’s common stock, respectively, at an exercise price of $1.428 per share and the options vested immediately. The options were valued at $146,400 fair value, respectively, with assumed 68.70% volatility, a four-year expiration term with an expected tenor of 0.94 years, a risk free rate of 0.20% and no dividend yield.
On April 8, 2015, the Company granted to 3 director options to purchase 300,000 shares of the Company’s common stock, respectively, at an exercise price of $1.428 per share and the options vested immediately. The options were valued at $181,400 fair value, respectively, with assumed 65.71% volatility, a four-year expiration term with an expected tenor of 1.30 years, a risk free rate of 0.31% and no dividend yield.
On May 7, 2015, the Company granted to an independent director an option to purchase 12,500 shares of the Company’s common stock at an exercise price of $2.550 per share and the options vested immediately. The options were valued at $8,600 fair value, with assumed 69.32% volatility, a three-year expiration term with an expected tenor of 0.97 years, a risk free rate of 0.23% and no dividend yield.
On July 1, 2015, the Company granted to an independent director an option to purchase 12,500 shares of the Company’s common stock at an exercise price of $2.07 per share and the options vested immediately. The options were valued at $9,500 fair value, with assumed 67.05% volatility, a three-year expiration term with an expected tenor of 1.33 years, a risk free rate of 0.41% and no dividend yield.
The following table summarizes all Company stock option transactions between January 1, 2015 and September 30, 2015.
|
Number of Option
and Warrants
Outstanding and exercisable
|
Weighted- Average
Exercise price of
Option
and Warrants
|
Range of
Exercise Price per Common Share
|
|||||||
|
Balance, January 1, 2015
|
2,744,000
|
$2.38
|
$ |
0.95 - $12.60
|
|||||
|
Granted and vested during the period
Ended September 30, 2015
|
612,500
|
$1.47
|
$ |
1.43-2.55
|
|||||
|
Exercised during the period ended
September 30, 2015
|
(182,500
|
)
|
$1.12
|
$ |
0.95-1.66
|
||||
|
Expired during the period ended
September 30, 2015
|
(817,500
|
)
|
$4.86
|
$ |
2.06-4.97
|
||||
|
Balance, September 30, 2015
|
2,356,500
|
$1.38
|
$ |
0.95 - $12.60
|
|||||
GULF RESOURCES, INC.
AND SUBSIDIARIES
NOTES TO CONDENSED CONSOLIDATED FINANCIAL STATEMENTS
SEPTEMBER 30, 2015
(Expressed in U.S. dollars)
(UNAUDITED)
NOTE 13 – STOCK-BASED COMPENSATION – Continued
|
Stock and Warrants Options Exercisable and Outstanding
|
|||||||
|
Weighted Average
|
|||||||
|
Remaining
|
|||||||
|
Outstanding at September 30, 2015
|
Range of
Exercise Prices
|
Contractual Life
(Years)
|
|||||
|
Exercisable and outstanding
|
2,356,500
|
$0.95 - $12.60
|
2.36
|
||||
The aggregate intrinsic value of options outstanding and exercisable as of September 30, 2015 was $736,442.
The total intrinsic value of options exercised was $236,535 and $400,954 for the nine months ended September 30, 2015 and 2014.
Intrinsic value is calculated as the difference between the exercise price of the underlying award and the closing market price of the stock of the Company as of September 30, 2014 for options outstanding and exercisable as of September 30, 2015, and the closing market price of the stock of the Company as of the date of exercise for options exercised.
During the nine months ended September 30, 2015, 97,244 shares of common stock were issued upon cashless exercise of 182,500 options.
NOTE 14 – INCOME TAXES
The Company utilizes the asset and liability method of accounting for income taxes in accordance with FASB ASC 740-10.
(a) United States
Gulf Resources, Inc. is subject to the United States of America Tax law at a tax rate of 35%. No provision for the US federal income taxes has been made as the Company had no US taxable income for the three-month and nine-month periods ended September 30, 2015 and 2014, and management believes that its earnings are permanently invested in the PRC.
(b) BVI
Upper Class Group Limited, a subsidiary of Gulf Resources, Inc., was incorporated in the BVI and, under the current laws of the BVI, it is not subject to tax on income or capital gain in the BVI. Upper Class Group Limited did not generate assessable profit for the three-month and nine-month periods ended September 30, 2015 and 2014.
(c) Hong Kong
Hong Kong Jiaxing Industrial Limited, a subsidiary of Upper Class Group Limited, was incorporated in Hong Kong and is subject to Hong Kong profits tax. The Company is subject to Hong Kong taxation on its activities conducted in Hong Kong and income arising in or derived from Hong Kong. No provision for profits tax has been made as the Company has no assessable income for the three-month and nine-month periods ended September 30, 2015 and 2014. The applicable statutory tax rates for the three-month and nine-month periods ended September 30, 2015 and 2014 are 16.5%. There is no dividend withholding tax in Hong Kong.
(d) PRC
Enterprise income tax (“EIT”) for SCHC, SYCI and SCRC in the PRC is charged at 25% of the assessable profits.
The operating subsidiaries SCHC, SYCI and SCRC are wholly foreign-owned enterprises (“FIE”) incorporated in the PRC and are subject to PRC Foreign Enterprise Income Tax Law.
On February 22, 2008, the Ministry of Finance (“MOF”) and the State Administration of Taxation (“SAT”) jointly issued Cai Shui [2008] Circular 1 (“Circular 1”). According to Article 4 of Circular 1, distributions of accumulated profits earned by a FIE prior to January 1, 2008 to foreign investor(s) in 2008 will be exempted from withholding tax (“WHT”) while distribution of the profit earned by an FIE after January 1, 2008 to its foreign investor(s) shall be subject to WHT at 5% effective tax rate.
As of September 30, 2015 and December 31, 2014, the accumulated distributable earnings under the Generally Accepted Accounting Principles (GAAP”) of PRC are $259,398,916 and $242,440,917, respectively. Since the Company intends to reinvest its earnings to further expand its businesses in mainland China, its foreign invested enterprises do not intend to declare dividends to their immediate foreign holding companies in the foreseeable future. Accordingly, as of September 30, 2015 and December 31, 2014, the Company has not recorded any WHT on the cumulative amount of distributable retained earnings of its foreign invested enterprises in China. As of September 30, 2015 and December 31, 2014, the unrecognized WHT are $11,899,270 and $11,008,938, respectively.
GULF RESOURCES, INC.
AND SUBSIDIARIES
NOTES TO CONDENSED CONSOLIDATED FINANCIAL STATEMENTS
SEPTEMBER 30, 2015
(Expressed in U.S. dollars)
(UNAUDITED)
NOTE 14 – INCOME TAXES – Continued
The Company’s tax returns are subject to the various tax authorities’ examination. The federal, state and local authorities of the United States may examine the Company’s tax returns filed in the United States for three years from the date of filing. The Company’s US tax returns since 2011 are currently subject to examination. Inland Revenue Department of Hong Kong may examine the Company’s tax returns filed in Hong Kong for seven years from date of filing. The Company’s Hong Kong tax returns since incorporation in year 2008 are currently subject to examination.
The components of the provision for income taxes from continuing operations are:
|
Three-Month Period
Ended September 30,
|
Nine-Month Period
Ended September 30,
|
|||||||||||||||
|
2015
|
2014
|
2015
|
2014
|
|||||||||||||
|
Current taxes – PRC
|
$
|
3,290,372
|
$
|
1,732,861
|
$
|
9,086,618
|
$
|
5,035,433
|
||||||||
|
Deferred taxes – PRC
|
-
|
-
|
(81,460
|
)
|
-
|
|||||||||||
|
$
|
3,290,372
|
$
|
1,732,861
|
$
|
9,005,158
|
$
|
5,035,433
|
|||||||||
The effective income tax expenses differ from the PRC statutory income tax rate of 25% from continuing operations in the PRC as follows:
|
Three-Month Period
Ended September 30,
|
Nine-Month Period
Ended September 30,
|
|||||||||
|
Reconciliations
|
2015
|
2014
|
2015
|
2014
|
||||||
|
Statutory income tax rate
|
25%
|
25%
|
25%
|
25%
|
||||||
|
Non-taxable item
|
(1%)
|
0%
|
(0.7%)
|
0%
|
||||||
|
Change in valuation allowance - US federal net operating loss
|
0%
|
1%
|
0.7%
|
0%
|
||||||
|
Effective tax rate
|
24%
|
26%
|
25%
|
25%
|
||||||
Significant components of the Company’s deferred tax assets and liabilities at September 30, 2015 and December 30, 2014 are as follows:
|
September 30, 2015
|
December 31, 2014
|
|||||||
|
Deferred tax liabilities
|
$
|
-
|
$
|
-
|
||||
|
Deferred tax assets:
|
||||||||
|
Allowance for obsolete and slow-moving inventories
|
$
|
831
|
$
|
864
|
||||
|
Impairment on property, plant and equipment
|
459,228
|
477,427
|
||||||
|
Exploration costs
|
1,957,141
|
1,952,990
|
||||||
|
Compensation costs of unexercised stock options
|
621,707
|
1,427,296
|
||||||
|
US federal net operating loss
|
10,013,893
|
9,692,379
|
||||||
|
Total deferred tax assets
|
13,052,800
|
13,550,956
|
||||||
|
Valuation allowance
|
(10,635,600
|
)
|
(11,119,675
|
)
|
||||
|
Net deferred tax asset
|
$
|
2,417,200
|
$
|
2,431,281
|
||||
|
Current deferred tax asset
|
$
|
831
|
$
|
864
|
||||
|
Long-term deferred tax asset
|
$
|
2,416,369
|
$
|
2,430,417
|
||||
GULF RESOURCES, INC.
AND SUBSIDIARIES
NOTES TO CONDENSED CONSOLIDATED FINANCIAL STATEMENTS
SEPTEMBER 30, 2015
(Expressed in U.S. dollars)
(UNAUDITED)
NOTE 14 – INCOME TAXES – Continued
The increase in valuation allowance for each of the three-month period ended September 30, 2015 and 2014 is $70,320 and $57,219, respectively.
The decrease in valuation allowance for the nine-month period ended September 30, 2015 is $484,075.
The increase in valuation allowance for the nine-month period ended September 30, 2014 is $276,646.
There were no unrecognized tax benefits and accrual for uncertain tax positions as of September 30, 2015 and December 31, 2014.
NOTE 15 – BUSINESS SEGMENTS
The Company has three reportable segments: bromine, crude salt and chemical products. The reportable segments are consistent with how management views the markets served by the Company and the financial information that is reviewed by its chief operating decision maker.
An operating segment’s performance is primarily evaluated based on segment operating income, which excludes share-based compensation expense, certain corporate costs and other income not associated with the operations of the segment. These corporate costs (income) are separately stated below and also include costs that are related to functional areas such as accounting, treasury, information technology, legal, human resources, and internal audit. The Company believes that segment operating income, as defined above, is an appropriate measure for evaluating the operating performance of its segments. All the customers are located in PRC.
|
Three-Month
Period Ended September 30, 2015
|
Bromine*
|
Crude
Salt*
|
Chemical
Products
|
Segment
Total
|
Corporate
|
Total
|
||||||||||||||||||
|
Net revenue
(external customers)
|
$
|
14,940,666
|
$
|
3,032,201
|
$
|
24,628,731
|
$
|
42,601,598
|
$
|
-
|
$
|
42,601,598
|
||||||||||||
|
Net revenue
(intersegment)
|
2,330,808
|
-
|
-
|
2,330,808
|
-
|
2,330,808
|
||||||||||||||||||
|
Income from
operations before taxes
|
4,307,709
|
351,251
|
8,393,184
|
13,052,144
|
851,014
|
13,903,158
|
||||||||||||||||||
|
Income taxes
|
932,211
|
231,354
|
2,126,807
|
3,290,372
|
-
|
3,290,372
|
||||||||||||||||||
|
Income from operations after taxes
|
3,375,498
|
119,897
|
6,266,377
|
9,761,772
|
851,014
|
10,612,786
|
||||||||||||||||||
|
Total assets
|
142,874,828
|
42,858,017
|
181,468,875
|
367,201,720
|
38,165
|
367,239,885
|
||||||||||||||||||
|
Depreciation and amortization
|
3,961,290
|
1,680,827
|
1,405,726
|
7,047,843
|
-
|
7,047,843
|
||||||||||||||||||
|
Capital expenditures
|
2,365,417
|
427,283
|
-
|
2,792,700
|
-
|
2,792,700
|
||||||||||||||||||
|
Three-Month
Period Ended September 30, 2014
|
Bromine*
|
Crude
Salt*
|
Chemical
Products
|
Segment
Total
|
Corporate
|
Total
|
||||||||||||||||||
|
Net revenue
(external customers)
|
$
|
15,973,528 | $ | 2,655,028 |
$
|
12,478,408 | $ | 31,106,964 |
$
|
- |
$
|
31,106,964 | ||||||||||||
|
Net revenue
(intersegment)
|
832,946 | - | - | 832,946 | - | 832,946 | ||||||||||||||||||
|
Income (loss) from
operations before taxes
|
3,131,684 | (431,901 | 4,161,811 | 6,861,594 | (167,005 | 6,694,589 | ||||||||||||||||||
|
Income taxes
|
793,882 | (109,510 | ) | 1,048,489 | 1,732,861 | - | 1,732,861 | |||||||||||||||||
|
Income (loss) from operations after taxes
|
2,337,802 | (322,391 | 3,113,322 | 5,128,733 | (167,005 | 4,961,728 | ||||||||||||||||||
|
Total assets
|
190,832,648 | 54,799,590 | 75,322,416 | 320,954,654 | 43,825 | 320,998,479 | ||||||||||||||||||
|
Depreciation and amortization
|
4,266,547 | 1,638,806 | 887,710 | 6,793,063 | - | 6,793,063 | ||||||||||||||||||
|
Capital expenditures
|
5,342,659 | 1,116,591 | - | 6,459,250 | - | 6,459,250 | ||||||||||||||||||
GULF RESOURCES, INC.
AND SUBSIDIARIES
NOTES TO CONDENSED CONSOLIDATED FINANCIAL STATEMENTS
SEPTEMBER 30, 2015
(Expressed in U.S. dollars)
(UNAUDITED)
NOTE 15 – BUSINESS SEGMENTS – Continued
|
Nine-Month
Period Ended September 30, 2015
|
Bromine*
|
Crude
Salt*
|
Chemical
Products
|
Segment
Total
|
Corporate
|
Total
|
||||||||||||||||||
|
Net revenue
(external customers)
|
$
|
41,066,776
|
$
|
7,905,274
|
$
|
77,890,447
|
$
|
126,862,497
|
$
|
-
|
$
|
126,862,497
|
||||||||||||
|
Net revenue
(intersegment)
|
6,355,047
|
-
|
-
|
6,355,047
|
-
|
6,355,047
|
||||||||||||||||||
|
Income (loss) from
operations before taxes
|
8,950,595
|
534,760
|
26,205,578
|
35,690,933
|
(115,735
|
)
|
35,575,198
|
|||||||||||||||||
|
Income taxes
|
1,959,513
|
412,092
|
6,633,553
|
9,005,158
|
-
|
9,005,158
|
||||||||||||||||||
|
Income (loss) from operations after taxes
|
6,991,082
|
122,668
|
19,572,025
|
26,685,775
|
(115,735
|
)
|
26,570,040
|
|||||||||||||||||
|
Total assets
|
142,874,828
|
42,858,017
|
181,468,875
|
367,201,720
|
38,165
|
367,239,885
|
||||||||||||||||||
|
Depreciation and amortization
|
13,198,194
|
4,671,613
|
4,084,705
|
21,954,512
|
-
|
21,954,512
|
||||||||||||||||||
|
Capital expenditures
|
2,365,417
|
427,283
|
-
|
2,792,700
|
-
|
2,792,700
|
||||||||||||||||||
|
Nine-Month
Period Ended September 30, 2014
|
Bromine*
|
Crude
Salt*
|
Chemical
Products
|
Segment
Total
|
Corporate
|
Total
|
||||||||||||||||||
|
Net revenue
(external customers)
|
$
|
43,950,056
|
$
|
8,012,368
|
$
|
36,489,530
|
$
|
88,451,954
|
$
|
-
|
$
|
88,451,954
|
||||||||||||
|
Net revenue
(intersegment)
|
2,453,779
|
-
|
-
|
2,453,779
|
-
|
2,453,779
|
||||||||||||||||||
|
Income (loss) from
operations before taxes
|
7,748,981
|
94,609
|
12,123,116
|
19,966,706
|
(138,901
|
)
|
19,827,805
|
|||||||||||||||||
|
Income taxes
|
1,964,367
|
17,483
|
3,053,583
|
5,035,433
|
-
|
5,035,433
|
||||||||||||||||||
|
Income (loss) from operations after taxes
|
5,784,614
|
77,126
|
9,069,533
|
14,931,273
|
(138,901
|
)
|
14,792,372
|
|||||||||||||||||
|
Total assets
|
190,832,648
|
54,799,590
|
75,322,416
|
320,954,654
|
43,825
|
320,998,479
|
||||||||||||||||||
|
Depreciation and amortization
|
13,194,940
|
4,738,524
|
2,668,597
|
20,602,061
|
-
|
20,602,061
|
||||||||||||||||||
|
Capital expenditures
|
5,342,659
|
1,116,591
|
-
|
6,459,250
|
-
|
6,459,250
|
||||||||||||||||||
* Certain common production overheads, operating and administrative expenses and asset items (mainly cash and certain office equipment) of bromine and crude salt segments in SCHC were split by reference to the average selling price and production volume of respective segment.
|
Three-Month Period
Ended September 30,
|
Nine-Month Period
Ended September 30,
|
|||||||||||||||
|
Reconciliations
|
2015
|
2014
|
2015
|
2014
|
||||||||||||
|
Total segment operating income
|
$
|
13,052,144
|
$
|
6,861,594
|
$
|
35,690,933
|
$
|
19,966,706
|
||||||||
|
Corporate costs
|
(210,707
|
)
|
(165,386
|
)
|
(1,153,164
|
)
|
(375,929
|
)
|
||||||||
|
Unrealized translation difference
|
1,061,721
|
(1,619
|
)
|
1,037,429
|
237,028
|
|||||||||||
|
Income from operations
|
13,903,158
|
6,694,589
|
35,575,198
|
19,827,805
|
||||||||||||
|
Other income, net of expense
|
66,636
|
76,675
|
199,913
|
197,181
|
||||||||||||
|
Income before taxes
|
$
|
13,969,794
|
$
|
6,771,264
|
$
|
35,775,111
|
$
|
20,024,986
|
||||||||
GULF RESOURCES, INC.
AND SUBSIDIARIES
NOTES TO CONDENSED CONSOLIDATED FINANCIAL STATEMENTS
SEPTEMBER 30, 2015
(Expressed in U.S. dollars)
(UNAUDITED)
NOTE 15 – BUSINESS SEGMENTS – Continued
The following table shows the major customer(s) (10% or more) for the three-month period ended September 30, 2015.
|
Number
|
Customer
|
Bromine
(000’s)
|
Crude Salt
(000’s)
|
Chemical Products
(000’s)
|
Total
Revenue
(000’s)
|
Percentage of
Total Revenue (%)
|
||||||||||||||||
|
1
|
Shandong Morui
Chemical Company
Limited
|
$
|
2,059
|
$
|
852
|
$
|
2,085
|
$
|
4,996
|
11.7%
|
||||||||||||
|
TOTAL
|
$
|
2,059
|
$
|
852
|
$
|
2,085
|
$
|
4,996
|
11.7%
|
|||||||||||||
The following table shows the major customer(s) (10% or more) for the nine-month period ended September 30, 2015.
|
Number
|
Customer
|
Bromine
(000’s)
|
Crude Salt
(000’s)
|
Chemical Products
(000’s)
|
Total
Revenue
(000’s)
|
Percentage of
Total Revenue (%)
|
||||||||||||||||
|
1
|
Shandong Morui
Chemical Company
Limited
|
$
|
6,130
|
$
|
2,047
|
$
|
5,769
|
$
|
13,946
|
11.0%
|
||||||||||||
|
TOTAL
|
$
|
6,130
|
$
|
2,047
|
$
|
5,769
|
$
|
13,946
|
11.0%
|
|||||||||||||
The following table shows the major customer(s) (10% or more) for the three-month period ended September 30, 2014.
|
Number
|
Customer
|
Bromine
(000’s)
|
Crude Salt
(000’s)
|
Chemical Products
(000’s)
|
Total
Revenue
(000’s)
|
Percentage of
Total Revenue (%)
|
||||||||||||||||
|
1
|
Shandong Morui
Chemical Company
Limited
|
$
|
2,212
|
$
|
673
|
$
|
1,916
|
$
|
4,801
|
15.4%
|
||||||||||||
|
TOTAL
|
$
|
2,212
|
$
|
673
|
$
|
1,916
|
$
|
4,801
|
15.4%
|
|||||||||||||
The following table shows the major customer(s) (10% or more) for the nine-month period ended September 30, 2014.
|
Number
|
Customer
|
Bromine
(000’s)
|
Crude Salt
(000’s)
|
Chemical Products
(000’s)
|
Total
Revenue
(000’s)
|
Percentage of
Total Revenue (%)
|
||||||||||||||||
|
1
|
Shandong Morui
Chemical Company
Limited
|
$
|
6,300
|
$
|
1,936
|
$
|
5,237
|
$
|
13,473
|
15.2%
|
||||||||||||
|
TOTAL
|
$
|
6,300
|
$
|
1,936
|
$
|
5,237
|
$
|
13,473
|
15.2%
|
|||||||||||||
NOTE 16 – MAJOR SUPPLIERS
During the three-month and nine-month periods ended September 30, 2015, the Company purchased 58.5% and 57.2% of its raw materials from its top five suppliers, respectively. As of September 30, 2015, amounts due to those suppliers included in accounts payable were $4,320,350. During the three-month and nine-month periods ended September 30, 2014, the Company purchased 89.0% and 89.6% of its raw materials from its top five suppliers, respectively. As of September 30, 2014, amounts due to those suppliers included in accounts payable were $3,710,837.This concentration makes the Company vulnerable to a near-term severe impact, should the relationships be terminated.
GULF RESOURCES, INC.
AND SUBSIDIARIES
NOTES TO CONDENSED CONSOLIDATED FINANCIAL STATEMENTS
SEPTEMBER 30, 2015
(Expressed in U.S. dollars)
(UNAUDITED)
NOTE 17 – CUSTOMER CONCENTRATION
The Company sells a substantial portion of its products to a limited number of customers. During the three-month and nine-month periods ended September 30, 2015, the Company sold 32.7% and 31.6% of its products to its top five customers, respectively. As of September 30, 2015, amounts due from these customers were $27,417,737. During the three-month and nine-month periods ended September 30, 2014, the Company sold 42.4% of its products to its top five customers, respectively. As of September 30, 2014, amounts due from these customers were $24,632,838. This concentration makes the Company vulnerable to a near-term severe impact, should the relationships be terminated.
NOTE 18 – FAIR VALUE OF FINANCIAL INSTRUMENTS
The carrying values of financial instruments, which consist of cash, accounts receivable and accounts payable and other payables, approximate their fair values due to the short-term nature of these instruments. There were no material unrecognized financial assets and liabilities as of September 30, 2015 and December 31, 2014.
NOTE 19 – CAPITAL COMMITMENT AND OPERATING LEASE COMMITMENTS
As of September 30, 2014, the Company leased a real property adjacent to Factory No. 1, with the related production facility, channels and ducts, other production equipment and the buildings located on the property, under capital lease. The future minimum lease payments required under capital lease, together with the present value of such payments, are included in the table show below.
The Company has leased ten pieces of land under non-cancelable operating leases, which are fixed in rentals and expired through December 2021, December 2022, December 2030, December 2031, December 2032, December 2040, February 2059, August 2059 and June 2060, respectively. The Company accounts for the leases as operating leases.
The following table sets forth the Company’s contractual obligations as of September 30, 2015:
|
Capital Lease Obligations
|
Operating Lease Obligations
|
Property
Management
Fees
|
||||||||||
|
Payable within:
|
||||||||||||
|
the next 12 months
|
$ | 295,064 | $ | 973,452 | $ | 98,071 | ||||||
|
the next 13 to 24 months
|
295,064 | 995,561 | 98,071 | |||||||||
|
the next 25 to 36 months
|
295,064 | 1,015,738 | 24,518 | |||||||||
|
the next 37 to 48 months
|
295,064 | 1,039,879 | - | |||||||||
|
the next 49 to 60 months
|
295,064 | 1,062,035 | - | |||||||||
|
thereafter
|
2,950,646 | 19,059,308 | - | |||||||||
|
Total
|
$ | 4,425,966 | $ | 24,145,973 | $ | 220,660 | ||||||
|
Less: Amount representing interest
|
(1,661,647 | ) | ||||||||||
|
Present value of net minimum lease payments
|
$ | 2,764,319 | ||||||||||
GULF RESOURCES, INC.
AND SUBSIDIARIES
NOTES TO CONDENSED CONSOLIDATED FINANCIAL STATEMENTS
SEPTEMBER 30, 2015
(Expressed in U.S. dollars)
(UNAUDITED)
NOTE 19 – CAPITAL COMMITMENT AND OPERATING LEASE COMMITMENTS – Continued
Rental expenses related to operating leases of the Company amounted to $267,281 and $244,097, which were charged to the income statements for the three-month ended September 30, 2015 and 2014, respectively. Rental expenses related to operating leases of the Company amounted to $810,983 and $733,138, which were charged to the income statements for the nine-month ended September 30, 2015 and 2014, respectively.
NOTE 20 – SUBSEQUENT EVENT
During the annual general meeting on October 5, 2015, the following were approved:
|
a)
|
amendment to the Company’s Amended and Restated 2007 Equity Incentive Plan to increase the number of Shares of Common Stock authorized for issuance under the Plan by 6,000,000 shares; and
|
|
b)
|
reincorporation of the Company from Delaware to Nevada which will be effected through the merger of the Company into a newly formed Nevada Corporation that is a wholly owned subsidiary of the Company.
|
The reincorporation will eliminate the Company’s obligation to pay the annual Delaware franchise tax resulting in significant savings to the Company in the long term. There will be no change in the Company’s business, management, employees, headquarters, benefit plans, assets, liabilities or net worth (other than as a result of the costs incidental to the reincorporation which is expected to be immaterial).
Cautionary Note Regarding Forward-Looking Statements
The discussion below contains “forward-looking statements” within the meaning of the Private Securities Litigation Reform Act of 1995, Section 27A of the Securities Act, and Section 21E of the Exchange Act. We have used words such as “believes,” “intends,” “anticipates,” “expects” and similar expressions to identify forward-looking statements. These statements are based on information currently available to us and are subject to a number of risks and uncertainties that may cause our actual results of operations, financial condition, cash flows, performance, business prospects and opportunities and the timing of certain events to differ materially from those expressed in, or implied by, these statements. These risks, uncertainties and other factors include, without limitation, those matters discussed in Item 1A of Part I of our 2014 Form 10-K. Except as expressly required by the federal securities laws, we undertake no obligation to update such factors or to publicly announce the results of any of the forward-looking statements contained herein to reflect future events, developments, or changed circumstances, or for any other reason. The following discussion should be read in conjunction with our consolidated financial statements and notes thereto appearing in our 2014 Form 10-K and Item 1A, “Risk Factors” for the year ended December 31, 2014.
Overview
Gulf Resources conducts operations through its three wholly-owned China subsidiaries, SCHC, SYCI and SCRC. Our business is also reported in these three segments, Bromine, Crude Salt, and Chemical Products.
Through SCHC, we produce and sell bromine and crude salt. We are one of the largest producers of bromine in China, as measured by production output. Elemental bromine is used to manufacture a wide variety of brominated compounds used in industry and agriculture. Bromine is commonly used in brominated flame retardants, fumigants, water purification compounds, dyes, medicines, and disinfectants.
Through SYCI, we manufacture and sell chemical products that are used in oil and gas field exploration, oil and gas distribution, oil field drilling, wastewater processing, papermaking chemical agents and inorganic chemicals.
Through SCRC, we manufacture and sell chemical products that are used for human and animal antibiotics.
Our Corporate History
We were incorporated in Delaware on February 28, 1989. From November 1993 through August 2006, we were engaged in the business of owning, leasing and operating coin and debit card pay-per copy photocopy machines, fax machines, microfilm reader-printers and accessory equipment under the name “Diversifax, Inc.”. Due to the increased use of internet services, demand for our services declined sharply, and in August 2006, our Board of Directors decided to discontinue our operations.
Upper Class Group Limited, incorporated in the British Virgin Islands in July 2006, acquired all the outstanding stock of SCHC, a company incorporated in Shouguang City, Shandong Province, PRC, in May 2005. At the time of the acquisition, members of the family of Mr. Ming Yang, our president and former chief executive officer, owned approximately 63.20% of the outstanding shares of Upper Class Group Limited. Since the ownership of Upper Class Group Limited and SCHC was then substantially the same, the acquisition was accounted for as a transaction between entities under common control, whereby Upper Class Group Limited recognized the assets and liabilities transferred at their carrying amounts.
On December 12, 2006, our company, then known as Diversifax, Inc., a public “shell” company, acquired Upper Class Group Limited and SCHC. Under the terms of the agreement, the stockholders of Upper Class Group Limited received 13,250,000 (restated for the 2-for-1 stock split in 2007 and the 1-for-4 stock split in 2009) shares of voting common stock of Gulf Resources, Inc. in exchange for all outstanding shares of Upper Class Group Limited. Members of the Yang family received approximately 62% of our common stock as a result of the acquisition. Under accounting principles generally accepted in the United States, the share exchange is considered to be a capital transaction rather than a business combination. That is, the share exchange is equivalent to the issuance of stock by Upper Class Group Limited for the net assets of Gulf Resources, Inc., accompanied by a recapitalization, and is accounted for as a change in capital structure. Accordingly, the accounting for the share exchange is identical to that resulting from a reverse acquisition, except no goodwill is recorded. Under reverse takeover accounting, the post reverse acquisition comparative historical financial statements of the legal acquirer, Gulf Resources, Inc., are those of the legal acquiree, Upper Class Group Limited. Share and per share amounts stated have been retroactively adjusted to reflect the share exchange. On February 20, 2007, we changed our corporate name to Gulf Resources, Inc.
On February 5, 2007, we acquired SYCI, a company incorporated in PRC, in October 2000. Under the terms of the acquisition agreement, the stockholders of SYCI received a total of 8,094,059 (restated for the 2-for-1 stock split in 2007 and the 1-for-4 stock split in 2009) shares of common stock of Gulf Resources, Inc. in exchange for all outstanding shares of SYCI's common stock. Simultaneously with the completion of the acquisition, a dividend of $2,550,000 was paid to the former stockholders of SYCI. At the time of the acquisition, approximately 49.1% of the outstanding shares of SYCI were owned by Ms. Yu, Mr. Yang’s wife, and the remaining 50.9% of the outstanding shares of SYCI were owned by SCHC, all of whose outstanding shares were owned by Mr. Yang and his wife. Since the ownership of Gulf Resources, Inc. and SYCI are substantially the same, the acquisition was accounted for as a transaction between entities under common control, whereby Gulf Resources, Inc. recognized the assets and liabilities of SYCI at their carrying amounts. Share and per share amounts have been retroactively adjusted to reflect the acquisition.
To satisfy certain ministerial requirements necessary to confirm certain government approvals required in connection with the acquisition of SCHC by Upper Class Group Limited, all of the equity interest of SCHC were transferred to a newly formed Hong Kong corporation named Hong Kong Jiaxing Industrial Limited (“Hong Kong Jiaxing”) all of the outstanding shares of which are owned by Upper Class Group Limited. The transfer of all of the equity interest of SCHC to Hong Kong Jiaxing received approval from the local State Administration of Industry and Commerce on December 10, 2007.
As a result of the transactions described above, our corporate structure is linear. That is Gulf Resources owns 100% of the outstanding shares of Upper Class Group Limited, which owns 100% of the outstanding shares of Hong Kong Jiaxing, which owns 100% of the outstanding shares of SCHC, which owns 100% of the outstanding shares of SYCI.
On October 12, 2009 we completed a 1-for-4 reverse stock split of our common stock, such that for each four shares outstanding prior to the stock split there was one share outstanding after the reverse stock split. All shares of common stock referenced in this report have been adjusted to reflect the stock split figures. On October 27, 2009 our shares began trading on the NASDAQ Global Select Market under the ticker symbol “GFRE” and on June 30, 2011 we changed our ticker symbol to “GURE” to better reflect of our corporate name.
On January 12, 2015, Gulf Resources, Inc. (the “Company” or “Gulf”) and Shouguang City Haoyuan Chemical Company Limited, a wholly owned subsidiary of the Company (“SCHC”), entered into an Equity Interest Transfer Agreement (the “Agreement”) with SCRC.
On February 4, 2015 the Company closed the transactions contemplated by the Agreement between the Company, SCHC and SCRC.
On the Closing Date, the Company issued 7,268,011shares of its common stock, par value $0.0005 per share (the “Shares”), at the closing market price of $1.84 per Share on the Closing Date to the four former equity owners of SCRC .The issuance of the Shares was exempt from registration pursuant to Regulation S of the Securities Act of 1933, as amended. On the Closing Date, the Company entered into a lock-up agreement with the four former equity owners of SCRC. In accordance with the terms of the lock-up agreement, the shareholders have agreed not to sell or transfer the Shares for five years from the date the stock certificates evidencing the Shares are issued.
The sellers of SCRC agreed as part of the purchase price to accept 7,268,011 shares of Gulf Resources stock, based on a valuation of $2.00, which was a 73% premium to the price on the day the agreement was reached. For accounting purposes, these shares are now being valued at $1.84, which was the closing price of Gulf Resources' stock on the day of the closing of the agreement. The price difference between the original $2.00 and the current $1.84 is solely for accounting purposes. There has been no change in the number of shares issued.
Our current corporate structure chart is set forth in the following diagram:
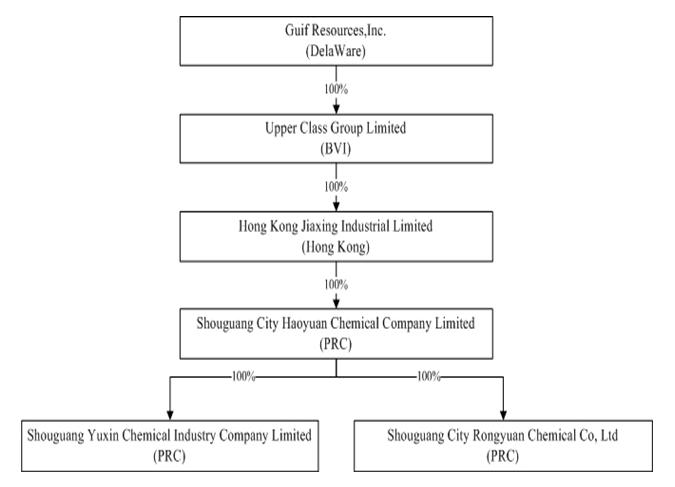
As a result of our acquisitions of SCHC, SYCI and SCRC, our historical financial statements and the information presented below reflects the accounts of SCHC, SYCI and SCRC. The following discussion should be read in conjunction with our consolidated financial statements and notes thereto appearing elsewhere in this report.
RESULTS OF OPERATIONS
The following table presents certain information derived from the consolidated statements of operations, cash flows and stockholders equity for the three-month and nine-month periods ended September 30, 2015 and 2014.
Comparison of the Three-Month Period Ended September 30, 2015 and 2014
|
Three-Month
Period Ended
September 30, 2015
|
Three-Month
Period Ended
September 30, 2014
|
% Change
|
||||||||||
|
Net revenue
|
$
|
42,601,598
|
$
|
31,106,964
|
|
37
|
%
|
|||||
|
Cost of net revenue
|
$
|
(27,000,576
|
)
|
$
|
(21,901,056
|
)
|
|
23
|
%
|
|||
|
Gross profit
|
$
|
15,601,022
|
$
|
9,205,908
|
|
69
|
%
|
|||||
|
Sales, marketing and other operating expenses
|
$
|
(91,919
|
)
|
$
|
(29,064
|
)
|
216
|
%
|
||||
|
Research and development costs
|
$
|
(69,403
|
)
|
$
|
(30,985
|
)
|
|
124
|
%
|
|||
|
Write-off/Impairment on property, plant and equipment
|
$
|
(819,701
|
)
|
$
|
(673,705
|
)
|
|
22
|
%
|
|||
|
General and administrative expenses
|
$
|
(831,955
|
)
|
$
|
(1,894,507
|
)
|
|
(56
|
%)
|
|||
|
Other operating income
|
$
|
115,114
|
$
|
116,942
|
|
(2
|
%)
|
|||||
|
Income from operations
|
$
|
13,903,158
|
$
|
6,694,589
|
|
108
|
%
|
|||||
|
Other income, net
|
$
|
66,636
|
$
|
76,675
|
|
(13
|
%)
|
|||||
|
Income before taxes
|
$
|
13,969,794
|
$
|
6,771,264
|
|
106
|
%
|
|||||
|
Income taxes
|
$
|
(3,290,372
|
)
|
$
|
(1,732,861
|
)
|
|
90
|
%
|
|||
|
Net income
|
$
|
10,679,422
|
$
|
5,038,403
|
|
112
|
%
|
|||||
Net revenue. Net revenue was $42,601,598 for three-month period ended September 30, 2015, an increase of approximately 11.5 million (or 37%) as compared to the same period in 2014. This increase was primarily attributable to the consolidation in 2015 of SCRC, which collectively contributed $11,829,929 to our net revenue for the three-month period ended September 30, 2015.
Revenue from the bromine products segment decreased from $15,973,528 for the three-month period ended September 30, 2014 to $14,940,666 for the same period in 2015, a decrease of approximately 6.5%. Revenue from the crude salt segment increased from $2,655,028 for the three-month period ended September 30, 2014 to $3,032,201 for the same period in 2015, an increase of approximately 14.2%.
Revenue from the chemical segment increased from $12,478,408 for the three-month period ended September 30, 2014 to $24,628,731 for the same period in 2015, an increase of approximately 97.4%.
|
Net Revenue by Segment
|
||||||||||||||||||||
|
Three-Month Period Ended
|
Three-Month Period Ended
|
Percent change
Increase/
(Decrease)
|
||||||||||||||||||
|
September 30, 2015
|
September 30, 2014
|
of Net Revenue
|
||||||||||||||||||
|
Segment
|
% of total
|
% of total
|
||||||||||||||||||
|
Bromine
|
$
|
14,940,666
|
35
|
%
|
$
|
15,973,528
|
51
|
%
|
(6.5
|
%)
|
||||||||||
|
Crude Salt
|
$
|
3,032,201
|
7
|
%
|
$
|
2,655,028
|
9
|
%
|
14.2
|
%
|
||||||||||
|
Chemical Products
|
$
|
24,628,731
|
58
|
%
|
$
|
12,478,408
|
40
|
%
|
97.4
|
%
|
||||||||||
|
Total sales
|
$
|
42,601,598
|
100
|
%
|
$
|
31,106,964
|
51
|
%
|
37.0
|
%
|
||||||||||
|
Bromine and crude salt segments
|
Three-Month Period Ended
|
Percentage Change
|
||||||||||
|
product sold in tonnes
|
September 30, 2015
|
September 30, 2014
|
Decrease
|
|||||||||
|
Bromine (excluded volume sold to SYCI and SCRC after acquisition in January 2015)
|
4,726
|
5,596
|
(16
|
%)
|
||||||||
|
Crude Salt
|
91,165
|
95,234
|
(4
|
%)
|
||||||||
|
Three-Month Period Ended
|
Percentage Change
|
|||||||||||
|
Chemical products segment sold in tonnes
|
September 30, 2015
|
September 30, 2014
|
Increase/(Decrease)
|
|||||||||
|
Oil and gas exploration additives
|
3,748
|
3,836
|
(2
|
%)
|
||||||||
|
Paper manufacturing additives
|
1,127
|
1,115
|
1
|
%
|
||||||||
|
Pesticides manufacturing additives
|
824
|
852
|
(3
|
%)
|
||||||||
|
Pharmaceutical intermediates
|
379
|
-
|
-
|
|||||||||
|
By products
|
3,368
|
-
|
-
|
|||||||||
|
Overall
|
9,446
|
5,803
|
63
|
%
|
||||||||
Bromine segment
The table below shows the changes in the average selling price and changes in the sales volume of bromine for three-month period ended September 30, 2015 from the same period in 2014.
|
Three-Month Period
Ended September 30,
|
||||
|
Increase/(Decrease) in net revenue of bromine as a result of:
|
2015 vs. 2014
|
|||
|
Increase in average selling price
|
$
|
1,584,283
|
||
|
Decrease in sales volume
|
$
|
(2,617,145
|
)
|
|
|
Total effect on net revenue of bromine
|
$
|
(1,032,862
|
)
|
|
The decrease in net revenue from our bromine segment was mainly due to the decrease in the sales volume. The sales volume of bromine decreased from 5,596 tonnes for the three-month period ended September 30, 2014 to 4,726 tonnes for the same period in 2015, a decrease of 16%. The reasons for the decrease in the sales volume of bromine were mainly due to the continuing macro-economic tightening policy imposed by the PRC government beginning in the second half of 2011 to slow down the economy, which has affected our customers’ industries and the sale of bromine to SCRC in three-month period ended September 30, 2015 excluded from the net revenue in the bromine segment as SCRC was acquired by us in January 2015.
The selling price of bromine increased from $2,855 per tonne for the three-month period ended September 30, 2014 to $3,162 per tonne for the same period in 2015, an increase of 11%. We expect the average selling price of bromine to remain at current levels through the end of 2015 should the PRC government’s macro-economic tightening policy remain in place.
Crude salt segment
The table below shows the changes in the average selling price and changes in the sales volume of crude salt for three-month period ended September 30, 2015 from the same period in 2014.
|
Three-Month Period
Ended September 30,
|
||||
|
Increase/(Decrease) in net revenue of crude salt as a result of:
|
2015 vs. 2014
|
|||
|
Increase in average selling price
|
$
|
501,555
|
||
|
Decrease in sales volume
|
$
|
(124,382
|
)
|
|
|
Total effect on net revenue of crude salt
|
$
|
377,173
|
||
The increase in net revenue from our crude salt segment was mainly due to the increase in the selling price of crude salt. The selling price of crude salt increased by 19% from $27.88 per tonne for the three-month period ended September 30, 2014 to $33.26 per tonne for the same period in 2015. The increase in the average selling price was mainly due to the crude salt is a basic and elementary material for chemical industry.
We noted a upward trend in the average selling price of crude salt since the third quarter of 2014. We expect the average selling price of crude salt to remain at current levels through the end of 2015.
Chemical products segment
|
Product Mix of Chemical Products Segment
|
Percent
|
|||||||||||||||||||
|
Three-Month Period Ended
|
Three-Month Period Ended
|
Change of
|
||||||||||||||||||
|
September 30, 2015
|
September 30, 2014
|
Net Revenue
|
||||||||||||||||||
|
Chemical Products
|
% of total
|
% of total
|
||||||||||||||||||
|
Oil and gas exploration additives
|
$
|
7,271,644
|
30
|
%
|
$
|
7,129,171
|
57
|
%
|
2.0
|
%
|
||||||||||
|
Paper manufacturing additives
|
$
|
1,381,212
|
6
|
%
|
$
|
1,272,376
|
10
|
%
|
8.6
|
%
|
||||||||||
|
Pesticides manufacturing additives
|
$
|
4,145,946
|
17
|
%
|
$
|
4,076,861
|
33
|
%
|
1.7
|
%
|
||||||||||
|
Pharmaceutical intermediates
|
$
|
7,764,120
|
31
|
%
|
$
|
-
|
-
|
-
|
||||||||||||
|
By products
|
$
|
4,065,809
|
16
|
%
|
$
|
-
|
-
|
-
|
||||||||||||
|
Total sales
|
$
|
24,628,731
|
100
|
%
|
$
|
12,478,408
|
100
|
%
|
97.4
|
%
|
||||||||||
Net revenue from our chemical products segment increased from $12,478,408 for the three-month period ended September 30, 2014 to $24,628,731 for the same period in 2015, an increase of 97.4%. This increase was primarily attributable to the consolidation in 2015 of SCRC, which collectively contributed $11,829,929 to our revenue for the three-month period ended September 30, 2015. Net revenue from our oil and gas exploration chemicals contributed $7,271,644 and $7,129,171 of our chemical segment revenue for the three-month period ended September 30, 2015 and 2014, respectively, with an increase of $142,473, or 2.0%. Net revenue from our paper manufacturing additives increased from $1,272,376 for the three-month period ended September 30, 2014 to $1,381,212 for the same period in 2015, an increase of approximately 8.6%. Net revenue from our pesticides manufacturing additives increased from $4,076,861 for the three-month period ended September 30, 2014 to $4,145,946 for the same period in 2015, an increase of approximately 1.7%.
The table below shows the changes in the average selling price and changes in the sales volume of major chemical products for three-month period ended September 30, 2015 from the same period in 2014 (excluding SCRC).
|
Increase/(Decrease) in net revenue,
for the three-month period ended September 30,
2015 vs. 2014, as a result of:
|
Oil and gas exploration additives
|
Paper manufacturing additives
|
Pesticides manufacturing additives
|
Total
|
||||||||||||
|
Increase in average selling price
|
$
|
309,613
|
$
|
94,636
|
$
|
206,517
|
$
|
610,766
|
||||||||
|
Increase /(Decrease) in sales volume
|
$
|
(167,140
|
)
|
$
|
14,200
|
$
|
(137,432
|
)
|
$
|
(290,372
|
)
|
|||||
|
Total effect on net revenue of chemical products
|
$
|
142,473
|
$
|
108,836
|
$
|
69,085
|
$
|
320,394
|
||||||||
Cost of Net Revenue.
|
Cost of Net Revenue by Segment
|
% Change
|
|||||||||||||||||||
|
Three-Month Period Ended
|
Three-Month Period Ended
|
of Cost of
|
||||||||||||||||||
|
September 30, 2015
|
September 30, 2014
|
Net Revenue
|
||||||||||||||||||
|
Segment
|
% of total
|
% of total
|
||||||||||||||||||
|
Bromine
|
$
|
9,088,078
|
34
|
%
|
$
|
11,181,746
|
51
|
%
|
(18.7
|
%)
|
||||||||||
|
Crude Salt
|
$
|
2,268,976
|
8
|
%
|
$
|
2,714,874
|
12
|
%
|
(16.4
|
%)
|
||||||||||
|
Chemical Products
|
$
|
15,643,522
|
58
|
%
|
$
|
8,004,436
|
37
|
%
|
95.4
|
%
|
||||||||||
|
Total
|
$
|
27,000,576
|
100
|
%
|
$
|
21,901,056
|
100
|
%
|
23.3
|
%
|
||||||||||
Cost of net revenue reflects mainly the raw materials consumed and the direct salaries and benefits of staff engaged in the production process, electricity, depreciation and amortization of manufacturing plant and machinery and other manufacturing costs. Our cost of net revenue was $27,000,576 for the three-month period ended September 30, 2015, an increase of $5,099,520 (or 23.3%) as compared to the same period in 2014. This increase was primarily attributable to the consolidation in 2015 of SCRC, which collectively contributed $7,548,242 to our cost of net revenue for the three-month period ended September 30, 2015.
Bromine production capacity and utilization of our factories
The table below represents the annual capacity and utilization ratios for all of our bromine producing properties:
|
Annual Production Capacity (in tonnes)
|
Utilization
Ratio (i)
|
|||||||
|
Three-month period ended September 30, 2014
|
47,347
|
54%
|
||||||
|
Three-month period ended September 30, 2015
|
47,347
|
49%
|
||||||
|
Variance of the three-month period ended September 30, 2015 and 2014
|
-
|
(5%
|
)
|
|||||
(i) Utilization ratio is calculated based on the annualized actual production volume in tonnes for the period divided by the annual production capacity in tonnes.
Our utilization ratio decreased by 5% for the three-month period ended September 30, 2015 as compared with the same period in 2014.
Bromine segment
For the three-month period ended September 30, 2015, the cost of net revenue for the bromine segment was $9,088,078, a decrease of $2,093,668 or 18.7% over the same period in 2014. The most significant components of the costs of net revenue for the bromine segment were the cost of raw materials and finished goods consumed of $3,437,804 (or 38%), depreciation and amortization of manufacturing plant and machinery of $3,850,984 (or 42%) and electricity of $804,731 (or 9%) for the three-month period ended September 30, 2015. For the three-month period ended September 30, 2014, the major components of the cost of net revenue were the cost of raw materials and finished goods consumed of $4,967,567 (or 44%), depreciation and amortization of manufacturing plant and machinery of $3,987,538 (or 36%) and electricity of $901,481 (or 7%). The cost structure changed as compared with the same period in 2014 where the contribution from the cost of raw materials and finished goods consumed decreased by 6% and depreciation and amortization of manufacturing plant and machinery increased by 6%. The decrease in net cost of net revenue was mainly attributable to the decreased volume of products sold and an inter-company elimination adjustment related to the sale of bromine to SCRC in the three-month period ended September 30, 2015 allocated to the bromine segment whereas there is no such adjustment in the same period in 2014 as SCRC was acquired by us in January 2015.
The table below represents the major production cost component of bromine per tonne for respective periods:
|
Per tonne production cost
|
Three-Month Period Ended
|
Three-Month Period Ended
|
||||||||||||||||||
|
component of bromine segment
|
September 30, 2015
|
September 30, 2014
|
% Change
|
|||||||||||||||||
|
% of total
|
% of total
|
|||||||||||||||||||
|
Raw materials
|
$
|
1,055
|
51
|
%
|
$
|
985
|
48
|
%
|
7
|
%
|
||||||||||
|
Depreciation and amortization
|
$
|
704
|
34
|
%
|
$
|
677
|
33
|
%
|
4
|
%
|
||||||||||
|
Electricity
|
$
|
147
|
7
|
%
|
$
|
153
|
8
|
%
|
(4
|
%)
|
||||||||||
|
Others
|
$
|
183
|
8
|
%
|
$
|
225
|
11
|
%
|
19
|
%
|
||||||||||
|
Production cost of bromine per tonne
|
$
|
2,089
|
100
|
%
|
$
|
2,040
|
100
|
%
|
2
|
%
|
||||||||||
Our production cost of bromine per tonne was $2,089 for the three-month period ended September 30, 2015, an increase of 2% (or $49) as compared to the same period in 2014, which was attributable mainly to the component of the cost of raw materials consumed. The cost of raw materials consumed per tonne increased by 7% as compared to the last comparison period, which was mainly attributable to the increase in the purchase price of raw materials.
Crude salt segment
The cost of net revenue for our crude salt segment for the three-month period ended September 30, 2015 was $2,268,976, representing a decrease of $445,898, or 16.4%, compared to $2,714,874 for the same period in 2014. The decrease in cost was mainly due to the decrease in volume of crude salt sold and unit production cost. The significant cost components for the three-month period ended September 30, 2015 were depreciation and amortization of $1,555,701 (or 69%), resource taxes calculated based on crude salt sold of $291,510 (or 13%) and electricity of $187,909 (or 8%). The significant cost components for the three-month period ended September 30, 2014 were depreciation and amortization of $1,836,322 (or 68%), resource taxes calculated based on crude salt sold of $309,359 (or 11%) and electricity of $219,306 (or 8%). The table below represents the major production cost component of crude salt per ton for respective periods:
|
Per tonne production cost
|
Three-Month Period Ended
|
Three-Month Period Ended
|
||||||||||||||||||
|
component of crude salt segment
|
September 30, 2015
|
September 30, 2014
|
% Change
|
|||||||||||||||||
|
% of total
|
% of total
|
|||||||||||||||||||
|
Depreciation and amortization
|
$
|
17.1
|
67
|
%
|
$
|
19.3
|
67
|
%
|
(12
|
%)
|
||||||||||
|
Resource tax
|
$
|
3.2
|
12
|
%
|
$
|
3.2
|
12
|
%
|
-
|
|||||||||||
|
Electricity
|
$
|
2.0
|
9
|
%
|
$
|
2.3
|
9
|
%
|
(13
|
%)
|
||||||||||
|
Others
|
$
|
2.6
|
12
|
%
|
$
|
3.7
|
12
|
%
|
(30
|
%)
|
||||||||||
|
Production cost of crude salt per tonne
|
$
|
24.9
|
100
|
%
|
$
|
28.5
|
100
|
%
|
(13
|
%)
|
||||||||||
Chemical products segment
Cost of net revenue for our chemical products segment for the three-month period ended September 30, 2015, was $15,643,522, representing an increase of $7,639,086 or 95.4% over the same period in 2014. This increase was primarily attributable to the consolidation in 2015 of SCRC, which collectively contributed $7,548,242 to our cost of net revenue for the three-month period ended September 30, 2015.
Gross Profit. Gross profit was $15,601,022, or 37%, of net revenue for three-month period ended September 30, 2015 compared to $9,205,908, or 30%, of net revenue for the same period in 2014.
|
Gross Profit by Segment
|
% Point Change
|
|||||||||||||||||||
|
Three-Month Period Ended
|
Three-Month Period Ended
|
of Gross
|
||||||||||||||||||
|
September 30, 2015
|
September 30, 2014
|
Profit Margin
|
||||||||||||||||||
|
Segment
|
Gross Profit Margin
|
Gross Profit Margin
|
||||||||||||||||||
|
Bromine
|
$
|
5,852,588
|
39
|
%
|
$
|
4,791,782
|
30
|
%
|
9
|
%
|
||||||||||
|
Crude Salt
|
$
|
763,225
|
25
|
%
|
$
|
(59,846
|
)
|
(2
|
%)
|
27
|
%
|
|||||||||
|
Chemical Products
|
$
|
8,985,209
|
36
|
%
|
$
|
4,473,972
|
36
|
%
|
-
|
|||||||||||
|
Total Gross Profit
|
$
|
15,601,022
|
37
|
%
|
$
|
9,205,908
|
30
|
%
|
7
|
%
|
||||||||||
Bromine segment
For the three-month period ended September 30, 2015, the gross profit margin for our bromine segment was 39% compared to 30% for the same period in 2014. This 9% increase is mainly due to the selling price of bromine increased from $2,855 per tonne for the three-month period ended September 30, 2014 to $3,162 per tonnes for the same period in 2015, an increase of 11%. We expect that the average selling price and gross profit margin of bromine will remain at current level towards the end of 2015 should the PRC government’s macro-economic tightening policy remain in place.
Crude salt segment
For the three-month period ended September 30, 2015 the gross profit margin for our crude salt segment was 25% compared to -2% for the same period in 2014. This 27% increase in our gross profit margin is mainly attributable to the selling price increased from $27.88 per tonne for the three-month period ended September 30, 2014 to $33.26 per tonne for the same period in 2015, an increase of 19%.
Chemical products segment
The gross profit margin for our chemical products segment for the three-month period ended September 30, 2015 was 36% compared to 36% for the same period in 2014.
Research and Development Costs. The total research and development costs incurred for the three-month period ended September 30, 2015 and 2014 were $69,403 and $30,985, respectively, an increase of 124%. Research and development costs for the three-month period ended September 30, 2015 represented raw materials used by SYCI and SCRC for testing the manufacturing routine. Research and development costs for the three-month period ended September 30, 2014 represented raw materials used by SYCI for testing the manufacturing routine.
Write-off/Impairment on property, plant and equipment. Write-off on property, plant and equipment for the three-month period ended September 30, 2015 and 2014 were $819,701 and $673,705, respectively, an increase of 22%. Write-off on property, plant and equipment of $673,705 for the three-month period ended September 30, 2014 represented the write-off of certain protective shells to transmission pipelines and ducts replaced during the third phase enhancement project that started in August 2014 and completed in September 2014. Write-off on property, plant and equipment of $819,701 for the three-month period ended September 30, 2015 represented the write-off of (i) certain protective shells to transmission pipelines and ducts replaced of $753,025 during the fourth phase enhancement project that started in August 2015 and completed in September 2015; and (ii) certain machinery and equipment replaced during the enhancement work to our bromine production facilities in Factory No. 11 of $66,676.
General and Administrative Expenses. General and administrative expenses were $831,955 for the three-month period ended September 30, 2015, a decrease of $1,062,552 (or 56%) as compared to $1,894,507 for the same period in 2014. This decrease in general and administrative expenses was primarily due to the unrealized exchange gain of $1,061,721 in relation to the translation of current portion of inter-company balance owing in RMB for the three-month period ended September 30, 2015, as compared to the unrealized exchange loss for the same period in 2014 in the amount of $1,619.
Other Operating Income. Other operating income was $115,114 for the three-month period ended September 30, 2015, a decrease of $1,828(or 2%) as compared to $116,942 for the same period in 2014 for sales of wastewater. Wastewater is generated from the production of bromine and eventually becomes crude salt when it evaporates. Not all of our bromine production plants have sufficient area on the property to allow for evaporation of wastewater to produce crude salt. Certain of our customers who have facilities located adjacent to our bromine production plants have agreed to allow us to channel our wastewater into brine pans on their properties for evaporation. These customers then are able to sell the resulting crude salt themselves. We signed agreements with four of our customers to sell them our wastewater at market prices.
Income from Operations. Income from operations was $13,903,158 for the three-month period ended September 30, 2015 (or 33% of net revenue), an increase of $7,208,569, or approximately 108%, over the income from operations for the same period in 2014. This increase was primarily attributable to the consolidation in 2015 of SCRC, which collectively contributed $4,006,865 to our income from operation for the three-month period ended September 30, 2015.
|
Income from Operations by Segment
|
||||||||||||||||
|
Three-Month Period Ended
September 30, 2015
|
Three-Month Period Ended
September 30, 2014
|
|||||||||||||||
|
Segment:
|
% of total
|
% of total
|
||||||||||||||
|
Bromine
|
$ | 4,307,709 | 33 | % | $ | 3,131,684 | 45 | % | ||||||||
|
Crude Salt
|
351,251 | 3 | % | (431,901 | ) | (6 | %) | |||||||||
|
Chemical Products
|
8,393,184 | 64 | % | 4,161,811 | 61 | % | ||||||||||
|
Income from operations before corporate costs
|
13,052,144 | 100 | % | 6,861,594 | 100 | % | ||||||||||
|
Corporate costs
|
(210,707 | ) | (165,386 | ) | ||||||||||||
|
Unrealized translation difference
|
1,061,721 | (1,619 | ) | |||||||||||||
|
Income from operations
|
$ | 13,903,158 | $ | 6,694,589 | ||||||||||||
Bromine segment
Income from operations from our bromine segment was $4,307,709 for the three-month period ended September 30, 2015, an increase of $1,176,025 (or approximately 38%) compared to the same period in 2014. This increase resulted primarily from the higher selling price of bromine in the three-month period ended September 30, 2015 compared to the same period in 2014.
Crude salt segment
Income from operations from our crude salt segment was $351,251 for the three-month period ended September 30, 2015, an increase of $783,152 compared to the same period in 2014. Loss from operations from our crude salt segment was $431,901 for the three-month period ended September 30, 2014. This increase resulted primarily from the increase in selling price of crude salt.
Chemical products segment
Income from operations from our chemical products segment was $8,393,184 for the three-month period ended September 30, 2015, an increase of $4,231,373 (or approximately 102%) compared to the same period in 2014. This significant increase was primarily due to the consolidation in 2015 of SCRC, which contributed $4,006,865 to our income from operation for the three-month period ended September 30, 2015.
Other Income. Net Other income, net of $66,636 represented bank interest income, net of capital lease interest expense for the three -month period ended September 30, 2015, a decrease of $10,039 (or approximately 13%) as compared to the same period in 2014.
Net Income. Net income was $10,679,422 for the three-month period ended September 30, 2015, an increase of $5,641,019 (or approximately 112%) compared to the same period in 2014. This significant increase was primarily attributable to the consolidation in 2015 of SCRC, which contributed $3,003,994 to our net income for the three-month period ended September 30, 2015.
Effective Tax Rate. Our effective tax rate for the three-month period ended September 30, 2015 and 2014 was 24% and 26%, respectively. The effective tax rate of 24% for the three-month period ended September 30, 2015 differs from the PRC statutory income tax rate of 25% mainly due to non-taxable item in connection with the unrealized exchange gain for the Company (contributed 1% gap). The effective tax rate of 26% for the three-month period ended September 30, 2014 differs from the PRC statutory income tax rate of 25% due to the change in valuation allowance set up against US federal net operating loss incurred by the Company.
Comparison of the Nine-Month Period Ended September 30, 2015 and 2014
|
Nine-Month
Period Ended
September 30, 2015
|
Nine-Month
Period Ended
September 30, 2014
|
% Change
|
||||||||||
|
Net revenue
|
$ | 126,862,497 | $ | 88,451,954 | 43 | % | ||||||
|
Cost of net revenue
|
$ | (84,761,554 | ) | $ | (63,202,383 | ) | 34 | % | ||||
|
Gross profit
|
$ | 42,100,943 | $ | 25,249,571 | 67 | % | ||||||
|
Sales, marketing and other operating expenses
|
$ | (294,095 | ) | $ | (78,793 | ) | 273 | % | ||||
|
Research and development costs
|
$ | (181,108 | ) | $ | (94,323 | ) | 92 | % | ||||
|
Exploration cost
|
$ | (325,840 | ) | - | - | |||||||
|
Loss from disposal of property, plant and equipment
|
$ | - | (9,866 | ) | (100 | %) | ||||||
|
Write-off/Impairment on property, plant and equipment
|
$ | (819,701 | ) | $ | (673,705 | ) | 22 | % | ||||
|
General and administrative expenses
|
$ | (5,247,318 | ) | $ | (4,916,626 | ) | 7 | % | ||||
|
Other operating income
|
$ | 342,317 | $ | 351,547 | (3 | %) | ||||||
|
Income from operations
|
$ | 35,575,198 | $ | 19,827,805 | 79 | % | ||||||
|
Other income, net
|
$ | 199,913 | $ | 197,181 | 1 | % | ||||||
|
Income before taxes
|
$ | 35,775,111 | $ | 20,024,986 | 79 | % | ||||||
|
Income taxes
|
$ | (9,005,158 | ) | $ | (5,035,433 | ) | 79 | % | ||||
|
Net income
|
$ | 26,769,953 | $ | 14,989,553 | 79 | % | ||||||
Net revenue. Net revenue for nine-month period ended September 30, 2015 was $126,862,497, representing an increase of approximately $38.4 million (or 43%) over the same period in 2014. This increase was primarily attributable to the consolidation in 2015 of SCRC, which collectively contributed $40,418,261 to our net revenue for the nine-month period ended September 30, 2015.
Revenue from the bromine products segment decreased from $43,950,056 for the nine-month period ended September 30, 2014 to $41,066,776 for the same period in 2015, a decrease of approximately 7%. Revenue from the crude salt segment decreased from $$8,012,368 for the nine-month period ended September 30, 2014 to $7,905,274 for the same period in 2015, a decrease of approximately 1%.
|
Net Revenue by Segment
|
||||||||||||||||||||
|
Nine-Month Period Ended
|
Nine-Month Period Ended
|
Percent
Increase/(Decrease)
|
||||||||||||||||||
|
September 30, 2015
|
September 30, 2014
|
of Net Revenue
|
||||||||||||||||||
|
Segment
|
% of total
|
% of total
|
||||||||||||||||||
|
Bromine
|
$
|
41,066,776
|
32
|
%
|
$
|
43,950,056
|
50
|
%
|
(7
|
%)
|
||||||||||
|
Crude Salt
|
$
|
7,905,274
|
6
|
%
|
$
|
8,012,368
|
9
|
%
|
(1
|
%)
|
||||||||||
|
Chemical Products
|
$
|
77,890,447
|
62
|
%
|
$
|
36,489,530
|
41
|
%
|
113
|
%
|
||||||||||
|
Total sales
|
$
|
126,862,497
|
100
|
%
|
$
|
88,451,954
|
100
|
%
|
43
|
%
|
||||||||||
|
Bromine and crude salt segments
|
Nine-Month Period Ended
|
Percentage Change
|
||||||||||
|
product sold in tonnes
|
September 30, 2015
|
September 30, 2014
|
Decrease
|
|||||||||
|
Bromine (excluded volume sold to SYCI and
SCRC after acquisition in January 2015)
|
13,148
|
15,199
|
(13
|
%)
|
||||||||
|
Crude Salt
|
244,367
|
248,134
|
(2
|
%)
|
||||||||
|
Nine-Month Period Ended
|
Percentage Change
|
|||||||||||
|
Chemical products segment sold in tonnes
|
September 30, 2015
|
September 30, 2014
|
Increase/(Decrease)
|
|||||||||
|
Oil and gas exploration additives
|
11,122
|
11,062
|
0.5
|
%
|
||||||||
|
Paper manufacturing additives
|
3,217
|
3,173
|
1.4
|
%
|
||||||||
|
Pesticides manufacturing additives
|
2,438
|
2,503
|
(2.6
|
%)
|
||||||||
|
Pharmaceutical intermediates
|
1,231
|
-
|
-
|
|||||||||
|
By products
|
9,514
|
-
|
-
|
|||||||||
|
Overall
|
27,522
|
16,738
|
64
|
%
|
||||||||
Bromine segment
The decrease in net revenue from our bromine segment was mainly due to the decrease in the sales volume of bromine. The sales volume of bromine decreased from 15,199 tonnes for the nine-month period ended September 30, 2014 to 13,148 tonnes for the same period in 2015, a decrease of 13%. The reasons for the decrease in the sales volume of bromine were mainly due to the continuing macro-economic tightening policy imposed by the PRC government beginning in the second half of 2011 to slow down the economy, which has affected our customers’ industries and the sale of bromine to SCRC in nine-month period ended September 30, 2015 excluded from the net revenue in the bromine segment as SCRC was acquired by us in January 2015.
The selling price of bromine increased from $2,892 per tonne for the nine-month period ended September 30, 2014 to $3,124 per tonnes for the same period in 2015, an increase of 8%. We expect the average selling price of bromine to remain at current levels through the end of 2015 should the PRC government’s macro-economic tightening policy remain in place. The table below shows the changes in the average selling price and changes in the sales volume of bromine for the nine-month period ended September 30, 2015 from the same period in 2014.
|
Nine-Month Period
Ended September 30,
|
||||
|
Increase/(Decrease) in net revenue of bromine as a result of:
|
2015 vs. 2014
|
|||
|
Increase in average selling price
|
$
|
3,287,044
|
||
|
Decrease in sales volume
|
$
|
(6,170,324
|
)
|
|
|
Total effect on net revenue of bromine
|
$
|
(2,883,280
|
)
|
|
Crude salt segment
The decrease in net revenue from our crude salt segment was mainly due to the decrease in the sales volume. The sales volume of bromine decreased from 248,134 tonnes for the nine-month period ended September 30, 2014 to 244,367 tonnes for the same period in 2015, a decrease of 2%. The decrease in the sales volume was mainly due to the macro-economic tightening policy imposed by the PRC government to slow down the economy, which has affected our customers’ industries.
The table below shows the changes in the average selling price and changes in the sales volume of crude salt for nine-month period ended September 30, 2015 from the same period in 2014.
|
Nine-Month Period
Ended September 30,
|
||||
|
Increase /(Decrease) in net revenue of crude salt as a result of:
|
2015 vs. 2014
|
|||
|
Increase in average selling price
|
$
|
14,660
|
||
|
Decrease in sales volume
|
$
|
(121,754
|
)
|
|
|
Total effect on net revenue of crude salt
|
$
|
(107,094
|
)
|
|
Chemical products segment
|
Product Mix of Chemical Products Segment
|
Percent
|
|||||||||||||||||||
|
Nine-Month Period Ended
|
Nine-Month Period Ended
|
Change of
|
||||||||||||||||||
|
September 30, 2015
|
September 30, 2014
|
Net Revenue
|
||||||||||||||||||
|
Chemical Products
|
% of total
|
% of total
|
||||||||||||||||||
|
Oil and gas exploration additives
|
$
|
21,484,864
|
27
|
%
|
$
|
20,848,777
|
57
|
%
|
3
|
%
|
||||||||||
|
Paper manufacturing additives
|
$
|
3,839,123
|
5
|
%
|
$
|
3,643,637
|
10
|
%
|
5
|
%
|
||||||||||
|
Pesticides manufacturing additives
|
$
|
12,148,198
|
16
|
%
|
$
|
11,997,116
|
33
|
%
|
1
|
%
|
||||||||||
|
Pharmaceutical intermediates
|
$
|
28,882,132
|
37
|
%
|
$
|
-
|
-
|
-
|
||||||||||||
|
By products
|
$
|
11,536,130
|
15
|
%
|
$
|
-
|
-
|
-
|
||||||||||||
|
Total sales
|
$
|
77,890,447
|
100
|
%
|
$
|
36,489,530
|
100
|
%
|
113
|
%
|
||||||||||
Net revenue from our chemical products segment increased from $36,489,530 for the nine-month period ended September 30, 2014 to $77,890,447 for the same period in 2015, an increase of approximately 113%. This increase was primarily attributable to the consolidation in 2015 of SCRC, which collectively contributed $40,418,261 to our revenue for the nine-month period ended September 30, 2015. Net revenue from our oil and gas exploration chemicals contributed $21,484,864 (or 27%) and $20,848,777 (or 57%) of our chemical segment revenue for the nine-month period ended September 30, 2015 and 2014, respectively, with an increase of $636,087, or 3%. Net revenue from our paper manufacturing additives increased from $3,643,637 for the nine-month period ended September 30, 2014 to $3,839,123 for the same period in 2015, an increase of approximately 5%. Net revenue from our pesticides manufacturing additives increased from $11,997,116 for the nine-month period ended September 30, 2014 to $12,148,198 for the same period in 2015, an increase of approximately 1%.
The table below shows the changes in the average selling price and changes in the sales volume of major chemical products for nine-month period ended September 30, 2015 from the same period in 2014 (excluding SCRC).
|
Increase / (Decrease) in net revenue,
for the nine-month period ended September 30,
2015 vs. 2014, as a result of:
|
Oil and gas exploration additives
|
Paper manufacturing additives
|
Pesticides manufacturing additives
|
Total
|
||||||||||||
|
Increase in average selling price
|
$
|
521,593
|
$
|
143,968
|
$
|
468,800
|
$
|
1,134,361
|
||||||||
|
Increase/(Decrease) in sales volume
|
$
|
114,494
|
$
|
51,518
|
$
|
(317,719
|
)
|
$
|
(151,707
|
)
|
||||||
|
Total effect on net revenue of chemical products
|
$
|
636,087
|
$
|
195,486
|
$
|
151,081
|
$
|
982,654
|
||||||||
Cost of Net Revenue.
|
Cost of Net Revenue by Segment
|
% Change
|
|||||||||||||||||||
|
Nine-Month Period Ended
|
Nine-Month Period Ended
|
of Cost of
|
||||||||||||||||||
|
September 30, 2015
|
September 30, 2014
|
Net Revenue
|
||||||||||||||||||
|
Segment
|
% of total
|
% of total
|
||||||||||||||||||
|
Bromine
|
$ | 28,257,737 | 33 | % | $ | 32,606,253 | 52 | % | (13 | %) | ||||||||||
|
Crude Salt
|
$ | 6,586,716 | 8 | % | $ | 7,172,556 | 11 | % | (8 | %) | ||||||||||
|
Chemical Products
|
$ | 49,917,101 | 59 | % | $ | 23,423,574 | 37 | % | 113 | % | ||||||||||
|
Total
|
$ | 84,761,554 | 100 | % | $ | 63,202,383 | 100 | % | 34 | % | ||||||||||
Cost of net revenue reflects mainly the raw materials consumed and the direct salaries and benefits of staff engaged in the production process, electricity, depreciation and amortization of manufacturing plant and machinery and other manufacturing costs. Our cost of net revenue was $84,761,554 for nine-month period ended September 30, 2015, an increase of $21,559,171 (or 34%) over the same period in 2014. This increase was primarily attributable to the consolidation in 2015 of SCRC, which collectively contributed $25,994,506 to our cost of net revenue for the nine-month period ended September 30, 2015.
Bromine production capacity and utilization of our factories
The table below represents the annual capacity and utilization ratios for all of our bromine producing properties:
|
Annual Production Capacity (in tonnes)
|
Utilization
Ratio (i)
|
|||||||
|
Nine-month period ended September 30, 2014
|
47,347
|
45%
|
||||||
|
Nine-month period ended September 30, 2015
|
47,347
|
43%
|
||||||
|
Variance of the nine-month period ended September 30, 2015 and 2014
|
-
|
(2%
|
)
|
|||||
(i) Utilization ratio is calculated based on the annualized actual production volume in tonnes for the period divided by the annual production capacity in tonnes.
Our utilization ratio decreased by 2% for the nine-month period ended September 30, 2015 as compared with the same period in 2014.
Bromine segment
For the nine-month period ended September 30, 2015, the cost of net revenue for the bromine segment was $28,257,737, a decrease of $4,348,516 or 13% over the same period in 2014. The most significant components of the costs of net revenue for the bromine segment were the cost of raw materials and finished goods consumed of $9,768,303 (or 35%), depreciation and amortization of manufacturing plant and machinery of $12,841,167 (or 45%) and electricity of $2,387,390 (or 8%) for the nine-month period ended September 30, 2015. For the nine-month period ended September 30, 2014, the major components of the cost of net revenue were the cost of raw materials and finished goods consumed of $13,623,872 (or 42%), depreciation and amortization of manufacturing plant and machinery of $12,674,236 (or 39%) and electricity of $2,528,684 (or 8%). The cost structure changed as compared with the same period in 2014 where the contribution from cost of raw materials and finished goods consumed decreased by 7% and depreciation and amortization of manufacturing plant and machinery increased by 6%. The decrease in net cost of net revenue was attributable mainly to the decrease in volume of products sold and an inter-company elimination adjustment related to the sale of bromine to SCRC in the nine-month period ended September 30, 2015 allocated to the bromine segment whereas there is no such adjustment in the same period in 2014 as SCRC was acquired by us in January 2015.
|
Per tonne production cost
|
Nine-Month Period Ended
|
Nine-Month Period Ended
|
||||||||||||||||||
|
component of bromine segment
|
September 30, 2015
|
September 30, 2014
|
% Change
|
|||||||||||||||||
|
% of total
|
% of total
|
|||||||||||||||||||
|
Raw materials
|
$
|
1,061
|
47
|
%
|
$
|
1,002
|
46
|
%
|
6
|
%
|
||||||||||
|
Depreciation and amortization
|
$
|
845
|
37
|
%
|
$
|
790
|
36
|
%
|
7
|
%
|
||||||||||
|
Electricity
|
$
|
157
|
7
|
%
|
$
|
158
|
7
|
%
|
(1
|
%)
|
||||||||||
|
Others
|
$
|
215
|
9
|
%
|
$
|
235
|
11
|
%
|
(9
|
%)
|
||||||||||
|
Production cost of bromine per tonne
|
$
|
2,278
|
100
|
%
|
$
|
2,185
|
100
|
%
|
4
|
%
|
||||||||||
Our production cost of bromine per tonne was $2,278 for the nine-month period ended September 30, 2015, an increase of 4% (or $93) over the same period in 2014.
Crude salt segment
For the nine-month period ended September 30, 2015, the cost of net revenue for our crude salt segment was $6,586,716, representing a decrease of $585,840, or 8%, compared to $7,172,556 for the same period in 2014. The decrease in cost was mainly due to the decrease in volume of crude salt sold and unit production cost. The significant cost components for the nine-month period ended September 30, 2015 were depreciation and amortization of $4,650,209 (or 71%), resource taxes calculated based on crude salt sold of $791,553 (or 12%) and electricity of $456,026 (or 7%). The significant cost components for the nine-month period ended September 30, 2014 were depreciation and amortization of $4,953,782 (or 69%), resource taxes calculated based on crude salt sold of $807,291 (or 11%) and electricity of $524,401 (or 7%).. The table below represents the major production cost component of crude salt per ton for respective periods:
|
Per tonne production cost
|
Nine-Month Period Ended
|
Nine-Month Period Ended
|
||||||||||||||||||
|
component of crude salt segment
|
September 30, 2015
|
September 30, 2014
|
% Change
|
|||||||||||||||||
|
% of total
|
% of total
|
|||||||||||||||||||
|
Depreciation and amortization
|
$
|
19.0
|
70
|
%
|
$
|
20.0
|
69
|
%
|
(5
|
%)
|
||||||||||
|
Resource tax
|
$
|
3.2
|
12
|
%
|
$
|
3.2
|
11
|
%
|
-
|
|||||||||||
|
Electricity
|
$
|
1.9
|
7
|
%
|
$
|
2.1
|
7
|
%
|
(10
|
%)
|
||||||||||
|
Others
|
$
|
2.9
|
11
|
%
|
$
|
3.6
|
13
|
%
|
(19
|
%)
|
||||||||||
|
Production cost of crude salt per tonne
|
$
|
27.0
|
100
|
%
|
$
|
28.9
|
100
|
%
|
(7
|
%)
|
||||||||||
Our production cost of crude salt per tonne was $27.0 for the nine-month period ended September 30, 2015, a decrease of 7% (or $1.9) as compared to the same period in 2014.
Chemical products segment
For the nine-month period ended September 30, 2015, cost of net revenue for our chemical products segment was $49,917,101, representing an increase of $26,493,527 or 113% over the same period in 2014. This increase was primarily attributable to the consolidation in 2015 of SCRC, which collectively contributed $25,994,506 to our cost of net revenue for the nine-month period ended September 30, 2015.
Gross Profit. Gross profit was $42,100,943, or 33%, of net revenue for nine-month period ended September 30, 2015 compared to $25,249,571, or 29%, of net revenue for the same period in 2014. The increase in gross profit percentage was primarily attributable to an increase in the margin percentage of bromine.
.
|
Gross Profit by Segment
|
% Point Change
|
|||||||||||||||||||
|
Nine-Month Period Ended
|
Nine-Month Period Ended
|
of Gross
|
||||||||||||||||||
|
September 30, 2015
|
September 30, 2014
|
Profit Margin
|
||||||||||||||||||
|
Segment
|
Gross Profit Margin
|
Gross Profit Margin
|
||||||||||||||||||
|
Bromine
|
$
|
12,809,039
|
31
|
%
|
$
|
11,343,803
|
26
|
%
|
5
|
%
|
||||||||||
|
Crude Salt
|
$
|
1,318,558
|
17
|
%
|
$
|
839,812
|
10
|
%
|
7
|
%
|
||||||||||
|
Chemical Products
|
$
|
27,973,346
|
36
|
%
|
$
|
13,065,956
|
36
|
%
|
-
|
|||||||||||
|
Total Gross Profit
|
$
|
42,100,943
|
33
|
%
|
$
|
25,249,571
|
29
|
%
|
4
|
%
|
||||||||||
Bromine segment
The gross profit margin for our bromine segment for the nine-month period ended September 30, 2015 was 31% compared to 26% for the same period in 2015. This 5% increase is mainly due to the increase in bromine price.
Crude salt segment
For the nine-month period ended September 30, 2015, the gross profit margin for our crude salt segment was 17% compared to 10% for the same period in 2014. This 7% increase in our gross profit margin is mainly attributable to the decreased cost of revenue for the for the nine-month period ended September 30, 2015 compare for the same period in 2014 as mentioned in the cost of net revenue for our crude salt segment.
Chemical products segment
The gross profit margin for our chemical products segment for the nine-month period ended September 30, 2015 was 36% compared to 36% for the same period in 2014.
Research and Development Costs. For the nine-month period ended September 30, 2015 and 2014, the total research and development costs incurred were $181,108 and $94,323, respectively, an increase of 92%. Research and development costs for the nine-month period ended September 30, 2015 represented raw materials used by SYCI and SCRC for testing the manufacturing routine. Research and development costs for the nine-month period ended September 30, 2014 represented raw materials used by SYCI for testing the manufacturing routine.
Exploration Costs The total exploration costs incurred for the nine-month periods ended September 30, 2015 and 2014 were $325,840 and $0. As of September 30, 2015 the Company incurred a total of $7,848,873 in exploration cost for the drilling of natural gas resources. On January 30, 2015, the Company announced that it found natural gas resources under its bromine well in the Sichuan area and received a testing report in early May 2015 which confirmed the economics of the natural gas under this well. The Company is in discussion with the government about the natural gas trial production.
Write-off/Impairment on property, plant and equipment. Write-off on property, plant and equipment for the nine-month period ended September 30, 2015 and 2014 were $819,701 and $673,705, respectively, an increase of 22%. Write-off on property, plant and equipment of $673,705 for the nine-month period ended September 30, 2014 represented the write-off of certain protective shells to transmission pipelines and ducts replaced during the third phase enhancement project that started in August 2014 and completed in September 2014. Write-off on property, plant and equipment of $819,701 for the nine-month period ended September 30, 2015 represented the write-off of (i) certain protective shells to transmission pipelines and ducts replaced of $753,025 during the fourth phase enhancement project that started in August 2015 and completed in September 2015; and (ii) certain machinery and equipment replaced during the enhancement work to our bromine production facilities in Factory No. 11 of $66,676.
General and Administrative Expenses. General and administrative expenses were $5,247,318 for the nine-month period ended September 30, 2015, an increase of $330,692 (or 7%) as compared to $4,916,626 for the same period in 2014. This increase in general and administrative expenses was primarily due to (i) a non-cash expense related to stock options granted to employees increased from $30,000 for the nine-month period ended September 30,2014 to $353,300 for the same period of 2015; and (ii) audit fee incurred in the amount of $115,000 related to the audit of SCRC acquired in the nine-month period ended September 30, 2015; and (iii) consolidation in 2015 of SCRC, which accounted for $515,674 of our general and administrative expenses for the nine-month period ended September 30, 2015, which offset by the unrealized exchange gain in relation to the translation difference of inter-company balance in RMB for the nine-month period ended September 30,2015 amounted to $1,037,429, as compared to the unrealized exchange gain for the same period in 2014 amounted to $237,028.
Other Operating Income. Other operating income was $342,317 for the nine-month period ended September 30, 2015, a decrease of $9,230(or 3%) as compared to $351,547 for the same period in 2014 for sales of wastewater. Wastewater is generated from the production of bromine and eventually becomes crude salt when it evaporates. Not all of our bromine production plants have sufficient area on the property to allow for evaporation of wastewater to produce crude salt. Certain of our customers who have facilities located adjacent to our bromine production plants have agreed to allow us to channel our wastewater into brine pans on their properties for evaporation. These customers then are able to sell the resulting crude salt themselves. We signed agreements with four of our customers to sell them our wastewater at market prices.
Income from Operations. Income from operations was $35,575,198 for the nine-month period ended September 30, 2015 (or 28% of net revenue), an increase of $15,747,393, or approximately 79%, over income from operations for the same period in 2014. This increase was primarily attributable to the consolidation in 2015 of SCRC, which collectively contributed $13,606,012 to our income from operation for the nine-month period ended September 30, 2015.
|
Income from Operations by Segment
|
||||||||||||||||
|
Nine-Month Period Ended
September 30, 2015
|
Nine-Month Period Ended
September 30, 2014
|
|||||||||||||||
|
Segment:
|
% of total
|
% of total
|
||||||||||||||
|
Bromine
|
$ | 8,950,595 | 25.1 | % | $ | 7,748,981 | 38.8 | % | ||||||||
|
Crude Salt
|
534,760 | 1.5 | % | 94,609 | 0.5 | % | ||||||||||
|
Chemical Products
|
26,205,578 | 73.4 | % | 12,123,116 | 60.7 | % | ||||||||||
|
Income from operations before corporate costs
|
35,690,933 | 100 | % | 19,966,706 | 100 | % | ||||||||||
|
Corporate costs
|
(1,153,164 | ) | (375,929 | ) | ||||||||||||
|
Unrealized exchange difference
|
1,037,429 | 237,028 | ||||||||||||||
|
Income from operations
|
$ | 35,575,198 | $ | 19,827,805 | ||||||||||||
Bromine segment
Income from operations from our bromine segment was $8,950,595 for the nine-month period ended September 30, 2015, an increase of $1,201,614 (or approximately 16%) compared to the same period in 2014. This increase resulted primarily from the higher selling price of bromine in the nine-month period ended September 30, 2015 compared to the same period in 2014.
Crude salt segment
For the nine-month period ended September 30, 2015, income from operations from our crude salt segment was $534,760, an increase of $440,151 (or approximately 465%) compared to the same period in 2014. This increase is mainly attributable to the decreased cost of revenue for the for the nine-month period ended September 30, 2015 compare for the same period in 2014 as mentioned in the cost of net revenue for our crude salt segment.
Chemical products segment
For the nine-month period ended September 30, 2015, income from operations from our chemical products segment was $26,205,578, an increase of $14,082,462 (or approximately 116%) over same period in 2014. This significant increase was primarily due to the consolidation in 2015 of SCRC, which contributed $13,606,012 to our income from operation for the nine-month period ended September 30, 2015.
Other Income, Net. Other income, net of $199,913 represented bank interest income, net of capital lease interest expense for the nine -month period ended September 30, 2015, an increase of $2,732 (or approximately 1%) as compared to the same period in 2014.
Net Income. Net income was $26,769,953 for the nine-month period ended September 30, 2015, an increase of $11,780,400 (or approximately 79%) compared to the same period in 2014. This significant increase was primarily attributable to the consolidation in 2015 of SCRC, which contributed $10,202,563 to our net income for the nine-month period ended September 30, 2015, offset by the decrease in revenue from bromine and crude salt as compared with the same period in 2014.
Effective Tax Rate. Our effective tax rate for the nine-month period ended September 30, 2015 and 2014 was 25% and 25%, respectively. The effective tax rate of 25% for the nine-month period ended September 30, 2015 consistent with the PRC statutory income tax rate.
LIQUIDITY AND CAPITAL RESOURCES
As of September 30, 2015, cash and cash equivalents were $120,892,138 as compared to $146,585,601 as of December 31, 2014. The components of this decrease of $25,693,463 are reflected below.
Statement of Cash Flows
|
Nine-Month Period Ended September 30,
|
||||||||
|
2015
|
2014
|
|||||||
|
Net cash provided by operating activities
|
$
|
34,915,819
|
$
|
32,476,141
|
||||
|
Net cash used in investing activities
|
$
|
(55,706,715
|
)
|
$
|
(7,101,842
|
)
|
||
|
Net cash used in financing activities
|
$
|
(344,396
|
)
|
$
|
(304,806
|
)
|
||
|
Effects of exchange rate changes on cash and cash equivalents
|
$
|
(4,558,171
|
)
|
$
|
(1,031,745
|
)
|
||
|
Net (Decrease)/Increase in cash and cash equivalents
|
$
|
(25,693,463
|
)
|
$
|
24,037,748
|
|||
For the nine-month period ended September 30, 2015, we met our working capital and capital investment requirements mainly by using cash flow from operations and cash on hand.
Net Cash Provided by Operating Activities
During the nine-month period ended September 30, 2015 and 2014, we had positive cash flow from operating activities of $34.9 million and $32.5 million, respectively, primarily attributable to net income.
During the nine-month period ended September 30, 2015, cash flow from operating activities of $34.9 million exceeded our net income of $26.8 million, mainly due to (i) substantial non-cash charges of $22.7 million, primarily in the form of depreciation and amortization of property, plant and equipment, and write-off/impairment loss on property, plant and equipment; partially offset by (ii) cash used in working capital of $14.5 million, which mainly consisted of an increase in accounts receivable and inventories, partially offset by the increase in taxes payable.
During the nine-month period ended September 30, 2014, cash flow from operating activities of $32.5 million exceeded our net income of $15.0 million, mainly due to (i) substantial non-cash charges of $21.7 million, primarily in the form of depreciation and amortization of property, plant and equipment, and write-off/impairment loss on property, plant and equipment; partially offset by (ii) cash used in working capital of $4.2 million, which mainly consisted of an increase in accounts receivable and decrease in tax payable, partially offset by the increase in accounts payable and accrued expenses.
Accounts receivable
Cash collections on our accounts receivable had a major impact on our overall liquidity. The following table presents the aging analysis of our accounts receivable as of September 30, 2015 and December 31, 2014.
|
September 30, 2015
|
December 31, 2014
|
|||||||||||||||
|
% of total
|
% of total
|
|||||||||||||||
|
Aged 1-30 days
|
$
|
13,279,701
|
17
|
%
|
$
|
9,323,910
|
22
|
%
|
||||||||
|
Aged 31-60 days
|
$
|
16,395,061
|
22
|
%
|
$
|
9,974,381
|
24
|
%
|
||||||||
|
Aged 61-90 days
|
$
|
17,673,585
|
24
|
%
|
$
|
8,631,203
|
20
|
%
|
||||||||
|
Aged 91-120 days
|
$
|
15,711,637
|
22
|
%
|
$
|
9,188,133
|
22
|
%
|
||||||||
|
Aged 121-150 days
|
$
|
10,111,489
|
14
|
%
|
$
|
4,880,235
|
12
|
%
|
||||||||
|
Aged 151-180 days
|
$
|
1,108,414
|
1
|
%
|
$
|
|||||||||||
|
Total
|
$
|
74,279,887
|
100
|
%
|
$
|
41,997,862
|
100
|
%
|
||||||||
The overall accounts receivable balance as of September 30, 2015 increased by $32,282,025 (or 77%), as compared to those as of December 31, 2014. Such increase was mainly due to the consolidation in 2015 of SCRC, which contributed $23,601,224 to our accounts receivable for September 30, 2015. Approximately 69% of the balances of accounts receivable as of September 30, 2015 aged more than 90 days was settled in October 2015. We have policies in place to ensure that sales are made to customers with an appropriate credit history and we perform ongoing credit evaluation on the financial condition of our customers. No allowance for doubtful debts for the nine-month period ended September 30, 2015 is required.
Inventory
Our inventory consists of the following:
|
September 30, 2015
|
December 31, 2014
|
|||||||||||||||
|
% of total
|
% of total
|
|||||||||||||||
|
Raw materials
|
$
|
1,022,750
|
13.88
|
%
|
$
|
625,160
|
11.7
|
%
|
||||||||
|
Finished goods
|
$
|
5,247,548
|
71.20
|
%
|
$
|
4,746,163
|
88.4
|
%
|
||||||||
|
Work-in-process
|
1,103,076
|
14.97
|
%
|
-
|
-
|
|||||||||||
|
$
|
7,373,374
|
100.05
|
%
|
$
|
5,371,323
|
100.1
|
%
|
|||||||||
|
Allowance for obsolete and slowing-moving inventory
|
$
|
(3,323
|
)
|
(0.05
|
%)
|
$
|
(3,455
|
)
|
(0.1
|
%)
|
||||||
|
Total
|
$
|
7,370,051
|
100.0
|
%
|
$
|
5,367,868
|
100.0
|
%
|
||||||||
The net inventory level as of September 30, 2015 increased by $2,002,183 (or 37%), as compared to the net inventory level as of December 31, 2014.
Raw materials increase by 64% as of September 30, 2015 as compared to December 31, 2014. All of the raw materials are basic chemical industry materials, few of which have a possibility of loss over time, or major fluctuations in their prices. We concluded that all of our raw materials as of September 30, 2015 are fully realizable for production of finished goods without any impairment.
Our finished goods consist of bromine, crude salt and chemical products. Our chemical products are similar to raw materials, with no loss over time, a stable market price and a gross profit margin of 36% for the nine-month period ended September 30, 2015 as compared to 36% for the same period in fiscal year 2014. Therefore, we believe that the realization of the chemical products is 100%. Similarly, as there is no depletion of bromine, we believe that the realization of it is also 100%. The gross profit margin for the nine-month period ended September 30, 2015 increased to 31%, as compared with 25% for the same period in fiscal year 2014, we anticipated that the price for the rest of 2015 will not fluctuate significantly to impair the cost of bromine.
The annual loss of crude salt due to evaporation is approximately 3%. The average selling price of crude salt per tonne increased from $27.88 in the third quarter of 2014 to $33.26 in the third quarter of 2015. In the same period, gross profit also increased from 10% for the nine –month period ended September 30, 2014 to 17% for the same period in 2015. We believe that there will be no realization problem for crude salt as we do not expect selling price to be lower than its cost.
Net Cash Used in Investing Activities
For the nine-month period ended September 30, 2015, we used approximately $0.7 million cash for the prepayment of land leases. We also used approximately $66.3 million to acquire SCRC. In the same period, we also used approximately $2.8 million cash in the fourth phase enhancement project related to the protective shells to transmission channels and ducts in Factory No. 10 and 11 and the enhancement work to bromine production facilities in Factory No.11.
We also received $14.1 million from the acquisition of SCRC.
In the nine-month period ended September 30, 2014, we used approximately $0.66 million cash for the prepayment of land leases. In the same period, we also used approximately $6.46 million cash in the third phase enhancement project related to the protective shells to transmission channels and ducts in Factory No. 10 and 11.
The investing activities described above were financed by opening cash balances as of December 31, 2014, and 2013, and cash generated from operation during the nine-month period ended September 30, 2015.
Net Cash Used in Financing Activities
We repaid approximately $0.3 million cash for our capital lease obligation for the nine-month period ended September 30, 2015 and 2014.
For the nine-month period ended September 30, 2015, we used $0.04 million to repurchase 31,000 shares of common stock of the Company with the approval of the Board of Directors.
We believe that our available funds and cash flows generated from operations will be sufficient to meet our anticipated ongoing operating needs for the next twelve (12) months.
Working capital was approximately $176.6 million at September 30, 2015 as compared to approximately $186.0 million at December 31, 2014. The decrease was mainly attributable to the cash paid for business acquisition of SCRC, which offset by the cash provided by operating activities during the nine-month period ended September 30, 2015.
We had available cash of approximately $120.9 million at September 30, 2015, most of which is in highly liquid current deposits which earn no or little interest. We intend to retain the cash for future expansion of our bromine and crude salt businesses through acquisition, enhancements to our existing bromine and crude salt business, and further development of the new resources in Sichuan Province.
In the future we intend to focus our efforts on the activities of SCHC, SYCI and SCRC as these segments continue to expand within the Chinese market.
We may not be able to identify, successfully integrate or profitably manage any businesses or business segment we may acquire, or any expansion of our business. An expansion may involve a number of risks, including possible adverse effects on our operating results, diversion of management attention, inability to retain key personnel, risks associated with unanticipated events and the financial statement effect of potential impairment of acquired intangible assets, any of which could have a materially adverse effect on our condition and results of operations. In addition, if competition for acquisition candidates or operations were to increase, the cost of acquiring businesses could increase materially. We may effect an acquisition with a target business which may be financially unstable, under-managed, or in its early stages of development or growth. In addition, if competition for acquisition candidates or operations were to increase, the cost of acquiring businesses could increase materially. Our inability to implement and manage our expansion strategy successfully may have a material adverse effect on our business and future prospects.
Contractual Obligations and Commitments
We have no significant contractual obligations not fully recorded on our condensed consolidated balance sheets or fully disclosed in the notes to our condensed consolidated financial statements. Additional information regarding our contractual obligations and commitments at September 30, 2015 is provided in the notes to our condensed consolidated financial statements. See “Notes to Condensed Consolidated Financial Statements, Note 19 – Capital Commitment and Operating Lease Commitments”.
Material Off-Balance Sheet Arrangements
We do not currently have any off balance sheet arrangements falling within the definition of Item 303(a) of Regulation S-K.
Critical Accounting Policies and Estimates
Our consolidated financial statements have been prepared in accordance with accounting principles generally accepted in the United States of America and this requires management to make estimates and assumptions that affect the reported amounts of assets and liabilities at the date of the consolidated financial statements and the reported amounts of revenues and expenses during the reporting period. We base these estimates on historical experience and on various other assumptions that are believed to be reasonable under the circumstances. Accordingly, actual results may differ significantly from these estimates under different assumptions or conditions. We have identified the following critical accounting policies and estimates used by us in the preparation of our financial statements: accounts receivable and allowance for doubtful accounts, assets retirement obligation, property, plant and equipment, recoverability of long lived assets, mineral rights, revenue recognition, income taxes, and stock-based compensation. These policies and estimates are described in the Company’s 2014 Form 10-K.
Pursuant to Item 305(e) of Regulation S-K (§ 229.305(e)), the Company is not required to provide the information required by this Item as it is a “smaller reporting company,” as defined by Rule 229.10(f)(1).
Item 4. Controls and Procedures
(a) Evaluation of Disclosure Controls and Procedures
We maintain disclosure controls and procedures (as such term is defined in Exchange Act Rules 13a-15(e) and 15d-15(e)) that are designed to ensure that information required to be disclosed in our reports filed pursuant to the Exchange Act is recorded, processed, summarized and reported within the time periods specified in the SEC’s rules, regulations and related forms, and that such information is accumulated and communicated to our management, including our Chief Executive Officer (“CEO”) and Chief Financial Officer (“CFO”), as appropriate, to allow timely decisions regarding required disclosure.
Under the supervision and with the participation of our management, including our CEO and CFO, we conducted an evaluation of the effectiveness of the design and operation of our disclosure controls and procedures as of the end of the period covered by this report. Based on this evaluation, our CEO and CFO concluded that our disclosure controls and procedures were effective as of the end of the period covered by this Form 10-Q.
(b) Changes in internal controls
There were no changes in our internal control over financial reporting (as such term is defined in Rules 13a-15(f) under the Exchange Act) during our most recently completed fiscal quarter, which is the subject of this report, that have materially affected, or are reasonably likely to materially affect, our internal control over financial reporting.
PART II—OTHER INFORMATION
Item 1. Legal Proceedings
None.
There have been no changes with respect to risk factors as previously disclosed in our 2014 Form 10-K. Investing in our common stock involves a high degree of risk. Before you invest you should carefully consider the risks and uncertainties described below and in our 2014 Form 10-K, under the caption “Risk Factors”, our Management’s Discussion and Analysis of Financial Condition and Results of Operations set forth in Item 2 of Part I of this Quarterly Report on Form 10-Q, our consolidated financial statements and related notes included in Item 1 of Part I of this Quarterly Report on Form 10-Q and our consolidated financial statements and related notes, as well as our Management’s Discussion and Analysis of Financial Condition and Results of Operations and the other information in our 2014 Form 10-K. Readers should carefully review those risks, as well as additional risks described in other documents we file from time to time with the Securities and Exchange Commission.
Item 2. Unregistered Shares of Equity Securities and Use of Proceeds
None.
Item 3. Defaults Upon Senior Securities
None.
Item 4. Mine Safety Disclosures
Not applicable.
Item 5. Other Information
None.
Item 6. Exhibits
|
Exhibit No.
|
Description
|
|
31.1
|
Certification of Chief Executive Officer pursuant to Rule 13a-14(a) and 15d-14(a), as adopted pursuant to Section 302 of the Sarbanes-Oxley Act of 2002.
|
|
31.2
|
Certification of Chief Financial Officer pursuant to Rule 13a-14(a) and 15d-14(a), as adopted pursuant to Section 302 of the Sarbanes-Oxley Act of 2002.
|
|
32.1
|
Certification pursuant to 18 U.S.C. Section 1350, as adopted pursuant to Section 906 of the Sarbanes-Oxley Act of 2002.
|
|
101.1
|
The following financial statements from Gulf Resources, Inc.’s Quarterly Report on Form 10-Q for the quarterly period ended September 30, 2014 formatted in XBRL (eXtensible Business Reporting Language): (i) the Consolidated Balance Sheets; (ii) the Consolidated Statements of Operations and Other Comprehensive Income (Loss); (iii) the Consolidated Statements of Changes in Equity; (iv) the Consolidated Statement of Cash Flows; and, (v) the Notes to Consolidated Financial Statements, tagged as blocks of text.
|
Pursuant to the requirements of Section 13 or 15(d) of the Securities Exchange Act of 1934, the registrant has duly caused this report to be signed on its behalf by the undersigned, thereunto duly authorized.
|
GULF RESOURCES, INC.
|
||
|
Dated: November 10, 2015
|
By:
|
/s/ Xiaobin Liu
|
|
Xiaobin Liu
|
||
|
Chief Executive Officer
|
||
|
(principal executive officer)
|
||
|
Dated: November 10, 2015
|
By:
|
/s/ Min Li
|
|
Min Li
|
||
|
Chief Financial Officer
|
||
|
(principal financial and accounting officer)
|
||