Attached files
| file | filename |
|---|---|
| 8-K - ANNUAL PRESENTATION 2018 - Oritani Financial Corp | annualpresentation.htm |

Annual MeetingNovember 20, 2018

2 Forward-Looking Statements This presentation contains forward-looking statements, which can be identified by the use of words such as “estimate,” “project,” “believe,” “intend,” “anticipate,” “plan,” “seek,” “expect” and words of similar meaning. These forward-looking statements include, but are not limited to: statements of our goals, intentions and expectations; statements regarding our business plans, prospects, growth and operating strategies; statements regarding the asset quality of our loan and investment portfolios; and estimates of our risks and future costs and benefits.These forward-looking statements are based on current beliefs and expectations of our management and are inherently subject to significant business, economic and competitive uncertainties and contingencies, many of which are beyond our control. In addition, these forward-looking statements are subject to assumptions with respect to future business strategies and decisions that are subject to change.The following factors, among others, could cause actual results to differ materially from the anticipated results or other expectations expressed in the forward-looking statements:changes in laws or government regulations or policies affecting financial institutions, including changes in regulatory fees and capital requirements; general economic conditions, either nationally or in our market areas, that are worse than expected; estimates of our risks and future costs and benefits.competition among depository and other financial institutions; inflation and changes in the interest rate environment that reduce our margins or reduce the fair value of financial instruments;adverse changes in the securities markets; our ability to enter new markets successfully and capitalize on growth opportunities; our ability to successfully integrate acquired entities, if any; changes in consumer spending, borrowing and savings habits; changes in our organization, compensation and benefit plans;our ability to continue to increase and manage our commercial and residential real estate, multi-family, and commercial and industrial loans;possible impairments of securities held by us, including those issued by government entities and government sponsored enterprises;the level of future deposit premium assessments;changes in the financial performance and/or condition of our borrowers; andthe effect of changes in accounting policies and practices, as may be adopted by the regulatory agencies, as well as the Securities and Exchange Commission, the Public Company Accounting Oversight Board, the Financial Accounting Standards Board and other accounting standard setters.Because of these and other uncertainties, our actual future results may be materially different from the results indicated by these forward-looking statements.
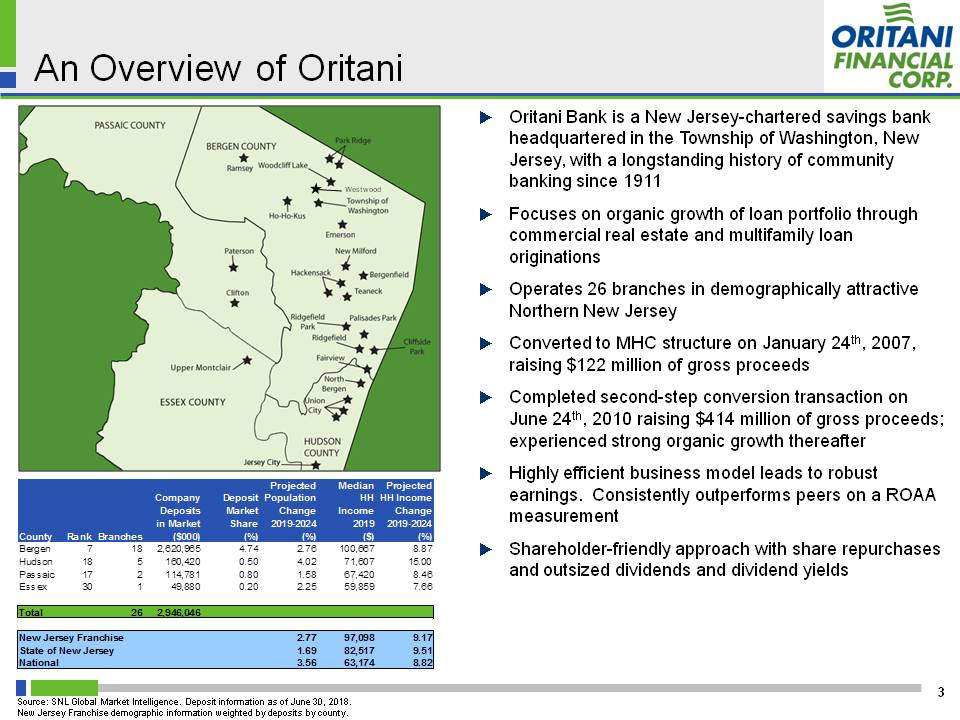
An Overview of Oritani 3 Oritani Bank is a New Jersey-chartered savings bank headquartered in the Township of Washington, New Jersey, with a longstanding history of community banking since 1911Focuses on organic growth of loan portfolio through commercial real estate and multifamily loan originationsOperates 26 branches in demographically attractive Northern New JerseyConverted to MHC structure on January 24th, 2007, raising $122 million of gross proceedsCompleted second-step conversion transaction on June 24th, 2010 raising $414 million of gross proceeds; experienced strong organic growth thereafterHighly efficient business model leads to robust earnings. Consistently outperforms peers on a ROAA measurementShareholder-friendly approach with share repurchases and outsized dividends and dividend yields Source: SNL Global Market Intelligence. Deposit information as of June 30, 2018.New Jersey Franchise demographic information weighted by deposits by county. Westwood
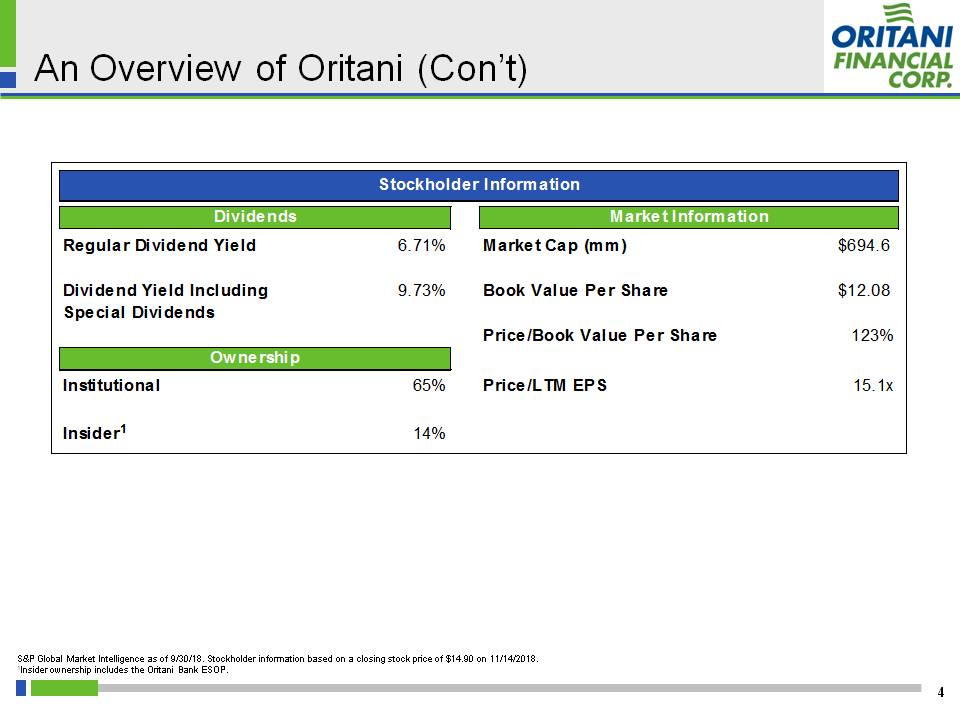
An Overview of Oritani (Con’t) 4 S&P Global Market Intelligence as of 9/30/18. Stockholder information based on a closing stock price of $14.90 on 11/14/2018.1Insider ownership includes the Oritani Bank ESOP.

An Overview of Key Metrics 5 Includes the impact of special dividends. Financial data is presented for Oritani’s Fiscal Year Ended June 30 for each respective year.

Where We Have Been 6 Since the completion of our second step transaction, we have executed the business plan we communicated to shareholdersOrganic growth of the loan portfolioCapital management primarily through growth, share repurchases and dividendsStrong profitability and returns

Loan Growth 7 Oritani’s focus on commercial real estate and multifamily loans has been the Company’s primary source of growthThrough 2017, the Company consistently and significantly expanded its loan portfolioRecently, the market for profitable loan growth has been impacted by several factors and contracted Financial data is presented for Oritani’s Fiscal Year Ended June 30 for each respective year. Dollars in thousands.

Loan Geography 8 Oritani’s loan portfolio is concentrated in New York and New Jersey, and primarily within a 150 mile radius from our headquarters in Bergen County
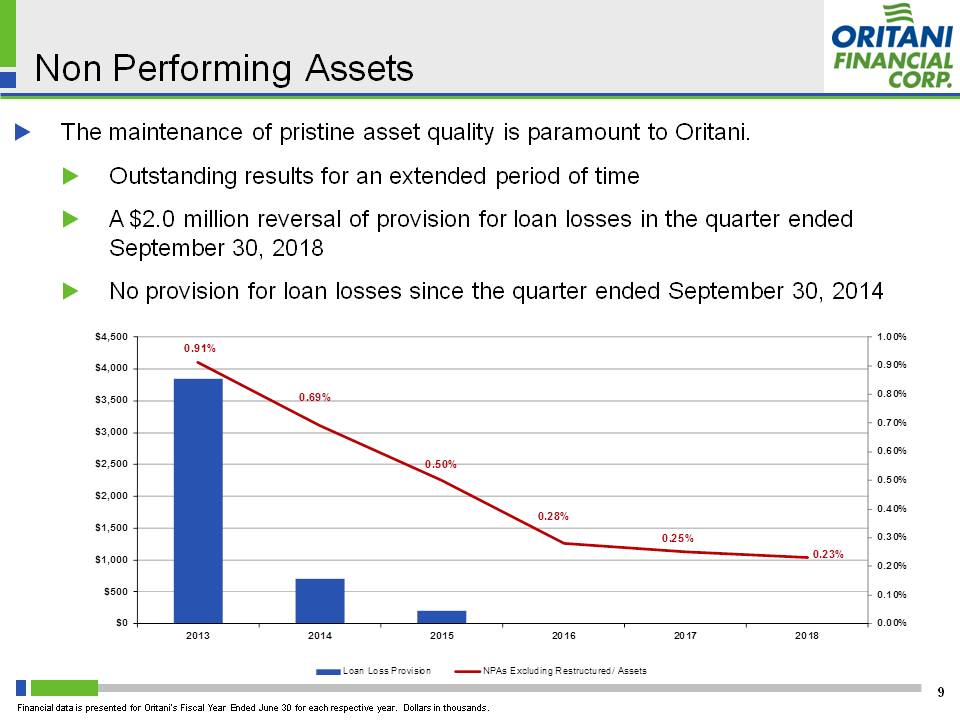
Non Performing Assets 9 The maintenance of pristine asset quality is paramount to Oritani.Outstanding results for an extended period of timeA $2.0 million reversal of provision for loan losses in the quarter ended September 30, 2018No provision for loan losses since the quarter ended September 30, 2014 Financial data is presented for Oritani’s Fiscal Year Ended June 30 for each respective year. Dollars in thousands.

Capital Deployment 10 Oritani continues to execute its strategic plan of capital deployment primarily through asset growth, share repurchases and dividends Share repurchases were used extensively through 2015 and have recently been rekindled.The Company continues to utilize a 100% dividend payout ratio. Financial data is presented for Oritani’s Fiscal Year Ended June 30 for each respective year. Dollars in thousands.

What We Delivered - ROAA Results vs. Peers 11 Financial data is presented for Oritani’s Fiscal Year Ended June 30 for each respective year. Peer group is detailed on page 18.
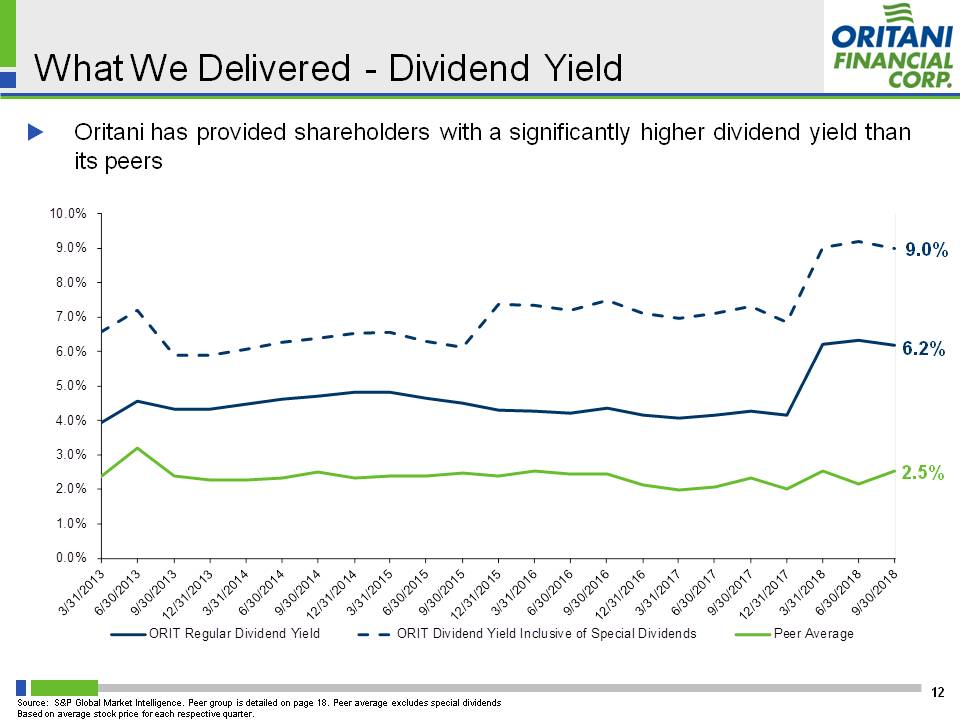
What We Delivered - Dividend Yield 12 Oritani has provided shareholders with a significantly higher dividend yield than its peers Source: S&P Global Market Intelligence. Peer group is detailed on page 18. Peer average excludes special dividendsBased on average stock price for each respective quarter. 2.5% 6.2% 9.0%

What You Can Expect 13 We have been pleased with the results achieved through the execution of our business plan. We intend to continue to execute this plan.Loan Growth: We are poised to return to our historical growth levels when the market normalizes.Net Interest Margin: Currently our NIM is pressured as deposits are repricing faster than assets. The situation may get worse before it gets better. However, as detailed on a succeeding chart we anticipate a significant portion of our loan portfolio will reprice up in rate in the near future.Expense Management: Our business plan will continue to facilitate our ability to operate at an enviable efficiency ratio and contribute significantly to profitability. See succeeding chart.Profitability: We believe our business plan will allow us to continue to generate strong earnings.Capital Management: Our interests are aligned with those of shareholders and we will operate the Company with the intention of maximizing shareholder value.

Continued Focus on Cost Control 14 Oritani has been keenly focused on controlling costs while growing top line revenues. This approach will not change. Financial data is presented for Oritani’s Fiscal Year Ended June 30 for each respective year. Peer group is detailed on page 18.

Opportunities Within the Loan Portfolio 15 Oritani’s lending practices continue to demonstrate discipline regarding interest rate risk. The vast majority of the portfolio will reprice or mature within 5 years, over half of the portfolio reprices within 3 years.The weighted average rate of the loans in both the “1 year or less” and “1 - 3 years” buckets are under current market rates and will provide the Company with an opportunity to increase loan interest income as the loans reprice or mature.

Disciplined Share Buybacks 16 The Company has opportunistically utilized share repurchases as a tool for capital deployment.Detailed in the table below is a summary of the Company’s repurchase activity.The Company continues to deploy this strategy. Of the 1,471,136 shares repurchased as part of Repurchase Plan IV, 1,130,923 were purchased between October 1, 2018 and to November 8, 2018.

QUESTIONS & ANSWERS

Appendix: Oritani Peer Data 18 Source: S&P Global Market Intelligence as of the most recent reported quarter.