Attached files
| file | filename |
|---|---|
| EX-32 - EXHIBIT 32 - GCP Applied Technologies Inc. | a2018q310-qexhibit32.htm |
| EX-31.2 - EXHIBIT 31.2 - GCP Applied Technologies Inc. | a2018q310-qexhibit312.htm |
| EX-31.1 - EXHIBIT 31.1 - GCP Applied Technologies Inc. | a2018q310-qexhibit311.htm |
UNITED STATES
SECURITIES AND EXCHANGE COMMISSION
WASHINGTON, D.C. 20549
FORM 10-Q
ý | QUARTERLY REPORT PURSUANT TO SECTION 13 OR 15(d) OF THE SECURITIES EXCHANGE ACT OF 1934 | |
For the Quarterly Period Ended September 30, 2018 | ||
OR | ||
o | TRANSITION REPORT PURSUANT TO SECTION 13 OR 15(d) OF THE SECURITIES EXCHANGE ACT OF 1934 | |
Commission File Number 1-137533 | ||
GCP Applied Technologies Inc.
Delaware (State of Incorporation) | 47-3936076 (I.R.S. Employer Identification No.) | |
62 Whittemore Avenue, Cambridge, Massachusetts 02140-1623
(617) 876-1400
(Address and phone number of principal executive offices)
Indicate by check mark whether the registrant (1) has filed all reports required to be filed by Section 13 or 15(d) of the Securities Exchange Act of 1934 during the preceding 12 months (or for such shorter period that the registrant was required to file such reports), and (2) has been subject to such filing requirements for the past 90 days. Yes ý No o
Indicate by check mark whether the registrant has submitted electronically every Interactive Data File required to be submitted pursuant to Rule 405 of Regulation S-T (§232.405 of this chapter) during the preceding 12 months (or for such shorter period that the registrant was required to submit and post such files).
Yes ý No o
Indicate by check mark whether the registrant is a large accelerated filer, an accelerated filer, a non-accelerated filer, a smaller reporting company, or an emerging growth company. See the definitions of "large accelerated filer," "accelerated filer," "smaller reporting company" and “emerging growth company” in Rule 12b-2 of the Exchange Act.
Large accelerated filer ý | Accelerated filer o | Non-accelerated filer o | Smaller reporting company o | Emerging growth company o | ||||
If an emerging growth company, indicate by check mark if the registrant has elected not to use the extended transition period for complying with any new or revised financial accounting standards provided pursuant to Section 13(a) of the Exchange Act. o
Indicate by check mark whether the registrant is a shell company (as defined in Rule 12b-2 of the Exchange Act). Yes o No ý
Indicate the number of shares outstanding of each of the issuer's classes of common stock, as of the latest practicable date.
Class | Outstanding at October 31, 2018 | |
Common Stock, $0.01 par value per share | 72,166,406 shares | |
TABLE OF CONTENTS | ||||
_______________________________________________________________________________
2
Presentation of Information
Unless the context requires otherwise, references to "GCP Applied Technologies Inc.", "GCP", "we", "us", "our" and "the Company" refer to GCP Applied Technologies Inc., and its consolidated subsidiaries for periods subsequent to its separation from W.R. Grace & Co. on February 3, 2016. For periods prior to February 3, 2016, these terms refer to the combined historical business and operations of W.R. Grace & Co.’s construction products and packaging technologies businesses as they were historically managed as part of W.R. Grace & Co. Unless the context requires otherwise, references to "Grace" refer to W.R. Grace & Co., and its consolidated subsidiaries, which is the Company’s former parent company. References in this Quarterly Report on Form 10-Q to the "Separation" refer to the legal separation and transfer of Grace’s construction products and packaging technologies businesses to the Company through a dividend distribution of all of the then-outstanding common stock of GCP to Grace shareholders on February 3, 2016.
3
PART I. FINANCIAL INFORMATION
Item 1. Financial Statements
GCP Applied Technologies Inc.
Consolidated Statements of Operations (unaudited)
Three Months Ended September 30, | Nine Months Ended September 30, | ||||||||||||||
(In millions, except per share amounts) | 2018 | 2017 | 2018 | 2017 | |||||||||||
Net sales | $ | 296.3 | $ | 282.4 | $ | 849.3 | $ | 794.9 | |||||||
Cost of goods sold | 185.9 | 175.9 | 539.7 | 488.1 | |||||||||||
Gross profit | 110.4 | 106.5 | 309.6 | 306.8 | |||||||||||
Selling, general and administrative expenses | 67.3 | 76.3 | 219.8 | 221.9 | |||||||||||
Research and development expenses | 5.2 | 5.2 | 15.4 | 15.2 | |||||||||||
Interest expense and related financing costs | 5.9 | 21.6 | 86.4 | 56.1 | |||||||||||
Repositioning expenses | 3.7 | 1.1 | 5.8 | 6.8 | |||||||||||
Restructuring expenses and asset impairments | 14.3 | 2.1 | 13.2 | 13.0 | |||||||||||
Loss in Venezuela | — | 36.7 | — | 38.3 | |||||||||||
Other income, net | (0.9 | ) | (4.0 | ) | (11.3 | ) | (6.6 | ) | |||||||
Total costs and expenses | 95.5 | 139.0 | 329.3 | 344.7 | |||||||||||
Income (loss) from continuing operations before income taxes | 14.9 | (32.5 | ) | (19.7 | ) | (37.9 | ) | ||||||||
(Provision for) benefit from income taxes | (7.6 | ) | 14.5 | (15.8 | ) | (3.7 | ) | ||||||||
Income (loss) from continuing operations | 7.3 | (18.0 | ) | (35.5 | ) | (41.6 | ) | ||||||||
Income from discontinued operations, net of income taxes | 18.2 | 677.3 | 26.7 | 679.4 | |||||||||||
Net income (loss) | 25.5 | 659.3 | (8.8 | ) | 637.8 | ||||||||||
Less: Net income attributable to noncontrolling interests | (0.1 | ) | (0.1 | ) | (0.3 | ) | (0.2 | ) | |||||||
Net income (loss) attributable to GCP shareholders | $ | 25.4 | $ | 659.2 | $ | (9.1 | ) | $ | 637.6 | ||||||
Amounts Attributable to GCP Shareholders: | |||||||||||||||
Income (loss) from continuing operations attributable to GCP shareholders | 7.2 | (18.1 | ) | (35.8 | ) | (41.8 | ) | ||||||||
Income from discontinued operations, net of income taxes | 18.2 | 677.3 | 26.7 | 679.4 | |||||||||||
Net income (loss) attributable to GCP shareholders | $ | 25.4 | $ | 659.2 | $ | (9.1 | ) | $ | 637.6 | ||||||
Earnings (Loss) Per Share Attributable to GCP Shareholders | |||||||||||||||
Basic earnings (loss) per share: | |||||||||||||||
Income (loss) from continuing operations attributable to GCP shareholders | $ | 0.10 | $ | (0.25 | ) | $ | (0.50 | ) | $ | (0.59 | ) | ||||
Income from discontinued operations, net of income taxes | $ | 0.25 | $ | 9.46 | $ | 0.37 | $ | 9.54 | |||||||
Net income (loss) attributable to GCP shareholders(1) | $ | 0.35 | $ | 9.21 | $ | (0.13 | ) | $ | 8.96 | ||||||
Weighted average number of basic shares | 72.2 | 71.6 | 72.1 | 71.2 | |||||||||||
Diluted earnings (loss) per share:(2) | |||||||||||||||
Income (loss) from continuing operations attributable to GCP shareholders | $ | 0.10 | $ | (0.25 | ) | $ | (0.50 | ) | $ | (0.59 | ) | ||||
Income from discontinued operations, net of income taxes | $ | 0.25 | $ | 9.46 | $ | 0.37 | $ | 9.54 | |||||||
Net income (loss) attributable to GCP shareholders(1) | $ | 0.35 | $ | 9.21 | $ | (0.13 | ) | $ | 8.96 | ||||||
Weighted average number of diluted shares | 72.7 | 71.6 | 72.1 | 71.2 | |||||||||||
(1) Amounts may not sum due to rounding.
(2) Dilutive effect only applicable to periods where there is income from continuing operations.
The Notes to Consolidated Financial Statements are an integral part of these statements.
4
GCP Applied Technologies Inc.
Consolidated Balance Sheets (unaudited)
(In millions, except par value and shares) | September 30, 2018 | December 31, 2017 | |||||
ASSETS | |||||||
Current Assets | |||||||
Cash and cash equivalents | $ | 301.0 | $ | 721.5 | |||
Trade accounts receivable (including allowances of $5.9 million and $5.7 million, respectively) | 213.1 | 217.1 | |||||
Inventories, net | 115.9 | 106.3 | |||||
Other current assets | 47.2 | 48.6 | |||||
Current assets held for sale | 3.1 | 19.7 | |||||
Total Current Assets | 680.3 | 1,113.2 | |||||
Properties and equipment, net | 220.2 | 216.6 | |||||
Goodwill | 210.1 | 198.2 | |||||
Technology and other intangible assets, net | 91.9 | 91.8 | |||||
Deferred income taxes | 29.1 | 30.2 | |||||
Overfunded defined benefit pension plans | 26.1 | 26.4 | |||||
Other assets | 31.7 | 23.8 | |||||
Non-current assets held for sale | 0.9 | 2.8 | |||||
Total Assets | $ | 1,290.3 | $ | 1,703.0 | |||
LIABILITIES AND STOCKHOLDERS' EQUITY | |||||||
Current Liabilities | |||||||
Debt payable within one year | $ | 10.9 | $ | 24.0 | |||
Accounts payable | 125.8 | 134.8 | |||||
Other current liabilities | 156.8 | 316.2 | |||||
Current liabilities held for sale | 1.2 | 7.8 | |||||
Total Current Liabilities | 294.7 | 482.8 | |||||
Debt payable after one year | 346.7 | 520.3 | |||||
Income taxes payable | 49.2 | 58.3 | |||||
Deferred income taxes | 15.4 | 14.7 | |||||
Unrecognized tax benefits | 43.2 | 42.4 | |||||
Underfunded and unfunded defined benefit pension plans | 56.6 | 57.1 | |||||
Other liabilities | 19.5 | 35.1 | |||||
Non-current liabilities held for sale | 0.3 | 0.3 | |||||
Total Liabilities | 825.6 | 1,211.0 | |||||
Commitments and Contingencies - Note 8 | |||||||
Stockholders' Equity | |||||||
Common stock issued, par value $0.01; 300,000,000 shares authorized; outstanding: 72,161,545 and 71,754,344, respectively | 0.7 | 0.7 | |||||
Paid-in capital | 40.4 | 29.9 | |||||
Accumulated earnings | 539.6 | 548.7 | |||||
Accumulated other comprehensive loss | (113.3 | ) | (85.7 | ) | |||
Treasury stock | (4.7 | ) | (3.4 | ) | |||
Total GCP's Shareholders' Equity | 462.7 | 490.2 | |||||
Noncontrolling interests | 2.0 | 1.8 | |||||
Total Stockholders' Equity | 464.7 | 492.0 | |||||
Total Liabilities and Stockholders' Equity | $ | 1,290.3 | $ | 1,703.0 | |||
The Notes to Consolidated Financial Statements are an integral part of these statements.
5
GCP Applied Technologies Inc.
Consolidated Statements of Comprehensive Income (Loss) (unaudited)
Three Months Ended September 30, | Nine Months Ended September 30, | ||||||||||||||
(In millions) | 2018 | 2017 | 2018 | 2017 | |||||||||||
Net income (loss) | $ | 25.5 | $ | 659.3 | $ | (8.8 | ) | $ | 637.8 | ||||||
Other comprehensive (loss) income: | |||||||||||||||
Defined benefit pension and other postretirement plans, net of income taxes | 0.2 | (0.3 | ) | (0.4 | ) | (0.3 | ) | ||||||||
Currency translation adjustments | (9.1 | ) | 46.2 | (27.3 | ) | 63.0 | |||||||||
Gain (loss) from hedging activities, net of income taxes | — | 0.5 | 0.1 | (0.1 | ) | ||||||||||
Total other comprehensive (loss) income | (8.9 | ) | 46.4 | (27.6 | ) | 62.6 | |||||||||
Comprehensive income (loss) | 16.6 | 705.7 | (36.4 | ) | 700.4 | ||||||||||
Less: Comprehensive income attributable to noncontrolling interests | (0.1 | ) | (0.1 | ) | (0.3 | ) | (0.2 | ) | |||||||
Comprehensive income (loss) attributable to GCP shareholders | $ | 16.5 | $ | 705.6 | $ | (36.7 | ) | $ | 700.2 | ||||||
The Notes to Consolidated Financial Statements are an integral part of these statements.
6
GCP Applied Technologies Inc.
Consolidated Statements of Stockholders' Equity (Deficit) (unaudited)
Common Stock | Treasury Stock | ||||||||||||||||||||||||||||||||
(In millions) | Number of Shares | Par Value | Number of Shares | Cost | Additional Paid-in Capital | Accumulated Earnings / (Deficit) | Accumulated Other Comprehensive Loss | Noncontrolling Interests | Total Stockholders' Equity (Deficit) | ||||||||||||||||||||||||
Balance, December 31, 2016 | 71.2 | $ | 0.7 | 0.1 | $ | (2.1 | ) | $ | 11.0 | $ | (4.7 | ) | $ | (147.6 | ) | $ | 3.7 | $ | (139.0 | ) | |||||||||||||
Net income | — | — | — | — | — | 637.6 | — | 0.2 | 637.8 | ||||||||||||||||||||||||
Issuance of common stock in connection with stock plans | 0.1 | — | — | — | — | — | — | — | — | ||||||||||||||||||||||||
Share-based compensation | — | — | — | — | 7.5 | — | — | — | 7.5 | ||||||||||||||||||||||||
Exercise of stock options | 0.4 | — | — | — | 6.6 | — | — | — | 6.6 | ||||||||||||||||||||||||
Share repurchases(1) | — | — | — | (1.0 | ) | — | — | — | — | (1.0 | ) | ||||||||||||||||||||||
Other comprehensive income | — | — | — | — | — | — | 62.6 | — | 62.6 | ||||||||||||||||||||||||
Dividends and other changes in noncontrolling interest | — | — | — | — | — | — | — | (2.3 | ) | (2.3 | ) | ||||||||||||||||||||||
Balance, September 30, 2017 | 71.7 | $ | 0.7 | 0.1 | $ | (3.1 | ) | $ | 25.1 | $ | 632.9 | $ | (85.0 | ) | $ | 1.6 | $ | 572.2 | |||||||||||||||
Balance, December 31, 2017 | 71.9 | $ | 0.7 | 0.1 | $ | (3.4 | ) | $ | 29.9 | $ | 548.7 | $ | (85.7 | ) | $ | 1.8 | $ | 492.0 | |||||||||||||||
Net (loss) income | — | — | — | — | — | (9.1 | ) | — | 0.3 | (8.8 | ) | ||||||||||||||||||||||
Issuance of common stock in connection with stock plans | 0.1 | — | — | — | — | — | — | — | — | ||||||||||||||||||||||||
Share-based compensation | — | — | — | — | 5.3 | — | — | — | 5.3 | ||||||||||||||||||||||||
Exercise of stock options | 0.4 | — | — | — | 5.2 | — | — | — | 5.2 | ||||||||||||||||||||||||
Share repurchases(1) | — | — | 0.1 | (1.3 | ) | — | — | — | — | (1.3 | ) | ||||||||||||||||||||||
Other comprehensive loss | — | — | — | — | — | — | (27.6 | ) | — | (27.6 | ) | ||||||||||||||||||||||
Dividends and other changes in noncontrolling interest | — | — | — | — | — | — | — | (0.1 | ) | (0.1 | ) | ||||||||||||||||||||||
Balance, September 30, 2018 | 72.4 | $ | 0.7 | 0.2 | $ | (4.7 | ) | $ | 40.4 | $ | 539.6 | $ | (113.3 | ) | $ | 2.0 | $ | 464.7 | |||||||||||||||
________________________________
(1) | During the nine months ended September 30, 2018 and 2017, GCP repurchased approximately 45,000 shares and 37,000 shares of Company common stock for $1.3 million and $1.0 million, respectively, in connection with its equity compensation programs. |
The Notes to Consolidated Financial Statements are an integral part of these statements.
7
GCP Applied Technologies Inc.
Consolidated Statements of Cash Flows (unaudited)
Nine Months Ended September 30, | |||||||
(In millions) | 2018 | 2017 | |||||
OPERATING ACTIVITIES | |||||||
Net (loss) income | $ | (8.8 | ) | $ | 637.8 | ||
Less: Income from discontinued operations | 26.7 | 679.4 | |||||
Loss from continuing operations | (35.5 | ) | (41.6 | ) | |||
Reconciliation to net cash (used in) provided by operating activities: | |||||||
Depreciation and amortization | 31.3 | 26.9 | |||||
Amortization of debt discount and financing costs | 1.2 | 2.2 | |||||
Stock-based compensation expense | 4.6 | 7.1 | |||||
Unrealized loss on foreign currency | — | 0.7 | |||||
Gain on termination and curtailment of pension and other postretirement benefit plans | (0.1 | ) | (5.8 | ) | |||
Currency and other losses in Venezuela | — | 40.1 | |||||
Deferred income taxes | (2.5 | ) | (5.6 | ) | |||
Loss on debt refinancing | 59.8 | — | |||||
Gain on disposal of property and equipment | (1.1 | ) | (0.6 | ) | |||
Loss on sale of product line | — | 2.1 | |||||
Changes in assets and liabilities, excluding effect of currency translation: | |||||||
Trade accounts receivable | (6.3 | ) | (40.0 | ) | |||
Inventories | (13.1 | ) | (13.3 | ) | |||
Accounts payable | (2.3 | ) | 18.8 | ||||
Pension assets and liabilities, net | — | 7.2 | |||||
Other assets and liabilities, net | (6.4 | ) | (7.3 | ) | |||
Net cash provided by (used in) operating activities from continuing operations | 29.6 | (9.1 | ) | ||||
Net cash used in operating activities from discontinued operations | (130.4 | ) | (15.3 | ) | |||
Net cash used in operating activities | (100.8 | ) | (24.4 | ) | |||
INVESTING ACTIVITIES | |||||||
Capital expenditures | (40.7 | ) | (32.4 | ) | |||
Businesses acquired, net of cash acquired | (29.7 | ) | (87.7 | ) | |||
Proceeds from sale of product line | — | 2.9 | |||||
Other investing activities | (2.9 | ) | 2.4 | ||||
Net cash used in investing activities from continuing operations | (73.3 | ) | (114.8 | ) | |||
Net cash provided by investing activities from discontinued operations | 0.1 | 1,038.3 | |||||
Net cash (used in) provided by investing activities | (73.2 | ) | 923.5 | ||||
FINANCING ACTIVITIES | |||||||
Borrowings under credit arrangements | 54.6 | 120.0 | |||||
Repayments under credit arrangements | (66.4 | ) | (416.6 | ) | |||
Proceeds from issuance of long term note obligations | 350.0 | — | |||||
Repayments of long term note obligations | (578.3 | ) | — | ||||
Cash paid for debt financing costs | (6.9 | ) | — | ||||
Share repurchases | (1.3 | ) | (1.0 | ) | |||
Proceeds from exercise of stock options | 5.2 | 6.1 | |||||
Noncontrolling interest dividend | (0.1 | ) | (2.0 | ) | |||
Other financing activities | (0.7 | ) | — | ||||
Net cash used in financing activities from continuing operations | (243.9 | ) | (293.5 | ) | |||
Net cash provided by financing activities from discontinued operations | — | 1.1 | |||||
Net cash used in financing activities | (243.9 | ) | (292.4 | ) | |||
Effect of currency exchange rate changes on cash and cash equivalents | (2.6 | ) | 1.4 | ||||
(Decrease) increase in cash and cash equivalents | (420.5 | ) | 608.1 | ||||
Cash and cash equivalents, beginning of period | 721.5 | 163.3 | |||||
Cash and cash equivalents, end of period | $ | 301.0 | $ | 771.4 | |||
The Notes to Consolidated Financial Statements are an integral part of these statements.
8
GCP Applied Technologies Inc.
Notes to Consolidated Financial Statements (unaudited)
1. Basis of Presentation and Summary of Significant Accounting and Financial Reporting Policies
GCP is engaged in the production and sale of specialty construction chemicals and specialty building materials through two operating segments. Specialty Construction Chemicals ("SCC") manufactures and markets concrete admixtures and cement additives. Specialty Building Materials ("SBM") manufactures and markets sheet and liquid membrane systems that protect structures from water, air and vapor penetration, fireproofing and other products designed to protect the building envelope.
On July 3, 2017 (the "Closing Date"), GCP completed the sale of its Darex Packaging Technologies ("Darex") business to Henkel AG & Co. KGaA (“Henkel”) for $1.06 billion in cash. As discussed further below under "Discontinued Operations," the results of operations for Darex have been excluded from GCP's continuing operations and segment results for all periods presented.
Basis of Presentation
The accompanying unaudited Consolidated Financial Statements are presented on a consolidated basis and include all of the accounts and operations of GCP and its majority-owned subsidiaries, except as noted below with respect to the Company's Venezuela subsidiary. The financial statements reflect the financial position, results of operations and cash flows of GCP in accordance with generally accepted accounting principles in the United States of America ("GAAP") and the instructions to Form 10-Q and Article 10 of SEC Regulation S-X for interim financial information.
The interim financial statements presented herein are unaudited and should be read in conjunction with the audited Consolidated Financial Statements and notes thereto contained in GCP's Annual Report on Form 10-K filed with the SEC for the year ended December 31, 2017 (the "2017 Annual Report on Form 10-K"). The accompanying Consolidated Balance Sheet as of December 31, 2017 was derived from the audited annual consolidated financial statements as of the period then ended. Certain information and footnote disclosures typically included in GCP's annual consolidated financial statements have been condensed or omitted. The accompanying unaudited financial statements reflect all adjustments that, in the opinion of management, are necessary for a fair statement of the results of the interim periods presented. All such adjustments are of a normal recurring nature except for the impacts of adopting new accounting standards discussed below. All significant intercompany accounts and transactions have been eliminated. The results of operations for the three and nine-months period ended September 30, 2018 are not necessarily indicative of the results of operations for the year ending December 31, 2018.
Discontinued Operations
As noted above, on July 3, 2017, the Company completed the sale of Darex to Henkel. In conjunction with this transaction and applicable GAAP, the assets and liabilities related to Darex in the applicable delayed close countries have been reclassified and reflected as "held for sale" in the accompanying unaudited Consolidated Balance Sheets as of September 30, 2018 and December 31, 2017, as discussed further in Note 15, "Discontinued Operations". Additionally, Darex results of operations and cash flows have been reclassified and reflected as "discontinued operations" in the accompanying unaudited Consolidated Statements of Operations and accompanying unaudited Consolidated Statements of Cash Flows for all periods presented.
As of December 31, 2017, a liability of $55.1 million and $13.6 million, respectively, related to the consideration received by GCP for the delayed closings was recognized in “Other current liabilities” and “Other liabilities." During the nine months ended September 30, 2018, GCP reduced the liability by $55.1 million which consisted primarily of the sale proceeds received on July 3, 2017 for the delayed closings in Argentina, Colombia, Peru, and China completed during the period then ended. The remaining liability of $13.1 million and $0.5 million, respectively, for the consideration received on the closing date related to the remaining delayed closing countries is recorded in “Other current liabilities” and "Other liabilities" as of September 30, 2018.
Unless otherwise noted, the information throughout the Notes to the accompanying unaudited Consolidated Financial Statements pertains only to the continuing operations of GCP. Please refer to Note 15, "Discontinued Operations" for further discussion of discontinued operations.
9
Deconsolidation of Venezuelan Operations
Prior to July 3, 2017, the Company included the results of its Venezuelan operations (“GCP Venezuela”) in the Consolidated Financial Statements using the consolidation method of accounting. Venezuelan exchange control regulations have resulted in an other-than-temporary lack of exchangeability between the Venezuelan bolivar and U.S. dollar, and have restricted GCP Venezuela’s ability to pay dividends and meet obligations denominated in U.S. dollars. These exchange regulations, combined with other regulations, have constrained availability of raw materials and have significantly limited GCP Venezuela’s ability to maintain normal production. As a result of these conditions, combined with the loss of scale in Venezuela resulting from the sale of the Company’s Darex-related operations and assets in Venezuela, GCP has deconsolidated its Venezuelan operations as of July 3, 2017 in accordance with provisions of Financial Accounting Standards Board ("FASB") Accounting Standards Codification ("ASC") 810, Consolidation. During the three months ended September 30, 2017, GCP recognized a pre-tax loss of $36.7 million which was $23.8 million after tax. Such loss is primarily related to unfavorable cumulative translation adjustments of $33.4 million associated with the Venezuelan business and presented as a “Loss in Venezuela” in the accompanying unaudited Consolidated Statements of Operations during the three and nine months ended September 30, 2017. Subsequent to July 3, 2017, the Company began accounting for GCP Venezuela using the cost method of accounting in accordance with which the Company’s financial results do not include the operating results of GCP Venezuela. The Company records cash and recognizes income from its Venezuelan operations in the accompanying unaudited Consolidated Financial Statements to the extent GCP is paid for inventory sold to or dividends are received from GCP Venezuela. The remaining investment on the Company's accompanying unaudited Consolidated Balance Sheets as of September 30, 2018 and December 31, 2017 is immaterial.
Use of Estimates
The preparation of financial statements in conformity with GAAP requires management to make estimates and assumptions that affect the reported amount of assets and liabilities and disclosure of contingent assets and liabilities at the date of the unaudited Consolidated Financial Statements, and the reported amounts of revenues and expenses for the periods presented. Actual amounts could differ from those estimates, and the differences could be material. Changes in estimates are recorded in the period identified. GCP's accounting measurements that are most affected by management's estimates of future events are disclosed in its 2017 Annual Report on Form 10-K. There have been no significant changes to management's assumptions and estimates underlying those measurements as reported in these interim financial statements, except as discussed in Note 5, "Income Taxes".
Reclassifications
Certain amounts in prior period financial statements have been reclassified to conform to the current period presentation. Such reclassifications have not materially affected previously reported amounts.
Revision of Prior Period Financial Statements
During the nine months ended September 30, 2018 GCP identified an error related to the presentation of the effect of currency exchange rate changes on cash and cash equivalents in its unaudited Consolidated Statements of Cash Flows filed in its Form 10-Q for the quarterly period ended September 30, 2017 and Consolidated Statements of Cash Flows in its 2017 Annual Report on Form 10-K for the year ended December 31, 2017. The correction of this error resulted in a reclassification between “cash provided by (used in) operating activities from continuing operations” and “effect of currency exchange rate changes on cash and cash equivalents” on the Consolidated Statements of Cash Flows filed during these periods. There was no impact on the Consolidated Statements of Operations, Consolidated Statements of Comprehensive Income, Consolidated Balance Sheets, or Consolidated Statements of Stockholders’ Equity during these periods as a result of these errors.
10
The Company considered the guidance in ASC Topic 250, Accounting Changes and Error Corrections, ASC Topic 250-10-S99-1, Assessing Materiality, and ASC Topic 250-10-S99-2, Considering the Effects of Prior Year Misstatements when Quantifying Misstatements in Current Year Financial Statements in evaluating whether the Company’s previously issued consolidated financial statements were materially misstated. The Company concluded this error was not material individually or in the aggregate to the financial statements presented during any of the prior reporting periods, and therefore, amendments of previously filed Form 10-Q for the quarterly period ended September 30, 2017 and the 2017 Annual Report on Form 10-K for the year ended December 31, 2017 were not required. The revisions for these corrections to the applicable prior periods are reflected in the financial information herein and will be reflected in future filings containing such financial information.
The following table summarizes the effects of the error on the interim and annual prior-period financial statements:
Nine Months Ended, | Year Ended, | ||||||||||||||||||||||
September 30, 2017 | December 31, 2017 | ||||||||||||||||||||||
(in millions) | As Previously Reported | Adjustment | As Revised | As Previously Reported | Adjustment | As Revised | |||||||||||||||||
CASH FLOWS FROM OPERATING ACTIVITIES: | |||||||||||||||||||||||
Net cash (used in) provided by operating activities from continuing operations | $ | (11.7 | ) | $ | 2.6 | $ | (9.1 | ) | $ | (5.4 | ) | $ | 4.4 | $ | (1.0 | ) | |||||||
Effect on currency exchange rate changes on cash and cash equivalents | 4.0 | (2.6 | ) | 1.4 | 6.4 | (4.4 | ) | 2.0 | |||||||||||||||
Income Tax
As a global enterprise, GCP is subject to a complex array of tax regulations and is required to make assessments of applicable tax laws and judgments in estimating its ultimate income tax liability. Please refer to Note 5, "Income Taxes," for further discussion regarding estimates used in accounting for income tax matters, including unrecognized tax benefits.
Currency Translation
Assets and liabilities of foreign subsidiaries (other than those located in countries with highly inflationary economies) are translated into U.S. dollars at current exchange rates, while revenues, costs and expenses are translated at average exchange rates during each reporting period. The resulting currency translation adjustments are included in "Accumulated other comprehensive loss" in the accompanying unaudited Consolidated Balance Sheets. The financial statements of any subsidiaries located in countries with highly inflationary economies are remeasured as if the functional currency were the U.S. dollar. Translation adjustments recognized as a result of such remeasurements are reflected in the results of operations in the unaudited Consolidated Statements of Operations.
As of July 3, 2017, GCP deconsolidated its Venezuelan operations and, as a result, the Company's financial results no longer include the operations of GCP Venezuela, including currency translation adjustments, beyond that date.
11
As of June 30, 2018, GCP concluded that Argentina is a highly inflationary economy since the three-year cumulative inflation rates commonly used to evaluate Argentina’s inflation currently exceed 100%. As a result, GCP began accounting for its operations in Argentina as a highly inflationary economy during the three months ended September 30, 2018. Effective July 1, 2018, the functional currency of the Company's subsidiary operating in Argentina became the U.S. dollar and all remeasurement adjustments after the effective date are reflected in GCP's results operations in the accompanying unaudited Consolidated Statements of Operations. During the three months ended September 30, 2018, the Company incurred losses of $1.1 million related to the remeasurement of these monetary net assets which are included in "Other income, net" in the accompanying unaudited Consolidated Statements of Operations. Net sales generated by the Argentina subsidiary were not material to the Company's consolidated net sales during the three and nine months ended September 30, 2018. Monetary net assets denominated in local currency within the Company's Argentina subsidiary were not material to GCP's consolidated total assets as of September 30, 2018.
Contract Assets and Contract Liabilities
Contract assets consist of unbilled amounts typically resulting from sales under long-term contracts when the revenue recognized exceeds the amount billed to the customer. Contract liabilities consist of advance payments and billings for revenue not meeting the criteria to be recognized and/or in excess of costs incurred. The Company’s contract assets and liabilities resulting from its contracts in the SCC or SBM operating segments were not material as of September 30, 2018 and December 31, 2017. Additionally, the amounts recorded in the accompanying unaudited Statements of Operations for the three and nine months ended September 30, 2018 related to changes in the contract assets and liabilities during the periods were immaterial.
Trade accounts receivable include amounts billed and currently due from customers. The amounts due are stated at their net estimated realizable value. The Company maintains an allowance for doubtful accounts to provide for the estimated amount of receivables that will not be collected. The allowance is based upon an assessment of customer creditworthiness, historical payment experience, the age of outstanding receivables and collateral to the extent applicable. As of September 30, 2018 and December 31, 2017, the Company’s total trade accounts receivable balance was $213.1 million and $217.1 million, respectively, of which $5.0 million and $5.6 million, respectively, was related to trade accounts receivable associated with rental revenue generated from leases within certain SCC contracts and accounted for within the provisions of ASC Topic 840, Leases ("Topic 840").
Costs to Obtain a Contract
GCP pays external sales agents certain commissions based on actual customer sales and it has determined that such amounts represent incremental costs incurred in obtaining such customer contracts. The performance obligations associated with these costs are satisfied at a point in time and accordingly the amortization period of such costs is less than one year. The Company expenses these costs as incurred in accordance with the practical expedient that allows for such treatment, as prescribed by ASC Topic 340-40, Costs to obtain or fulfill a contract.
12
Recently Issued Accounting Standards
Leases
In February 2016, the FASB issued ASU 2016-02, Leases (Topic 842), which is intended to increase transparency and comparability among organizations by recognizing lease assets and lease liabilities on the balance sheet and disclosing key information about leasing arrangements. In accordance with provisions of Topic 842, a lessee will be required to recognize in the statement of financial position a lease liability related to making lease payments and a right-of-use asset representing its right to use the underlying asset for the lease term, including optional payments that are reasonably certain to occur. In July 2018, the FASB issued two amendments to ASU 2016-02. The first amendment clarifies the application of certain aspects of ASU 2016-02 related to: (i) the rate implicit in the lease, (ii) impairment of the net investment in the lease, (iii) lessee reassessment of lease classification, (iv) lessor reassessment of lease term and purchase options, (v) variable payments that depend on an index or rate and (vi) certain transition adjustments, among other things. The second amendment includes a transition option allowing entities to forgo the application of ASU 2016-02 in the comparative periods presented in the financial statements during the year of adoption. Additionally, the amendment includes a practical expedient which provides lessors with an option to not separate non-lease components from the associated lease components when certain criteria are met and requires lessors to account for the combined component in accordance with provisions of ASC Topic 606 if the associated non-lease components are the predominant components in the arrangement. The guidance and the related amendments are effective for fiscal years beginning after December 15, 2018, including interim periods within those fiscal years, with early adoption being permitted. GCP will adopt Topic 842 during the first quarter of 2019.
As of September 30, 2018, GCP initiated the evaluation of the potential impact of adopting Topic 842 on its financial position, results of operations and related disclosures, but has not yet completed such assessment or determined whether it will elect the practical expedients upon adoption or the transition option allowing companies to forgo the application of Topic 842 in the comparative periods presented in its financial statements during the year of adoption. GCP has established a steering committee, a project plan and an implementation team which will analyze GCP's current contracts portfolio to determine the impact of adopting Topic 842 on the Company's financial position, results of operations and related disclosures. The implementation team is also responsible for evaluating and designing the necessary changes to the Company’s business processes, policies, systems and controls to support recognition and disclosure under the new guidance. During the three months ended September 30, 2018, GCP launched a comprehensive data collection initiative related to the population of arrangements containing leases and made a significant progress on collecting a portion of such data as of September 30, 2018. The Company also began the initial assessment of its lease contracts to determine the impact of adopting Topic 842 on its financial position, results of operations and related disclosures, but has not reached final conclusions related to such assessment as of September 30, 2018. Additionally, the Company completed a third party vendor selection process related to the lease accounting and management software solution to facilitate the adoption of Topic 842 and streamline the related accounting, contract tracking and disclosure reporting processes.
Other new pronouncements issued but not effective until after September 30, 2018 are not expected to have a material impact on the Company's financial position, results of operations or liquidity.
Recently Adopted Accounting Standards
Revenue from Contracts with Customers
In May 2014, the FASB issued Accounting Standards Update ("ASU") 2014-09, Revenue from Contracts with Customers (Topic 606). This update is intended to remove inconsistencies and weaknesses in revenue requirements; provide a more robust framework for addressing revenue issues; improve comparability of revenue recognition practices across entities, industries, jurisdictions and capital markets; provide more useful information to users of financial statements through improved disclosure requirements; and simplify the preparation of financial statements by reducing the number of requirements to which an entity must refer. The revised standard allows for two methods of adoption: (a) full retrospective adoption, in accordance with which the standard is applied to all periods presented, or (b) modified retrospective adoption, in accordance with which the cumulative effect of applying the new standard is recognized as an adjustment to the opening retained earnings balance.
13
GCP has adopted Topic 606 effective January 1, 2018 using the modified retrospective approach. Under this transition method, GCP has elected to apply the guidance to all open contracts that are not completed or that are active as of January 1, 2018, and has elected not to retrospectively restate any of its contracts for modifications that occurred prior to the date of adoption of Topic 606. Accordingly, such modifications are reflected in the amounts reported for satisfied and unsatisfied performance obligations, transaction price of such performance obligations, and allocations of the transaction price among contract components, as of the date of the initial application. The impact of applying this practical expedient is immaterial to the Company’s accompanying unaudited Consolidated Financial Statements.
The impact of the adoption of Topic 606 on the Company's three and nine months ended September 30, 2018 net sales, income (loss) from continuing operations before income taxes, and income (loss) from continuing operations was immaterial. The cumulative impact on the Company's retained earnings at January 1, 2018 was also not material. Such impact is disclosed in Note 2, "Revenue from Contracts with Customers."
Stock Compensation
In May 2017, the FASB issued ASU 2017-09, Compensation—Stock Compensation (Topic 718), which provides guidance related to the changes to the terms or conditions of a share-based payment award that require an application of modification accounting pursuant to Topic 718. GCP adopted the standard effective January 1, 2018; such adoption did not have a material impact on its financial position as of September 30, 2018 and results of operations for the three and nine months ended September 30, 2018.
Statement of Cash Flows
In August 2016, the FASB issued ASU 2016-15, Statement of Cash Flows (Topic 230): Classification of Certain Cash Receipts and Payments, which addresses a number of specific cash flow presentation issues with the objective of reducing existing diversity in practice. GCP adopted the standard effective January 1, 2018 and classified within the cash flows from financing activities a $53.3 million payment related to the redemption premium on the extinguishment of its 9.5% Senior Notes, consistent with the provisions of the guidance. Such payment was included in "Repayments of long term note obligations" in the accompanying unaudited Consolidated Statements of Cash Flows. Please refer to Note 4, "Debt and Other Borrowings" for further discussion of this transaction. There was no other material impact on the Company's unaudited Consolidated Statements of Cash Flows for the nine months ended September 30, 2018 as a result of the standard adoption.
Income Taxes
In October 2016, the FASB issued ASU 2016-16, Income Taxes (Topic 740): Intra-Entity Transfers of Assets Other Than Inventory. This ASU requires recognition of the current and deferred income tax effects of an intra-entity asset transfer, other than inventory, when the transfer occurs, as opposed to current GAAP, which requires companies to defer the income tax effects until the asset has been sold to an outside party. GCP adopted the standard effective January 1, 2018. It did not have a material impact on the Company's financial position as of September 30, 2018 and results of operations for the three and nine months ended September 30, 2018.
Other
During the three and nine months ended September 30, 2018, except as discussed above, there were no material changes to the Company's significant accounting and financial reporting policies from those reflected in the Annual Report on Form 10-K for the year ended December 31, 2017. For further information with regard to the Company’s Significant Accounting Policies, please refer to Note 1, "Basis of Presentation and Summary of Significant Accounting and Financial Reporting Policies," to the Company’s Consolidated Financial Statements included in the 2017 Annual Report on Form 10-K.
14
2. Revenue from Contracts with Customers
Short-Term Arrangements
The majority of the Company’s revenue is generated from short-term arrangements associated with the production and sale of concrete admixtures and cement additives within its SCC operating segment, as well as sheet and liquid membrane systems and other specialty products designed to protect the building envelope within its SBM operating segment. The products sold are priced based on the costs of producing goods and the value delivered to the customer. In these arrangements, the customer generally pays GCP for the contract price agreed upon within a short period of time, which is between thirty and sixty days. For such arrangements, the transfer of control takes place at a point in time when products are shipped to the customer. The evaluation of transfer of control for these goods does not involve significant judgment. Revenue from these contracts with customers is therefore typically recognized upon shipment of the product or delivery at the customer’s site depending on the shipping terms, provided the transaction price can be estimated appropriately and the Company expects to collect the consideration to which it is entitled in exchange for the products it ships.
The Company generates revenue from short-term arrangements within its SCC operating segment which involve selling concrete admixtures and providing dispensers to customers. GCP has determined that the dispensers represent a lease and has allocated revenue between the lease and non-lease components based on the relative stand-alone selling price of each component which is determined based on a cost plus a reasonable margin approach for the lease component and standalone selling prices for the non-lease component. The Company recognizes revenue for the non-lease component at a point of time when the control is transferred to the customer. The lease component is considered a short-term obligation which is generally thirty days or less. The Company recognizes revenue for the lease component over the term of the lease in accordance with provisions of Topic 840. GCP records dispensers as fixed assets and depreciates them over their estimated useful life.
Long-Term Arrangements
The Company generates revenue from long-term arrangements within its SCC operating segment, which generally consist of VERIFI® and Ductilcrete sales arrangements.
VERIFI® sales arrangements involve installing equipment on the customers’ trucks and at their plants, as well as performing slump management and truck location tracking services. The Company has determined that the installed equipment represents a lease. The Company allocates the transaction price in a VERIFI® sales arrangement between the lease and non-lease components based on valuation techniques that estimate a relative stand-alone selling price of each component. The services included within the non-lease component represent the Company’s stand-ready promise to perform a series of daily distinct services, which is combined into a single performance obligation. The Company recognizes revenue associated with such services over time since the customer simultaneously receives and consumes the benefits provided by such services. The transaction price in a VERIFI® sales arrangement consists of installation fees and slump management fees which are dependent on the quantity of materials poured and represent variable consideration. The Company records the amount of variable consideration at the time of the transfer of services to its customers, which is constrained by the amount for which a significant revenue reversal is not probable to occur. Revenue for the lease component is recognized over the term of the lease in accordance with provisions of Topic 840. Revenue generated from VERIFI® sales arrangements represented less than 10% of the Company's consolidated revenue during the three and nine months ended September 30, 2018.
Ductilcrete sales arrangements include licenses without significant standalone functionality and usage fees received upfront, both of which represent separate performance obligations for which revenue is recognized over the period of related services. Additional performance obligations included in these arrangements are related to other fees and product sales for which revenue is recognized at a point in time once such performance obligations are satisfied. Revenue generated from Ductilcrete sales arrangements represented less than 10% of the Company's consolidated revenue during the three and nine months ended September 30, 2018.
15
Lease elements within sales arrangements
Certain sales arrangements within the SCC operating segment related to VERIFI® and certain admixture contracts include lease components, as discussed above. Revenue for the lease components are recognized over the term of the leases in accordance with provisions of Topic 840.
During the three and nine months ended September 30, 2018, the Company recognized revenue of $8.6 million and $25.0 million, respectively, related to the lease components of the arrangements within the SCC operating segment.
Other revenue considerations
The Company generally provides warranties that its products will function as intended. GCP accrues a general warranty liability at the time of sale based on historical experience and on a transaction-specific basis according to individual facts and circumstances.
The Company accepts returns for certain products sales. These returns are at the discretion of the Company and typically are only granted within six months from the date of sale. GCP accrues for these returns at the time of the sale based on historical experience and records them as a reduction of transaction price.
Certain long-term agreements with customers may include one-time, upfront payments made to customers. GCP defers these costs and recognizes them as assets which get amortized over the term of the agreement as a reduction of gross sales.
Certain customer arrangements include conditions for volume rebates. GCP records a rebate allowance and reduces transaction price for anticipated selling price adjustments at the time of sale. GCP regularly reviews and estimates rebate accruals based on actual and anticipated sales patterns. The Company also evaluates contracts with customers that contain early payment discounts and reduces transaction price by the amount not expected to be collected due to such discounts in any given period.
The Company does not include any taxes (i.e. sales, use, value added and some excise taxes) in the transaction price that is allocated among its products or services. The Company has elected to account for shipping and handling costs as fulfillment activities under the provisions of Topic 606 allowing it to continue its current treatment of the associated revenue and costs under the new standard. GCP expenses shipping and handling costs in the period they are incurred and presents them within "Cost of goods sold" in the accompanying unaudited Consolidated Statements of Operations.
The Company’s revenue is principally recognized as goods and services are delivered and performance obligations are satisfied upon delivery. The Company has certain long-term arrangements resulting in remaining obligations for which the work has not been performed or has been partially performed. As of September 30, 2018, the aggregate amount of the transaction price allocated to remaining performance obligations was $4.5 million, including the estimated transaction price to be earned as revenue over the remaining term of these contracts, which is generally one to five years.
16
3. Inventories, net
Inventories are stated at the lower of cost or net realizable value. Cost is determined on a first-in, first-out ("FIFO") basis. GCP provides reserves for excess, obsolete or damaged inventories based on their expected selling price, net of completion and disposal costs.
The following is a summary of inventories presented on GCP's accompanying unaudited Consolidated Balance Sheets at September 30, 2018 and December 31, 2017:
(In millions) | September 30, 2018 | December 31, 2017 | |||||
Raw materials | $ | 47.3 | $ | 41.9 | |||
In process | 4.4 | 3.5 | |||||
Finished products and other | 64.2 | 60.9 | |||||
Total inventories, net | $ | 115.9 | $ | 106.3 | |||
The "Finished products and other" category presented in the table above includes "other" inventories, which consist of finished products purchased rather than produced by GCP of $14.2 million and $11.1 million, respectively, as of September 30, 2018 and December 31, 2017.
17
4. Debt and Other Borrowings
Components of Debt
The following is a summary of obligations under senior notes and other borrowings at September 30, 2018 and December 31, 2017:
(In millions) | September 30, 2018 | December 31, 2017 | |||||
5.5% Senior Notes due in 2026, net of unamortized debt issuance costs of $4.5 million at September 30, 2018 | $ | 345.5 | $ | — | |||
9.5% Senior Notes due in 2023, net of unamortized debt issuance costs of $6.4 million at December 31, 2017 | — | 518.6 | |||||
Revolving credit facility due 2023(1) | — | — | |||||
Other borrowings(2) | 12.1 | 25.7 | |||||
Total debt | 357.6 | 544.3 | |||||
Less debt payable within one year | 10.9 | 24.0 | |||||
Debt payable after one year | $ | 346.7 | $ | 520.3 | |||
Weighted average interest rates on total debt obligations | 5.7 | % | 9.4 | % | |||
(1) | Represents borrowings under the Revolving Credit Facility with an aggregate available principal amount of $350.0 million and $250.0 million, respectively, as of September 30, 2018 and December 31, 2017. |
(2) | Represents borrowings under various lines of credit and other borrowings, primarily by non-U.S. subsidiaries. |
The principal maturities of debt obligations outstanding, net of debt issuance costs, were as follows at September 30, 2018:
(In millions) | ||||
Year ending December 31, | Amount | |||
2018 | $ | 10.4 | ||
2019 | 1.2 | |||
2020 | 0.5 | |||
2021 | — | |||
2022 | — | |||
Thereafter | 345.5 | |||
Total debt | $ | 357.6 | ||
18
Debt Refinancing
On April 10, 2018, GCP redeemed its then existing 9.5% Senior Notes with an aggregate principal amount of $525.0 million due in 2023 (the “9.5% Senior Notes”). On April 10, 2018, the Company also issued 5.5% Senior Notes with an aggregate principal amount of $350.0 million maturing on April 15, 2026 (the "5.5% Senior Notes") and amended its Credit Agreement to, among other things, (i) increase the aggregate principal amount available under its revolving credit facility to $350.0 million, (ii) extend the maturity date of the revolving credit facility thereunder to April 2023 and (iii) make certain other changes to the covenants and other provisions therein. Additionally, the Company borrowed $50.0 million in aggregate principal amount of revolving loans under the Credit Agreement on April 10, 2018 which was fully repaid during the second quarter of 2018. The aggregate cash payment of $587.9 million, which consisted of: (i) proceeds of $350.0 million from the issuance of the 5.5% Senior Notes, net of loan origination fees of $3.1 million, (ii) borrowings of $50.0 million under the Credit Agreement, and (iii) a cash payment of $191.0 million was used to redeem all of the then outstanding 9.5% Senior Notes in accordance with the terms of the indenture governing the 9.5% Senior Notes.
The redemption of the 9.5% Senior Notes was accounted for as a debt extinguishment in accordance with provisions of ASC Topic 470-50, Debt Modifications and Extinguishments. During the nine months ended September 30, 2018, GCP recognized a loss on debt extinguishment of $59.4 million which was included in "Interest expense and related financing costs" in the accompanying unaudited Consolidated Statements of Operations. In connection with the redemption of the 9.5% Senior Notes with then outstanding principal balance of $525.0 million, GCP paid total cash proceeds of $587.9 million, including $53.3 million of a redemption premium and $9.6 million of accrued interest unpaid thereon through the redemption date, and wrote off $6.1 million of previously deferred debt issuance costs.
The amendment to the Credit Agreement among GCP and a syndicate of financial institutions resulted in an increase in a maximum borrowing capacity under the Revolving Credit Facility from $250.0 million to $350.0 million and extension of the maturity date to April 2023. During the nine months ended September 30, 2018, GCP wrote off $0.4 million of deferred debt issuance costs related to a financial institution that exited the syndicate upon amendment of the Credit Agreement. As of September 30, 2018, debt issuance costs of $4.3 million related to the financial institutions that remained in the syndicate are presented within "Other assets" in the accompanying unaudited Consolidated Balance Sheets and amortized over the term of the Revolving Credit Facility.
The total loss recognized on the debt refinancing transaction was $59.8 million which was included in "Interest expense and related financing costs" in the accompanying unaudited Consolidated Statements of Operations and consisted of $59.4 million related to the extinguishment of the 9.5% Senior Notes and $0.4 million related to a deferred issuance costs write-off in connection with the amendment of the Credit Agreement.
5.5% Senior Notes
On April 10, 2018, GCP issued 5.5% Senior Notes with an aggregate principal amount of $350.0 million maturing on April 15, 2026. The 5.5% Senior Notes were issued at $346.9 million, or 99.1% of their par value, resulting in a discount of $3.1 million, or 0.9%, which represented loan origination fees paid at the closing. The Company incurred additional deferred financing costs of $1.6 million related to the issuance. Interest is payable semi-annually in arrears on April 15 and October 15 of each year, commencing on October 15, 2018. An interest payment of $9.9 million was due and paid on October 15, 2018.
The 5.5% Senior Notes were issued pursuant to an Indenture (the “Indenture”), by and among GCP, the guarantors party thereto (the “Note Guarantors”) and Wilmington Trust, National Association, as trustee. The 5.5% Senior Notes and the related guarantees rank equally with all of the existing and future unsubordinated indebtedness of GCP and the Note Guarantors and senior in right of payment to any existing and future subordinated indebtedness of GCP and the Note Guarantors. The 5.5% Senior Notes and related guarantees are effectively subordinated to any secured indebtedness of GCP or the Note Guarantors, as applicable, to the extent of the value of the assets securing such indebtedness and structurally subordinated to all existing and future indebtedness and other liabilities of GCP’s non-guarantor subsidiaries.
19
Subject to certain conditions stated in the Indenture, GCP may, at its option and at any time and from time to time prior to April 15, 2021, redeem the 5.5% Senior Notes in whole or in part at a redemption price equal to: (i) 100% of their principal amount redeemed, plus (ii) the applicable premium, as defined in the Indenture, plus (iii) accrued and unpaid interest, if any, to, but excluding, the applicable redemption date. In addition, GCP may, at its option, redeem up to 40% of the outstanding principal amount of the 5.5% Senior Notes at any time and from time to time prior to April 15, 2021 with the net cash proceeds from certain equity offerings at a redemption price equal to: (i) 105.5% of the principal amount redeemed, plus (ii) accrued and unpaid interest, if any, to, but excluding, the applicable redemption date. At any time and from time to time on or after April 15, 2021, GCP may, at its option, redeem the 5.5% Senior Notes in whole or in part at the redemption price equal: (i) 102.8% of the par value if redeemed after April 15, 2021, (ii) 101.4% of the par value if redeemed after April 15, 2022, and (iii) 100.0% of the par value if redeemed after April 15, 2023 and thereafter. Upon occurrence of a change of control, as defined in the Indenture, GCP will be required to make an offer to repurchase the 5.5% Senior Notes at a price equal to 101.0% of their aggregate principal amount repurchased plus accrued and unpaid interest, if any, to, but excluding, the date of repurchase.
The Indenture contains covenants that limit the ability of GCP and its subsidiaries, subject to certain exceptions and qualifications set forth therein, to (i) create or incur liens on certain assets, (ii) incur additional debt, (iii) make certain investments and acquisitions, (iv) consolidate, merge, or convey, transfer, or lease all or substantially all of their assets, (v) sell certain assets, (vi) pay dividends on or make distributions in respect of GCP’s capital stock or make other restricted payments, (vii) enter into certain transactions with GCP’s affiliates and (viii) place restrictions on distributions from and other actions by subsidiaries. As of September 30, 2018, the Company was in compliance with all covenants and conditions under the Indenture.
The Indenture provides for customary events of default which are subject in certain cases to customary grace periods and include, among others: (i) nonpayment of principal or interest, (ii) breach of other agreements in the Indenture, (iii) failure to pay certain other indebtedness, (iv) certain events of bankruptcy or insolvency, (v) failure to discharge final judgments aggregating in excess of $50.0 million rendered against GCP or certain of its subsidiaries, (vi) and failure of the guarantee of the 5.5% Senior Notes by any of GCP’s significant subsidiaries to be in full force and effect. There are no events of default under the Indenture as of September 30, 2018.
Credit Agreement
On February 3, 2016, GCP entered into a Credit Agreement that provides for senior secured credit facilities (the “Credit Facilities”) in an aggregate principal amount of $525.0 million, which consisted of: (i) the term loan (the "Term Loan") with an aggregate principal amount of $275.0 million and (ii) a revolving credit facility (the "Revolving Credit Facility") of $250.0 million due in 2021. During 2017, the Company fully repaid the outstanding principal balance on the Term Loan together with accrued and unpaid interest and extinguished the Term Loan under the Credit Agreement.
On April 10, 2018, GCP entered into an amendment to its Credit Agreement and borrowed $50.0 million in aggregate principal amount of revolving loans under the Credit Agreement, as discussed above, which was fully repaid during the second quarter of 2018.
The Credit Agreement contains conditions that would require mandatory principal payments in advance of the maturity date of the Revolving Credit Facility, as well as certain customary affirmative and negative covenants and events of default, as described in Note 5, "Debt and Other Financial Instruments," to the Company's Consolidated Financial Statements included in the 2017 Annual Report in the Form 10-K. The Company was in compliance with all covenant terms as of September 30, 2018 and December 31, 2017. There are no events of default as of September 30, 2018 and December 31, 2017.
The Revolving Credit Facility is secured on a first priority basis by a perfected security interest in, and mortgages on substantially all U.S. tangible and intangible personal property, financial assets and real property owned by the Company in Chicago, Illinois and Mount Pleasant, Tennessee; a pledge of 100% of the equity of each material U.S. subsidiary of the Company; and 65% of the equity of a U.K. holding company.
20
The interest rate per annum applicable to the Revolving Credit Facility is equal to, at GCP’s option, either: (i) a base rate plus a margin ranging from 0.5% to 1.0%, or (ii) LIBOR plus a margin ranging from 1.5% to 2.0%, based upon the total leverage ratio of GCP and its restricted subsidiaries in both scenarios. During the three and nine months ended September 30, 2018, the weighted average interest rate paid on the Revolving Credit Facility was 0.0% and 3.4%, respectively. During the nine months ended September 30, 2018, GCP made aggregate payments of $50.0 million on the Revolving Credit Facility. As of September 30, 2018, there were no outstanding borrowings on the Revolving Credit Facility and approximately $5.7 million in outstanding letters of credit, which resulted in available credit of $344.3 million under the Revolving Credit Facility. As of December 31, 2017, there were no outstanding borrowings under the Revolving Credit Facility. There were no interest payments on the Revolving Credit Facility during the three months ended September 30, 2018. Such interest payments were $0.2 million during the nine months ended September 30, 2018.
9.5% Senior Notes
On January 27, 2016, GCP issued $525.0 million aggregate principal amount of 9.5% Senior Notes maturing in 2023. Interest was payable semi-annually in arrears on February 1 and August 1 of each year. The 9.5% Senior Notes became callable at a premium over their face amount on February 1, 2019 and were redeemable prior to February 1, 2019 at a price that reflected a yield to the first call that was equivalent to the applicable Treasury bond yield plus 0.5 percentage points.
On April 10, 2018, GCP redeemed all of the then outstanding 9.5% Senior Notes, as described above, and paid $9.6 million of accrued interest unpaid thereon through their redemption date.
The 9.5% Senior Notes were subject to covenants that limited GCP's and certain of its subsidiaries’ ability, subject to certain exceptions and qualifications, to (i) create or incur liens on assets; (ii) incur additional debt; (iii) sell certain assets; and (iv) make certain investments and acquisitions, merge or sell or otherwise dispose of all or substantially all assets.
Debt Issuance Costs
GCP recognizes expenses directly associated with obtaining the Revolving Credit Facility as debt issuance costs which are presented within "Other assets" in the accompanying unaudited Consolidated Balance Sheets. Such costs are amortized over the term of the Revolving Credit Facility and included in “Interest expense and related financing costs” in the accompanying unaudited Consolidated Statements of Operations. Debt issuance costs related to the Revolving Credit Facility were $4.3 million as of September 30, 2018 and $3.2 million as of December 31, 2017. During the nine months ended September 30, 2018, GCP wrote off $0.4 million of debt issuance costs related to a financial institution that exited the syndicate upon amendment of the Credit Agreement which governs the Revolving Credit Facility. During the nine months ended September 30, 2018, GCP incurred debt issuance costs of $2.2 million due to the amendment of the Credit Agreement.
Debt issuance costs of $4.7 million, including loan origination fees of $3.1 million paid at the closing, are directly associated with issuing the 5.5% Senior Notes and presented as a reduction of the principal balance in the accompanying unaudited Consolidated Balance Sheets. Such costs are amortized over the term of the 5.5% Senior Notes using the effective interest rate method and included in “Interest expense and related financing costs” in the accompanying unaudited Consolidated Statements of Operations. At September 30, 2018, the remaining unamortized debt issuance costs related to the 5.5% Senior Notes were $4.5 million.
During the nine months ended September 30, 2018, GCP wrote off $6.1 million of previously deferred debt issuance costs related to the 9.5% Senior Notes in connection with their redemption.
21
Debt Fair Value
At September 30, 2018, the carrying amounts and fair values of GCP's debt were as follows:
September 30, 2018 | December 31, 2017 | ||||||||||||||
(In millions) | Carrying Amount | Fair Value | Carrying Amount | Fair Value | |||||||||||
9.5% Senior Notes due in 2023 | $ | — | $ | — | $ | 518.6 | $ | 584.5 | |||||||
5.5% Senior Notes due in 2026 | 345.5 | 344.0 | — | — | |||||||||||
Other borrowings | 12.1 | 12.1 | 25.7 | 25.7 | |||||||||||
Total debt | $ | 357.6 | $ | 356.1 | $ | 544.3 | $ | 610.2 | |||||||
Fair value is determined based on Level 2 inputs, including expected future cash flows discounted at market interest rates, estimated current market prices and quotes from financial institutions. The decrease in fair value as of September 30, 2018 was primarily due to the market trend of increasing interest rates.
5. Income Taxes
Income tax expense (benefit) attributable to continuing operations during the three months ended September 30, 2018 and 2017 was $7.6 million and ($14.5 million), respectively, representing effective tax rates of 51.0% and 44.6%, respectively. The difference between the provision for income taxes at the U.S. federal income tax rate of 21.0% and GCP’s overall income tax rate for the three months ended September 30, 2018 was primarily attributable to valuation allowances recorded of $3.6 million, the effect of tax rates in foreign jurisdictions of $0.2 million, and permanent book-to-tax differences and other items of $0.7 million. The difference between the provision for income taxes at the U.S. federal income tax rate of 35.0% and GCP's overall income tax rate for the three months ended September 30, 2017 was primarily due to $2.9 million of tax benefit on undistributed foreign earnings.
Income tax expense attributable to continuing operations during the nine months ended September 30, 2018 and 2017 was $15.8 million and $3.7 million, respectively, representing effective tax rates of 80.2% and 9.8%, respectively. The difference between the provision for income taxes at the U.S. federal income tax rate of 21.0% and GCP’s overall income tax rate for the nine months ended September 30, 2018 was primarily attributable to changes in estimates related to the 2017 Tax Act in the amount of $12.5 million, income tax valuation allowances of $4.7 million, tax rates in foreign jurisdictions of $0.9 million, and permanent book-to-tax differences and other items of $1.8 million. The difference in income tax at the U.S. federal income rate of 35.0% and GCP's overall income tax rate for the nine months ended September 30, 2017 was primarily due to an income tax valuation allowance of $13.9 million, tax expense on undistributed foreign earnings of $3.6 million, and tax benefit on permanent book-to-tax differences and other items of $0.5 million.
During the three and nine months ended September 30, 2018, GCP recorded income tax expense attributable to discontinued operations of $6.1 million and $14.0 million, respectively, compared to $200.0 million and $199.7 million, respectively, for the three and nine months ended September 30, 2017. Please refer to Note 15, "Discontinued Operations," to the accompanying unaudited Consolidated Financial Statements for further details regarding the Darex transaction.
Tax Reform
During the year ended December 31, 2017, the Company recorded a provisional net charge of $81.7 million related to the provisions of the 2017 Tax Act, which was comprised of a $70.5 million Transition Toll Tax and a $11.2 million revaluation of net deferred tax assets. Changes in tax rates and tax laws are accounted for in the period of enactment.
22
In the first quarter of 2018, the Company recorded an increase to the provisional net charge related to the 2017 Tax Act provisions of $12.5 million. This change consisted of an increase of $17.4 million related to capital gain treatment triggered in 2017 due to the 2017 Tax Act, an increase of $0.3 million deferred tax expense related to executive compensation, and a decrease of $5.2 million related to the 2017 Transition Toll Tax. There were no adjustments to the provisional net charge recorded during the second or third quarters of 2018.
The Company's preliminary estimate of the Transition Toll Tax and the remeasurement of its deferred tax assets and liabilities is subject to the finalization of management’s analysis related to certain matters, such as developing interpretations of the provisions of the 2017 Tax Act, changes to certain estimates and amounts related to the earnings and profits of certain subsidiaries and the filing of the Company's tax returns. U.S. Treasury regulations, administrative interpretations or court decisions interpreting the 2017 Tax Act may require further adjustments and changes in our estimates.
The 2017 final determination of the Transition Toll Tax and remeasurement of our deferred assets and liabilities will be completed as additional information becomes available, but no later than one year from the enactment of the 2017 Tax Act.
The 2017 Tax Act subjects a U.S. shareholder to tax on Global Intangible Low Taxed Income (GILTI) earned by foreign subsidiaries. The Company has not determined its accounting policy with respect to GILTI and has therefore included the estimate of current year GILTI as a period cost and included it as part of the estimated 2018 annual effective tax rate. The 2018 estimated annual effective tax rate also includes the 2018 impact of all other U.S. tax reform provisions that were effective on January 1, 2018.
For additional information related to the 2017 Tax Act, please refer to Note 6, "Income Taxes," to the Company's Consolidated Financial Statements included in the 2017 Annual Report on Form 10-K.
Repatriation
As of December 31, 2017, no provision has been made for income taxes on certain undistributed earnings of foreign subsidiaries the Company provisionally intends to permanently reinvest or that may be remitted substantially tax-free. Due to the transition tax on deemed repatriation required by the 2017 Tax Act, the Company has been subject to tax on substantially all of its previously undistributed earnings from foreign subsidiaries, which it provisionally recorded in the fourth quarter of 2017. Beginning in 2018, the Act will generally provide a 100% deduction for U.S. federal tax purposes of all dividends received by the Company from its foreign subsidiaries. However, the Company is currently evaluating the potential foreign and U.S. state tax liabilities that would result from future repatriations, if any, and how the 2017 Tax Act will affect the Company's existing accounting position with regard to its indefinite reinvestment of undistributed foreign earnings assertion. The Company expects to complete this evaluation and determine the impact the legislation may have on its indefinite reinvestment assertion within the measurement period provided by SAB 118.
During the nine months ended September 30, 2017, GCP determined it could no longer assert it was indefinitely reinvested in Mexico and Venezuela because these entities were anticipated to be sold as part of the Darex transaction. The tax associated with its outside book and tax basis differences in Mexico and Venezuela were recorded as discrete items resulting in a tax benefit of $2.9 million for the three months ended September 30, 2017 and a tax expense of $3.6 million for the nine months ended September 30, 2017.
GCP will continually analyze and evaluate its cash needs to determine the appropriateness of its indefinite reinvestment assertion, including further assessment under the 2017 Tax Act. The Company considers its assertion of indefinite reinvestment provisional as of September 30, 2018.
23
Valuation Allowance
In evaluating GCP's ability to realize its deferred tax assets, GCP considers all reasonably available positive and negative evidence, including recent earnings experience, expectations of future taxable income and the tax character of that income, the period of time over which temporary differences become deductible and the carryforward and/or carryback periods available to GCP for tax reporting purposes in the related jurisdiction. In estimating future taxable income, GCP relies upon assumptions and estimates about future activities, including the amount of future federal, state and foreign pretax operating income that GCP will generate; the reversal of temporary differences; and the implementation of feasible and prudent tax planning strategies. GCP records a valuation allowance to reduce deferred tax assets to the amount that it believes is more likely than not to be realized.
During the three and nine months ended September 30, 2018, GCP incurred income tax expense of $3.6 million and $4.7 million for valuation allowances recorded on losses generated in certain countries; primarily Brazil, Turkey, France, Germany, India and Singapore.
During the nine months ended September 30, 2017, GCP determined it was more likely than not a portion of its deferred tax assets would not be realized. As a result, during that period, GCP recorded $13.8 million of valuation allowances on those deferred tax assets during the period as discrete items, as they are significant, unusual and infrequent in nature. The valuation allowances were recorded against U.S. foreign tax credit carryovers of $4.3 million, and deferred tax assets primarily related to net operating loss carryovers in Brazil and Turkey of $9.1 million and $0.4 million, respectively. The determination to record the valuation allowances was made predominantly due to the anticipated sale of Darex and its impact on future taxable income and the ability to utilize those tax assets.
In connection with the Separation, GCP and Grace entered into various agreements that govern the relationship between the parties going forward, including a tax matters agreement (the "Tax Sharing Agreement"). Under the Tax Sharing Agreement, which was entered into on the distribution date, GCP and Grace will indemnify and hold each other harmless in accordance with the principles outlined therein.
During the nine months ended September 30, 2017, GCP reached a proposed favorable settlement with the Canada Revenue Agency for tax years 2007 through 2015. As a result, a tax benefit of $1.5 million, primarily for an anticipated refund of previously paid tax, was recorded during the period. GCP is required to pay Grace for the amount of the expected tax refund pursuant to the Tax Sharing Agreement. GCP also recorded a charge to its U.S. deferred tax assets of $1.6 million in the period related to the settlement due to the reduction of its step-up in tax basis. Both adjustments were recorded as discrete tax items. During the nine months ended September 30, 2018, GCP filed amended tax returns with the Canada Revenue Agency reflecting the anticipated refunds.
As discussed in Note 4, "Debt and Other Borrowings", GCP recognized a loss during the nine months ended September 30, 2018 of $59.8 million associated with its debt refinancing. Because this loss is unusual and infrequent in nature, the tax effect of the loss was recorded as a discrete tax item in the second quarter. The tax benefit recorded associated with the loss is $14.8 million.
6. Pension Plans and Other Postretirement Benefit Plans
Pension Plans
GCP sponsors certain defined benefit pension plans, primarily in the U.S. and the U.K., in which GCP employees participate. GCP records an asset or a liability to recognize the funded status of these pension plans in its accompanying unaudited Consolidated Balance Sheets.
24
The following table presents the funded status of GCP's overfunded, underfunded and unfunded defined pension plans related to continuing operations:
(In millions) | September 30, 2018 | December 31, 2017 | |||||
Overfunded defined benefit pension plans | $ | 26.1 | $ | 26.4 | |||
Underfunded defined benefit pension plans | (26.4 | ) | (26.6 | ) | |||
Unfunded defined benefit pension plans | (30.2 | ) | (30.5 | ) | |||
Total underfunded and unfunded defined benefit pension plans | (56.6 | ) | (57.1 | ) | |||
Pension liabilities included in other current liabilities | (2.0 | ) | (1.0 | ) | |||
Net funded status | $ | (32.5 | ) | $ | (31.7 | ) | |
Overfunded plans include several advance-funded plans for which the fair value of the plan assets exceeds the projected benefit obligation (the "PBO"). The overfunded status is reflected as assets in "Overfunded defined benefit pension plans" in the accompanying unaudited Consolidated Balance Sheets. Underfunded plans include a group of advance-funded plans that are underfunded on a PBO basis. Unfunded plans include several plans that are funded on a pay-as-you-go basis, and therefore, the entire PBO is unfunded. As of September 30, 2018 and December 31, 2017, the underfunded and unfunded plans are included as liabilities in the accompanying unaudited Consolidated Balance Sheets.
There were no curtailment or mark-to-market gains or losses recorded during the three months ended September 30, 2018. During the three months ended September 30, 2017, certain pension plans were curtailed and/or terminated resulting in consolidated curtailment gains of $17.1 million and consolidated mark-to-market losses of $2.9 million, of which $16.4 million and $0.1 million are presented in "Income from discontinued operations, net of income taxes" in the accompanying unaudited Consolidated Statements of Operations. Such curtailment gains and mark-to-market losses were primarily attributable to the divestiture of the Darex operating segment and restructuring activities.
During the nine months ended September 30, 2018, curtailment and mark-to-market remeasurement amounts include $0.4 million of gains recorded during the second quarter of 2018 related to a non-U.S pension plan. During the nine months ended September 30, 2017, consolidated curtailment gains amounted to $22.7 million and consolidated mark-to-market losses amounted to $2.8 million which were primarily attributable to the divestiture of the Darex operating segment, amendment to the GCP Applied Technologies, Inc. Retirement Plan for Salaried Employees that closed the plan to new hires effective January 1, 2018, as well as restructuring activities. Of those amounts, $16.9 million and $0.1 million, respectively, are presented in "Income from discontinued operations, net of income taxes" in the accompanying unaudited Consolidated Statements of Operations, in addition to expense of $0.5 million for service cost, interest cost, and expected return on plan assets. Please refer to Note 7, "Pension Plans and Other Postretirement Benefit Plans" to the Company's Consolidated Financial Statements included in the 2017 Annual Report in the Form 10-K for further information on these transactions.
Components of Net Periodic Benefit Cost
The components of GCP's net periodic benefit cost for the three and nine months ended September 30, 2018 and 2017 are as follows:
25
Three Months Ended September 30, | ||||||||||||||||
2018 | 2017 | |||||||||||||||
Pension | Pension | |||||||||||||||
(In millions) | U.S. | Non-U.S. | U.S. | Non-U.S. | ||||||||||||
Service cost | $ | 2.0 | $ | 0.8 | $ | 1.6 | $ | 0.8 | ||||||||
Interest cost | 1.4 | 1.4 | 1.3 | 1.4 | ||||||||||||
Expected return on plan assets | (1.9 | ) | (1.7 | ) | (1.4 | ) | (1.6 | ) | ||||||||
Mark-to-market adjustment | — | — | 1.2 | 1.7 | ||||||||||||
Gain on curtailments, settlements, and terminations | — | — | (2.8 | ) | (14.3 | ) | ||||||||||
Net periodic benefit cost (income) | $ | 1.5 | $ | 0.5 | $ | (0.1 | ) | $ | (12.0 | ) | ||||||
Less: Discontinued operations net periodic benefit income | — | — | (2.1 | ) | (14.4 | ) | ||||||||||
Net periodic benefit cost from continuing operations | $ | 1.5 | $ | 0.5 | $ | 2.0 | $ | 2.4 | ||||||||
Nine Months Ended September 30, | ||||||||||||||||
2018 | 2017 | |||||||||||||||
Pension | Pension | |||||||||||||||
(In millions) | U.S. | Non-U.S. | U.S. | Non-U.S. | ||||||||||||
Service cost | $ | 6.0 | $ | 2.4 | $ | 5.3 | $ | 3.0 | ||||||||
Interest cost | 4.2 | 4.2 | 4.2 | 4.3 | ||||||||||||
Expected return on plan assets | (5.7 | ) | (5.3 | ) | (4.2 | ) | (5.1 | ) | ||||||||
Mark-to-market adjustment | — | (0.3 | ) | 1.2 | 1.6 | |||||||||||
Gain on curtailments, settlements, and terminations | — | (0.1 | ) | (8.4 | ) | (14.3 | ) | |||||||||
Net periodic benefit cost (income) | $ | 4.5 | $ | 0.9 | $ | (1.9 | ) | $ | (10.5 | ) | ||||||
Less: Discontinued operations net periodic benefit income | — | — | (2.6 | ) | (13.9 | ) | ||||||||||
Net periodic benefit cost from continuing operations | $ | 4.5 | $ | 0.9 | $ | 0.7 | $ | 3.4 | ||||||||
Other Postretirement Benefit (OPEB) Plans
GCP provides postretirement health care benefits for certain qualifying retired employees. During the second quarter of 2018, GCP recognized a long-term liability of $2.0 million; accumulated other comprehensive income of $0.6 million, net of related tax impact of $0.2 million; as well as expense of $1.2 million, which are included within the accompanying unaudited Consolidated Balance Sheets and the accompanying unaudited Consolidated Statements of Operations. As of September 30, 2018, the related long-term liability of $1.8 million, accumulated other comprehensive income of $0.4 million, net of related tax impact of $0.1 million, are included within the accompanying unaudited Consolidated Balance Sheets. The related expense for the three and nine months ended September 30, 2018 was $0.1 million and $1.3 million, respectively.
Plan Contributions and Funding
GCP intends to satisfy its funding obligations under the U.S. qualified pension plans and to comply with all of the requirements of the Employee Retirement Income Security Act of 1974, as amended ("ERISA"). For ERISA purposes, funded status is calculated on a different basis than under GAAP.
GCP intends to fund non-U.S. pension plans based on applicable legal requirements, as well as actuarial and trustee recommendations. During the three and nine months ended September 30, 2018, GCP contributed $0.4 million and $4.3 million, respectively, to these non-U.S. plans, including a discretionary contribution of $2.9 million to a pension plan in Brazil. During the three and nine months ended September 30, 2017, such contributions amounted to $0.2 million and $1.9 million, respectively.
26
Defined Contribution Retirement Plan
GCP sponsors a defined contribution retirement plan for its employees in the U.S. which is a qualified plan under section 401(k) of the U.S. tax code. Under this plan, GCP contributes an amount equal to 100% of employee contributions, up to 6% of an individual employee's salary or wages. Effective January 1, 2018, GCP established an additional defined contribution plan whereby GCP contributes up to an additional 2% of 100% of applicable employee contributions. Applicable employees include those beginning employment with GCP on or after January 1, 2018 who are not eligible to participate the GCP Applied Technologies Inc. Retirement Plan for Salaried Employees, which closed to new hires effective January 1, 2018. GCP's costs related to these benefit plans are included in "Selling, general and administrative expenses" and "Cost of goods sold" in the accompanying unaudited Consolidated Statements of Operations and amounted to $1.0 million and $3.5 million, respectively, during the three and nine months ended September 30, 2018 and $1.1 million and $3.6 million, respectively, during the three and nine months ended September 30, 2017.
7. Other Balance Sheet Accounts
The following is a summary of other current assets at September 30, 2018 and December 31, 2017:
(In millions) | September 30, 2018 | December 31, 2017 | |||||
Other Current Assets: | |||||||
Non-trade receivables | $ | 26.4 | $ | 28.4 | |||
Prepaid expenses and other current assets | 9.6 | 13.8 | |||||
Income taxes receivable | 11.2 | 6.0 | |||||
Marketable securities | — | 0.4 | |||||
Total other current assets | $ | 47.2 | $ | 48.6 | |||
The following is a summary of other current liabilities at September 30, 2018 and December 31, 2017:
(In millions) | September 30, 2018 | December 31, 2017 | |||||
Other Current Liabilities: | |||||||
Accrued customer volume rebates | $ | 33.2 | $ | 31.5 | |||
Accrued compensation(1) | 16.7 | 27.1 | |||||
Income taxes payable(2) | 25.7 | 115.1 | |||||
Accrued interest | 9.4 | 20.8 | |||||
Pension liabilities | 2.0 | 1.0 | |||||
Restructuring liability | 13.3 | 12.8 | |||||
Other accrued liabilities(3) | 56.5 | 107.9 | |||||
Total other current liabilities | $ | 156.8 | $ | 316.2 | |||
(1) | Accrued compensation presented in the table above includes salaries and wages, as well as estimated current amounts due under the annual and long-term employee incentive programs. |
(2) | The change in income taxes payable between September 30, 2018 and December 31, 2017 is related primarily to the payment of $105.0 million related to the Company's provisional 2017 domestic income tax liability which was impacted by the sale of Darex and the 2017 Tax Act. |
(3) | Other accrued liabilities presented in the table above as of September 30, 2018 and December 31, 2017 include $13.1 million and $55.1 million, respectively, representing the current portion of the liability related to the delayed closings associated with the Company's divestiture of Darex, as discussed in Note 15, "Discontinued Operations." |
27
8. Commitments and Contingent Liabilities
GCP enters into certain purchase commitments and is a party to many contracts containing guarantees and indemnification obligations, as described in Note 9, "Commitments and Contingent Liabilities" to the Company's Consolidated Financial Statements included in the 2017 Annual Report in the Form 10-K. There have been no material changes to these commitments and obligations during the three and nine months ended September 30, 2018.
Environmental Matters
GCP is subject to loss contingencies resulting from extensive and evolving federal, state, local and foreign environmental laws and regulations relating to the generation, storage, handling, discharge, disposition and stewardship of hazardous wastes and other materials. GCP recognizes accrued liabilities for anticipated costs associated with response efforts if, based on the results of the assessment, it concluded that a probable liability has been incurred and the cost can be reasonably estimated. As of September 30, 2018 and December 31, 2017, GCP did not have any material environmental liabilities.
GCP's environmental liabilities are reassessed whenever circumstances become better defined or response efforts and their costs can be better estimated. These liabilities are evaluated based on currently available information, including the progress of remedial investigations at each site, the current status of discussions with regulatory authorities regarding the method and extent of remediation at each site, existing technology, prior experience in contaminated site remediation and the apportionment of costs among potentially responsible parties.
Financial Assurances
Financial assurances have been established for a variety of purposes, including insurance, environmental matters and other matters. At September 30, 2018 and December 31, 2017, GCP had gross financial assurances issued and outstanding of approximately $6 million and $10 million, respectively, which were composed of standby letters of credit.
Lawsuits and Investigations
From time to time, GCP and its subsidiaries are parties to, or targets of, lawsuits, claims, investigations and proceedings which are managed and defended in the ordinary course of business. While GCP is unable to predict the outcome of these matters, it does not believe, based upon currently available facts, that the ultimate resolution of any of such pending matters will have a material adverse effect on its overall financial condition, results of operations or cash flows for the three and nine months ended September 30, 2018.
Accounting for Contingencies
Although the outcome of each of the matters discussed above cannot be predicted with certainty, GCP has assessed the risk and has made accounting estimates and disclosures as required under GAAP.
9. Restructuring and Repositioning Expenses
GCP's Board of Directors approves all major restructuring programs that may involve the discontinuation of significant product lines or the shutdown of significant facilities. From time to time, GCP takes additional restructuring actions, including involuntary employee terminations that are not a part of a major program. Restructuring programs generally include severance and other employee-related costs, contract or lease termination costs, asset impairments, facility exit costs, moving and relocation, and other related costs.
The Company may also undertake repositioning activities that generally represent major strategic or transformational actions to enhance the value and performance of the Company, improve business efficiency or optimize the Company’s footprint. Repositioning expenses include professional fees for legal, consulting, accounting and tax services, employment-related costs, such as recruitment, relocation and compensation, as well as other expenses incurred that are directly associated with the repositioning activity. Repositioning activities may also include capital expenditures.
28
GCP recognizes restructuring and repositioning costs in the period the related liabilities are incurred and records them in "Restructuring and asset impairments" and “Repositioning expenses,” or in those captions within discontinued operations, in the accompanying unaudited Consolidated Statements of Operations. Restructuring expenses, asset impairments and repositioning expenses are excluded from segment operating income.
2018 Restructuring and Repositioning Plan (the “2018 Plan”)
On August 1, 2018, the Board of Directors of the Company approved a business restructuring and repositioning plan. The 2018 Plan is designed to streamline operations and improve profitability primarily within the concrete admixtures product line of the Specialty Construction Chemicals segment by focusing on the Company's core markets, rationalizing non-profitable geographies, reducing its global cost structure and accelerating the integration of VERIFI® into the Company’s global admixtures business.
The Company expects to incur total costs in connection with the 2018 Plan ranging from approximately $30 million to $35 million, of which costs ranging from approximately $20 million to $25 million are related to restructuring activities, and costs of approximately $10 million are related to repositioning activities.
Total expected restructuring activity costs consist of approximately $13 million to $16 million of severance and other employee-related costs, $4 million of asset impairments, $1 million to $2 million of facility exit costs and $3 million of other associated costs. Total expected restructuring activity costs are attributable as follows: (i) $18.0 million to $21.0 million to the SCC segment and (ii) $3.0 million to $4.0 million to the SBM segment. Substantially all of the restructuring actions are expected to be completed by December 31, 2019 and result in the net reduction of approximately 8%-10% of the Company's workforce.
Repositioning costs consist primarily of consulting services to assist GCP in advancing its technology strategy. Total costs expected to be incurred for repositioning activities are approximately $10 million. Substantially all of the repositioning activities are expected to be completed by December 31, 2019.
As of September 30, 2018, the cumulative restructuring activity costs recognized under the 2018 Plan since inception were $14.3 million, of which $12.0 million was attributable to the SCC segment and $2.3 million was attributable to the SBM segment. Of the $14.3 million incurred to date, $10.3 million was related to severance and employee-related costs and $4.0 million was related to asset impairments.
As of September 30, 2018, the cumulative repositioning activity costs recognized under the 2018 Plan since inception were approximately $2.6 million.
The Company expects to settle in cash approximately 70% of the restructuring costs and substantially all of the repositioning costs related to the 2018 Plan.
2017 Restructuring and Repositioning Plan (the “2017 Plan”)
On June 28, 2017, the Board of Directors approved a restructuring and repositioning plan that includes actions to streamline GCP's operations, reduce its global cost structure and reposition itself as a construction products technologies company.
GCP expects to incur total costs in connection with the 2017 Plan of approximately $30 million, of which $20 million is related to restructuring activities, and $10 million is related to repositioning activities.
Total expected restructuring activity costs consist of approximately $18 million of severance and other employee-related costs, and $2 million of asset impairments and facility exit costs. Total expected restructuring activity costs are attributable as follows: (i) $5 million to the SCC segment, (ii) $3 million to the SBM segment, (iii) $3 million to the Corporate function and (iv) $9 million to discontinued operations. The restructuring activities are expected to be substantially completed by December 31, 2018. Total costs expected to be incurred for repositioning activities are $10 million. Additionally, GCP expects to incur approximately $10 million to $15 million of capital expenditures related to repositioning activities, which includes the build-out of three manufacturing plants in Asia Pacific that will replace shared facilities sold as a part of the Darex divestiture. GCP expects all of its repositioning activities to be classified within continuing operations and such repositioning activities should be substantially completed by December 31, 2019.
29
As of September 30, 2018, the cumulative restructuring activity costs recognized under the 2017 Plan since inception were $19.4 million, of which $4.6 million was attributable to the SCC segment, $3.3 million was attributable to the SBM segment, $2.9 million was attributable to the Corporate function and $8.6 million was attributable to discontinued operations. Of the $19.4 million incurred to date, $17.6 million related to severance and employee-related costs and $1.8 million related to asset impairments and facility exit costs. As of September 30, 2018, the cumulative repositioning activity costs and capital expenditures recognized under the 2017 Plan since inception were approximately $7.6 million and $6.7 million, respectively. As of September 30, 2018, cumulative cash payments for repositioning made under the 2017 Plan from inception to date, including capital expenditures were $12.0 million.
The Company expects to settle in cash substantially all of the costs related to the 2017 Plan.
Restructuring Expenses and Asset Impairments
The following table summarizes restructuring costs and asset impairment charges related to the 2017 and 2018 Plans and other plans incurred during each period:
Three Months Ended September 30, | Nine Months Ended September 30, | ||||||||||||||
(In millions) | 2018 | 2017 | 2018 | 2017 | |||||||||||
Severance and other employee costs | $ | 10.0 | $ | 2.1 | 9.3 | $ | 19.0 | ||||||||
Facility exit costs | 0.2 | — | 0.2 | 0.1 | |||||||||||
Asset impairments | 4.1 | 0.4 | 4.5 | 0.8 | |||||||||||
Total restructuring expenses and asset impairments | $ | 14.3 | $ | 2.5 | $ | 14.0 | $ | 19.9 | |||||||
Less: restructuring expenses and asset impairments reflected in discontinued operations | — | 0.4 | 0.8 | 6.9 | |||||||||||
Total restructuring expenses and asset impairments from continuing operations | $ | 14.3 | $ | 2.1 | $ | 13.2 | $ | 13.0 | |||||||
GCP incurred restructuring costs and asset impairment charges related to its two operating segments and Corporate as follows:
Three Months Ended September 30, | Nine Months Ended September 30, | ||||||||||||||
(In millions) | 2018 | 2017 | 2018 | 2017 | |||||||||||
SCC | $ | 11.9 | $ | 0.7 | $ | 10.9 | $ | 6.2 | |||||||
SBM | 2.3 | (0.3 | ) | 1.9 | 4.1 | ||||||||||
Corporate | 0.1 | 1.7 | 0.4 | 2.7 | |||||||||||
Total restructuring expenses and asset impairments from continuing operations | $ | 14.3 | $ | 2.1 | $ | 13.2 | $ | 13.0 | |||||||
Restructuring expenses and asset impairments reflected in discontinued operations | — | 0.4 | 0.8 | 6.9 | |||||||||||
Total restructuring expenses and asset impairments | $ | 14.3 | $ | 2.5 | $ | 14.0 | $ | 19.9 | |||||||
Restructuring liabilities were $13.3 million and $12.8 million, respectively, as of September 30, 2018 and December 31, 2017. These liabilities are included within “Other current liabilities” in the accompanying unaudited Consolidated Balance Sheets. GCP expects to settle in cash substantially all of the remaining liabilities related to the 2017 Plan by March 31, 2019, and all of the remaining liabilities related to the 2018 Plan by December 31, 2019.
30
The following table summarizes the Company’s restructuring liability activity:
2018 Plan | 2017 Plan | ||||||||||||||||||||||
(In millions) | Severance and other employee costs | Facility exit costs | Severance and other employee costs | Facility exit costs | Other plans | Total | |||||||||||||||||
Balance, December 31, 2017 | $ | — | $ | — | $ | 11.6 | $ | 0.1 | $ | 1.1 | $ | 12.8 | |||||||||||
Expense(1) | 10.3 | — | (1.7 | ) | 0.2 | 0.7 | 9.5 | ||||||||||||||||
Payments | (1.2 | ) | — | (6.1 | ) | (0.1 | ) | (1.1 | ) | (8.5 | ) | ||||||||||||
Impact of foreign currency and other | — | — | (0.3 | ) | — | (0.2 | ) | (0.5 | ) | ||||||||||||||
Balance, September 30, 2018 | $ | 9.1 | $ | — | $ | 3.5 | $ | 0.2 | $ | 0.5 | $ | 13.3 | |||||||||||
(1) | Asset impairment charges of $4.5 million for the nine months ended September 30, 2018 related to the 2017 and 2018 Plans are recorded as a reduction to "Properties and equipment, net" in the accompanying unaudited Consolidated Balance Sheets. These expenses are not recorded to the restructuring liability and therefore, are not included in the table above. |
Repositioning Expenses
Repositioning Expenses - 2017 Plan and 2018 Plan
Repositioning expenses associated with the 2017 and 2018 Plans are primarily related to consulting, other professional services and recruitment costs associated with the Company’s organizational realignment and advancing its technology strategy. Due to the scope and complexity of the Company’s repositioning activities, the range of estimated repositioning expense and capital expenditures could increase or decrease and the timing of incurrence could change.
During the three and nine months ended September 30, 2018, GCP incurred repositioning expenses of $2.6 million related to the 2018 Plan. During the nine months ended September 30, 2018, the Company did not make any cash payments related to such repositioning expenses.
During the three and nine months ended September 30, 2018, GCP incurred repositioning expenses related to the 2017 Plan of $1.1 million and $3.2 million, respectively. During the three and nine months ended September 30, 2017, GCP incurred repositioning expenses of $1.1 million and $1.5 million, respectively, related to the 2017 Plan. During the nine months ended September 30, 2018, total cash payments related to such repositioning expenses were $10.0 million, which included $5.5 million for capital expenditures.
Separation-Related Repositioning Expenses
Post-Separation, GCP incurred expenses related to its transition to a stand-alone public company and completed these activities as of December 31, 2017. The Company did not incur any costs related to such activities during the three and nine months ended September 30, 2018. Please refer to Note 10, "Restructuring and Repositioning Expenses" to the Company's Consolidated Financial Statements included in the 2017 Annual Report in the Form 10-K for further information.
Separation-related repositioning expenses incurred for the three and nine months ended September 30, 2017 were as follows:
Three Months Ended September 30, 2017 | Nine Months Ended September 30, 2017 | ||||||
(In millions) | |||||||
Professional fees | $ | — | $ | 3.4 | |||
Software and IT implementation fees | — | 0.9 | |||||
Employee-related costs | — | 1.0 | |||||
Total | $ | — | $ | 5.3 | |||
31
Total cash payments for the nine months ended September 30, 2017 were $4.2 million for separation-related repositioning expenses and $1.9 million for capital-related expenditures. There were no such payments made during the three and nine months ended September 30, 2018.
10. Other Comprehensive (Loss) Income
The following tables present the pre-tax, tax and after-tax components of GCP's other comprehensive (loss) income for the three and nine months ended September 30, 2018 and 2017:
Three Months Ended September 30, 2018 | |||||||||||
(In millions) | Pre-Tax Amount | Tax (Expense) | After-Tax Amount | ||||||||
Defined benefit pension and other postretirement plans | $ | 0.3 | $ | (0.1 | ) | $ | 0.2 | ||||
Currency translation adjustments (1) | (9.1 | ) | — | (9.1 | ) | ||||||
Other comprehensive loss attributable to GCP shareholders | $ | (8.8 | ) | $ | (0.1 | ) | $ | (8.9 | ) | ||
Nine Months Ended September 30, 2018 | |||||||||||
(In millions) | Pre-Tax Amount | Tax Benefit | After-Tax Amount | ||||||||
Defined benefit pension and other postretirement plans | $ | (0.5 | ) | $ | 0.1 | $ | (0.4 | ) | |||
Currency translation adjustments (1) | (27.3 | ) | — | (27.3 | ) | ||||||
Gain from hedging activities | 0.1 | — | 0.1 | ||||||||
Other comprehensive loss attributable to GCP shareholders | $ | (27.7 | ) | $ | 0.1 | $ | (27.6 | ) | |||
Three Months Ended September 30, 2017 | |||||||||||
(In millions) | Pre-Tax Amount | Tax Expense | After-Tax Amount | ||||||||
Defined benefit pension and other postretirement plans | $ | (0.3 | ) | $ | — | $ | (0.3 | ) | |||
Currency translation adjustments (1) | 46.2 | — | 46.2 | ||||||||
Gain from hedging activities | 0.8 | (0.3 | ) | 0.5 | |||||||
Other comprehensive income attributable to GCP shareholders | $ | 46.7 | $ | (0.3 | ) | $ | 46.4 | ||||
Nine Months Ended September 30, 2017 | |||||||||||
(In millions) | Pre-Tax Amount | Tax Benefit | After-Tax Amount | ||||||||
Defined benefit pension and other postretirement plans | $ | (0.3 | ) | $ | — | $ | (0.3 | ) | |||
Currency translation adjustments (1) | 63.0 | — | 63.0 | ||||||||
Loss from hedging activities | (0.1 | ) | — | (0.1 | ) | ||||||
Other comprehensive income attributable to GCP shareholders | $ | 62.6 | $ | — | $ | 62.6 | |||||
(1) Currency translation adjustments did not have a corresponding tax effect.
32
The following tables present the changes in accumulated other comprehensive loss, net of tax, for the nine months ended September 30, 2018 and 2017:
(In millions) | Defined Benefit Pension and Other Postretirement Plans | Currency Translation Adjustments | Hedging Activities | Total | |||||||||||
Balance, December 31, 2017 | $ | 0.4 | $ | (86.0 | ) | $ | (0.1 | ) | $ | (85.7 | ) | ||||
Other comprehensive (loss) income before reclassifications | (0.4 | ) | (27.3 | ) | 0.2 | (27.5 | ) | ||||||||
Amounts reclassified from accumulated other comprehensive (loss) income | — | — | (0.1 | ) | (0.1 | ) | |||||||||
Current-period other comprehensive (loss) income | (0.4 | ) | (27.3 | ) | 0.1 | (27.6 | ) | ||||||||
Balance, September 30, 2018 | $ | — | $ | (113.3 | ) | $ | — | $ | (113.3 | ) | |||||
(In millions) | Defined Benefit Pension and Other Postretirement Plans | Currency Translation Adjustments | Hedging Activities | Total | |||||||||||
Balance, December 31, 2016 | $ | 0.1 | $ | (147.7 | ) | $ | — | $ | (147.6 | ) | |||||
Other comprehensive (loss) income before reclassifications | (0.3 | ) | 63.0 | (0.7 | ) | 62.0 | |||||||||
Amounts reclassified from accumulated other comprehensive (loss) income | — | — | 0.6 | 0.6 | |||||||||||
Net current-period other comprehensive (loss) income | (0.3 | ) | 63.0 | (0.1 | ) | 62.6 | |||||||||
Balance, September 30, 2017 | $ | (0.2 | ) | $ | (84.7 | ) | $ | (0.1 | ) | $ | (85.0 | ) | |||
GCP is a global enterprise operating in over 35 countries with the local currency generally deemed to be the functional currency for accounting purposes. The currency translation adjustments reflect translation of the balance sheets valued in functional currencies to the U.S. dollar as of the end of each period presented and translation of revenues and expenses at average exchange rates for each period presented.
As of June 30, 2018, GCP concluded that Argentina is a highly inflationary economy since the three-year cumulative inflation rates commonly used to evaluate Argentina’s inflation currently exceed 100%. As a result, GCP began accounting for its operations in Argentina as a highly inflationary economy effective July 1, 2018. Please refer to Note 1, "Basis of Presentation and Summary of Significant Accounting and Financial Reporting Policies" for further discussion of currency transaction of highly inflationary economies.
Please refer to Note 6, "Pension Plans and Other Postretirement Benefit Plans," for a discussion of pension plans and other postretirement benefit plans.
11. Stock Incentive Plans
GCP grants stock options, restricted stock units (the "RSUs") and performance-based units (the "PBUs") with or without market conditions which vest upon the satisfaction of a performance condition and/or a service condition. Please refer to Note 13, "Stock Incentive Plans" to the Company's Consolidated Financial Statements included in the 2017 Annual Report in the Form 10-K for further information on these awards.
33
Stock-Based Compensation Accounting
In accordance with U.S. GAAP, GCP estimates the fair value of equity awards issued at the grant date. The fair value of the awards is recognized as stock-based compensation expense on a straight line basis, net of estimated forfeitures, over the employee’s requisite service period for each separately vesting portion of the award. Total stock-based compensation (benefit) expense related to cash and non-cash settled awards is included in "Income (loss) from continuing operations before income taxes" in the accompanying unaudited Consolidated Statements of Operations and was $(0.3) million and $4.6 million, respectively, for the three and nine months ended September 30, 2018 and $2.0 million and $7.7 million, respectively, for the three and nine months ended September 30, 2017. During the three months ended September 30, 2018, the Company recorded a stock-based compensation expense reduction of $2.8 million related to remeasurement of PBUs granted in 2017 based on their estimated expected payout at the end of the applicable performance period. For further information with regards to the valuation of PBUs, please refer to Note 13, “Stock Incentive Plans,” the Company’s Consolidated Financial Statements included in the 2017 Annual Report on Form 10-K.
The Company issues new shares of common stock upon exercise of stock options. In accordance with certain provisions of the GCP Equity and Incentive Plan (the "Plan"), GCP repurchases shares issued to certain holders of GCP awards in order to fulfill statutory tax withholding requirements for the employee. During the nine months ended September 30, 2018 and 2017, GCP repurchased approximately 45,000 shares and 37,000 shares, respectively, under the provisions of the Plan. These purchases are reflected as "Share Repurchases" in the accompanying unaudited Consolidated Statements of Equity (Deficit).
As of September 30, 2018, approximately 8.3 million shares of common stock were reserved and available for future grant under the Plan.
Stock Options
Stock options are non-qualified and granted at exercise prices not less than 100% of fair market value on the grant date. The awards issued before February 28, 2017 were granted at the exercise price equal to fair market value on the grant date determined as the average of the high market price and low market price of the Company’s stock from that trading day. The awards issued after February 28, 2017 were granted at the exercise price equal to fair market value on the grant date determined as the market closing price of the Company’s stock on that date. Stock option awards that relate to Grace stock options originally granted prior to the Separation have a contractual term of five years from the original date of grant. Stock option awards granted post-Separation have a contractual term of seven or ten years from the original date of grant. Generally, stock options vest in substantially equal amounts each year over three years from the date of grant.
GCP values stock options using the Black-Scholes option pricing model for estimating the fair value of options granted. For further information with regards to the valuation of stock options, please refer to Note 13, “Stock Incentive Plans,” the Company’s Consolidated Financial Statements included in the 2017 Annual Report on Form 10-K.
The following summarizes GCP's assumptions for estimating the fair value of stock options granted during 2018 and 2017:
Nine Months Ended September 30, | |||
Assumptions used to calculate expense for stock options: | 2018 | 2017 | |
Risk-free interest rate | 2.68-2.90% | 1.83 - 2.10% | |
Average life of options (years) | 5.5-6.5 | 5.5 - 6.5 | |
Volatility | 27.91-30.65% | 31.42 - 31.96% | |
Dividend yield | — | — | |
Weighted average fair value per stock option | $10.63 | $9.16 | |
34
The following table sets forth information relating to stock options denominated in GCP stock during the nine months ended September 30, 2018:
Stock Option Activity | Number Of Shares (in thousands) | Weighted Average Exercise Price | Weighted Average Remaining Contractual Term (years) | Aggregated Intrinsic Value (in thousands) | ||||||||
Outstanding, December 31, 2017 | 1,636 | $ | 18.94 | 3.78 | $ | 21,597 | ||||||
Options exercised | 314 | 16.76 | ||||||||||
Options forfeited/expired/canceled | 25 | 25.41 | ||||||||||
Options granted | 241 | 31.31 | ||||||||||
Outstanding, September 30, 2018 | 1,538 | $ | 21.21 | 3.99 | $ | 9,262 | ||||||
Exercisable, September 30, 2018 | 968 | $ | 18.87 | 2.79 | $ | 7,339 | ||||||
Vested and expected to vest, September 30, 2018 | 1,520 | $ | 21.15 | 3.96 | $ | 9,222 | ||||||
The aggregate intrinsic values in the table above represent the total pre-tax intrinsic value, determined as the difference between GCP's closing stock price on the last trading day of September 30, 2018 and the exercise price, multiplied by the number of in-the-money options that would have been received by the option holders had all option holders exercised their in-the-money options at period end. The amount changes based on the fair market value of GCP's stock. Total intrinsic value of all options exercised during the three and nine months ended September 30, 2018 was $0.1 million, and $4.8 million, respectively, and during the three and nine months ended September 30, 2017 was $0.2 million and $8.3 million, respectively.
At September 30, 2018, total unrecognized stock-based compensation expense for stock options outstanding was $1.3 million and is expected to be recognized over the weighted-average period of approximately 1.0 year.
Restricted Stock Units and Performance Based Units
RSUs and PBUs are granted with the exercise price equal to zero and are converted to shares immediately upon vesting.
As of September 30, 2018, $6.3 million of total unrecognized compensation expense related to the RSU and PBU awards is expected to be recognized over the remaining weighted-average service period of approximately 1.2 years.
RSUs
The Company grants RSUs which are time-based, non-performance units. RSUs generally vest over a three year period, with some awards vesting in substantially equal amounts each year over three years and some awards vesting 100% after the third year from the date of grant. A smaller number of RSUs were designated as sign-on awards which are used for the purposes of attracting key employees and covering outstanding awards from prior employers. Such awards vest 100% after two years from the date of grant.
RSUs are recorded at fair value on the date of grant. The common stock-settled awards are considered equity awards, with the stock compensation expense being determined based on GCP’s stock price on the grant date. The cash settled awards are considered liability awards, with the liability being remeasured each reporting period based on GCP’s then current stock price.
35
GCP’s RSU activity for the nine months ended September 30, 2018 is presented below:
RSU Activity | Number Of Shares (in thousands) | Weighted Average Grant Date Fair Value | ||||
Outstanding, December 31, 2017 | 406 | $ | 19.15 | |||
RSUs settled | 158 | 18.36 | ||||
RSUs forfeited | 10 | 27.97 | ||||
RSUs granted | 129 | 29.28 | ||||
RSUs outstanding, September 30, 2018 | 367 | $ | 22.83 | |||
During the nine months ended September 30, 2018, GCP distributed 115,932 shares and $1.2 million of cash to settle RSUs upon vesting. GCP expects all future RSU vestings to settle in stock.
PBUs
PBUs are performance-based units which are granted by the Company either with or without market conditions. Such PBUs are expected to cliff vest over three years and will be settled in GCP common stock. PBUs are remeasured during each reporting period based on their expected payout, which may range from 0% to 200% of the targets for such awards. Therefore, the stock-based compensation expense recognized for these awards during each reporting period is subject to volatility until the final payout target is determined at the end of the applicable performance period.
Beginning with the annual PBU grant in the first quarter of 2017, the performance criteria for PBUs included a 3-year cumulative adjusted diluted earnings per share metric that is modified, up or down, based on the Company's relative total shareholder return ("TSR") against the Russell 3000 Index ("the Index"). The number of shares that ultimately vest, if any, is based on Company performance against these metrics, and can range from 0% to 200% of the target number of shares granted to the employee. The 2018 and 2017 awards will become vested, if at all, three years from the grant date once actual performance is certified by the Board's Compensation Committee. Vesting is also subject to the employees' continued employment through the vesting date.
PBUs granted during the three and nine months ended September 30, 2018 and 2017 were valued using a Monte Carlo simulation, which is commonly used for assessing the grant date fair value of equity awards with relative TSR metrics. For further information with regards to the valuation of PBUs, please refer to Note 13, “Stock Incentive Plans,” the Company’s Consolidated Financial Statements included in the 2017 Annual Report on Form 10-K.
The following summarizes the assumptions used in the Monte Carlo simulations for estimating the grant date fair values of PBUs granted during the nine months ended September 30, 2018 and 2017:
Nine Months Ended September 30, | |||
Assumptions used to calculate expense for PBUs: | 2018 | 2017 | |
Expected Term (Remaining Performance Period) | 2.86 | 2.84 | |
Expected volatility | 28.56% | 28.00% | |
Risk-free interest rate | 2.38% | 1.41% | |
Expected dividends | — | — | |
Correlation coefficient | 38.98% | 46.83% | |
Average correlation coefficient of constituents | 39.96% | 42.33% | |
During the nine months ended September 30, 2018, GCP granted 149,974 PBUs to Company employees. The weighted average grant date fair value of PBUs granted during the nine months ended September 30, 2018 was $34.20. During the nine months ended September 30, 2018, 3,369 of these PBUs were forfeited.
36
PBUs that were granted during the year ended December 31, 2017 to Company employees remain outstanding as of September 30, 2018 and the weighted average grant date fair value was $28.29. During the nine months ended September 30, 2018, 8,897 of these PBUs were forfeited.
PBUs that were granted during the year ended December 31, 2016 to Company employees remain outstanding as of September 30, 2018 and the weighted average grant date fair value of these awards was $17.04. During the nine months ended September 30, 2018, none of these awards were forfeited.
12. Earnings Per Share
The following table shows a reconciliation of the numerators and denominators used in calculating basic and diluted earnings (loss) per share:
Three Months Ended September 30, | Nine Months Ended September 30, | ||||||||||||||
(In millions, except per share amounts) | 2018 | 2017 | 2018 | 2017 | |||||||||||
Numerators | |||||||||||||||
Income (loss) from continuing operations attributable to GCP shareholders | $ | 7.2 | $ | (18.1 | ) | $ | (35.8 | ) | $ | (41.8 | ) | ||||
Income from discontinued operations, net of income taxes | 18.2 | 677.3 | 26.7 | 679.4 | |||||||||||
Net income (loss) attributable to GCP shareholders | $ | 25.4 | $ | 659.2 | $ | (9.1 | ) | $ | 637.6 | ||||||
Denominators | |||||||||||||||
Weighted average common shares—basic calculation | 72.2 | 71.6 | 72.1 | 71.2 | |||||||||||
Dilutive effect of employee stock awards(1) | 0.5 | — | — | — | |||||||||||
Weighted average common shares—diluted calculation | 72.7 | 71.6 | 72.1 | 71.2 | |||||||||||
Basic earnings (loss) per share | |||||||||||||||
Income (loss) from continuing operations attributable to GCP shareholders | $ | 0.10 | $ | (0.25 | ) | $ | (0.50 | ) | $ | (0.59 | ) | ||||
Income from discontinued operations, net of income taxes | $ | 0.25 | $ | 9.46 | $ | 0.37 | $ | 9.54 | |||||||
Net income (loss) attributable to GCP shareholders(2) | $ | 0.35 | $ | 9.21 | $ | (0.13 | ) | $ | 8.96 | ||||||
Diluted earnings (loss) per share | |||||||||||||||
Income (loss) from continuing operations attributable to GCP shareholders | $ | 0.10 | $ | (0.25 | ) | $ | (0.50 | ) | $ | (0.59 | ) | ||||
Income from discontinued operations, net of income taxes | $ | 0.25 | $ | 9.46 | $ | 0.37 | $ | 9.54 | |||||||
Net income (loss) attributable to GCP shareholders(2) | $ | 0.35 | $ | 9.21 | $ | (0.13 | ) | $ | 8.96 | ||||||
________________________________
(1) | Dilutive effect not applicable to periods in which GCP generated a loss from continuing operations. |
(2) | Amounts may not sum due to rounding. |
GCP uses the treasury stock method to compute diluted earnings (loss) per share. During the three months ended September 30, 2018, 0.4 million of anti-dilutive stock awards were excluded from the computation of diluted earnings per share based on the treasury stock method as a result of an income from continuing operations generated during the period then ended.
During the nine months ended September 30, 2018 and the three and nine months ended September 30, 2017, there were no anti-dilutive shares based on the treasury stock method as a result of a loss from continuing operations incurred during the periods then ended. As of September 30, 2018, total outstanding options of 1.5 million and total outstanding RSUs of 0.4 million were excluded from the computation of diluted loss per share during the nine months ended September 30, 2018. Additionally, as of September 30, 2017, total outstanding options of 1.7 million and total outstanding RSUs of 0.4 million were excluded from the computation of diluted loss per share during the three and nine months ended September 30, 2017.
37
The following table summarizes options and RSUs excluded from dilutive shares and diluted loss per share shown in the table above:
Three Months Ended September 30, | Nine Months Ended September 30, | |||||||||
(In millions of shares) | 2018 | 2017 | 2018 | 2017 | ||||||
Dilutive effect: | ||||||||||
Options(1) | N/A | 0.6 | 0.5 | 0.7 | ||||||
RSUs(1) | N/A | 0.4 | 0.2 | 0.4 | ||||||
(1) | N/A - Dilutive effect is included in computation of diluted earnings per share under the treasury stock method for periods in which GCP generated income from continuing operations. |
During the nine months ended September 30, 2018 and 2017, GCP repurchased approximately 45,000 and 37,000 shares of Company common stock for $1.3 million and $1.0 million, respectively, in connection with its equity compensation programs.
13. Related Party Transactions and Transactions with Grace
Transition Services Agreement
In connection with the Separation, the Company and Grace entered into a transition services agreement pursuant to which GCP and Grace provided various services to each other on a transitional basis which ended during the third quarter of 2017. During the three and nine months ended September 30, 2018 there were no services rendered between GCP and Grace. Please refer to Note 12, "Related Party Transactions and Transactions with Grace," to the Company's Consolidated Financial Statements included in the 2017 Annual Report in the Form 10-K for further information regarding the transaction services agreement.
Tax Sharing Agreement
In connection with the Separation, the Company and Grace entered into a Tax Sharing Agreement which governs the parties’ respective rights, responsibilities and obligations with respect to tax liabilities and benefits, tax attributes, the preparation and filing of tax returns, the control of audits and other tax proceedings, and other matters regarding taxes. In general, and subject to the terms of the Tax Sharing Agreement, GCP is responsible for all U.S. federal, state and foreign taxes (and any related interest, penalties or audit adjustments) reportable on a GCP separate return (a return that does not include Grace or any of its subsidiaries); and Grace is responsible for all U.S. federal, state and foreign income taxes (and any related interest, penalties or audit adjustments) reportable on a consolidated, combined or unitary return that includes Grace or any of its subsidiaries and GCP or any of its subsidiaries up to the Separation date. GCP has recorded $7.2 million of indemnified receivables in "Other assets" as of September 30, 2018 and December 31, 2017. GCP has recorded $2.2 million and $2.7 million, respectively, of indemnified payables in "Other current liabilities" as of September 30, 2018 and December 31, 2017.
In addition, the Tax Sharing Agreement imposes certain restrictions on GCP and its subsidiaries (including restrictions on share issuances, business combinations, sales of assets and similar transactions) that are designed to preserve the qualification of the Distribution, together with certain related transactions, under Section 355 and certain other relevant provisions of the Code. The Tax Sharing Agreement provides special rules that allocate tax liabilities in the event the Distribution, together with certain related transactions, does not so qualify. In general, under the Tax Sharing Agreement, each party is expected to be responsible for any taxes imposed on, and certain related amounts payable by, GCP or Grace that arise from the failure of the Distribution and certain related transactions, to qualify under Section 355 and certain other relevant provisions of the Code, to the extent that the failure to so qualify is attributable to actions, events or transactions relating to such party’s respective stock, assets or business, or a breach of the relevant representations or covenants made by such party in the Tax Sharing Agreement.
38
14. Operating Segment and Geographic Information
GCP is engaged in the production and sale of specialty construction chemicals and specialty building materials through two operating segments. Specialty Construction Chemicals operating segment manufactures and markets concrete admixtures and cement additives. Specialty Building Materials operating segment manufactures and markets sheet and liquid membrane systems that protect structures from water, air and vapor penetration, as well as fireproofing and other products designed to protect the building envelope.
Operating Segment Data
The following table presents information related to GCP's operating segments:
Three Months Ended September 30, | Nine Months Ended September 30, | ||||||||||||||
(In millions) | 2018 | 2017 | 2018 | 2017 | |||||||||||
Net Sales | |||||||||||||||
Specialty Construction Chemicals | $ | 165.4 | $ | 156.2 | $ | 487.4 | $ | 449.1 | |||||||
Specialty Building Materials | 130.9 | 126.2 | 361.9 | 345.8 | |||||||||||
Total net sales | $ | 296.3 | $ | 282.4 | $ | 849.3 | $ | 794.9 | |||||||
Segment Operating Income | |||||||||||||||
Specialty Construction Chemicals segment operating income | $ | 12.7 | $ | 15.7 | $ | 31.2 | $ | 44.5 | |||||||
Specialty Building Materials segment operating income | 34.3 | 30.1 | 84.2 | 80.6 | |||||||||||
Total segment operating income | $ | 47.0 | $ | 45.8 | $ | 115.4 | $ | 125.1 | |||||||
Reconciliation of Operating Segment Data to Financial Statements
Corporate expenses directly related to the operating segments are allocated to the segment's operating income. GCP excludes from the segments' operating income certain functional costs, certain impacts of foreign currency exchange (related primarily to Venezuela for periods up through the deconsolidation date of July 3, 2017, as discussed in Note 1, "Basis of Presentation and Summary of Significant Accounting and Financial Reporting Policies"), as well as other corporate costs included in the table below. GCP also excludes from the segment's operating income certain ongoing defined benefit pension costs recognized during each reporting period, which include service and interest costs, the effect of expected returns on plan assets and amortization of prior service costs/credits. GCP believes that the exclusion of certain corporate costs and pension costs provides a better indicator of its operating segment performance since such costs are not managed at an operating segment level.
39
Total segment operating income for the three and nine months ended September 30, 2018 and 2017, is reconciled below to "Income (loss) from continuing operations before income taxes" presented in the accompanying unaudited Consolidated Statements of Operations:
Three Months Ended September 30, | Nine Months Ended September 30, | ||||||||||||||
(In millions) | 2018 | 2017 | 2018 | 2017 | |||||||||||
Total segment operating income | $ | 47.0 | $ | 45.8 | $ | 115.4 | $ | 125.1 | |||||||
Corporate costs(1) | (5.3 | ) | (7.5 | ) | (22.8 | ) | (28.9 | ) | |||||||
Certain pension costs | (2.0 | ) | (2.1 | ) | (5.8 | ) | (7.0 | ) | |||||||
Loss on sale of product line | — | — | — | (2.1 | ) | ||||||||||
Currency and other financial losses in Venezuela | — | (36.7 | ) | — | (39.1 | ) | |||||||||
Litigation settlement | — | (4.0 | ) | — | $ | (4.0 | ) | ||||||||
Repositioning expenses | (3.7 | ) | (1.1 | ) | (5.8 | ) | $ | (6.8 | ) | ||||||
Restructuring expenses and asset impairments | (14.3 | ) | (2.1 | ) | (13.2 | ) | $ | (13.0 | ) | ||||||
Pension MTM adjustment and other related costs, net | — | (3.0 | ) | (0.9 | ) | $ | (2.9 | ) | |||||||
Gain on termination and curtailment of pension and other postretirement plans | — | 0.8 | 0.1 | $ | 5.9 | ||||||||||
Third-party and other acquisition-related costs | (0.5 | ) | (2.0 | ) | (2.1 | ) | $ | (5.0 | ) | ||||||
Amortization of acquired inventory fair value adjustment | — | (0.2 | ) | (0.2 | ) | $ | (2.9 | ) | |||||||
Tax indemnification adjustments | — | — | — | (2.4 | ) | ||||||||||
Net income attributable to noncontrolling interests | 0.1 | 0.1 | 0.3 | 0.2 | |||||||||||
Other financing costs | — | (6.0 | ) | — | (6.0 | ) | |||||||||
Interest expense, net(2) | (5.3 | ) | (14.5 | ) | (83.6 | ) | (49.0 | ) | |||||||
Currency losses in Argentina | (1.1 | ) | — | (1.1 | ) | — | |||||||||
Income (loss) from continuing operations before income taxes | $ | 14.9 | $ | (32.5 | ) | $ | (19.7 | ) | $ | (37.9 | ) | ||||
(1) | Management allocates corporate costs to each segment to the extent such costs are directly attributable to the segments. Corporate costs include approximately $5.4 million of allocated costs during the nine months ended September 30, 2017 that were previously reported within the Darex operating segment since such costs did not meet the criteria to be reclassified to discontinued operations. Beginning with the third quarter of 2017, the Company began allocating these costs to its remaining operating segments. |
(2) | Interest expense, net includes a loss of $59.8 million as a result of debt refinancing transaction completed on April 10, 2018. Please refer to Note 4, "Debt and Other Borrowings" for further information on the transaction. |
Disaggregation of Total Net Sales
The Company disaggregates its revenue from contracts with customers by operating segments, which it believes best depicts how the nature, amount, timing and uncertainty of revenue and cash flows are affected by economic factors.
40
Geographic Area Data
The table below presents information related to the geographic areas in which GCP operates. Sales are attributed to geographic areas based on customer location.
Three Months Ended September 30, | Nine Months Ended September 30, | ||||||||||||||
(In millions) | 2018 | 2017 | 2018 | 2017 | |||||||||||
Net Sales | |||||||||||||||
United States | $ | 144.4 | $ | 132.5 | $ | 402.4 | $ | 374.2 | |||||||
Canada and Puerto Rico | 9.7 | 9.0 | 24.0 | 21.8 | |||||||||||
Total North America | 154.1 | 141.5 | 426.4 | 396.0 | |||||||||||
Europe Middle East Africa | 61.7 | 67.0 | 189.2 | 178.9 | |||||||||||
Asia Pacific | 63.9 | 58.0 | 181.6 | 168.4 | |||||||||||
Latin America | 16.6 | 15.9 | 52.1 | 51.6 | |||||||||||
Total | $ | 296.3 | $ | 282.4 | $ | 849.3 | $ | 794.9 | |||||||
15. Discontinued Operations
On July 3, 2017, the Company completed the sale of Darex to Henkel for $1.06 billion in cash (the “Disposition”). In accordance with applicable accounting guidance, the assets and liabilities of the Darex business in the delayed close countries are categorized as "Assets held for sale" or "Liabilities held for sale" in the accompanying unaudited Consolidated Balance Sheets as of September 30, 2018 and December 31, 2017. In addition, Darex results have been reclassified and reflected as "discontinued operations" in the accompanying unaudited Consolidated Statements of Operations and accompanying unaudited Consolidated Statements of Cash Flows for all periods presented.
The agreement with Henkel governing the Disposition (the “Amended Purchase Agreement”) provides for a series of delayed closings in certain non-U.S. jurisdictions, including Argentina, China, Colombia, Indonesia, Peru and Venezuela for which sale proceeds were received on the July 3, 2017 closing date. The delayed closings will implement the legal transfer of the Darex business in the delayed closing jurisdictions in accordance with local law. The delayed closings in Argentina, Colombia, and Peru were completed during the first half of 2018. During the three months ended September 30, 2018, the delayed closing in China was completed. During the three and nine months ended September 30, 2018, the Company recorded an after-tax gain of $18.8 million and $29.1 million, respectively, on the sale of the delayed close entities in these countries. During each of the three and nine months ended September 30, 2017, the Company recorded an after-tax gain of $683.7 million on the sale of the Darex entities that closed on July 3, 2017. The remaining delayed closings in Indonesia and Venezuela are expected to be completed over the following 4 to 15 months. Up to the time of the delayed closings for these countries, the results of the operations of the Darex business in the delayed close countries are reported as “Income from discontinued operations, net of income taxes” in the accompanying unaudited Consolidated Statements of Operations and reflect an economic benefit payable to or recoverable from Henkel, as applicable for each reporting period.
As of December 31, 2017, a liability of $55.1 million and $13.6 million, respectively, related to the consideration received by GCP for the delayed closings was recognized in “Other current liabilities” and “Other liabilities." During the nine months ended September 30, 2018, GCP reduced the liability by $55.1 million which consisted primarily of the sale proceeds received on July 3, 2017 for the delayed closings in Argentina, Colombia, Peru, and China completed during the period then ended. The remaining liability of $13.1 million and $0.5 million, respectively, for the consideration received on the closing date related to the remaining delayed closing countries is recorded in “Other current liabilities” and "Other liabilities" as of September 30, 2018.
41
The following table includes a reconciliation of the gain on the sale of the Darex business related to delayed close entities recorded during the three and nine months ended September 30, 2018 and September 30, 2017:
Three Months Ended September 30, | Nine Months Ended September 30, | |||||||||||
(In millions) | 2018 | 2017 | 2018 | 2017 | ||||||||
Net proceeds included in gain | $ | 30.4 | $ | 1,000.2 | $ | 55.4 | $ | 1,000.2 | ||||
Less: Transaction costs | — | 15.9 | — | 15.9 | ||||||||
Less: Net assets derecognized | 5.4 | 100.6 | 11.9 | 100.6 | ||||||||
Gain recognized before income taxes | 25.0 | 883.7 | 43.5 | 883.7 | ||||||||
Less: Tax effect of gain recognized | 6.2 | 200.0 | 14.4 | 200.0 | ||||||||
Gain recognized after income taxes | $ | 18.8 | $ | 683.7 | $ | 29.1 | $ | 683.7 | ||||
In connection with the Disposition and related tax gain, as noted above, the Company recorded tax expense of $6.2 million and $14.4 million, respectively, within discontinued operations during the three and nine months ended September 30, 2018 and $200.0 million during the three and nine months ended September 30, 2017. The tax consequences of the Disposition are complex and the calculation of the provision is based on management’s best estimate using all readily accessible information. Management is in the process of completing further analysis related to the stock basis, earnings and profits, tax pools, transaction costs and other related components associated with the Disposition. Based on the overall complexity of the calculation, management believes that there is a reasonable possibility that differences between the estimated tax provision and actual outcome may result within the next three months, which could have a material impact on the Company's results of operations.
In connection with the Disposition, the Company and Henkel also entered into a Transition Services Agreement pursuant to which Henkel and the Company will provide various services to each other in connection with the transition of the Darex business to Henkel. The Company and Henkel expect to perform these services, which relate to real estate, information technology, accounts payable, payroll and other financial functions and administrative services, for various periods up to 24 months following the closing date. The charges for such services generally allow the servicing party to recover all out-of-pocket costs and expenses and are recorded in "Other income, net" on the accompanying unaudited Consolidated Statements of Operations.
Additionally, in connection with the Disposition, the Company and Henkel entered into a Master Tolling Agreement, whereby Henkel will operate certain equipment at facilities being sold in order to manufacture and prepare for shipping certain products related to product lines that the Company continues to own. The Company and Henkel expect these services to be provided for a period of 24 months following the closing date.
Under the Amended Purchase Agreement, GCP is required to indemnify Henkel for certain possible future tax liabilities. GCP has recorded an indemnification payable of $3.2 million and $3.3 million, respectively, in this regard as a result of the Disposition as of September 30, 2018 and December 31, 2017.
42
The components of "Income from discontinued operations, net of income taxes" in the accompanying unaudited Consolidated Statements of Operations are comprised of the following:
Three Months Ended September 30, | Nine Months Ended September 30, | ||||||||||||||
(In millions) | 2018 | 2017 | 2018 | 2017 | |||||||||||
Net sales | $ | 1.7 | $ | 9.1 | $ | 13.3 | $ | 156.9 | |||||||
Cost of goods sold | 1.2 | 6.0 | 13.9 | 104.6 | |||||||||||
Gross profit | 0.5 | 3.1 | (0.6 | ) | 52.3 | ||||||||||
Selling, general and administrative expenses | 1.3 | 6.6 | 4.6 | 40.1 | |||||||||||
Research and development expenses | — | 0.1 | — | 2.3 | |||||||||||
Restructuring and asset impairments | — | 0.4 | 0.8 | 6.9 | |||||||||||
Gain on sale of business | (25.0 | ) | (883.7 | ) | (43.5 | ) | (883.7 | ) | |||||||
Other (income) expenses, net | (0.1 | ) | 2.4 | (3.2 | ) | 7.5 | |||||||||
Total income | (23.8 | ) | (874.2 | ) | (41.3 | ) | (826.9 | ) | |||||||
Income from discontinued operations before income taxes | 24.3 | 877.3 | 40.7 | 879.2 | |||||||||||
Provision for income taxes | (6.1 | ) | (200.0 | ) | (14.0 | ) | (199.7 | ) | |||||||
Less: Net income attributable to noncontrolling interests | — | — | — | (0.1 | ) | ||||||||||
Income from discontinued operations, net of income taxes | $ | 18.2 | $ | 677.3 | $ | 26.7 | $ | 679.4 | |||||||
The carrying amounts of the major classes of assets and liabilities of Darex classified as held for sale in the accompanying unaudited Consolidated Balance Sheets as of September 30, 2018 and December 31, 2017 consist of the following:
(In millions) | September 30, 2018 | December 31, 2017 | |||||
Trade accounts receivable | $ | 1.7 | $ | 8.4 | |||
Inventories | 1.4 | 10.6 | |||||
Other current assets | — | 0.7 | |||||
Current assets held for sale | $ | 3.1 | $ | 19.7 | |||
Properties and equipment, net | 0.4 | 2.2 | |||||
Other assets | 0.5 | 0.6 | |||||
Non-current assets held for sale | $ | 0.9 | $ | 2.8 | |||
Accounts payable | 1.1 | 6.4 | |||||
Other current liabilities | 0.1 | 1.4 | |||||
Current liabilities held for sale | $ | 1.2 | $ | 7.8 | |||
Underfunded and unfunded defined benefit pension plans | 0.3 | 0.3 | |||||
Non-current liabilities held for sale | $ | 0.3 | $ | 0.3 | |||
43
16. Acquisitions and Dispositions
Acquisitions Completed in 2018
Clydebridge Holdings Limited
On May 4, 2018, GCP acquired 100% of the outstanding capital stock of Clydebridge Holdings Limited which owns 100% of RIW Limited (the "RIW"), a U.K.-based supplier of waterproofing solutions for commercial and residential construction applications. The acquisition is expected to strengthen GCP’s position in the U.K. waterproofing market and complement its product portfolio within the SBM operating segment by adding waterproofing capabilities for a wider range of projects. The aggregate purchase price of $29.7 million, net of cash acquired of $10.0 million, consisted of a net cash payment of $29.8 million, which was reduced by working capital adjustments of $0.1 million. The purchase price is subject to normal and customary purchase price adjustments.
The Company accounted for the acquisition as a business combination in accordance with provisions of ASC 805, Business Combinations ("ASC 805"). The operating results of RIW have been reflected in the results of operations for the SBM operating segment from the date of the acquisition.
The Company used a market participant approach to record the assets acquired and liabilities assumed in the RIW acquisition. The purchase price allocation is based on a preliminary valuation and is subject to further adjustments within the measurement period as additional information becomes available related to the fair value of such assets acquired and liabilities assumed. The fair values of inventory, intangible assets, accrued liabilities, tax-related matters and residual goodwill were preliminary as of September 30, 2018. The Company will refine such fair value estimates as new information becomes available during the measurement period. Any adjustments to the purchase price allocation will be made as soon as practicable, but no later than one year from the acquisition date.
The following table summarizes the updated allocation of the purchase price as of September 30, 2018:
(In millions) | Net Assets Acquired | ||
Accounts receivable (approximates contractual value) | $ | 1.3 | |
Inventories | 0.6 | ||
Prepaid expenses and other current assets | 0.1 | ||
Property, plant and equipment | 0.1 | ||
Intangible assets | 10.7 | ||
Goodwill | 19.9 | ||
Accounts payable | (1.0 | ) | |
Accrued liabilities | (0.1 | ) | |
Deferred tax liabilities | (1.9 | ) | |
Net assets acquired | $ | 29.7 | |
Fair values of intangible assets acquired consisted of customer relationships of $8.8 million, trademarks and trade names of $1.1 million, as well as developed technology of $0.8 million. The Company used the income approach in accordance with the excess-earnings method to estimate the fair value of customer relationships, equal to the present value of the incremental after-tax cash flows attributable to the intangible asset. The Company used the income approach in accordance with the relief-from-royalty method to estimate the fair values of the trademarks and trade names, as well as developed technology which is equal to the present value of the after-tax royalty savings attributable to owning the intangible asset. The weighted average amortization periods for the intangible assets acquired are 9 years for the customer relationship intangible asset, 15 years for developed technology and 10 years for trademarks and trade names. The total weighted average amortization period of the intangible assets acquired is 10 years using methods that approximate the pattern in which the economic benefits are expected to be realized.
44
At the closing of the acquisition of RIW, a portion of the consideration was placed into escrow which was ascribed to the purchase price and will be released to the sellers no later than December 30, 2020. The escrow was related to the sellers’ satisfaction of indemnity claims and general representations and warranties. There were no amounts released from the escrow to the sellers as of September 30, 2018.
Goodwill represents the excess of the consideration transferred over the fair value of the net assets acquired and has been assigned to the SBM operating segment. Goodwill is primarily the result of expected synergies from combining the operations of RIW with GCP's operations and is not deductible for tax purposes.
The Company did not present a proforma information summary for its consolidated results of operations for three and nine months ended September 30, 2018 as if the acquisition of RIW occurred on January 1, 2017 because such results were not material.
Acquisitions Completed in 2017
Ductilcrete Technologies
On October 31, 2017, GCP acquired 100% of the share capital of Ductilcrete, a U.S.-based technology leader for concrete engineered systems, for a total cash consideration of $31.8 million, net of $1.5 million of cash acquired. The Company believes that the acquisition of Ductilcrete expands its technology platform with new product categories and engineered systems that will allow it to access a wider range of customers.
The Company accounted for the acquisition as a business combination in accordance with provisions of ASC 805, and reflected Ductilcrete's operating results from the date of the acquisition within the operating results of the SCC operating segment. The Company allocated the acquisition purchase price to the assets acquired and liabilities assumed determined from a market participant perspective and recognized the excess as goodwill. Please refer to Note 16, "Acquisitions and Dispositions," to the Company's Consolidated Financial Statements included in the 2017 Annual Report on Form 10-K for further information on this acquisition.
The Company allocated the acquisition purchase price to the assets acquired and liabilities assumed determined from a market participant perspective and recognized the excess as goodwill. As of December 31, 2017, the Company recognized $14.0 million of goodwill, which is tax-deductible and will be amortized for tax purposes over 15 years. The goodwill is attributable to the revenue growth and operating synergies that GCP expects to realize from this acquisition.
During the first quarter of 2018, the Company finalized certain closing adjustments with the seller and its purchase price allocation by recording a $0.3 million reduction in both consideration paid and accounts receivable.
The following table presents the aggregate purchase price allocation as of September 30, 2018:
(In millions) | Net Assets Acquired | ||
Accounts receivable | $ | 2.2 | |
Other current assets | 0.2 | ||
Properties and equipment | 0.1 | ||
Goodwill | 14.0 | ||
Intangible assets | 15.5 | ||
Accounts payable | (0.2 | ) | |
Net assets acquired | $ | 31.8 | |
Stirling Lloyd
On May 17, 2017, GCP acquired 100% of the share capital of Stirling Lloyd, a UK-based global supplier of high-performance liquid waterproofing and coatings products, for total consideration of $91.1 million, net of $16.1 million of cash acquired. The Company believes that the addition of Stirling Lloyd and its products, which are used for the protection of infrastructure and buildings, opens new growth opportunities by offering additional selling channels for specialized end-market applications.
45
The Company accounted for the acquisition as a business combination in accordance with provisions of ASC 805, and reflected Stirling Lloyd's operating results from the date of the acquisition within the operating results of the SBM operating segment. The Company allocated the acquisition purchase price to the assets acquired and liabilities assumed determined from a market participant perspective and recognized the excess as goodwill. During 2017, the Company finalized its purchase price allocation. Please refer to Note 16, "Acquisitions and Dispositions" to the Company's Consolidated Financial Statements included in the 2017 Annual Report on Form 10-K for further information on this acquisition.
Revenue from RIW, Ductilcrete and Stirling Lloyd was not material individually, or in the aggregate, to the Company's consolidated revenue during the three and nine months ended September 30, 2018. Net income from RIW, Ductilcrete and Stirling Lloyd was not material individually to the Company’s consolidated net income (loss) during the three and nine months ended September 30, 2018. In the aggregate, net income from RIW, Ductilcrete and Stirling Lloyd was $3.1 million and $8.1 million, respectively, during the three and nine months ended September 30, 2018.
Dispositions
Disposal of Non-core Halex Net Assets
In April 2017, the Company completed the sale of non-core carpet tack strip and plywood underlayment product lines that were acquired with Halex Corporation (“Halex”) for approximately $3 million in cash. The Company recorded a $2.1 million loss related to the disposal of these non-core Halex net assets, which is reflected in "Other income, net" in the accompanying unaudited Consolidated Statements of Operations.
46
ITEM 2. MANAGEMENT'S DISCUSSION AND ANALYSIS OF FINANCIAL CONDITION AND RESULTS OF OPERATIONS
We generally refer to the quarter ended September 30, 2018 as the "third quarter", the quarter ended September 30, 2017 as the "prior-year quarter", the quarter ended March 31, 2018 as the "2018 first quarter", the quarter ended June 30, 2018 as the "2018 second quarter," the nine months ended September 30, 2018 as the "nine months", and the nine months ended September 30, 2017 as the "prior-year period." See Analysis of Operations for a discussion of our non-GAAP performance measures.
On July 3, 2017, we completed the sale of our Darex business to Henkel AG & Co. KGaA ("Henkel"). The results of operations of the Darex segment are presented as discontinued operations and, as such, have been excluded from continuing operations and segment results for all periods presented. Unless otherwise noted, the following discussion and analysis pertains only to our continuing operations.
Information Related to Forward-Looking Statements
This document contains, and our other public communications may contain, forward-looking statements, that is, information related to future, not historical events. Such statements generally include the words "believes," "plans," "intends," "targets," "will," "expects," "suggests," "anticipates," "outlook," "continues" or similar expressions. Forward-looking statements include, without limitation, expected financial positions; results of operations; cash flows; financing plans; business strategy; operating plans; capital and other expenditures; competitive positions; growth opportunities for existing products; benefits from new technology and cost reduction initiatives, plans and objectives; and markets for securities. Like other businesses, we are subject to risks and uncertainties that could cause our actual results to differ materially from our projections or that could cause other forward-looking statements to prove incorrect. Factors that could cause actual results to materially differ from those contained in the forward-looking statements, or that could cause other forward-looking statements to prove incorrect, include, without limitation, risks related to: the cyclical and seasonal nature of the industries that GCP serves; foreign operations, especially in emerging regions; changes in currency exchange rates; the cost and availability of raw materials and energy; the effectiveness of GCP’s research and development, new product introductions and growth investments; acquisitions and divestitures of assets and gains and losses from dispositions; developments affecting GCP’s outstanding liquidity and indebtedness, including debt covenants and interest rate exposure; developments affecting GCP’s funded and unfunded pension obligations; warranty and product liability claims; legal proceedings; the inability to establish or maintain certain business relationships and relationships with customers and suppliers or the inability to retain key personnel; the handling of hazardous materials and the costs of compliance with environmental regulation, and those factors set forth in our most recent Annual Report on Form 10-K, this Quarterly Report on Form 10-Q and Current Reports on Form 8-K, which have been filed with the Securities and Exchange Commission ("SEC") and are available on the Internet at www.sec.gov. Our reported results should not be considered as an indication of our future performance. Readers are cautioned not to place undue reliance on our projections and forward-looking statements, which speak only as of the date thereof. We undertake no obligation to publicly release any revisions to the projections and forward-looking statements contained in this document, or to update them to reflect events or circumstances occurring after the date of this document.
Results of Operations
Summary Description of Business
We are engaged in the production and sale of specialty construction chemicals and specialty building materials through two global operating segments:
• | Specialty Construction Chemicals. Our Specialty Construction Chemicals ("SCC") operating segment provides products, technologies, and services that reduce the cost and improve the performance and quality of cement, concrete, mortar, masonry and other cementitious-based construction materials. |
• | Specialty Building Materials. Our Specialty Building Materials ("SBM") operating segment produces and sells sheet and liquid membrane systems and other products that protect both new and existing structures from water, air, and vapor penetration, as well as from fire damage. We also manufacture and sell specialized cementitious and chemical grouts used for soil consolidation and leak-sealing applications in addition to a moisture barrier system and installation tools for the flooring industry. |
47
We operate our business on a global scale as approximately 50% of our sales were generated outside the U.S for the three and nine months ended September 30, 2018. We conduct business in over 35 countries and approximately 30 currencies. We manage our operating segments on a global basis to serve global markets. Currency fluctuations affect our reported results of operations, cash flows and financial position.
Third Quarter Performance Summary
Following is a summary of our financial performance for the third quarter compared with the prior-year quarter.
• | Net sales increased 4.9% to $296.3 million. |
• | Income from continuing operations attributable to GCP shareholders was $7.2 million, or $0.10 per diluted share, compared to a loss of $18.1 million, or $0.25 per diluted share, for the prior-year quarter. The change was primarily due to lower expenses as a result of a loss recognized during the prior-year quarter on the deconsolidation of our Venezuela operations, partially offset by higher income taxes. |
• | Adjusted EBIT increased 9.7% to $39.7 million. |
• | Adjusted EPS was $0.34 per diluted share compared to $0.22 in the prior-year quarter. |
• | Adjusted EBIT Return On Invested Capital was 18.4% on a trailing four quarters basis compared with 23.0% for the third quarter of 2017. |
Analysis of Operations
We have set forth in the table below our key operating statistics with percentage changes for the third quarter and nine months compared to the corresponding prior-year quarter and prior-year period. Please refer to the Analysis of Operations (the “table”) when reviewing our Management's Discussion and Analysis of Financial Condition and Results of Operations (“MD&A”). In the table, we present financial information in accordance with U.S. GAAP, as well as certain non-GAAP financial measures, which we describe below in further detail. We believe that the non-GAAP financial information supplements our discussions about the performance of our businesses, improves quarter-to-quarter and year-over-year comparability, as well as provides insight to the information that our management uses to evaluate the performance of our businesses. Our management uses non-GAAP measures in financial and operational decision-making processes, for internal reporting and as part of forecasting and budgeting processes since these measures provide additional transparency to our core operations.
In the table, we have provided reconciliations of these non-GAAP financial measures to the most directly comparable financial measures calculated and presented in accordance with U.S. GAAP. These non-GAAP financial measures should not be considered substitutes for financial measures calculated in accordance with U.S. GAAP, and the financial results that we calculate and present in the table in accordance with U.S. GAAP, as well as the corresponding reconciliations from those results, should be carefully evaluated as part of our MD&A.
The following are the non-GAAP financial measures presented in the table:
• | Adjusted EBIT (a non-GAAP financial measure)- is defined as net income (loss) from continuing operations attributable to GCP shareholders adjusted for: (i) gains and losses on sales of businesses, product lines and certain other investments; (ii) currency and other financial losses in Venezuela (iii) costs related to legacy product, environmental and other claims; (iv) restructuring expenses, repositioning and asset impairments; (v) defined benefit plan costs other than service and interest costs, expected returns on plan assets and amortization of prior service costs/credits; (vi) third-party and other acquisition-related costs; (vii) other financing costs associated with the modification or extinguishment of debt; (viii) amortization of acquired inventory fair value adjustments; (ix) tax indemnification adjustments; (x) interest income, interest expense and related financing costs; (xi) income taxes; and (xii) and certain other items that are not representative of underlying trends. We use Adjusted EBIT to assess and measure our operating performance and determine performance-based compensation. We use Adjusted EBIT as a performance measure because it provides improved quarter-to-quarter and year-over-year comparability for decision-making and compensation purposes and allows management to measure the ongoing earnings results of our strategic and operating decisions. |
48
• | Adjusted EBITDA (a non-GAAP financial measure)- is defined as Adjusted EBIT adjusted for depreciation and amortization. We use Adjusted EBITDA as a performance measure in making significant business decisions. |
• | Adjusted Earnings Per Share (a non-GAAP financial measure)- is defined as earnings per share ("EPS") from continuing operations on a diluted basis adjusted for costs related to: (i) gains and losses on sales of businesses, product lines and certain other investments; (ii) currency and other financial losses in Venezuela; (iii) legacy product, environmental and other claims; (iv) restructuring and repositioning expenses and asset impairments; (v) defined benefit plan costs other than service and interest costs, expected returns on plan assets and amortization of prior service costs/credits; (vi) third-party and other acquisition-related costs; (vii) other financing costs associated with the modification or extinguishment of debt; (viii) amortization of acquired inventory fair value adjustments; (ix) tax indemnification adjustments; (x) certain other items that are not representative of underlying trends; and (xi) and certain discrete tax items. We use Adjusted EPS as a performance measure to review our diluted earnings per share results on a consistent basis. |
• | Adjusted Gross Profit (a non-GAAP financial measure)- is defined as gross profit adjusted for: (i) corporate and pension-related costs included in cost of goods sold; (ii) loss in Venezuela included in cost of goods sold; and (iii) amortization of acquired inventory fair value adjustment. Adjusted Gross Margin means Adjusted Gross Profit divided by net sales. We use this performance measure to understand trends and changes and to make business decisions regarding core operations. |
• | Adjusted EBIT Return On Invested Capital (a non-GAAP financial measure)- is defined as Adjusted EBIT (on a trailing four quarters basis) divided by the sum of net working capital, properties and equipment and certain other assets and liabilities. We use Adjusted EBIT Return On Invested Capital as a performance measure to review investments and to make capital allocation decisions. |
Adjusted EBIT, Adjusted EBITDA, Adjusted EPS, Adjusted EBIT Return On Invested Capital, Adjusted Gross Profit and Adjusted Gross Margin do not purport to represent income measures as defined under U.S. GAAP. These measures are provided to investors and others to improve the quarter-to-quarter, year-to-year and peer-to-peer comparability of our financial results and to ensure that investors understand the information we use to evaluate the performance of our businesses.
Adjusted EBIT has material limitations as an operating performance measure because it excludes costs related to income and expenses from restructuring and repositioning activities which historically has been a material component of our net income (loss) from continuing operations attributable to GCP shareholders. Adjusted EBITDA also has material limitations as an operating performance measure because it excludes the impact of depreciation and amortization expense. Our business is substantially dependent on the successful deployment of capital, and depreciation and amortization expense is a necessary element of our costs. We compensate for the limitations of these measurements by using these indicators together with net income (loss) measured under GAAP to present a complete analysis of our results of operations. Adjusted EBIT and Adjusted EBITDA should be evaluated together with net income (loss) from continuing operations attributable to GCP shareholders measured under GAAP for a complete understanding of our results of operations.
49
We have provided in the following tables a reconciliation of these non-GAAP measures to the most directly comparable financial measures calculated and presented in accordance with U.S. GAAP.
Analysis of Operations (in millions, except per share amounts) | Three Months Ended September 30, | Nine Months Ended September 30, | |||||||||||||||||||
2018 | 2017 | % Change | 2018 | 2017 | % Change | ||||||||||||||||
Net sales: | |||||||||||||||||||||
Specialty Construction Chemicals | $ | 165.4 | $ | 156.2 | 5.9 | % | $ | 487.4 | $ | 449.1 | 8.5 | % | |||||||||
Specialty Building Materials | 130.9 | 126.2 | 3.7 | % | 361.9 | 345.8 | 4.7 | % | |||||||||||||
Total GCP net sales | $ | 296.3 | $ | 282.4 | 4.9 | % | $ | 849.3 | $ | 794.9 | 6.8 | % | |||||||||
Net sales by region: | |||||||||||||||||||||
North America | $ | 154.1 | $ | 141.5 | 8.9 | % | $ | 426.4 | $ | 396.0 | 7.7 | % | |||||||||
Europe Middle East Africa (EMEA) | 61.7 | 67.0 | (7.9 | )% | 189.2 | 178.9 | 5.8 | % | |||||||||||||
Asia Pacific | 63.9 | 58.0 | 10.2 | % | 181.6 | 168.4 | 7.8 | % | |||||||||||||
Latin America | 16.6 | 15.9 | 4.4 | % | 52.1 | 51.6 | 1.0 | % | |||||||||||||
Total net sales by region | $ | 296.3 | $ | 282.4 | 4.9 | % | $ | 849.3 | $ | 794.9 | 6.8 | % | |||||||||
Profitability performance measures: | |||||||||||||||||||||
Adjusted EBIT (A): | |||||||||||||||||||||
Specialty Construction Chemicals segment operating income | $ | 12.7 | $ | 15.7 | (19.1 | )% | $ | 31.2 | $ | 44.5 | (29.9 | )% | |||||||||
Specialty Building Materials segment operating income | 34.3 | 30.1 | 14.0 | % | 84.2 | 80.6 | 4.5 | % | |||||||||||||
Corporate costs (B) | (5.3 | ) | (7.5 | ) | (29.3 | )% | (22.8 | ) | (28.9 | ) | (21.1 | )% | |||||||||
Certain pension costs (C) | (2.0 | ) | (2.1 | ) | (4.8 | )% | (5.8 | ) | (7.0 | ) | (17.1 | )% | |||||||||
Adjusted EBIT (non-GAAP) | 39.7 | 36.2 | 9.7 | % | 86.8 | 89.2 | (2.7 | )% | |||||||||||||
Currency and other financial losses in Venezuela | — | (36.7 | ) | (100.0 | )% | — | (39.1 | ) | (100.0 | )% | |||||||||||
Litigation settlement | — | (4.0 | ) | (100.0 | )% | — | (4.0 | ) | (100.0 | )% | |||||||||||
Repositioning expenses | (3.7 | ) | (1.1 | ) | NM | (5.8 | ) | (6.8 | ) | (14.7 | )% | ||||||||||
Restructuring expenses and asset impairments | (14.3 | ) | (2.1 | ) | NM | (13.2 | ) | (13.0 | ) | 1.5 | % | ||||||||||
Pension MTM adjustment and other related costs, net | — | (3.0 | ) | (100.0 | )% | (0.9 | ) | (2.9 | ) | (69.0 | )% | ||||||||||
Gain on termination and curtailment of pension and other postretirement plans | — | 0.8 | (100.0 | )% | 0.1 | 5.9 | (98.3 | )% | |||||||||||||
Loss on sale of product line | — | — | — | % | — | (2.1 | ) | (100.0 | )% | ||||||||||||
Third-party and other acquisition-related costs | (0.5 | ) | (2.0 | ) | (75.0 | )% | (2.1 | ) | (5.0 | ) | (58.0 | )% | |||||||||
Other financing costs | — | (6.0 | ) | (100.0 | )% | — | (6.0 | ) | (100.0 | )% | |||||||||||
Amortization of acquired inventory fair value adjustment | — | (0.2 | ) | (100.0 | )% | (0.2 | ) | (2.9 | ) | (93.1 | )% | ||||||||||
Tax indemnification adjustments | — | — | — | % | — | (2.4 | ) | (100.0 | )% | ||||||||||||
Interest expense, net | (5.3 | ) | (14.5 | ) | (63.4 | )% | (83.6 | ) | (49.0 | ) | 70.6 | % | |||||||||
Currency losses in Argentina | (1.1 | ) | — | NM | (1.1 | ) | — | NM | |||||||||||||
Income tax (expense) benefit | (7.6 | ) | 14.5 | NM | (15.8 | ) | (3.7 | ) | NM | ||||||||||||
Income (loss) from continuing operations attributable to GCP shareholders (GAAP) | $ | 7.2 | $ | (18.1 | ) | NM | $ | (35.8 | ) | $ | (41.8 | ) | (14.4 | )% | |||||||
Diluted EPS from continuing operations (GAAP) | $ | 0.10 | $ | (0.25 | ) | NM | $ | (0.50 | ) | $ | (0.59 | ) | 15.3 | % | |||||||
Adjusted EPS (non-GAAP) | $ | 0.34 | $ | 0.22 | 54.5 | % | $ | 0.62 | $ | 0.39 | 59.0 | % | |||||||||
50
Analysis of Operations (in millions) | Three Months Ended September 30, | Nine Months Ended September 30, | |||||||||||||||||||
2018 | 2017 | % Change | 2018 | 2017 | % Change | ||||||||||||||||
Adjusted profitability performance measures: | |||||||||||||||||||||
Gross Profit: | |||||||||||||||||||||
Specialty Construction Chemicals | $ | 53.7 | $ | 53.4 | 0.6 | % | $ | 156.7 | $ | 160.1 | (2.1 | )% | |||||||||
Specialty Building Materials | 57.1 | 54.1 | 5.5 | % | 154.6 | 152.1 | 1.6 | % | |||||||||||||
Adjusted Gross Profit (non-GAAP) | 110.8 | 107.5 | 3.1 | % | 311.3 | 312.2 | (0.3 | )% | |||||||||||||
Amortization of acquired inventory fair value adjustment | — | (0.2 | ) | (100.0 | )% | (0.2 | ) | (2.9 | ) | 93.1 | % | ||||||||||
Loss in Venezuela in cost of goods sold | — | — | — | % | — | (0.8 | ) | (100.0 | )% | ||||||||||||
Corporate costs and pension costs in cost of goods sold | (0.4 | ) | (0.4 | ) | — | % | (1.5 | ) | (1.3 | ) | (15.4 | )% | |||||||||
Total GCP Gross Profit (GAAP) | $ | 110.4 | $ | 106.9 | 3.3 | % | $ | 309.6 | $ | 307.2 | 0.8 | % | |||||||||
Gross Margin: | |||||||||||||||||||||
Specialty Construction Chemicals | 32.5 | % | 34.2 | % | (1.7) pts | 32.2 | % | 35.6 | % | (3.4) pts | |||||||||||
Specialty Building Materials | 43.6 | % | 42.9 | % | 0.7 pts | 42.7 | % | 44.0 | % | (1.3) pts | |||||||||||
Adjusted Gross Margin (non-GAAP) | 37.4 | % | 38.1 | % | (0.7) pts | 36.7 | % | 39.3 | % | (2.6) pts | |||||||||||
Loss in Venezuela in cost of goods sold | — | % | — | % | 0.0 pts | — | % | (0.1 | )% | 0.1 pts | |||||||||||
Amortization of acquired inventory fair value adjustment | — | % | (0.1 | )% | 0.1 pts | — | % | (0.4 | )% | 0.4 pts | |||||||||||
Corporate costs and pension costs in cost of goods sold | (0.1 | )% | (0.1 | )% | 0.0 pts | (0.2 | )% | (0.2 | )% | 0.0 pts | |||||||||||
Total GCP Gross Margin (GAAP) | 37.3 | % | 37.9 | % | (0.6) pts | 36.5 | % | 38.6 | % | (2.1) pts | |||||||||||
Adjusted EBIT (A)(B)(C): | |||||||||||||||||||||
Specialty Construction Chemicals segment operating income | $ | 12.7 | $ | 15.7 | (19.1 | )% | $ | 31.2 | $ | 44.5 | (29.9 | )% | |||||||||
Specialty Building Materials segment operating income | 34.3 | 30.1 | 14.0 | % | 84.2 | 80.6 | 4.5 | % | |||||||||||||
Corporate and certain pension costs | (7.3 | ) | (9.6 | ) | (24.0 | )% | (28.6 | ) | (35.9 | ) | (20.3 | )% | |||||||||
Total GCP Adjusted EBIT (non-GAAP) | $ | 39.7 | $ | 36.2 | 9.7 | % | $ | 86.8 | $ | 89.2 | (2.7 | )% | |||||||||
Depreciation and amortization: | |||||||||||||||||||||
Specialty Construction Chemicals | $ | 6.0 | $ | 5.4 | 11.1 | % | $ | 18.0 | $ | 15.6 | 15.4 | % | |||||||||
Specialty Building Materials | 3.8 | 3.6 | 5.6 | % | 10.9 | 9.6 | 13.5 | % | |||||||||||||
Corporate | 0.7 | 0.7 | — | % | 2.4 | 1.7 | 41.2 | % | |||||||||||||
Total GCP depreciation and amortization | $ | 10.5 | $ | 9.7 | 8.2 | % | $ | 31.3 | $ | 26.9 | 16.4 | % | |||||||||
Adjusted EBITDA: | |||||||||||||||||||||
Specialty Construction Chemicals | $ | 18.7 | $ | 21.1 | (11.4 | )% | $ | 49.2 | $ | 60.1 | (18.1 | )% | |||||||||
Specialty Building Materials | 38.1 | 33.7 | 13.1 | % | 95.1 | 90.2 | 5.4 | % | |||||||||||||
Corporate and certain pension costs | (6.6 | ) | (8.9 | ) | (25.8 | )% | (26.2 | ) | (34.2 | ) | (23.4 | )% | |||||||||
Total GCP Adjusted EBITDA (non-GAAP) | $ | 50.2 | $ | 45.9 | 9.4 | % | $ | 118.1 | $ | 116.1 | 1.7 | % | |||||||||
Adjusted EBIT Margin: | |||||||||||||||||||||
Specialty Construction Chemicals | 7.7 | % | 10.1 | % | (2.4) pts | 6.4 | % | 9.9 | % | (3.5) pts | |||||||||||
Specialty Building Materials | 26.2 | % | 23.9 | % | 2.3 pts | 23.3 | % | 23.3 | % | 0.0 pts | |||||||||||
Total GCP Adjusted EBIT Margin (non-GAAP) | 13.4 | % | 12.8 | % | 0.6 pts | 10.2 | % | 11.2 | % | (1.0) pts | |||||||||||
Adjusted EBITDA Margin: | |||||||||||||||||||||
Specialty Construction Chemicals | 11.3 | % | 13.5 | % | (2.2) pts | 10.1 | % | 13.4 | % | (3.3) pts | |||||||||||
Specialty Building Materials | 29.1 | % | 26.7 | % | 2.4 pts | 26.3 | % | 26.1 | % | 0.2 pts | |||||||||||
Total GCP Adjusted EBITDA Margin (non-GAAP) | 16.9 | % | 16.3 | % | 0.6 pts | 13.9 | % | 14.6 | % | (0.7) pts | |||||||||||
51
Analysis of Operations (in millions) | Four Quarters Ended | ||||||
September 30, 2018 | September 30, 2017 | ||||||
Calculation of Adjusted EBIT Return On Invested Capital (trailing four quarters): | |||||||
Adjusted EBIT | $ | 125.0 | $ | 122.1 | |||
Invested Capital: | |||||||
Trade accounts receivable | 213.1 | 209.4 | |||||
Inventories | 115.9 | 108.4 | |||||
Accounts payable | (125.8 | ) | (120.8 | ) | |||
Invested working capital | 203.2 | 197.0 | |||||
Other current assets (excluding income taxes) | 36.0 | 51.9 | |||||
Properties and equipment, net | 220.2 | 209.1 | |||||
Goodwill | 210.1 | 183.8 | |||||
Technology and other intangible assets, net | 91.9 | 76.9 | |||||
Other assets (excluding capitalized financing fees) | 27.4 | 24.6 | |||||
Other current liabilities (excluding income taxes, restructuring, repositioning, accrued interest and liabilities incurred in association with the Darex divestiture) | (91.8 | ) | (176.6 | ) | |||
Other liabilities (excluding other postretirement benefits liability and liabilities incurred in association with the Darex divestiture) | (17.2 | ) | (35.5 | ) | |||
Total invested capital | $ | 679.8 | $ | 531.2 | |||
Adjusted EBIT Return On Invested Capital (non-GAAP) | 18.4 | % | 23.0 | % | |||
___________________________________________________________________________________________________________________
(A) | Our segment operating income includes only our share of income of consolidated joint ventures. |
(B) | Management allocates corporate costs to each segment to the extent such costs are directly attributable to the segments. Corporate costs include approximately $5.4 million of allocated costs for the nine months ended September 30, 2017 that were previously reported within the Darex operating segment since such costs did not meet the criteria to be reclassified to discontinued operations. Beginning in the third quarter of 2017, the Company began allocating these costs to its remaining operating segments. |
(C) | Certain pension costs include only ongoing costs recognized quarterly, which include service and interest costs, expected returns on plan assets and amortization of prior service costs/credits. SCC and SBM segment operating income and corporate costs do not include any amounts for pension expense. Other pension-related costs including annual mark-to-market adjustments, actuarial gains and losses, gains or losses from curtailments and terminations and other related costs are excluded from Adjusted EBIT. These amounts are not used by management to evaluate the performance of our businesses and significantly affect the peer-to-peer and period-to-period comparability of our financial results. Mark-to-market adjustments, actuarial gains and losses and other related costs relate primarily to changes in financial market values and actuarial assumptions and are not directly related to the operation of our businesses. |
NM | Not meaningful. |
52
Adjusted EPS
The following tables reconcile our Diluted EPS (GAAP) to our Adjusted EPS (non-GAAP):
________________________________
Three Months Ended September 30, | |||||||||||||||||||||||||||||||
2018 | 2017 | ||||||||||||||||||||||||||||||
(in millions, except per share amounts) | Pre- Tax | Tax Effect | After- Tax | Per Share | Pre- Tax | Tax Effect | After- Tax | Per Share | |||||||||||||||||||||||
Diluted EPS from continuing operations (GAAP) | $ | 0.10 | $ | (0.25 | ) | ||||||||||||||||||||||||||
Repositioning expenses | $ | 3.7 | $ | 0.9 | $ | 2.8 | 0.04 | $ | 1.1 | $ | 0.4 | $ | 0.7 | 0.01 | |||||||||||||||||
Restructuring expenses and asset impairments | 14.3 | 3.2 | 11.1 | 0.15 | 2.1 | 0.7 | 1.4 | 0.02 | |||||||||||||||||||||||
Gain on termination and curtailment of pension and other postretirement plans | — | — | — | — | (0.8 | ) | (0.4 | ) | (0.4 | ) | (0.01 | ) | |||||||||||||||||||
Pension MTM adjustment and other related costs, net | — | — | — | — | 3.0 | 1.3 | 1.7 | 0.02 | |||||||||||||||||||||||
Currency and other financial losses in Venezuela | — | — | — | — | 36.7 | 12.2 | 24.5 | 0.34 | |||||||||||||||||||||||
Third-party and other acquisition-related costs | 0.5 | 0.1 | 0.4 | 0.01 | 2.0 | 0.4 | 1.6 | 0.02 | |||||||||||||||||||||||
Litigation settlement | — | — | — | — | 4.0 | 1.5 | 2.5 | 0.03 | |||||||||||||||||||||||
Currency losses in Argentina | 1.1 | 0.3 | 0.8 | 0.01 | — | — | — | — | |||||||||||||||||||||||
Loss on debt refinancing (1) | — | 1.8 | (1.8 | ) | (0.02 | ) | — | — | — | — | |||||||||||||||||||||
Amortization of acquired inventory fair value adjustment | — | — | — | — | 0.2 | 0.1 | 0.1 | — | |||||||||||||||||||||||
Other financing costs | — | — | — | — | 6.0 | 2.3 | 3.7 | 0.05 | |||||||||||||||||||||||
Discrete tax items, including adjustments to uncertain tax positions | — | (3.9 | ) | 3.9 | $ | 0.05 | — | 1.1 | (1.1 | ) | $ | (0.01 | ) | ||||||||||||||||||
Adjusted EPS (non-GAAP) | $ | 0.34 | $ | 0.22 | |||||||||||||||||||||||||||
(1) | Represents incremental tax effect related to the loss on debt refinancing of $59.8 million incurred during the 2018 second quarter due to changes from the effect of tax reform on the Company. |
53
Nine Months Ended September 30, | |||||||||||||||||||||||||||||||
2018 | 2017 | ||||||||||||||||||||||||||||||
(In millions, except per share amounts) | Pre- Tax | Tax Effect | After- Tax | Per Share | Pre- Tax | Tax Effect | After- Tax | Per Share | |||||||||||||||||||||||
Diluted EPS from continuing operations (GAAP) | $ | (0.50 | ) | $ | (0.59 | ) | |||||||||||||||||||||||||
Repositioning expenses | $ | 5.8 | $ | 1.5 | $ | 4.3 | 0.06 | $ | 6.8 | $ | 2.6 | $ | 4.2 | 0.06 | |||||||||||||||||
Restructuring expenses and asset impairments | 13.2 | 2.9 | 10.3 | 0.14 | 13.0 | 4.8 | 8.2 | 0.11 | |||||||||||||||||||||||
Gain on termination and curtailment of pension and other postretirement plans | (0.1 | ) | — | (0.1 | ) | — | (5.9 | ) | (2.6 | ) | (3.3 | ) | (0.05 | ) | |||||||||||||||||
Pension MTM adjustment and other related costs, net | 0.9 | 0.2 | 0.7 | 0.01 | 2.9 | 1.3 | 1.6 | 0.02 | |||||||||||||||||||||||
Currency and other financial losses in Venezuela | — | — | — | — | 39.1 | 12.9 | 26.2 | 0.37 | |||||||||||||||||||||||
Loss on sale of product line | — | — | — | — | 2.1 | 0.8 | 1.3 | 0.02 | |||||||||||||||||||||||
Third-party and other acquisition-related costs | 2.1 | 0.5 | 1.6 | 0.02 | 5.0 | 1.0 | 4.0 | 0.06 | |||||||||||||||||||||||
Litigation settlement | — | — | — | — | 4.0 | 1.5 | 2.5 | 0.03 | |||||||||||||||||||||||
Currency losses in Argentina | 1.1 | 0.3 | 0.8 | 0.01 | — | — | — | — | |||||||||||||||||||||||
Loss on debt refinancing | 59.8 | 14.8 | 45.0 | 0.62 | — | — | — | — | |||||||||||||||||||||||
Amortization of acquired inventory fair value adjustment | 0.2 | — | 0.2 | — | 2.9 | 0.9 | 2.0 | 0.03 | |||||||||||||||||||||||
Tax indemnification adjustments | — | — | — | — | 2.4 | 0.9 | 1.5 | 0.02 | |||||||||||||||||||||||
Other financing costs | — | — | — | — | 6.0 | 2.3 | 3.7 | 0.05 | |||||||||||||||||||||||
Discrete tax items, including adjustments to uncertain tax positions | — | (18.6 | ) | 18.6 | $ | 0.26 | — | (18.2 | ) | 18.2 | $ | 0.26 | |||||||||||||||||||
Adjusted EPS (non-GAAP) | $ | 0.62 | $ | 0.39 | |||||||||||||||||||||||||||
GCP Overview
Following is an overview of our financial performance for the third quarter and nine months compared with the prior-year periods.
Net Sales and Gross Margin
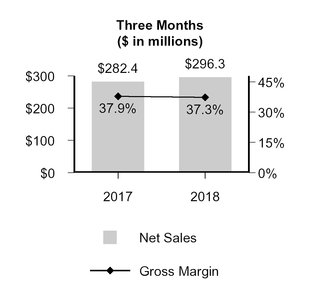
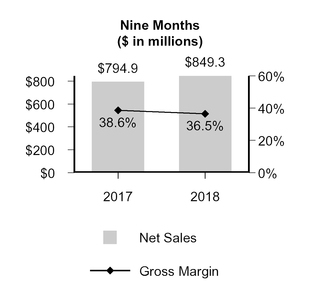
54
The following table identifies the period-over-period increase or decrease in sales attributable to changes in volume and/or mix, product prices and the impact of currency exchange for the period.
Three Months Ended September 30, 2018 as a Percentage Increase (Decrease) from Three Months Ended September 30, 2017 | |||||||||||
Net Sales Variance Analysis | Volume | Price | Currency Translation | Total Change | |||||||
Specialty Construction Chemicals | 7.3 | % | 2.5 | % | (3.9 | )% | 5.9 | % | |||
Specialty Building Materials | 0.7 | % | 3.2 | % | (0.2 | )% | 3.7 | % | |||
Net sales | 4.3 | % | 2.9 | % | (2.3 | )% | 4.9 | % | |||
By Region: | |||||||||||
North America | 5.7 | % | 3.3 | % | (0.1 | )% | 8.9 | % | |||
Europe Middle East Africa | (6.6 | )% | 2.4 | % | (3.7 | )% | (7.9 | )% | |||
Asia Pacific | 11.4 | % | (0.1 | )% | (1.1 | )% | 10.2 | % | |||
Latin America | 12.2 | % | 11.6 | % | (19.4 | )% | 4.4 | % | |||
Nine Months Ended September 30, 2018 as a Percentage Increase (Decrease) from Nine Months Ended September 30, 2017 | |||||||||||
Net Sales Variance Analysis | Volume | Price | Currency Translation | Total Change | |||||||
Specialty Construction Chemicals | 7.2 | % | 1.5 | % | (0.2 | )% | 8.5 | % | |||
Specialty Building Materials | 1.3 | % | 1.8 | % | 1.6 | % | 4.7 | % | |||
Net sales | 4.6 | % | 1.6 | % | 0.6 | % | 6.8 | % | |||
By Region: | |||||||||||
North America | 5.6 | % | 2.0 | % | 0.1 | % | 7.7 | % | |||
Europe Middle East Africa | 0.8 | % | 2.2 | % | 2.8 | % | 5.8 | % | |||
Asia Pacific | 6.2 | % | (1.0 | )% | 2.6 | % | 7.8 | % | |||
Latin America | 4.9 | % | 5.1 | % | (9.0 | )% | 1.0 | % | |||
Net sales of $296.3 million for the third quarter increased by $13.9 million, or 4.9%, from the prior-year quarter. The increase was primarily due to higher sales volumes in SCC, and price increases in both SCC and SBM, partially offset by the unfavorable impact of foreign currency translation, particularly in SCC, as the U.S. dollar strengthened against the Turkish Lira and currencies in Latin America. Sales volumes increased due to stronger product demand in North America, Asia Pacific, and Latin America, as well as the acquisitions of Ductilcrete within SCC and RIW within SBM. Net sales in the EMEA region declined primarily due to project timing in the Middle East.
GCP's gross margin of 37.3% decreased 60 basis points and GCP's Adjusted Gross Margin of 37.4% decreased 70 basis points for the third quarter compared with the prior-year quarter. The declines were primarily within the SCC segment where higher price and productivity gains were more than offset by increased raw material and logistics costs. SBM’s gross margin increased 70 basis points to 43.6% as price increases more than offset higher raw material and logistics costs.
Net sales of $849.3 million for the nine months increased by $54.4 million, or 6.8%, compared with the prior-year period. The increase was primarily due to higher sales volumes and price increases in both SCC and SBM, as well as the favorable impact of foreign currency translation. Higher sales volumes were driven by stronger product demand and the impact of acquisitions, including Ductilcrete within SCC as well as Stirling Lloyd and RIW within SBM.
GCP's gross margin of 36.5% declined 210 basis points and GCP's Adjusted Gross Margin of 36.7% decreased 260 points for the nine months compared with the prior-year period. The declines were primarily due to higher raw material and logistics costs, which were partially offset by price increases and productivity gains.
55
Income (Loss) from Continuing Operations Attributable to GCP Shareholders
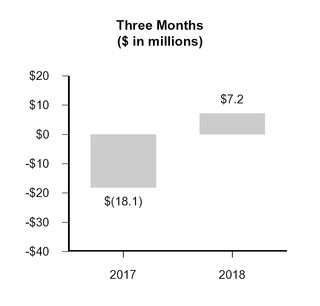
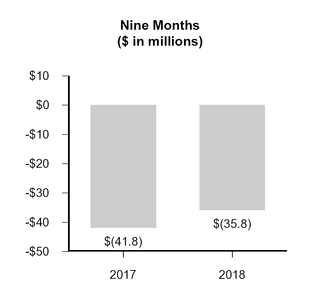
Income from continuing operations attributable to GCP shareholders was $7.2 million for the third quarter compared to a loss from continuing operations attributable to GCP shareholders of $18.1 million for the prior-year quarter. The change was primarily attributable to: (i) lower expenses due to a loss on deconsolidation of GCP Venezuela operations recognized during the prior-year quarter, (ii) lower interest expense and related financing costs due to the refinancing of our 9.5% Senior Notes in the 2018 second quarter and full repayment of the Term Loan previously outstanding under our Credit Agreement during the prior-year quarter, and (iii) lower selling, general and administrative expenses primarily due to savings associated with restructuring, lower employee incentive compensation, and a loss from a litigation settlement recognized during the prior-year quarter. The impact of these items was partially offset by higher income taxes, higher restructuring and repositioning expenses, and a reduction in "other income, net," due to lower income from our Transition Services Agreement (the "TSA") related to the sale of Darex.
Loss from continuing operations attributable to GCP shareholders was $35.8 million for the nine months compared to a loss of $41.8 million for the prior-year period. The change was primarily attributable to: (i) lower expenses due to a loss on the deconsolidation of GCP's Venezuela operations recognized during the prior-year period, (ii) lower interest expense and related financing cost due to the refinancing of our 9.5% Senior Notes in the 2018 second quarter and full repayment of the Term Loan previously outstanding under our Credit Agreement during the prior-year period, and (iii) higher "other income, net" primarily due to income associated with the TSA related to the sale of Darex. The impact of such items was partially offset by a loss on debt extinguishment of $59.4 million resulting from the refinancing of our 9.5% Senior Notes in the 2018 second quarter and higher income taxes.
56
Adjusted EBIT
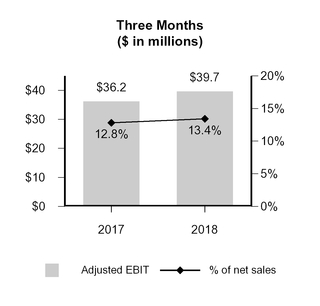
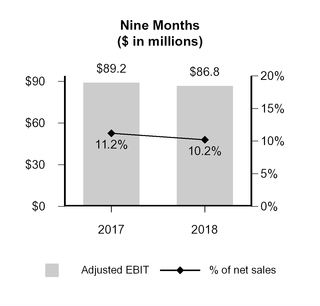
Adjusted EBIT was $39.7 million for the third quarter, an increase of 9.7% compared with the prior-year quarter. The increase was primarily due to higher SBM operating income and lower corporate costs, partially offset by lower SCC operating income.
Adjusted EBIT was $86.8 million for the nine months, a decrease of 2.7% compared with the prior-year period. The decrease was primarily due to lower SCC segment operating income, partially offset by higher SBM operating income and lower corporate and certain pension costs.
Adjusted EBIT Return On Invested Capital
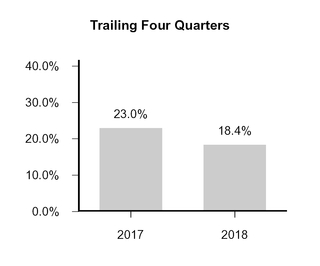
Adjusted EBIT Return On Invested Capital for the third quarter decreased to 18.4% on a trailing four quarters basis from 23.0% on the same basis for the prior-year quarter. The decrease was mainly driven by a 28.0% increase in invested capital that resulted primarily from higher goodwill and intangible assets as a result of our acquisitions.
57
We manage our operations with the objective of maximizing sales, earnings and cash flow over time which requires that we successfully balance our growth, profitability and working capital and other investments to support sustainable, long-term financial performance. We use Adjusted EBIT Return On Invested Capital as a performance measure in evaluating operating results, in making operating and investment decisions and in balancing the growth and profitability of our operations. Generally, we favor those businesses and investments that provide the highest return on invested capital.
58
Operating Segment Overview—Specialty Construction Chemicals (SCC)
Following is an overview of the financial performance of SCC for the third quarter and nine months compared with the corresponding prior-year quarter and prior-year period.
Net Sales and Gross Margin—SCC
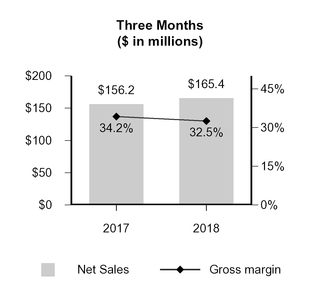
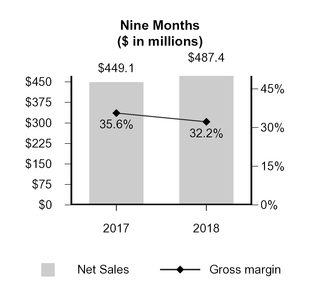
Net sales were $165.4 million for the third quarter, an increase of 5.9% compared with the prior-year quarter. The increase was primarily due to higher sales volumes as described below and improved pricing in all regions except Asia Pacific, partially offset by unfavorable foreign currency translation.
Sales volumes increased 7.3% primarily due to growth in North America, Latin America and Asia Pacific. Sales volumes increased 9.6% in our Concrete business primarily due to stronger demand in North America and the impact of the Ductilcrete acquisition. Sales volumes in our Cement business increased 1.1%.
Gross profit was $53.7 million for the third quarter and remained largely unchanged compared to the prior-year quarter. Gross margin was 32.5% compared with 34.2% for the prior-year quarter. The decrease in gross margin was primarily due to higher raw material and logistics costs, partially offset by price increases.
Net sales were $487.4 million for the nine months, an increase of 8.5% compared with the prior-year period. The increase was primarily due to higher sales volumes as described below and increased pricing in all regions except Asia Pacific.
Sales volumes increased 7.2% for the nine months primarily due to growth in North America, Asia Pacific and EMEA, partially offset by sales volume declines in Latin America. Sales volumes increased 8.9% in our Concrete business due to stronger demand in North America as well as the acquisition of Ductilcrete, partially offset by lower sales in our Venezuela subsidiary which was deconsolidated in the prior-year quarter. Sales volumes in our Cement business increased 2.7% primarily due to stronger demand in EMEA and Asia Pacific.
Gross profit was $156.7 million for the nine months, a decrease of $3.4 million, or 2.1%, compared with the prior-year period. Gross margin was 32.2% compared with 35.6% for the prior-year period. The decrease in gross margin was primarily due to increases in raw material and logistics costs, partially offset by price increases.
59
Segment Operating Income and Operating Margin—SCC
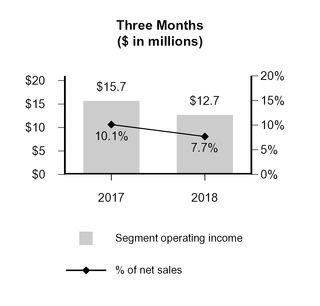
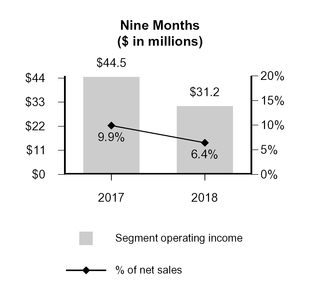
Segment operating income was $12.7 million for the third quarter, a decrease of $3.0 million, or 19.1%, compared with the prior-year quarter. Segment operating margin was 7.7% compared with 10.1% for the prior-year quarter. The decrease in segment operating margin was primarily due to lower gross margin.
Segment operating income was $31.2 million for the nine months, a decrease of $13.3 million, or 29.9%, compared with the prior-year period. Segment operating margin was 6.4% for the nine months compared with 9.9% for the prior-year period. The decrease in segment operating margin was primarily due to lower gross margin, higher corporate cost allocations and the deconsolidation of GCP Venezuela in the prior-year quarter. During the prior-year period, SCC’s Venezuelan operations contributed net sales of $6.2 million and operating income of $4.3 million. The Venezuelan entity was deconsolidated on July 3, 2017 and no longer contributed to net sales or operating income beyond that date.
60
Operating Segment Overview—Specialty Building Materials (SBM)
Following is an overview of the financial performance of SBM for the third quarter and nine months compared with the corresponding prior-year periods.
Net Sales and Gross Margin—SBM
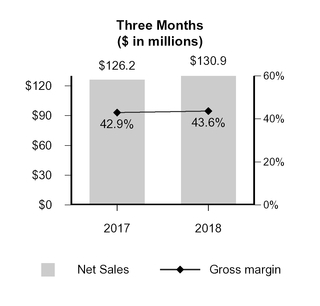
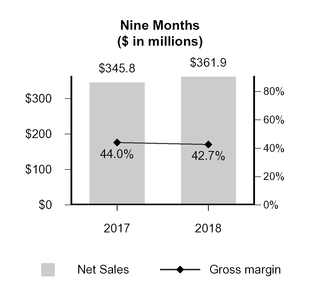
Net sales were $130.9 million for the third quarter, an increase of 3.7% compared with the prior-year quarter. The increase in net sales was primarily due to improved pricing in Latin America, North America and EMEA and higher sales volumes as described below.
Sales volumes increased 0.7% primarily due to growth in Latin America and Asia Pacific, partially offset by declines in EMEA. Building Envelope and Residential volumes increased 2.3% and 7.4%, respectively, due to increased project activity and the acquisition of RIW. Specialty Construction Products volumes declined 7.6% primarily due to lower volumes in fire protection and specialty flooring products, partially offset by increased grouts volumes.
Gross profit was $57.1 million for the third quarter, an increase of 5.5% from the prior-year quarter. Gross margin was 43.6% compared with 42.9% for the prior-year quarter primarily due to price increases and productivity gains that more than offset increases in raw material and logistics costs.
Net sales were $361.9 million for the nine months, an increase of 4.7% compared with the prior-year period. The increase was due to price increases in North America and EMEA, the favorable impact of foreign exchange and higher sales volumes as described below.
Sales volumes increased 1.3% primarily due to growth in Asia Pacific and Latin America, partially offset by lower sales volumes in North America and EMEA. Building Envelope volumes increased 7.5% due to increased project activity and the impact of the Stirling Lloyd and RIW acquisitions. Residential and Specialty Construction Products volumes declined 3.5% and 8.4%, respectively. The decline in Residential was due to the timing of promotional activity, while the decline in Specialty Construction Products volumes was primarily due to the divestiture of the non-core Halex tack strip business in the 2017 second quarter.
Gross profit was $154.6 million for the nine months, an increase of 1.6% from the prior-year period. Gross margin was 42.7% compared with 44.0% for the prior-year period primarily due to increased raw material and logistics costs, partially offset by price increases and productivity gains.
61
Segment Operating Income and Operating Margin—SBM
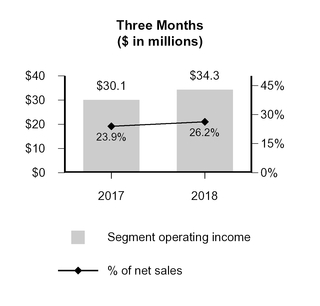
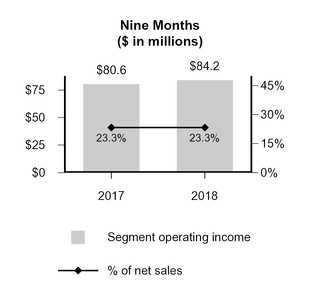
Segment operating income was $34.3 million for the third quarter, an increase of 14.0% from the prior-year quarter. Segment operating margin for the third quarter was 26.2%, an increase compared to 23.9% in the prior-year quarter. The increase in segment operating margin was primarily due to higher gross margin and lower operating expenses.
Segment operating income was $84.2 million for the nine months, an increase of 4.5% from the prior-year period. Segment operating margin for each of the nine months and the prior-year period was 23.3% due to lower gross margin and higher corporate cost allocations, partially offset by lower operating expenses.
62
Corporate Overview
Following is an overview of corporate costs for the third quarter and nine months compared with the corresponding prior-year periods.
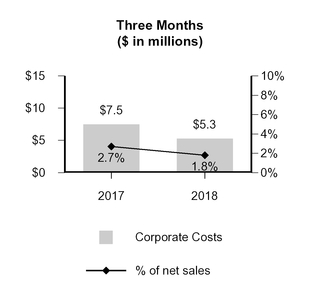
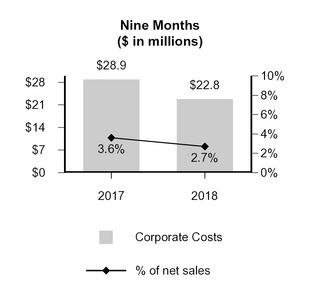
Corporate costs include certain functional support costs, the impacts of foreign exchange, certain performance-based employee incentive compensation, public company costs, and other costs that are not allocated to our operating segments. Corporate costs were $5.3 million for the third quarter, a decrease of 29.3% compared with the prior-year quarter. The decrease was primarily due to lower employee incentive compensation expense, partially offset by higher corporate function and public company costs. Corporate costs were $22.8 million for the first nine months of 2018, a decrease of 21.1% compared with the prior-year period. The decrease was primarily due to $5.4 million of costs included in the prior-year period that were subsequently eliminated as a result of the 2017 restructuring program or allocated out to our remaining operating segments after the July 3, 2017 closing date of the Darex sale, lower foreign exchange losses primarily from Venezuela and lower employee incentive compensation. These decreases were partially offset by increases in corporate functional support and public company costs.
Defined Benefit Pension and Other Postretirement Expense
Defined benefit expense includes costs relating to U.S. and non-U.S. defined benefit pension and other postretirement benefit (OPEB) plans that provide benefits for retirees and former employees of divested businesses where we retained these obligations.
Certain pension costs for the third quarter and nine months were $2.0 million and $5.8 million, respectively, compared with $2.1 million and $7.0 million, respectively, for the corresponding prior-year periods. The decrease is primarily related to greater expected return on plan assets due to the $40.0 million contribution to our U.S. plans in December 2017.
Pension MTM adjustment and other related costs, net decreased $3.0 million in the third quarter compared to the prior year quarter primarily due to plan remeasurement losses related to the sale of Darex recognized during the prior-year quarter.
Pension MTM adjustment and other related costs, net decreased $2.0 million in the nine months compared to the prior year period. During the nine months, we recognized an aggregate expense of $0.9 million which consisted of $1.2 million related to a recognition of a liability for an OPEB retiree health care plan offset by a mark-to-market remeasurement gain of $0.3 million related to a non-U.S. pension plan. During the prior year period, we recognized plan remeasurement losses of $3.0 million related to the sale of Darex offset by a mark-to-market remeasurement gain of $0.1 million related to a non-U.S. pension plan.
63
Gain on termination and curtailment of pension and other postretirement plans decreased $0.8 million in the third quarter compared to the prior year quarter due to a curtailment gain related to restructuring activities recorded during the prior year quarter. Gain on termination and curtailment of pension and other postretirement plans decreased $5.8 million in the nine months compared to the prior year period primarily due to a curtailment gain related to restructuring activities and a U.S. plan amendment recognized during the prior-year period.
Restructuring and Repositioning Expenses
2018 Restructuring and Repositioning Plan (the “2018 Plan”)
On August 1, 2018, our Board of Directors approved a business restructuring and repositioning plan. The 2018 Plan is designed to streamline operations and improve profitability primarily within the concrete admixtures product line of our SCC segment by focusing on our core markets, rationalizing non-profitable geographies, reducing our global cost structure and accelerating the integration of VERIFI® into our global admixtures business.
We expect to incur total pre-tax costs in connection with the 2018 Plan of approximately $30 million to $35 million, of which approximately $20 million to $25 million represents restructuring costs and approximately $10 million represents repositioning costs.
We expect to realize total annualized pre-tax cost savings associated with the 2018 Plan of approximately $25 million in 2019, of which, approximately 20% will be in cost of goods sold and 80% in selling, general and administrative expenses. Approximately 75% of the total pre-tax cost savings is expected in SCC and 25% in SBM. During the third quarter, we achieved pre-tax cost savings of approximately $2 million, or approximately $8 million on an annualized basis. Total expected revenue reduction is approximately 10% of the annual SCC revenue amount as a result of exiting non-profitable geographic markets under the 2018 Plan. Such revenue reductions amounted to approximately $2 million during the third quarter or approximately $8 million on an annualized basis.
2017 Restructuring and Repositioning Plan (the “2017 Plan”)
On June 28, 2017, our Board of Directors approved a restructuring and repositioning plan that includes actions to streamline our operations, reduce our global cost structure and reposition us as a construction products technologies company.
We expect to incur total costs under the 2017 Plan of approximately $30 million, of which $20 million is related to restructuring activities, and $10 million is related to repositioning activities.
Upon conclusion of the 2017 Plan, we expect to achieve net annualized cost reductions of approximately $28 million to $30 million. We expect approximately $13 million to $15 million of these net annualized cost reductions to benefit continuing operations and approximately $15 million to be related to discontinued operations. While we expect the net cost reductions to be phased-in over the completion of the 2017 Plan, we expect that the cost recovery generated from the Transition Services Agreement with Henkel, as described in Note 15, "Discontinued Operations" in the Notes to the unaudited Consolidated Financial Statements included in Item 1 "Consolidated Financial Statements" of this Quarterly Report on Form 10‑Q, will largely offset the cost that will be eliminated upon completion of the program. During the third quarter, we achieved net cost reductions of approximately $8 million, of which $4 million and $4 million, respectively, related to continuing operations and discontinued operations. During the nine months, we achieved net cost reductions of approximately $22 million, of which $11 million and $11 million, respectively, related to continuing operations and discontinued operations. These net cost reductions are primarily related to selling, general and administrative expenses.
64
Restructuring Expenses and Asset Impairments
The following table summarizes restructuring expenses and asset impairments related to the 2017 and 2018 Plans and other plans:
Three Months Ended September 30, | Nine Months Ended September 30, | ||||||||||||||
(in millions) | 2018 | 2017 | 2018 | 2017 | |||||||||||
Severance and other employee costs | $ | 10.0 | $ | 2.1 | $ | 9.3 | $ | 19.0 | |||||||
Facility exit costs | 0.2 | — | 0.2 | 0.1 | |||||||||||
Asset impairments | 4.1 | 0.4 | 4.5 | 0.8 | |||||||||||
Total restructuring and asset impairments | $ | 14.3 | $ | 2.5 | $ | 14.0 | $ | 19.9 | |||||||
Less: restructuring and asset impairments reflected in discontinued operations | — | 0.4 | 0.8 | 6.9 | |||||||||||
Total restructuring and asset impairments from continuing operations | $ | 14.3 | $ | 2.1 | $ | 13.2 | $ | 13.0 | |||||||
For further information on our restructuring activities, please refer to Note 9, "Restructuring Expenses and Repositioning Expenses" in the Notes to the unaudited Consolidated Financial Statements included in Item 1 "Consolidated Financial Statements" on this Quarterly Report on Form 10-Q.
Repositioning Expenses - 2017 Plan and 2018 Plan
Repositioning expenses associated with the 2017 and 2018 Plans primarily relate to consulting, other professional services and employee-related costs associated with our organizational realignment. Due to the scope and complexity of our repositioning activities, the range of estimated repositioning expense could increase or decrease and the timing of incurrence could change.
During the third quarter and prior-year quarter, we incurred repositioning expenses related to the 2017 Plan of $1.1 million, substantially all of which were related to consulting and other professional service fees and employee-related costs associated with our organizational realignment. During the nine months and prior-year period, we incurred repositioning expenses of $3.2 million and $1.5 million, respectively, related to the 2017 Plan. As of September 30, 2018, the cumulative repositioning activity costs recognized under the 2017 Plan were approximately $7.6 million.
As of September 30, 2018, cumulative cash payments for repositioning made under the 2017 Plan from inception to date were $12.0 million. Total cash payments associated with the 2017 Plan were $10.0 million during the nine months. As of September 30, 2018, cumulative capital expenditures incurred from inception to date were $6.7 million.
During the third quarter, we incurred repositioning expenses related to the 2018 Plan of $2.6 million, substantially all of which were related to consulting and other professional service fees and employee-related costs associated with our organizational realignment.
As of September 30, 2018, the Company did not make any cash payments related to such repositioning expenses.
Separation-Related Repositioning Expenses
Post-Separation from Grace, we incurred expenses related to our transition to a stand-alone public company and completed these activities as of December 31, 2017. We incurred total cumulative costs of $20.6 million in connection with these activities. We did not incur any costs related to such activities during the third quarter and the nine months. For further information on this action and the related costs, please refer to Note 10, "Restructuring and Repositioning Expenses" to our Consolidated Financial Statements included in the 2017 Annual Report in the Form 10-K and Note 8, "Restructuring Expenses and Repositioning Expenses" in the Notes to the unaudited Consolidated Financial Statements included in Item 1 "Consolidated Financial Statements" on this Quarterly Report on Form 10-Q.
65
We exclude restructuring and repositioning expenses from Adjusted EBIT, as discussed in the "Results of Operations" section above.
Interest and Financing Expenses
"Interest expense and related financing costs" included in the accompanying unaudited Consolidated Statements of Operations were $5.9 million and $86.4 million, respectively, for the third quarter and nine months compared to $21.6 million and $56.1 million, respectively, in the corresponding prior-year periods.
The decrease of $15.7 million during the third quarter is primarily attributable to the full repayment of the Term Loan principal balance previously outstanding under our Credit Agreement during the prior-year quarter, as well as the lower interest on the 5.5% Senior Notes issued in connection with the redemption of our 9.5% Senior Notes in the 2018 second quarter. The increase of $30.3 million during the nine months compared to corresponding prior-year period resulted primarily from a loss on debt extinguishment due to the redemption of our 9.5% Senior Notes on April 10, 2018.
Income Taxes
Income tax expense (benefit) attributable to continuing operations during the third quarter and the prior-year quarter was $7.6 million and ($14.5 million), respectively, representing effective tax rates of 51.0% and 44.6%, respectively. The difference between the provision for income taxes at the U.S. federal income tax rate of 21.0% and GCP’s overall income tax rate for the third quarter was primarily attributable to valuation allowances recorded of $3.6 million, the effect of tax rates in foreign jurisdictions of $0.2 million, and permanent book-to-tax differences and other items of $0.7 million. The difference between the provision for income taxes at the U.S. federal income tax rate of 35.0% and GCP's overall income tax rate for the prior-year quarter was primarily due to $2.9 million of tax benefit on undistributed foreign earnings.
Income tax expense attributable to continuing operations during the nine months and the prior-year period was $15.8 million and $3.7 million, respectively, representing effective tax rates of 80.2% and 9.8%, respectively. The difference between the provision for income taxes at the U.S. federal income tax rate of 21.0% and GCP’s overall income tax rate for the prior-year period was primarily attributable to changes in estimates related to the 2017 Tax Act in the amount of $12.5 million, income tax valuation allowances of $4.7 million, tax rates in foreign jurisdictions of $0.9 million, and permanent book-to-tax differences and other items of $1.8 million. The difference in income tax at the U.S. federal income tax rate of 35.0% and GCP's overall income tax rate for the prior-year period was primarily due to an income tax valuation allowance of $13.9 million, tax expense on undistributed foreign earnings of $3.6 million, and tax benefit on permanent book-to-tax differences and other items of $0.5 million.
Tax Reform
During the year ended December 31, 2017, we recorded a provisional net charge of $81.7 million related to the provisions of the 2017 Tax Act, which is comprised of a $70.5 million Transition Toll Tax and a $11.2 million revaluation of net deferred tax assets. Changes in tax rates and tax laws are accounted for in the period of enactment.
During the first quarter, we recorded an increase to the provisional net charge related to the 2017 Tax Act provisions of $12.5 million. This charge consisted of an increase of $17.4 million related to capital gain treatment triggered in 2017 due to the 2017 Tax Act, an increase of $0.3 million deferred tax expense related to executive compensation, and a decrease of $5.2 million related to the Transition Toll Tax. There were no adjustments to the provisional net charge recorded during the second or third quarter of 2018.
The final determination of the Transition Toll Tax and remeasurement of our deferred assets and liabilities will be completed as additional information becomes available, but no later than one year from the enactment of the 2017 Tax Act.
For additional information related to the 2017 Tax Act, please refer to Note 5, "Income Taxes", to our Consolidated Financial Statements included in our 2017 Annual Report in the Form 10-K.
66
Repatriation
During the prior-year period, we determined we could no longer assert we are indefinitely reinvested in Mexico and Venezuela because these entities were anticipated to be sold as part of the Darex transaction. The tax associated with its outside book and tax basis differences in Mexico and Venezuela were recorded as discrete items resulting in a tax benefit of $2.9 million for the third quarter of 2017 and a tax expense of $3.6 million for the nine months ended September 30, 2017.
We will continually analyze and evaluate our cash needs to determine the appropriateness of our indefinite reinvestment assertion, including further assessment under the 2017 Tax Act. We consider the assertion of indefinite reinvestment provisional as of September 30, 2018. Please refer to Note 5, "Income Taxes," in the Notes to the unaudited Consolidated Financial Statements included in Item 1 "Consolidated Financial Statements" on this Quarterly Report on Form 10-Q for additional information.
As discussed in Note 4, "Debt and Other Borrowings" in the Notes to the unaudited Consolidated Financial Statements included in Item 1 "Consolidated Financial Statements" on this Quarterly Report on Form 10-Q, we recognized a loss on debt refinancing of $59.8 million associated with our debt refinancing. Since this loss is unusual and infrequent in nature, the tax effect of the loss was recorded as a discrete tax item in the 2018 second quarter. The tax benefit recorded associated with the loss is $14.8 million.
Other Income, Net
Other income, net was $0.9 million and $4.0 million, respectively, during the third quarter and the prior-year quarter. The decrease of $3.1 million was primarily attributable to: (i) lower income from our TSA related to the sale of Darex which began during the prior-year quarter and substantially ended during the 2018 second quarter and (ii) remeasurement losses related to the monetary assets of our subsidiary operating in Argentina for which we began accounting as a highly inflationary economy effective July 1, 2018. Such decreases were partially offset by mark-to-market remeasurement losses related to the defined benefit pension plan assets and projected benefit obligations recognized during prior-year quarter due to the divestiture of Darex.
Other income, net was $11.3 million and $6.6 million, respectively, during the nine months and the prior-year period. The increase of $4.7 million was primarily attributable to: (i) a tax-related charge incurred during the prior-year period for a required payment to Grace pursuant to the provisions of the Tax Sharing Agreement, (ii) mark-to-market remeasurement losses related to the defined benefit pension plan assets and projected benefit obligations recognized during prior-year period due to the divestiture of Darex, (iii) a loss on the divestiture of Halex’s non-core tack strip business recognized during the prior-year period, (iv) lower pension costs during the nine months due to a greater expected return on plan assets resulting from the $40.0 million contribution to the Company's U.S. plans in December 2017, as well as (iv) higher interest income from the cash proceeds received from the sale of Darex and higher TSA income, as described above. Such increases were partially offset by the defined benefit pension plan curtailment gain recognized during the prior-year period due to the amendment to the GCP Applied Technologies Inc. Retirement Plan for Salaried Employees and remeasurement losses related to the monetary assets of our subsidiary operating in Argentina, as described above.
Financial Condition, Liquidity, and Capital Resources
Following is an analysis of our financial condition, liquidity and capital resources at September 30, 2018.
Our principal uses of cash generally have been capital investments, acquisitions and working capital investments. We believe our liquidity and capital resources, including cash on hand and cash we expect to generate during 2018 and thereafter, future borrowings if any, as well as other available liquidity and capital resources discussed further below, are sufficient to finance our operations and growth strategy and to meet our debt obligations.
Divestiture of Darex
Upon the closing of the sale of Darex on July 3, 2017, we received pre-tax proceeds of approximately $1.06 billion before deal and other one-time costs. We have used a portion of these proceeds primarily to repay indebtedness, for acquisitions and for general corporate purposes.
67
The agreement governing our sale of Darex provides for a series of delayed closings in certain non-U.S. jurisdictions, including Argentina, China, Colombia, Indonesia, Peru and Venezuela for which sales proceeds were received on the July 3, 2017 closing date. The delayed closings will implement the legal transfer of the Darex business in the delayed closing jurisdictions in accordance with local law. During the nine months, we completed delayed closings in Argentina, Colombia, Peru and China and recognized a gain associated with these delayed closings of $43.5 million on a pre-tax basis and $29.1 million on an after-tax basis based on $55.4 million of proceeds received. During the prior-year period we recognized a gain of $883.7 million on a pre-tax basis and $683.7 million on an after-tax basis based on $1.0 billion of proceeds received on the sale of Darex entities that closed on July 3, 2017.
We expect to complete the remaining delayed closings for Indonesia and Venezuela over the following 4 to 15 months. Up to the time of the delayed closings, the results of the operations of the Darex business within the delayed close countries are reported as “Income from discontinued operations, net of income taxes” in the accompanying unaudited Consolidated Statements of Operations, which are adjusted for an economic benefit (payable to) or recovered from Henkel. The assets and liabilities of the Darex business in the remaining delayed close countries are categorized as assets or liabilities held for sale in the accompanying unaudited Consolidated Balance Sheets as of September 30, 2018 and December 31, 2017.
Cash Resources and Available Credit Facilities
At September 30, 2018, we had available liquidity of $687.4 million, consisting of $301.0 million in cash and cash equivalents, of which $60.2 million was held in the U.S., $344.3 million available under our revolving credit facility, and $42.1 million of available liquidity under various non-U.S. credit facilities.
Our non-U.S. credit facilities are extended to various subsidiaries that use them primarily to issue bank guarantees supporting trade activity and provide working capital during occasional cash shortfalls. We generally renew these credit facilities as they expire.
The following table summarizes our non-U.S. credit facilities as of September 30, 2018:
(In millions) | Maximum Borrowing Amount | Available Liquidity | Maturity Date | ||||||
China | $ | 12.0 | $ | 11.6 | 2/3/2021 | ||||
India | 12.0 | 2.6 | 2/3/2021 | ||||||
Canada | 5.8 | 5.8 | 2/3/2021 | ||||||
Korea | 5.0 | 5.0 | 2/3/2021 | ||||||
Mexico | 2.4 | 2.4 | 3/31/2019 | ||||||
Brazil | 2.2 | 2.2 | 10/31/2018 | ||||||
United Arab Emirates | 2.4 | 2.0 | 12/31/2018 | ||||||
Other countries | 12.2 | 10.5 | Open end | ||||||
Total | $ | 54.0 | $ | 42.1 | |||||
68
Analysis of Cash Flows
The following table summarizes our cash flows for the nine months and prior-year period:
Nine Months Ended September 30, | |||||||
(In millions) | 2018 | 2017 | |||||
Net cash provided by (used in) operating activities from continuing operations | $ | 29.6 | $ | (9.1 | ) | ||
Net cash used in investing activities from continuing operations | (73.3 | ) | (114.8 | ) | |||
Net cash used in financing activities from continuing operations | (243.9 | ) | (293.5 | ) | |||
Net cash provided by operating activities from continuing operations for the nine months was $29.6 million compared to net cash used in operating activities of $9.1 million for the prior-year period. The year-over-year change was primarily attributable to accounts receivable as a result of stronger cash collections during the nine months compared to the prior-year period, as well as lower cash paid for interest. These items were partially offset by increased cash outflows from accounts payable, higher cash paid for taxes and pension plan contributions.
Net cash used in operating activities from continuing operations for the nine months and prior-year-period included restructuring payments of $5.8 million and $4.3 million, respectively, and repositioning payments of $4.5 million and $5.4 million, respectively. Total cash payments were $10.3 million and $9.7 million, respectively, for the nine months and prior-year period.
Net cash used in investing activities from continuing operations for the nine months was $73.3 million, compared to $114.8 million for the prior-year period. The decrease year-over-year was primarily due to lower cash payments for acquisitions, partially offset by higher capital expenditures during the nine months compared to the prior-year period.
Net cash used in financing activities from continuing operations for the nine months was $243.9 million, compared to $293.5 million for the prior-year period. During the nine months, we redeemed the 9.5% Senior Notes for $587.9 million, in part using $350.0 million in proceeds from the issuance of the 5.5% Senior Notes. During the prior-year period we repaid the Term Loan principal balance outstanding under the Credit Agreement for $272.6 million.
Debt and Other Contractual Obligations
Debt
Total debt outstanding at September 30, 2018 and December 31, 2017 was $357.6 million and $544.3 million, respectively.
On April 10, 2018, we redeemed our then existing 9.5% Senior Notes with an aggregate principal amount of $525.0 million due in 2023 (the “9.5% Senior Notes”). On April 10, 2018, we also issued 5.5% Senior Notes with an aggregate principal amount of $350.0 million maturing on April 15, 2026 (the "5.5% Senior Notes") and entered into an amendment to our Credit Agreement to, among other things, (i) increase the aggregate principal amount available under our revolving credit facility to $350.0 million, (ii) extend the maturity date of the revolving credit facility thereunder to April 2023 and (iii) make certain other changes to the covenants and other provisions therein. Additionally, we borrowed $50.0 million in aggregate principal amount of revolving loans under the Credit Agreement on April 10, 2018 which was fully repaid during the 2018 second quarter. The aggregate cash payment of $587.9 million, which consisted of: (i) proceeds of $350.0 million from the issuance of the 5.5% Senior Notes, net of loan origination fees of $3.1 million, (ii) borrowings of $50.0 million under the Credit Agreement, and (iii) a cash payment of $191.0 million was used to redeem all of the then outstanding 9.5% Senior Notes in accordance with the terms of the indenture governing the 9.5% Senior Notes.
69
During the nine months, we recognized a loss on debt extinguishment of $59.4 million related to the 9.5% Senior Notes which was included in "Interest expense and related financing costs" in the accompanying unaudited Consolidated Statements of Operations. In connection with the redemption of our 9.5% Senior Notes with the then outstanding principal balance of $525.0 million, we paid total cash proceeds of $587.9 million, including $53.3 million of a redemption premium and $9.6 million of accrued interest unpaid thereon through the redemption date, and wrote off $6.1 million of previously deferred debt issuance costs.
5.5% Senior Notes
The 5.5% Senior Notes were issued pursuant to an Indenture (the “Indenture”), at $346.9 million, or 99.1% of their par value, resulting in a discount of $3.1 million, or 0.9%, which represented loan origination fees paid at the closing. We incurred additional deferred financing costs of $1.6 million during the nine months. Interest is payable semi-annually in arrears on April 15 and October 15 of each year, commencing on October 15, 2018. An interest payment of $9.9 million was paid on October 15, 2018. Our debt service requirements are expected to be funded through our existing sources of liquidity and operating cash flows.
Subject to certain conditions stated in the Indenture, we may, at our option and at any time and from time to time, redeem the 5.5% Senior Notes prior to their maturity date in whole or in part at certain redemption prices, as discussed in Note 4, "Debt and Other borrowings," in the Notes to the unaudited Consolidated Financial Statements included in Item 1 "Consolidated Financial Statements" of this Quarterly Report on Form 10‑Q. Upon occurrence of a change of control, as defined in the Indenture, we will be required to make an offer to repurchase the 5.5% Senior Notes at a price equal to 101.00% of their aggregate principal amount repurchased plus accrued and unpaid interest, if any, to, but excluding, the date of repurchase.
The Indenture contains certain covenants and provides for customary events of default subject to customary grace periods in certain cases. Please refer to Note 4, "Debt and Other borrowings," in the Notes to the unaudited Consolidated Financial Statements included in Item 1 "Consolidated Financial Statements" of this Quarterly Report on Form 10‑Q for additional information regarding our debt. As of September 30 2018, we were in compliance with all covenants and conditions under the Indenture. There are no events of default under the Indenture as of September 30, 2018.
Credit Agreement
On April 10, 2018, we entered into an amendment to our Credit Agreement and borrowed $50 million in aggregate principal amount of revolving loans under the Credit Agreement, as discussed above. The Credit Agreement contains conditions that would require mandatory principal payments in advance of the maturity date of the Revolving Credit Facility, as well as certain customary affirmative and negative covenants and events of default, as described in Note 5, "Debt and Other Financial Instruments," to our Consolidated Financial Statements included in the 2017 Annual Report in the Form 10-K. We were in compliance with all covenant terms as of September 30, 2018 and December 31, 2017. There are no events of default as of September 30, 2018 or December 31, 2017.
The interest rate per annum applicable to the Revolving Credit Facility is equal to, at our option, either: (i) a base rate plus a margin ranging from 0.5% to 1.0%, or (ii) LIBOR plus a margin ranging from 1.5% to 2.0%, based upon our total leverage ratio and our restricted subsidiaries' in both scenarios. During the nine months, the weighted average interest rate paid on the Revolving Credit Facility was 3.4%. During the nine months, we made aggregate payments of $50.0 million on the Revolving Credit Facility. As of September 30, 2018, there were no outstanding borrowings on the Revolving Credit Facility and $5.7 million in outstanding letters of credit, which resulted in available credit of $344.3 million under the Revolving Credit Facility. As of December 31, 2017, there were no outstanding borrowings under the Revolving Credit Facility. During nine months, interest payments made on the Revolving Credit Facility were $0.2 million. Please refer to Note 4, "Debt and Other borrowings," in the Notes to the unaudited Consolidated Financial Statements included in Item 1 "Consolidated Financial Statements" of this Quarterly Report on Form 10‑Q for additional information regarding our debt.
70
On July 3, 2017, we completed the sale of Darex to Henkel for approximately $1.06 billion in cash, subject to working capital and certain other adjustments. The sale of Darex is a permitted transaction under our Credit Agreement and the Indenture governing the 9.5% Senior Notes which were redeemed on April 10, 2018. Under the Credit Agreement and the Indenture governing the 9.5% Senior Notes, we were required to use net cash proceeds from the sale to prepay debt or make investments in the business over a period of approximately 18 months. During 2017, we fully repaid the outstanding principal balance on the Term Loan together with accrued and unpaid interest and extinguished the Term Loan under the Credit Agreement.
Other Contractual Obligations and Contingencies
We have various future contractual obligations, including those for debt and related interest payments, pension funding requirements, operating leases and other operating commitments. During the nine months, there were no material changes to our contractual obligations as previously reported in the “Management’s Discussion and Analysis of Financial Condition and Results of Operations - Financial Condition, Liquidity and Capital Resources” our Annual Report on Form 10-K for the year ended December 31, 2017, except for the issuance of the 5.5% Senior Notes, redemption of the 9.5% Senior Notes and amendment of the Credit Agreement described above.
Please refer to Note 8, "Commitments and Contingent Liabilities," in the Notes to the unaudited consolidated financial statements included in Item 1 "Consolidated Financial Statements" of this Quarterly Report on Form 10‑Q for a discussion of financial assurances and other contingencies.
Employee Benefit Plans
During the nine months and the prior-year period, we did not contribute any funds to the U.S. qualified pension plans.
We intend to fund non-U.S. pension plans based upon applicable legal requirements as well as actuarial and trustee recommendations. During the third quarter and the nine months, we contributed $0.4 million and $4.3 million, respectively, compared with $0.2 million and $1.9 million, respectively, in the corresponding prior year periods. The increase during the nine months was due to a $2.9 million discretionary contribution to a pension plan in Brazil.
Please refer to Note 6, "Pension Plans and Other Postretirement Benefit Plans," in the Notes to the unaudited Consolidated Financial Statements included in Item 1 "Consolidated Financial Statements" of this Quarterly Report on Form 10‑Q for further discussion on our pension plans.
Inflation
We recognize that inflationary pressures may have an adverse effect on us through higher asset replacement costs and higher raw material and other operating costs. We try to minimize these impacts through effective control of operating expenses and productivity improvements, as well as price increases to customers.
We estimate that the cost of replacing our property and equipment today is greater than its historical cost. Accordingly, our depreciation expense would be greater if the expense were stated on a current cost basis.
Venezuela
We deconsolidated our GCP Venezuela operations as of July 3, 2017 and the operating results of GCP Venezuela are no longer included in our consolidated financial results subsequent to that date. During the prior-year period, GCP Venezuela contributed net sales of $6.2 million and operating income of $3.2 million within continuing operations. In periods subsequent to the deconsolidation, we began accounting for GCP Venezuela using the cost method of accounting and recognized a pre-tax charge of $36.7 million, which was $23.8 million net of tax, during the prior-year quarter. Such charge was reflected in “Loss in Venezuela” in the accompanying unaudited consolidated Statements of Operations and primarily related to the recognition of unfavorable currency translation adjustments of $33.4 million related to the Venezuela subsidiary for periods prior to January 1, 2010. In periods subsequent to July 3, 2017, our financial results did not include the operating results of GCP Venezuela. The remaining investment in GCP Venezuela included in our unaudited Consolidated
71
Balance Sheets included in Item 1 "Consolidated Financial Statements" of this Quarterly Report on Form 10-Q is immaterial.
Argentina
As of June 30, 2018, we concluded that Argentina is a highly inflationary economy since the three-year cumulative inflation rates commonly used to evaluate Argentina’s inflation currently exceed 100%. As a result, we began accounting for our operations in Argentina as a highly inflationary economy during the third quarter. Effective July 1, 2018, the functional currency of our subsidiary operating in Argentina became the U.S. dollar and all remeasurement adjustments after the effective date are reflected in our results operations in the accompanying unaudited Consolidated Statements of Operations. During the third quarter, we incurred losses of $1.1 million which are included in "Other income, net" in the Consolidated Statement of Operations, related to the remeasurement of these monetary net assets. During the third quarter and the nine months, net sales generated by the Argentina subsidiary were not material to our consolidated net sales. Monetary net assets denominated in local currency within our Argentina subsidiary were not material to our consolidated total assets as of September 30, 2018.
Critical Accounting Policies and Estimates
For information on our significant accounting policies and estimates, please refer to Note 1, "Basis of Presentation and Summary of Significant Accounting and Financial Reporting Policies" in the Notes to the unaudited Consolidated Financial Statements included in Item 1 "Consolidated Financial Statements" of this Quarterly Report on Form 10-Q and in the Notes to our audited Consolidated Financial Statements included in Part II, Item 8 “Financial Statements and Supplementary Data” in our 2017 Annual Report on Form 10-K for the year ended December 31, 2017.
Recent Accounting Pronouncements
Effective January 1, 2018, we adopted Accounting Standard Update (the "ASU") 2014-09, Revenue from Contracts with Customers (Topic 606). The impact of this adoption was deemed immaterial to our net sales, income (loss) from continuing operations before income taxes, income (loss) from continuing operations, and net income (loss) during the third quarter of 2018 and nine months of 2018. For further discussion of recently issued and adopted accounting pronouncements applicable to our unaudited Consolidated Financial Statements and their potential effect on our results of operations, financial position and related disclosures, please refer to Note 1, "Basis of Presentation and Summary of Significant Accounting and Financial Reporting Policies," in the Notes to the unaudited Consolidated Financial Statements included in Item 1 "Consolidated Financial Statements" of this Quarterly Report on Form 10-Q.
72
Item 3. QUANTITATIVE AND QUALITATIVE DISCLOSURES ABOUT MARKET RISK
With respect to information disclosed in the "Quantitative and Qualitative Disclosures About Market Risk" section of our Annual Report on Form 10-K for the year ended December 31, 2017 ("2017 Annual Report"), more recent numerical measures and other information are available in the "Financial Statements" and "Management's Discussion and Analysis of Financial Condition and Results of Operations" sections of this Report. These more recent measures and the information disclosed in the "Quantitative and Qualitative Disclosures About Market Risk" section of our 2017 Annual Report are incorporated herein by reference.
Item 4. CONTROLS AND PROCEDURES
Management’s Evaluation of Disclosure Controls and Procedures
Our management, with the participation of our principal executive officer and principal financial officer, evaluated the effectiveness of our disclosure controls and procedures, as defined in Rules 13a-15(e) and 15d-15(e) of the Securities Exchange Act of 1934 (the "Exchange Act"). Disclosure controls are designed to provide reasonable assurance that we are able to record, process, summarize and report the information required to be disclosed in our reports under the Exchange Act within the time periods specified in SEC rules and forms. Based on their evaluation, our principal executive officer and principal financial officer concluded that, as of the end of the period covered by this report, our disclosure controls and procedures were effective.
Changes in Internal Control Over Financial Reporting
There were no changes in our internal control over financial reporting during the quarter ended September 30, 2018, that have materially affected, or are reasonably likely to materially affect, our internal control over financial reporting.
73
PART II. OTHER INFORMATION
Item 1. LEGAL PROCEEDINGS
Information with respect to this Item may be found in Note 8 "Commitments and Contingent Liabilities" in the Notes to the unaudited Consolidated Financial Statements included in Item 1 "Consolidated Financial Statements" of this Quarterly Report on Form 10-Q which information is incorporated herein by reference.
Additional information on our commitments and contingencies can be found in our Annual Report on Form 10-K for our fiscal year ended December 31, 2017.
Item 1A. RISK FACTORS
There are no material changes from the risk factors as previously disclosed in our Annual Report on Form 10-K for our year ended December 31, 2017.
Item 6. EXHIBITS
Exhibit No. | Description of Exhibit | |
101.INS* | XBRL Instance Document | |
101.SCH* | XBRL Taxonomy Extension Schema | |
101.CAL* | XBRL Taxonomy Extension Calculation Linkbase | |
101.DEF* | XBRL Taxonomy Extension Definition Linkbase | |
101.LAB* | XBRL Taxonomy Extension Label Linkbase | |
101.PRE* | XBRL Taxonomy Extension Presentation Linkbase | |
* Filed herewith.
** Furnished herewith.
74
SIGNATURES
In accordance with the requirements of the Securities Exchange Act of 1934, the registrant caused this report to be signed on its behalf by the undersigned, thereunto duly authorized.
GCP Applied Technologies Inc. (Registrant) | ||
Date: November 6, 2018 | By: | /s/ GREGORY E. POLING |
Gregory E. Poling Chief Executive Officer (Principal Executive Officer) | ||
Date: November 6, 2018 | By: | /s/ DEAN P. FREEMAN |
Dean P. Freeman Vice President and Chief Financial Officer (Principal Financial Officer) | ||
Date: November 6, 2018 | By: | /s/ KENNETH S. KOROTKIN |
Kenneth S. Korotkin Vice President, Controller and Chief Accounting Officer (Principal Accounting Officer) | ||
75