Attached files
| file | filename |
|---|---|
| EX-32 - EXHIBIT 32 - GCP Applied Technologies Inc. | a2017q310-qexhibit32.htm |
| EX-31.2 - EXHIBIT 31.2 - GCP Applied Technologies Inc. | a2017q310-qexhibit312.htm |
| EX-31.1 - EXHIBIT 31.1 - GCP Applied Technologies Inc. | a2017q310-qexhibit311.htm |
UNITED STATES
SECURITIES AND EXCHANGE COMMISSION
WASHINGTON, D.C. 20549
FORM 10-Q
ý | QUARTERLY REPORT PURSUANT TO SECTION 13 OR 15(d) OF THE SECURITIES EXCHANGE ACT OF 1934 | |
For the Quarterly Period Ended September 30, 2017 | ||
OR | ||
o | TRANSITION REPORT PURSUANT TO SECTION 13 OR 15(d) OF THE SECURITIES EXCHANGE ACT OF 1934 | |
Commission File Number 1-137533 | ||
GCP Applied Technologies Inc.
Delaware (State of Incorporation) | 47-3936076 (I.R.S. Employer Identification No.) | |
62 Whittemore Avenue, Cambridge, Massachusetts 02140-1623
(617) 876-1400
(Address and phone number of principal executive offices)
Indicate by check mark whether the registrant (1) has filed all reports required to be filed by Section 13 or 15(d) of the Securities Exchange Act of 1934 during the preceding 12 months (or for such shorter period that the registrant was required to file such reports), and (2) has been subject to such filing requirements for the past 90 days. Yes ý No o
Indicate by check mark whether the registrant has submitted electronically and posted on its corporate Web site, if any, every Interactive Data File required to be submitted and posted pursuant to Rule 405 of Regulation S-T (§232.405 of this chapter) during the preceding 12 months (or for such shorter period that the registrant was required to submit and post such files). Yes ý No o
Indicate by check mark whether the registrant is a large accelerated filer, an accelerated filer, a non-accelerated filer, or a smaller reporting company. See the definitions of "large accelerated filer," "accelerated filer" and "smaller reporting company" in Rule 12b-2 of the Exchange Act.
Large accelerated filer o | Accelerated filer o | Non-accelerated filer ý (Do not check if a smaller reporting company) | Smaller reporting company o | Emerging growth company o | ||||
If an emerging growth company, indicate by check mark if the registrant has elected not to use the extended transition period for complying with any new or revised financial accounting standards provided pursuant to Section 13(a) of the Exchange Act. o
Indicate by check mark whether the registrant is a shell company (as defined in Rule 12b-2 of the Exchange Act). Yes o No ý
Indicate the number of shares outstanding of each of the issuer's classes of common stock, as of the latest practicable date.
Class | Outstanding at October 31, 2017 | |
Common Stock, $0.01 par value per share | 71,636,080 shares | |
TABLE OF CONTENTS | ||||
_______________________________________________________________________________
2
Presentation of Information
Unless the context requires otherwise, references to "GCP Applied Technologies Inc.", "GCP", "we", "us", "our" and "the Company" refer to GCP Applied Technologies Inc., and its consolidated subsidiaries for periods subsequent to its separation from W.R. Grace & Co. on February 3, 2016. For periods prior to February 3, 2016, these terms refer to the combined historical business and operations of W.R. Grace & Co.’s construction products and packaging technologies businesses as they were historically managed as part of W.R. Grace & Co. Unless the context requires otherwise, references to "Grace" refer to W.R. Grace & Co., and its consolidated subsidiaries, which is the Company’s former parent company. References in this Quarterly Report on Form 10-Q to the "Separation" refer to the legal separation and transfer of Grace’s construction products and packaging technologies businesses to the Company through a dividend distribution of all of the then-outstanding common stock of GCP to Grace shareholders on February 3, 2016.
Forward-Looking Statements
This document contains, and our other public communications may contain, forward-looking statements, that is, information related to future, not past, events. Such statements generally include the words "believes," "plans," "intends," "targets," "will," "expects," "suggests," "anticipates," "outlook," "continues" or similar expressions. Forward-looking statements include, without limitation, statements about expected financial positions; results of operations; cash flows; financing plans; business strategy; operating plans; capital and other expenditures; competitive positions; growth opportunities for existing products; benefits from new technology and cost reduction initiatives, plans and objectives; and markets for securities. Like other businesses, we are subject to risks and uncertainties that could cause our actual results to differ materially from our projections or that could cause other forward-looking statements to prove incorrect. Factors that could cause actual events to materially differ from those contained in the forward-looking statements include, without limitation, risks related to: the cyclical and seasonal nature of the industries that GCP serves; foreign operations, especially in emerging regions; changes in currency exchange rates; the cost and availability of raw materials and energy; the effectiveness of GCP's research and development, new product introductions and growth investments; acquisitions and divestitures of assets and gains and losses from dispositions; developments affecting GCP’s outstanding indebtedness, including debt covenants and interest rate exposure; developments affecting GCP's funded and unfunded pension obligations; warranty and product liability claims; legal proceedings; uncertainties related to GCP’s ability to realize the anticipated benefits of the spin-off /separation from W.R. Grace and the value of GCP’s common stock following the spin-off; the inability to establish or maintain certain business relationships and relationships with customers and suppliers or the inability to retain key personnel following the spin-off; and hazardous materials and the costs of compliance with environmental regulation. These and other factors are identified and described in more detail in GCP's most recent Annual Report on Form 10-K, this Quarterly Report on Form 10-Q and Current Reports on Form 8-K, which have been filed with the Securities and Exchange Commission ("SEC") and are available online at www.sec.gov. Our reported results should not be considered as an indication of our future performance. Readers are cautioned not to place undue reliance on GCP's projections and forward-looking statements, which speak only as of the date thereof. GCP undertakes no obligation to publicly release any revision to the projections and forward-looking statements contained in this document, or to update them to reflect events or circumstances occurring after the date of this document.
3
PART I. FINANCIAL INFORMATION
Item 1. Financial Statements
GCP Applied Technologies Inc.
Consolidated Statements of Operations (unaudited)
Three Months Ended September 30, | Nine Months Ended September 30, | ||||||||||||||
(In millions, except per share amounts) | 2017 | 2016 | 2017 | 2016 | |||||||||||
Net sales | $ | 282.4 | $ | 263.4 | $ | 794.9 | $ | 785.1 | |||||||
Cost of goods sold | 175.9 | 154.8 | 488.1 | 465.1 | |||||||||||
Gross profit | 106.5 | 108.6 | 306.8 | 320.0 | |||||||||||
Selling, general and administrative expenses | 76.3 | 67.4 | 221.9 | 199.5 | |||||||||||
Research and development expenses | 5.2 | 4.7 | 15.2 | 13.6 | |||||||||||
Interest expense and related financing costs | 21.6 | 18.8 | 56.1 | 49.0 | |||||||||||
Repositioning expenses | 1.1 | 5.3 | 6.8 | 14.3 | |||||||||||
Restructuring expenses and asset impairments | 2.1 | 0.4 | 13.0 | 1.4 | |||||||||||
Loss in Venezuela | 36.7 | — | 38.3 | — | |||||||||||
Other income, net | (4.0 | ) | (1.6 | ) | (6.6 | ) | (1.7 | ) | |||||||
Total costs and expenses | 139.0 | 95.0 | 344.7 | 276.1 | |||||||||||
(Loss) income from continuing operations before income taxes | (32.5 | ) | 13.6 | (37.9 | ) | 43.9 | |||||||||
Income tax benefit (expense) | 14.5 | (2.5 | ) | (3.7 | ) | (9.8 | ) | ||||||||
(Loss) income from continuing operations | (18.0 | ) | 11.1 | (41.6 | ) | 34.1 | |||||||||
Income from discontinued operations, net of income taxes | 677.3 | 10.4 | 679.4 | 36.2 | |||||||||||
Net income | 659.3 | 21.5 | 637.8 | 70.3 | |||||||||||
Less: Net income attributable to noncontrolling interests | (0.1 | ) | (0.2 | ) | (0.2 | ) | (0.9 | ) | |||||||
Net income attributable to GCP shareholders | $ | 659.2 | $ | 21.3 | $ | 637.6 | $ | 69.4 | |||||||
Amounts Attributable to GCP Shareholders: | |||||||||||||||
(Loss) income from continuing operations attributable to GCP shareholders | (18.1 | ) | 10.9 | (41.8 | ) | 33.2 | |||||||||
Income from discontinued operations, net of income taxes | 677.3 | 10.4 | 679.4 | 36.2 | |||||||||||
Net income attributable to GCP shareholders | $ | 659.2 | $ | 21.3 | $ | 637.6 | $ | 69.4 | |||||||
Earnings Per Share Attributable to GCP Shareholders | |||||||||||||||
Basic earnings per share: | |||||||||||||||
(Loss) income from continuing operations attributable to GCP shareholders | $ | (0.25 | ) | $ | 0.15 | $ | (0.59 | ) | $ | 0.47 | |||||
Income from discontinued operations, net of income taxes | $ | 9.46 | $ | 0.15 | $ | 9.54 | $ | 0.51 | |||||||
Net income attributable to GCP shareholders(2) | $ | 9.21 | $ | 0.30 | $ | 8.96 | $ | 0.98 | |||||||
Weighted average number of basic shares | 71.6 | 71.0 | 71.2 | 70.8 | |||||||||||
Diluted earnings per share:(1) | |||||||||||||||
(Loss) income from continuing operations attributable to GCP shareholders | $ | (0.25 | ) | $ | 0.15 | $ | (0.59 | ) | $ | 0.46 | |||||
Income from discontinued operations, net of income taxes | $ | 9.46 | $ | 0.14 | $ | 9.54 | $ | 0.51 | |||||||
Net income attributable to GCP shareholders(2) | $ | 9.21 | $ | 0.30 | $ | 8.96 | $ | 0.97 | |||||||
Weighted average number of diluted shares | 71.6 | 72.2 | 71.2 | 71.6 | |||||||||||
(1) Dilutive effect only applicable to periods where there is net income from continuing operations.
(2) Amounts may not sum due to rounding.
The Notes to Consolidated Financial Statements are an integral part of these statements.
4
GCP Applied Technologies Inc.
Consolidated Balance Sheets (unaudited)
(In millions, except par value and shares) | September 30, 2017 | December 31, 2016 | |||||
ASSETS | |||||||
Current Assets | |||||||
Cash and cash equivalents | $ | 771.4 | $ | 147.0 | |||
Trade accounts receivable, less allowance of $6.0 (2016—$4.5) | 209.4 | 166.6 | |||||
Inventories | 108.4 | 89.3 | |||||
Other current assets | 59.2 | 42.9 | |||||
Current assets held for sale | 16.8 | 108.0 | |||||
Total Current Assets | 1,165.2 | 553.8 | |||||
Properties and equipment, net | 209.1 | 192.6 | |||||
Goodwill | 183.8 | 114.9 | |||||
Technology and other intangible assets, net | 76.9 | 52.6 | |||||
Deferred income taxes | 45.4 | 76.9 | |||||
Overfunded defined benefit pension plans | 22.1 | 21.2 | |||||
Other assets | 28.1 | 22.4 | |||||
Noncurrent assets held for sale | 2.5 | 55.4 | |||||
Total Assets | $ | 1,733.1 | $ | 1,089.8 | |||
LIABILITIES AND STOCKHOLDERS' EQUITY (DEFICIT) | |||||||
Current Liabilities | |||||||
Debt payable within one year | $ | 23.8 | $ | 47.9 | |||
Accounts payable | 120.8 | 95.9 | |||||
Other current liabilities | 310.3 | 119.5 | |||||
Current liabilities held for sale | 8.1 | 48.2 | |||||
Total Current Liabilities | 463.0 | 311.5 | |||||
Debt payable after one year | 520.3 | 783.0 | |||||
Deferred income taxes | 13.5 | 6.6 | |||||
Unrecognized tax benefits | 42.7 | 9.7 | |||||
Underfunded and unfunded defined benefit pension plans | 85.6 | 83.2 | |||||
Other liabilities | 35.5 | 13.9 | |||||
Noncurrent liabilities held for sale | 0.3 | 20.9 | |||||
Total Liabilities | 1,160.9 | 1,228.8 | |||||
Commitments and Contingencies - Note 7 | |||||||
Stockholders' Equity (Deficit) | |||||||
Common stock issued, par value $0.01; 300,000,000 shares authorized; outstanding: 71,628,903 and 71,081,764 respectively | 0.7 | 0.7 | |||||
Paid-in capital | 25.1 | 11.0 | |||||
Accumulated earnings (deficit) | 632.9 | (4.7 | ) | ||||
Accumulated other comprehensive loss | (85.0 | ) | (147.6 | ) | |||
Treasury stock | (3.1 | ) | (2.1 | ) | |||
Total GCP Shareholders' Equity (Deficit) | 570.6 | (142.7 | ) | ||||
Noncontrolling interests | 1.6 | 3.7 | |||||
Total Stockholders' Equity (Deficit) | 572.2 | (139.0 | ) | ||||
Total Liabilities and Stockholders' Equity (Deficit) | $ | 1,733.1 | $ | 1,089.8 | |||
The Notes to Consolidated Financial Statements are an integral part of these statements.
5
GCP Applied Technologies Inc.
Consolidated Statements of Comprehensive Income (Loss) (unaudited)
Three Months Ended September 30, | Nine Months Ended September 30, | ||||||||||||||
(In millions) | 2017 | 2016 | 2017 | 2016 | |||||||||||
Net income | $ | 659.3 | $ | 21.5 | $ | 637.8 | $ | 70.3 | |||||||
Other comprehensive income (loss): | |||||||||||||||
Defined benefit pension and other postretirement plans, net of income taxes | $ | (0.3 | ) | $ | — | $ | (0.3 | ) | $ | (0.5 | ) | ||||
Currency translation adjustments | 46.2 | 3.0 | 63.0 | 3.5 | |||||||||||
Gain (loss) from hedging activities, net of income taxes | 0.5 | (0.1 | ) | (0.1 | ) | (0.1 | ) | ||||||||
Total other comprehensive income attributable to noncontrolling interests | — | — | — | 0.2 | |||||||||||
Total other comprehensive income | 46.4 | 2.9 | 62.6 | 3.1 | |||||||||||
Comprehensive income | 705.7 | 24.4 | 700.4 | 73.4 | |||||||||||
Less: Comprehensive income attributable to noncontrolling interests | (0.1 | ) | (0.2 | ) | (0.2 | ) | (1.1 | ) | |||||||
Comprehensive income attributable to GCP shareholders | $ | 705.6 | $ | 24.2 | $ | 700.2 | $ | 72.3 | |||||||
The Notes to Consolidated Financial Statements are an integral part of these statements.
6
GCP Applied Technologies Inc.
Consolidated Statements of Stockholders' Equity (Deficit) (unaudited)
Common Stock | Treasury Stock | ||||||||||||||||||||||||||||||||||||
(In millions) | Number of Shares | Par Value | Number of Shares | Cost | Additional Paid-in Capital | Accumulated Earnings/(Deficit) | Net Parent Investment | Accumulated Other Comprehensive Loss | Noncontrolling Interests | Total Stockholders' Equity (Deficit) | |||||||||||||||||||||||||||
Balance, December 31, 2015 | — | $ | — | — | $ | — | $ | — | $ | — | $ | 598.3 | $ | (127.7 | ) | $ | 3.5 | $ | 474.1 | ||||||||||||||||||
Net income | — | — | — | — | — | 62.2 | 7.2 | — | 0.9 | 70.3 | |||||||||||||||||||||||||||
Net transfer to parent | — | — | — | — | — | — | (672.2 | ) | — | — | (672.2 | ) | |||||||||||||||||||||||||
Issuance of common stock and reclassification of net parent investment in connection with Separation | 70.5 | 0.7 | — | — | — | (67.4 | ) | 66.7 | — | — | — | ||||||||||||||||||||||||||
Issuance of common stock in connection with stock plans | 0.1 | — | — | — | — | — | — | — | — | — | |||||||||||||||||||||||||||
Share-based compensation | — | — | — | — | — | 4.7 | — | — | — | 4.7 | |||||||||||||||||||||||||||
Exercise of stock options | 0.4 | — | — | — | — | 4.1 | — | — | — | 4.1 | |||||||||||||||||||||||||||
Treasury stock purchased under GCP 2016 Stock Incentive Plan | — | — | 0.1 | (1.8 | ) | — | — | — | — | — | (1.8 | ) | |||||||||||||||||||||||||
Other comprehensive income | — | — | — | — | — | — | — | 2.9 | 0.2 | 3.1 | |||||||||||||||||||||||||||
Dividends and other changes in noncontrolling interest | — | — | — | — | — | — | — | — | (0.7 | ) | (0.7 | ) | |||||||||||||||||||||||||
Balance, September 30, 2016 | 71.0 | $ | 0.7 | 0.1 | $ | (1.8 | ) | $ | — | $ | 3.6 | $ | — | $ | (124.8 | ) | $ | 3.9 | $ | (118.4 | ) | ||||||||||||||||
Balance, December 31, 2016 | 71.2 | $ | 0.7 | 0.1 | $ | (2.1 | ) | $ | 11.0 | $ | (4.7 | ) | $ | — | $ | (147.6 | ) | $ | 3.7 | $ | (139.0 | ) | |||||||||||||||
Net income | — | — | — | — | — | 637.6 | — | — | 0.2 | 637.8 | |||||||||||||||||||||||||||
Issuance of common stock in connection with stock plans | 0.1 | — | — | — | — | — | — | — | — | — | |||||||||||||||||||||||||||
Share-based compensation | — | — | — | — | 7.5 | — | — | — | 7.5 | ||||||||||||||||||||||||||||
Exercise of stock options | 0.4 | — | — | — | 6.6 | — | — | — | 6.6 | ||||||||||||||||||||||||||||
Share repurchases | — | — | — | (1.0 | ) | — | — | — | — | — | (1.0 | ) | |||||||||||||||||||||||||
Other comprehensive income | — | — | — | — | — | — | — | 62.6 | — | 62.6 | |||||||||||||||||||||||||||
Dividends and other changes in noncontrolling interest | — | — | — | — | — | — | — | — | (2.3 | ) | (2.3 | ) | |||||||||||||||||||||||||
Balance, September 30, 2017 | 71.7 | $ | 0.7 | 0.1 | $ | (3.1 | ) | $ | 25.1 | $ | 632.9 | $ | — | $ | (85.0 | ) | $ | 1.6 | $ | 572.2 | |||||||||||||||||
The Notes to Consolidated Financial Statements are an integral part of these statements.
7
GCP Applied Technologies Inc.
Consolidated Statements of Cash Flows (unaudited)
Nine Months Ended September 30, | |||||||
(In millions) | 2017 | 2016 | |||||
OPERATING ACTIVITIES | |||||||
Net income | $ | 637.8 | $ | 70.3 | |||
Less: Income from discontinued operations | 679.4 | 36.2 | |||||
(Loss) income from continuing operations | (41.6 | ) | 34.1 | ||||
Reconciliation to net cash (used in) provided by operating activities: | |||||||
Depreciation and amortization | 26.9 | 22.2 | |||||
Amortization of debt discount and financing costs | 2.2 | 2.0 | |||||
Stock-based compensation expense | 7.1 | 4.9 | |||||
Gain on termination and curtailment of pension and other postretirement plans | (5.8 | ) | (2.6 | ) | |||
Currency and other losses in Venezuela | 40.1 | 2.9 | |||||
Deferred income taxes | (5.6 | ) | (10.5 | ) | |||
(Gain) loss on disposal of property and equipment | (0.6 | ) | 0.5 | ||||
Loss on sale of product line | 2.1 | — | |||||
Changes in assets and liabilities, excluding effect of currency translation: | |||||||
Trade accounts receivable | (40.0 | ) | (28.6 | ) | |||
Inventories | (13.3 | ) | (7.5 | ) | |||
Accounts payable | 18.8 | 6.9 | |||||
Pension assets and liabilities, net | 7.2 | 3.4 | |||||
Other assets and liabilities, net | (9.2 | ) | (1.4 | ) | |||
Net cash (used in) provided by operating activities from continuing operations | (11.7 | ) | 26.3 | ||||
Net cash (used in) provided by operating activities from discontinued operations | (15.3 | ) | 46.7 | ||||
Net cash (used in) provided by operating activities | (27.0 | ) | 73.0 | ||||
INVESTING ACTIVITIES | |||||||
Capital expenditures | (32.4 | ) | (30.5 | ) | |||
Businesses acquired, net of cash acquired | (87.7 | ) | — | ||||
Proceeds from sale of product line | 2.9 | — | |||||
Other investing activities | 2.4 | 0.5 | |||||
Net cash used in investing activities from continuing operations | (114.8 | ) | (30.0 | ) | |||
Net cash provided by (used in) investing activities from discontinued operations | 1,038.3 | (2.8 | ) | ||||
Net cash provided by (used in) investing activities | 923.5 | (32.8 | ) | ||||
FINANCING ACTIVITIES | |||||||
Borrowings under credit arrangements | 120.0 | 294.3 | |||||
Repayments under credit arrangements | (416.6 | ) | (30.7 | ) | |||
Proceeds from issuance of notes | — | 525.0 | |||||
Cash paid for debt financing costs | — | (18.2 | ) | ||||
Share repurchases | (1.0 | ) | (1.8 | ) | |||
Proceeds from exercise of stock options | 6.1 | 3.7 | |||||
Noncontrolling interest dividend | (2.0 | ) | (0.7 | ) | |||
Transfers to parent, net | — | (758.7 | ) | ||||
Net cash (used in) provided by financing activities from continuing operations | (293.5 | ) | 12.9 | ||||
Net cash provided by (used in) financing activities from discontinued operations | 1.1 | (5.8 | ) | ||||
Net cash (used in) provided by financing activities | (292.4 | ) | 7.1 | ||||
Effect of currency exchange rate changes on cash and cash equivalents | 4.0 | 2.6 | |||||
Increase in cash and cash equivalents | 608.1 | 49.9 | |||||
Cash and cash equivalents, beginning of period | 163.3 | 98.6 | |||||
Cash and cash equivalents, end of period | 771.4 | 148.5 | |||||
Less: Cash and cash equivalents of discontinued operations | — | 23.7 | |||||
Cash and cash equivalents of continuing operations, end of period | $ | 771.4 | $ | 124.8 | |||
The Notes to Consolidated Financial Statements are an integral part of these statements.
8
Notes to Consolidated Financial Statements
1. Basis of Presentation and Summary of Significant Accounting and Financial Reporting Policies
On January 27, 2016, GCP entered into a separation and distribution agreement pursuant to which W.R. Grace & Co. ("Grace") agreed to transfer its Grace Construction Products operating segment and the packaging technologies business, operated under the “Darex” name, of its Grace Materials Technologies operating segment to GCP (the "Separation"). The Separation occurred on February 3, 2016, by means of a pro rata distribution to Grace stockholders of all of the then-outstanding shares of Company common stock, at which time GCP became an independent public company and its common stock listed and began trading under the symbol "GCP" on the New York Stock Exchange.
On July 3, 2017, GCP completed the sale of its Darex Packaging Technologies ("Darex") business to Henkel AG & Co. KgaA (“Henkel”) for $1.06 billion in cash, subject to customary closing adjustments. As discussed further below under "Discontinued Operations," the results of operations for Darex have been excluded from continuing operations and segment results for all periods presented.
GCP is engaged in the production and sale of specialty construction chemicals and specialty building materials through two operating segments. Specialty Construction Chemicals ("SCC") manufactures and markets concrete admixtures and cement additives. Specialty Building Materials ("SBM") manufactures and markets sheet and liquid membrane systems that protect structures from water, air and vapor penetration, fireproofing and other products designed to protect the building envelope.
Basis of Presentation
The accompanying Consolidated Financial Statements are presented on a consolidated basis and include all of the accounts and operations of GCP and its majority-owned subsidiaries, except as noted below with respect to the Company's Venezuela subsidiary. The financial statements reflect the financial position, results of operations and cash flows of GCP in accordance with generally accepted accounting principles in the United States of America ("GAAP") and with the instructions to Form 10-Q and Article 10 of SEC Regulation S-X for interim financial information.
The interim financial statements presented herein are unaudited and should be read in conjunction with the Consolidated Financial Statements presented in the Company's 2016 Annual Report on Form 10-K. Such financial statements reflect all adjustments that, in the opinion of management, are necessary for a fair statement of the results of the interim periods presented; all such adjustments are of a normal recurring nature except for the impacts of adopting new accounting standards as discussed below. All significant intercompany accounts and transactions have been eliminated. The results of operations for the nine-month period ended September 30, 2017 are not necessarily indicative of the results of operations for the year ending December 31, 2017.
Discontinued Operations As noted above, on July 3, 2017, the Company completed the sale of Darex to Henkel. In conjunction with this transaction and applicable GAAP, the assets and liabilities related to Darex have been reclassified and reflected as "held for sale" on the Consolidated Balance Sheet as of December 31, 2016. As discussed further in Note 14, the assets and liabilities of the Darex business in certain delayed close countries are categorized as “Assets held for sale” or “Liabilities held for sale” in the accompanying Consolidated Balance Sheet as of September 30, 2017. Additionally, Darex has been reclassified and reflected as "discontinued operations" on the Consolidated Statements of Operations and Consolidated Statements of Cash Flows for all periods presented.
GCP recognized a pre-tax gain on the sale of Darex of approximately $883.7 million during the third quarter of 2017. The calculation of the pre-tax gain excludes deferral of $68.7 million of consideration related to the delayed closings, which was received on the closing date. Deferred consideration is recorded in “Other current liabilities” and “Other liabilities” on the Consolidated Balance Sheet as of September 30, 2017.
Unless otherwise noted, the information throughout the Notes to the Consolidated Financial Statements pertains only to the continuing operations of GCP. Refer to Note 14 for further discussion of the sale of Darex.
9
Table of Contents
Notes to Consolidated Financial Statements (Continued)
Deconsolidation of Venezuelan Operations Prior to July 3, 2017, the Company included the results of its Venezuelan operations (“GCP Venezuela”) in the Consolidated Financial Statements using the consolidation method of accounting. Venezuelan exchange control regulations have resulted in an other-than-temporary lack of exchangeability between the Venezuelan bolivar and U.S. dollar, and have restricted GCP Venezuela’s ability to pay dividends and meet obligations denominated in U.S. dollars. These exchange regulations, combined with other recently adopted regulations, have constrained availability of raw materials and have significantly limited GCP Venezuela’s ability to maintain normal production. As a result of these conditions, combined with the loss of scale in Venezuela resulting from the sale of the Company’s Darex-related operations and assets in Venezuela, GCP has deconsolidated its Venezuelan operations as of July 3, 2017 in accordance with Financial Accounting Standards Board ("FASB") Accounting Standards Codification ("ASC") 810, Consolidation. Subsequent to this date, the Company began accounting for GCP Venezuela using the cost method of accounting. This change resulted in a third quarter 2017 pre-tax charge of $36.7 million ($23.8 million net of tax), which is reflected in “Loss in Venezuela” in the accompanying Statement of Operations, primarily related to the recognition of $33.4 million of unfavorable cumulative translation adjustments associated with the Venezuelan business.
In the third quarter of 2017, GCP recorded an out-period-adjustment to correct the misclassification of a $3.4 million foreign exchange remeasurement loss that was incorrectly included within discontinued operations in the second quarter of 2017. The impact of this correction, of which $2.9 million is reflected in "Loss on Venezuela" and $0.5 million is reflected in "Other income, net" on the Consolidated Statement of Operations, resulted in an increase in "Loss from continuing operations." There was no tax impact associated with this adjustment. There is no impact to the Consolidated Statement of Operations for the nine-month period ended September 30, 2017. GCP has assessed the impact of this error and concluded that the amount was not material to any prior-period financial statements and the impact of correcting this error in the current period is not material.
In periods subsequent to July 3, 2017, the Company’s financial results will not include the operating results of GCP Venezuela. The Company will record cash and recognize income from its Venezuelan operations in the consolidated financial statements to the extent GCP is paid for inventory sold to or dividends received from GCP Venezuela. The remaining investment on the Company's Consolidated Balance Sheet as of September 30, 2017 is immaterial.
Use of Estimates The preparation of financial statements in conformity with GAAP requires management to make estimates and assumptions that affect the reported amount of assets and liabilities and disclosure of contingent assets and liabilities at the date of the Consolidated Financial Statements, and the reported amounts of revenues and expenses for the periods presented. Actual amounts could differ from those estimates, and the differences could be material. Changes in estimates are recorded in the period identified. GCP's accounting measurements that are most affected by management's estimates of future events are disclosed in its 2016 Annual Report on Form 10-K; there have been no significant changes to management's assumptions and estimates underlying those measurements as reported in these interim financial statements.
Reclassifications Certain amounts in prior period financial statements have been reclassified to conform to the current period presentation. Such reclassifications have not materially affected previously reported amounts.
Income Tax As a global enterprise, GCP is subject to a complex array of tax regulations and must make assessments of applicable tax law and judgments in estimating its ultimate income tax liability. Refer to Note 4 for details regarding estimates used in accounting for income tax matters including unrecognized tax benefits.
10
Table of Contents
Notes to Consolidated Financial Statements (Continued)
Stock-Based Compensation Expense Prior to the Separation, GCP was allocated stock-based compensation expense from Grace related to GCP employees receiving awards denominated in Grace equity instruments. In accordance with an employee matters agreement entered into between Grace and GCP on January 27, 2016 in connection with the Separation (the "Employee Matters Agreement"), previously outstanding stock-based compensation awards granted under Grace's equity compensation programs prior to the Separation and held by certain executives and employees of GCP and Grace were adjusted to reflect the impact of the Separation on these awards. To preserve the aggregate intrinsic value of these stock-based compensation awards, as measured immediately before and immediately after the Separation, each holder of Grace stock-based compensation awards generally received an adjusted award consisting of either (i) both a stock-based compensation award denominated in Grace equity as it existed subsequent to the Separation and a stock-based compensation award denominated in GCP equity or (ii) solely a stock-based compensation award denominated in the equity of the company at which the person was employed following the Separation. In the Separation, the determination as to which type of adjustment applied to a holder’s previously outstanding Grace award was based upon the type of stock-based compensation award that was to be adjusted and the date on which the award was originally granted under the Grace equity compensation programs prior to the Separation. Under the Employee Matters Agreement, GCP retains certain obligations related to all stock- and cash-settled stock-based compensation awards denominated in GCP equity, regardless of whether the holder is a GCP or Grace employee. Following the Separation, the Company records stock-based compensation expense for equity awards in accordance with authoritative accounting guidance.
Currency Translation Assets and liabilities of foreign subsidiaries (other than those located in countries with highly inflationary economies) are translated into U.S. dollars at current exchange rates, while revenues, costs and expenses are translated at average exchange rates during each reporting period. The resulting currency translation adjustments are included in accumulated other comprehensive income or loss in the Consolidated Balance Sheets. The financial statements of subsidiaries located in countries with highly inflationary economies are remeasured as if the functional currency were the U.S. dollar; the remeasurement creates translation adjustments that are reflected in net income in the Consolidated Statements of Operations.
Recently Issued Accounting Standards
Derivatives and Hedging
In August 2017, the FASB issued Accounting Standards Update ("ASU") 2017-12, Derivatives and Hedging (Topic 815). The amendments in this update improve the financial reporting of hedging relationships to better portray the economic results of an entity's risk management activities in its financial statements by expanding and refining hedge accounting for both nonfinancial and financial risk components and aligning the recognition and presentation of the effects of the hedging instrument and the hedged item in the financial statements. The standard is effective for the Company as of January 1, 2019, and early adoption is permitted. GCP is currently evaluating the potential impact on its Consolidated Financial Statements and related disclosures, but does not expect the adoption of this standard will have a material effect on its Consolidated Financial Statements.
Stock Compensation
In May 2017, the FASB issued ASU 2017-09, Compensation—Stock Compensation (Topic 718), which provides guidance about which changes to the terms or conditions of a share-based payment award require an entity to apply modification accounting in Topic 718. The standard is effective for the Company on January 1, 2018, with early adoption permitted, including adoption in any interim period, for public business entities for reporting periods for which financial statements have not yet been issued. The amendments in this update should be applied prospectively to an award modified on or after the adoption date, and, therefore, GCP will consider the provisions of this update in conjunction with awards issued on or after January 1, 2018, as applicable.
11
Table of Contents
Notes to Consolidated Financial Statements (Continued)
Goodwill
In January 2017, the FASB issued ASU 2017-04, Intangibles—Goodwill and Other (Topic 350). This ASU modifies the concept of impairment from the condition that exists when the carrying amount of goodwill exceeds its implied fair value to the condition that exists when the carrying amount of a reporting unit exceeds its fair value, which eliminates Step 2 from the goodwill impairment test. The standard is effective for the Company for annual or any interim goodwill impairment tests beginning on or after January 1, 2020. Early adoption is permitted for interim or annual goodwill impairment tests performed on testing dates after January 1, 2017.
Revenue from Contracts with Customers
In May 2014, the FASB issued ASU 2014-09, Revenue from Contracts with Customers (Topic 606). This update is intended to remove inconsistencies and weaknesses in revenue requirements; provide a more robust framework for addressing revenue issues; improve comparability of revenue recognition practices across entities, industries, jurisdictions and capital markets; provide more useful information to users of financial statements through improved disclosure requirements; and simplify the preparation of financial statements by reducing the number of requirements to which an entity must refer. The revised standard allows for two methods of adoption: (a) full retrospective adoption, meaning the standard is applied to all periods presented, or (b) modified retrospective adoption, meaning the cumulative effect of applying the new standard is recognized as an adjustment to the opening retained earnings balance. GCP will adopt the standard beginning January 1, 2018.
GCP has preliminarily determined that it will adopt Topic 606 through a cumulative adjustment to retained earnings, as opposed to retrospectively adjusting prior periods, and continues to progress in its evaluation of the potential impact of the standard on its Consolidated Financial Statements and related disclosures. To date, a multi-disciplinary project team has analyzed certain of the Company's sales contracts and practices as compared to the new guidance and has begun to develop implementation steps to address the initial impact of adoption, including ongoing policy and process changes. In addition to the expanded disclosures regarding revenue, the guidance may affect the timing of revenue recognition for certain of the Company’s arrangements that involve multiple performance obligations, as well as arrangements containing variable consideration.
Leases
In February 2016, the FASB issued ASU 2016-02, Leases (Topic 842), which is intended to increase transparency and comparability among organizations by recognizing lease assets and lease liabilities on the balance sheet and disclosing key information about leasing arrangements. The core principle of Topic 842 is that a lessee should recognize the assets and liabilities that arise from leases. A lessee should recognize in the statement of financial position a liability to make lease payments (the lease liability) and a right-of-use asset representing its right to use the underlying asset for the lease term, including optional payments where they are reasonably certain to occur. The amendments in this update are effective for fiscal years beginning after December 15, 2018, including interim periods within those fiscal years, with early adoption permitted. GCP is currently evaluating the potential impact on its Consolidated Financial Statements and related disclosures.
Other new pronouncements issued but not effective until after September 30, 2017 are not expected to have a material impact on the Company's financial position, results of operations or liquidity.
Recently Adopted Accounting Standards
Business Combinations
In January 2017, the FASB issued ASU 2017-01, Business Combinations (Topic 805): Clarifying the Definition of a Business, which clarifies the definition of a business when evaluating whether transactions should be accounted for as acquisitions (or disposals) of assets or businesses. The update provides that when substantially all the fair value of the assets acquired is concentrated in a single identifiable asset or a group of similar identifiable assets, the transaction does not involve a business. The standard is effective for the Company on January 1, 2018, with early application permitted for certain transactions. GCP elected to early adopt the provisions of this update in the second quarter of 2017 in conjunction with its acquisition of Stirling Lloyd Plc (refer to Note 15).
12
Table of Contents
Notes to Consolidated Financial Statements (Continued)
Pension and Other Postretirement Benefit Costs
In March 2017, the FASB issued ASU 2017-07, Compensation—Retirement Benefits (Topic 715): Improving the Presentation of Net Periodic Pension Cost and Net Periodic Postretirement Benefit Cost, which changes certain presentation and disclosure requirements for employers that sponsor defined benefit pension and other postretirement benefit plans. The amendments in this ASU require entities to (1) report the service cost component of net periodic pension/postretirement benefit cost in the same line item or items as other compensation costs arising from services rendered by the pertinent employees during the period; (2) capitalize only the service cost component of net periodic pension/postretirement benefit cost (when applicable); and (3) present other components of net periodic pension/postretirement benefit cost separately from the service cost component and outside a subtotal of income from operations (if applicable). The standard is effective for the Company on January 1, 2018, with early adoption permitted as of January 1, 2017.
GCP elected to early adopt this standard in the first quarter of 2017 and has reflected only the service cost component of net periodic pension/postretirement benefit cost in "Cost of goods sold" and presented the other components of net periodic pension/postretirement benefit cost in "Other income, net," within the Consolidated Statements of Operations. In accordance with the standard, GCP utilized prior period footnote disclosures as a practical expedient to apply these retrospective presentation requirements and will prospectively apply the capitalization requirements. GCP's adoption of this standard did not have a material effect on the accompanying Consolidated Financial Statements.
Inventory
In July 2015, the FASB issued ASU 2015-11, Simplifying the Measurement of Inventory. The update requires that inventory be measured at the lower of cost or net realizable value for entities using first-in, first-out ("FIFO") or average cost methods. The new requirements are effective for fiscal years beginning after December 15, 2016, and for interim periods within those fiscal years, with early adoption permitted. GCP adopted this standard for the 2017 first quarter and there were no material effects on the accompanying Consolidated Financial Statements.
2. Inventories
Inventories are stated at the lower of cost or net realizable value. GCP determines cost using the FIFO methodology. Inventories presented on GCP's Consolidated Balance Sheets consisted of the following:
(In millions) | September 30, 2017 | December 31, 2016 | |||||
Raw materials | $ | 40.2 | $ | 35.7 | |||
In process | 4.0 | 3.6 | |||||
Finished products and other | 64.2 | 50.0 | |||||
Total inventories | $ | 108.4 | $ | 89.3 | |||
Included above as "other" within "Finished products and other" are finished products purchased rather than produced by GCP of $12.2 million and $10.9 million as of September 30, 2017 and December 31, 2016, respectively.
13
Table of Contents
Notes to Consolidated Financial Statements (Continued)
3. Debt and Other Financial Instruments
Components of Debt
__________________________
(In millions) | September 30, 2017 | December 31, 2016 | |||||
9.5% Senior Notes due 2023, net of unamortized debt issuance costs of $6.6 at September 30, 2017 (2016—$7.3) | $ | 518.4 | $ | 517.7 | |||
Term Loan due 2022, net of unamortized discount of $2.4M and unamortized debt issuance costs of $4.3M at December 31, 2016 (1) | — | 266.2 | |||||
Revolving credit facility due 2021(2) | — | 25.0 | |||||
Other borrowings(3) | 25.7 | 22.0 | |||||
Total debt | 544.1 | 830.9 | |||||
Less debt payable within one year | 23.8 | 47.9 | |||||
Debt payable after one year | $ | 520.3 | $ | 783.0 | |||
Weighted average interest rates on total debt | 9.4 | % | 7.5 | % | |||
(1) | GCP repaid the outstanding principal balance and accrued interest on the Term Loan in July 2017. Refer below to "Credit Agreement" disclosure. |
(2) | Interest at LIBOR +200 bps at September 30, 2017. |
(3) | Represents borrowings under various lines of credit and other borrowings, primarily by non-U.S. subsidiaries. |
The principal maturities of debt outstanding (net of unamortized discounts and debt issuance costs) at September 30, 2017, were as follows:
(In millions) | |||
2017 | $ | 23.4 | |
2018 | 0.9 | ||
2019 | 0.9 | ||
2020 | 0.5 | ||
2021 | — | ||
Thereafter | 518.4 | ||
Total debt | $ | 544.1 | |
Credit Agreement
On February 3, 2016, GCP entered into a credit agreement (the “Credit Agreement”) that provides for senior secured credit facilities (the “Credit Facilities”) in an aggregate principal amount of $525.0 million, consisting of:
(a) | term loan (the “Term Loan”) in an aggregate principal amount of $275.0 million maturing in 2022; and |
(b) | $250.0 million revolving credit facility (the "Revolving Loan") due in 2021. |
The Credit Agreement contains customary affirmative covenants, including, but not limited to (i) maintenance of legal existence and compliance with laws and regulations; (ii) delivery of consolidated financial statements and other information; (iii) payment of taxes; (iv) delivery of notices of defaults and certain other material events; and (v) maintenance of adequate insurance. The Credit Agreement also contains customary negative covenants, including but not limited to restrictions on (i) dividends on, and redemptions of, equity interests and other restricted payments; (ii) liens; (iii) loans and investments; (iv) the sale, transfer or disposition of assets and businesses; (v) transactions with affiliates; and (vi) a maximum total leverage ratio. Certain debt covenants may restrict the entity's ability as it relates to dividends, acquisitions and other borrowings. The Credit Agreement contains conditions that would require mandatory principal payments in advance of the maturity date of the Term Loan and Revolving Loan; the Company was in compliance with all terms as of September 30, 2017.
14
Table of Contents
Notes to Consolidated Financial Statements (Continued)
Events of default under the Credit Agreement include, but are not limited to: (i) failure to pay principal, interest, fees or other amounts under the Credit Agreement when due, taking into account any applicable grace period; (ii) any representation or warranty proving to have been incorrect in any material respect when made; (iii) failure to perform or observe covenants or other terms of the Credit Agreement subject to certain grace periods; (iv) a cross-default and cross-acceleration with certain other material debt; (v) bankruptcy events; (vi) certain defaults under ERISA; and (vii) the invalidity or impairment of security interests. There are no events of default as of September 30, 2017.
The Credit Facilities are secured on a first priority basis by a perfected security interest in, and mortgages on, substantially all tangible and intangible personal property and material fee-owned real property (specifically properties in Chicago, Illinois and Mount Pleasant, Tennessee) of the Company, a pledge of 100% of the equity of each material U.S. subsidiary of the Company and 65% of the equity of the United Kingdom holding company.
During 2016, GCP refinanced the existing Credit Agreement with a syndicate of banks (the “First Amendment to Credit Agreement”). The First Amendment to Credit Agreement reduced the interest rate margins applicable to the Term Loan from base rate plus a margin of 3.5% or LIBOR plus a margin of 4.5% to a base rate plus a margin of 2.25% or LIBOR plus a margin of 3.25% at GCP’s option. The outstanding principal balance was replaced by a like aggregate principal balance with substantially similar terms to the Credit Agreement.
On July 31, 2017, the Company repaid the outstanding principal balance and extinguished the Term Loan under the Credit Agreement, which, together with accrued and unpaid interest, was $272.6 million. In conjunction with the debt repayment, GCP wrote-off the net unamortized discount of $2.1 million and the net unamortized debt issuance costs of $3.9 million related to the Term Loan, which are reflected in "Interest expense and related financing costs" in the Consolidated Statement of Operations for the three and nine months ended September 30, 2017.
The interest rate per annum applicable to the Revolving Loan is equal to, at GCP’s option, either a base rate plus a margin ranging from 0.5% to 1.0% or LIBOR plus a margin ranging from 1.5% to 2.0%, in either case based upon the total leverage ratio of GCP and its restricted subsidiaries. As of September 30, 2017, there were no outstanding draws and approximately $10 million in outstanding letters of credit, which resulted in available credit under the Revolving Loan of $240.0 million.
The summary above of the Credit Agreement and First Amendment to Credit Agreement does not purport to be complete and is qualified in its entirety by reference to the full text of such agreements, copies of which have been filed with the SEC.
Senior Notes
On January 27, 2016, GCP issued $525.0 million aggregate principal amount of 9.5% Senior Notes due 2023 (the “Notes”). Interest is payable semi-annually in arrears on February 1 and August 1 of each year.
The Notes were issued subject to covenants that limit the Company's and certain of its subsidiaries’ ability, subject to certain exceptions and qualifications, to (i) create or incur liens on assets; (ii) incur additional debt; (iii) sell certain assets; and/or (iv) make certain investments and acquisitions, merge or sell or otherwise dispose of all or substantially all assets.
Other Items
As discussed in Note 1, on July 3, 2017, the Company completed the sale of Darex to Henkel for $1.06 billion, subject to working capital and certain other adjustments. The sale of Darex is a permitted transaction under the Company's Credit Agreement and the Indenture governing the Notes. Under the Credit Agreement and Indenture, the Company is required to use any net cash proceeds from the sale of Darex to prepay debt or make investments in its business over a period of approximately 18 months. Refer to Note 14 for further discussion of the sale of Darex.
15
Table of Contents
Notes to Consolidated Financial Statements (Continued)
During 2016, GCP incurred debt issuance costs relating to issuance of the Notes, Term Loan and Revolving Loan of $8.0 million, $5.0 million and $5.2 million, respectively. GCP deducted the debt issuance costs relating to the Notes and the Term Loan from the carrying amounts presented on its Consolidated Balance Sheets and continues to amortize the costs related to the Notes over the term of the underlying obligation. GCP classified the debt issuance costs relating to the Revolving Loan in "Other assets" on its Consolidated Balance Sheets and is amortizing those costs over the term of the Revolving Loan. The unamortized portion of these costs reflected in "Other assets" was $3.5 million as of September 30, 2017 and $4.2 million as of December 31, 2016.
During the first quarter of 2016, GCP used certain proceeds from the Notes and Credit Facilities to fund a distribution to Grace in an amount of $750.0 million related to the Separation. Approximately $50 million was retained to meet operating requirements and to pay fees associated with the debt financing and other costs of the Separation. Related party debt of approximately $42 million and related interest was transferred from Grace to GCP in connection with the Separation.
Debt Fair Value
At September 30, 2017, the carrying amounts and fair values of GCP's debt were as follows:
September 30, 2017 | December 31, 2016 | ||||||||||||||
(In millions) | Carrying Amount | Fair Value | Carrying Amount | Fair Value | |||||||||||
9.5% Senior Notes due 2023 | $ | 518.4 | $ | 592.6 | $ | 517.7 | $ | 603.1 | |||||||
Term Loan due 2022 | — | — | 266.2 | 274.6 | |||||||||||
Revolving credit facility due 2021 | — | — | 25.0 | 25.0 | |||||||||||
Other borrowings | 25.7 | 25.7 | 22.0 | 22.0 | |||||||||||
Total debt | $ | 544.1 | $ | 618.3 | $ | 830.9 | $ | 924.7 | |||||||
Fair value is determined based on Level 2 inputs, including expected future cash flows (discounted at market interest rates), estimated current market prices and quotes from financial institutions. The decrease in fair value on the Senior Notes as of September 30, 2017 was due primarily to the Federal Reserve raising the federal funds target rate during 2017.
4. Income Taxes
The income tax benefit attributable to continuing operations for the three months ended September 30, 2017 was $14.5 million, compared with income tax expense attributable to continuing operations of $2.5 million for the three months ended September 30, 2016, representing effective tax rates of 44.6% and 18.4%, respectively. The income tax expense attributable to continuing operations for the nine months ended September 30, 2017 and 2016 was $3.7 million and $9.8 million, respectively, representing effective tax rates of 9.8% and 22.3%, respectively. The difference between the provision for income taxes at the U.S. federal income tax rate of 35% and GCP’s overall income tax rate is summarized below.
Three Months Ended September 30, | Nine Months Ended September 30, | ||||||||||||||
(In millions) | 2017 | 2016 | 2017 | 2016 | |||||||||||
Income tax (benefit) expense at U.S. federal income tax rate | $ | (11.4 | ) | $ | 4.8 | $ | (13.3 | ) | $ | 15.4 | |||||
Change in income tax (benefit) expense resulting from: | |||||||||||||||
Valuation allowance | — | — | 13.9 | — | |||||||||||
Tax on undistributed foreign earnings | (2.9 | ) | — | 3.6 | — | ||||||||||
Effect of tax rates in foreign jurisdictions | (0.1 | ) | (0.5 | ) | 0.1 | (3.9 | ) | ||||||||
Permanent items and other | (0.1 | ) | (1.8 | ) | (0.6 | ) | (1.7 | ) | |||||||
Income tax (benefit) expense | $ | (14.5 | ) | $ | 2.5 | $ | 3.7 | $ | 9.8 | ||||||
16
Table of Contents
Notes to Consolidated Financial Statements (Continued)
For the three months ended September 30, 2017 and 2016, GCP recorded income tax expense attributable to discontinued operations of $200 million and $7.1 million, respectively. For the nine months ended September 30, 2017 and 2016, GCP recorded income tax expense attributable to discontinued operations of $199.7 million and $20.0 million, respectively. Refer to Note 14 for further details regarding the Darex transaction.
As of December 31, 2016, GCP had the intent and ability to indefinitely reinvest undistributed earnings of its foreign subsidiaries outside the United States. During the first and second quarters of 2017, GCP determined it could no longer assert it is indefinitely reinvested in Mexico and Venezuela because these entities were included in the Darex transaction, resulting in a tax expense of $6.5 million. In the third quarter of 2017, GCP recorded $7.5 million of tax benefit related to an adjustment to the Mexico outside book and tax basis difference. Additionally, in the third quarter of 2017, pursuant to tax planning with the respect to the Company’s subsidiary, GCP UK Holdings Limited, GCP determined it could no longer assert it is indefinitely reinvested in this subsidiary, resulting in $4.6 million of tax expense. These changes in assertions resulted in a tax benefit of $2.9 million in the third quarter of 2017 and tax expense of $3.6 million for the nine months ended September 30, 2017. Management is in the process of completing further analysis related to the stock basis, earnings and profits, tax pools, and other related components associated with the Darex transaction. Based on the overall complexity of the calculation, management believes that there is a reasonable possibility that differences between these estimates and actual outcomes may result within the next 12 months, which could have a material impact on the Company’s consolidated financial position.
GCP believes that the sale of Darex is a one-time, non-recurring event and that recognition of deferred taxes of undistributed earnings during 2017 would not have occurred if not for the sale. As of September 30, 2017, GCP has the intent and ability to indefinitely reinvest undistributed earnings of all its other foreign subsidiaries outside the United States. GCP expects undistributed prior-year earnings of its foreign subsidiaries to remain indefinitely reinvested except in certain instances where repatriation of such earnings would result in minimal or no tax. GCP bases this assertion on:
(1) | the expectation that it will satisfy its U.S. cash obligations in the foreseeable future without requiring the repatriation of prior-year foreign earnings; |
(2) | plans for significant and continued reinvestment of foreign earnings in organic and inorganic growth initiatives outside the U.S.; and |
(3) | remittance restrictions imposed by local governments. |
GCP will continually analyze and evaluate its cash needs to determine the appropriateness of its indefinite reinvestment assertion.
In evaluating GCP's ability to realize its deferred tax assets, GCP considers all reasonably available positive and negative evidence, including recent earnings experience, expectations of future taxable income and the tax character of that income, the period of time over which the temporary differences become deductible and the carryforward and/or carryback periods available to GCP for tax reporting purposes in the related jurisdiction. In estimating future taxable income, GCP relies upon assumptions and estimates about future activities, including the amount of future federal, state and foreign pretax operating income that GCP will generate; the reversal of temporary differences; and the implementation of feasible and prudent tax planning strategies. GCP records a valuation allowance to reduce deferred tax assets to the amount that it believes is more likely than not to be realized. GCP determined it is more likely than not a portion of its deferred tax assets will not be realized. As a result, GCP recorded valuation allowances on those deferred tax assets as discrete items, as they are significant, unusual and infrequent in nature. The $13.9 million valuation allowance recorded for the nine months ended September 30, 2017 relates to U.S. foreign tax credit carryovers and Brazil and Turkey deferred tax assets relating primarily to net operating loss carryovers. The determination to record the valuation allowances was made predominantly due to the sale of Darex and its impact on future taxable income and the ability to utilize those tax assets.
17
Table of Contents
Notes to Consolidated Financial Statements (Continued)
In connection with the Separation, GCP and Grace entered into various agreements that govern the relationship between the parties going forward, including a tax matters agreement (the "Tax Sharing Agreement"). Under the Tax Sharing Agreement, which was entered into on the distribution date, GCP and Grace will indemnify and hold each other harmless in accordance with the principles outlined therein.
5. Pension Plans and Other Postretirement Benefit Plans
Postretirement Benefits Other Than Pensions Prior to the Separation, Grace provided postretirement life insurance benefits for retired employees of certain U.S. business units and certain divested business units.
During the second quarter of 2016, GCP entered into an agreement to eliminate retiree life insurance benefits for one of its two remaining bargaining locations. This plan change was a negative plan amendment that resulted in a $1.0 million curtailment gain, which is presented in "Other income, net" in the Consolidated Statements of Operations for the nine months ended September 30, 2016.
Pension Plans GCP sponsors certain defined benefit pension plans, primarily in the U.S. and the U.K., in which GCP employees participate. GCP records an asset or liability to recognize the funded status of these pension plans in its Consolidated Balance Sheets.
The following table presents the funded status of GCP's overfunded, underfunded and unfunded defined pension plans from continuing operations:
(In millions) | September 30, 2017 | December 31, 2016 | |||||
Overfunded defined benefit pension plans | $ | 22.1 | $ | 21.2 | |||
Underfunded defined benefit pension plans | (57.9 | ) | (55.6 | ) | |||
Unfunded defined benefit pension plans | (27.7 | ) | (27.6 | ) | |||
Total underfunded and unfunded defined benefit pension plans | (85.6 | ) | (83.2 | ) | |||
Pension liabilities included in other current liabilities | (1.0 | ) | (0.4 | ) | |||
Net funded status | $ | (64.5 | ) | $ | (62.4 | ) | |
Overfunded plans include several advance-funded plans for which the fair value of the plan assets exceeds the projected benefit obligation ("PBO"). This group of plans was overfunded by $22.1 million as of September 30, 2017, and the overfunded status is reflected as assets in "Overfunded defined benefit pension plans" in the Consolidated Balance Sheets. Underfunded plans include a group of advance-funded plans that are underfunded on a PBO basis. Unfunded plans include several plans that are funded on a pay-as-you-go basis, and therefore, the entire PBO is unfunded. As of September 30, 2017, the combined balance of $86.6 million for the underfunded and unfunded plans included as liabilities in the Consolidated Balance Sheets is comprised of current and non-current components of $1.0 million in "Other current liabilities" and $85.6 million in "Underfunded and unfunded defined benefit pension plans," respectively.
On May 3, 2017, the Board of Directors approved an amendment to the GCP Applied Technologies Inc. Retirement Plan for Salaried Employees that closes the plan to new hires effective January 1, 2018 and freezes the accrual of plan benefits for all plan participants as of December 31, 2022. In the second quarter of 2017, the Company recognized a curtailment gain of $5.1 million in continuing operations and $0.5 million in discontinued operations as a result of this plan amendment. In addition, GCP terminated and settled a pension plan at one non-U.S. location, resulting in a mark-to-market remeasurement gain of $0.1 million. With the exception of the $0.5 million recorded in discontinued operations, these amounts are presented in "Other income, net" in the Consolidated Statements of Operations for the nine months ended September 30, 2017.
In the third quarter of 2017, the Company recognized a curtailment gain of $0.7 million as a result of restructuring activities in the U.S. presented in "Other income, net" in the Consolidated Statements of Operations for the three and nine months ended September 30, 2017.
18
Table of Contents
Notes to Consolidated Financial Statements (Continued)
In connection with the Company's divestiture of the Darex segment in the third quarter of 2017, the Company recognized curtailment and settlement gains totaling $2.1 million and $14.3 million relating to the defined benefit pension plans in the U.S. and outside of the U.S, respectively. These amounts are presented in "Income from discontinued operations, net of income taxes" in the Consolidated Statements of Operations for the three and nine months ended September 30, 2017.
The Company also incurred mark-to-market losses associated with the divestiture of Darex as a result of the remeasurement of plan assets and projected benefit obligations of $1.2 million and $1.8 million for the U.S. plans and non-U.S. plans, respectively, which are presented in "Other income, net" (as a component of continuing operations) in the Consolidated Statements of Operations for the three and nine months ended September 30, 2017.
In addition to the amounts disclosed above, the Company has included in "Income from discontinued operations, net of income taxes" a $0.1 million mark-to-market gain in the third quarter of 2017 and $0.5 million of non-U.S. plan service cost, interest cost, and expected return on plan assets for the nine months ended September 30, 2017, as well as $0.3 million and $0.9 million of non-U.S. plan service cost, interest cost, and expected return on plan assets for the three and nine months ended September 30, 2016, respectively.
19
Table of Contents
Notes to Consolidated Financial Statements (Continued)
Components of Net Periodic Benefit Cost (Income)
Three Months Ended September 30, | |||||||||||||||||||||||
2017 | 2016 | ||||||||||||||||||||||
Pension | Pension | ||||||||||||||||||||||
(In millions) | U.S. | Non-U.S. | Other Post Retirement | U.S. | Non-U.S. | Other Post Retirement | |||||||||||||||||
Service cost | $ | 1.6 | $ | 0.8 | $ | — | $ | 1.6 | $ | 0.8 | $ | — | |||||||||||
Interest cost | 1.3 | 1.4 | — | 1.1 | 1.9 | — | |||||||||||||||||
Expected return on plan assets | (1.4 | ) | (1.6 | ) | — | (1.2 | ) | (2.1 | ) | — | |||||||||||||
Amortization of net deferred actuarial loss | — | — | — | — | — | 0.1 | |||||||||||||||||
Mark-to-market adjustment | 1.2 | 1.7 | — | — | — | — | |||||||||||||||||
Gain on curtailments, settlements and terminations | (2.8 | ) | (14.3 | ) | — | — | (0.2 | ) | — | ||||||||||||||
Net periodic benefit (income) cost | $ | (0.1 | ) | $ | (12.0 | ) | $ | — | $ | 1.5 | $ | 0.4 | $ | 0.1 | |||||||||
Less: Discontinued operations (income) cost | (2.1 | ) | (14.4 | ) | — | — | 0.3 | — | |||||||||||||||
Net periodic benefit cost from continuing operations | $ | 2.0 | $ | 2.4 | $ | — | $ | 1.5 | $ | 0.1 | $ | 0.1 | |||||||||||
Nine Months Ended September 30, | |||||||||||||||||||||||
2017 | 2016 | ||||||||||||||||||||||
Pension | Pension | ||||||||||||||||||||||
(In millions) | U.S. | Non-U.S. | Other Post Retirement | U.S. | Non-U.S. | Other Post Retirement | |||||||||||||||||
Service cost | $ | 5.3 | $ | 3.0 | $ | — | $ | 4.6 | $ | 2.5 | $ | — | |||||||||||
Interest cost | 4.2 | 4.3 | — | 3.5 | 6.0 | — | |||||||||||||||||
Expected return on plan assets | (4.2 | ) | (5.1 | ) | — | (3.7 | ) | (6.6 | ) | — | |||||||||||||
Amortization of prior service credit | — | — | — | — | — | (0.1 | ) | ||||||||||||||||
Amortization of net deferred actuarial loss | — | — | — | — | — | 0.1 | |||||||||||||||||
Mark-to-market adjustment | 1.2 | 1.6 | — | — | — | — | |||||||||||||||||
Gain on termination and curtailment of pension and other postretirement plans | (8.4 | ) | (14.3 | ) | — | — | (1.6 | ) | (1.0 | ) | |||||||||||||
Net periodic benefit (income) cost | $ | (1.9 | ) | $ | (10.5 | ) | $ | — | $ | 4.4 | $ | 0.3 | $ | (1.0 | ) | ||||||||
Less: Discontinued operations (income) cost | (2.6 | ) | (13.9 | ) | — | — | 0.9 | — | |||||||||||||||
Net periodic benefit cost (income) from continuing operations | $ | 0.7 | $ | 3.4 | $ | — | $ | 4.4 | $ | (0.6 | ) | $ | (1.0 | ) | |||||||||
Plan Contributions and Funding GCP intends to satisfy its funding obligations to U.S. tax-qualified pension plans and to comply with all of the requirements of the Employee Retirement Income Security Act of 1974, as amended ("ERISA"). For ERISA purposes, funded status is calculated on a different basis than under GAAP.
GCP intends to fund non-U.S. pension plans based on applicable legal requirements as well as actuarial and trustee recommendations. GCP contributed $1.9 million to these non-U.S. plans during the nine months ended September 30, 2017 compared with $1.7 million during the prior-year period.
20
Table of Contents
Notes to Consolidated Financial Statements (Continued)
Defined Contribution Retirement Plan As part of the Separation, GCP established a defined contribution retirement plan for its employees in the U.S. This plan is intended to be tax-qualified under section 401(k) of the Internal Revenue Code of 1986, as amended. Currently, GCP contributes to the 401(k) plan an amount equal to 100% of an employee's contributions to the plan, up to 6% of such employee's eligible compensation. GCP's costs included in "Selling, general and administrative expenses" in the Consolidated Statements of Operations related to this plan for the three and nine months ended September 30, 2017 were $1.1 million and $3.6 million compared with $1.0 million and $3.0 million during the prior-year periods, respectively.
6. Other Balance Sheet Accounts
(In millions) | September 30, 2017 | December 31, 2016 | |||||
Other Current Assets: | |||||||
Non-trade receivables | $ | 36.1 | $ | 19.9 | |||
Income tax receivable | 7.4 | 10.6 | |||||
Prepaid and other | 15.7 | 12.4 | |||||
Total other current assets | $ | 59.2 | $ | 42.9 | |||
(In millions) | September 30, 2017 | December 31, 2016 | |||||
Other Current Liabilities | |||||||
Customer volume rebates | $ | 28.6 | $ | 30.5 | |||
Accrued compensation(1) | 23.0 | 28.0 | |||||
Income tax payable | 118.2 | 6.7 | |||||
Accrued interest | 8.5 | 20.8 | |||||
Restructuring liabilities | 15.2 | 1.1 | |||||
Pension liabilities | 1.0 | 0.4 | |||||
Other accrued liabilities(2) | 115.8 | 32.0 | |||||
Total other current liabilities | $ | 310.3 | $ | 119.5 | |||
(1) | Accrued compensation in the table above includes salaries and wages, as well as estimated current amounts due under the annual and long-term incentive programs. |
(2) | Other accrued liabilities in the table above as of September 30, 2017 includes $55.1 million of deferred consideration related to the delayed closings associated with our divestiture of Darex, as discussed in Note 14. |
7. Commitments and Contingent Liabilities
Purchase Commitments GCP uses purchase commitments to ensure supply and to minimize the volatility of certain key raw materials including lignins, polycarboxylates, amines and other materials. Such commitments are for quantities that GCP fully expects to use in its normal operations.
Guarantees and Indemnification Obligations GCP is a party to many contracts containing guarantees and indemnification obligations. These contracts primarily consist of:
• | Product warranties with respect to certain products sold to customers in the ordinary course of business. These warranties typically provide that products will conform to specifications. GCP accrues a general warranty liability at the time of sale based on historical experience and on a transaction-specific basis according to individual facts and circumstances. Both the liability and annual expense related to product warranties are immaterial to the Consolidated Financial Statements. |
• | Performance guarantees offered to customers. GCP has not established a liability for these arrangements based on past performance. |
21
Table of Contents
Notes to Consolidated Financial Statements (Continued)
• | Contracts providing for the sale of a business unit or product line in which GCP has agreed to indemnify the buyer against liabilities arising prior to the closing of the transaction, including environmental liabilities. |
• | The Tax Sharing Agreement requires GCP, in certain circumstances, to indemnify Grace if the Separation, together with certain related transactions, does not qualify under Section 355 and certain other relevant provisions of the Internal Revenue Code (the "Code"). If GCP is required to indemnify Grace under the Tax Sharing Agreement, it could be subject to significant tax liabilities. |
Environmental Matters GCP is subject to loss contingencies resulting from extensive and evolving federal, state, local and foreign environmental laws and regulations relating to the generation, storage, handling, discharge, disposition and stewardship of hazardous wastes and other materials. GCP accrues for anticipated costs associated with response efforts where an assessment has indicated that a probable liability has been incurred and the cost can be reasonably estimated. As of September 30, 2017, GCP did not have any material environmental liabilities.
GCP's environmental liabilities are reassessed whenever circumstances become better defined or response efforts and their costs can be better estimated. These liabilities are evaluated based on currently available information, including the progress of remedial investigations at each site, the current status of discussions with regulatory authorities regarding the method and extent of remediation at each site, existing technology, prior experience in contaminated site remediation and the apportionment of costs among potentially responsible parties.
Financial Assurances Financial assurances have been established for a variety of purposes, including insurance and environmental matters and other matters. At September 30, 2017, GCP had gross financial assurances issued and outstanding of approximately $10 million, composed of standby letters of credit.
Lawsuits and Investigations In Re: Library Gardens Balcony Litigation, Lead Case Beary v. Blackrock, Inc. Case No. RG15793054 was filed on November 12, 2015 in Alameda County Superior Court in California. It is the lead case in a consolidated lawsuit filed on behalf of six individuals who died and an additional seven individuals who were injured in a balcony collapse, which occurred on June 16, 2015 in Berkeley, California. The consolidated complaint names the Company as the sole party in the category of suppliers of materials and names twenty additional defendants in other categories, including categories for property owners, property managers, construction defendants and development and design defendants. The consolidated complaint alleges product liability against the Company concerning one of its products. The plaintiffs seek unspecified monetary damages against all defendants and punitive damages only against the building owners, building manager and two construction company defendants. During the third quarter of 2017, the Company reached an agreement with the plaintiffs to settle this matter for $4.0 million, which the Company has recorded and reflected in "Selling, general and administrative expenses" in the accompanying Consolidated Statements of Operations. The settlement documents have been distributed to the parties for signature. Once all signatures have been obtained, the settlement will be presented to the court for approval.
In addition to the above, from time to time, GCP and its subsidiaries are parties to, or targets of, lawsuits, claims, investigations and proceedings which are managed and defended in the ordinary course of business. While GCP is unable to predict the outcome of these matters, it does not believe, based upon currently available facts, that the ultimate resolution of any of such pending matters will have a material adverse effect on its overall financial condition, results of operations or cash flows.
Accounting for Contingencies Although the outcome of each of the matters discussed above cannot be predicted with certainty, GCP has assessed its risk and has made accounting estimates and disclosures as required under GAAP.
22
Table of Contents
Notes to Consolidated Financial Statements (Continued)
8. Restructuring and Repositioning Expenses
GCP's Board of Directors approves all major restructuring programs that may involve the discontinuance of significant product lines or the shutdown of significant facilities. From time to time, GCP takes additional restructuring actions, including involuntary employee terminations that are not part of a major program. Restructuring programs generally include severance and other employee-related costs, contract or lease termination costs, asset impairments, facility exit costs and other costs.
The Company may also undertake repositioning activities that generally represent major strategic or transformational actions to enhance the value and performance of the Company, improve business efficiency or optimize the Company’s footprint. Repositioning expenses generally include professional fees, such as recruitment, consulting and legal fees and other associated costs that are not classified as restructuring expenses.
GCP accounts for these costs, which are reflected in "Restructuring expenses and asset impairments" and “Repositioning expenses,” respectively, in its Consolidated Statements of Operations, or in those captions within discontinued operations, in the period that the related liabilities are incurred. Restructuring expenses, including asset impairments, and repositioning expenses are excluded from segment operating income.
2017 Restructuring and Repositioning Plan (the “2017 Plan”) On June 28, 2017, the Board of Directors approved a restructuring and repositioning plan that includes actions to streamline its operations, reduce its global cost structure and reposition itself as a construction products technologies company.
The Company expects to incur total costs under the 2017 Plan of approximately $28 million to $32 million, an increase from the $22 million to $26 million estimated range in the second quarter of 2017. The 2017 Plan includes approximately $25 million related to restructuring activities and approximately $6 million related to repositioning activities. The restructuring activities, which are expected to be completed by December 31, 2018, primarily relate to severance and other employee-related costs, asset impairments and facility exit costs, of which the Company expects to classify approximately $9 million within discontinued operations. The repositioning activities primarily include consulting, other professional services and recruitment costs associated with the Company’s organizational realignment. In addition, the Company expects to incur approximately $9 million in capital expenditures related to repositioning activities, an increase of $3 million from the estimate in the second quarter of 2017. All of the Company’s repositioning activities are expected to relate to continuing operations and should be substantially completed by December 31, 2019. The Company expects to settle substantially all of the costs related to the 2017 Plan in cash.
Restructuring Expenses
The following table summarizes restructuring expenses incurred related to the 2017 Plan and prior-period plans:
Three Months Ended September 30, | Nine Months Ended September 30, | ||||||||||||||
(In millions) | 2017 | 2016 | 2017 | 2016 | |||||||||||
Severance and other employee costs | $ | 2.1 | $ | 0.4 | $ | 19.0 | $ | 1.4 | |||||||
Facility exit costs and asset impairments | 0.4 | — | 0.9 | — | |||||||||||
Total restructuring expenses | $ | 2.5 | $ | 0.4 | $ | 19.9 | $ | 1.4 | |||||||
Less: restructuring expenses reflected in discontinued operations | 0.4 | — | 6.9 | — | |||||||||||
Total restructuring expenses from continuing operations | $ | 2.1 | $ | 0.4 | $ | 13.0 | $ | 1.4 | |||||||
23
Table of Contents
Notes to Consolidated Financial Statements (Continued)
GCP incurred restructuring costs related to its segments as follows:
Three Months Ended September 30, | Nine Months Ended September 30, | ||||||||||||||
(In millions) | 2017 | 2016 | 2017 | 2016 | |||||||||||
SCC | $ | 0.7 | $ | 0.3 | $ | 6.2 | $ | 0.8 | |||||||
SBM | (0.3 | ) | 0.1 | 4.1 | 0.6 | ||||||||||
Corporate | 1.7 | — | 2.7 | — | |||||||||||
Total restructuring expenses from continuing operations | $ | 2.1 | $ | 0.4 | $ | 13.0 | $ | 1.4 | |||||||
Restructuring expenses reflected in discontinued operations | 0.4 | — | 6.9 | — | |||||||||||
Total restructuring expenses | $ | 2.5 | $ | 0.4 | $ | 19.9 | $ | 1.4 | |||||||
GCP had restructuring liabilities of $15.2 million and $1.1 million as of September 30, 2017 and December 31, 2016, respectively. These liabilities are included within “Other current liabilities” and “Other liabilities” in the Consolidated Balance Sheets. GCP expects to pay substantially all costs related to prior-year plans by December 31, 2017 and the 2017 Plan by December 31, 2018.
The following table summarizes details of the Company’s restructuring liability activity:
2017 Plan | |||||||||||||||
(In millions) | Severance and other employee costs | Facility exit costs | Other plans | Total | |||||||||||
Balance, December 31, 2016 | $ | — | $ | — | $ | 1.1 | $ | 1.1 | |||||||
Expense | 18.5 | 0.1 | 0.5 | 19.1 | |||||||||||
Payments | (4.7 | ) | — | (0.5 | ) | (5.2 | ) | ||||||||
Impact of foreign currency and other | 0.2 | — | — | 0.2 | |||||||||||
Balance, September 30, 2017 | $ | 14.0 | $ | 0.1 | $ | 1.1 | $ | 15.2 | |||||||
Repositioning Expenses
Repositioning Expenses - 2017 Plan
Repositioning expenses associated with the 2017 Plan primarily relate to consulting, other professional services and recruitment costs associated with the Company’s organizational realignment. Due to the scope and complexity of the Company’s repositioning activities, the range of estimated repositioning expense could increase or decrease and the timing of incurrence could change.
For the three months ended September 30, 2017, GCP incurred repositioning expenses related to the 2017 Plan of $1.1 million, substantially all of which represent professional fees and employee-related costs. Total expenses for the nine months ended September 30, 2017 were $1.5 million. Total cash payments for the nine months ended September 30, 2017 were $1.2 million.
24
Table of Contents
Notes to Consolidated Financial Statements (Continued)
Separation-Related Repositioning Expenses
Post-Separation from Grace, GCP incurred expenses related to its transition to a stand-alone public company. As of June 30, 2017, the Company has substantially completed these activities and incurred total costs of $20.5 million.
Separation-related repositioning expenses primarily relate to the following:
• | accounting, tax, legal and other professional costs pertaining to the Separation and establishment as a stand-alone public company; |
• | costs relating to information technology systems and marketing expense for repackaging and re-branding; |
• | employee-related costs that would not be incurred absent the Separation primarily relating to compensation, benefits, retention bonuses related to new or transitioning employees; and |
• | recruitment and relocation costs associated with hiring and relocating employees. |
Separation-related repositioning expenses incurred for the periods presented were as follows:
Three Months Ended September 30, | Nine Months Ended September 30, | ||||||||||||||
(In millions) | 2017 | 2016 | 2017 | 2016 | |||||||||||
Professional fees | $ | — | $ | 3.1 | $ | 3.4 | $ | 7.3 | |||||||
Software and IT implementation fees | — | 0.8 | 0.9 | 2.5 | |||||||||||
Employee-related costs | — | 1.4 | 1.0 | 4.5 | |||||||||||
Total | $ | — | $ | 5.3 | $ | 5.3 | $ | 14.3 | |||||||
Total cash payments for the nine months ended September 30, 2017 were $4.2 million for professional fees and employee-related costs and $1.9 million for related capital expenditures. Total cash payments for the nine months ended September 30, 2016 were $14.7 million for professional fees and employee-related costs, $5.7 million for related capital expenditures and $6.9 million for taxes.
25
Table of Contents
Notes to Consolidated Financial Statements (Continued)
9. Other Comprehensive Income (Loss)
The following tables present the pre-tax, tax and after-tax components of GCP's other comprehensive income for the three and nine months ended September 30, 2017 and 2016:
Three Months Ended September 30, 2017 (In millions) | Pre-Tax Amount | Tax (Expense)/ Benefit | After-Tax Amount | ||||||||
Defined benefit pension and other postretirement plans: | |||||||||||
Other changes | $ | (0.3 | ) | $ | — | $ | (0.3 | ) | |||
Benefit plans, net | (0.3 | ) | — | (0.3 | ) | ||||||
Currency translation adjustments | 46.2 | — | 46.2 | ||||||||
Gain from hedging activities | 0.8 | (0.3 | ) | 0.5 | |||||||
Other comprehensive income attributable to GCP shareholders | $ | 46.7 | $ | (0.3 | ) | $ | 46.4 | ||||
Nine Months Ended September 30, 2017 (In millions) | Pre-Tax Amount | Tax (Expense)/ Benefit | After-Tax Amount | ||||||||
Defined benefit pension and other postretirement plans: | |||||||||||
Other changes | $ | (0.3 | ) | $ | — | $ | (0.3 | ) | |||
Benefit plans, net | (0.3 | ) | — | (0.3 | ) | ||||||
Currency translation adjustments | 63.0 | — | 63.0 | ||||||||
Loss from hedging activities | (0.1 | ) | — | (0.1 | ) | ||||||
Other comprehensive income attributable to GCP shareholders | $ | 62.6 | $ | — | $ | 62.6 | |||||
Three Months Ended September 30, 2016 (In millions) | Pre-Tax Amount | Tax (Expense)/ Benefit | After-Tax Amount | ||||||||
Defined benefit pension and other postretirement plans: | |||||||||||
Amortization of net actuarial gain | $ | 0.1 | $ | — | $ | 0.1 | |||||
Other changes in funded status | (0.1 | ) | — | (0.1 | ) | ||||||
Benefit plans, net | — | — | — | ||||||||
Currency translation adjustments | 3.0 | — | 3.0 | ||||||||
Loss from hedging activities | (0.1 | ) | — | (0.1 | ) | ||||||
Other comprehensive income attributable to GCP shareholders | $ | 2.9 | $ | — | $ | 2.9 | |||||
Nine Months Ended September 30, 2016 (In millions) | Pre-Tax Amount | Tax (Expense)/ Benefit | After-Tax Amount | ||||||||
Defined benefit pension and other postretirement plans: | |||||||||||
Amortization of net prior service credit | $ | (0.1 | ) | $ | — | $ | (0.1 | ) | |||
Amortization of net actuarial gain | 0.1 | — | 0.1 | ||||||||
Assumption of net prior service credit | 1.2 | (0.4 | ) | 0.8 | |||||||
Assumption of net actuarial loss | (1.1 | ) | 0.4 | (0.7 | ) | ||||||
Other changes in funded status | (0.9 | ) | 0.3 | (0.6 | ) | ||||||
Benefit plans, net | (0.8 | ) | 0.3 | (0.5 | ) | ||||||
Currency translation adjustments | 3.5 | — | 3.5 | ||||||||
Loss from hedging activities | (0.1 | ) | — | (0.1 | ) | ||||||
Other comprehensive income attributable to GCP shareholders | $ | 2.6 | $ | 0.3 | $ | 2.9 | |||||
26
Table of Contents
Notes to Consolidated Financial Statements (Continued)
The following tables present the changes in accumulated other comprehensive income (loss), net of tax, for the nine months ended September 30, 2017 and 2016:
Nine Months Ended September 30, 2017 (In millions) | Defined Benefit Pension and Other Postretirement Plans | Currency Translation Adjustments | (Losses) Gains from Hedging Activities | Total | |||||||||||
Beginning balance | $ | 0.1 | $ | (147.7 | ) | $ | — | $ | (147.6 | ) | |||||
Other comprehensive (loss) income before reclassifications | (0.3 | ) | 63.0 | (0.7 | ) | 62.0 | |||||||||
Amounts reclassified from accumulated other comprehensive (loss) income | — | — | 0.6 | 0.6 | |||||||||||
Net current-period other comprehensive (loss) income | (0.3 | ) | 63.0 | (0.1 | ) | 62.6 | |||||||||
Ending balance | $ | (0.2 | ) | $ | (84.7 | ) | $ | (0.1 | ) | $ | (85.0 | ) | |||
Nine Months Ended September 30, 2016 (In millions) | Defined Benefit Pension and Other Postretirement Plans | Currency Translation Adjustments | (Losses) Gains from Hedging Activities | Total | |||||||||||
Beginning balance | $ | 0.1 | $ | (127.8 | ) | $ | — | $ | (127.7 | ) | |||||
Other comprehensive income (loss) before reclassifications | — | 3.5 | (1.2 | ) | 2.3 | ||||||||||
Amounts reclassified from accumulated other comprehensive income (loss) | (0.5 | ) | — | 1.1 | 0.6 | ||||||||||
Net current-period other comprehensive (loss) income | (0.5 | ) | 3.5 | (0.1 | ) | 2.9 | |||||||||
Ending balance | $ | (0.4 | ) | $ | (124.3 | ) | $ | (0.1 | ) | $ | (124.8 | ) | |||
GCP is a global enterprise operating in over 35 countries with local currency generally deemed to be the functional currency for accounting purposes. The currency translation adjustments reflect translation of the balance sheets valued in local currencies to the U.S. dollar as of the end of each period presented, and translation of revenues and expenses at average exchange rates for each period presented.
10. Stock Incentive Plans
On May 11, 2017, GCP filed a Registration Statement on Form S-8 with the SEC for the purpose of registering an additional 8,000,000 shares of Common Stock, par value $0.01 per share, that may be issued under the GCP Applied Technologies Inc. Equity and Incentive Plan (the "Plan"), as amended and restated on February 28, 2017. GCP has provided certain key employees equity awards in the form of stock options, restricted stock units (“RSUs”) and performance-based stock units (“PBUs”) under the Plan. Certain employees and members of the Board of Directors are eligible to receive stock-based compensation, including stock, stock options, RSUs and PBUs. As of September 30, 2017, approximately 9,098,000 shares of common stock were available for issuance under the Plan.
Total cash and non-cash stock-based compensation cost included in "(Loss) income from continuing operations before income taxes" on the Consolidated Statements of Operations is $2.0 million and $1.9 million for the three months ended September 30, 2017 and 2016, respectively. Total cash and non-cash stock-based compensation cost included in the Consolidated Statements of Operations is $7.7 million and $5.3 million for the nine months ended September 30, 2017 and 2016, respectively.
27
Table of Contents
Notes to Consolidated Financial Statements (Continued)
Upon Separation from Grace, previously outstanding stock-based compensation awards granted under Grace’s equity compensation programs were adjusted to reflect the impact of the Separation. To preserve the aggregate intrinsic value of those Grace awards, as measured immediately before and immediately after the Separation, each holder of Grace stock-based compensation awards generally received an adjusted award consisting of either (i) both a stock-based compensation award denominated in Grace equity as it existed subsequent to the Separation and a stock-based compensation award denominated in GCP equity or (ii) solely a stock-based compensation award denominated in the equity of the company at which the person was employed following the Separation. Adjusted awards consisting of stock-based compensation awards denominated in GCP equity are considered issued under the Plan. These adjusted awards generally will be subject to the same vesting conditions and other terms that applied to the original Grace awards before the Separation.
Under the Employee Matters Agreement, GCP is obligated to settle all of the stock-based compensation awards denominated in GCP equity, regardless of whether the holders are employees of GCP or Grace. Likewise, Grace is obligated to settle all of the stock-based compensation awards denominated in Grace shares, regardless of whether the holders are employees of GCP or Grace. As a result, GCP recorded a liability for cash-settled awards held by Grace employees.
In accordance with certain provisions of the Plan, GCP repurchases shares issued to certain holders of GCP awards in order to fulfill statutory tax withholding requirements for the employee. In the nine months ended September 30, 2017 and 2016, GCP repurchased approximately 37,000 and 96,000 shares respectively, under these provisions. These purchases are reflected as "Share repurchases" in the Consolidated Statements of Equity (Deficit).
Stock Options
Stock options are non-qualified and are set at exercise prices not less than 100% of the fair market value on the date of grant (with respect to awards issued before February 28, 2017, fair market value is the average of the high price and low price on the grant date and, with respect to awards issued after February 28, 2017, fair market value is the closing price on the grant date). Stock option awards that relate to Grace stock options originally granted prior to the Separation have a contractual term of five years from the original date of grant. Stock option awards granted post-Separation have a contractual term of seven or ten years from the original date of grant. Generally, stock options vest in substantially equal amounts each year over three years from the date of grant.
GCP values stock options using the Black-Scholes option pricing model, which was developed for use in estimating the fair value of traded options. The risk-free rate is based on the U.S. Treasury yield curve published as of the grant date, with maturities approximating the expected term of the options. GCP estimates the expected term of the options according to the simplified method as allowed by ASC 718-20, Awards Classified as Equity, whereby the average between the vesting period and contractual term is used. GCP estimated the expected volatility using an industry peer group.
The following summarizes GCP's assumptions for estimating the fair value of stock options granted during 2017:
Assumptions used to calculate expense for stock option | Nine Months Ended September 30, 2017 |
Risk-free interest rate | 1.83 - 2.10% |
Average life of options (years) | 5.5 - 6.5 |
Volatility | 31.42 - 31.96% |
Dividend yield | — |
Average fair value per stock option | $9.16 |
28
Table of Contents
Notes to Consolidated Financial Statements (Continued)
The following table summarizes GCP stock option activity for the nine months ended September 30, 2017:
Stock Option Activity | Number Of Shares (in thousands) | Weighted Average Exercise Price | Weighted Average Remaining Contractual Term (years) | Aggregated Intrinsic Value (in thousands) | ||||||||
Outstanding, December 31, 2016 | 2,122 | $ | 16.92 | 3.57 | $ | 20,748 | ||||||
Options exercised | 493 | 13.91 | ||||||||||
Options forfeited/expired/canceled | 120 | 19.64 | ||||||||||
Options granted | 240 | 26.48 | ||||||||||
Outstanding, September 30, 2017 | 1,749 | 18.90 | 3.55 | 20,691 | ||||||||
Exercisable September 30, 2017 | 944 | $ | 17.81 | 2.35 | $ | 12,190 | ||||||
The aggregate intrinsic values in the table above represent the total pre-tax intrinsic value (the difference between GCP's closing stock price on the last trading day of September 2017 and the exercise price, multiplied by the number of in-the-money options) that would have been received by the option holders had all option holders exercised their in-the-money options at period end. The amount changes based on the fair market value of GCP's stock. The intrinsic value of all options exercised in the nine-month period ended September 30, 2017 was $8.3 million.
Total unrecognized stock-based compensation expense for stock options outstanding at September 30, 2017, was $1.1 million and the weighted-average period over which this expense will be recognized is approximately 1.0 years.
Restricted Stock Units and Performance Based Stock Units
Upon Separation, certain previously outstanding RSUs and PBUs granted under Grace's equity compensation programs prior to the Separation were adjusted, in accordance with the Employee Matters Agreement, such that holders of these original Grace RSUs and PBUs received RSUs denominated in GCP equity.
RSUs generally vest over a three year period, with vesting in substantially equal amounts each year over three years and some vesting 100% on the third anniversary of the date of grant. A smaller number of RSUs were designated as sign-on awards and used for purposes of attracting key employees and to cover outstanding awards from a prior employer and vest 100% after two years.
GCP’s RSU activity for the nine months ended September 30, 2017 is as follows:
RSU Activity | Number Of Shares (in thousands) | Weighted Average Grant Date Fair Value | ||||
Outstanding, December 31, 2016 | 538 | $ | 17.22 | |||
RSUs settled | 113 | 17.23 | ||||
RSUs forfeited | 84 | 18.26 | ||||
RSUs granted | 95 | 26.42 | ||||
RSUs outstanding, September 30, 2017 | 436 | $ | 19.02 | |||
29
Table of Contents
Notes to Consolidated Financial Statements (Continued)
During the nine months ended September 30, 2017, GCP distributed 79,917 shares and $0.9 million of cash to settle RSUs. GCP's expectations of future RSU vesting and settlement are as follows:
Year | Number of Shares Vesting (in thousands) | Settled in Cash | Settled in Stock | |||
2017 | 20 | —% | 100% | |||
2018 | 179 | 11% | 89% | |||
2019 | 212 | —% | 100% | |||
2020 | 25 | —% | 100% | |||
PBUs and RSUs are recorded at fair value at the date of grant. The common stock-settled awards are considered equity awards, with the stock compensation expense being determined based on GCP’s stock price on the grant date. The cash settled awards are considered liability awards, with the liability being remeasured each reporting period based on GCP’s then current stock price.
During the nine months ended September 30, 2017, GCP granted 165,974 PBUs under the Plan to Company employees. These awards vest upon certification by the Board's Compensation Committee that the applicable performance criteria have been satisfied (such certification would likely occur in February 2020), are subject to the employees' continued employment through the vesting date, and have a weighted average grant date fair value of $26.48. During the nine months ended September 30, 2017, 13,257 of these awards were forfeited. PBUs that were granted during the year ended December 31, 2016 under the Plan to Company employees remain outstanding as of September 30, 2017. These awards vest upon certification by the Board's Compensation Committee that the applicable performance criteria have been satisfied (such certification would likely occur in February 2019), are subject to the employees' continued employment through the vesting date, and have a weighted average grant date fair value of $17.04. GCP anticipates that 100% of the PBUs will be settled in GCP common stock upon vesting. During the nine months ended September 30, 2017, 35,505 of these awards were forfeited.
The performance criteria for PBUs granted in 2017 is a three-year cumulative adjusted diluted earnings per share metric that is modified, up or down, based on the Company's relative total shareholder return as against the Russell 3000 Index. The number of shares subject to a 2017 PBU award that ultimately vest, if any, is based on Company performance against these metrics, and can range from 0% to 200% of the target number of shares granted to the employee. The awards will become vested, if at all, no later than March 15, 2020, once actual performance for the 2017-2019 performance period is certified by the Board's Compensation Committee. PBUs are remeasured each reporting period based on the expected payout of the award, which may range from 0% to 200% of the targets for such awards; therefore, these portions of the awards are subject to volatility until the payout is finally determined at the end of the applicable performance period.
As of September 30, 2017, $6.4 million of total unrecognized compensation expense related to the RSU and PBU awards is expected to be recognized over the remaining weighted-average service period of 1.4 years.
30
Table of Contents
Notes to Consolidated Financial Statements (Continued)
11. Earnings Per Share
The following table shows a reconciliation of the numerators and denominators used in calculating basic and diluted (loss) earnings per share:
Three Months Ended September 30, | Nine Months Ended September 30, | ||||||||||||||
(In millions, except per share amounts) | 2017 | 2016 | 2017 | 2016 | |||||||||||
Numerators | |||||||||||||||
Net (loss) income from continuing operations attributable to GCP shareholders | $ | (18.1 | ) | $ | 10.9 | $ | (41.8 | ) | $ | 33.2 | |||||
Income from discontinued operations, net of income taxes | $ | 677.3 | $ | 10.4 | $ | 679.4 | $ | 36.2 | |||||||
Net income attributable to GCP shareholders | $ | 659.2 | $ | 21.3 | $ | 637.6 | $ | 69.4 | |||||||
Denominators | |||||||||||||||
Weighted average common shares—basic calculation | 71.6 | 71.0 | 71.2 | 70.8 | |||||||||||
Dilutive effect of employee stock awards (1) | — | 1.2 | — | 0.8 | |||||||||||
Weighted average common shares—diluted calculation | 71.6 | 72.2 | 71.2 | 71.6 | |||||||||||
Basic (loss) earnings per share | |||||||||||||||
Net (loss) income from continuing operations attributable to GCP shareholders | $ | (0.25 | ) | $ | 0.15 | $ | (0.59 | ) | $ | 0.47 | |||||
Income from discontinued operations, net of income taxes | $ | 9.46 | $ | 0.15 | $ | 9.54 | $ | 0.51 | |||||||
Net income attributable to GCP shareholders(2) | $ | 9.21 | $ | 0.30 | $ | 8.96 | $ | 0.98 | |||||||
Diluted (loss) earnings per share | |||||||||||||||
Net (loss) income from continuing operations attributable to GCP shareholders | $ | (0.25 | ) | $ | 0.15 | $ | (0.59 | ) | $ | 0.46 | |||||
Income from discontinued operations, net of income taxes | $ | 9.46 | $ | 0.14 | $ | 9.54 | $ | 0.51 | |||||||
Net income attributable to GCP shareholders(2) | $ | 9.21 | $ | 0.30 | $ | 8.96 | $ | 0.97 | |||||||
(1) Dilutive effect only applicable to periods where there is net income from continuing operations.
(2) Amounts may not sum due to rounding.
For 2016, the computation of basic and diluted earnings per common share is calculated assuming the number of shares of GCP common stock outstanding on February 3, 2016 had been outstanding at the beginning of the period.
There were approximately 0.1 million anti-dilutive options and no anti-dilutive RSUs outstanding on a weighted-average basis for the three and nine months ended September 30, 2017. There were approximately 0.2 million anti-dilutive options and 0.1 million anti-dilutive RSUs outstanding on a weighted average basis for the nine months ended September 30, 2016. There were no anti-dilutive options and or anti-dilutive RSUs outstanding on a weighted average basis for the three months ended September 30, 2016.
During the nine months ended September 30, 2017 and 2016, GCP repurchased approximately 37,000 shares and 96,000 shares of Company common stock for $1.0 million and $1.8 million, respectively, in connection with its equity compensation programs.
31
Table of Contents
Notes to Consolidated Financial Statements (Continued)
12. Related Party Transactions and Transactions with Grace
Related Parties
All contracts with related parties are at rates and terms that GCP believes are comparable with those that could be entered into with independent third parties. Subsequent to the Separation, transactions with Grace represent third-party transactions.
Allocation of General Corporate Expenses
Prior to the Separation, the financial statements included expense allocations for certain functions provided by Grace as well as other Grace employees not solely dedicated to GCP, including, but not limited to, general corporate expenses related to finance, legal, information technology, human resources, communications, ethics and compliance, shared services, employee benefits and incentives and stock-based compensation. These expenses were allocated to GCP on the basis of direct usage when identifiable, with the remainder allocated on the basis of revenue, headcount or other measures.
Between January 1, 2016 and the Separation, GCP was allocated $2.0 million of general corporate expense, which is primarily included within "Selling, general and administrative expenses" in the accompanying Statement of Operations for the nine months ended September 30, 2016.
Transition Services Agreement
In connection with the Separation, the Company entered into a transition services agreement pursuant to which GCP and Grace provided various services to each other on a temporary, transitional basis. The services provided by Grace to GCP included information technology, treasury, tax administration, accounting, financial reporting, human resources and other services. Following the Separation, Grace provided some of these services on a transitional basis, generally for a period of up to 18 months. As of the third quarter 2017, these transitional services are substantially complete.
Tax Sharing Agreement
The Tax Sharing Agreement governs the parties’ respective rights, responsibilities and obligations with respect to tax liabilities and benefits, tax attributes, the preparation and filing of tax returns, the control of audits and other tax proceedings, and other matters regarding taxes. In general, and subject to the terms of the Tax Sharing Agreement, GCP is responsible for all U.S. federal, state and foreign taxes (and any related interest, penalties or audit adjustments) reportable on a GCP separate return (a return that does not include Grace or any of its subsidiaries); and Grace is responsible for all U.S. federal, state and foreign income taxes (and any related interest, penalties or audit adjustments) reportable on a consolidated, combined or unitary return that includes Grace or any of its subsidiaries and GCP or any of its subsidiaries up to the Separation date. As of the balance sheet date, GCP has included $10.3 million of indemnified receivables in "Other assets" and $2.6 million of indemnified payables in "Other current liabilities."
In addition, the Tax Sharing Agreement imposes certain restrictions on GCP and its subsidiaries (including restrictions on share issuances, business combinations, sales of assets and similar transactions) that are designed to preserve the qualification of the Distribution, together with certain related transactions, under Section 355 and certain other relevant provisions of the Code. The Tax Sharing Agreement provides special rules that allocate tax liabilities in the event the Distribution, together with certain related transactions, does not so qualify. In general, under the Tax Sharing Agreement, each party is expected to be responsible for any taxes imposed on, and certain related amounts payable by, GCP or Grace that arise from the failure of the Distribution and certain related transactions, to qualify under Section 355 and certain other relevant provisions of the Code, to the extent that the failure to so qualify is attributable to actions, events or transactions relating to such party’s respective stock, assets or business, or a breach of the relevant representations or covenants made by such party in the Tax Sharing Agreement.
32
Table of Contents
Notes to Consolidated Financial Statements (Continued)
Parent Company Equity
Net transfers to parent are included within net parent investment on the Consolidated Statements of Equity (Deficit). The components of the net transfers to parent as of September 30, 2016 are as follows:
(In millions) | 2016 | ||
Cash pooling and general financing activities | $ | (685.1 | ) |
GCP expenses funded by parent | 6.6 | ||
Corporate costs allocations | 2.0 | ||
Provision for income taxes | 4.3 | ||
Total net transfers to parent | (672.2 | ) | |
Other, net | (86.5 | ) | |
Transfers to parent, net, per Consolidated Statement of Cash Flows | $ | (758.7 | ) |
In the nine months ended September 30, 2017, there were no adjustments to parent company equity. In 2016, "Other, net" includes the non-cash transfer from parent of approximately $44 million of net pension liabilities, approximately $23 million of fixed assets and the non-cash transfer of approximately $36 million of related-party debt, deferred tax items and other items.
GCP used proceeds from the Notes and Credit Facilities to fund a distribution to Grace in an amount of $750.0 million related to the Separation. This distribution is reflected as a component of transfers to parent in the table above.
13. Operating Segment Information
GCP is engaged in the production and sale of specialty construction chemicals and specialty building materials through two operating segments. Specialty Construction Chemicals manufactures and markets concrete admixtures and cement additives. Specialty Building Materials manufactures and markets sheet and liquid membrane systems that protect structures from water, air and vapor penetration, fireproofing, and other products designed to protect the building envelope.
The table below presents information related to GCP's operating segments. Only those corporate expenses directly related to the operating segments are allocated for reporting purposes. GCP excludes certain functional costs, impacts of foreign exchange (related primarily to Venezuela for periods up through the deconsolidation date of July 3, 2017, as discussed in Note 1) and other corporate costs such as certain performance-based incentive compensation and public company costs from segment operating income. GCP also excludes certain ongoing defined benefit pension costs recognized quarterly, which include service and interest costs, the effect of expected returns on plan assets and amortization of prior service costs/credits, from the calculation of segment operating income. GCP believes that the exclusion of certain corporate costs and pension costs provides a better indicator of its operating segment performance as such costs are not managed at an operating segment level.
Operating Segment Data
Three Months Ended September 30, | Nine Months Ended September 30, | ||||||||||||||
(In millions) | 2017 | 2016 | 2017 | 2016 | |||||||||||
Net Sales | |||||||||||||||
Specialty Construction Chemicals | $ | 156.2 | $ | 162.8 | $ | 449.1 | $ | 466.6 | |||||||
Specialty Building Materials | 126.2 | 100.6 | 345.8 | 318.5 | |||||||||||
Total net sales | $ | 282.4 | $ | 263.4 | $ | 794.9 | $ | 785.1 | |||||||
Segment Operating Income | |||||||||||||||
Specialty Construction Chemicals | $ | 15.7 | $ | 23.2 | $ | 44.5 | $ | 53.7 | |||||||
Specialty Building Materials | 30.1 | 25.6 | 80.6 | 88.9 | |||||||||||
Total segment operating income | $ | 45.8 | $ | 48.8 | $ | 125.1 | $ | 142.6 | |||||||
33
Table of Contents
Notes to Consolidated Financial Statements (Continued)
Reconciliation of Operating Segment Data to Financial Statements
Total segment operating income for the three and nine months ended September 30, 2017 and 2016, is reconciled below to "(Loss) income from continuing operations before income taxes" presented in the accompanying Consolidated Statements of Operations:
Three Months Ended September 30, | Nine Months Ended September 30, | ||||||||||||||
(In millions) | 2017 | 2016 | 2017 | 2016 | |||||||||||
Total segment operating income | $ | 45.8 | $ | 48.8 | $ | 125.1 | $ | 142.6 | |||||||
Corporate costs(1) | (7.5 | ) | (9.0 | ) | (28.9 | ) | (29.1 | ) | |||||||
Certain pension costs | (2.1 | ) | (1.8 | ) | (7.0 | ) | (5.4 | ) | |||||||
Loss on sale of product line | — | — | (2.1 | ) | — | ||||||||||
Currency and other financial losses in Venezuela | (36.7 | ) | — | (39.1 | ) | — | |||||||||
Litigation settlement | (4.0 | ) | — | (4.0 | ) | — | |||||||||
Repositioning expenses | (1.1 | ) | (5.3 | ) | (6.8 | ) | (14.3 | ) | |||||||
Restructuring expenses and asset impairments | (2.1 | ) | (0.4 | ) | (13.0 | ) | (1.4 | ) | |||||||
Pension MTM adjustment and other related costs, net | (3.0 | ) | — | (2.9 | ) | (2.7 | ) | ||||||||
Gain on termination and curtailment of pension and other postretirement plans | 0.8 | 0.2 | 5.9 | 2.6 | |||||||||||
Third-party and other acquisition-related costs | (2.0 | ) | (0.3 | ) | (5.0 | ) | (0.3 | ) | |||||||
Amortization of acquired inventory fair value adjustment | (0.2 | ) | — | (2.9 | ) | — | |||||||||
Tax indemnification adjustments | — | — | (2.4 | ) | — | ||||||||||
Net income attributable to noncontrolling interests | 0.1 | 0.2 | 0.2 | 0.9 | |||||||||||
Other financing costs | (6.0 | ) | (1.2 | ) | (6.0 | ) | (1.2 | ) | |||||||
Interest expense, net | (14.5 | ) | (17.6 | ) | (49.0 | ) | (47.8 | ) | |||||||
(Loss) income from continuing operations before income taxes | $ | (32.5 | ) | $ | 13.6 | $ | (37.9 | ) | $ | 43.9 | |||||
(1) | Corporate costs include $5.4 million and $7.0 million of allocated costs in the nine months ended September 30, 2017 and 2016, respectively, and $2.6 million of allocated costs in the three months ended September 30, 2016 that were previously reported within the Darex operating segment. Such costs did not qualify to be reclassified to discontinued operations. For the three months ended September 30, 2017, the Company began allocating these costs to its remaining operating segments. |
Geographic Area Data
The table below presents information related to the geographic areas in which GCP operates. Sales are attributed to geographic areas based on customer location.
Three Months Ended September 30, | Nine Months Ended September 30, | ||||||||||||||
(In millions) | 2017 | 2016 | 2017 | 2016 | |||||||||||
Net Sales | |||||||||||||||
United States | $ | 132.5 | $ | 119.6 | $ | 374.2 | $ | 353.1 | |||||||
Canada and Puerto Rico | 9.0 | 9.0 | 21.8 | 24.9 | |||||||||||
Total North America | 141.5 | 128.6 | 396.0 | 378.0 | |||||||||||
Europe Middle East Africa | 67.0 | 55.3 | 178.9 | 173.9 | |||||||||||
Asia Pacific | 58.0 | 61.3 | 168.4 | 180.9 | |||||||||||
Latin America | 15.9 | 18.2 | 51.6 | 52.3 | |||||||||||
Total | $ | 282.4 | $ | 263.4 | $ | 794.9 | $ | 785.1 | |||||||
34
Table of Contents
Notes to Consolidated Financial Statements (Continued)
14. Discontinued Operations
On July 3, 2017, the Company completed the sale of Darex to Henkel for $1.06 billion in cash, subject to customary closing adjustments (the “Disposition”). In accordance with applicable accounting guidance, the assets and liabilities related to Darex have been reclassified and reflected as "held for sale" on the Consolidated Balance Sheet as of December 31, 2016. In addition, Darex results have been reclassified and reflected as "discontinued operations" on the Consolidated Statements of Operations and Consolidated Statements of Cash Flows for all periods presented.
The agreement with Henkel governing the Disposition (the “Amended Purchase Agreement”) provides for a series of delayed closings that will take place in certain non-U.S. jurisdictions, including Argentina, China, Colombia, Indonesia, Peru and Venezuela. The delayed closings will implement the legal transfer of the Darex business in the delayed closing jurisdictions in accordance with local law over the following four to 27 months. Up to the time of the delayed closings for these countries, the results of the operations of the Darex business in the delayed close countries are reported as “Income (loss) from discontinued operations, net of income taxes” in the Consolidated Statements of Operations, and reflect an economic benefit payable to or recoverable from Henkel, as applicable for each reporting period, per the Amended Purchase Agreement. The assets and liabilities of the Darex business in the delayed close countries are categorized as “Assets held for sale” or “Liabilities held for sale” in the accompanying Consolidated Balance Sheet as of September 30, 2017.
In connection with the Disposition, the Company and Henkel also entered into a Transition Services Agreement pursuant to which Henkel and the Company will provide various services to each other in connection with the transition of the Darex business to Henkel. The Company and Henkel expect to perform these services, which relate to real estate, information technology, accounts payable, payroll and other financial functions and administrative services, for various periods up to 24 months following the closing date. The charges for such services generally allow the servicing party to recover all out-of-pocket costs and expenses.
Additionally, in connection with the Disposition, the Company and Henkel entered into a Master Tolling Agreement, whereby Henkel will operate certain equipment at facilities being sold in order to manufacture and prepare for shipping certain products related to product lines that the Company continues to own. The Company and Henkel expect these services to be provided for a period of 24 months following the closing date, which can be further extended.
Under the Amended Purchase Agreement, GCP is required to indemnify Henkel for certain possible future tax liabilities. GCP has recorded an indemnification payable of $5.7 million in this regard as a result of the Disposition.
GCP recognized a pre-tax gain on the sale of Darex of approximately $883.7 million during the third quarter of 2017. The calculation of the pre-tax gain excludes deferral of $68.7 million of consideration related to the delayed closings, which was received on the closing date. Deferred consideration is recorded in “Other current liabilities” and “Other liabilities” on the Consolidated Balance Sheet as of September 30, 2017. Refer to the table below for a reconciliation of the gain recorded on the sale of Darex at the closing date.
(In millions) | |||
Net proceeds included in gain recognized in third quarter of 2017 | $ | 1,000.2 | |
Less: Transaction costs | 15.9 | ||
Less: Net assets derecognized in third quarter of 2017 | 100.6 | ||
Gain recognized in third quarter of 2017 before income taxes | 883.7 | ||
Less: Tax effect of gain recognized in third quarter of 2017 | 200.0 | ||
Gain recognized in third quarter of 2017 after income taxes | $ | 683.7 | |
35
Table of Contents
Notes to Consolidated Financial Statements (Continued)
In connection with the Disposition and related tax gain, as noted above, the Company has recorded tax expense of approximately $200 million within discontinued operations. The tax consequences of the Disposition are complex and the calculation of the provision is based on management’s best estimate using all readily accessible information. Management is in the process of completing further analysis related to the stock basis, earnings and profits, tax pools, transaction costs and other related components associated with the Disposition. Based on the overall complexity of the calculation, management believes that there is a reasonable possibility that differences between the estimated tax provision and actual outcome may result within the next 12 months, which could have a material impact on the Company's results of operations.
As a result of the Disposition, GCP recorded an unrecognized tax benefit of $31.2 million, which is reflected in the tax effect of the gain and within income tax expense in discontinued operations for the three and nine months ended September 30, 2017.
"Income from discontinued operations, net of income taxes" in the accompanying Statements of Operations is comprised of the following:
Three Months Ended September 30, | Nine Months Ended September 30, | ||||||||||||||
(In millions) | 2017 | 2016 | 2017 | 2016 | |||||||||||
Net sales | $ | 9.1 | $ | 79.1 | $ | 156.9 | $ | 237.8 | |||||||
Cost of goods sold | 6.0 | 51.7 | 104.6 | 152.2 | |||||||||||
Selling, general and administrative expenses | 6.6 | 8.0 | 40.1 | 24.1 | |||||||||||
Research and development expenses | 0.1 | 1.2 | 2.3 | 3.5 | |||||||||||
Restructuring expenses | 0.4 | — | 6.9 | — | |||||||||||
Gain on sale of business | (883.7 | ) | — | (883.7 | ) | — | |||||||||
Other non-operating expenses, net | 2.4 | 0.7 | 7.5 | 1.8 | |||||||||||
Provision for income taxes | (200.0 | ) | (7.1 | ) | (199.7 | ) | (20.0 | ) | |||||||
Less: Net income attributable to noncontrolling interests | — | — | (0.1 | ) | — | ||||||||||
Income from discontinued operations, net of income taxes | $ | 677.3 | $ | 10.4 | $ | 679.4 | $ | 36.2 | |||||||
36
Table of Contents
Notes to Consolidated Financial Statements (Continued)
The carrying amounts of the major classes of assets and liabilities of Darex classified as "held for sale" as of September 30, 2017 and December 31, 2016 consist of the following:
(In millions) | September 30, 2017 | December 31, 2016 | |||||
Cash and cash equivalents | $ | — | $ | 16.3 | |||
Trade accounts receivable | 7.9 | 50.5 | |||||
Inventories | 7.9 | 32.3 | |||||
Other current assets | 1.0 | 8.9 | |||||
Current assets held for sale | 16.8 | 108.0 | |||||
Properties and equipment, net | 1.9 | 39.6 | |||||
Goodwill | — | 4.4 | |||||
Technology and other intangible assets, net | — | 0.4 | |||||
Deferred income taxes | — | 6.4 | |||||
Other assets | 0.6 | 4.6 | |||||
Noncurrent assets held for sale | 2.5 | 55.4 | |||||
Accounts payable | 6.8 | 26.7 | |||||
Other current liabilities | 1.3 | 21.5 | |||||
Current liabilities held for sale | 8.1 | 48.2 | |||||
Deferred income taxes | — | 2.3 | |||||
Underfunded and unfunded defined benefit pension plans | 0.3 | 14.8 | |||||
Other liabilities | — | 3.8 | |||||
Noncurrent liabilities held for sale | $ | 0.3 | $ | 20.9 | |||
15. Acquisitions
Acquisition of Stirling Lloyd Plc
On May 17, 2017, GCP acquired 100% of the share capital of Stirling Lloyd Plc ("Stirling Lloyd"), a UK-based global supplier of high-performance liquid waterproofing and coatings products, for total consideration of $91.1 million, net of $16.1 million of cash acquired. The Company believes that the addition of Stirling Lloyd and its products, which are used for the protection of infrastructure and buildings, opens new growth opportunities by offering additional selling channels in targeting specialized end-market applications.
The Company has accounted for the acquisition as a business combination in accordance with ASC 805, Business Combinations ("ASC 805"), and has included Stirling Lloyd within the SBM operating and reportable segment. In applying the provisions of ASC 805 and determining that Stirling Lloyd represents a business, the Company elected to early adopt and apply ASU 2017-01 (refer to Note 1). Under ASU 2017-01, the Company first assessed whether all of the fair value of the acquired Stirling Lloyd gross assets is concentrated in a single identifiable asset or group of identifiable assets. If that concentration existed, Stirling Lloyd would not be considered a business. The Company concluded that there was not such a concentration, as the fair value of the acquired gross assets is distributed between various intangible and tangible assets.
The Company has allocated the acquisition purchase price to the tangible net assets and identifiable intangible assets acquired based on their estimated fair values at the acquisition date and recorded the excess as goodwill. The Company recognized $59.6 million of goodwill, which is attributable to the revenue growth and operating synergies that GCP expects to realize from this acquisition.
During the quarter ended September 30, 2017, the Company finalized its purchase price allocation and recorded $0.6 million decrease to goodwill, primarily related to final settlement of assets and liabilities transferred between the seller and the buyer.
37
Table of Contents
Notes to Consolidated Financial Statements (Continued)
The following table presents the aggregate purchase price allocation as of September 30, 2017.
(In millions) | Net Assets Acquired | ||
Accounts receivable, net | $ | 6.8 | |
Other current assets | 3.1 | ||
Inventories | 4.2 | ||
Properties and equipment, net | 3.4 | ||
Goodwill | 59.6 | ||
Intangible assets | 26.9 | ||
Accounts payable | (2.9 | ) | |
Other current liabilities | (4.2 | ) | |
Other liabilities | (5.8 | ) | |
Net assets acquired | $ | 91.1 | |
The table below presents the intangible assets acquired as part of the acquisition of Stirling Lloyd and the periods over which they will be amortized.
Amount (In millions) | Weighted-Average Amortization Period (in years) | ||||
Customer Lists | $ | 15.0 | 10 | ||
Technology | 9.8 | 11 | |||
Trademarks | 2.1 | 10 | |||
Total | $ | 26.9 | |||
16. Subsequent Event
On October 31, 2017, GCP acquired 100% of the stock of Ductilcrete Technologies ("Ductilcrete"), a technology leader for concrete flooring systems, for approximately $32 million in cash, subject to normal and customary purchase price adjustments. The business will be included within the Company's SCC operating segment. Due to the timing of the acquisition, the Company has not yet finalized the purchase price allocation in accordance with ASC 805.
38
ITEM 2. MANAGEMENT'S DISCUSSION AND ANALYSIS OF FINANCIAL CONDITION AND RESULTS OF OPERATIONS
We generally refer to the quarter ended September 30, 2017 as the "third quarter," the quarter ended September 30, 2016 as the "prior-year quarter," the quarter ended March 31, 2017 as the "2017 first quarter," the quarter ended June 30, 2017 as the "2017 second quarter," the nine months ended September 30, 2017 as the "nine months," and the nine months ended September 30, 2016 as the "prior-year period." See Analysis of Operations for a discussion of our non-GAAP performance measures.
On July 3, 2017, the Company completed the sale of its Darex Packaging Technologies ("Darex") business to Henkel AG & Co. KgaA. The results of operations of the Darex segment are presented as discontinued operations and, as such, have been excluded from continuing operations and segment results for all periods presented. Unless otherwise noted, the following discussion and analysis pertains only to our continuing operations.
Results of Operations
Summary Description of Business
We are engaged in the production and sale of specialty construction chemicals and specialty building materials through two operating segments:
• | Specialty Construction Chemicals. Specialty Construction Chemicals ("SCC") provides products, technologies, and services that reduce the cost and improve the performance of cement, concrete, mortar, masonry and other cementitious based construction materials. |
• | Specialty Building Materials. Specialty Building Materials ("SBM") produces and sells sheet and liquid membrane systems and other products that protect both new and existing structures from water, air, and vapor penetration, and from fire damage. We also manufacture and sell specialized cementitious and chemical grouts used for soil consolidation and leak-sealing applications. |
We operate our business on a global scale with approximately 54.4% of our annual 2016 net sales from outside the United States. We conduct business in over 35 countries and in over 30 currencies. We manage our operating segments on a global basis, to serve global markets. Currency fluctuations affect our reported results of operations, cash flows, and financial position.
On January 27, 2016, GCP entered into a separation and distribution agreement pursuant to which W.R. Grace & Co. ("Grace") agreed to transfer its Grace Construction Products operating segment and the packaging technologies business, operated under the “Darex” name, of its Grace Materials Technologies operating segment to GCP (the "Separation"). The Separation occurred on February 3, 2016, by means of a pro rata distribution to Grace stockholders of all of the then-outstanding shares of Company common stock, at which time GCP became an independent public company and its common stock listed and began trading under the symbol "GCP" on the New York Stock Exchange.
Third Quarter Performance Summary
Following is a summary of our financial performance for the third quarter compared with the prior-year quarter.
• | Net sales increased 7.2% to $282.4 million. |
• | Net loss from continuing operations attributable to GCP shareholders was $18.1 million, or $0.25 per diluted share, compared with net income from continuing operations attributable to GCP shareholders of $10.9 million or $0.15 per diluted share, for the prior-year quarter. Adjusted EPS was $0.22 and $0.21 per diluted share in the current and prior-year quarters. |
• | Adjusted EBIT decreased 4.7% to $36.2 million. |
• | Adjusted EBIT Return On Invested Capital was 23.0% on a trailing four quarters basis compared with 30.0% for the 2016 third quarter. |
39
Analysis of Operations
We have set forth in the table below our key operating statistics with percentage changes for the third quarter and nine months compared with the corresponding prior-year quarter and prior-year period. Please refer to this Analysis of Operations (the “table”) when reviewing our Management's Discussion and Analysis of Financial Condition and Results of Operations (“MD&A”). In the table, we present financial information in accordance with U.S. GAAP, as well as certain non-GAAP financial measures, which we describe below in further detail. We believe that the non-GAAP financial information supplements our discussions about the performance of our businesses, improves quarter-to-quarter comparability and provides insight to the information that our management uses to evaluate the performance of our businesses. Our management uses non-GAAP measures in financial and operational decision-making processes, for internal reporting, and as part of forecasting and budgeting processes, as these measures provide additional transparency to our core operations.
In the table, we have provided reconciliations of these non-GAAP financial measures to the most directly comparable financial measures calculated and presented in accordance with U.S. GAAP. These non-GAAP financial measures should not be considered substitutes for financial measures calculated in accordance with U.S. GAAP, and the financial results that we calculate and present in the table in accordance with U.S. GAAP, as well as the corresponding reconciliations from those results, should be carefully evaluated as part of our MD&A.
We define Adjusted EBIT (a non-GAAP financial measure) to be net income from continuing operations attributable to GCP shareholders adjusted for interest income; interest expense and related financing costs; income taxes; currency and other financial losses in Venezuela; restructuring and repositioning expenses and asset impairments; pension costs other than service and interest costs, expected returns on plan assets and amortization of prior service costs/credits; gains and losses on sales of businesses, product lines and certain other investments; third-party and other acquisition-related costs; amortization of acquired inventory fair value adjustment; tax indemnification adjustments; and certain other items that are not representative of underlying trends (such as legal settlements). We use Adjusted EBIT to assess and measure our operating performance and in determining performance-based compensation. We use Adjusted EBIT as a performance measure because it provides improved quarter-to-quarter comparability for decision-making and compensation purposes and because it allows management to measure the ongoing earnings results of our strategic and operating decisions.
We define Adjusted EBITDA (a non-GAAP financial measure) to be Adjusted EBIT adjusted for depreciation and amortization. We use Adjusted EBITDA as a performance measure in making significant business decisions.
We define Adjusted Earnings Per Share (a non-GAAP financial measure) to be earnings per share ("EPS") from continuing operations on a diluted basis adjusted for costs related to restructuring and repositioning expenses and asset impairments; pension costs other than service and interest costs, expected return on plan assets and amortization of prior service costs/credits; gains and losses on sales of businesses, product lines and certain other investments; third-party and other acquisition-related costs; amortization of acquired inventory fair value adjustment; tax indemnification adjustments; other financing costs associated with the modification or extinguishment of debt; currency and other financial losses in Venezuela; certain other items that are not representative of underlying trends (such as legal settlements); and certain discrete tax items. We use Adjusted EPS as a performance measure to review our diluted earnings per share results on a consistent basis.
We define Adjusted Gross Profit (a non-GAAP financial measure) to be gross profit adjusted for pension-related costs included in cost of goods sold; loss in Venezuela included in cost of goods sold; and amortization of acquired inventory fair value adjustment. Adjusted Gross Margin means Adjusted Gross Profit divided by net sales. We use this performance measure to understand trends and changes and to make business decisions regarding core operations.
We define Adjusted EBIT Return On Invested Capital (a non-GAAP financial measure) to be Adjusted EBIT (on a trailing four quarters basis) divided by the sum of net working capital, properties and equipment and certain other assets and liabilities. We use Adjusted EBIT Return On Invested Capital as a performance measure to review investments and to make capital allocation decisions.
Adjusted EBIT, Adjusted EBITDA, Adjusted EPS, Adjusted EBIT Return On Invested Capital and Adjusted Gross Margin do not purport to represent income measures as defined under U.S. GAAP. These measures are provided to investors and others to improve the quarter-to-quarter comparability and peer-to-peer comparability of our financial results and to ensure that investors understand the information we use to evaluate the performance of our businesses.
40
Adjusted EBIT has material limitations as an operating performance measure because it excludes costs related to income and expenses from restructuring and repositioning activities, which historically has been a material component of our net income. Adjusted EBITDA also has material limitations as an operating performance measure because it excludes the impact of depreciation and amortization expense. Our business is substantially dependent on the successful deployment of capital, and depreciation and amortization expense is a necessary element of our costs. We compensate for the limitations of these measurements by using these indicators together with net income as measured under GAAP to present a complete analysis of our results of operations. Adjusted EBIT and Adjusted EBITDA should be evaluated together with net income measured under GAAP for a complete understanding of our results of operations.
41
We have provided in the following tables a reconciliation of these non-GAAP measures to the most directly comparable financial measure calculated and presented in accordance with U.S. GAAP.
Analysis of Operations (In millions, except per share amounts) | Three Months Ended September 30, | Nine Months Ended September 30, | |||||||||||||||||||
2017 | 2016 | % Change | 2017 | 2016 | % Change | ||||||||||||||||
Net sales: | |||||||||||||||||||||
Specialty Construction Chemicals | $ | 156.2 | $ | 162.8 | (4.1 | )% | $ | 449.1 | $ | 466.6 | (3.8 | )% | |||||||||
Specialty Building Materials | 126.2 | 100.6 | 25.4 | % | 345.8 | 318.5 | 8.6 | % | |||||||||||||
Total GCP net sales | $ | 282.4 | $ | 263.4 | 7.2 | % | $ | 794.9 | $ | 785.1 | 1.2 | % | |||||||||
Net sales by region: | |||||||||||||||||||||
North America | $ | 141.5 | $ | 128.6 | 10.0 | % | $ | 396.0 | $ | 378.0 | 4.8 | % | |||||||||
Europe Middle East Africa (EMEA) | 67.0 | 55.3 | 21.2 | % | 178.9 | 173.9 | 2.9 | % | |||||||||||||
Asia Pacific | 58.0 | 61.3 | (5.4 | )% | 168.4 | 180.9 | (6.9 | )% | |||||||||||||
Latin America | 15.9 | 18.2 | (12.6 | )% | 51.6 | 52.3 | (1.3 | )% | |||||||||||||
Total net sales by region | $ | 282.4 | $ | 263.4 | 7.2 | % | $ | 794.9 | $ | 785.1 | 1.2 | % | |||||||||
Profitability performance measures: | |||||||||||||||||||||
Adjusted EBIT(A): | |||||||||||||||||||||
Specialty Construction Chemicals segment operating income | $ | 15.7 | $ | 23.2 | (32.3 | )% | $ | 44.5 | $ | 53.7 | (17.1 | )% | |||||||||
Specialty Building Materials segment operating income | 30.1 | 25.6 | 17.6 | % | 80.6 | 88.9 | (9.3 | )% | |||||||||||||
Corporate costs(B) | (7.5 | ) | (9.0 | ) | 16.7 | % | (28.9 | ) | (29.1 | ) | 0.7 | % | |||||||||
Certain pension costs(C) | (2.1 | ) | (1.8 | ) | (16.7 | )% | (7.0 | ) | (5.4 | ) | (29.6 | )% | |||||||||
Adjusted EBIT (non-GAAP) | 36.2 | 38.0 | (4.7 | )% | 89.2 | 108.1 | (17.5 | )% | |||||||||||||
Currency and other financial losses in Venezuela | (36.7 | ) | — | NM | (39.1 | ) | — | NM | |||||||||||||
Litigation settlement | (4.0 | ) | — | NM | (4.0 | ) | — | NM | |||||||||||||
Repositioning expenses | (1.1 | ) | (5.3 | ) | 79.2 | % | (6.8 | ) | (14.3 | ) | 52.4 | % | |||||||||
Restructuring expenses and asset impairments | (2.1 | ) | (0.4 | ) | NM | (13.0 | ) | (1.4 | ) | NM | |||||||||||
Pension MTM adjustment and other related costs, net | (3.0 | ) | — | NM | (2.9 | ) | (2.7 | ) | (7.4 | )% | |||||||||||
Gain on termination and curtailment of pension and other postretirement plans | 0.8 | 0.2 | NM | 5.9 | 2.6 | NM | |||||||||||||||
Third-party and other acquisition-related costs | (2.0 | ) | (0.3 | ) | NM | (5.0 | ) | (0.3 | ) | NM | |||||||||||
Other financing costs | (6.0 | ) | (1.2 | ) | NM | (6.0 | ) | (1.2 | ) | NM | |||||||||||
Amortization of acquired inventory fair value adjustment | (0.2 | ) | — | NM | (2.9 | ) | — | NM | |||||||||||||
Loss on sale of product line | — | — | — | % | (2.1 | ) | — | NM | |||||||||||||
Tax indemnification adjustments | — | — | — | % | (2.4 | ) | — | NM | |||||||||||||
Interest expense, net | (14.5 | ) | (17.6 | ) | 17.6 | % | (49.0 | ) | (47.8 | ) | (2.5 | )% | |||||||||
Income tax benefit (expense) | 14.5 | (2.5 | ) | NM | (3.7 | ) | (9.8 | ) | 62.2 | % | |||||||||||
Net (loss) income from continuing operations attributable to GCP shareholders (GAAP) | $ | (18.1 | ) | $ | 10.9 | NM | $ | (41.8 | ) | $ | 33.2 | NM | |||||||||
Diluted EPS from continuing operations (GAAP)(1) | $ | (0.25 | ) | $ | 0.15 | NM | $ | (0.59 | ) | $ | 0.46 | NM | |||||||||
Adjusted EPS (non-GAAP) | $ | 0.22 | $ | 0.21 | 4.8 | % | $ | 0.39 | $ | 0.62 | (37.1 | )% | |||||||||
______________________________
(1) Dilutive effect only applicable to periods where there is net income from continuing operations.
42
Analysis of Operations (In millions) | Three Months Ended September 30, | Nine Months Ended September 30, | |||||||||||||||||||
2017 | 2016 | % Change | 2017 | 2016 | % Change | ||||||||||||||||
Adjusted profitability performance measures: | |||||||||||||||||||||
Gross Profit: | |||||||||||||||||||||
Specialty Construction Chemicals | $ | 53.4 | $ | 62.2 | (14.1 | )% | $ | 160.1 | $ | 171.6 | (6.7 | )% | |||||||||
Specialty Building Materials | 54.1 | 46.8 | 15.6 | % | 152.1 | 149.7 | 1.6 | % | |||||||||||||
Adjusted Gross Profit (non-GAAP) | 107.5 | 109.0 | (1.4 | )% | 312.2 | 321.3 | (2.8 | )% | |||||||||||||
Loss in Venezuela in cost of goods sold | — | — | — | % | (0.8 | ) | — | NM | |||||||||||||
Amortization of acquired inventory fair value adjustment | (0.2 | ) | — | NM | (2.9 | ) | — | NM | |||||||||||||
Pension costs in cost of goods sold | (0.4 | ) | (0.3 | ) | (33.3 | )% | (1.3 | ) | (0.9 | ) | (44.4 | )% | |||||||||
Total GCP Gross Profit (GAAP) | 106.9 | 108.7 | (1.7 | )% | 307.2 | 320.4 | (4.1 | )% | |||||||||||||
Gross Margin: | |||||||||||||||||||||
Specialty Construction Chemicals | 34.2 | % | 38.2 | % | (4.0) pts | 35.6 | % | 36.8 | % | (1.2) pts | |||||||||||
Specialty Building Materials | 42.9 | % | 46.5 | % | (3.6) pts | 44.0 | % | 47.0 | % | (3.0) pts | |||||||||||
Adjusted Gross Margin (non-GAAP) | 38.1 | % | 41.4 | % | (3.3) pts | 39.3 | % | 40.9 | % | (1.6) pts | |||||||||||
Loss in Venezuela in cost of goods sold | — | % | — | % | 0.0 pts | (0.1 | )% | — | % | NM | |||||||||||
Amortization of acquired inventory fair value adjustment | (0.1 | )% | — | % | NM | (0.4 | )% | — | % | NM | |||||||||||
Pension costs in cost of goods sold | (0.1 | )% | (0.1 | )% | 0.0 pts | (0.2 | )% | (0.1 | )% | (0.1) pts | |||||||||||
Total GCP Gross Margin (GAAP) | 37.9 | % | 41.3 | % | (3.4) pts | 38.6 | % | 40.8 | % | (2.2) pts | |||||||||||
Adjusted EBIT(A)(B)(C): | |||||||||||||||||||||
Specialty Construction Chemicals segment operating income | $ | 15.7 | $ | 23.2 | (32.3 | )% | $ | 44.5 | $ | 53.7 | (17.1 | )% | |||||||||
Specialty Building Materials segment operating income | 30.1 | 25.6 | 17.6 | % | 80.6 | 88.9 | (9.3 | )% | |||||||||||||
Corporate and certain pension costs | (9.6 | ) | (10.8 | ) | 11.1 | % | (35.9 | ) | (34.5 | ) | (4.1 | )% | |||||||||
Total GCP Adjusted EBIT (non-GAAP) | 36.2 | 38.0 | (4.7 | )% | 89.2 | 108.1 | (17.5 | )% | |||||||||||||
Depreciation and amortization: | |||||||||||||||||||||
Specialty Construction Chemicals | $ | 5.4 | $ | 5.1 | 5.9 | % | $ | 15.6 | $ | 15.0 | 4.0 | % | |||||||||
Specialty Building Materials | 3.6 | 2.4 | 50.0 | % | 9.6 | 6.9 | 39.1 | % | |||||||||||||
Corporate | 0.7 | — | NM | 1.7 | 0.3 | NM | |||||||||||||||
Total GCP | 9.7 | 7.5 | 29.3 | % | 26.9 | 22.2 | 21.2 | % | |||||||||||||
Adjusted EBITDA: | |||||||||||||||||||||
Specialty Construction Chemicals | $ | 21.1 | $ | 28.3 | (25.4 | )% | $ | 60.1 | $ | 68.7 | (12.5 | )% | |||||||||
Specialty Building Materials | 33.7 | 28.0 | 20.4 | % | 90.2 | 95.8 | (5.8 | )% | |||||||||||||
Corporate and certain pension costs | (8.9 | ) | (10.8 | ) | 17.6 | % | (34.2 | ) | (34.2 | ) | — | % | |||||||||
Total GCP Adjusted EBITDA (non-GAAP) | 45.9 | 45.5 | 0.9 | % | 116.1 | 130.3 | (10.9 | )% | |||||||||||||
Adjusted EBIT Margin: | |||||||||||||||||||||
Specialty Construction Chemicals | 10.1 | % | 14.3 | % | (4.2) pts | 9.9 | % | 11.5 | % | (1.6) pts | |||||||||||
Specialty Building Materials | 23.9 | % | 25.4 | % | (1.5) pts | 23.3 | % | 27.9 | % | (4.6) pts | |||||||||||
Total GCP Adjusted EBIT Margin (non-GAAP) | 12.8 | % | 14.4 | % | (1.6) pts | 11.2 | % | 13.8 | % | (2.6) pts | |||||||||||
Adjusted EBITDA Margin: | |||||||||||||||||||||
Specialty Construction Chemicals | 13.5 | % | 17.4 | % | (3.9) pts | 13.4 | % | 14.7 | % | (1.3) pts | |||||||||||
Specialty Building Materials | 26.7 | % | 27.8 | % | (1.1) pts | 26.1 | % | 30.1 | % | (4.0) pts | |||||||||||
Total GCP Adjusted EBITDA Margin (non-GAAP) | 16.3 | % | 17.3 | % | (1.0) pts | 14.6 | % | 16.6 | % | (2.0) pts | |||||||||||
43
Analysis of Operations (In millions) | Four Quarters Ended | ||||||
September 30, 2017 | September 30, 2016 | ||||||
Calculation of Adjusted EBIT Return On Invested Capital (trailing four quarters): | |||||||
Adjusted EBIT | $ | 122.1 | $ | 140.6 | |||
Invested Capital: | |||||||
Trade accounts receivable | 209.4 | 188.8 | |||||
Inventories | 108.4 | 85.2 | |||||
Accounts payable | (120.8 | ) | (92.4 | ) | |||
197.0 | 181.6 | ||||||
Other current assets (excluding income taxes) | 51.9 | 32.4 | |||||
Properties and equipment, net | 209.1 | 185.5 | |||||
Goodwill | 183.8 | 102.9 | |||||
Technology and other intangible assets, net | 76.9 | 34.4 | |||||
Other assets (excluding capitalized financing fees) | 24.6 | 18.4 | |||||
Other current liabilities (excluding income taxes, restructuring, repositioning and accrued interest) | (176.6 | ) | (72.9 | ) | |||
Other liabilities (excluding other postretirement benefits liability) | (35.5 | ) | (14.3 | ) | |||
Total invested capital | $ | 531.2 | $ | 468.0 | |||
Adjusted EBIT Return On Invested Capital (non-GAAP) | 23.0 | % | 30.0 | % | |||
___________________________________________________________________________________________________________________
Amounts may not add due to rounding.
(A) | GCP's segment operating income includes only GCP's share of income of consolidated joint ventures. |
(B) | Management allocates all costs within corporate to each segment to the extent such costs are directly attributable to the segments. Corporate costs include approximately $5.4 million and $7.0 million of allocated costs in the nine months ended September 30, 2017, and 2016, respectively, and approximately $2.6 million of allocated costs in the three months ended September 30, 2016 that were previously reported within the Darex operating segment. Such costs did not qualify to be reclassified to discontinued operations. For the three months ended September 30, 2017, the Company began allocating these costs to its remaining operating segments. |
(C) | Certain pension costs include only ongoing costs recognized quarterly, which include service and interest costs, expected returns on plan assets, and amortization of prior service costs/credits. Other pension related costs including mark-to-market adjustments, actuarial gains and losses, gains or losses from curtailments and terminations, and other related costs are excluded from Adjusted EBIT. These amounts are not used by management to evaluate the performance of the GCP businesses and significantly affect the peer-to-peer and quarter-to-quarter comparability of our financial results. Mark-to-market adjustments, actuarial gains and losses, and other related costs relate primarily to changes in financial market values and actuarial assumptions and are not directly related to the operation of the GCP businesses. SCC and SBM segment operating income and corporate costs do not include any amounts for pension cost. |
NM | Not meaningful. |
44
Adjusted EPS
The following table reconciles our Diluted EPS (GAAP) to our Adjusted EPS (non-GAAP):
Three Months Ended September 30, | |||||||||||||||||||||||||||||||
2017 | 2016 | ||||||||||||||||||||||||||||||
(In millions, except per share amounts) | Pre- Tax | Tax Effect | After- Tax | Per Share | Pre- Tax | Tax Effect | After- Tax | Per Share | |||||||||||||||||||||||
Diluted EPS from continuing operations (GAAP) | $ | (0.25 | ) | $ | 0.15 | ||||||||||||||||||||||||||
Repositioning expenses | $ | 1.1 | $ | 0.4 | $ | 0.7 | 0.01 | $ | 5.3 | $ | 2.1 | $ | 3.2 | 0.04 | |||||||||||||||||
Restructuring expenses and asset impairments | 2.1 | 0.7 | 1.4 | 0.02 | 0.4 | 0.1 | 0.3 | — | |||||||||||||||||||||||
Gain on termination and curtailment of pension and other postretirement plans | (0.8 | ) | (0.4 | ) | (0.4 | ) | (0.01 | ) | (0.2 | ) | — | (0.2 | ) | — | |||||||||||||||||
Pension MTM adjustment and other related costs, net | 3.0 | 1.3 | 1.7 | 0.02 | — | — | — | — | |||||||||||||||||||||||
Currency and other financial losses in Venezuela | 36.7 | 12.2 | 24.5 | 0.34 | — | — | — | — | |||||||||||||||||||||||
Litigation settlement | 4.0 | 1.5 | 2.5 | 0.03 | — | — | — | — | |||||||||||||||||||||||
Other financing costs | 6.0 | 2.3 | 3.7 | 0.05 | 1.2 | 0.5 | 0.7 | 0.01 | |||||||||||||||||||||||
Third-party and other acquisition-related costs | 2.0 | 0.4 | 1.6 | 0.02 | 0.3 | 0.1 | 0.2 | — | |||||||||||||||||||||||
Amortization of acquired inventory fair value adjustment | 0.2 | 0.1 | 0.1 | — | — | — | — | — | |||||||||||||||||||||||
Discrete tax items: | |||||||||||||||||||||||||||||||
Discrete tax items, including adjustments to uncertain tax positions | — | 1.1 | (1.1 | ) | (0.01 | ) | — | (0.4 | ) | 0.4 | 0.01 | ||||||||||||||||||||
Adjusted EPS (non-GAAP) | $ | 0.22 | $ | 0.21 | |||||||||||||||||||||||||||
Nine Months Ended September 30, | |||||||||||||||||||||||||||||||
2017 | 2016 | ||||||||||||||||||||||||||||||
(In millions, except per share amounts) | Pre- Tax | Tax Effect | After- Tax | Per Share | Pre- Tax | Tax Effect | After- Tax | Per Share | |||||||||||||||||||||||
Diluted Earnings Per Share (GAAP) | $ | (0.59 | ) | $ | 0.46 | ||||||||||||||||||||||||||
Repositioning expenses | $ | 6.8 | $ | 2.6 | $ | 4.2 | 0.06 | $ | 14.3 | $ | 5.3 | $ | 9.0 | 0.13 | |||||||||||||||||
Restructuring expenses and asset impairments | 13.0 | 4.8 | 8.2 | 0.11 | 1.4 | 0.3 | 1.1 | 0.02 | |||||||||||||||||||||||
Gain on termination and curtailment of pension and other postretirement plans | (5.9 | ) | (2.6 | ) | (3.3 | ) | (0.05 | ) | (2.6 | ) | (0.7 | ) | (1.9 | ) | (0.03 | ) | |||||||||||||||
Pension MTM adjustment and other related costs, net | 2.9 | 1.3 | 1.6 | 0.02 | 2.7 | 0.9 | 1.8 | 0.03 | |||||||||||||||||||||||
Currency and other financial losses in Venezuela | 39.1 | 12.9 | 26.2 | 0.37 | — | — | — | — | |||||||||||||||||||||||
Litigation settlement | 4.0 | 1.5 | 2.5 | 0.03 | — | — | — | — | |||||||||||||||||||||||
Other financing costs | 6.0 | 2.3 | 3.7 | 0.05 | 1.2 | 0.5 | 0.7 | 0.01 | |||||||||||||||||||||||
Third-party and other acquisition-related costs | 5.0 | 1.0 | 4.0 | 0.06 | 0.3 | 0.1 | 0.2 | — | |||||||||||||||||||||||
Amortization of acquired inventory fair value adjustment | 2.9 | 0.9 | 2.0 | 0.03 | — | — | — | — | |||||||||||||||||||||||
Tax indemnification adjustments | 2.4 | 0.9 | 1.5 | 0.02 | — | — | — | — | |||||||||||||||||||||||
Loss on sale of product line | 2.1 | 0.8 | 1.3 | 0.02 | — | — | — | — | |||||||||||||||||||||||
Discrete tax items: | |||||||||||||||||||||||||||||||
Discrete tax items, including adjustments to uncertain tax positions | — | (18.2 | ) | 18.2 | 0.26 | — | (0.3 | ) | 0.3 | — | |||||||||||||||||||||
Adjusted EPS (non-GAAP) | $ | 0.39 | $ | 0.62 | |||||||||||||||||||||||||||
45
GCP Overview
Following is an overview of our financial performance for the third quarter and nine months compared with the prior-year periods.
Net Sales and Gross Margin
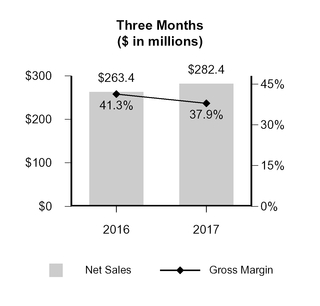
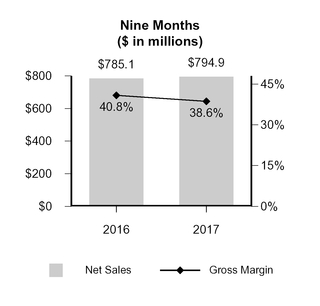
46
The following table identifies the year-over-year increase or decrease in sales attributable to changes in volume and/or mix, product price, and the impact of currency translation for the quarter.
Three Months Ended September 30, 2017 as a Percentage Increase (Decrease) from Three Months Ended September 30, 2016 | |||||||||||
Net Sales Variance Analysis | Volume | Price | Currency Translation | Total Change | |||||||
Specialty Construction Chemicals | (3.8 | )% | (0.6 | )% | 0.3 | % | (4.1 | )% | |||
Specialty Building Materials | 24.9 | % | 0.4 | % | 0.1 | % | 25.4 | % | |||
Net sales | 7.2 | % | (0.2 | )% | 0.2 | % | 7.2 | % | |||
By Region: | |||||||||||
North America | 10.4 | % | (0.6 | )% | 0.2 | % | 10.0 | % | |||
Europe Middle East Africa | 20.6 | % | 1.9 | % | (1.3 | )% | 21.2 | % | |||
Asia Pacific | (3.8 | )% | (1.6 | )% | — | % | (5.4 | )% | |||
Latin America | (20.2 | )% | 1.6 | % | 6.0 | % | (12.6 | )% | |||
Nine Months Ended September 30, 2017 as a Percentage Increase (Decrease) from Nine Months Ended September 30, 2016 | |||||||||||
Net Sales Variance Analysis | Volume | Price | Currency Translation | Total Change | |||||||
Specialty Construction Chemicals | (3.8 | )% | 3.4 | % | (3.4 | )% | (3.8 | )% | |||
Specialty Building Materials | 8.4 | % | 1.3 | % | (1.1 | )% | 8.6 | % | |||
Net sales | 1.2 | % | 2.5 | % | (2.5 | )% | 1.2 | % | |||
By Region: | |||||||||||
North America | 4.4 | % | 0.4 | % | — | % | 4.8 | % | |||
Europe Middle East Africa | 5.9 | % | 1.7 | % | (4.7 | )% | 2.9 | % | |||
Asia Pacific | (5.0 | )% | (1.3 | )% | (0.6 | )% | (6.9 | )% | |||
Latin America | (14.8 | )% | 33.6 | % | (20.1 | )% | (1.3 | )% | |||
Net sales of $282.4 million for the third quarter of 2017 increased $19.0 million or 7.2% compared with the prior-year quarter. The increase was primarily due to sales of $20.3 million related to our acquisitions of Halex and Stirling Lloyd, higher non-acquisition-related sales volumes and higher price in SBM, partially offset by lower sales volumes and lower price in SCC.
Sales volumes increased in North America and EMEA primarily due to the Halex and Stirling Lloyd acquisitions and non-acquisition growth in SBM. Volume declines in Asia Pacific and Latin America were primarily due to the performance of SCC, which was impacted by the deconsolidation of Venezuela.
Gross margin of 37.9% decreased 340 basis points for the third quarter compared with the prior-year quarter due to lower gross margins in SBM and SCC. GCP experienced significant raw material inflation across its business due to higher costs for hydrocarbon-derived inputs. Raw material inflation was exacerbated by supplier capacity constraints in Asia Pacific and the hurricanes impacting North America. The poor weather in North America also disrupted our logistics operations, resulting in increased freight expenses.
Net sales of $794.9 million for the nine months increased $9.8 million or 1.2% compared with the prior-year period. The increase was primarily due to sales of $45.7 million related to our acquisitions of Halex and Stirling Lloyd and improved pricing, partially offset by lower sales volumes excluding acquisitions and unfavorable foreign currency translation.
Gross margin of 38.6% decreased 220 basis points for the nine months ended September 30, 2017 compared with the prior-year period, primarily due to lower gross margin in SBM and the impact of acquisition-related inventory fair value adjustments.
47
Net (Loss) Income from Continuing Operations Attributable to GCP Shareholders
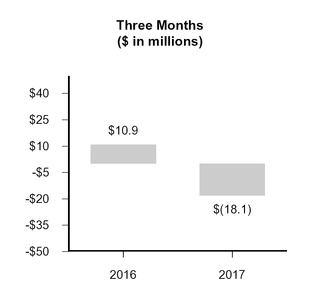
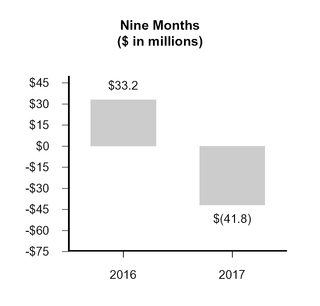
Net loss from continuing operations attributable to GCP shareholders was $18.1 million for the third quarter of 2017, compared to net income from continuing operations attributable to GCP shareholders of $10.9 million for the prior-year quarter. The change was primarily due to the $36.7 million loss in Venezuela resulting from the deconsolidation; a $6.0 million increase in interest expense and related financing costs due to the write-off of debt issuance costs and unamortized discount associated with the repayment and extinguishment of the Term Loan under our Credit Agreement; and a $4.0 million increase in selling, general and administrative expenses due to a litigation settlement, partially offset by lower tax expense of $17.0 million.
Net loss from continuing operations attributable to GCP shareholders was $41.8 million for the nine months, compared to net income from continuing operations attributable to GCP shareholders of $33.2 million for the prior-year period. The change was primarily due to a $39.1 million loss in Venezuela, lower segment operating income, and higher restructuring expenses for the nine months ended September 30, 2017.
48
Adjusted EBIT
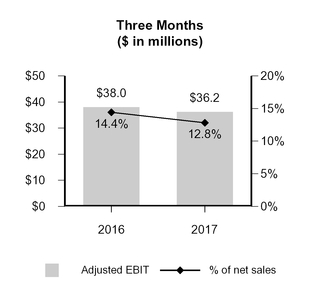
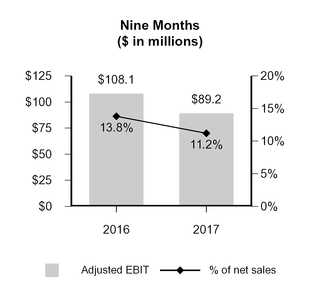
Adjusted EBIT was $36.2 million for the third quarter of 2017, a decrease of 4.7% compared with the prior-year quarter. Adjusted EBIT was $89.2 million for the nine months of 2017, a decrease of 17.5% compared with the prior-year period. The decrease in both the third quarter and nine months of 2017 compared to the prior-year periods was primarily due to lower segment operating income and higher pension cost, partially offset by lower corporate costs.
49
Adjusted EBIT Return On Invested Capital
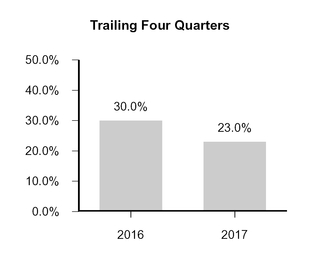
Adjusted EBIT Return On Invested Capital for the third quarter decreased to 23.0% on a trailing four quarters basis from 30.0% on the same basis for the prior-year period. The decrease was mainly driven by a decline in the trailing four quarters of Adjusted EBIT and a 13.5% increase in invested capital that resulted primarily from our acquisitions of Halex in the fourth quarter of 2016 and Stirling Lloyd in the second quarter of 2017, partially offset by the deferred consideration liabilities related to the delayed closings associated with the sale of Darex, as discussed further in Note 14, "Discontinued Operations," to our Consolidated Financial Statements.
We manage our operations with the objective of maximizing sales, earnings and cash flow over time. Doing so requires that we successfully balance our growth, profitability and working capital and other investments to support sustainable, long-term financial performance. We use Adjusted EBIT Return On Invested Capital as a performance measure in evaluating operating results, in making operating and investment decisions and in balancing the growth and profitability of our operations. Generally, we favor those businesses and investments that provide the highest return on invested capital.
50
Operating Segment Overview—Specialty Construction Chemicals (SCC)
Following is an overview of the financial performance of SCC for the third quarter and nine months compared with the corresponding prior-year periods.
Net Sales—SCC
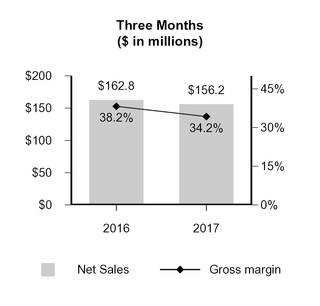
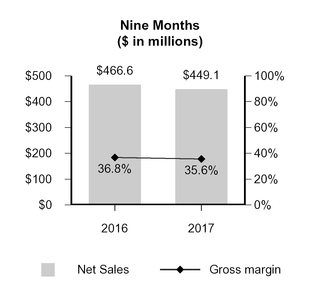
Net sales were $156.2 million for the third quarter, a decrease of 4.1% compared with the prior-year quarter. The decrease in net sales was due primarily to volume declines in Asia Pacific.
Sales volumes decreased in our Concrete business by 5.0% for the third quarter compared with the prior-year quarter. Increased sales volume in EMEA due to higher project activity was more than offset by decreases in Asia Pacific due to share loss and in Latin America, mainly as a result of the deconsolidation of Venezuela. Sales volumes in North America were flat despite the impact of poor weather, including three hurricanes impacting the region. Sales volumes were flat in our Cement business for the third quarter compared with the prior-year quarter, with growth in North America and Europe offset by a decline in Asia Pacific.
Net sales were $449.1 million for the nine months, a decrease of 3.8% compared with the prior-year period. The decrease was due primarily to unfavorable foreign exchange rates and volume declines in Asia Pacific, Europe and Latin America, partially offset by volume increases in North America and inflation-driven price increases in Venezuela. Sales volumes decreased in our Concrete business by 5.6% for the nine months compared with the prior-year period due to a slow-down in Asia Pacific and unfavorable macroeconomic conditions in Europe and Latin America during the first six months of the year. Sales volumes increased in our Cement business by 2.4% for the nine months compared with the prior-year period, reflecting growth in Europe and the Americas.
51
Segment Operating Income (SOI) and Margin—SCC
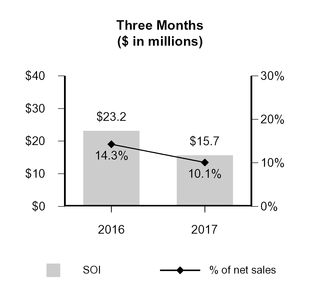
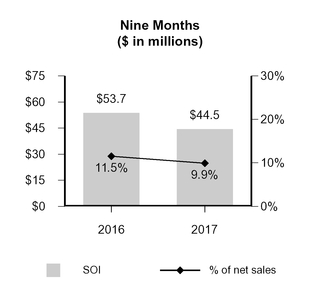
Gross profit was $53.4 million for the third quarter, a decrease of $8.8 million or 14.1% compared with the prior-year quarter, primarily due to a decrease in sales volume and increases in raw materials and logistics costs. Gross margin was 34.2%, compared with 38.2% for the prior-year quarter, primarily due to increases in raw material and logistics costs, partially offset by productivity gains.
Segment operating income was $15.7 million for the third quarter, a decrease of $7.5 million or 32.3% compared with the prior-year quarter, primarily due to lower gross profit, partially offset by a reduction in operating expenses. Segment operating margin decreased 420 basis points to 10.1% compared with the prior-year quarter.
Gross profit was $160.1 million for the nine months, a decrease of $11.5 million or 6.7% compared with the prior-year period, primarily due to a decrease in sales volume and increases in raw material costs. Gross margin was 35.6%, compared with 36.8% for the prior-year quarter, due primarily to increases in raw material costs, partially offset by pricing and productivity gains.
Segment operating income was $44.5 million for the nine months, a decrease of $9.2 million or 17.1% compared with the prior-year period, primarily due to lower gross profit. Segment operating margin decreased 160 basis points to 9.9% compared with the prior-year period.
52
Operating Segment Overview—Specialty Building Materials (SBM)
The following is an overview of the financial performance of SBM for the third quarter and nine months compared with the corresponding prior-year periods.
Net Sales—SBM
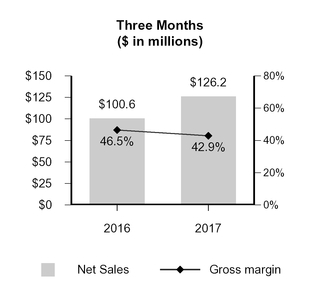
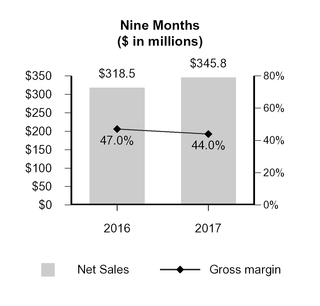
Net sales were $126.2 million for the third quarter, an increase of 25.4% compared with the prior-year quarter, primarily due to $20.3 million of sales related to our acquisitions of Halex and Stirling Lloyd, higher sales volumes excluding acquisitions, and improved pricing. Net sales increased 43.0% and 32.3% in Specialty Construction Products and Building Envelope, respectively, primarily due to net sales from acquisitions, while net sales in Residential declined 6.6% primarily due to a reduction in distribution channel inventories. Sales volumes increased 47.0% in Europe, 20.5% in Asia Pacific and 20.3% in North America and decreased 53.0% in Latin America, largely due to project timing.
Net sales were $345.8 million for the nine months, an increase of 8.6% compared with the prior-year period, primarily due to $45.7 million of sales related to our acquisitions of Halex and Stirling Lloyd and increased pricing, partially offset by lower sales volumes excluding acquisitions, and unfavorable currency translation. Net sales increased 34.2% and 6.2% in Specialty Construction Products and Building Envelope, respectively, primarily due to the acquisitions, and decreased 12.0% in Residential. Sales volumes increased 17.1% in Europe, 7.4% in North America and 5.5% in Asia Pacific, while decreasing 50.3% in Latin America. Excluding acquisitions, sales volumes declined in North America largely due to project timing and a stronger comparable prior-year period due to an abnormally mild winter.
53
Segment Operating Income (SOI) and Margin—SBM
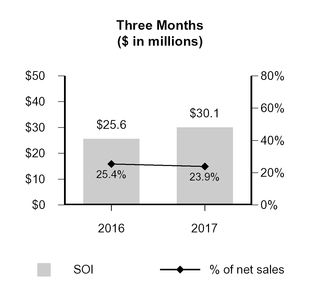
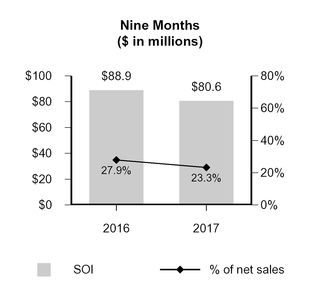
Gross profit was $54.1 million for the third quarter, an increase of 15.6% from the prior-year quarter due primarily to increased net sales partially offset by lower gross margin. Gross margin was 42.9% compared with 46.5% for the prior-year quarter, primarily due to raw material inflation and unfavorable product mix, partially offset by productivity gains.
Segment operating income was $30.1 million for the third quarter, an increase of 17.6% from the prior-year quarter due primarily to increased gross profit. Segment operating margin for the third quarter was 23.9%, a decrease from 25.4% in the prior-year quarter. The decrease resulted from lower gross margin, partially offset by improved operating leverage.
Gross profit was $152.1 million for the nine months, an increase of 1.6% from the prior-year period primarily due to an increase in net sales, partially offset by lower gross margin. Gross margin was 44.0% compared with 47.0% for the prior-year period primarily due to increased raw material costs and unfavorable product mix, partially offset by increased pricing and productivity gains.
Segment operating income was $80.6 million for the nine months, a decrease of 9.3% from the prior-year period primarily due to lower gross margin. Segment operating margin for the nine months was 23.3%, a decrease from 27.9% in the prior-year period. The decrease resulted from lower gross margin and higher selling, general and administrative costs primarily due to acquisitions.
54
Corporate Overview
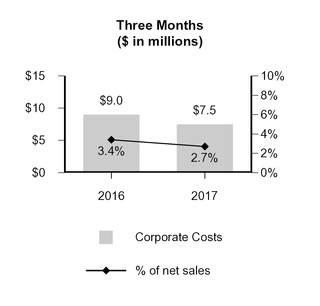
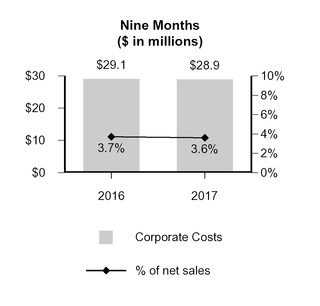
Corporate costs include certain functional costs, impacts of foreign exchange and other corporate costs such as certain performance-based incentive compensation and public company costs that are not allocated to our operating segments.
Corporate costs for the third quarter of 2017 were $7.5 million, a decrease of 16.7% compared with the prior-year quarter. Corporate costs for the nine months of 2017 were $28.9 million, a decrease of 0.7% from the prior-year period. Costs were lower in both periods primarily due to lower incentive-based compensation and public company costs, partially offset by higher general corporate costs.
Defined Benefit Pension Expense
Certain pension costs for the third quarter and nine months were $2.1 million and $7.0 million compared with $1.8 million and $5.4 million for the corresponding prior-year quarter and period, respectively. The increase in both periods relates primarily to lower discount rates and demographic factors related to plan participants.
In the third quarter, GCP recognized a curtailment gain of $0.7 million and a mark-to-market loss of $3.0 million in continuing operations due to plan remeasurements resulting from the restructuring activities and the sale of Darex.
For the nine months, GCP recognized a curtailment gain of $5.1 million as a result of an amendment to the GCP Applied Technologies Inc. Retirement Plan for Salaried Employees that closes the plan to new hires effective January 1, 2018 and freezes the accrual of plan benefits for all plan participants as of December 31, 2022. In addition, GCP terminated and settled a pension plan at one non-U.S. location, resulting a mark-to-market remeasurement gain of $0.1 million.
Pension mark-to-market and other related costs, net, were $2.7 million for the nine months ended September 30, 2016 primarily due to a $2.4 million liability relating to a U.S. multi-employer plan that GCP participants withdrew from during the years 2007 to 2011, which triggered a partial withdrawal under ERISA rules.
Restructuring and Repositioning Expenses
2017 Restructuring and Repositioning Plan (the “2017 Plan”)
On June 28, 2017, the Board of Directors of GCP approved a restructuring and repositioning plan that includes actions to streamline its operations, reduce its global cost structure and reposition itself as a construction products technologies company.
55
We expect to incur total costs under the 2017 Plan of approximately $28 million to $32 million, an increase from the $22 million to $26 million estimated range in the second quarter of 2017. The 2017 Plan includes approximately $25 million related to restructuring activities and approximately $6 million related to repositioning activities. The restructuring activities, which are expected to be completed by December 31, 2018, primarily relate to severance and other employee-related costs, asset impairments and facility exit costs, of which we expect to classify approximately $9 million within discontinued operations. The repositioning activities primarily include consulting, other professional services and recruitment costs associated with our organizational realignment. In addition, we expect to incur approximately $9 million in capital expenditures related to repositioning activities, an increase of $3 million from the estimate in the second quarter of 2017. All of our repositioning activities are expected to relate to continuing operations and should be substantially completed by December 31, 2019. We expect to settle substantially all of the costs related to the 2017 Plan in cash.
At the conclusion of the execution of the 2017 Plan, we expect to achieve a net annualized cost reduction of approximately $24 million to $28 million, an increase from our $22 million to $25 million estimate in the second quarter of 2017. We expect approximately $9 million to $13 million of this net annualized cost reduction to benefit continuing operations, while $15 million relates to discontinued operations. While we expect the cost reduction to be phased-in over the completion of the 2017 Plan, we expect that the cost recovery generated from the Transition Services Agreement with Henkel beginning in the third quarter of 2017 (refer to Note 14, "Discontinued Operations," to our Consolidated Financial Statements) will largely offset the cost that will be eliminated under the program.
Restructuring Expenses
The following table summarizes restructuring expenses incurred related to the 2017 Plan and prior-period plans:
Three Months Ended September 30, | Nine Months Ended September 30, | ||||||||||||||
(In millions) | 2017 | 2016 | 2017 | 2016 | |||||||||||
Severance and other employee costs | $ | 2.1 | $ | 0.4 | $ | 19.0 | $ | 1.4 | |||||||
Facility exit costs and asset impairments | 0.4 | — | 0.9 | — | |||||||||||
Total restructuring expenses | $ | 2.5 | $ | 0.4 | $ | 19.9 | $ | 1.4 | |||||||
Less: restructuring expenses reflected in discontinued operations | 0.4 | — | 6.9 | — | |||||||||||
Total restructuring expenses from continuing operations | $ | 2.1 | $ | 0.4 | $ | 13.0 | $ | 1.4 | |||||||
Repositioning Expenses - 2017 Plan
Repositioning expenses associated with the 2017 Plan primarily relate to consulting, other professional services and recruitment costs associated with the Company’s organizational realignment. Due to the scope and complexity of the Company’s repositioning activities, the range of estimated repositioning expense could increase or decrease and the timing of incurrence could change. For the third quarter and nine months, GCP incurred repositioning expenses related to the 2017 Plan of $1.1 million and $1.5 million respectively, substantially all of which represent professional fees.
56
Separation-Related Repositioning Expenses
Post-Separation from Grace, GCP incurred expenses related to its transition to a stand-alone public company. As of June 30, 2017, the Company has substantially completed these activities and incurred total costs of $20.5 million. Separation-related repositioning expenses incurred for the periods presented were as follows:
Three Months Ended September 30, | Nine Months Ended September 30, | ||||||||||||||
(In millions) | 2017 | 2016 | 2017 | 2016 | |||||||||||
Professional fees | $ | — | $ | 3.1 | $ | 3.4 | $ | 7.3 | |||||||
Software and IT implementation fees | — | 0.8 | 0.9 | 2.5 | |||||||||||
Employee-related costs | — | 1.4 | 1.0 | 4.5 | |||||||||||
Total | $ | — | $ | 5.3 | $ | 5.3 | $ | 14.3 | |||||||
We exclude restructuring and repositioning expenses from Adjusted EBIT.
Interest Expense and Related Financing Costs
Net interest expense and other related financing costs were $21.6 million and $56.1 million for the third quarter and nine months of 2017 compared to $18.8 million and $49.0 million in the corresponding prior-year periods. The third quarter increase of 14.9% and the nine-month period increase of 14.5% resulted primarily from the write-off of the net unamortized debt issuance costs of $3.9 million and the net unamortized discount of $2.1 million associated with the repayment and extinguishment of our Term Loan on July 31, 2017.
Income Taxes
The income tax benefit attributable to continuing operations for the three months ended September 30, 2017 was $14.5 million, compared with income tax expense attributable to continuing operations of $2.5 million in the prior-year quarter, representing effective tax rates of 44.6% and 18.4%, respectively. The income tax expense attributable to continuing operations for the nine months ended September 30, 2017 and 2016 was $3.7 million and $9.8 million, respectively, representing effective tax rates of 9.8% and 22.3%, respectively. The difference between the provision for income taxes at the U.S. federal income tax rate of 35% and GCP’s overall income tax rate is summarized below.
Three Months Ended September 30, | Nine Months Ended September 30, | ||||||||||||||
(In millions) | 2017 | 2016 | 2017 | 2016 | |||||||||||
Income tax (benefit) expense at U.S. federal income tax rate | $ | (11.4 | ) | $ | 4.8 | $ | (13.3 | ) | $ | 15.4 | |||||
Change in income tax (benefit) expense resulting from: | |||||||||||||||
Valuation allowance | — | — | 13.9 | — | |||||||||||
Tax on undistributed foreign earnings | (2.9 | ) | — | 3.6 | — | ||||||||||
Effect of tax rates in foreign jurisdictions | (0.1 | ) | (0.5 | ) | 0.1 | (3.9 | ) | ||||||||
Permanent items and other | (0.1 | ) | (1.8 | ) | (0.6 | ) | (1.7 | ) | |||||||
Income tax (benefit) expense | $ | (14.5 | ) | $ | 2.5 | $ | 3.7 | $ | 9.8 | ||||||
For the three months ended September 30, 2017 and 2016, GCP recorded income tax expense attributable to discontinued operations of $200 million and $7.1 million, respectively. For the nine months ended September 30, 2017 and 2016, GCP recorded income tax expense attributable to discontinued operations of $199.7 million and $20.0 million, respectively. Refer to Note 14, "Discontinued Operations," to the Consolidated Financial Statements for further details regarding the Darex transaction.
57
As of December 31, 2016, GCP had the intent and ability to indefinitely reinvest undistributed earnings of its foreign subsidiaries outside the United States. During the first and second quarters of 2017, GCP determined it could no longer assert it is indefinitely reinvested in Mexico and Venezuela because these entities were included in the Darex transaction, resulting in a tax expense of $6.5 million. In the third quarter of 2017, GCP recorded $7.5 million of tax benefit related to an adjustment to the Mexico outside book and tax basis difference. Additionally, in the third quarter of 2017, pursuant to tax planning with the respect to the Company’s subsidiary, GCP UK Holdings Limited, GCP determined it could no longer assert it is indefinitely reinvested in this subsidiary, resulting in $4.6 million of tax expense. These changes in assertions resulted in a tax benefit of $2.9 million in the third quarter of 2017 and tax expense of $3.6 million for the nine months ended September 30, 2017. Management is in the process of completing further analysis related to the stock basis, earnings and profits, tax pools, and other related components associated with the Darex transaction. Based on the overall complexity of the calculation, management believes that there is a reasonable possibility that differences between these estimates and actual outcomes may result within the next 12 months, which could have a material impact on the Company’s consolidated financial position.
GCP believes that the sale of Darex is a one-time, non-recurring event and that recognition of deferred taxes of undistributed earnings during 2017 would not have occurred if not for the sale. As of September 30, 2017, GCP has the intent and ability to indefinitely reinvest undistributed earnings of all its other foreign subsidiaries outside the United States. GCP expects undistributed prior-year earnings of its foreign subsidiaries to remain indefinitely reinvested except in certain instances where repatriation of such earnings would result in minimal or no tax. GCP bases this assertion on:
(1) | the expectation that it will satisfy its U.S. cash obligations in the foreseeable future without requiring the repatriation of prior-year foreign earnings; |
(2) | plans for significant and continued reinvestment of foreign earnings in organic and inorganic growth initiatives outside the U.S.; and |
(3) | remittance restrictions imposed by local governments. |
GCP continually analyzes and evaluates its cash needs to determine the appropriateness of its indefinite reinvestment assertion.
Refer to Note 4, "Income Taxes," to the Consolidated Financial Statements for additional information.
Financial Condition, Liquidity, and Capital Resources
Following is an analysis of our financial condition, liquidity and capital resources at September 30, 2017.
Our principal uses of cash generally have been capital investments and acquisitions and working capital investments. In connection with our separation from Grace, we incurred $800.0 million of indebtedness, including $750.0 million borrowed to pay a distribution to Grace prior to the Separation and approximately $50 million retained to meet operating requirements and to pay Separation-related fees. We believe our liquidity and capital resources, including cash on hand, cash we expect to generate during 2017 and thereafter, future borrowings if any, and other available liquidity and capital resources (discussed further below), are sufficient to finance our operations and growth strategy and to meet our debt obligations during the next twelve months and for the foreseeable future.
Divestiture of Darex
Upon the closing of the sale of Darex on July 3, 2017, we received pre-tax proceeds of approximately $1.06 billion before deal and other one-time costs, subject to customary closing adjustments. We have used a portion of these proceeds primarily for general corporate purposes and to repay indebtedness.
58
The agreement governing our sale of Darex provides for a series of delayed closings that will take place in certain non-U.S. jurisdictions, including Argentina, China, Colombia, Indonesia, Peru and Venezuela. The delayed closings will implement the legal transfer of the Darex business in the delayed closing jurisdictions in accordance with local law over the following four to 27 months. Up to the time of the delayed closing for these countries, the results of the operations of the Darex business within the delayed close countries are reported as “Income (loss) from discontinued operations, net of income taxes” in the Consolidated Statement of Operations, which are adjusted for an economic benefit (payable to) or recovered from Henkel. The assets and liabilities of the Darex business in the delayed close countries are categorized as “Assets held for sale” or “Liabilities held for sale” in the Consolidated Balance Sheet as of September 30, 2017.
Cash Resources and Available Credit Facilities
At September 30, 2017, we had available liquidity of $1,046.8 million, consisting of $771.4 million in cash and cash equivalents ($90.8 million in the U.S.), $240.0 million available under our revolving credit facility, and $35.4 million of available liquidity under various non-U.S. credit facilities.
Our non-U.S. credit facilities are extended to various subsidiaries that use them primarily to issue bank guarantees supporting trade activity and to provide working capital during occasional cash shortfalls. We generally renew these credit facilities as they expire.
The following table summarizes our non-U.S. credit facilities as of September 30, 2017:
(In millions) | Maximum Borrowing Amount | Available Liquidity | Expiration Date | ||||||
China | $ | 16.5 | $ | 7.0 | Open end | ||||
India | 12.0 | 3.6 | 2/3/2021 | ||||||
Canada | 6.1 | 2.0 | 2/3/2021 | ||||||
Turkey | 3.2 | 1.9 | Open end | ||||||
Australia | 3.0 | 2.6 | 2/3/2021 | ||||||
Brazil | 2.8 | 2.8 | 11/8/2017 | ||||||
Mexico | 2.6 | 2.6 | 3/31/2018 | ||||||
Other Countries | 12.9 | 12.9 | Open end | ||||||
Total | $ | 59.1 | $ | 35.4 | |||||
Analysis of Cash Flows
The following table summarizes our cash flows for the nine months and prior-year period:
Nine Months Ended September 30, | |||||||
(In millions) | 2017 | 2016 | |||||
Net cash (used in) provided by operating activities from continuing operations | $ | (11.7 | ) | $ | 26.3 | ||
Net cash used in investing activities from continuing operations | (114.8 | ) | (30.0 | ) | |||
Net cash (used in) provided by financing activities from continuing operations | (293.5 | ) | 12.9 | ||||
Net cash used in operating activities from continuing operations for the nine months was $11.7 million, compared with net cash provided by operating activities of $26.3 million for the prior-year period. The year-over-year change was primarily due to the decrease in income from continuing operations and increases in trade accounts receivable and other assets and liabilities, partially offset by the non-cash impact of the $36.7 million pre-tax charge associated with the deconsolidation of our Venezuelan operations and an increase in accounts payable.
Net cash used in investing activities from continuing operations for the nine months was $114.8 million, compared with $30.0 million for the prior-year period. The year-over-year change was primarily due to the acquisition of Stirling Lloyd.
59
Net cash used in financing activities from continuing operations for the nine months was $293.5 million, compared with net cash provided by financing activities of $12.9 million in the prior-year period. The year-over-year change in cash flow was primarily due to the repayment and extinguishment of the Term Loan principal balance outstanding under the Credit Agreement, which, together with accrued interest, was $272.6 million.
Included in net cash (used in) provided by operating activities from continuing operations for the nine months ended September 30, 2017 and September 30, 2016, are restructuring payments of $4.3 million and $2.8 million, respectively, and repositioning payments of $5.4 million and $14.7 million, respectively. These cash flows totaled $9.7 million and $17.5 million for the nine months and prior-year period, respectively.
Debt and Other Contractual Obligations
Total debt outstanding at September 30, 2017 was $544.1 million. Refer to Note 3, "Debt and Other Financial Instruments," to the Consolidated Financial Statements for additional information regarding our debt. On July 3, 2017, GCP completed the sale of Darex to Henkel for approximately $1.06 billion in cash, subject to working capital and certain other adjustments. The sale of Darex is a permitted transaction under the Company's Credit Agreement and the Indenture governing the Notes. Under the Credit Agreement and the Indenture governing the Senior Notes, GCP is required to use net cash proceeds from the sale to prepay debt or make investments in the business over a period of approximately 18 months. On July 31, 2017, GCP repaid and extinguished the Term Loan principal balance outstanding under the Credit Agreement, which, together with accrued interest, was $272.6 million. In conjunction with the debt repayment, GCP wrote-off the net unamortized discount of $2.1 million and the net unamortized debt issuance costs of $3.8 million related to the Term Loan, which are reflected in "Interest expense and related financing costs" for the three and nine months ended September 30, 2017.
We have various future contractual obligations, including those for debt and related interest payments, pension funding requirements, operating leases and other operating commitments. During the quarter ended September 30, 2017, there were no material changes to our contractual obligations as previously reported in our Annual Report on Form 10-K for the year ended December 31, 2016, except as discussed above and in Note 3, "Debt and Other Financial Instruments."
Refer to Note 7, "Commitments and Contingent Liabilities," to the Consolidated Financial Statements for a discussion of financial assurances.
Employee Benefit Plans
For the nine months ended September 30, 2017, we did not contribute any funds to the U.S. qualified pension plans. During the nine months ended September 30, 2016, we made an accelerated contribution to the trusts that hold assets of the U.S. qualified pension plans of approximately $1.0 million.
We intend to fund non-U.S. pension plans based upon applicable legal requirements as well as actuarial and trustee recommendations. We contributed $1.9 million to these non-U.S. plans during the nine months ended September 30, 2017 compared with $1.7 million during the prior-year period.
Refer to Note 5, "Pension Plans and Other Postretirement Benefit Plans," to the Consolidated Financial Statements for further discussion.
Other Contingencies
Refer to Note 7, "Commitments and Contingent Liabilities," to the Consolidated Financial Statements for a discussion of other contingencies.
60
Inflation
We recognize that inflationary pressures may have an adverse effect on us through higher asset replacement costs and higher raw materials and other operating costs. We try to minimize these impacts through effective control of operating expenses and productivity improvements as well as price increases to customers.
We estimate that the cost of replacing our property and equipment today is greater than its historical cost. Accordingly, our depreciation expense would be greater if the expense were stated on a current cost basis.
Venezuela
The operating environment in Venezuela is challenging, with high inflation, labor unrest, governmental restrictions in the form of currency exchange and price and margin controls, and the possibility of additional government actions such as further currency devaluations, business occupations or intervention and expropriation of assets. In addition, the foreign exchange controls in Venezuela limit our ability to purchase raw materials, repatriate earnings, remit dividends and pay intercompany balances at an official exchange rate or at all.
Effective January 1, 2010, we began to account for Venezuela as a highly inflationary economy. As a result, the functional currency of our Venezuelan subsidiary became the U.S. dollar; therefore, all translation adjustments after the effective date are reflected in net income in the accompanying Consolidated Statements of Operations.
Effective September 30, 2015, we began accounting for our results in Venezuela at the SIMADI rate. In mid-February 2016, changes to the currency exchange systems were announced that eliminated the SICAD exchange rate and replaced the name SIMADI rate with DICOM.
At the end of May 2017, the Venezuela government announced that it had completed its first auction under the new DICOM exchange mechanism at a rate of 2,010 bolivars per U.S. dollar, an increase of 176.1% from the previously published rate of 728 bolivars per U.S. dollar.
Prior to July 3, 2017, the Company included the results of its Venezuelan operations ("GCP Venezuela") in the Consolidated Financial Statements using the consolidation method of accounting. Venezuelan exchange control regulations have resulted in an other-than-temporary lack of exchangeability between the Venezuelan bolivar and U.S. dollar, and have restricted GCP Venezuela’s ability to pay dividends and meet obligations denominated in U.S. dollars. These exchange regulations, combined with other recently adopted regulations, have constrained availability of raw materials and are significantly limiting GCP Venezuela’s ability to maintain normal production. As a result of these conditions, combined with the loss of scale in Venezuela resulting from the sale of the Company’s Darex-related operations and assets in Venezuela, GCP has deconsolidated its Venezuelan operations as of July 3, 2017. Subsequent to this date, the Company began accounting for GCP Venezuela using the cost method of accounting. This change resulted in a third quarter 2017 pre-tax charge of $36.7 million ($23.8 million net of tax), which is reflected in “Loss in Venezuela” in the accompanying Statement of Operations, primarily related to the recognition of unfavorable currency translation adjustments of $33.4 million related to the Venezuela subsidiary for periods prior to January 1, 2010. In periods subsequent to July 3, 2017, the Company’s financial results will not include the operating results of GCP Venezuela. The Company will record cash and recognize income from its Venezuelan operations in the consolidated financial statements to the extent GCP is paid for inventory sold to or dividends received from GCP Venezuela. The remaining investment on the Company's Consolidated Balance Sheet as of September 30, 2017 is immaterial.
Critical Accounting Estimates
Refer to the "Critical Accounting Estimates" heading in Item 7 of our Form 10-K for the year ended December 31, 2016.
Recent Accounting Pronouncements
Refer to Note 1, "Basis of Presentation and Summary of Significant Accounting and Financial Reporting Policies," to the Consolidated Financial Statements for a discussion of recent accounting pronouncements and their potential effect on our results of operations, financial position and related disclosures.
61
Item 3. QUANTITATIVE AND QUALITATIVE DISCLOSURES ABOUT MARKET RISK
With respect to information disclosed in the "Quantitative and Qualitative Disclosures About Market Risk" section of our Annual Report on Form 10-K for the year ended December 31, 2016 ("2016 Annual Report"), more recent numerical measures and other information are available in the "Financial Statements" and "Management's Discussion and Analysis of Financial Condition and Results of Operations" sections of this Report. These more recent measures and the information disclosed in the "Quantitative and Qualitative Disclosures About Market Risk" section of our 2016 Annual Report are incorporated herein by reference.
Item 4. CONTROLS AND PROCEDURES
Management’s Evaluation of Disclosure Controls and Procedures
As of the end of the period covered by this report, our principal executive officer and principal financial officer evaluated the effectiveness of our disclosure controls and procedures, as defined in Rule 13a-15(e) of the Securities Exchange Act of 1934 (the "Exchange Act"), which are designed to provide reasonable assurance that we are able to record, process, summarize and report the information required to be disclosed in our reports under the Exchange Act within the time periods specified in SEC rules and forms. Based on their evaluation, our principal executive officer and principal financial officer concluded that our disclosure controls and procedures were effective to provide reasonable assurance that the information required to be disclosed in reports that we file or submit under the Exchange Act is accumulated and communicated to management, and made known to our principal executive officer and principal financial officer, on a timely basis to ensure that it is recorded, processed, summarized and reported within the time periods specified in the SEC’s rules and forms.
Changes in Internal Control Over Financial Reporting
There were no changes in our internal control over financial reporting during the quarter ended September 30, 2017, that have materially affected, or are reasonably likely to materially affect, our internal control over financial reporting.
62
PART II. OTHER INFORMATION
Item 1. LEGAL PROCEEDINGS
Information with respect to this Item may be found in Note 7 to the Consolidated Financial Statements in this Quarterly Report on Form 10-Q, which information is incorporated herein by reference.
Additional information on our commitments and contingencies can be found in our Annual Report on Form 10-K for our fiscal year ended December 31, 2016.
Item 1A. RISK FACTORS
There are no material changes from the risk factors as previously disclosed in our Annual Report on Form 10-K for our fiscal year ended December 31, 2016.
Item 6. EXHIBITS
Exhibit No. | Description of Exhibit | |
31.1* | Certification of the Chief Executive Officer pursuant to Rule 13a-14(a) of the Exchange Act, as adopted pursuant to Section 302 of the Sarbanes-Oxley Act of 2002 | |
31.2* | Certification of the Chief Financial Officer pursuant to Rule 13a-14(a) of the Exchange Act, as adopted pursuant to Section 302 of the Sarbanes-Oxley Act of 2002 | |
32** | Certification of the Chief Executive Officer and Chief Financial Officer under Section 906 of the Sarbanes-Oxley Act of 2002 | |
101.INS* | XBRL Instance Document | |
101.SCH* | XBRL Taxonomy Extension Schema | |
101.CAL* | XBRL Taxonomy Extension Calculation Linkbase | |
101.DEF* | XBRL Taxonomy Extension Definition Linkbase | |
101.LAB* | XBRL Taxonomy Extension Label Linkbase | |
101.PRE* | XBRL Taxonomy Extension Presentation Linkbase | |
* Filed herewith.
** Furnished herewith.
63
SIGNATURES
In accordance with the requirements of the Securities Exchange Act of 1934, the registrant caused this report to be signed on its behalf by the undersigned, thereunto duly authorized.
GCP Applied Technologies Inc. (Registrant) | ||
Date: November 8, 2017 | By: | /s/ GREGORY E. POLING |
Gregory E. Poling President and Chief Executive Officer (Principal Executive Officer) | ||
Date: November 8, 2017 | By: | /s/ DEAN P. FREEMAN |
Dean P. Freeman Vice President and Chief Financial Officer (Principal Financial Officer) | ||
Date: November 8, 2017 | By: | /s/ KENNETH S. KOROTKIN |
Kenneth S. Korotkin Vice President, Controller and Chief Accounting Officer (Principal Accounting Officer) | ||
64
EXHIBIT INDEX
Exhibit No. | Description of Exhibit | |
101.INS* | XBRL Instance Document | |
101.SCH* | XBRL Taxonomy Extension Schema | |
101.CAL* | XBRL Taxonomy Extension Calculation Linkbase | |
101.DEF* | XBRL Taxonomy Extension Definition Linkbase | |
101.LAB* | XBRL Taxonomy Extension Label Linkbase | |
101.PRE* | XBRL Taxonomy Extension Presentation Linkbase | |
* Filed herewith.
** Furnished herewith.
65