Attached files
| file | filename |
|---|---|
| EX-32 - EXHIBIT 32 - GCP Applied Technologies Inc. | gcp2016q310-qexhibit32.htm |
| EX-31.2 - EXHIBIT 31.2 - GCP Applied Technologies Inc. | gcp2016q310-qexhibit312.htm |
| EX-31.1 - EXHIBIT 31.1 - GCP Applied Technologies Inc. | gcp2016q310-qexhibit311.htm |
UNITED STATES
SECURITIES AND EXCHANGE COMMISSION
WASHINGTON, D.C. 20549
FORM 10-Q
ý | QUARTERLY REPORT PURSUANT TO SECTION 13 OR 15(d) OF THE SECURITIES EXCHANGE ACT OF 1934 | |
For the Quarterly Period Ended September 30, 2016 | ||
OR | ||
o | TRANSITION REPORT PURSUANT TO SECTION 13 OR 15(d) OF THE SECURITIES EXCHANGE ACT OF 1934 | |
Commission File Number 1-137533 | ||
GCP Applied Technologies Inc.
Delaware (State of Incorporation) | 47-3936076 (I.R.S. Employer Identification No.) | |
62 Whittemore Avenue, Cambridge, Massachusetts 02140-1623
(617) 876-1400
(Address and phone number of principal executive offices)
Indicate by check mark whether the registrant (1) has filed all reports required to be filed by Section 13 or 15(d) of the Securities Exchange Act of 1934 during the preceding 12 months (or for such shorter period that the registrant was required to file such reports), and (2) has been subject to such filing requirements for the past 90 days. Yes ý No o
Indicate by check mark whether the registrant has submitted electronically and posted on its corporate Web site, if any, every Interactive Data File required to be submitted and posted pursuant to Rule 405 of Regulation S-T (§232.405 of this chapter) during the preceding 12 months (or for such shorter period that the registrant was required to submit and post such files). Yes ý No o
Indicate by check mark whether the registrant is a large accelerated filer, an accelerated filer, a non-accelerated filer, or a smaller reporting company. See the definitions of "large accelerated filer," "accelerated filer" and "smaller reporting company" in Rule 12b-2 of the Exchange Act.
Large accelerated filer o | Accelerated filer o | Non-accelerated filer ý (Do not check if a smaller reporting company) | Smaller reporting company o | |||
Indicate by check mark whether the registrant is a shell company (as defined in Rule 12b-2 of the Exchange Act). Yes o No ý
Indicate the number of shares outstanding of each of the issuer's classes of common stock, as of the latest practicable date.
Class | Outstanding at November 2, 2016 | |
Common Stock, $0.01 par value per share | 71,043,787 shares | |
TABLE OF CONTENTS | ||||
_______________________________________________________________________________
Presentation of Information
Unless the context requires otherwise, references to "GCP Applied Technologies Inc.", "GCP", "we", "us", "our" and "the Company" refer to GCP Applied Technologies Inc., and its consolidated subsidiaries for periods subsequent to its separation from W.R. Grace & Co. on February 3, 2016. For periods prior to February 3, 2016, these terms refer to the combined historical business and operations of W.R. Grace & Co.’s construction products and packaging technologies businesses as they were historically managed as part of W.R. Grace & Co. Unless the context requires otherwise, references to "Grace" refer to W.R. Grace & Co., and its consolidated subsidiaries, which is the Company’s former parent company. References in this Quarterly Report on Form 10-Q to the "Separation" refer to the legal separation and transfer of Grace’s construction products and packaging technologies businesses to the Company through a dividend distribution of all of the then-outstanding common stock of GCP to Grace shareholders on February 3, 2016.
2
Forward-Looking Statements
This document contains, and our other public communications may contain, forward-looking statements, that is, information related to future, not past, events. Such statements generally include the words "believes," "plans," "intends," "targets," "will," "expects," "suggests," "anticipates," "outlook," "continues" or similar expressions. Forward-looking statements include, without limitation, expected financial positions; results of operations; cash flows; financing plans; business strategy; operating plans; capital and other expenditures; competitive positions; growth opportunities for existing products; benefits from new technology and cost reduction initiatives, plans and objectives; and markets for securities. Like other businesses, we are subject to risks and uncertainties that could cause our actual results to differ materially from our projections or that could cause other forward-looking statements to prove incorrect. Factors that could cause actual events to materially differ from those contained in the forward-looking statements include, without limitation: risks related to foreign operations, especially in emerging regions; the cost and availability of raw materials and energy; the effectiveness of GCP's research and development and growth investments; acquisitions and divestitures of assets and gains and losses from dispositions; developments affecting GCP’s outstanding indebtedness; developments affecting GCP's funded and unfunded pension obligations; GCP's legal and environmental proceedings; uncertainties related to the Company’s ability to realize the anticipated benefits of the separation transaction; the inability to establish or maintain certain business relationships and relationships with customers and suppliers or the inability to retain key personnel; costs of compliance with environmental regulation, and those factors set forth in our most recent Annual Report on Form 10-K, this Quarterly Report on Form 10-Q and Current Reports on Form 8-K, which have been filed with the Securities and Exchange Commission ("SEC") and are available on the Internet at www.sec.gov. Our reported results should not be considered as an indication of our future performance. Readers are cautioned not to place undue reliance on our projections and forward-looking statements, which speak only as of the date thereof. We undertake no obligation to publicly release any revisions to the projections and forward-looking statements contained in this document, or to update them to reflect events or circumstances occurring after the date of this document.
3
PART I. FINANCIAL INFORMATION
Item 1. Financial Statements
GCP Applied Technologies Inc.
Consolidated Statements of Operations (unaudited)
Three Months Ended September 30, | Nine Months Ended September 30, | ||||||||||||||
(In millions, except per share amounts) | 2016 | 2015 | 2016 | 2015 | |||||||||||
Net sales | $ | 342.5 | $ | 389.7 | $ | 1,022.9 | $ | 1,086.1 | |||||||
Cost of goods sold | 206.5 | 245.8 | 617.3 | 688.0 | |||||||||||
Gross profit | 136.0 | 143.9 | 405.6 | 398.1 | |||||||||||
Selling, general and administrative expenses | 75.0 | 72.9 | 220.4 | 217.5 | |||||||||||
Research and development expenses | 5.9 | 5.6 | 17.1 | 16.8 | |||||||||||
Interest expense and related financing costs | 18.8 | 0.3 | 49.0 | 1.1 | |||||||||||
Interest expense, net - related party | — | 0.3 | — | 0.7 | |||||||||||
Repositioning expenses | 5.3 | — | 14.3 | — | |||||||||||
Restructuring expenses | 0.4 | 2.3 | 1.4 | 9.9 | |||||||||||
Loss in Venezuela | — | 59.6 | — | 59.6 | |||||||||||
Other (income) expense, net | (0.5 | ) | 1.1 | 3.3 | 1.3 | ||||||||||
Total costs and expenses | 104.9 | 142.1 | 305.5 | 306.9 | |||||||||||
Income before income taxes | 31.1 | 1.8 | 100.1 | 91.2 | |||||||||||
Provision for income taxes | (9.6 | ) | (16.8 | ) | (29.8 | ) | (58.2 | ) | |||||||
Net income (loss) | 21.5 | (15.0 | ) | 70.3 | 33.0 | ||||||||||
Less: net income attributable to noncontrolling interests | (0.2 | ) | (0.3 | ) | (0.9 | ) | (0.6 | ) | |||||||
Net income (loss) attributable to GCP shareholders | $ | 21.3 | $ | (15.3 | ) | $ | 69.4 | $ | 32.4 | ||||||
Earnings Per Share Attributable to GCP Shareholders | |||||||||||||||
Basic earnings per share: | |||||||||||||||
Net income (loss) attributable to GCP shareholders | $ | 0.30 | $ | (0.22 | ) | $ | 0.98 | $ | 0.46 | ||||||
Weighted average number of basic shares | 71.0 | 70.5 | 70.8 | 70.5 | |||||||||||
Diluted earnings per share: | |||||||||||||||
Net income (loss) attributable to GCP shareholders | $ | 0.30 | $ | (0.22 | ) | $ | 0.97 | $ | 0.46 | ||||||
Weighted average number of diluted shares | 72.2 | 70.5 | 71.6 | 70.5 | |||||||||||
The Notes to Consolidated Financial Statements are an integral part of these statements.
4
GCP Applied Technologies Inc.
Consolidated Balance Sheets (unaudited)
(In millions, except par value and shares) | September 30, 2016 | December 31, 2015 | |||||
ASSETS | |||||||
Current Assets | |||||||
Cash and cash equivalents | $ | 148.5 | $ | 98.6 | |||
Trade accounts receivable, less allowance of $5.9 (2015—$6.2) | 244.0 | 203.6 | |||||
Inventories | 117.3 | 105.3 | |||||
Other current assets | 47.0 | 38.9 | |||||
Total Current Assets | 556.8 | 446.4 | |||||
Properties and equipment, net | 226.1 | 197.1 | |||||
Goodwill | 107.6 | 102.5 | |||||
Technology and other intangible assets, net | 34.8 | 33.3 | |||||
Deferred income taxes | 83.1 | 17.6 | |||||
Overfunded defined benefit pension plans | 24.4 | 26.1 | |||||
Other assets | 28.2 | 10.1 | |||||
Total Assets | $ | 1,061.0 | $ | 833.1 | |||
LIABILITIES AND STOCKHOLDERS' (DEFICIT) EQUITY | |||||||
Current Liabilities | |||||||
Debt payable within one year | $ | 23.2 | $ | 25.7 | |||
Accounts payable | 118.1 | 109.0 | |||||
Loans payable - related party | — | 42.3 | |||||
Other current liabilities | 133.0 | 125.5 | |||||
Total Current Liabilities | 274.3 | 302.5 | |||||
Debt payable after one year | 783.4 | — | |||||
Deferred income taxes | 9.1 | 8.7 | |||||
Unrecognized tax benefits | 11.6 | 5.2 | |||||
Underfunded and unfunded defined benefit pension plans | 82.8 | 34.0 | |||||
Other liabilities | 18.2 | 8.6 | |||||
Total Liabilities | 1,179.4 | 359.0 | |||||
Commitments and Contingencies - Note 7 | |||||||
Stockholders' (Deficit) Equity | |||||||
Net parent investment | — | 598.3 | |||||
Common stock issued, par value $0.01; 300,000,000 shares authorized; outstanding: 71,030,386 | 0.7 | — | |||||
Accumulated earnings | 3.6 | — | |||||
Accumulated other comprehensive loss | (124.8 | ) | (127.7 | ) | |||
Treasury stock | (1.8 | ) | — | ||||
Total GCP's Shareholders' (Deficit) Equity | (122.3 | ) | 470.6 | ||||
Noncontrolling interests | 3.9 | 3.5 | |||||
Total Stockholders' (Deficit) Equity | (118.4 | ) | 474.1 | ||||
Total Liabilities and Stockholders' (Deficit) Equity | $ | 1,061.0 | $ | 833.1 | |||
The Notes to Consolidated Financial Statements are an integral part of these statements.
5
GCP Applied Technologies Inc.
Consolidated Statements of Comprehensive Income (Loss) (unaudited)
Three Months Ended September 30, | Nine Months Ended September 30, | ||||||||||||||
(In millions) | 2016 | 2015 | 2016 | 2015 | |||||||||||
Net income (loss) | $ | 21.5 | $ | (15.0 | ) | $ | 70.3 | $ | 33.0 | ||||||
Other comprehensive income (loss): | |||||||||||||||
Defined benefit pension and other postretirement plans, net of income taxes | — | — | (0.5 | ) | — | ||||||||||
Currency translation adjustments | 3.0 | (19.7 | ) | 3.5 | (39.1 | ) | |||||||||
(Loss) gain from hedging activities, net of income taxes | (0.1 | ) | 0.2 | (0.1 | ) | 0.2 | |||||||||
Total other comprehensive (loss) income attributable to noncontrolling interests | — | (0.5 | ) | 0.2 | (0.3 | ) | |||||||||
Total other comprehensive income (loss) | 2.9 | (20.0 | ) | 3.1 | (39.2 | ) | |||||||||
Comprehensive income (loss) | 24.4 | (35.0 | ) | 73.4 | (6.2 | ) | |||||||||
Less: Comprehensive (income) loss attributable to noncontrolling interests | (0.2 | ) | 0.2 | (1.1 | ) | (0.3 | ) | ||||||||
Comprehensive income (loss) attributable to GCP shareholders | $ | 24.2 | $ | (34.8 | ) | $ | 72.3 | $ | (6.5 | ) | |||||
The Notes to Consolidated Financial Statements are an integral part of these statements.
6
GCP Applied Technologies Inc.
Consolidated Statements of (Deficit) Equity (unaudited)
(In millions) | Common Stock | Accumulated Earnings (Deficit) | Treasury Stock | Net Parent Investment | Accumulated Other Comprehensive Loss | Noncontrolling Interests | Total Equity (Deficit) | ||||||||||||||||||||
Balance, December 31, 2014 | $ | — | $ | — | $ | — | $ | 670.6 | $ | (66.0 | ) | $ | 2.8 | $ | 607.4 | ||||||||||||
Net income | — | — | — | 32.4 | — | 0.6 | 33.0 | ||||||||||||||||||||
Other comprehensive loss | — | — | — | — | (38.9 | ) | (0.3 | ) | (39.2 | ) | |||||||||||||||||
Net transfer from parent | — | — | — | (96.1 | ) | — | — | (96.1 | ) | ||||||||||||||||||
Balance, September 30, 2015 | $ | — | $ | — | $ | — | $ | 606.9 | $ | (104.9 | ) | $ | 3.1 | $ | 505.1 | ||||||||||||
Balance, December 31, 2015 | $ | — | $ | — | $ | — | $ | 598.3 | $ | (127.7 | ) | $ | 3.5 | $ | 474.1 | ||||||||||||
Net income | — | 62.2 | — | 7.2 | — | 0.9 | 70.3 | ||||||||||||||||||||
Net transfer to parent | — | — | — | (672.2 | ) | — | — | (672.2 | ) | ||||||||||||||||||
Reclassification of net parent investment in connection with Separation | 0.7 | (67.4 | ) | — | 66.7 | — | — | — | |||||||||||||||||||
Share based compensation | — | 4.7 | — | — | — | — | 4.7 | ||||||||||||||||||||
Exercise of stock options | — | 4.1 | — | — | — | — | 4.1 | ||||||||||||||||||||
Treasury stock purchased under GCP 2016 Stock Incentive Plan | — | — | (1.8 | ) | — | — | — | (1.8 | ) | ||||||||||||||||||
Other comprehensive income | — | — | — | — | 2.9 | 0.2 | 3.1 | ||||||||||||||||||||
Noncontrolling interest dividend | — | — | — | — | — | (0.7 | ) | (0.7 | ) | ||||||||||||||||||
Balance, September 30, 2016 | $ | 0.7 | $ | 3.6 | $ | (1.8 | ) | $ | — | $ | (124.8 | ) | $ | 3.9 | $ | (118.4 | ) | ||||||||||
The Notes to Consolidated Financial Statements are an integral part of these statements.
7
GCP Applied Technologies Inc.
Consolidated Statements of Cash Flows (unaudited)
Nine Months Ended September 30, | |||||||
(In millions) | 2016 | 2015 | |||||
OPERATING ACTIVITIES | |||||||
Net income | $ | 70.3 | $ | 33.0 | |||
Reconciliation to net cash provided by operating activities: | |||||||
Depreciation and amortization | 27.0 | 24.4 | |||||
Amortization of debt discount and financing costs | 2.0 | — | |||||
Stock-based compensation expense | 5.0 | 2.8 | |||||
Gain on termination and curtailment of pension and other postretirement plans | (2.6 | ) | — | ||||
Currency and other losses in Venezuela | 4.2 | 73.2 | |||||
Deferred income taxes | 2.2 | (7.3 | ) | ||||
Excess tax benefits from stock-based compensation | — | (2.8 | ) | ||||
Loss on disposal of property and equipment | 0.5 | 3.9 | |||||
Changes in assets and liabilities, excluding effect of currency translation: | |||||||
Trade accounts receivable | (37.0 | ) | (51.7 | ) | |||
Inventories | (10.9 | ) | (13.2 | ) | |||
Accounts payable | 9.4 | 17.1 | |||||
Pension assets and liabilities, net | 3.4 | (0.6 | ) | ||||
Other assets and liabilities, net | (0.5 | ) | 23.1 | ||||
Net cash provided by operating activities | 73.0 | 101.9 | |||||
INVESTING ACTIVITIES | |||||||
Capital expenditures | (33.3 | ) | (26.2 | ) | |||
Receipt of payment on loan from related party | — | 40.0 | |||||
Other investing activities | 0.5 | 0.4 | |||||
Net cash (used in) provided by investing activities | (32.8 | ) | 14.2 | ||||
FINANCING ACTIVITIES | |||||||
Borrowings under credit arrangements | 294.3 | 27.6 | |||||
Repayments under credit arrangements | (30.7 | ) | (41.0 | ) | |||
Borrowings under related party loans | — | 2.1 | |||||
Repayments under related party loans | — | (5.9 | ) | ||||
Proceeds from issuance of bonds | 525.0 | — | |||||
Cash paid for debt financing costs | (18.2 | ) | — | ||||
Share repurchase under GCP 2016 Stock Incentive Plan | (1.8 | ) | — | ||||
Proceeds from exercise of stock options | 3.8 | — | |||||
Excess tax benefits from stock-based compensation | — | 2.8 | |||||
Noncontrolling interest dividend | (0.7 | ) | — | ||||
Transfers to parent, net | (764.6 | ) | (69.6 | ) | |||
Net cash provided by (used in) financing activities | 7.1 | (84.0 | ) | ||||
Effect of currency exchange rate changes on cash and cash equivalents | 2.6 | (53.1 | ) | ||||
Increase (decrease) in cash and cash equivalents | 49.9 | (21.0 | ) | ||||
Cash and cash equivalents, beginning of period | 98.6 | 120.9 | |||||
Cash and cash equivalents, end of period | $ | 148.5 | $ | 99.9 | |||
The Notes to Consolidated Financial Statements are an integral part of these statements.
8
Notes to Consolidated Financial Statements
1. Basis of Presentation and Summary of Significant Accounting and Financial Reporting Policies
On January 27, 2016, GCP entered into a Separation and Distribution Agreement pursuant to which Grace agreed to transfer its Grace Construction Products operating segment and the packaging technologies business, operated under the “Darex” name, of its Grace Materials Technologies operating segment to GCP (the "Separation"). The Separation occurred on February 3, 2016, by means of a pro rata distribution to Grace stockholders of all of the then-outstanding shares of Company common stock (the "Distribution"). Under the Distribution, one share of Company common stock was distributed for each share of Grace common stock held by Grace stockholders of record as of the close of business on January 27, 2016. No fractional shares were distributed. As a result of the Distribution, GCP is now an independent public company and its common stock is listed under the symbol "GCP" on the New York Stock Exchange.
GCP is engaged in the production and sale of specialty construction chemicals, specialty building materials, and packaging products through three operating segments. Specialty Construction Chemicals ("SCC") manufactures and markets concrete admixtures and cement additives. Specialty Building Materials ("SBM") manufactures and markets sheet and liquid membrane systems that protect structures from water, air and vapor penetration, fireproofing and other products designed to protect the building envelope. Darex Packaging Technologies ("Darex") manufactures and markets packaging materials for use in beverage and food containers, industrial containers and other consumer and industrial applications.
Prior to the Separation, the Company operated as the Grace Construction Products operating segment and the Darex Packaging Technologies business of W.R. Grace & Co.
The Separation was completed pursuant to various agreements with Grace related to the Separation. These agreements govern the relationship between GCP and Grace following the Separation and provided for the allocation of various assets, liabilities, rights and obligations. These agreements also include arrangements for transition services to be provided on a temporary basis by both parties.
Basis of Presentation
The financial statements for periods prior to the Separation have been prepared on a stand-alone basis and are derived from the consolidated financial statements and accounting records of Grace, as the Company's business operated as a combination of entities under common control of Grace. These financial statements reflect the historical basis and carrying values established when the Company was part of Grace. Subsequent to the Separation, the accompanying Consolidated Financial Statements are presented on a consolidated basis and include all of the accounts and operations of GCP and its majority-owned subsidiaries. The financial statements reflect the financial position, results of operations and cash flows of GCP in accordance with generally accepted accounting principles in the United States of America ("GAAP") and with the instructions to Form 10-Q and Article 10 of SEC Regulation S-X for interim financial information.
The interim financial statements presented herein are unaudited and should be read in conjunction with the Combined Financial Statements presented in the Company's 2015 Annual Report on Form 10-K. Such financial statements reflect all adjustments that, in the opinion of management, are necessary for a fair statement of the results of the interim periods presented; all such adjustments are of a normal recurring nature except for the impacts of adopting new accounting standards as discussed below. All significant intercompany accounts and transactions have been eliminated. The results of operations for the nine-month interim period ended September 30, 2016 are not necessarily indicative of the results of operations for the year ending December 31, 2016.
All transactions between GCP and Grace have been included in these financial statements. Prior to the Separation, all such transactions, other than intercompany loan transactions, are effectively considered to be settled for cash, in the Combined Financial Statements at the time the transactions were recorded. The intercompany loans payable to Grace and the related interest and cash flows, as presented in Note 3 are reflected as "Borrowings under related party loans" and "Repayments under related party loans" in the Statements of Cash Flows, as "Loans payable-related party" in the Balance Sheets and as "Interest expense, net-related party" in the Statements of Operations. Subsequent to the Separation, Grace is no longer a related party of the Company.
9
Prior to the Separation, the financial statements included expenses of Grace allocated to GCP for certain functions provided by Grace, including, but not limited to, general corporate expenses related to finance, legal, information technology, human resources, communications, ethics and compliance, environment health and safety, supply chain, shared services, employee benefits and incentives, insurance and stock-based compensation. These expenses were allocated to GCP on the basis of direct usage when identifiable, with the remainder allocated on the basis of revenue, headcount or other measures. These cost allocations were included in selling, general and administrative expenses in the Statement of Operations. Most of these costs were included in segment operating income with only a portion included in corporate costs. Both GCP and Grace consider the basis on which the expenses have been allocated to be a reasonable reflection of the utilization of services provided to, or the benefit received by, GCP during the periods presented.
Subsequent to the Separation, GCP has performed most of these functions using its own resources or purchased services. However, the remainder of these functions will continue to be provided by Grace under a transition services agreement, for a period generally up to 18 months from the Separation. See Note 12 for further description of the transition services agreement between GCP and Grace.
Prior to the Separation, the financial statements also included the assets and liabilities that were historically held at the Grace corporate level but were specifically identifiable or otherwise pushed down to GCP. The cash and cash equivalents held by Grace at the corporate level were not specifically identifiable to GCP and therefore were not allocated to GCP for any of the periods presented. Prior to the Separation, cash and cash equivalents in the Balance Sheets represent primarily cash held locally by entities included in the financial statements. Third-party debt and the related interest expense of Grace were not allocated to GCP for any of the periods presented as GCP was not the legal obligor of the debt and the Grace borrowings were not directly attributable to GCP's business.
The financial statements exclude all assets, liabilities, income, gains, costs and expenses reported by Grace related to asbestos and bankruptcy matters. Prior to the Separation, these matters were not allocated to GCP as Grace was the legal obligor for those liabilities and Grace is expected to pay all future liabilities and costs related to such matters as such matters were not historically managed by GCP. Grace retained full responsibility for these matters following the Separation and GCP has not indemnified Grace for any losses or payments associated with these matters.
Prior to the Separation, Grace used a centralized approach to cash management and financing of its operations and Grace funded GCP's operating and investing activities as needed. Prior to the Separation, cash transfers to and from the cash management accounts of Grace are reflected in the Statements of Cash Flows as “Transfers (to) from parent, net.”
Use of Estimates The preparation of financial statements in conformity with GAAP requires management to make estimates and assumptions that affect the reported amount of assets and liabilities and disclosure of contingent assets and liabilities at the date of the Consolidated Financial Statements, and the reported amounts of revenues and expenses for the periods presented. Actual amounts could differ from those estimates, and the differences could be material. Changes in estimates are recorded in the period identified. GCP's accounting measurements that are most affected by management's estimates of future events are:
•Contingent liabilities, which depend on an assessment of the probability of loss and an estimate of ultimate resolution cost, that may arise from circumstances such as legal disputes, environmental remediation, product liability claims, material commitments (see Note 7 to the Consolidated Financial Statements) and income taxes (see Note 4 to the Consolidated Financial Statements);
•Pension and postretirement liabilities that depend on assumptions regarding participant life spans, future inflation, discount rates and total returns on invested funds (see Note 5 to the Consolidated Financial Statements); and
•Realization values of net deferred tax assets, which depend on projections of future taxable income (see Note 4 to the Consolidated Financial Statements).
10
Reclassifications Certain amounts in prior period financial statements have been reclassified to conform to the current period presentation. Such reclassifications have not materially affected previously reported amounts.
Certain amounts within "Net cash provided by operating activities" in the Company’s Consolidated Statement of Cash Flows for the nine months ended September 30, 2015 have been reclassified to conform to current period presentation. These reclassifications had no effect on the previously reported cash flows from operating, investing and financing activities.
Income Tax As a global enterprise, GCP is subject to a complex array of tax regulations and must make assessments of applicable tax law and judgments in estimating its ultimate income tax liability.
In the financial statements for periods prior to the Separation, income tax expense and tax balances were calculated using the separate return method as if GCP was a separate taxpayer, although GCP was included in tax returns filed by Grace. After the Separation, income tax expense and income tax balances represent GCP’s federal, state and foreign income taxes as an independent company.
As a stand-alone entity, GCP will file tax returns on its own behalf and its deferred taxes and effective tax rate may not be comparable to those of historical periods prior to the Separation.
See Note 4 for details regarding estimates used in accounting for income tax matters including unrecognized tax benefits.
Stock-Based Compensation Expense Prior to the Separation, GCP was allocated stock-based compensation expense from Grace related to GCP employees receiving awards denominated in Grace equity instruments. In accordance with an employee matters agreement entered into between Grace and GCP on January 27, 2016 in connection with the Separation (the "Employee Matters Agreement"), previously outstanding stock-based compensation awards granted under Grace's equity compensation programs prior to the Separation and held by certain executives and employees of GCP and Grace were adjusted to reflect the impact of the Separation on these awards. To preserve the aggregate intrinsic value of these stock-based compensation awards, as measured immediately before and immediately after the Separation, each holder of Grace stock-based compensation awards generally received an adjusted award consisting of either (i) both a stock-based compensation award denominated in Grace equity as it existed subsequent to the Separation and a stock-based compensation award denominated in GCP equity or (ii) solely a stock-based compensation award denominated in the equity of the company at which the person was employed following the Separation. In the Separation, the determination as to which type of adjustment applied to a holder’s previously outstanding Grace award was based upon the type of stock-based compensation award that was to be adjusted and the date on which the award was originally granted under the Grace equity compensation programs prior to the Separation. Under the Employee Matters Agreement, GCP retains certain obligations related to all stock- and cash-settled stock-based compensation awards denominated in GCP equity, regardless of whether the holder is a GCP or Grace employee. Following the Separation, the Company records stock-based compensation expense for equity awards in accordance with authoritative accounting guidance.
Currency Translation Assets and liabilities of foreign subsidiaries (other than those located in countries with highly inflationary economies) are translated into U.S. dollars at current exchange rates, while revenues, costs and expenses are translated at average exchange rates during each reporting period. The resulting currency translation adjustments are included in accumulated other comprehensive loss in the Consolidated Balance Sheets. The financial statements of any subsidiaries located in countries with highly inflationary economies are remeasured as if the functional currency were the U.S. dollar; the remeasurement creates translation adjustments that are reflected in net income in the Consolidated Statements of Operations.
11
Effective January 1, 2010, GCP began to account for its Venezuela subsidiary as a highly inflationary economy. As a result, the functional currency of its Venezuelan subsidiary became the U.S. dollar; therefore, all translation adjustments are reflected in net income in the accompanying Consolidated Statements of Operations. The official exchange rate (CENCOEX) of 4.3 was used to remeasure GCP's financial statements from bolivars to U.S. dollars upon Venezuela's designation as a highly inflationary economy. On February 8, 2013, the Venezuelan government announced that, effective February 13, 2013, the official exchange rate of the bolivar to U.S. dollar would devalue from 4.3 to 6.3. GCP continued to account for its results in Venezuela at the official exchange rate of 6.3 bolivars to one U.S. dollar until September 30, 2015. Based on developments in the third quarter of 2015, including changed expectations about GCP's ability to import raw materials into Venezuela at the official exchange rate and increased inflation, the Company determined that it was no longer appropriate to use the official exchange rate. Effective September 30, 2015, the Company began accounting for its results in Venezuela at the SIMADI rate. The Company recorded a pre-tax charge of $73.2 million in the third quarter of 2015 to reflect the devaluation of monetary assets and the impairment of non-monetary assets at the SIMADI rate of 199 bolivars to one U.S. dollar. We recorded $13.7 million of this amount related to inventory to cost of goods sold and $59.6 million related to other assets and liabilities as a separate line item in our Consolidated Statement of Operations, referred to as "Loss in Venezuela."
In mid-February 2016, changes to the currency exchange systems were announced that eliminated the SICAD exchange rate and replaced the name SIMADI rate with DICOM, a floating exchange rate. The DICOM rate of 654 bolivars to one U.S. dollar at September 30, 2016 has increased approximately 230% from the rate at December 31, 2015. Accordingly, the Company has recorded a $4.2 million loss within "Other (income) expense, net" in its Consolidated Statement of Operations for the nine months ended September 30, 2016 to reflect the remeasurement of its Venezuela subsidiary's financial statements to U.S. dollars.
Recently Issued Accounting Standards
Statement of Cash Flows
In August 2016, the Financial Accounting Standards Board ("FASB") issued Accounting Standards Update ("ASU") 2016-15, Statement of Cash Flows (Topic 230): Classification of Certain Cash Receipts and Payments, which addresses eight specific cash flow presentation issues with the objective of reducing existing diversity in practice. ASU 2016-15 is effective for the Company on January 1, 2018 and requires a retrospective approach to adoption. GCP is currently evaluating the potential impact on its Consolidated Financial Statements and related disclosures.
Revenue from Contracts with Customers
In May 2016, the FASB issued ASU 2016-12, Narrow-Scope Improvements and Practical Expedients, which clarifies aspects of ASU 2014-09, Revenue from Contracts with Customers (Topic 606), including non-cash consideration, and provides a practical expedient for reflecting contract modifications upon transition. The Company is currently evaluating the impact of adopting ASU 2016-12, which will occur in conjunction with its adoption of the new revenue recognition standard promulgated in Topic 606. ASU 2014-09 is effective for the Company on January 1, 2018, with early adoption permitted as of January 1, 2017, and requires either a retrospective or a modified retrospective approach to adoption. GCP is currently evaluating the available transition methods and the potential impact of the new revenue recognition standard on its Consolidated Financial Statements and related disclosures.
In April 2016, the FASB issued ASU 2016-10, Identifying Performance Obligations and Licensing, which clarifies aspects of ASU 2014-09 pertaining to the identification of performance obligations and the licensing implementation guidance, while retaining the core principles for those areas. GCP is currently evaluating the impact of adopting ASU 2016-10, which will occur in conjunction with its adoption of Topic 606.
In March 2016, the FASB issued ASU 2016-08, Principal Versus Agent Considerations (Reporting Revenue Gross Versus Net), which amends the principal-versus-agent implementation guidance in Topic 606 and will affect whether an entity reports revenue on a gross or net basis. GCP is currently evaluating the impact of adopting ASU 2016-08, which will occur in conjunction with its adoption of Topic 606.
12
Leases
In February 2016, the FASB issued ASU 2016-02, Leases (Topic 842), which is intended to increase transparency and comparability among organizations by recognizing lease assets and lease liabilities on the balance sheet and disclosing key information about leasing arrangements. The core principle of Topic 842 is that a lessee should recognize the assets and liabilities that arise from leases. A lessee should recognize in the statement of financial position a liability to make lease payments (the lease liability) and a right-of-use asset representing its right to use the underlying asset for the lease term, including optional payments where they are reasonably certain to occur. The amendments in this update are effective for fiscal years beginning after December 15, 2018, including interim periods within those fiscal years, with early adoption permitted. GCP is currently evaluating the potential impact on its Consolidated Financial Statements and related disclosures.
Recently Adopted Accounting Standards
Accounting for Stock Compensation
In March 2016, the FASB issued ASU 2016-09, Compensation - Stock Compensation (Topic 718): Improvements to Employee Share-Based Payment Accounting. The updated standard is intended to simplify several areas of accounting for share-based compensation arrangements, including the income tax impact, classification on the statement of cash flows and forfeitures.
The update requires that excess tax benefits and deficiencies be recorded in the income statement when the awards vest or are settled. It also eliminates the requirement that excess tax benefits be realized (reduce cash taxes payable) before being recognized. Previously, an entity could not recognize excess tax benefits if the tax deduction increased a net operating loss ("NOL") or tax credit carryforward. The updated standard no longer requires cash flows related to excess tax benefits to be presented as a financing activity separate from other income tax cash flows. The update also allows entities to repurchase more of an employee's shares for tax withholding purposes without triggering liability accounting, clarifies that all cash payments to taxing authorities made on an employee's behalf for withheld shares should be presented as a financing activity on the statement of cash flows, and provides for an accounting policy election to account for forfeitures as they occur. The update is effective for annual periods beginning after December 15, 2016, and interim periods within those annual periods, with early adoption permitted.
GCP elected to early adopt this update in the 2016 third quarter and now recognizes excess tax benefits in the provision for income taxes rather than paid-in capital. Adoption of the update resulted in the recognition of excess tax benefits in the provision for income taxes of $0.8 million, $0.2 million and $0.9 million for the three month periods ended March 31, 2016, June 30, 2016 and September 30, 2016, respectively; $1.0 million for the six months ended June 30, 2016; and $1.9 million for the nine months ended September 30, 2016.
GCP has elected to continue to estimate forfeitures expected to occur to determine the amount of compensation expense to be recognized each period.
The presentation requirements for cash flows related to excess tax benefits resulted in an increase in cash provided by operating activities of $0.8 million and $1.0 million (with a corresponding reduction of cash provided by financing activities) for the three months ended March 31, 2016 and the six months ended June 30, 2016, respectively.
The tables below summarize the effects of the adoption of this update on GCP's previously reported results for the 2016 first and second quarters and for the six months ended June 30, 2016.
13
Consolidated Statement of Operations
Three Months Ended March 31, 2016 | Three Months Ended June 30, 2016 | Six Months Ended June 30, 2016 | |||||||||||||||||||||||||||||||||
(In millions, except per share amounts) | Previously Reported | Revised | Effect of Change | Previously Reported | Revised | Effect of Change | Previously Reported | Revised | Effect of Change | ||||||||||||||||||||||||||
Provision for income taxes | $ | (8.4 | ) | $ | (7.6 | ) | $ | 0.8 | $ | (12.8 | ) | $ | (12.6 | ) | $ | 0.2 | $ | (21.2 | ) | $ | (20.2 | ) | $ | 1.0 | |||||||||||
Net income | 17.4 | 18.2 | 0.8 | 30.4 | 30.6 | 0.2 | 47.8 | 48.8 | 1.0 | ||||||||||||||||||||||||||
Net income attributable to GCP shareholders | 17.0 | 17.8 | 0.8 | 30.1 | 30.3 | 0.2 | 47.1 | 48.1 | 1.0 | ||||||||||||||||||||||||||
Basic earnings per share: | |||||||||||||||||||||||||||||||||||
Net income attributable to GCP shareholders | $ | 0.24 | $ | 0.25 | $ | 0.01 | $ | 0.43 | $ | 0.43 | $ | — | $ | 0.67 | $ | 0.68 | $ | 0.01 | |||||||||||||||||
Diluted earnings per share: | |||||||||||||||||||||||||||||||||||
Net income attributable to GCP shareholders | $ | 0.24 | $ | 0.25 | $ | 0.01 | $ | 0.42 | $ | 0.42 | $ | — | $ | 0.66 | $ | 0.67 | $ | 0.01 | |||||||||||||||||
Weighted average number of diluted shares | 70.9 | 70.9 | — | 71.4 | 71.7 | 0.3 | 71.2 | 71.3 | 0.1 | ||||||||||||||||||||||||||
Consolidated Statement of Cash Flows
Three Months Ended March 31, 2016 | Six Months Ended June 30, 2016 | ||||||||||||||||||||||
(In millions) | Previously Reported | Revised | Effect of Change | Previously Reported | Revised | Effect of Change | |||||||||||||||||
Net cash provided by operating activities | $ | 23.7 | $ | 24.5 | $ | 0.8 | $ | 52.0 | $ | 53.0 | $ | 1.0 | |||||||||||
Net cash provided by financing activities | 15.6 | 14.8 | (0.8 | ) | 9.2 | 8.2 | (1.0 | ) | |||||||||||||||
2. Inventories
Inventories are stated at the lower of cost or market, GCP determines cost using the first-in, first-out ("FIFO") methodology. Inventories presented on GCP's Consolidated Balance Sheets consisted of the following:
(In millions) | September 30, 2016 | December 31, 2015 | |||||
Raw materials | $ | 46.7 | $ | 39.1 | |||
In process | 6.4 | 6.2 | |||||
Finished products and other | 64.2 | 60.0 | |||||
Total inventories | $ | 117.3 | $ | 105.3 | |||
Included above as "other" within "Finished products and other" are finished products purchased rather than produced by GCP of $10.2 million and $8.6 million as of September 30, 2016 and December 31, 2015, respectively.
14
3. Debt and Other Financial Instruments
Components of Debt
__________________________
(In millions) | September 30, 2016 | December 31, 2015 | |||||
9.5% Senior Notes due 2023, net of unamortized debt issuance costs of $7.5 at September 30, 2016 | $ | 517.5 | $ | — | |||
Term Loan due 2022, net of unamortized discount of $2.5 and unamortized debt issuance costs of $4.5 at September 30, 2016(1) | 266.6 | — | |||||
Related party | — | 42.3 | |||||
Other borrowings(2) | 22.5 | 25.7 | |||||
Total debt | 806.6 | 68.0 | |||||
Less debt payable within one year | 23.2 | 68.0 | |||||
Debt payable after one year | $ | 783.4 | $ | — | |||
Weighted average interest rates on related party debt | — | % | 3.3 | % | |||
Weighted average interest rates on total debt | 7.6 | % | 11.9 | % | |||
(1) | Interest at LIBOR +325 bps with a 75 bps LIBOR floor at September 30, 2016. |
(2) | Represents borrowings under various lines of credit and other borrowings, primarily by non-U.S. subsidiaries. |
The principal maturities of debt outstanding (net of unamortized discounts and debt issuance costs) at September 30, 2016, were as follows:
(In millions) | |||
2016 | $ | 17.7 | |
2017 | 6.4 | ||
2018 | 3.4 | ||
2019 | 3.4 | ||
2020 | 3.4 | ||
Thereafter | 772.3 | ||
Total debt | $ | 806.6 | |
Credit Agreement
On February 3, 2016, GCP entered into a credit agreement (the “Credit Agreement”) that provides for new senior secured credit facilities (the “Credit Facilities”) in an aggregate principal amount of $525.0 million, consisting of:
(a) | term loan (the “Term Loan”) in an aggregate principal amount of $275.0 million maturing in 2022; and |
(b) | $250.0 million revolving credit facility (the "Revolving Loan") due in 2021. |
The Term Loan principal balance is scheduled to be repaid in equal quarterly installments in aggregate annual amounts equal to 1.0% of the original principal amount.
The Credit Agreement contains customary affirmative covenants, including, but not limited to (i) maintenance of legal existence and compliance with laws and regulations; (ii) delivery of consolidated financial statements and other information; (iii) payment of taxes; (iv) delivery of notices of defaults and certain other material events; and (v) maintenance of adequate insurance. The Credit Agreement also contains customary negative covenants, including but not limited to restrictions on (i) dividends on, and redemptions of, equity interests and other restricted payments; (ii) liens; (iii) loans and investments; (iv) the sale, transfer or disposition of assets and businesses; (vi) transactions with affiliates; and (vii) a maximum total leverage ratio. Certain debt covenants may restrict the entity's ability as it relates to dividends, acquisitions and other borrowings. The Credit Agreement
15
contains conditions that would require mandatory principal payments in advance of the maturity date of the Term Loan and Revolving Credit Facility; the Company was in compliance with all terms as of September 30, 2016.
Events of default under the Credit Agreement include, but are not limited to: (i) failure to pay principal, interest, fees or other amounts under the Credit Agreement when due, taking into account any applicable grace period; (ii) any representation or warranty proving to have been incorrect in any material respect when made; (iii) failure to perform or observe covenants or other terms of the Credit Agreement subject to certain grace periods; (iv) a cross-default and cross-acceleration with certain other material debt; (v) bankruptcy events; (vi) certain defaults under ERISA; and (vii) the invalidity or impairment of security interests. There are no events of default as of September 30, 2016.
The Credit Facilities are secured on a first priority basis by a perfected security interest in, and mortgages on, substantially all tangible and intangible personal property and material fee-owned real property (including properties in Chicago, Illinois and Mount Pleasant, Tennessee) of the Company, a pledge of 100% of the equity of each material U.S. subsidiary of the Company and 65% of the equity of the United Kingdom holding company.
On August 25, 2016, GCP refinanced the existing Credit Agreement with a syndicate of banks (the “Amended Credit Agreement”). The Amended Credit Agreement reduced the interest rate margins applicable to the Term Loan from base rate plus a margin of 3.5% or LIBOR plus a margin of 4.5% to a base rate plus a margin of 2.25% or LIBOR plus a margin of 3.25% at GCP’s option. The $274.3 million outstanding principal balance was replaced by a like aggregate $274.3 million principal balance with substantially similar terms to the Credit Agreement. In conjunction with the refinancing, the Company recognized accelerated amortization of $0.1 million for a portion of the associated previously deferred debt issuance costs and expensed $1.2 million of related third-party financing costs. These amounts are included in "Interest expense and related financing costs" in the Consolidated Statement of Operations for the three and nine months ended September 30, 2016.
The interest rate per annum applicable to the Revolving Loan is equal to, at GCP’s option, either a base rate plus a margin ranging from 0.5% to 1.0% or LIBOR plus a margin ranging from 1.5% to 2.0%, in either case based upon the total leverage ratio of GCP and its restricted subsidiaries. GCP had no outstanding draws on the Revolving Loan as of September 30, 2016; however, the available credit under that facility was reduced to $244.0 million by approximately $6 million in outstanding letters of credit.
Senior Notes
On January 27, 2016, GCP issued $525.0 million aggregate principal amount of 9.5% Senior Notes due 2023 (the “Notes”). Interest is payable semi-annually in arrears on February 1 and August 1 of each year, commencing on August 1, 2016.
The Notes were issued subject to covenants that limit the Company's and certain of its subsidiaries’ ability, subject to certain exceptions and qualifications, to (i) create or incur liens on assets, (ii) incur additional debt (iii) sell certain assets (iv) make certain investments and acquisitions, merge or sell or otherwise dispose of all or substantially all assets.
During the first quarter 2016, GCP incurred debt issuance costs relating to issuance of the Notes, Term Loan, and Revolving Loan of $8.0 million, $5.0 million and $5.2 million, respectively. GCP deducted the debt issuance costs relating to the Notes and the Term Loan from the carrying amounts presented on its Consolidated Balance Sheet and is amortizing those costs over the terms of the underlying obligations.
GCP classified debt issuance costs relating to the Revolving Loan in "Other assets" on its Consolidated Balance Sheet and is amortizing those costs over the term of the Revolving Loan. The unamortized portion of these costs as of September 30, 2016 was $4.5 million.
During the first quarter 2016, GCP used certain proceeds from the Notes and Credit Facilities to fund a distribution to Grace in an amount of $750.0 million related to the Separation. Approximately $50 million was retained to meet operating requirements and to pay fees associated with the debt financing and other post-Separation costs. Related party debt of approximately $42 million and related interest was settled with Grace in connection with the Separation.
16
Debt Fair Value
At September 30, 2016, the carrying amounts and fair values of GCP's debt were as follows:
September 30, 2016 | December 31, 2015 | ||||||||||||||
(In millions) | Carrying Amount | Fair Value | Carrying Amount | Fair Value | |||||||||||
9.5% Senior Notes due 2023 | $ | 517.5 | $ | 601.1 | $ | — | $ | — | |||||||
Term Loan due 2022 | 266.6 | 276.7 | — | — | |||||||||||
Other borrowings | 22.5 | 22.5 | 68.0 | 68.0 | |||||||||||
Total debt | $ | 806.6 | $ | 900.3 | $ | 68.0 | $ | 68.0 | |||||||
Fair value is determined based on Level 2 inputs, including expected future cash flows (discounted at market interest rates), estimated current market prices and quotes from financial institutions. The increase in fair value of the Notes since issuance was driven by favorable demands in the marketplace.
4. Income Taxes
The income tax provision for the three months ended September 30, 2016 and 2015 was $9.6 million and $16.8 million, respectively, representing effective tax rates of 30.9% and 933.3%, respectively. The income tax provision for the nine months ended September 30, 2016 and 2015 was $29.8 million and $58.2 million, respectively, representing effective tax rates of 29.8% and 63.8%, respectively. The decrease in our effective tax rate for the three and nine months ended September 30, 2016 compared to the same period in 2015 was primarily due to a 2015 repatriation of foreign earnings and the nondeductible loss in Venezuela recorded in the third quarter of 2015. The early adoption of ASU 2016-09 in 2016 reduced the effective tax rate for the three months ended September 30, 2016 by 2.9 percentage points, or $0.9 million, and for the nine months ended September 30, 2016 by 1.9 percentage points, or $1.9 million. The effects of early adoption of ASU 2016-09 are further discussed in Note 1.
As also discussed in Note 1, on February 3, 2016 the Separation of Grace and GCP was completed. In conjunction with the Separation, GCP has increased its deferred tax assets in the U.S. by approximately $77 million, which primarily relates to the step up in tax basis and transfer of a net pension liability.
In evaluating GCP's ability to realize its deferred tax assets, GCP considers all reasonably available positive and negative evidence, including recent earnings experience, expectations of future taxable income and the tax character of that income, the period of time over which the temporary differences become deductible and the carryforward and/or carryback periods available to GCP for tax reporting purposes in the related jurisdiction. In estimating future taxable income, GCP relies upon assumptions and estimates about future activities, including the amount of future federal, state and foreign pretax operating income that GCP will generate; the reversal of temporary differences; and the implementation of feasible and prudent tax planning strategies. GCP records a valuation allowance to reduce deferred tax assets to the amount that it believes is more likely than not to be realized.
As of September 30, 2016, the Company has the intent and ability to indefinitely reinvest undistributed earnings of its foreign subsidiaries outside the United States.
In 2015, Grace repatriated a total of $173.1 million of foreign earnings from foreign subsidiaries transferred to GCP pursuant to the Separation. Such amount was determined based on an analysis of each non-U.S. subsidiary's requirements for working capital, debt repayment and strategic initiatives. In 2015, on a stand-alone basis (see Basis of Presentation), GCP incurred $19.9 million in tax expense as a result of such repatriation, increasing the Company's 2015 effective tax rate by 15.9 percentage points when compared to the U.S. federal statutory rate. The tax effect of the repatriation is determined by several variables including the tax rate applicable to the entity making the distribution, the cumulative earnings and associated foreign taxes of the entity and the extent to which those earnings may have already been taxed in the U.S.
17
GCP believes that the Separation is a one-time, non-recurring event and that recognition of deferred taxes of undistributed earnings during 2015 would not have occurred if not for the Separation. Subsequent to the Separation, GCP expects undistributed prior-year earnings of its foreign subsidiaries to remain permanently reinvested except in certain instances where repatriation of such earnings would result in minimal or no tax. GCP bases this assertion on:
(1) | the expectation that it will satisfy its U.S. cash obligations in the foreseeable future without requiring the repatriation of prior-year foreign earnings; |
(2) | plans for significant and continued reinvestment of foreign earnings in organic and inorganic growth initiatives outside the U.S.; and |
(3) | remittance restrictions imposed by local governments. |
GCP will continually analyze and evaluate its cash needs to determine the appropriateness of its indefinite reinvestment assertion.
In connection with the Separation, GCP and Grace entered into various agreements that govern the relationship between the parties going forward, including a tax matters agreement (the "Tax Sharing Agreement"). Under the Tax Sharing Agreement, which was entered into on the distribution date, GCP and Grace will indemnify and hold each other harmless in accordance with the principles outlined therein.
5. Pension Plans and Other Postretirement Benefit Plans
Multiemployer Benefit Plans Prior to the Separation, Grace sponsored funded and unfunded defined benefit pension and other postretirement benefit plans in which GCP employees and employees from other Grace businesses participated in (the “Shared Plans”). These Shared Plans were accounted for as multiemployer benefit plans. Accordingly, GCP did not record an asset or liability to recognize the funded status of these Shared Plans in the Balance Sheet prior to the Separation.
In the fourth quarter of 2015, in preparation for the Separation, certain international pension plans were legally separated resulting in an approximate $4 million increase to net pension liabilities. GCP recorded the funded status for these international plans as of December 31, 2015. During the first quarter of 2016, certain Shared Plans in the U.S. were legally separated, resulting in an approximate $44 million increase to net pension liabilities on the Consolidated Balance Sheet as of March 31, 2016. The funded status of these plans as of September 30, 2016 is included in the Net Funded Status table below.
GCP’s allocated pension expense for the Shared Plans was $2.8 million for the nine months ended September 30, 2015. The related expense for the nine months ended September 30, 2016 is included in the Components of Net Periodic Benefit Cost (Income) table below.
Postretirement Benefits Other Than Pensions Grace provided postretirement life insurance benefits for retired employees of certain U.S. business units and certain divested business units. GCP’s allocated income for these postretirement life insurance benefits plan was $1.2 million for the nine months ended September 30, 2015. In the first quarter of 2016, the postretirement life insurance benefits plan liability related to GCP employees who were participants in this plan at the time of Separation was legally transferred to GCP, resulting in an increase of $0.1 million to other liabilities. Additionally as part of the Separation, GCP assumed $0.8 million of prior service credit and $0.7 million of actuarial losses, both net of tax.
During the second quarter of 2016, GCP entered into an agreement to eliminate retiree life insurance benefits for one of its two remaining bargaining locations. This plan change was a negative plan amendment that resulted in a $1.0 million curtailment gain, which is recognized in operating income for the nine months ended September 30, 2016.
Pension Plans GCP sponsors certain defined benefit pension plans, primarily in the U.S. and the United Kingdom in which GCP employees participate. GCP records an asset or liability to recognize the funded status of these pension plans in its Consolidated Balance Sheets.
The Shared Plans that were legally separated during the first quarter of 2016, as discussed under "Multiemployer Benefit Plans" above, resulted in an approximate $44 million increase to pension liabilities as of March 31, 2016. Net funded status and net periodic benefit cost as of September 30, 2016 is shown below.
18
The following table presents the funded status of GCP's overfunded, underfunded and unfunded defined pension plans:
(In millions) | September 30, 2016 | December 31, 2015 | |||||
Overfunded defined benefit pension plans | $ | 24.4 | $ | 26.1 | |||
Underfunded defined benefit pension plans | (47.2 | ) | (8.0 | ) | |||
Unfunded defined benefit pension plans | (35.6 | ) | (26.0 | ) | |||
Total underfunded and unfunded defined benefit pension plans | (82.8 | ) | (34.0 | ) | |||
Pension liabilities included in other current liabilities | (1.2 | ) | (1.1 | ) | |||
Net funded status | $ | (59.6 | ) | $ | (9.0 | ) | |
Overfunded plans include several advance-funded plans for which the fair value of the plan assets exceeds the projected benefit obligation ("PBO"). This group of plans was overfunded by $24.4 million as of September 30, 2016, and the overfunded status is reflected as assets in "Overfunded defined benefit pension plans" in the Consolidated Balance Sheets. Underfunded plans include a group of advance-funded plans that are underfunded on a PBO basis. Unfunded plans include several plans that are funded on a pay-as-you-go basis, and therefore, the entire PBO is unfunded. As of September 30, 2016, the combined balance of $84.0 million for the underfunded and unfunded plans included as liabilities in the Consolidated Balance Sheets is comprised of current and non-current components of $1.2 million in "Other current liabilities" and $82.8 million in "Underfunded and unfunded defined benefit pension plans", respectively.
During the third quarter of 2016, GCP amended a pension plan at one non-U.S. location, resulting in a curtailment gain of $0.2 million. During the second quarter of 2016, GCP terminated a pension plan at one non-U.S. location, resulting in a curtailment gain of $1.4 million. For the nine months ended September 30, 2016, GCP recognized a total of $1.6 million in operating income relating to non-U.S. pension plan curtailment gains.
Components of Net Periodic Benefit Cost (Income)
Three Months Ended September 30, | |||||||||||||||||||||||
2016 | 2015 | ||||||||||||||||||||||
Pension | Other Post Retirement | Pension | Other Post Retirement | ||||||||||||||||||||
(In millions) | U.S. | Non-U.S. | U.S. | Non-U.S. | |||||||||||||||||||
Service cost | $ | 1.6 | $ | 0.8 | $ | — | $ | 0.1 | $ | 0.8 | $ | — | |||||||||||
Interest cost | 1.1 | 1.9 | — | 0.1 | 2.3 | — | |||||||||||||||||
Expected return on plan assets | (1.2 | ) | (2.1 | ) | — | (0.2 | ) | (2.8 | ) | — | |||||||||||||
Amortization of net deferred actuarial loss | — | — | 0.1 | — | — | — | |||||||||||||||||
Gain on termination and curtailment of pension and other postretirement plans | — | (0.2 | ) | — | — | — | — | ||||||||||||||||
Net periodic benefit cost (1) | $ | 1.5 | $ | 0.4 | $ | 0.1 | $ | — | $ | 0.3 | $ | — | |||||||||||
19
Nine Months Ended September 30, | |||||||||||||||||||||||
2016 | 2015 | ||||||||||||||||||||||
Pension | Other Post Retirement | Pension | Other Post Retirement | ||||||||||||||||||||
(In millions) | U.S. | Non-U.S. | U.S. | Non-U.S. | |||||||||||||||||||
Service cost | $ | 4.6 | $ | 2.5 | $ | — | $ | 0.2 | $ | 2.3 | $ | — | |||||||||||
Interest cost | 3.5 | 6.0 | — | 0.4 | 6.9 | — | |||||||||||||||||
Expected return on plan assets | (3.7 | ) | (6.6 | ) | — | (0.5 | ) | (8.3 | ) | — | |||||||||||||
Amortization of prior service (credit) cost | — | (0.1 | ) | — | 0.1 | — | |||||||||||||||||
Amortization of net deferred actuarial loss | — | — | 0.1 | — | — | — | |||||||||||||||||
Gain on termination and curtailment of pension and other postretirement plans | — | (1.6 | ) | (1.0 | ) | — | — | — | |||||||||||||||
Net periodic benefit cost (income)(1) | $ | 4.4 | $ | 0.3 | $ | (1.0 | ) | $ | 0.1 | $ | 1.0 | $ | — | ||||||||||
___________________________________
(1) | Includes expense that was allocated to Grace of $0.1 million for the nine months ended September 30, 2015. |
Plan Contributions and Funding GCP intends to satisfy its funding obligations under the U.S. qualified pension plans and to comply with all of the requirements of the Employee Retirement Income Security Act of 1974, as amended ("ERISA"). For ERISA purposes, funded status is calculated on a different basis than under GAAP. In March 2016, GCP made an accelerated contribution to the trusts that hold assets of the U.S. qualified pension plans of approximately $1 million.
GCP intends to fund non-U.S. pension plans based on applicable legal requirements as well as actuarial and trustee recommendations.
Defined Contribution Retirement Plan As part of the Separation, GCP established a defined contribution retirement plan for its employees in the United States, similar in design to the Grace defined contribution retirement plan. This plan is qualified under section 401(k) of the U.S. tax code. Currently, GCP contributes an amount equal to 100% of employee contributions, up to 6% of an individual employee's salary or wages. GCP's costs included in selling, general and administrative expenses related to this benefit plan for the three and nine months ended September 30, 2016 were $1.2 million and $3.4 million compared with GCP's allocation of the total cost related to this benefit plan of $1.2 million and $3.8 million for the corresponding prior-year periods.
6. Other Balance Sheet Accounts
________________________________
(In millions) | September 30, 2016 | December 31, 2015 | |||||
Other Current Liabilities | |||||||
Customer volume rebates | $ | 28.7 | $ | 33.5 | |||
Accrued compensation(1) | 37.0 | 27.1 | |||||
Income tax payable(2) | 14.8 | 23.3 | |||||
Accrued interest | 8.3 | 3.9 | |||||
Pension liabilities | 1.2 | 1.1 | |||||
Other accrued liabilities | 43.0 | 36.6 | |||||
Total other current liabilities | $ | 133.0 | $ | 125.5 | |||
(1) | Accrued compensation in the table above includes salaries and wages as well as estimated current amounts due under the annual and long-term incentive programs. |
(2) | Income tax items above do not include amounts due from/to Grace, which are reflected in other assets on the accompanying Consolidated Balance Sheets. |
20
7. Commitments and Contingent Liabilities
Purchase Commitments GCP uses purchase commitments to ensure supply and to minimize the volatility of certain key raw materials including lignins, polycarboxylates, amines and other materials. Such commitments are for quantities that GCP fully expects to use in its normal operations.
Guarantees and Indemnification Obligations GCP is a party to many contracts containing guarantees and indemnification obligations. These contracts primarily consist of:
• | Product warranties with respect to certain products sold to customers in the ordinary course of business. These warranties typically provide that products will conform to specifications. GCP accrues a general warranty liability at the time of sale based on historical experience and on a transaction-specific basis according to individual facts and circumstances. Both the liability and annual expense related to product warranties are immaterial to the Consolidated Financial Statements. |
• | Performance guarantees offered to customers. GCP has not established a liability for these arrangements based on past performance. |
• | Contracts providing for the sale of a former business unit or product line in which GCP has agreed to indemnify the buyer against liabilities arising prior to the closing of the transaction, including environmental liabilities. |
• | The Tax Sharing Agreement, which may require GCP, in certain circumstances, to indemnify Grace if the Separation, together with certain related transactions, does not qualify under Section 355 and certain other relevant provisions of the Internal Revenue Code (the "Code"). If GCP is required to indemnify Grace under the Tax Sharing Agreement, it could be subject to significant tax liabilities. |
Environmental Matters GCP is subject to loss contingencies resulting from extensive and evolving federal, state, local and foreign environmental laws and regulations relating to the generation, storage, handling, discharge, disposition and stewardship of hazardous wastes and other materials. GCP accrues for anticipated costs associated with response efforts where an assessment has indicated that a probable liability has been incurred and the cost can be reasonably estimated. As of September 30, 2016, GCP did not have any material environmental liabilities.
GCP's environmental liabilities are reassessed whenever circumstances become better defined or response efforts and their costs can be better estimated. These liabilities are evaluated based on currently available information, including the progress of remedial investigations at each site, the current status of discussions with regulatory authorities regarding the method and extent of remediation at each site, existing technology, prior experience in contaminated site remediation and the apportionment of costs among potentially responsible parties.
Financial Assurances Financial assurances have been established for a variety of purposes, including insurance and environmental matters and other matters. At September 30, 2016, GCP had gross financial assurances issued and outstanding of $6.0 million, composed of standby letters of credit.
Lawsuits and Investigations From time to time, GCP and its subsidiaries are parties to, or targets of, lawsuits, claims, investigations and proceedings which are managed and defended in the ordinary course of business. While GCP is unable to predict the outcome of these matters, it does not believe, based upon currently available facts, that the ultimate resolution of any of such pending matters will have a material adverse effect on its overall financial condition, results of operations or cash flows.
Accounting for Contingencies Although the outcome of each of the matters discussed above cannot be predicted with certainty, GCP has assessed its risk and has made accounting estimates and disclosures as required under GAAP.
21
8. Restructuring and Repositioning Expenses
Restructuring Expenses
GCP's Board of Directors approves all major restructuring programs that may involve the discontinuance of significant product lines or the shutdown of significant facilities. From time to time, GCP takes additional restructuring actions, including involuntary terminations that are not part of a major program. GCP accounts for these costs, which are reflected in restructuring expense in its Consolidated Statements of Operations, in the period that the related liabilities are incurred. Restructuring expenses are excluded from segment operating income.
For the third quarter of 2016, GCP incurred $0.4 million ($0.3 million in SCC and $0.1 million in SBM) of restructuring expenses, compared with $2.3 million ($1.3 million in SCC, $0.4 million in SBM and $0.6 million in Darex) for the prior-year quarter. GCP incurred $1.4 million ($0.8 million in SCC and $0.6 million in SBM) of restructuring expenses for the nine months ended September 30, 2016, compared with $9.9 million ($5.7 million in SCC, $2.7 million in SBM and $1.5 million in Darex) for the nine months ended September 30, 2015.
GCP had restructuring liabilities of $1.4 million as of September 30, 2016 and December 31, 2015, related to severance actions taken during the periods. GCP expects to pay substantially all costs related to its current restructuring programs by December 31, 2016.
Restructuring Liability (In millions) | Total | ||
Balance, December 31, 2015 | $ | 1.4 | |
Accruals for severance | 1.4 | ||
Payments | (2.8 | ) | |
Impact of foreign currency and other | 1.4 | ||
Balance, September 30, 2016 | $ | 1.4 | |
Repositioning Expenses
Post-Separation, GCP has incurred expenses related to its transition to a stand-alone public company. The Company expects to incur these repositioning expenses, ranging from $18.0 million to $20.0 million, within 18 months of the Separation. Repositioning expenses primarily relate to the following:
• | accounting, tax, legal and other professional costs pertaining to the Separation and establishment as a stand-alone public company; |
• | costs relating to information technology systems and marketing expense for repackaging and re-branding; |
• | employee-related costs that would not be incurred absent the Separation primarily relating to compensation, benefits, retention bonuses related to new or transitioning employees; and |
• | recruitment and relocation costs associated with hiring and relocating employees. |
Due to the scope and complexity of these activities, the range of estimated repositioning expenses could increase or decrease and the timing of incurrence could change.
For the three and nine months ended September 30, 2016, GCP incurred repositioning expenses as follows:
(In millions) | Three Months Ended September 30, 2016 | Nine Months Ended September 30, 2016 | |||||
Professional fees | $ | 3.1 | $ | 7.3 | |||
Software and IT implementation fees | 0.8 | 2.5 | |||||
Employee-related costs | 1.4 | 4.5 | |||||
Total | $ | 5.3 | $ | 14.3 | |||
22
GCP accounts for these costs, which are reflected in repositioning expense in the accompanying Consolidated Statements of Operations, in the period incurred. Substantially all of these costs have been or are expected to be settled in cash. Total cash payments for the nine months ended September 30, 2016 were $14.7 million for professional fees and employee-related costs, $5.7 million for capital expenditures and $6.9 million for taxes.
9. Other Comprehensive Income (Loss)
The following tables present the pre-tax, tax, and after-tax components of GCP's other comprehensive income (loss) for the three and nine months ended September 30, 2016 and 2015:
Three Months Ended September 30, 2016 | Pre-Tax Amount | Tax Benefit/ (Expense) | After-Tax Amount | ||||||||
(In millions) | |||||||||||
Defined benefit pension and other postretirement plans: | |||||||||||
Amortization of net actuarial gain | 0.1 | — | 0.1 | ||||||||
Other changes in funded status | $ | (0.1 | ) | $ | — | $ | (0.1 | ) | |||
Benefit plans, net | — | — | — | ||||||||
Currency translation adjustments | 3.0 | — | 3.0 | ||||||||
Loss from hedging activities | (0.1 | ) | — | (0.1 | ) | ||||||
Other comprehensive income attributable to GCP shareholders | $ | 2.9 | $ | — | $ | 2.9 | |||||
Nine Months Ended September 30, 2016 | Pre-Tax Amount | Tax Benefit/ (Expense) | After-Tax Amount | ||||||||
(In millions) | |||||||||||
Defined benefit pension and other postretirement plans: | |||||||||||
Amortization of net prior service credit | $ | (0.1 | ) | $ | — | $ | (0.1 | ) | |||
Amortization of net actuarial gain | 0.1 | — | 0.1 | ||||||||
Assumption of net prior service credit | 1.2 | (0.4 | ) | 0.8 | |||||||
Assumption of net actuarial loss | (1.1 | ) | 0.4 | (0.7 | ) | ||||||
Other changes in funded status | (0.9 | ) | 0.3 | (0.6 | ) | ||||||
Benefit plans, net | (0.8 | ) | 0.3 | (0.5 | ) | ||||||
Currency translation adjustments | 3.5 | — | 3.5 | ||||||||
Loss from hedging activities | (0.1 | ) | — | (0.1 | ) | ||||||
Other comprehensive income attributable to GCP shareholders | $ | 2.6 | $ | 0.3 | $ | 2.9 | |||||
Three Months Ended September 30, 2015 | Pre-Tax Amount | Tax Benefit/ (Expense) | After-Tax Amount | ||||||||
(In millions) | |||||||||||
Currency translation adjustments | $ | (19.7 | ) | $ | — | $ | (19.7 | ) | |||
Gain from hedging activities | 0.3 | (0.1 | ) | 0.2 | |||||||
Other comprehensive loss attributable to GCP shareholders | $ | (19.4 | ) | $ | (0.1 | ) | $ | (19.5 | ) | ||
Nine Months Ended September 30, 2015 | Pre-Tax Amount | Tax Benefit/ (Expense) | After-Tax Amount | ||||||||
(In millions) | |||||||||||
Defined benefit pension and other postretirement plans: | |||||||||||
Amortization of net prior service cost | $ | 0.1 | $ | (0.1 | ) | $ | — | ||||
Benefit plans, net | 0.1 | (0.1 | ) | — | |||||||
Currency translation adjustments | (39.1 | ) | — | (39.1 | ) | ||||||
Gain from hedging activities | 0.4 | (0.2 | ) | 0.2 | |||||||
Other comprehensive loss attributable to GCP shareholders | $ | (38.6 | ) | $ | (0.3 | ) | $ | (38.9 | ) | ||
23
The following tables present the changes in accumulated other comprehensive income (loss), net of tax, for the nine months ended September 30, 2016 and 2015:
Nine Months Ended September 30, 2016 | Defined Benefit Pension and Other Postretirement Plans | Currency Translation Adjustments | (Losses) Gains from Hedging Activities | Total | |||||||||||
(In millions) | |||||||||||||||
Beginning balance | $ | 0.1 | $ | (127.8 | ) | $ | — | $ | (127.7 | ) | |||||
Other comprehensive income (loss) before reclassifications | — | 3.5 | (1.2 | ) | 2.3 | ||||||||||
Amounts reclassified from accumulated other comprehensive (loss) income | (0.5 | ) | — | 1.1 | 0.6 | ||||||||||
Net current-period other comprehensive (loss) income | (0.5 | ) | 3.5 | (0.1 | ) | 2.9 | |||||||||
Ending balance | $ | (0.4 | ) | $ | (124.3 | ) | $ | (0.1 | ) | $ | (124.8 | ) | |||
Nine Months Ended September 30, 2015 | Defined Benefit Pension and Other Postretirement Plans | Currency Translation Adjustments | (Losses) Gains from Hedging Activities | Total | |||||||||||
(In millions) | |||||||||||||||
Beginning balance | $ | (0.3 | ) | $ | (65.5 | ) | $ | (0.2 | ) | $ | (66.0 | ) | |||
Other comprehensive (loss) income before reclassifications | — | (39.1 | ) | 0.4 | (38.7 | ) | |||||||||
Amounts reclassified from accumulated other comprehensive loss | — | — | (0.2 | ) | (0.2 | ) | |||||||||
Net current-period other comprehensive (loss) income | — | (39.1 | ) | 0.2 | (38.9 | ) | |||||||||
Ending balance | $ | (0.3 | ) | $ | (104.6 | ) | $ | — | $ | (104.9 | ) | ||||
GCP is a global enterprise operating in over 40 countries with local currency generally deemed to be the functional currency for accounting purposes. The currency translation adjustments reflect translation of the balance sheets valued in local currencies to the U.S. dollar as of the end of each period presented, and translation of revenues and expenses at average exchange rates for each period presented.
10. Stock Incentive Plans
GCP has provided certain key employees equity awards in the form of stock options, performance-based units (“PBUs”) and restricted share units (“RSUs”) under the GCP 2016 Stock Incentive Plan, which was adopted at Separation. Certain employees and members of the Board of Directors are eligible to receive stock-based compensation, including stock, stock options, RSUs, and PBUs.
Total cash and non-cash stock-based compensation cost included in the Consolidated Statements of Operations is $2.0 million for the three months ended September 30, 2016 and $0.9 million for the three months ended September 30, 2015. Total cash and non-cash stock-based compensation cost included in the Consolidated Statements of Operations is $5.6 million for the nine months ended September 30, 2016 and $2.8 million for the nine months ended September 30, 2015. Stock-based compensation expense prior to the Separation was allocated to GCP based on the portion of Grace’s equity compensation programs in which GCP employees participated.
24
In accordance with the Employee Matters Agreement, previously outstanding stock-based compensation awards granted under Grace’s equity compensation programs prior to the Separation and held by certain executives and employees of GCP and Grace were adjusted to reflect the impact of the Separation on these awards. To preserve the aggregate intrinsic value of Grace awards held prior to the Separation, as measured immediately before and immediately after the Separation, each holder of Grace stock-based compensation awards generally received an adjusted award consisting of either (i) both a stock-based compensation award denominated in Grace equity as it existed subsequent to the Separation and a stock-based compensation award denominated in GCP equity or (ii) solely a stock-based compensation award denominated in the equity of the company at which the person was employed following the Separation. In the Separation, the determination as to which type of adjustment applied to a holder’s previously outstanding Grace award was based upon the type of stock-based compensation award that was to be adjusted and the date on which the award was originally granted under the Grace equity compensation programs prior to the Separation. Adjusted awards consisting of stock-based compensation awards denominated in GCP equity are considered issued under the GCP 2016 Stock Incentive Plan. These adjusted awards generally will be subject to the same vesting conditions and other terms that applied to the original Grace award to which these adjusted awards relate, before the Separation.
Under the Employee Matters Agreement, GCP is obligated to settle all of the stock-based compensation awards denominated in GCP equity, regardless of whether the holders are employees of GCP or Grace. Likewise, Grace is obligated to settle all of the stock-based compensation awards denominated in Grace shares, regardless of whether the holders are employees of GCP or Grace. As a result, GCP has recorded a liability for cash-settled awards held by Grace employees. The adjustment of the original Grace awards that resulted in the issuance of GCP stock-based compensation awards resulted in an immaterial charge in the first quarter of 2016.
In accordance with certain provisions of the GCP 2016 Stock Incentive Plan, GCP repurchases shares issued to certain holders of GCP awards in order to fulfill statutory tax withholding requirements for the employee. In the nine months ended September 30, 2016, GCP repurchased approximately 96,270 shares under these provisions. These purchases are reflected as "Treasury stock purchased under 2016 Stock Incentive Plan" in the Consolidated Statement of (Deficit) Equity.
As of September 30, 2016, 1,641,952 shares of common stock were available for issuance under the GCP 2016 Stock Incentive Plan.
Stock Options
Stock options are non-qualified and are set at exercise prices not less than 100% of the market value on the date of grant (market value is the average of the high price and low price from that trading day). Stock option awards that relate to Grace stock options originally granted prior to the Separation have a contractual term of five years from the original date of grant. Stock option awards granted post-Separation have a contractual term of seven years from the original date of grant. Generally, stock options vest in substantially equal amounts each year over three years from the date of grant.
GCP values stock options using the Black-Scholes option pricing model, which was developed for use in estimating the fair value of traded options. The risk-free rate is based on the U.S. Treasury yield curve published as of the grant date, with maturities approximating the expected term of the options. GCP estimates the expected term of the options according to the simplified method as allowed by FASB Accounting Standards Codification ("ASC") Topic No. 718-20, Awards Classified as Equity, whereby the average between the vesting period and contractual term is used. GCP estimated the expected volatility using an industry peer group.
25
The following summarizes GCP's assumptions for estimating the fair value of stock options granted during 2016:
Assumptions used to calculate expense for stock option | Nine Months Ended September 30, 2016 | |
Risk-free interest rate | 0.93 - 1.24% | |
Average life of options (years) | 4 - 5 | |
Volatility | 29.6 – 33.2% | |
Dividend yield | — | |
Average fair value per stock option | $4.88 | |
The following table summarizes GCP stock option activity for the nine months ended September 30, 2016:
Stock Option Activity | Number Of Shares (in thousands) | Weighted Average Exercise Price | Weighted Average Remaining Contractual Term (years) | Aggregated Intrinsic Value (in thousands) | |||||||||
Outstanding, December 31, 2015 | — | $ | — | ||||||||||
Converted on February 3, 2016 | 2,236 | 14.36 | |||||||||||
Options exercised | 757 | 9.68 | |||||||||||
Options forfeited | 5 | 18.95 | |||||||||||
Options granted | 748 | 17.18 | |||||||||||
Outstanding, September 30, 2016 | 2,222 | 16.90 | 3.81 | $ | 25,131 | ||||||||
Exercisable September 30, 2016 | 945 | $ | 15.42 | 2.00 | 12,077 | ||||||||
The aggregate intrinsic values in the table above represent the total pre-tax intrinsic value (the difference between GCP's closing stock price on the last trading day of September 30, 2016 and the exercise price, multiplied by the number of in-the-money options) that would have been received by the option holders had all option holders exercised their in-the-money options at period end. The amount changes based on the fair market value of GCP's stock. The intrinsic value of all options exercised in the nine-month period ended September 30, 2016 was $8.7 million.
Total unrecognized stock-based compensation expense for stock options outstanding at September 30, 2016, was $2.5 million and the weighted-average period over which this expense will be recognized is approximately 1.3 years.
Restricted Stock Units and Performance Based Units
Upon Separation, certain previously outstanding RSUs and PBUs granted under Grace's equity compensation programs prior to the Separation were adjusted, in accordance with the Employee Matters Agreement, such that holders of these original Grace RSUs and PBUs received RSUs denominated in GCP equity.
RSUs generally vest over a three year period, with vesting in substantially equal amounts each year over three years and some vesting 100% after the third year from the date of grant. A smaller number of RSUs were designated as sign-on awards and used for purposes of attracting key employees and to cover outstanding awards from a prior employer and vest 100% after two years.
26
GCP’s RSU activity for the nine months ended September 30, 2016 is as follows:
RSU Activity | Number Of Shares (in thousands) | Weighted Average Grant Date Fair Value | |||||
Outstanding, December 31, 2015 | — | $ | — | ||||
Converted on February 3, 2016 | 265 | 17.00 | |||||
RSUs settled | 31 | 16.90 | |||||
RSUs granted | 323 | 17.11 | |||||
RSUs outstanding, September 30, 2016 | 557 | $ | 17.07 | ||||
During the nine months ended September 30, 2016, GCP distributed 25,000 shares and $0.5 million of cash to settle RSUs. GCP expects that approximately 41% of the 80,621 RSUs vesting in 2016, none of the 68,211 RSUs vesting in 2017, 37% of the 162,707 RSUs vesting in 2018 and none of the 245,176 RSUs vesting in 2019, will be settled in cash, with the remaining percentages of these RSUs to be settled in GCP stock.
During the nine months ended September 30, 2016, GCP granted 155,501 PBUs under the GCP 2016 Stock Incentive Plan to Company employees. These awards vest on February 2019 subject to continued employment through the payment date, and have a weighted average grant date fair value of $17.04. GCP anticipates that 100% of the PBUs will be settled in GCP common stock upon vesting.
PBUs granted in 2016 are based on a three year cumulative adjusted earnings per share measure. The number of shares ultimately provided to an employee who received a 2016 PBU grant will be based on Company performance against this measure, and can range from 0% to 200% of the target number of shares granted based upon the level of achievement of this measure. The awards will be settled in 2019 once actual performance against the measure, which is measured over fiscal years 2016-2018, is certified by the Compensation Committee.
PBUs and RSUs are recorded at fair value at the date of grant. The common stock-settled portion of each such award is considered an equity award, with the stock compensation expense being determined based on GCP’s stock price on the grant date. The cash settled portion of the award is considered a liability award with the liability being remeasured each reporting period based on GCP’s then current stock price. PBU stock-and cash-settled awards are remeasured each reporting period based on the expected payout of the award, which may range from 0% to 200% of the targets for such awards; therefore, these portions of the awards are subject to volatility until the payout is finally determined at the end of the performance period.
As of September 30, 2016, $7.9 million of total unrecognized compensation expense related to the RSU and PBU awards is expected to be recognized over the remaining weighted-average service period of 1.7 years.
27
11. Earnings Per Share
The following table shows a reconciliation of the numerators and denominators used in calculating basic and diluted earnings (loss) per share:
Three Months Ended September 30, | Nine Months Ended September 30, | ||||||||||||||
(In millions, except per share amounts) | 2016 | 2015 | 2016 | 2015 | |||||||||||
Numerators | |||||||||||||||
Net income (loss) attributable to GCP shareholders | $ | 21.3 | $ | (15.3 | ) | $ | 69.4 | $ | 32.4 | ||||||
Denominators | |||||||||||||||
Weighted average common shares—basic calculation | 71.0 | 70.5 | 70.8 | 70.5 | |||||||||||
Dilutive effect of employee stock awards | 1.2 | — | 0.8 | — | |||||||||||
Weighted average common shares—diluted calculation | 72.2 | 70.5 | 71.6 | 70.5 | |||||||||||
Basic earnings (loss) per share | $ | 0.30 | $ | (0.22 | ) | $ | 0.98 | $ | 0.46 | ||||||
Diluted earnings (loss) per share | $ | 0.30 | $ | (0.22 | ) | $ | 0.97 | $ | 0.46 | ||||||
The computation of basic and diluted earnings (loss) per common share is calculated assuming the number of shares of GCP common stock outstanding on February 3, 2016 had been outstanding at the beginning of each period presented. For periods prior to the Separation, it is assumed that there are no dilutive equity instruments as there were no equity awards in GCP outstanding prior to the Separation. See Note 1 for further discussion of the Separation.
There were approximately 0.2 million anti-dilutive options and 0.1 million anti-dilutive RSUs outstanding on a weighted average basis for the nine months ended September 30, 2016, respectively. There were no anti-dilutive options or anti-dilutive RSU's outstanding on a weighted-average basis for the three months ended September 30, 2016.
During the nine months ended September 30, 2016, GCP repurchased 96,270 shares of Company common stock for $1.8 million, respectively, in connection with its equity compensation programs.
12. Related Party Transactions and Transactions with Grace
Related Parties
All contracts with related parties are at rates and terms that GCP believes are comparable with those that could be entered into with independent third parties. Subsequent to the Separation, transactions with Grace represent third-party transactions.
Allocation of General Corporate Expenses
Prior to the Separation, the financial statements included expense allocations for certain functions provided by Grace as well as other Grace employees not solely dedicated to GCP, including, but not limited to, general corporate expenses related to finance, legal, information technology, human resources, communications, ethics and compliance, shared services, employee benefits and incentives and stock-based compensation. These expenses were allocated to GCP on the basis of direct usage when identifiable, with the remainder allocated on the basis of revenue, headcount or other measures.
The expense allocations from Grace prior to the Separation included costs associated with defined benefit pension and other postretirement benefit plans (the “Shared Plans”) sponsored by Grace in which certain of GCP's employees participated. GCP accounted for such Shared Plans as multiemployer benefit plans. Accordingly, GCP did not record an asset or liability to recognize the funded status of the Shared Plans. As part of the Separation, Grace has split certain Shared Plans and transferred the assets and liabilities of such plans related to GCP employees to GCP. The expense allocations were determined on a basis that GCP considered to be a reasonable reflection of the utilization of or benefit received by GCP for the services provided by Grace. The allocations may not, however, reflect the expense GCP would have incurred as an independent company for the periods presented.
28
Between January 1, 2016 and the Separation, GCP was allocated $2.0 million of general corporate expense, which is primarily included within "Selling, general and administrative expenses" in the accompanying Statement of Operations for the nine months ended September 30, 2016. During the nine months ended September 30, 2015 Grace allocated $40.2 million of general corporate expenses to GCP. For the three months ended September 30, 2016, GCP was not allocated any general corporate expense, compared with $13.3 million for the three months ended September 30, 2015.
Transition Services Agreement
In connection with the Separation, the Company entered into a transition services agreement pursuant to which GCP and Grace provide various services to each other on a temporary, transitional basis.
The services provided by Grace to GCP include information technology, treasury, tax administration, accounting, financial reporting, human resources and other services. Following the Separation, Grace will continue to provide some of these services on a transitional basis, generally for a period of up to 18 months from the date of Separation.
Tax Sharing Agreement
The Tax Sharing Agreement governs the parties’ respective rights, responsibilities and obligations with respect to tax liabilities and benefits, tax attributes, the preparation and filing of tax returns, the control of audits and other tax proceedings, and other matters regarding taxes. In general, and subject to the terms of the Tax Sharing Agreement, GCP is responsible for all U.S. federal, state and foreign taxes (and any related interest, penalties or audit adjustments) reportable on a GCP separate return (a return that does not include Grace or any of its subsidiaries); and Grace is responsible for all U.S. federal, state and foreign income taxes (and any related interest, penalties or audit adjustments) reportable on a consolidated, combined or unitary return that includes Grace or any of its subsidiaries and GCP or any of its subsidiaries. As of the balance sheet date, GCP has included $7.0 million of indemnified receivables ($2.5 million in other current assets and $4.5 million in other assets).
In addition, the Tax Sharing Agreement imposes certain restrictions on GCP and its subsidiaries (including restrictions on share issuances, business combinations, sales of assets and similar transactions) that are designed to preserve the qualification of the Distribution, together with certain related transactions, under Section 355 and certain other relevant provisions of the Code. The Tax Sharing Agreement provides special rules that allocate tax liabilities in the event the Distribution, together with certain related transactions, does not so qualify. In general, under the Tax Sharing Agreement, each party is expected to be responsible for any taxes imposed on, and certain related amounts payable by, GCP or Grace that arise from the failure of the Distribution and certain related transactions, to qualify under Section 355 and certain other relevant provisions of the Code, to the extent that the failure to so qualify is attributable to actions, events or transactions relating to such party’s respective stock, assets or business, or a breach of the relevant representations or covenants made by such party in the Tax Sharing Agreement.
Parent Company Equity
Net transfers to parent are included within net parent investment on the Consolidated Statements of (Deficit) Equity. The components of the net transfers to parent as of September 30, 2016 and 2015 are as follows:
Nine Months Ended September 30, | |||||||
(In millions) | 2016 | 2015 | |||||
Cash pooling and general financing activities | $ | (685.1 | ) | $ | (237.5 | ) | |
GCP expenses funded by parent | 6.6 | 43.0 | |||||
Corporate costs allocations | 2.0 | 40.2 | |||||
Provision for income taxes | 4.3 | 58.2 | |||||
Total net transfers to parent | (672.2 | ) | (96.1 | ) | |||
Other, net | (92.4 | ) | 26.5 | ||||
Transfers to parent, net per Consolidated Statements of Cash Flows | $ | (764.6 | ) | $ | (69.6 | ) | |
29
Other, net includes the non-cash transfer from parent of approximately $44 million of net pension liabilities, approximately $23 million of fixed assets and the non-cash transfer of approximately $42 million of related-party debt, deferred tax items and other items.
As discussed in Note 3, GCP used proceeds from the Notes and Credit Facilities to fund a distribution to Grace in an amount of $750.0 million related to the Separation. This distribution is reflected as a component of transfers to parent in the table above.
13. Operating Segment Information
GCP is engaged in the production and sale of specialty construction chemicals, specialty building materials and packaging products through three operating segments. Specialty Construction Chemicals manufactures and markets concrete admixtures and cement additives. Specialty Building Materials manufactures and markets sheet and liquid membrane systems that protect structures from water, air and vapor penetration, fireproofing, and other products designed to protect the building envelope. Darex Packaging Technologies manufactures and markets packaging materials for use in beverage and food containers, industrial containers and other consumer and industrial applications.
The table below presents information related to GCP's operating segments. Only those corporate expenses directly related to the operating segments are allocated for reporting purposes. GCP excludes certain functional costs, impacts of foreign exchange (related primarily to Venezuela) and other corporate costs such as certain performance-based incentive compensation and public company costs from segment operating income. GCP also excludes certain ongoing defined benefit pension costs recognized quarterly, which include service and interest costs, the effect of expected returns on plan assets and amortization of prior service costs/credits, from the calculation of segment operating income. GCP believes that the exclusion of certain corporate costs and pension costs provides a better indicator of its operating segment performance as such costs are not managed at an operating segment level. Corporate costs and certain pension costs excluded from segment operating income were $9.2 million and $7.2 million and $29.5 million and $20.3 million for the three and nine months ended September 30, 2016 and 2015, respectively.
Operating Segment Data
Three Months Ended September 30, | Nine Months Ended September 30, | ||||||||||||||
(In millions) | 2016 | 2015 | 2016 | 2015 | |||||||||||
Net Sales | |||||||||||||||
Specialty Construction Chemicals | $ | 162.8 | $ | 201.9 | $ | 466.6 | $ | 534.2 | |||||||
Specialty Building Materials | 100.6 | 102.0 | 318.5 | 297.6 | |||||||||||
Darex Packaging Technologies | 79.1 | 85.8 | 237.8 | 254.3 | |||||||||||
Total | $ | 342.5 | $ | 389.7 | $ | 1,022.9 | $ | 1,086.1 | |||||||
Segment Operating Income | |||||||||||||||
Specialty Construction Chemicals segment operating income | $ | 23.2 | $ | 37.2 | $ | 53.7 | $ | 66.9 | |||||||
Specialty Building Materials segment operating income | 25.6 | 26.7 | 88.9 | 73.3 | |||||||||||
Darex Packaging Technologies segment operating income | 15.9 | 20.9 | 51.2 | 56.0 | |||||||||||
Total segment operating income | $ | 64.7 | $ | 84.8 | $ | 193.8 | $ | 196.2 | |||||||
30
Reconciliation of Operating Segment Data to Financial Statements
Total segment operating income for the three and nine months ended September 30, 2016 and 2015, is reconciled below to income before income taxes presented in the accompanying Consolidated Statements of Operations.
Three Months Ended September 30, | Nine Months Ended September 30, | ||||||||||||||
(In millions) | 2016 | 2015 | 2016 | 2015 | |||||||||||
Total segment operating income | $ | 64.7 | $ | 84.8 | $ | 193.8 | $ | 196.2 | |||||||
Corporate costs | (7.1 | ) | (5.9 | ) | (23.2 | ) | (16.5 | ) | |||||||
Certain pension costs | (2.1 | ) | (1.3 | ) | $ | (6.3 | ) | $ | (3.8 | ) | |||||
Currency and other financial losses in Venezuela | — | (73.2 | ) | — | (73.2 | ) | |||||||||
Repositioning expenses | (5.3 | ) | — | (14.3 | ) | — | |||||||||
Restructuring expenses | (0.4 | ) | (2.3 | ) | (1.4 | ) | (9.9 | ) | |||||||
Pension MTM adjustment and other related costs, net | — | — | (2.7 | ) | (0.5 | ) | |||||||||
Gain on termination and curtailment of pension and other postretirement plans | 0.2 | — | 2.6 | — | |||||||||||
Third-party acquisition-related costs | (0.3 | ) | — | (0.3 | ) | — | |||||||||
Net income attributable to noncontrolling interests | 0.2 | 0.3 | 0.9 | 0.6 | |||||||||||
Other financing costs | (1.2 | ) | — | (1.2 | ) | — | |||||||||
Interest expense, net | (17.6 | ) | (0.6 | ) | (47.8 | ) | (1.7 | ) | |||||||
Income before income taxes | $ | 31.1 | $ | 1.8 | $ | 100.1 | $ | 91.2 | |||||||
Geographic Area Data
The table below presents information related to the geographic areas in which GCP operates. Sales are attributed to geographic areas based on customer location.
Three Months Ended September 30, | Nine Months Ended September 30, | ||||||||||||||
(In millions) | 2016 | 2015 | 2016 | 2015 | |||||||||||
Net Sales | |||||||||||||||
United States | $ | 134.6 | $ | 133.0 | $ | 402.7 | $ | 378.3 | |||||||
Canada and Puerto Rico | 9.2 | 8.6 | 25.2 | 22.9 | |||||||||||
Total North America | 143.8 | 141.6 | 427.9 | 401.2 | |||||||||||
Europe Middle East Africa | 79.5 | 88.9 | 249.3 | 260.7 | |||||||||||
Asia Pacific | 81.9 | 83.3 | 242.6 | 248.6 | |||||||||||
Latin America | 37.3 | 75.9 | 103.1 | 175.6 | |||||||||||
Total | $ | 342.5 | $ | 389.7 | $ | 1,022.9 | $ | 1,086.1 | |||||||
14. Acquisitions
On August 9, 2016, GCP acquired the intellectual property and related assets of Sensocrete, a Canadian technology company in the ready mix concrete industry. This acquisition did not have a material effect on the Company's financial statements for the periods presented.
31
15. Subsequent Event
On November 9, 2016, GCP acquired 100% of the stock of Halex Corporation for approximately $47 million in cash. Halex is a supplier of specialty moisture barrier flooring underlayment products, seam tapes and accessories with annual net sales of approximately $45 million. The business will be included within GCP’s Specialty Building Materials operating segment. The acquisition purchase price, subject to normal and customary purchase price adjustments, was partially funded by a $25 million draw on the Company's revolving credit facility. Due to the timing of the acquisition, the Company has not yet finalized the purchase price allocation in accordance with ASC 805, “Business Combinations.”
32
ITEM 2. MANAGEMENT'S DISCUSSION AND ANALYSIS OF FINANCIAL CONDITION AND RESULTS OF OPERATIONS
We generally refer to the quarter ended September 30, 2016, as the "third quarter," the quarter ended September 30, 2015, as the "prior-year quarter," the quarter ended March 31, 2016, as the "2016 first quarter," the quarter ended June 30, 2016, as the "2016 second quarter," the nine months ended September 30, 2016, as the "nine months," and the nine months ended September 30, 2015, as the "prior-year period." See Analysis of Operations for a discussion of our non-GAAP performance measures.
Results of Operations
Summary Description of Business
We are engaged in the production and sale of specialty construction chemicals, specialty building materials and packaging products through three operating segments:
• | Specialty Construction Chemicals. Specialty Construction Chemicals ("SCC") provides products, technologies, and services that reduce the cost and improve the performance of cement, concrete, mortar, masonry and other cementitious based construction materials. |
• | Specialty Building Materials. Specialty Building Materials ("SBM") produces and sells sheet and liquid membrane systems and other products that protect both new and existing structures from water, air, and vapor penetration, and from fire damage. We also manufacture and sell specialized cementitious and chemical grouts used for soil consolidation and leak-sealing applications. |
• | Darex Packaging Technologies. Darex Packaging Technologies ("Darex") produces and sells sealants and coatings for consumer and industrial applications to protect the integrity of packaged products. |
We operate our business on a global scale with approximately 64% of our annual 2015 net sales from outside the United States. We conduct business in over 40 countries and do business in over 30 currencies. We manage our operating segments on a global basis, to serve global markets. Currency fluctuations affect our reported results of operations, cash flows, and financial position.
On January 27, 2016, GCP entered into a Separation and Distribution Agreement pursuant to which Grace agreed to transfer its Grace Construction Products operating segment and the packaging technologies business, operated under the “Darex” name, of its Grace Materials Technologies operating segment to GCP (the "Separation"). The Separation occurred on February 3, 2016, by means of a pro rata distribution to Grace stockholders of all of the outstanding shares of Company common stock (the "Distribution"). Under the Distribution, one share of Company common stock was distributed for each share of Grace common stock held as of the close of business on January 27, 2016. No fractional shares were distributed. As a result of the Distribution, GCP is now an independent public company and its common stock is listed under the symbol “GCP” on the New York Stock Exchange.
Third Quarter Performance Summary
Following is a summary of our financial performance for the third quarter compared with the prior-year quarter.
• | Net sales decreased 12.1% to $342.5 million. |
• | Net income attributable to GCP shareholders was $21.3 million or $0.30 per diluted share, compared to a net loss attributable to GCP shareholders of $15.3 million or $0.22 per diluted share, for the prior-year quarter. Adjusted EPS was $0.35 per diluted share. |
• | Adjusted EBIT decreased 28.5% to $55.5 million. |
• | Adjusted EBIT Return On Invested Capital was 38.9% on a trailing four quarters basis compared with 46.6% for the 2015 third quarter. |
33
Analysis of Operations
We have set forth in the table below our key operating statistics with percentage changes for the third quarter and nine months compared with the corresponding prior-year periods. Please refer to this Analysis of Operations (the “table”) when reviewing our Management's Discussion and Analysis of Financial Condition and Results of Operations (“MD&A”). In the table, we present financial information in accordance with U.S. GAAP, as well as certain non-GAAP financial measures, which we describe below in further detail. We believe that the non-GAAP financial information supplements our discussions about the performance of our businesses, improves period-to-period comparability and provides insight to the information that our management uses to evaluate the performance of our businesses. Our management uses non-GAAP measures in financial and operational decision-making processes, for internal reporting, and as part of forecasting and budgeting processes, as these measures provide additional transparency to our core operations.
In the table, we have provided reconciliations of these non-GAAP financial measures to the most directly comparable financial measures calculated and presented in accordance with U.S. GAAP. These non-GAAP financial measures should not be considered substitutes for financial measures calculated in accordance with U.S. GAAP, and the financial results that we calculate and present in the table in accordance with U.S. GAAP, as well as the corresponding reconciliations from those results, should be carefully evaluated as part of our MD&A.
We define Adjusted EBIT (a non-GAAP financial measure) to be net income attributable to GCP shareholders adjusted for interest income; interest expense and related financing costs; income taxes; currency and other financial losses in Venezuela; restructuring and repositioning expenses and asset impairments; pension costs other than service and interest costs, expected returns on plan assets and amortization of prior service costs/credits; income and expense items related to certain product lines and investments; gains and losses on sales of businesses, product lines and certain other investments; third-party acquisition-related costs; and certain other items that are not representative of underlying trends. Adjusted EBIT Margin means Adjusted EBIT divided by net sales. We use Adjusted EBIT to assess and measure our operating performance and in determining performance-based compensation. We use Adjusted EBIT as a performance measure because it provides improved period-to-period comparability for decision-making and compensation purposes and because it allows management to measure the ongoing earnings results of our strategic and operating decisions.
We define Adjusted EBITDA (a non-GAAP financial measure) to be Adjusted EBIT adjusted for depreciation and amortization. We use Adjusted EBITDA as a performance measure in making significant business decisions.
We define Adjusted Earnings Per Share (a non-GAAP financial measure) to be earnings per share ("EPS") on a diluted basis adjusted for costs related to restructuring and repositioning expenses and asset impairments; pension costs other than service and interest costs, expected return on plan assets and amortization of prior service costs/credits; gains and losses on sales of businesses, product lines and certain other investments; third-party acquisition-related costs; other financing costs associated with the modification or extinguishment of debt; certain other items that are not representative of underlying trends; and certain discrete tax items. We use Adjusted EPS as a performance measure to review our diluted earnings per share results on a consistent basis.
We define Adjusted Gross Profit (a non-GAAP financial measure) to be gross profit adjusted for pension-related costs and loss in Venezuela included in cost of goods sold. Adjusted Gross Margin means Adjusted Gross Profit divided by net sales. We use this performance measure to understand trends and changes and to make business decisions regarding core operations. We note that the devaluation loss in Venezuela results primarily from geopolitical factors.
We define Adjusted EBIT Return On Invested Capital (a non-GAAP financial measure) to be Adjusted EBIT (on a trailing four quarters basis) divided by the sum of net working capital, properties and equipment and certain other assets and liabilities. We use Adjusted EBIT Return On Invested Capital as a performance measure to review investments and to make capital allocation decisions.
Adjusted EBIT, Adjusted EBITDA, Adjusted EPS, Adjusted EBIT Return On Invested Capital and Adjusted Gross Margin do not purport to represent income measures as defined under U.S. GAAP. These measures are provided to investors and others to improve the period-to-period comparability and peer-to-peer comparability of our financial results and to ensure that investors understand the information we use to evaluate the performance of our businesses.
34
Adjusted EBIT has material limitations as an operating performance measure because it excludes costs related to income and expenses from restructuring and repositioning activities, which historically has been a material component of our net income. Adjusted EBITDA also has material limitations as an operating performance measure because it excludes the impact of depreciation and amortization expense. Our business is substantially dependent on the successful deployment of capital, and depreciation and amortization expense is a necessary element of our costs. We compensate for the limitations of these measurements by using these indicators together with net income as measured under GAAP to present a complete analysis of our results of operations. Adjusted EBIT and Adjusted EBITDA should be evaluated together with net income measured under GAAP for a complete understanding of our results of operations.
We have provided in the following tables a reconciliation of these non-GAAP measures to the most directly comparable financial measure calculated and presented in accordance with U.S. GAAP.
Analysis of Operations (In millions, except per share amounts) | Three Months Ended September 30, | Nine Months Ended September 30, | |||||||||||||||||||
2016 | 2015 | % Change | 2016 | 2015 | % Change | ||||||||||||||||
Net sales: | |||||||||||||||||||||
Specialty Construction Chemicals | $ | 162.8 | $ | 201.9 | (19.4 | )% | $ | 466.6 | $ | 534.2 | (12.7 | )% | |||||||||
Specialty Building Materials | 100.6 | 102.0 | (1.4 | )% | 318.5 | 297.6 | 7.0 | % | |||||||||||||
Darex Packaging Technologies | 79.1 | 85.8 | (7.8 | )% | 237.8 | 254.3 | (6.5 | )% | |||||||||||||
Total GCP net sales | $ | 342.5 | $ | 389.7 | (12.1 | )% | $ | 1,022.9 | $ | 1,086.1 | (5.8 | )% | |||||||||
Net sales by region: | |||||||||||||||||||||
North America | $ | 143.8 | $ | 141.6 | 1.6 | % | $ | 427.9 | $ | 401.2 | 6.7 | % | |||||||||
Europe Middle East Africa (EMEA) | 79.5 | 88.9 | (10.6 | )% | 249.3 | 260.7 | (4.4 | )% | |||||||||||||
Asia Pacific | 81.9 | 83.3 | (1.7 | )% | 242.6 | 248.6 | (2.4 | )% | |||||||||||||
Latin America | 37.3 | 75.9 | (50.9 | )% | 103.1 | 175.6 | (41.3 | )% | |||||||||||||
Total net sales by region | $ | 342.5 | $ | 389.7 | (12.1 | )% | $ | 1,022.9 | $ | 1,086.1 | (5.8 | )% | |||||||||
Profitability performance measures: | |||||||||||||||||||||
Adjusted EBIT(A): | |||||||||||||||||||||
Specialty Construction Chemicals segment operating income | $ | 23.2 | $ | 37.2 | (37.6 | )% | $ | 53.7 | $ | 66.9 | (19.7 | )% | |||||||||
Specialty Building Materials segment operating income | 25.6 | 26.7 | (4.1 | )% | 88.9 | 73.3 | 21.3 | % | |||||||||||||
Darex Packaging Technologies segment operating income | 15.9 | 20.9 | (23.9 | )% | 51.2 | 56.0 | (8.6 | )% | |||||||||||||
Corporate costs(B) | (7.1 | ) | (5.9 | ) | (20.3 | )% | (23.2 | ) | (16.5 | ) | (40.6 | )% | |||||||||
Certain pension costs(C) | (2.1 | ) | (1.3 | ) | (61.5 | )% | (6.3 | ) | (3.8 | ) | (65.8 | )% | |||||||||
Adjusted EBIT (non-GAAP) | 55.5 | 77.6 | (28.5 | )% | 164.3 | 175.9 | (6.6 | )% | |||||||||||||
Currency and other financial losses in Venezuela | — | (73.2 | ) | NM | — | (73.2 | ) | NM | |||||||||||||
Repositioning expenses | (5.3 | ) | — | NM | (14.3 | ) | — | NM | |||||||||||||
Restructuring expenses | (0.4 | ) | (2.3 | ) | 82.6 | % | (1.4 | ) | (9.9 | ) | 85.9 | % | |||||||||
Pension MTM adjustment and other related costs, net | — | — | NM | (2.7 | ) | (0.5 | ) | NM | |||||||||||||
Gain on termination and curtailment of pension and other postretirement plans | 0.2 | — | NM | 2.6 | — | NM | |||||||||||||||
Third-party acquisition-related costs | (0.3 | ) | — | NM | (0.3 | ) | — | NM | |||||||||||||
Other financing costs | (1.2 | ) | — | NM | (1.2 | ) | — | NM | |||||||||||||
Interest expense, net | (17.6 | ) | (0.6 | ) | NM | (47.8 | ) | (1.7 | ) | NM | |||||||||||
Provision for income taxes | (9.6 | ) | (16.8 | ) | 42.9 | % | (29.8 | ) | (58.2 | ) | 48.8 | % | |||||||||
Net income attributable to GCP shareholders (GAAP) | $ | 21.3 | $ | (15.3 | ) | NM | $ | 69.4 | $ | 32.4 | 114.2 | % | |||||||||
Diluted EPS (GAAP) | $ | 0.30 | $ | (0.22 | ) | NM | $ | 0.97 | $ | 0.46 | 110.9 | % | |||||||||
Adjusted EPS (non-GAAP) | $ | 0.35 | $ | 1.12 | |||||||||||||||||
35
Analysis of Operations (In millions) | Three Months Ended September 30, | Nine Months Ended September 30, | |||||||||||||||||||
2016 | 2015 | % Change | 2016 | 2015 | % Change | ||||||||||||||||
Adjusted profitability performance measures: | |||||||||||||||||||||
Gross Profit: | |||||||||||||||||||||
Specialty Construction Chemicals | $ | 62.2 | $ | 79.3 | (21.6 | )% | $ | 171.6 | $ | 190.0 | (9.7 | )% | |||||||||
Specialty Building Materials | 46.8 | 46.2 | 1.3 | % | 149.7 | 133.2 | 12.4 | % | |||||||||||||
Darex Packaging Technologies | 27.4 | 32.2 | (14.9 | )% | 85.7 | 89.5 | (4.2 | )% | |||||||||||||
Adjusted Gross Profit (non-GAAP) | 136.4 | 157.7 | (13.5 | )% | 407.0 | 412.7 | (1.4 | )% | |||||||||||||
Loss in Venezuela in cost of goods sold | — | (13.7 | ) | NM | — | (13.7 | ) | NM | |||||||||||||
Pension costs in cost of goods sold | (0.4 | ) | (0.1 | ) | NM | (1.4 | ) | (0.9 | ) | (55.6 | )% | ||||||||||
Total GCP Gross Profit (GAAP) | 136.0 | 143.9 | (5.5 | )% | 405.6 | 398.1 | 1.9 | % | |||||||||||||
Gross Margin: | |||||||||||||||||||||
Specialty Construction Chemicals | 38.2 | % | 39.3 | % | (1.1) pts | 36.8 | % | 35.6 | % | 1.2 pts | |||||||||||
Specialty Building Materials | 46.5 | % | 45.3 | % | 1.2 pts | 47.0 | % | 44.8 | % | 2.2 pts | |||||||||||
Darex Packaging Technologies | 34.6 | % | 37.5 | % | (2.9) pts | 36.0 | % | 35.2 | % | 0.8 pts | |||||||||||
Adjusted Gross Margin (non-GAAP) | 39.8 | % | 40.5 | % | (0.7) pts | 39.8 | % | 38.0 | % | 1.8 pts | |||||||||||
Loss in Venezuela in cost of goods sold | — | % | (3.5 | )% | NM | — | % | (1.3 | )% | NM | |||||||||||
Pension costs in cost of goods sold | (0.1 | )% | — | % | NM | (0.1 | )% | (0.1 | )% | 0.0 pts | |||||||||||
Total GCP Gross Margin (GAAP) | 39.7 | % | 37.0 | % | 2.7 pts | 39.7 | % | 36.6 | % | 3.1 pts | |||||||||||
Adjusted EBIT(A)(B)(C): | |||||||||||||||||||||
Specialty Construction Chemicals segment operating income | $ | 23.2 | $ | 37.2 | (37.6 | )% | $ | 53.7 | $ | 66.9 | (19.7 | )% | |||||||||
Specialty Building Materials segment operating income | 25.6 | 26.7 | (4.1 | )% | 88.9 | 73.3 | 21.3 | % | |||||||||||||
Darex Packaging Technologies segment operating income | 15.9 | 20.9 | (23.9 | )% | 51.2 | 56.0 | (8.6 | )% | |||||||||||||
Corporate and certain pension costs | (9.2 | ) | (7.2 | ) | (27.8 | )% | (29.5 | ) | (20.3 | ) | (45.3 | )% | |||||||||
Total GCP Adjusted EBIT (non-GAAP) | 55.5 | 77.6 | (28.5 | )% | 164.3 | 175.9 | (6.6 | )% | |||||||||||||
Depreciation and amortization: | |||||||||||||||||||||
Specialty Construction Chemicals | $ | 5.1 | $ | 4.6 | 10.9 | % | $ | 15.0 | $ | 13.8 | 8.7 | % | |||||||||
Specialty Building Materials | 2.4 | 1.9 | 26.3 | % | 6.9 | 5.9 | 16.9 | % | |||||||||||||
Darex Packaging Technologies | 1.6 | 1.3 | 23.1 | % | 4.8 | 3.8 | 26.3 | % | |||||||||||||
Corporate | — | 0.2 | NM | 0.3 | 0.9 | (66.7 | )% | ||||||||||||||
Total GCP | 9.1 | 8.0 | 13.8 | % | 27.0 | 24.4 | 10.7 | % | |||||||||||||
Adjusted EBITDA: | |||||||||||||||||||||
Specialty Construction Chemicals | $ | 28.3 | $ | 41.8 | (32.3 | )% | $ | 68.7 | $ | 80.7 | (14.9 | )% | |||||||||
Specialty Building Materials | 28.0 | 28.6 | (2.1 | )% | 95.8 | 79.2 | 21.0 | % | |||||||||||||
Darex Packaging Technologies | 17.5 | 22.2 | (21.2 | )% | 56.0 | 59.8 | (6.4 | )% | |||||||||||||
Corporate and certain pension costs | (9.2 | ) | (7.0 | ) | (31.4 | )% | (29.2 | ) | (19.4 | ) | (50.5 | )% | |||||||||
Total GCP Adjusted EBITDA (non-GAAP) | 64.6 | 85.6 | (24.5 | )% | 191.3 | 200.3 | (4.5 | )% | |||||||||||||
Adjusted EBIT Margin: | |||||||||||||||||||||
Specialty Construction Chemicals | 14.3 | % | 18.4 | % | (4.1) pts | 11.5 | % | 12.5 | % | (1.0) pts | |||||||||||
Specialty Building Materials | 25.4 | % | 26.2 | % | (0.8) pts | 27.9 | % | 24.6 | % | 3.3 pts | |||||||||||
Darex Packaging Technologies | 20.1 | % | 24.4 | % | (4.3) pts | 21.5 | % | 22.0 | % | (0.5) pts | |||||||||||
Total GCP Adjusted EBIT Margin (non-GAAP) | 16.2 | % | 19.9 | % | (3.7) pts | 16.1 | % | 16.2 | % | (0.1) pts | |||||||||||
Adjusted EBITDA Margin: | |||||||||||||||||||||
Specialty Construction Chemicals | 17.4 | % | 20.7 | % | (3.3) pts | 14.7 | % | 15.1 | % | (0.4) pts | |||||||||||
Specialty Building Materials | 27.8 | % | 28.0 | % | (0.2) pts | 30.1 | % | 26.6 | % | 3.5 pts | |||||||||||
Darex Packaging Technologies | 22.1 | % | 25.9 | % | (3.8) pts | 23.5 | % | 23.5 | % | 0.0 pts | |||||||||||
Total GCP Adjusted EBITDA Margin (non-GAAP) | 18.9 | % | 22.0 | % | (3.1) pts | 18.7 | % | 18.4 | % | 0.3 pts | |||||||||||
36
Analysis of Operations (In millions) | Four Quarters Ended | ||||||
September 30, 2016 | September 30, 2015 | ||||||
Calculation of Adjusted EBIT Return On Invested Capital (trailing four quarters): | |||||||
Adjusted EBIT | $ | 215.1 | $ | 225.9 | |||
Invested Capital: | |||||||
Trade accounts receivable | 244.0 | 234.4 | |||||
Inventories | 117.3 | 114.2 | |||||
Accounts payable | (118.1 | ) | (117.5 | ) | |||
243.2 | 231.1 | ||||||
Other current assets (excluding income taxes and related party loans receivable) | 42.7 | 30.4 | |||||
Properties and equipment, net | 226.1 | 187.1 | |||||
Goodwill | 107.6 | 102.8 | |||||
Technology and other intangible assets, net | 34.8 | 34.2 | |||||
Other assets (excluding capitalized financing fees) | 23.7 | 8.8 | |||||
Other current liabilities (excluding income taxes, restructuring, repositioning and accrued interest) | (107.2 | ) | (101.4 | ) | |||
Other liabilities (excluding other postretirement benefits liability) | (18.2 | ) | (8.2 | ) | |||
Total invested capital | $ | 552.7 | $ | 484.8 | |||
Adjusted EBIT Return On Invested Capital (non-GAAP) | 38.9 | % | 46.6 | % | |||
___________________________________________________________________________________________________________________
Amounts may not add due to rounding.
(A) | GCP's segment operating income includes only GCP's share of income of consolidated joint ventures. |
(B) | Management allocates all costs within corporate to each segment to the extent such costs are directly attributable to the segments. |
(C) | Certain pension costs include only ongoing costs recognized quarterly, which include service and interest costs, expected returns on plan assets, and amortization of prior service costs/credits. SCC, SBM, and Darex segment operating income and corporate costs do not include any amounts for pension expense. Other pension related costs including annual mark-to-market adjustments, actuarial gains and losses, gains or losses from curtailments and terminations, and other related costs are excluded from Adjusted EBIT. These amounts are not used by management to evaluate the performance of the GCP businesses and significantly affect the peer-to-peer and period-to-period comparability of our financial results. Mark-to-market adjustments, actuarial gains and losses, and other related costs relate primarily to changes in financial market values and actuarial assumptions and are not directly related to the operation of the GCP businesses. |
NM Not meaningful.
Adjusted EPS
The following table reconciles our Diluted EPS (GAAP) to our Adjusted EPS (non-GAAP):
Three months ended September 30, 2016 | |||||||||||||||
(In millions, except per share amounts) | Pre- Tax | Tax Effect | After- Tax | Per Share | |||||||||||
Diluted Earnings Per Share (GAAP) | $ | 0.30 | |||||||||||||
Repositioning expenses | $ | 5.3 | $ | 2.1 | $ | 3.2 | 0.04 | ||||||||
Restructuring expenses | 0.4 | 0.1 | 0.3 | — | |||||||||||
Gain on termination and curtailment of pension and other postretirement plans | (0.2 | ) | — | (0.2 | ) | — | |||||||||
Third-party acquisition-related costs | 0.3 | 0.1 | 0.2 | — | |||||||||||
Other financing costs | 1.2 | 0.5 | 0.7 | 0.01 | |||||||||||
Discrete tax items: | |||||||||||||||
Discrete tax items, including adjustments to uncertain tax positions | — | 0.2 | (0.2 | ) | — | ||||||||||
Adjusted EPS (non-GAAP) | $ | 0.35 | |||||||||||||
37
Nine months ended September 30, 2016 | |||||||||||||||
(In millions, except per share amounts) | Pre- Tax | Tax Effect | After- Tax | Per Share | |||||||||||
Diluted Earnings Per Share (GAAP) | $ | 0.97 | |||||||||||||
Repositioning expenses | $ | 14.3 | $ | 5.3 | $ | 9.0 | 0.13 | ||||||||
Restructuring expenses | 1.4 | 0.3 | 1.1 | 0.02 | |||||||||||
Gain on termination and curtailment of pension and other postretirement plans | (2.6 | ) | (0.7 | ) | (1.9 | ) | (0.03 | ) | |||||||
Pension MTM adjustment and other related costs, net | 2.7 | 0.9 | 1.8 | 0.03 | |||||||||||
Third-party acquisition-related costs | 0.3 | 0.1 | 0.2 | — | |||||||||||
Other financing costs | 1.2 | 0.5 | 0.7 | 0.01 | |||||||||||
Discrete tax items: | |||||||||||||||
Discrete tax items, including adjustments to uncertain tax positions | — | 0.4 | (0.4 | ) | (0.01 | ) | |||||||||
Adjusted EPS (non-GAAP) | $ | 1.12 | |||||||||||||
GCP Overview
Following is an overview of our financial performance for the third quarter and nine months compared with the prior-year periods.
Net Sales and Adjusted Gross Margin
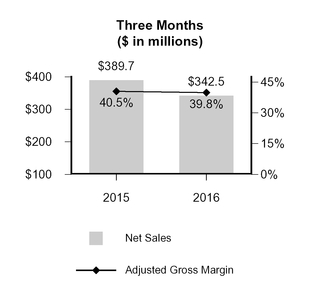
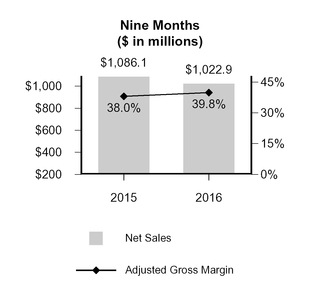
The following table identifies the year-over-year increase or decrease in sales attributable to changes in volume and/or mix, product price, the impact of currency translation and for changes in net sales in Venezuela for the quarter.
38
Three Months Ended September 30, 2016 as a Percentage Increase (Decrease) from Three Months Ended September 30, 2015 | ||||||||||||||
Net Sales Variance Analysis | Volume(1) | Price(1) | Currency Translation(1) | Net Sales in Venezuela | Total Change | |||||||||
Specialty Construction Chemicals | (4.0 | )% | 1.2 | % | (2.0 | )% | (14.6 | )% | (19.4 | )% | ||||
Specialty Building Materials | (1.2 | )% | 1.3 | % | (1.5 | )% | — | % | (1.4 | )% | ||||
Darex Packaging Technologies | 4.4 | % | (1.5 | )% | (2.3 | )% | (8.4 | )% | (7.8 | )% | ||||
Net sales | (1.3 | )% | 0.6 | % | (1.9 | )% | (9.5 | )% | (12.1 | )% | ||||
By Region: | ||||||||||||||
North America | (0.5 | )% | 2.2 | % | (0.1 | )% | — | % | 1.6 | % | ||||
Europe Middle East Africa | (5.1 | )% | (1.5 | )% | (4.0 | )% | — | % | (10.6 | )% | ||||
Asia Pacific | (0.3 | )% | (2.0 | )% | 0.6 | % | — | % | (1.7 | )% | ||||
Latin America | 2.5 | % | 6.2 | % | (9.8 | )% | (49.8 | )% | (50.9 | )% | ||||
__________________________
(1) Excludes net sales in Venezuela.
Net sales of $342.5 million for the third quarter of 2016 decreased $47.2 million or 12.1% compared with the prior-year quarter. The decrease was primarily due to lower sales in Venezuela, a decrease in sales volume and unfavorable currency translation, partially offset by price increases. Higher sales volume in Darex, primarily in Latin America and Asia Pacific, was more than offset by a decline in SCC and SBM, as demand in EMEA decreased, partially due to geopolitical events in the United Kingdom and Turkey and slower activity in the Middle East. Foreign exchange negatively impacted all three operating segments, with the largest effects in Latin America and EMEA as the U.S. dollar strengthened against local currencies in those regions. Excluding Venezuela, net sales for the third quarter of 2016 decreased 2.6% from the prior-year quarter.
Net sales in Venezuela decreased $38.1 million or 91.8% in the third quarter 2016 compared with the prior-year quarter, primarily due to the devaluation of the local currency in the third quarter of 2015. See "Venezuela" below for further discussion.
The following table presents the Venezuela net sales, Adjusted Gross Profit, and Adjusted EBIT by operating segment as compared with the prior-year quarter:
Venezuela Financial Performance for the Three Months Ended September 30, 2016 | |||||||||||||||
($ in millions) | SCC | Darex | Corporate | Total Venezuela | |||||||||||
Net sales | $ | 1.9 | $ | 1.5 | $ | — | $ | 3.4 | |||||||
Adjusted Gross Profit | 0.6 | 0.7 | — | 1.3 | |||||||||||
Adjusted EBIT | 0.4 | 0.7 | (0.2 | ) | 0.9 | ||||||||||
Venezuela Financial Performance for the Three Months Ended September 30, 2015 (1) | |||||||||||||||
($ in millions) | SCC | Darex | Corporate | Total Venezuela | |||||||||||
Net sales | $ | 32.9 | $ | 8.6 | $ | — | $ | 41.5 | |||||||
Adjusted Gross Profit | 20.1 | 5.1 | — | 25.2 | |||||||||||
Adjusted EBIT | 19.2 | 4.5 | (0.9 | ) | 22.8 | ||||||||||
39
Three Months Ended September 30, 2016 versus Three Months Ended September 30, 2015 - Change (%) | |||||||||||
SCC | Darex | Corporate | Total Venezuela | ||||||||
Net sales | (94.2 | )% | (82.6 | )% | NM | (91.8 | )% | ||||
Adjusted Gross Profit | (97.0 | )% | (86.3 | )% | NM | (94.8 | )% | ||||
Adjusted EBIT | (97.9 | )% | (84.4 | )% | (77.8 | )% | (96.1 | )% | |||
__________________________
(1) | In the table above for the three months ended September 30, 2015, Venezuela's Adjusted Gross Profit excludes the $13.7 million loss in Venezuela included in cost of goods sold and Adjusted EBIT excludes the $73.2 million currency and other financial losses in Venezuela incurred as a result of the currency devaluation in the third quarter of 2015. |
GCP's gross margin of 39.7% increased 270 basis points for the third quarter compared with the prior-year quarter, primarily due to a $13.7 million loss in Venezuela included in cost of goods sold in the third quarter of 2015 due to the devaluation of the local currency. GCP's Adjusted Gross Margin of 39.8% decreased 70 basis points for the third quarter compared with the prior-year quarter as lower raw material costs and productivity improvements were more than offset by the margin impact of Venezuela.
The following table identifies the year-over-year increase or decrease in net sales attributable to changes in volume and/or mix, product price, the impact of currency translation and for changes in net sales in Venezuela for the nine months.
Nine Months Ended September 30, 2016 as a Percentage Increase (Decrease) from Nine Months Ended September 30, 2015 | ||||||||||||||
Net Sales Variance Analysis | Volume(1) | Price(1) | Currency Translation(1) | Net Sales in Venezuela | Total Change | |||||||||
Specialty Construction Chemicals | (0.3 | )% | 0.3 | % | (4.1 | )% | (8.6 | )% | (12.7 | )% | ||||
Specialty Building Materials | 8.7 | % | 0.1 | % | (1.8 | )% | — | % | 7.0 | % | ||||
Darex Packaging Technologies | 2.9 | % | (1.5 | )% | (3.7 | )% | (4.2 | )% | (6.5 | )% | ||||
Net sales | 3.1 | % | (0.2 | )% | (3.3 | )% | (5.4 | )% | (5.8 | )% | ||||
By Region: | ||||||||||||||
North America | 7.2 | % | (0.2 | )% | (0.3 | )% | — | % | 6.7 | % | ||||
Europe Middle East Africa | 0.5 | % | (0.1 | )% | (3.8 | )% | (1.0 | )% | (4.4 | )% | ||||
Asia Pacific | 2.2 | % | (1.8 | )% | (2.8 | )% | — | % | (2.4 | )% | ||||
Latin America | (2.9 | )% | 5.4 | % | (14.7 | )% | (29.1 | )% | (41.3 | )% | ||||
__________________________
(1) Excludes net sales in Venezuela
Net sales of $1,022.9 million for the nine months of 2016 decreased $63.2 million or 5.8% compared with the prior-year period. Excluding Venezuela, net sales for the nine months of 2016 remained constant compared with the prior-year period. The net sales decrease was primarily due to lower net sales in Venezuela and unfavorable currency translation, partially offset by higher sales volume in SBM and Darex. As the dollar strengthened against the euro and other currencies, unfavorable currency translation affected all operating segments, primarily in EMEA and Latin America.
40
Net sales in Venezuela decreased $59.3 million or 86.4% in the nine months compared with the prior-year period, largely due to the impact of the devaluation of the local currency in the third quarter of 2015. The following table presents the Venezuela net sales, Adjusted Gross Profit, and Adjusted EBIT by operating segment as compared with the prior year period:
Venezuela Financial Performance for the Nine Months Ended September 30, 2016 | |||||||||||||||
($ in millions) | SCC | Darex | Corporate | Total VZ | |||||||||||
Net sales | $ | 5.3 | $ | 4.0 | $ | — | $ | 9.3 | |||||||
Adjusted Gross Profit | 2.3 | 2.2 | — | 4.5 | |||||||||||
Adjusted EBIT | 1.2 | 1.8 | (3.3 | ) | (0.3 | ) | |||||||||
Venezuela Financial Performance for the Nine Months Ended September 30, 2015 (1) | |||||||||||||||
($ in millions) | SCC | Darex | Corporate | Total VZ | |||||||||||
Net sales | $ | 53.4 | $ | 15.2 | $ | — | $ | 68.6 | |||||||
Adjusted Gross Profit | 28.5 | 6.1 | — | 34.6 | |||||||||||
Adjusted EBIT | 26.5 | 4.7 | (2.4 | ) | 28.8 | ||||||||||
Nine Months Ended September 30, 2016 versus Nine Months Ended September 30, 2015 - Change (%) | |||||||||||
SCC | Darex | Corporate | Total VZ | ||||||||
Net sales | (90.1 | )% | (73.7 | )% | NM | (86.4 | )% | ||||
Adjusted Gross Profit | (91.9 | )% | (63.9 | )% | NM | (87.0 | )% | ||||
Adjusted EBIT | (95.5 | )% | (61.7 | )% | 37.5 | % | (101.0 | )% | |||
__________________________
(1) | In the table above for the nine months ended September 30, 2015, Venezuela's Adjusted Gross Profit excludes the $13.7 million loss in Venezuela included in cost of goods sold and Adjusted EBIT excludes the $73.2 million currency and other financial losses in Venezuela incurred as a result of the currency devaluation in the third quarter of 2015. |
GCP's gross margin of 39.7% increased 310 basis points for the nine months compared to the prior-year period, primarily due to lower raw material costs, increased price, productivity improvements and a $13.7 million loss in Venezuela included in cost of goods sold in the third quarter of 2015 as a result of the currency devaluation. Adjusted Gross Margin of 39.8% increased 180 basis points for the nine months compared to the prior-year period, primarily due to lower raw material cost, increased pricing and productivity improvements, partially offset by the margin impact of Venezuela.
41
Net Income (Loss) Attributable to GCP Shareholders
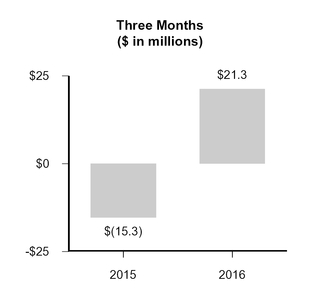
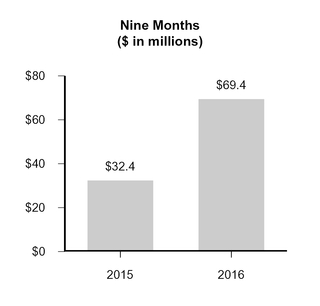
Net income attributable to GCP shareholders was $21.3 million for the third quarter of 2016, compared to a net loss attributable to GCP shareholders of $15.3 million for the prior-year quarter. The change was primarily due to the $73.2 million loss in Venezuela recorded in the third quarter of 2015 due to the devaluation of the local currency and lower income taxes, partially offset by lower segment operating income and higher interest and repositioning expenses.
Net income attributable to GCP shareholders increased to $69.4 million for the nine months of 2016. The increase was primarily due to the $73.2 million loss in Venezuela recorded in the third quarter of 2015 and lower income taxes, partially offset by higher interest and repositioning expenses.
Adjusted EBIT
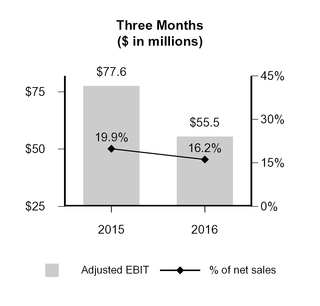
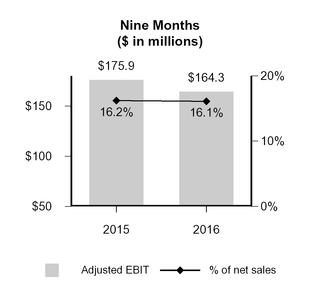
Adjusted EBIT was $55.5 million for the third quarter of 2016, a decrease of 28.5% compared with the prior-year quarter. The decrease was primarily due to a $21.9 million decrease in Venezuela’s Adjusted EBIT as a result of the devaluation of the local currency in the third quarter of 2015 and an increase in corporate and certain pension costs. Excluding Venezuela, Adjusted EBIT decreased 0.4%.
42
Adjusted EBIT was $164.3 million for the nine months, a decrease of 6.6% compared with the prior-year period. The decrease was primarily due to a $29.1 million decrease in Venezuela’s Adjusted EBIT as a result of the devaluation of the local currency in the third quarter of 2015 and an increase in corporate and certain pension costs, partially offset by higher segment operating income in SBM. Excluding Venezuela, Adjusted EBIT increased 11.9%, primarily due to the increase in Adjusted Gross Margin.
Adjusted EBIT Return On Invested Capital
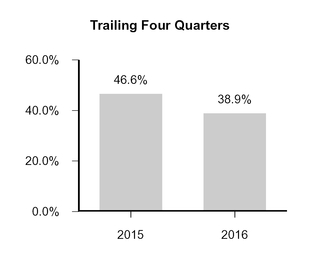
Adjusted EBIT Return On Invested Capital for the third quarter decreased to 38.9% on a trailing four quarters basis from 46.6% on the same basis for the prior-year period. The decrease was mainly driven by a 14.0% increase in invested capital that resulted primarily from the non-cash transfer of net assets from parent that occurred in conjunction with the Separation, partially offset by a 4.8% decrease in Adjusted EBIT due to the lower Adjusted EBIT in Venezuela.
We manage our operations with the objective of maximizing sales, earnings and cash flow over time. Doing so requires that we successfully balance our growth, profitability and working capital and other investments to support sustainable, long-term financial performance. We use Adjusted EBIT Return On Invested Capital as a performance measure in evaluating operating results, in making operating and investment decisions and in balancing the growth and profitability of our operations. Generally, we favor those businesses and investments that provide the highest return on invested capital.
43
Operating Segment Overview—Specialty Construction Chemicals (SCC)
Following is an overview of the financial performance of SCC for the third quarter and nine months compared with the corresponding prior-year periods.
Net Sales—SCC
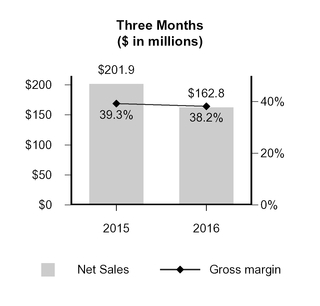
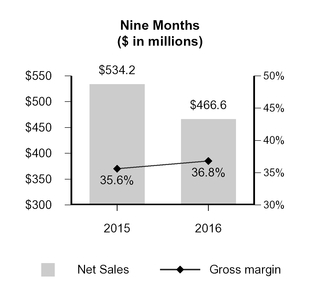
Net sales were $162.8 million for the third quarter, a decrease of 19.4% compared with the prior-year quarter. The decrease in net sales was due to lower net sales in Venezuela, primarily resulting from the currency devaluation in the third quarter of 2015, volume declines and unfavorable currency translation, partially offset by an increase in price. Excluding Venezuela, net sales declined 4.8% from the prior-year quarter.
Sales volumes declined in our Concrete business by 5.7% as a result of lower growth in EMEA, partially due to geopolitical events in the United Kingdom and Turkey, a slow-down of activity in the Middle East and North America and year-over-year declines in Latin America due to unfavorable macro-economic conditions, particularly in Brazil. The sales volume decline in our Concrete business was partially offset by a slight increase in our Cement business, primarily due to improved demand in Asia Pacific.
Currency translation had an unfavorable impact in all regions except Asia Pacific, where it provided a slight benefit. Price increases in Latin America were partially offset by declines in Europe and Asia Pacific.
Net sales were $466.6 million for the nine months, a decrease of 12.7% compared with the prior-year period. The decrease in net sales was due to lower net sales in Venezuela, primarily due to the currency devaluation in the third quarter of 2015 and unfavorable currency translation. Excluding Venezuela, net sales declined 4.1% from the prior-year period.
Sales volume increases in North America, Asia Pacific and Europe were more than offset by lower volumes in Latin America, primarily in Brazil. Currency translation had an unfavorable impact in all regions, particularly Latin America. Price increases in Latin America were partially offset by declines in Asia Pacific.
44
Segment Operating Income (SOI) and Margin—SCC
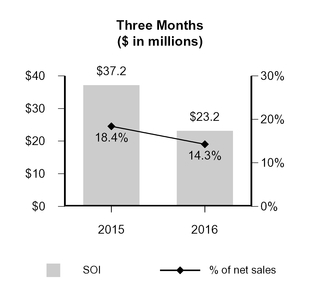
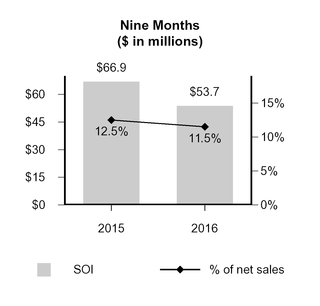
Gross profit was $62.2 million for the third quarter, a decrease of $17.1 million or 21.6% compared with the prior-year quarter, primarily due to lower gross profit in Venezuela, which declined $19.5 million over the same period. Gross margin was 38.2%, compared with 39.3% for the prior-year quarter, as lower raw material costs and productivity programs were more than offset by the margin impact of Venezuela.
Segment operating income was $23.2 million for the third quarter, a decrease of $14.0 million or 37.6% compared with the prior-year quarter, primarily due to an $18.8 million decrease in Venezuela's Adjusted EBIT as a result of the devaluation of the local currency in the third quarter of 2015. Excluding Venezuela, segment operating income increased 26.7%. Segment operating margin for the third quarter decreased 410 basis points to 14.3% compared with the prior-year quarter, primarily due to the impact of Venezuela, partially offset by lower raw material costs and productivity improvements.
Gross profit was $171.6 million for the nine months, a decrease of $18.4 million or 9.7% compared with the prior-year period, primarily due to lower gross profit in Venezuela, which declined $26.2 million in the same period. Gross margin was 36.8% compared with 35.6% for the prior-year period due to lower raw material cost and increases in productivity that more than offset the margin impact of Venezuela.
Segment operating income was $53.7 million for the nine months, a decrease of $13.2 million or 19.7% compared with the prior-year period, primarily due to a $25.3 million decrease in Venezuela's Adjusted EBIT as a result of the devaluation of the local currency in the third quarter of 2015, partially offset by improved gross margins. Excluding Venezuela, segment operating income increased 30.0%. Segment operating margin for the nine months was 11.5%, a decrease of 100 basis points compared with the prior-year period, primarily due to the margin impact of Venezuela, partially offset by lower raw material costs and productivity improvements.
45
Operating Segment Overview—Specialty Building Materials (SBM)
Following is an overview of the financial performance of SBM for the third quarter and nine months compared with the corresponding prior-year periods. SBM has minimal operations in Venezuela and is therefore not impacted by the Venezuela currency devaluation in the third quarter of 2015.
Net Sales—SBM
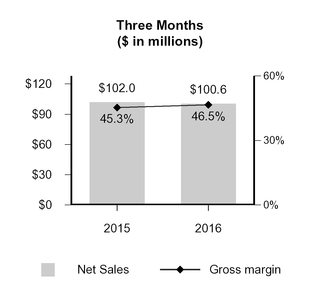
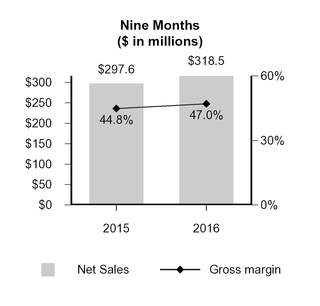
Net sales were $100.6 million for the third quarter, a decrease of 1.4% compared with the prior-year quarter. The decrease was due to lower sales volume and unfavorable currency translation, which more than offset higher pricing. Net sales increased in Specialty Businesses and Residential by 6.5% and 3.4%, respectively, while Building Envelope decreased 6.2%. Product line sales volumes grew 5.3% in North America and 4.5% in Latin America, partially offset by Asia Pacific, which was down 19.9%, and Europe, which declined 2.5%. The increase in North America reflects strength in Building Envelope, Fire Protection and Residential products. The decrease in sales volumes in Europe reflects geopolitical events in the United Kingdom and Turkey that negatively impacted demand in the third quarter. The year-over-year decline in Asia Pacific sales volumes was a result of the completion of a large project in the comparable prior-year period and a challenging market in China.
Currency translation had an unfavorable impact in Europe and Asia Pacific. We experienced price increases in North America, which were partially offset by declines in Europe and Asia Pacific.
Net sales were $318.5 million for the nine months, an increase of 7.0% compared with the prior-year period. The increase was due to higher sales volumes, partially offset by unfavorable currency translation. Net sales increased in all product lines, with Specialty Businesses, Residential, and Building Envelope up 14.0%, 11.6% and 2.9%, respectively. Product line sales volumes in Latin America, North America, and Europe were up 26.8%, 15.1%, and 3.3%, respectively, partially offset by Asia Pacific, which was down 5.6%. Currency translation had an unfavorable impact primarily in Europe and Asia Pacific.
46
Segment Operating Income (SOI) and Margin—SBM
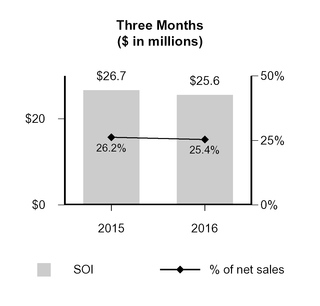
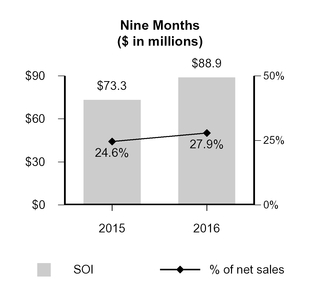
Gross profit was $46.8 million for the third quarter, an increase of 1.3% from the prior-year quarter. Gross margin was 46.5% compared with 45.3% for the prior-year quarter. The increase was primarily due to increased pricing, raw material deflation and productivity.
Segment operating income was $25.6 million for the third quarter, a decrease of 4.1% from the prior-year quarter. Segment operating margin for the third quarter was 25.4%, a decrease of 80 basis points from the prior-year quarter, primarily due to higher general and administrative costs.
Gross profit was $149.7 million for the nine months, an increase of 12.4% compared with the prior-year period. Gross margin was 47.0% compared with 44.8% for the prior-year period, primarily due to higher net sales, raw material deflation, favorable product line mix and productivity.
Segment operating income was $88.9 million for the nine months, an increase of 21.3% compared with the prior-year period. Segment operating margin for the nine months was 27.9%, an increase of 330 basis points compared with the prior-year period, primarily due to increased volume and raw material deflation, partially offset by higher general and administrative costs.
47
Operating Segment Overview—Darex Packaging Technologies (Darex)
Following is an overview of the financial performance of Darex for the third quarter and nine months compared with the corresponding prior-year periods.
Net Sales—Darex
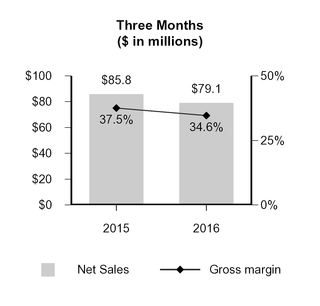
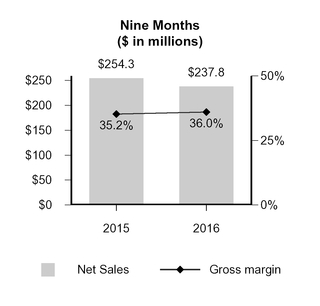
Net sales were $79.1 million for the third quarter, a decrease of 7.8% compared with the prior-year quarter. The decrease in net sales was primarily due to lower net sales in Venezuela due to the devaluation of local currency in the third quarter of 2015, unfavorable currency translation and lower price, which more than offset increased sales volumes, primarily in Asia Pacific and Latin America. Excluding Venezuela, net sales increased 0.5%.
Sales volume increased in Latin America and Asia Pacific, primarily due to higher demand for Coatings and Closures, and decreased in North America and EMEA, primarily due to lower demand for Sealants.
Net sales were $237.8 million for the nine months, a decrease of 6.5% compared with the prior-year period. The decrease in net sales was primarily due to lower net sales in Venezuela due to the devaluation of the local currency in the third quarter of 2015, unfavorable currency translation and lower price, which more than offset increased sales volume in North America, Asia Pacific and Latin America. Excluding Venezuela, net sales decreased 2.2%.
48
Segment Operating Income (SOI) and Margin—Darex
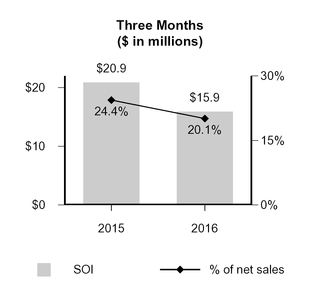
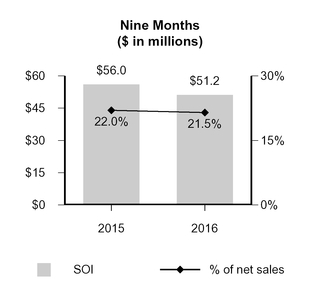
Gross profit was $27.4 million for the third quarter, a decrease of $4.8 million or 14.9% compared with the prior-year quarter primarily due to lower gross profit in Venezuela, which declined $4.4 million over the same period. Gross margin was 34.6% compared with 37.5% for the prior-year quarter, primarily due to the margin impact of Venezuela, other unfavorable currency translation and lower price, partially offset by lower raw material cost and productivity.
Segment operating income was $15.9 million for the third quarter, a decrease of $5.0 million or 23.9% compared with the prior-year quarter. The decrease was primarily due to a $3.8 million decrease in Venezuela's Adjusted EBIT as a result of the devaluation of the local currency in the third quarter of 2015, lower gross profit and higher general and administrative costs. Excluding Venezuela, segment operating income decreased 7.3%. Segment operating margin of 20.1% declined 430 basis points largely due to the impact of Venezuela, lower gross margin and an increase in general and administrative costs. Excluding Venezuela, segment operating margin declined 160 basis points, primarily due to higher general and administrative costs.
Gross profit was $85.7 million for the nine months, a decrease of $3.8 million or 4.2% compared with the prior-year period, primarily due to a $3.9 million decline in Venezuela gross profit. Gross margin increased from 35.2% to 36.0% primarily due to lower raw material cost and productivity improvements.
Segment operating income was $51.2 million for the nine months, a decrease of $4.8 million 8.6% from the prior-year period. The decrease was primarily due to a $2.9 million decrease in Venezuela's Adjusted EBIT and higher general and administrative costs. Excluding Venezuela, segment operating income decreased 3.7% and segment operating margin decreased 50 basis points to 21.5% compared to the prior-year period.
49
Corporate Overview
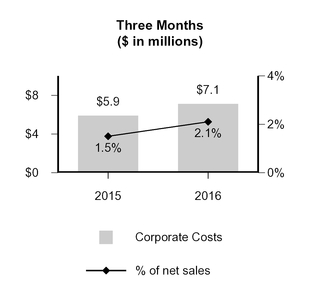
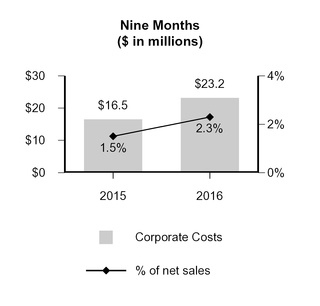
Corporate costs include certain functional costs, impacts of foreign exchange and other corporate costs such as certain performance-based incentive compensation and public company costs.
Corporate costs were $7.1 million for the third quarter, an increase of 20.3% compared with the prior-year quarter. The increase was primarily due to higher incurred public company costs and incentive compensation compared with similar costs allocated by Grace on a pre-Separation basis in the prior-year period.
Corporate costs were $23.2 million for the nine months, an increase of 40.6% compared with the prior-year period. The increase was primarily due to foreign exchange losses related to Venezuela, and higher public company costs and incentive compensation compared with similar costs allocated by Grace on a pre-Separation basis in the prior year period.
Defined Benefit Pension and Gain on Termination and Curtailments
Certain pension costs for the third quarter and nine months were $2.1 million and $6.3 million, respectively compared with $1.3 million and $3.8 million, respectively for the corresponding prior-year periods. Actual pension costs incurred by GCP as a stand-alone company post-Separation were higher than the pension costs allocated by Grace in the periods prior to the Separation, resulting in the increase from the prior year for both periods.
Pension mark-to-market and other related costs, net were $2.7 million for the nine months, compared with $0.5 million in the prior-year period. The $2.2 million increase was primarily due to a $2.4 million liability recorded in the first quarter of 2016 relating to a U.S. multi-employer plan that GCP participants withdrew from, triggering a partial withdrawal under ERISA rules.
Gain on termination and curtailment of pension and other post-retirement plans of $0.2 million for the third quarter is attributable to GCP's amendment of a non-U.S. pension plan. In addition, gain on termination and curtailment of pension and other post-retirement plans of $2.6 million for the nine months included a gain on termination and curtailment of a non-U.S. pension plan of $1.4 million and a $1.0 million gain on curtailment of a U.S. other post-retirement plan.
50
Restructuring and Repositioning Expenses
GCP incurred $0.4 million and $1.4 million of restructuring expenses during the third quarter and nine months ended September 30, 2016, compared with $2.3 million and $9.9 million for the corresponding prior-year periods. The decrease in both periods was due to fewer restructuring actions in 2016 compared to 2015.
Post-Separation, GCP has incurred expenses related to the transition to becoming a stand-alone public company. These costs are expected to range from $18.0 million to $20.0 million with substantially all of these expenses expected to be incurred within 18 months of the Separation. Repositioning expenses for the three and nine months ended September 30, 2016, were as follows:
(In millions) | Three Months Ended September 30, 2016 | Nine Months Ended September 30, 2016 | |||||
Professional fees | $ | 3.1 | $ | 7.3 | |||
Software and IT implementation fees | 0.8 | 2.5 | |||||
Employee-related costs | 1.4 | 4.5 | |||||
Total | $ | 5.3 | $ | 14.3 | |||
We exclude restructuring and repositioning expenses from Adjusted EBIT.
Interest and Financing Expenses
Net interest and financing expenses were $18.8 million and $49.0 million for the third quarter and nine months, compared to $0.6 million and $1.7 million in the corresponding prior-year periods, primarily due to issuance of $525.0 million in senior notes and $275.0 million in term loans during the 2016 first quarter.
On August 25, 2016, GCP refinanced the existing Credit Agreement with a syndicate of banks (the “Amended Credit Agreement”). The Amended Credit Agreement reduced the interest rate margins applicable to the Term Loan from base rate plus a margin of 3.5% or LIBOR plus a margin of 4.5% to a base rate plus a margin of 2.25% or LIBOR plus a margin of 3.25% at GCP’s option. The $274.3 million outstanding principal balance was replaced by a like aggregate $274.3 million principal balance with substantially similar terms to the Credit Agreement. In conjunction with the refinancing, the Company recognized accelerated amortization of $0.1 million for a portion of the associated previously deferred debt issuance costs and expensed $1.2 million of third-party financing costs. These amounts are included in "Interest expense and related financing costs" in the Consolidated Statement of Operations for the third quarter and the nine months.
Income Taxes
The income tax provision at the U.S. federal corporate rate of 35% for the nine months and the prior-year period would have been $35.0 million and $31.9 million, respectively. The primary differences between these amounts and the recorded provision for income taxes of $29.8 million and $58.2 million, respectively, are, in the current period, the benefit of lower tax rates in foreign jurisdictions, and in the prior-year period, a provision for separation-related repatriation of foreign earnings, partially offset with a benefit of lower tax rates in foreign jurisdictions. Our effective tax rate may change over time as the amount or mix of income and taxes changes among the jurisdictions in which we are subject to tax. The foreign rate differential in the third quarter and prior year-end resulted in decreases to the annualized effective tax rate of 7.4% and 6.4%, respectively.
As of September 30, 2016, the Company has the intent and ability to indefinitely reinvest undistributed earnings of its foreign subsidiaries outside the United States.
In 2015, in connection with the Separation, Grace repatriated a total of $173.1 million of foreign earnings from foreign subsidiaries transferred to GCP pursuant to the Separation. Such amount was determined based on an analysis of each non-U.S. subsidiary's requirements for working capital, debt repayment and strategic initiatives. In 2015, on a stand-alone basis (see Note 4), GCP incurred $19.9 million in tax expense as a result of such repatriation, increasing our 2015 effective tax rate by 15.9 percentage points when compared to the U.S. federal statutory rate. The tax effect of the repatriation is determined by several variables including the tax rate applicable to the entity making the distribution, the cumulative earnings and associated foreign taxes of the entity and the extent to which those earnings may have already been taxed in the U.S.
51
GCP believes that the Separation is a one-time, non-recurring event and that recognition of deferred taxes of undistributed earnings during 2015 would not have occurred if not for the Separation. Subsequent to Separation, GCP expects undistributed prior-year earnings of our foreign subsidiaries to remain permanently reinvested except in certain instances where repatriation of such earnings would result in minimal or no tax. GCP bases this assertion on:
(1) | the expectation that it will satisfy our U.S. cash obligations in the foreseeable future without requiring the repatriation of prior-year foreign earnings; |
(2) | plans for significant and continued reinvestment of foreign earnings in organic and inorganic growth initiatives outside the U.S.; and |
(3) | remittance restrictions imposed by local governments. |
GCP will continually analyze and evaluate our cash needs to determine the appropriateness of our indefinite reinvestment assertion.
See Note 4 to the Consolidated Financial Statements for additional information regarding income tax.
Financial Condition, Liquidity, and Capital Resources
Following is an analysis of our financial condition, liquidity and capital resources at September 30, 2016.
Our principal uses of cash generally have been capital investments and acquisitions and working capital investments. In connection with our Separation from Grace, we incurred $800.0 million of indebtedness, including $750.0 million borrowed to pay a distribution to Grace prior to the Separation and approximately $50 million retained to meet operating requirements and to pay separation associated fees. We believe our liquidity and capital resources, including cash on hand, cash we expect to generate during 2016 and thereafter, future borrowings if any, and other available liquidity and capital resources, are sufficient to finance our operations and growth strategy and to meet our debt obligations.
Cash Resources and Available Credit Facilities
At September 30, 2016, we had available liquidity of $429.1 million, consisting of $148.5 million in cash and cash equivalents ($36.4 million in the U.S.), $244.0 million available under our revolving credit facility, and $36.6 million of available liquidity under various non-U.S. credit facilities.
Our non-U.S. credit facilities are extended to various subsidiaries that use them primarily to issue bank guarantees supporting trade activity and to provide working capital during occasional cash shortfalls. We generally renew these credit facilities as they expire.
In conjunction with the Separation, we repatriated $173.1 million from our non-U.S. subsidiaries in the third and fourth quarters of 2015. We expect to have sufficient cash and liquidity in our non-U.S. subsidiaries to fund working capital and operating needs.
We expect to meet U.S. cash and liquidity requirements with cash that was on hand at time of Separation, cash we expect to generate during 2016 and thereafter, future borrowings if any, and other available liquidity including royalties and service fees from our foreign subsidiaries. We may also repatriate future foreign earnings if that results in minimal or no U.S. tax consequences. We expect to have sufficient cash and liquidity to finance our U.S. operations and growth strategy and to meet our debt obligations in the U.S.
52
The following table summarizes our non-U.S. credit facilities as of September 30, 2016:
(In millions) | Maximum Borrowing Amount | Available Liquidity | Expiration Date | ||||||
China | $ | 11.5 | $ | 5.6 | Open end | ||||
India | 10.0 | 2.9 | Open end | ||||||
Singapore | 7.6 | 7.6 | Open end | ||||||
Australia | 6.0 | 1.8 | Open end | ||||||
Canada | 5.7 | 2.6 | 2/3/2017 | ||||||
Turkey | 3.8 | 3.6 | Open end | ||||||
United Arab Emirates | 2.5 | 2.5 | 11/30/2016 | ||||||
Other countries | 11.0 | 10.0 | Open end | ||||||
Total | $ | 58.1 | $ | 36.6 | |||||
Analysis of Cash Flows
The following table summarizes our cash flows for the nine months and prior-year period:
Nine Months Ended September 30, | |||||||
(In millions) | 2016 | 2015 | |||||
Net cash provided by operating activities | $ | 73.0 | $ | 101.9 | |||
Net cash (used in) provided by investing activities | (32.8 | ) | 14.2 | ||||
Net cash provided by (used in) financing activities | 7.1 | (84.0 | ) | ||||
Effect of currency exchange rate changes on cash and cash equivalents | 2.6 | (53.1 | ) | ||||
Increase (decrease) in cash and cash equivalents | 49.9 | (21.0 | ) | ||||
Cash and cash equivalents, beginning of period | 98.6 | 120.9 | |||||
Cash and cash equivalents, end of period | $ | 148.5 | $ | 99.9 | |||
Net cash provided by operating activities for the nine months was $73.0 million, compared with $101.9 million for the prior-year period. The year-over-year change was primarily due to cash paid for interest related to our senior notes, which were issued in fiscal 2016, and an increase in cash paid for repositioning expenses, partially offset by a decrease in cash paid for restructuring expenses.
Net cash used for investing activities for the nine months was $32.8 million, compared with net cash provided by investing activities of $14.2 million for the prior-year period. The year-over-year change was primarily due to an increase in capital expenditures and the receipt of a payment from Grace of approximately $40 million on a related party note in 2015.
Net cash provided by financing activities for the nine months was $7.1 million, compared with net cash used by financing activities of $84.0 million in the prior-year period. The year-over-year change in cash flow was primarily due to proceeds from the issuance of bonds and indebtedness incurred during the first quarter of 2016, partially offset by a distribution paid to Grace and other transfers to Grace in connection with the Separation.
Included in net cash provided by operating activities for the nine months ended September 30, 2016 and September 30, 2015, are restructuring payments of $2.8 million and $7.9 million, respectively, and repositioning payments of $14.7 million for the nine months ended September 30, 2016 for professional fees and employee-related costs. These cash flows totaled $17.5 million and $7.9 million for the nine months and prior-year period, respectively. We do not include these cash flows when evaluating the performance of our businesses.
Debt and Other Contractual Obligations
Total debt outstanding at September 30, 2016 was $806.6 million. See Note 3, Debt and Other Financial Instruments to the Consolidated Financial Statements for additional information regarding our debt.
53
See Note 7, Commitments and Contingent Liabilities to the Consolidated Financial Statements for a discussion of Financial Assurances.
Employee Benefit Plans
See Note 5 to the Consolidated Financial Statements for further discussion of Pension Plans and Other Postretirement Benefit Plans.
Multiemployer Benefit Plans
Prior to the Separation, Grace sponsored funded and unfunded defined benefit pension and other postretirement benefit plans that GCP employees and employees from other Grace businesses participated in (the “Shared Plans”). For purposes of the financial statements in periods prior to the Separation, the Shared Plans were accounted for as multiemployer benefit plans. Accordingly, we did not record an asset or liability to recognize the funded status of these plans in periods presented prior to the Separation.
In the fourth quarter of 2015, in preparation for the Separation, certain international pension plans were legally separated. Previously, the funded status of these Shared Plans was not reflected on our balance sheet as the plans were accounted for as multiemployer benefit plans. Upon legal separation of the international plans in 2015, we recorded the funded status as of December 31, 2015, resulting in an approximate $4 million increase to net pension liabilities. In the first quarter of 2016, certain Shared Plans in the U.S. were legally separated, resulting in an approximate $44 million increase to net pension liabilities as of March 31, 2016.
Defined Benefit Pension Plans
In the nine months, we made an accelerated contribution to the trusts that hold assets of the U.S. qualified pension plans of approximately $1 million. We intend to fund non-U.S. pension plans based upon applicable legal requirements as well as actuarial and trustee recommendations. We contributed $1.9 million to these plans during the nine months compared with $1.7 million during the prior-year period.
Other Contingencies
See Note 7 to the Consolidated Financial Statements for a discussion of other contingencies.
Inflation
We recognize that inflationary pressures may have an adverse effect on us through higher asset replacement costs and higher raw materials and other operating costs. We try to minimize these impacts through effective control of operating expenses and productivity improvements as well as price increases to customers.
We estimate that the cost of replacing our property and equipment today is greater than its historical cost. Accordingly, our depreciation expense would be greater if the expense were stated on a current cost basis.
Venezuela
Effective January 1, 2010, we began to account for Venezuela as a highly inflationary economy. As a result, the functional currency of our Venezuelan subsidiary became the U.S. dollar; therefore, all translation adjustments are reflected in net income in the accompanying Consolidated Statements of Operations. The official exchange rate (CENCOEX) of 4.3 was used to remeasure our financial statements from bolivars to U.S. dollars upon Venezuela's designation as a highly inflationary economy. The operating environment in Venezuela is challenging, with high inflation, governmental restrictions in the form of currency exchange, price and margin controls, importation of raw materials, labor unrest, and the possibility of government actions such as further devaluations, business occupations or intervention and expropriation of assets. In addition, the foreign exchange controls in Venezuela limit our ability to repatriate earnings and the Venezuela subsidiary’s ability to remit dividends and pay intercompany balances at any official exchange rate or at all.
54
In March 2013, the Venezuelan government launched a new foreign exchange mechanism called the "Complimentary System of Foreign Currency Acquirement" (or SICAD1). The SICAD1 operated similarly to an auction system and allowed entities in specific sectors to bid for U.S. dollars to be used for specified import transactions. In March 2014, the Venezuelan government launched another foreign exchange mechanism, known as the SICAD2, which operated similarly to the SICAD1. Neither the SICAD1 nor the SICAD2 changed or eliminated the official exchange rate of the bolivar to the U.S. dollar. Until September 30, 2015, we used the official exchange rate of 6.3 bolivars to one U.S. dollar for remeasurement purposes, which had not changed since February 13, 2013.
In February 2015, the Venezuelan government unified SICAD1 and SICAD2 into a single exchange mechanism, called SICAD. Additionally, a new exchange mechanism, SIMADI, was also implemented.
Based on company-specific and macroeconomic developments in Venezuela in the prior-year quarter of 2015, including changed expectations about our ability to import raw materials at the official exchange rate in the future, the extended period of time since we have received payment at the official exchange rate, the increase in the rate of inflation and the weaker outlook for the Venezuelan economy, we determined that it was no longer appropriate to use the official exchange rate. Effective September 30, 2015, we began accounting for our results at the SIMADI rate. Based on the SIMADI rate of 199 bolivars to one U.S. dollar, we recorded a pre-tax charge of $73.2 million in the third quarter of 2015 to reflect the devaluation of net monetary assets and the impairment of non-monetary assets within our Venezuela subsidiary. This charge included $40.2 million for cash, $28.9 million for working capital and $4.1 million for properties and equipment; we recorded $13.7 million of this amount related to inventory to cost of goods sold and $59.6 million related to other assets and liabilities as a separate line item in our Consolidated Statement of Operations.
In mid-February 2016, changes to the currency exchange systems were announced which eliminated the SICAD exchange rate and replaced the name SIMADI rate with DICOM, a floating exchange rate. The DICOM rate of 654 bolivars to one U.S. dollar at the end of the third quarter 2016, an approximate 230% increase from the rate at December 31, 2015. Accordingly, the Company has recorded a $4.2 million loss within “Other (income) expense, net” in the Consolidated Statement of Operations for the nine months ended September 30, 2016 to reflect the remeasurement of the Venezuela subsidiary’s financial statements to U.S. dollars.
As of September 30, 2016, we had approximately $2.8 million of net monetary and non-monetary assets in our Venezuela subsidiary held in local currency, consisting primarily of cash and cash equivalents, trade accounts receivable, inventory, other current assets, accounts payable and other current liabilities. We believe, based on unofficial, open market exchange rates, the DICOM rate may continue to increase, which would adversely impact our financial results. For illustrative purposes only, using a hypothetical increase in the DICOM rate to 1,000 bolivar per U.S. dollar, we would record a loss of approximately $1.1 million based on the local currency net asset position of the Venezuela subsidiary as of September 30, 2016. Additionally, our net sales and net earnings would be adversely impacted by the further rate increase.
SCC and Darex have operated in Venezuela for several decades, with net sales in that country representing approximately 8% and 4%, respectively, of each segment’s net sales in 2015. During the third quarter of 2016, net sales in our Venezuela subsidiary were less than 1% of GCP’s total net sales, primarily due to the currency devaluation in the third quarter of 2015. The following table presents net sales, Adjusted Gross Profit, and Adjusted EBIT for our Venezuelan subsidiary for the three and nine months ended September 30, 2016 compared to the same periods in the prior year:
Three Months Ended September 30, | Nine Months Ended September 30, | ||||||||||||||
(In millions) | 2016 | 2015(1) | 2016 | 2015(1) | |||||||||||
Net sales | $ | 3.4 | $ | 41.5 | $ | 9.3 | $ | 68.6 | |||||||
Adjusted Gross Profit | 1.3 | 25.2 | 4.5 | 34.6 | |||||||||||
Adjusted EBIT | 0.9 | 22.8 | (0.3 | ) | 28.8 | ||||||||||
__________________________
(1) | In the table above for the three and nine months ended September 30, 2015, Venezuela's Adjusted Gross Profit excludes the $13.7 million loss in Venezuela included in cost of goods sold and Adjusted EBIT excludes the $73.2 million currency and other financial losses in Venezuela incurred as a result of the currency devaluation in the third quarter of 2015. |
55
The inability to use the Venezuela cash outside the country has not had a material impact on our ability to finance our global operations or meet our debt obligations.
Critical Accounting Estimates
See the "Critical Accounting Estimates" heading in Item 7 of our Form 10-K for the year ended December 31, 2015 for a discussion of our critical accounting estimates.
Recent Accounting Pronouncements
See Note 1 to the Consolidated Financial Statements for a discussion of recent accounting pronouncements and their potential effect on our results of operations, financial position and related disclosures.
56
Item 3. QUANTITATIVE AND QUALITATIVE DISCLOSURES ABOUT MARKET RISK
With respect to information disclosed in the "Quantitative and Qualitative Disclosures About Market Risk" section of our Annual Report on Form 10-K for the year ended December 31, 2015 ("2015 Annual Report"), more recent numerical measures and other information are available in the "Financial Statements" and "Management's Discussion and Analysis of Financial Condition and Results of Operations" sections of this Report. These more recent measures and the information disclosed in the "Quantitative and Qualitative Disclosures About Market Risk" section of our 2015 Annual Report are incorporated herein by reference.
Item 4. CONTROLS AND PROCEDURES
Management’s Evaluation of Disclosure Controls and Procedures
As of the end of the period covered by this report, our principal executive officer and principal financial officer evaluated the effectiveness of our disclosure controls and procedures, as defined in Rule 13a-15(e) of the Securities Exchange Act of 1934 (the "Exchange Act"), which are designed to provide reasonable assurance that we are able to record, process, summarize and report the information required to be disclosed in our reports under the Exchange Act within the time periods specified in SEC rules and forms. Based on their evaluation, our principal executive officer and principal financial officer concluded that our disclosure controls and procedures were effective to provide reasonable assurance that the information required to be disclosed in reports that we file or submit under the Exchange Act is accumulated and communicated to management, and made known to our principal executive officer and principal financial officer, on a timely basis to ensure that it is recorded, processed, summarized and reported within the time periods specified in the SEC’s rules and forms.
Changes in Internal Control Over Financial Reporting
There were no changes in our internal control over financial reporting during the quarter ended September 30, 2016, that have materially affected, or are reasonably likely to materially affect, our internal control over financial reporting.
57
PART II. OTHER INFORMATION
Item 1. LEGAL PROCEEDINGS
Information with respect to this Item may be found in Note 7 to the Consolidated Financial Statements in this Quarterly Report on Form 10-Q, which information is incorporated herein by reference.
Additional information on our commitments and contingencies can be found in our Annual Report on Form 10-K for our fiscal year ended December 31, 2015.
Item 1A. RISK FACTORS
There are no material changes from the risk factors as previously disclosed in our Annual Report on Form 10-K for our fiscal year ended December 31, 2015.
Item 6. EXHIBITS
Exhibit No. | Description of Exhibit | |
31.1* | Certification of the Chief Executive Officer pursuant to Rule 13a-14(a) of the Exchange Act, as adopted pursuant to Section 302 of the Sarbanes-Oxley Act of 2002 | |
31.2* | Certification of the Chief Financial Officer pursuant to Rule 13a-14(a) of the Exchange Act, as adopted pursuant to Section 302 of the Sarbanes-Oxley Act of 2002 | |
32** | Certification of the Chief Executive Officer and Chief Financial Officer under Section 906 of the Sarbanes-Oxley Act of 2002 | |
101.INS* | XBRL Instance Document | |
101.SCH* | XBRL Taxonomy Extension Schema | |
101.CAL* | XBRL Taxonomy Extension Calculation Linkbase | |
101.DEF* | XBRL Taxonomy Extension Definition Linkbase | |
101.LAB* | XBRL Taxonomy Extension Label Linkbase | |
101.PRE* | XBRL Taxonomy Extension Presentation Linkbase | |
* Filed herewith.
** Furnished herewith.
58
SIGNATURES
In accordance with the requirements of the Securities Exchange Act of 1934, the registrant caused this report to be signed on its behalf by the undersigned, thereunto duly authorized.
GCP Applied Technologies Inc. (Registrant) | ||
Date: November 9, 2016 | By: | /s/ GREGORY E. POLING |
Gregory E. Poling President and Chief Executive Officer (Principal Executive Officer) | ||
Date: November 9, 2016 | By: | /s/ DEAN P. FREEMAN |
Dean P. Freeman Vice President and Chief Financial Officer (Principal Financial Officer) | ||
Date: November 9, 2016 | By: | /s/ KENNETH S. KOROTKIN |
Kenneth S. Korotkin Vice President and Controller (Principal Accounting Officer) | ||
59
EXHIBIT INDEX
Exhibit No. | Description of Exhibit | |
31.1* | Certification of the Chief Executive Officer pursuant to Rule 13a-14(a) of the Exchange Act, as adopted pursuant to Section 302 of the Sarbanes-Oxley Act of 2002 | |
31.2* | Certification of the Chief Financial Officer pursuant to Rule 13a-14(a) of the Exchange Act, as adopted pursuant to Section 302 of the Sarbanes-Oxley Act of 2002 | |
32** | Certification of the Chief Executive Officer and Chief Financial Officer under Section 906 of the Sarbanes-Oxley Act of 2002 | |
101.INS* | XBRL Instance Document | |
101.SCH* | XBRL Taxonomy Extension Schema | |
101.CAL* | XBRL Taxonomy Extension Calculation Linkbase | |
101.DEF* | XBRL Taxonomy Extension Definition Linkbase | |
101.LAB* | XBRL Taxonomy Extension Label Linkbase | |
101.PRE* | XBRL Taxonomy Extension Presentation Linkbase | |
* Filed herewith.
** Furnished herewith.
60