Attached files
| file | filename |
|---|---|
| EX-32 - EXHIBIT 32 - GCP Applied Technologies Inc. | exh32certification.htm |
| EX-31.2 - EXHIBIT 31.2 - GCP Applied Technologies Inc. | exh312certification.htm |
| EX-31.1 - EXHIBIT 31.1 - GCP Applied Technologies Inc. | exh311certification.htm |
| EX-24 - EXHIBIT 24 - GCP Applied Technologies Inc. | exh24powerofattrny.htm |
| EX-23 - EXHIBIT 23 - GCP Applied Technologies Inc. | exh23auditorconsent.htm |
| EX-21 - EXHIBIT 21 - GCP Applied Technologies Inc. | exh21sublist.htm |
| EX-10.23 - EXHIBIT 10.23 - GCP Applied Technologies Inc. | exh1023khollandofferltr.htm |
| EX-10.10 - EXHIBIT 10.10 - GCP Applied Technologies Inc. | exh1010suppexecretplan.htm |
UNITED STATES
SECURITIES AND EXCHANGE COMMISSION
WASHINGTON, D.C. 20549
FORM 10-K
ý | ANNUAL REPORT PURSUANT TO SECTION 13 OR 15(d) OF THE SECURITIES EXCHANGE ACT OF 1934 | |
For the fiscal year ended December 31, 2016 | ||
OR | ||
o | TRANSITION REPORT PURSUANT TO SECTION 13 OR 15(d) OF THE SECURITIES EXCHANGE ACT OF 1934 | |
Commission File Number 1-137533 | ||
GCP Applied Technologies Inc.
Delaware (State of Incorporation) | 47-3936076 (I.R.S. Employer Identification No.) | |
62 Whittemore Avenue, Cambridge, Massachusetts 02140-1623
(617) 876-1400
(Address and phone number of principal executive offices)
Securities registered pursuant to Section 12(b) of the Exchange Act: | ||
Title of each class | Name of each exchange on which registered | |
Common Stock, $.01 par value | New York Stock Exchange, Inc. | |
Securities registered pursuant to Section 12(g) of the Act:
None
Indicate by check mark if the registrant is a well-known seasoned issuer, as defined in Rule 405 of the Securities Act. Yes o No ý
Indicate by check mark if the registrant is not required to file reports pursuant to Section 13 or 15(d) of the Act. Yes o No ý
Indicate by check mark whether the registrant (1) has filed all reports required to be filed by Section 13 or 15(d) of the Securities Exchange Act of 1934 during the preceding 12 months (or for such shorter period that the registrant was required to file such reports) and (2) has been subject to such filing requirements for the past 90 days. Yes ý No o
Indicate by check mark whether the registrant has submitted electronically and posted on its corporate Website, if any, every Interactive Data File required to be submitted and posted pursuant to Rule 405 of Regulation S-T (§232.405 of this chapter) during the preceding 12 months (or for such shorter period that the registrant was required to submit and post such files). Yes ý No o
Indicate by check mark if disclosure of delinquent filers pursuant to Item 405 of Regulations S-K is not contained herein and will not be contained, to the best of registrant's knowledge, in definitive proxy or information statements incorporated by reference in Part III of this Form 10-K or any amendment to this Form 10-K. ý
Indicate by check mark whether the registrant is a large accelerated filer, an accelerated filer, a non-accelerated filer, or a smaller reporting company. See the definitions of "large accelerated filer," "accelerated filer," and "smaller reporting company" in Rule 12b-2 of the Exchange Act.
Large accelerated filer o | Accelerated filer o | |
Non-accelerated filer ý (Do not check if a smaller reporting company) | Smaller reporting company o | |
Indicate by check mark whether the registrant is a shell company (as defined in Rule 12b-2 of the Act). Yes o No ý
The aggregate market value of GCP Applied Technologies' voting and non-voting common equity held by non-affiliates as of June 30, 2016 (the last business day of the registrant's most recently completed second fiscal quarter) based on the closing sale price of $26.04 as reported on the New York Stock Exchange was $1,844,781,249.
At February 27, 2017, there were 71,185,929 shares of GCP Applied Technologies Common Stock, $.01 par value, outstanding.
DOCUMENTS INCORPORATED BY REFERENCE
Portions of the definitive proxy statement for our 2017 Annual Meeting of Stockholders are incorporated by reference in Part III of this Form 10-K.
TABLE OF CONTENTS
PART I | ||
PART II | ||
PART III | ||
PART IV | ||
Presentation of Information
Unless the context requires otherwise, references to "GCP Applied Technologies Inc.", "GCP", "we", "us", "our" and "the Company" refer to GCP Applied Technologies Inc., and its consolidated subsidiaries for periods subsequent to its separation from W.R. Grace & Co. on February 3, 2016. For periods prior to February 3, 2016, these terms refer to the combined historical business and operations of W.R. Grace & Co.’s construction products and packaging technologies businesses as they were historically managed as part of W.R. Grace & Co. Unless the context requires otherwise, references to "Grace" refer to W.R. Grace & Co., and its consolidated subsidiaries, which is the Company’s former parent company. References in this Annual Report on Form 10-K to the "Separation" refer to the legal separation and transfer of Grace’s construction products and packaging technologies businesses to the Company through a dividend distribution of all of the then-outstanding common stock of GCP to Grace shareholders on February 3, 2016.
Forward-Looking Statements
This document contains, and our other public communications may contain, forward-looking statements, that is, information related to future, not past, events. Such statements generally include the words "believes," "plans," "intends," "targets," "will," "expects," "suggests," "anticipates," "outlook," "continues" or similar expressions. Forward-looking statements include, without limitation, expected financial positions; results of operations; cash flows; financing plans; business strategy; operating plans; capital and other expenditures; competitive positions; growth opportunities for existing products; benefits from new technology and cost reduction initiatives, plans and objectives; and markets for securities. Like other businesses, we are subject to risks and uncertainties that could cause our actual results to differ materially from our projections or that could cause other forward-looking statements to prove incorrect. Factors that could cause actual events to materially differ from those contained in the forward-looking statements include, without limitation: risks related to foreign operations, especially in emerging regions; the cost and availability of raw materials and energy; the effectiveness of GCP's research and development and growth investments; acquisitions and divestitures of assets and gains and losses from dispositions; developments affecting GCP’s outstanding indebtedness; developments affecting GCP's funded and unfunded pension obligations; GCP's legal and environmental proceedings; uncertainties related to the Company’s ability to realize the anticipated benefits of the separation transaction; the inability to establish or maintain certain business relationships and relationships with customers and suppliers or the inability to retain key personnel; costs of compliance with environmental regulation and those factors set forth in Item 1A of this Annual Report on Form 10-K, Quarterly Reports on Form 10-Q and Current Reports on Form 8-K, which have been filed with the Securities and Exchange Commission ("SEC") and are available on the Internet at www.sec.gov. Our reported results should not be considered as an indication of our future performance. Readers are cautioned not to place undue reliance on our projections and forward-looking statements, which speak only as of the date thereof. We undertake no obligation to publicly release any revisions to the projections and forward-looking statements contained in this document, or to update them to reflect events or circumstances occurring after the date of this document.
Trademarks and Trade Names
We own or have rights to trademarks, service marks, copyrights and trade names that we use in conjunction with the operation of our business, including, except as otherwise indicated, the trademarks, service marks or trade names used in this report. A mark designated with a circled “R” (e.g., ADVA®) means that the mark has been registered in the USA or other countries where we sell products. This report may also include trademarks, service marks and trade names of other companies. Each trademark, service mark or trade name of any other company appearing in this Annual Report on Form 10-K belongs to its holder. Unless otherwise indicated, use or display by us of other parties’ trademarks, service marks or trade names is not intended to and does not imply a relationship with the trade name owner, or endorsement or sponsorship by us of the trademark, service mark or trade name owner.
1
PART I.
Item 1. BUSINESS
BUSINESS OVERVIEW
GCP Applied Technologies Inc. produces and sells specialty construction chemicals, specialty building materials and packaging sealants and coatings through three global operating segments in which we have achieved leadership positions. Specialty Construction Chemicals manufactures and markets concrete admixtures, which enhance the properties of concrete and other cementitious construction materials, and cement additives, which improve the performance of Portland cement, the most widely used construction material in the world. Specialty Building Materials manufactures and markets building envelope, residential building, and specialty construction products that protect structures from water, vapor transmission, air penetration, and fire damage. Darex Packaging Technologies manufactures and markets sealants and coatings that safeguard the packaging materials and preserve the contents of beverage and food containers and other consumer and industrial applications.
GCP Applied Technologies Inc. was incorporated on May 1, 2015 for the purpose of holding the construction products and packaging technologies businesses of W. R. Grace & Co. On February 3, 2016, Grace shareholders received one common share of GCP for every one common share of Grace held and the construction products and packaging technologies businesses of Grace were transferred to GCP, thereby completing our legal separation from Grace ("the Separation"). On February 4, 2016, we began "regular way" trading on the New York Stock Exchange under the ticker symbol "GCP."
For the year ended December 31, 2016, we had net sales of $1.4 billion, income before income taxes of $106.0 million and net income of $72.8 million. Approximately 60% of our 2016 sales were generated outside the United States and we operate in approximately 35 countries.
Strategy Overview
Our objective is to deliver value to shareholders by growing our sales, earnings, cash flow, and return on invested capital through the implementation of our business strategies. The Specialty Construction Chemicals, Specialty Building Materials and Darex Packaging Technologies segments produce and market a portfolio of high-performance products for leading global concrete and cement producers, architects, engineers and developers, packaging and closure manufacturers, and food and beverage companies. Our products must satisfy our customers’ well-defined performance requirements and specifications to provide high value, although they typically represent a low percentage of the total cost of our customers’ end-products or projects.
We implement the following growth strategies using a number of key levers to accelerate progress toward our objective:
Leverage Segment Leadership Positions for Sales Growth — We utilize our global manufacturing operations, technical service and support footprint, research and development capabilities, and sales and marketing organization to increase our geographic and customer penetration worldwide. Our sales force employs our applied intelligence framework - a combination of integrated customer relationship management ("CRM") tools and capabilities and cross-product knowledge - to pursue higher value project-centric and customer-centric opportunities for GCP’s complete portfolio of high-performing products. We make targeted investments to expand our capabilities in geographies and segments where trends and economic cycles present the best opportunities.
Strengthen and Enhance Our Segment Positions with Product Innovation — We seek to strengthen our position as an industry innovator by investing in research and development activities focused on commercializing differentiated products and services and, where possible, creating new product categories. To drive this innovation, we employ our business model of introducing and supporting new technologies and categories through our centralized research and development center in Cambridge, Massachusetts as well as our regional global applications labs. Examples of our category creation successes include our patented intelligent concrete monitoring system, VERIFI®, which provides in-transit data on concrete quality and truck location, our PREPRUFE® fully-bonded pre-applied waterproofing technology, and ICE & WATER SHIELD®, a category-leading self-adhesive underlayment for sloped roofs.
2
Maintain Strong Customer Focus — A key aspect of our strategy is to deliver product and technology solutions to our customers that help improve the performance of their products and the productivity of their manufacturing operations. We believe that maintaining a close partnership with our customers, which includes providing on-site technical support, allows us to effectively focus our innovation efforts and respond to their changing demands at a global, regional and local level. Our goal is to demonstrate for each customer the layers of value we provide, which include outstanding product performance and technical service as well as savings for customers through reduced product application cost and improved building performance.
Increase Productivity by Optimizing Global Supply Chain Opportunities — GCP’s productivity strategies focus on operations, logistics and the supply chain. We have established procurement and product formulation expertise to manage our product costs and production efficiencies. Product formulations are optimized at our regional development labs around the world. These formulations are designed to meet specific customer needs while also considering the costs of the various raw material options available to meet those needs. Our global supply chain organization balances local raw material supply with global contracts that improve our buying power. Our global manufacturing network also maximizes production and delivery efficiencies.
Grow Through Strategic Acquisitions — When consistent with our business strategies, we will seek strategic, bolt-on acquisitions and alliances to accelerate our customer and geographic penetration, broaden our technology and product portfolios and bolster our manufacturing capacity and capability.
Drive Cash Flow Conversion and Adjusted EBIT Return on Invested Capital to Deliver Long-Term Value to Our Shareholders — We believe our strategies will allow us to accelerate our cash flow conversion to invest in research and development activities, manufacturing operations, technical service and sales organizations, strategic acquisitions and to return excess capital to shareholders.
PRODUCTS AND SEGMENTS
Specialty Construction Chemicals Operating Segment (SCC)
We supply concrete admixtures, polymer fibers and in transit monitoring systems to concrete producers that are used to improve the rheology, workability, quality, durability and other engineering properties of concrete, mortar, masonry and other cementitious construction materials. We also supply cement additives to cement manufacturers that are used to improve energy efficiency and reduce carbon dioxide in cement processing, enhance the characteristics of finished cement and improve ease of use.
We compete with several large international suppliers and regionally with smaller competitors. Competition for our products is based on product performance, technical support, the breadth of our manufacturing and distribution infrastructure and our ability to bring value to our customers in the construction industry. Our major global competitors are BASF and Sika.
The following table sets forth SCC sales as a percentage of GCP total revenue.
2016 | 2015 | 2014 | ||||||||||||||||||
(In millions) | Sales | % of GCP Revenue | Sales | % of GCP Revenue | Sales | % of GCP Revenue | ||||||||||||||
Concrete | $ | 469.1 | 34.6 | % | $ | 532.7 | 37.5 | % | $ | 541.9 | 36.6 | % | ||||||||
Cement | 154.7 | 11.4 | % | 161.6 | 11.4 | % | 184.4 | 12.5 | % | |||||||||||
Total SCC Revenue | $ | 623.8 | 46.0 | % | $ | 694.3 | 48.9 | % | $ | 726.3 | 49.1 | % | ||||||||
3
The following table sets forth SCC sales by geographic region as a percentage of SCC total revenue.
2016 | 2015 | 2014 | ||||||||||||||||||
(In millions) | Sales | % of SCC Revenue | Sales | % of SCC Revenue | Sales | % of SCC Revenue | ||||||||||||||
North America | $ | 243.0 | 39.0 | % | $ | 242.0 | 34.9 | % | $ | 235.0 | 32.4 | % | ||||||||
Europe Middle East Africa (EMEA) | 136.2 | 21.8 | % | 141.2 | 20.3 | % | 170.3 | 23.4 | % | |||||||||||
Asia Pacific | 179.0 | 28.7 | % | 181.9 | 26.2 | % | 185.5 | 25.5 | % | |||||||||||
Latin America | 65.6 | 10.5 | % | 129.2 | 18.6 | % | 135.5 | 18.7 | % | |||||||||||
Total SCC Revenue | $ | 623.8 | 100.0 | % | $ | 694.3 | 100.0 | % | $ | 726.3 | 100.0 | % | ||||||||
SCC consists of two product groups: concrete admixtures and cement additives.
Concrete admixtures
The concrete admixtures product group includes concrete admixtures, admixtures for decorative concrete and concrete production management systems.
Concrete admixtures allow concrete producers to use a limited selection of locally-sourced raw materials (cement and aggregates) to produce concrete to meet a wide variety of performance specifications. Our products are based on a set of core platform technologies formulated regionally into admixtures tailored to local end-use requirements. For example, our MIRA® admixtures allow concrete to be produced with a lower amount of water, which improves the compressive strength and the long-term durability of the concrete. ADVA® admixtures are used to make flowable "self-compacting concrete" which is popular in precast concrete manufacturing where the rapid filling of large molds is a major driver of economics. ECLIPSE® admixtures are used to minimize the formation of shrinkage cracks in critical applications, such as bridge decks. STRUX® polymeric fibers are designed to improve the ductility of concrete which is a naturally brittle material. In some cases, STRUX® polymeric fibers may be used to replace steel reinforcement near the surface of concrete that will be exposed to corrosive de-icing salts.
Admixtures for decorative concrete are used to create decorative/architectural concrete. PIERI® surface retarders are used to obtain exposed aggregate finishes in precast and cast-in-place concrete, achieving the desired surface appearance. PIERI® release agents allow for the efficient removal of mold forms with a resultant blemish-free concrete surface.
Concrete production management systems provide sophisticated process monitoring and control while concrete is in transit to the jobsite. Our patented concrete production management system, sold under the VERIFI® brand name, measures, monitors and manages critical concrete properties and systematically adds water or admixtures to maintain optimum concrete flow properties. The result is increased product quality and consistency of concrete, fewer rejected loads, increased jobsite efficiency and minimized costly project delays.
Cement additives
Portland cement is the binding agent for concrete. National standards usually dictate the compressive strength and other properties that must be met by cement. Cement additives are used to reduce the energy required to mill cement to the desired fineness and to improve the handling characteristics of the powdered material. These products are also used to adjust the performance of Portland cement, permitting our customers to optimize production economics. Examples include HEA2® Cement Additives, which are used around the world to improve the energy efficiency of cement grinding operations and CBA® Cement Additives, which are used to produce higher cement strength, providing a high level of process flexibility to the cement manufacturer. Increasingly, cement manufacturers seek to reduce the environmental impact of their manufacturing processes; our additives provide greater flexibility in raw materials, enabling customers to achieve improvements such as reductions in energy use and CO2 emissions.
4
The SCC product portfolio includes:
Products | Uses | Customers | Key Brands | |||
Concrete admixtures | Chemicals and polymeric fibers used to reduce the production and in-place costs of concrete, increase the performance of concrete and improve the life cycle cost of structures | Ready-mix and precast concrete producers, engineers and specifiers | ADVA®, STRUX®, MIRA®, POLARSET®, ECLIPSE®, DARACEM®, DARASET®, DCI®, RECOVER®, WRDA®, ZYLA® | |||
Admixtures for decorative concrete | Products for architectural concrete include surface retarders, coatings, pigments and release agents used by concrete producers and contractors to enhance the surface appearance and aesthetics of concrete | Precast concrete producers and architects | PIERI® | |||
Concrete production management systems | Proprietary sensors, algorithms and control systems which monitor and adjust the flow properties while in transit to construction sites, providing concrete producers quality control and operational efficiencies | Ready-mix concrete manufacturers | VERIFI® | |||
Cement additives | Formulated chemicals added to the milling stage of the cement manufacturing process to improve plant energy efficiency, enhance the performance of the finished cement and help our customers meet environmental regulations and reduce their CO2 footprints | Cement manufacturers | CBA®, SYNCHRO®, HEA2®, TDA®, ESE® | |||
Specialty Building Materials Operating Segment (SBM)
We supply building and flooring materials used in both new construction and renovation/repair projects. We manufacture and sell products that protect structures from water, vapor transmission and air penetration as well as fire damage. Our products also reduce energy usage and improve the long-term durability of structures. They include waterproofing membranes and roofing underlayments for use in commercial and residential buildings, polymeric grouts for use in waterproofing and soil stabilization applications, air and vapor barriers, cementitious grouts, passive fire protection, and a flooring barrier system to protect surface flooring from moisture and alkalinity damage, as well as flooring installation products.
Our products are specified and installed on commercial, residential and infrastructure projects around the world. Our technology platforms, project selling competencies and international reach are the foundation for our industry leadership. We are dedicated to understanding local codes and construction practices so that our technology solutions address the regional needs of our customers. Our global specification sales organization emphasizes its technical expertise and has established relationships with key influencers and decision makers across the entire project selling value chain including architects, engineers, general contractors, specialty contractors and other channel partners. We continue to expand our international presence in targeted regions with our core product lines and by adding new technologies.
Our specialty building materials product sales are global. We engage with global architectural and contracting firms as well as local specifiers, engineers, contractors and building material distributors that influence the buying decisions for our products. We compete globally with several large international construction materials suppliers, also regionally and locally with numerous smaller competitors. Competition for our products is based on product performance, technical support and service, brand name recognition and price. Our major competitors are Sika, RPM and Carlisle.
5
The following table sets forth SBM sales as a percentage of GCP total revenue.
2016 | 2015 | 2014 | ||||||||||||||||||
(In millions) | Sales | % of GCP Revenue | Sales | % of GCP Revenue | Sales | % of GCP Revenue | ||||||||||||||
Building Envelope | $ | 236.3 | 17.4 | % | $ | 234.7 | 16.6 | % | $ | 236.3 | 16.0 | % | ||||||||
Residential Building Products | 89.2 | 6.6 | % | 79.3 | 5.6 | % | 59.2 | 4.0 | % | |||||||||||
Specialty Construction Products | 97.2 | 7.2 | % | 84.1 | 5.9 | % | 83.8 | 5.6 | % | |||||||||||
Total SBM Revenue | $ | 422.7 | 31.2 | % | $ | 398.1 | 28.1 | % | $ | 379.3 | 25.6 | % | ||||||||
The following table sets forth SBM sales by geographic region as a percentage of SBM total revenue.
2016 | 2015 | 2014 | ||||||||||||||||||
(In millions) | Sales | % of SBM Revenue | Sales | % of SBM Revenue | Sales | % of SBM Revenue | ||||||||||||||
North America | $ | 265.9 | 62.9 | % | $ | 229.6 | 57.7 | % | $ | 201.0 | 53.0 | % | ||||||||
Europe Middle East Africa (EMEA) | 89.5 | 21.2 | % | 94.7 | 23.8 | % | 100.4 | 26.4 | % | |||||||||||
Asia Pacific | 62.2 | 14.7 | % | 69.4 | 17.4 | % | 72.0 | 19.0 | % | |||||||||||
Latin America | 5.1 | 1.2 | % | 4.4 | 1.1 | % | 5.9 | 1.6 | % | |||||||||||
Total SBM Revenue | $ | 422.7 | 100.0 | % | $ | 398.1 | 100.0 | % | $ | 379.3 | 100.0 | % | ||||||||
SBM consists of three product groups: building envelope, residential building products and specialty construction products.
Building envelope products
Building envelope products protect structures from water and help manage air and vapor transmission through building walls. The majority of sales in this product group are waterproofing products that protect commercial structures, residential structures and infrastructure. Our waterproofing products are used in both above-grade and below-grade applications. Above grade, our products protect the material to which they are applied and allow architects to design occupied spaces free from water infiltration, and below grade, our products enable the construction of structures in challenging sites, including portions below the existing water table. Examples of these products include our self-adhesive rubberized asphalt membrane, BITUTHENE® and our innovative pre-applied sheet membrane, PREPRUFE®.
Our BITUTHENE® product line is manufactured globally and has a long track record of providing waterproofing in the most challenging conditions. Designers and contractors have relied on BITUTHENE® for over 40 years and continue to specify it by name. We pioneered the pre-applied waterproofing category with our Advanced Bond Technology™ found in PREPRUFE®. Our unique technology allows a waterproofing membrane to be installed on the ground or on walls before concrete is placed for a foundation. This technology also allows waterproofing of walls normally inaccessible during the construction of a building, such as foundations in densely populated cities. Major projects around the world have successfully implemented our PREPRUFE® system and it continues to gain recognition for its waterproofing performance.
Residential building products
Residential building products consist of roofing underlayments, flashing and weather barriers. Roofing underlayments are placed below the outermost roof covering, such as shingles, to protect sloped roofs from water damage caused by wind-driven rain and ice dams. ICE & WATER SHIELD® roofing underlayments are known throughout the industry and are sold in North America through a network of distributors. The VYCOR® flashing portfolio consists of high performance self-adhered flashing products that provide premium protection against water infiltration in critical areas such as windows and doors. VYCOR® flashing reduces the risk of mold and rot development and contributes to energy efficiency by sealing air leakages from the building.
6
Specialty construction products
Specialty construction products include fire protection, chemical grouts, cementitious grouts and mortars, and specialty flooring products. Passive fire protection products are marketed under the MONOKOTE® brand. Chemical grouts are sold under the DE NEEF® brand and are used to repair cracks in concrete, seal water leaks in commercial buildings and infrastructure in addition to soil stabilization. BETEC® cementitious grouts and mortars are used in applications where specific strength and/or flow are required. Examples of these applications include assembly of concrete precast elements for wind turbines, filling under rails for railroads and providing a high-strength surface for heavy machinery in industrial settings. VERSASHIELD® is our branded fiberglass membrane that is installed between a concrete subfloor and surface flooring protecting the surface flooring from moisture and alkalinity related damage. Other flooring installation products include seam tapes, tack strips, underlayment, and tools and accessories used for the installation of carpet, ceramic, laminate stone and other surface flooring.
The SBM product portfolio includes:
Products | Uses | Customers | Key Brands | |||
Building envelope products | Structural barrier systems to prevent above and below ground water, vapor and air infiltration of the building envelope of commercial structures, including self-adhered sheet and liquid membranes, joint sealing materials, drainage composites and waterstops | Architects, consultants and structural engineers; specialty waterproofing, masons, dry wall contractors and general contractors; specialty distributors | BITUTHENE®, PREPRUFE®, ADPRUFE®, HYDRODUCT®, ADCOR®, SILCOR®, PERM-A-BARRIER® | |||
Residential building products | Specialty roofing membranes and flexible flashings for windows, doors, decks and detail areas, including fully adhered roofing underlayments, synthetic underlayments and self-adhered flashing | Roofing contractors, home builders and remodelers; building material distributors, lumberyards and home centers; architects and specifiers | ICE & WATER SHIELD®, TRI-FLEX®, VYCOR® | |||
Fire protection materials | Fire protection products spray-applied to the structural steel frame, encasing and insulating the steel and protecting the building in the event of fire and enhancing the heat resistance during a fire | Local contractors and specialty subcontractors and applicators; building materials distributors; industrial manufacturers; architects and structural engineers | MONOKOTE® | |||
Chemical grouts | Products for repair and remediation in waterproofing applications and soil stabilization | Contractors; specialty distributors; municipalities; and other owners of large infrastructure facilities | DE NEEF®, HYDRO ACTIVE®, SWELLSEAL®, DE NEEF® PURe™ | |||
Cementitious grouts and mortars | Cementitious grouts and mortars used for under filling and gap filling | Specialty contractors engaged in the repair of concrete, installation of new precast concrete elements and infrastructure repair | BETEC® | |||
Specialty flooring products | Flooring moisture barriers and installation products | Distributors; contractors; home centers; flooring manufacturers; and large commercial end users | VERSASHIELD®, ORCON® | |||
Darex Packaging Technologies Operating Segment (Darex)
We supply sealants and coatings to global manufacturers of beverage, food, consumer and industrial metal containers and closures. These products, designed with our significant regulatory and application knowledge, protect the packaging materials and preserve their contents. We are the global leader in can sealants.
7
Our growth is driven by innovation of higher performing products, continuous development of new applications, increasing demand for sustainability, rising disposable income in emerging regions, general economic growth and increasing demand for canned and bottled packaged products. Our customers trust and rely on our global technical service as well as our expertise in global regulatory compliance (including food laws) to address industry challenges and enhance their productivity. We seek to develop and introduce new products that add additional value to the current and future needs of our customers, such as our introduction of new BPA-NI coatings and products with oxygen scavenging functionality. We believe we are well positioned to capture industry growth, especially in emerging regions with our global infrastructure.
Our Darex business is global. We compete with several large international suppliers, and regionally, with many smaller competitors. Our primary global competitors are Altana, Akzo Nobel, PPG and Valspar. Competition for our products is generally based on product performance and reliability, technical service, price and additional value-added features to address the needs of our customers, end-users and brand owners.
The following table sets forth Darex sales as a percentage of GCP total revenue.
2016 | 2015 | 2014 | ||||||||||||||||||
(In millions) | Sales | % of GCP Revenue | Sales | % of GCP Revenue | Sales | % of GCP Revenue | ||||||||||||||
Sealants | $ | 211.7 | 15.6 | % | $ | 221.2 | 15.6 | % | $ | 254.8 | 17.2 | % | ||||||||
Coatings | 97.6 | 7.2 | % | 105.0 | 7.4 | % | 120.0 | 8.1 | % | |||||||||||
Total Darex Revenue | $ | 309.3 | 22.8 | % | $ | 326.2 | 23.0 | % | $ | 374.8 | 25.3 | % | ||||||||
The following table sets forth Darex sales by geographic region as a percentage of Darex total revenue.
2016 | 2015 | 2014 | ||||||||||||||||||
(In millions) | Sales | % of Darex Revenue | Sales | % of Darex Revenue | Sales | % of Darex Revenue | ||||||||||||||
North America | $ | 63.9 | 20.7 | % | $ | 66.6 | 20.4 | % | $ | 67.9 | 18.1 | % | ||||||||
Europe Middle East Africa (EMEA) | 95.6 | 30.9 | % | 105.2 | 32.3 | % | 125.3 | 33.4 | % | |||||||||||
Asia Pacific | 81.4 | 26.3 | % | 78.3 | 24.0 | % | 92.2 | 24.6 | % | |||||||||||
Latin America | 68.4 | 22.1 | % | 76.1 | 23.3 | % | 89.4 | 23.9 | % | |||||||||||
Total Darex Revenue | $ | 309.3 | 100.0 | % | $ | 326.2 | 100.0 | % | $ | 374.8 | 100.0 | % | ||||||||
Darex consists of two product groups: sealants and coatings.
Sealants
Our sealants product group includes two product lines: can sealants and closures.
Can sealants provide a hermetic seal between the lid and the body of the metal can used in beverage, food, aerosol and industrial packaging. We offer our customers a complete portfolio of both water-based and solvent-based technologies to address current industry trends of thinner gauge metals and high-speed production processes.
Closures products provide the seal for pry-off crowns, twist-off crowns and roll-on pilfer-proof (ROPP) and plastic caps. Our CELOX® oxygen-scavenging technology protects sensitive beverages from oxygen ingress into the packaging to extend product shelf-life and prevent flavor deterioration, color changes and nutrient depletion. Our SINCERA® lubricants are specifically designed for taste sensitive applications.
Coatings
Coatings protect both the interior and exterior surfaces of metal packaging containers and closures. Our coatings are engineered to prevent metal corrosion, ensure proper adhesion of sealing compounds and enhance graphic decorations on the exterior of containers and closures. We introduced our APPERTA® coatings to address increasing industry demands for non-BPA technology. We specifically formulated our SISTIAGA® coatings for technically demanding monobloc beverage and aerosol containers.
8
The Darex product portfolio includes:
Products | Uses | Customers | Key Brands | ||||
Sealants | Can Sealants | Solvent and water-based compounds for rigid metal containers that ensure a hermetic seal between the lid and the body of beverage, food, aerosol and other cans | Packaging manufacturers and food and beverage companies | DAREX® | |||
Closures | PVC and PVC-free compounds for metal and plastic bottle closures that are used on pry-off and twist-off metal crowns, as well as roll-on pilfer-proof and plastic closures to seal and enhance the shelf life of food and beverages in glass and plastic bottles and jars | Manufacturers of closures for food and beverages | DAREX®, DARAFORM®, DARASEAL®, DARABLEND®, SINCERA®, CELOX® | ||||
Coatings | Products for coating metal cans, crowns and closure packaging that protect the metal against corrosion, protect the contents against the influences of metal, ensure proper adhesion of sealing compounds to metal surfaces and provide base coats for inks and for decorative purposes | Packaging manufacturers and food and beverage companies | DAREX®, APPERTA®, SISTIAGA® | ||||
SALES AND MARKETING
Our three operating segments maintain direct sales and technical teams made up of approximately 850 employees supporting customers in over 125 countries worldwide. Our global team sells products under annual and multi-year global, regional and local agreements and has developed deep segment and product application knowledge key to our customers' success. We believe our deep rooted understanding of our customers' needs, challenges and operations and our ability to service at high standards throughout the world, give all three segments a competitive advantage. The majority of our products require local, regional, country and international code approvals related to use, storage and performance. Our commercial organization supports and consults on committees and technical associations in order to ensure codes and product standards are consistently applied.
Our SCC and SBM sales professionals work with leading architects, engineers and contractors across the globe seeking to have our products specified for use in thousands of projects annually. Our products have been used in some of the world's signature structures including the Getty Center in Los Angeles, Hong Kong’s Bank of China Tower, Qatar's Heart of Doha, London's Crossrail Railway System and many other landmarks. As part of our "go to market" strategy, the SCC team provides technical services to over 10,000 concrete and cement production facilities worldwide. In many cases, we also provide product dispensing equipment to our customers as an integral part of the concrete and cement production process.
Darex employs a global sales and technical service team to market our products and serve the needs of our customers in over 75 countries. Darex provides a high level of technical service at the customer facility to ensure proper use of our products, as well as ongoing consultation with our customers to drive productivity and value for the customer throughout the value chain.
MANUFACTURING, RAW MATERIALS AND SUPPLY CHAIN
Our three operating segments share global supply chain processes, manufacturing facilities, as well as technical service and sales centers around the world, which provides cost efficiency.
9
Specialty Construction Chemicals and Specialty Building Materials
We utilize internal and third party manufacturing to produce our products to our specifications. Our low capital intensive plants along with third-party manufacturers provide us with flexibility in servicing our customers. Several of our plants ship internationally but most of our facilities are positioned to serve local market demand. We have the ability to respond quickly to changes in local demand by establishing or expanding manufacturing capacity with low capital investment. With both vendors and customers, we have numerous multi-year supply and purchasing agreements which help to minimize volume disruption. Construction demand is seasonal resulting in demand variations requiring effective management of our manufacturing and distribution assets. For many of our SCC customers, we install and maintain a chemical dispensing and storage system for our products at their production facilities. We periodically replenish the on-site systems to give our customers instant access to our SCC products in the amounts they require twenty-four hours a day. We also install equipment on ready-mix trucks to monitor and manage concrete in transit to job sites. This customer-based equipment accounted for 28% of our current annual capital spend.
The raw materials we use in our products are obtained from a variety of suppliers, including basic chemical and petrochemical producers. Many of our raw materials are organic chemicals derived from olefins, including specialty films and fibers. We also make significant purchases of inorganic materials such as gypsum and specialty materials, including papers, rubber and asphalt. We have multiple raw material sources and balance our purchasing requirements between local and global sources seeking to maximize performance and profitability. Global supply and demand factors, changes in currency exchange rates and petroleum prices can significantly impact the price of our key raw materials.
Our global supply chain team monitors the global market to identify cost and productivity opportunities. We seek to leverage our overall purchasing volumes for all regions. Since we manufacture a portion of our products in emerging regions using raw materials from suppliers in the U.S., Europe and other advanced economies, changes in the values of the currencies of these emerging regions versus the U.S. dollar and the euro may adversely affect our raw material costs. This effect is partially mitigated by our reliance on local sourcing for some raw materials.
The construction business is cyclical, in response to economic conditions, as well as seasonal, driven by weather conditions. Demand for our products is primarily driven by global non-residential and infrastructure construction activity and U.S. residential construction activity. We seek to increase profitability and minimize the impact of cyclical downturns in regional economies by introducing technically advanced high-performance products and expanding geographically.
Darex Packaging Technologies
Our packaging products are manufactured by a network of globally integrated plants that are positioned to service our customers regionally. Our packaging products are manufactured in both large facilities to permit economies of scale and a network of smaller operations that enable customization to local conditions.
The principal raw materials for Darex products include resins, solvents, latexes (including certain food-grade raw materials), polyolefins, pigments and rubber. Multiple suppliers are generally available for each of these materials; however, some of our raw materials may be provided by single sources of supply. We seek to mitigate the risk of using single source suppliers by identifying and qualifying alternative suppliers or, for unique materials, by using alternative formulations from other suppliers. In some instances, we produce our own raw materials and intermediates.
Prices for many of our raw materials, including specialty and commodity materials such as latex, rubbers, pigments, resins and solvents, can be volatile. We generally take actions to mitigate the effect of changes in raw material cost, including increasing our product prices, developing alternative formulations for our products, increasing productivity and entering into supply agreements for certain raw materials.
Since we manufacture a substantial portion of our products in emerging regions using raw materials supplied from the U.S., Europe and other advanced economies, changes in the values of these currencies may adversely affect our raw material costs. This effect is partially mitigated by our reliance on local sourcing for many of our raw materials.
10
FINANCIAL INFORMATION ABOUT INDUSTRY SEGMENTS AND GEOGRAPHIC AREAS
Disclosure of financial information about industry segments and geographic areas for 2016, 2015 and 2014 is provided in this Annual Report on Form 10-K in Item 8 (Financial Statements and Supplementary Data) under Note 14 (Operating Segment Information) to the Consolidated Financial Statements, which disclosure is incorporated herein by reference. Disclosure of risks attendant to our foreign operations is provided in Item 1A (Risk Factors).
BACKLOG OF ORDERS
While at any given time there may be some backlog of orders, backlog is not material in respect to our total annual sales, nor are the changes, from time to time, significant.
RESEARCH ACTIVITIES; INTELLECTUAL PROPERTY
We believe success in our industries is driven by technology and innovation. Growing our businesses and maintaining our margins is dependent on our ability to introduce new products and enhance existing products based on innovative technology, as well as our ability to obtain patent or other intellectual property protection. Our research and development programs emphasize development of new products and processes, improvement of existing products and processes and application of existing products and processes to new industries and uses.
Our world-class Global Technology Center in Cambridge, Massachusetts houses the product research activities of all three of our operating segments. The global marketing resources that we believe are essential to a successful product development process are also located with our research and development group in Cambridge.
Technologies developed by our Global Technology Center are customized for each region and supported in the field by a network of Regional Technical Centers including facilities in Sorocaba, Brazil; Singapore; Beijing, China; Atsugi, Japan; Epernon, France; Lügde, Germany; Norderstedt, Germany; and Heist, Belgium.
Globally, we have over 400 research and development and technical service employees and approximately 11% of our workforce is focused on technology. We believe the collective technical expertise, industry knowledge and professionalism of this team is a significant differentiator for us.
We file patent applications globally on a routine basis and obtain grants in numerous countries around the world in support of our products, formulations, manufacturing processes, equipment and improvements. We also benefit from technological and commercial advantages protected under trade secret laws, including know-how and other proprietary information related to many of our products, technologies and internal quality control and testing methodologies. Entering 2017, we have approximately 900 active patents and patent applications pending in countries around the world, including approximately 160 in the U.S. During the past five years, we have averaged approximately 65 patent applications per year globally. The average number of patents filed and granted could go up or down from year to year, depending on various factors, some of which may not be within our control. It is our intent to continue to file for patents to protect our proprietary innovations and investments in research.
Research and development expenses were approximately $23 million in 2016, $22 million in 2015 and $28 million in 2014. These amounts include depreciation and amortization expenses related to research and development assets and expenses incurred in funding external research projects. The amount of research and development expenses relating to government- and customer- sponsored projects (rather than projects that we sponsor) was not material during these periods.
11
ENVIRONMENT, HEALTH AND SAFETY MATTERS
We are subject, along with other manufacturers of specialty chemicals, to stringent regulations under numerous U.S. federal, state and local and foreign environmental, health and safety laws and regulations relating to the generation, storage, handling, discharge, disposition and stewardship of hazardous wastes and other materials. Environmental laws require that certain responsible parties, as defined in the relevant statute, fund remediation actions regardless of legality of original disposal or ownership of a disposal site. We are involved in remediation actions to address hazardous wastes or other materials as required by U.S. federal, state and local and foreign laws.
We continuously seek to improve our environment, health and safety performance. We have expended funds to comply with environmental laws and regulations and expect to continue to do so in the future.
EMPLOYEE RELATIONS
As of December 31, 2016, we had approximately 2,900 employees, of which approximately 800 were employed in the United States. Of our total employees, approximately 2,400 were salaried and 500 were hourly.
Approximately 85 of our manufacturing employees in the United States are represented by five different local collective bargaining groups. We have operated without a labor work stoppage for more than 10 years.
We have works councils representing the majority of our European sites covering approximately 150 employees.
AVAILABLE INFORMATION
We maintain an Internet website at www.gcpat.com. Our Annual Report on Form 10-K, quarterly reports on Form 10-Q, current reports on Form 8-K, and amendments to those reports, filed or furnished pursuant to Section 13(a) or 15(d) of the Securities Exchange Act of 1934, as amended, are available, free of charge, on our website as soon as reasonably practicable after such reports are electronically filed with, or furnished to, the Securities and Exchange Commission, or "SEC." Further, the SEC's website, www.sec.gov, contains reports and other information regarding our filings or you may read and copy any materials that we file with the SEC at its Public Reference Room, located at 100 F Street, NE, Washington, DC 02549. These reports may be accessed through our website's investor relations page.
In addition, the charters for the Audit, Compensation, Nominating and Governance, and Corporate Responsibility Committees of our Board of Directors, our corporate governance principles and code of ethics are available, free of charge, on our website at http://investor.gcpat.com/corporate-governance/governance-documents. Printed copies of the charters, governance guidelines and code of ethics may be obtained free of charge by contacting GCP Shareholder Services by emailing investors@gcpat.com or by calling (617) 876-1400.The information on our website is not, and shall not be deemed to be, a part of this report or incorporated into any other filings we make with the SEC.
Item 1A. RISK FACTORS
Our operations are subject to a number of risks, including those listed below. When considering investments in our company, you should carefully consider each of the following risk factors and all of the other information set forth in this Annual Report on Form 10-K. Based on the information currently known to us, we believe that the following information identifies the most significant risk factors affecting the Company and our business in each of these categories of risks. However, the risks and uncertainties the Company faces are not limited to those set forth in the risk factors described below. Additional risks and uncertainties not presently known to us or that we currently believe to be immaterial may also adversely affect our business. In addition, past financial performance may not be a reliable indicator of future performance, and historical trends should not be used to anticipate results or trends in future periods.
12
If any of the following risks and uncertainties develops into actual events, these events could have a material adverse effect on our business, financial condition or results of operations. In such case or in the case that an additional risk or uncertainty not presently known to us or that we currently believe to be immaterial develops into actual events, the trading price of our common stock could decline.
Risks Relating to Our Business
We face significant competition and, if we are not able to respond to competition, our revenues may decrease.
We face significant competition from a variety of competitors in each of our markets. Some of our competitors have substantially greater financial, marketing, personnel and other resources than we do. New competitors also could enter our markets and certain of our customers could decide to self-manufacture or otherwise enter our markets. We consider product quality, performance, customer service, on-time delivery, price, distribution capabilities and breadth of product offerings to be the primary competitive factors in our markets. Our competitors may be able to offer more attractive pricing, duplicate our strategies, or develop enhancements to products that could offer performance features that are superior to our products. Competitive pressures, including those described above, could adversely affect our competitive position, leading to a loss of market share or decreases in prices, either of which could have a material adverse effect on our business, financial condition or results of operations.
The length and depth of product and industry business cycles in our segments may result in periods of reduced sales, earnings and cash flows, and portions of our business are subject to seasonality and weather-related effects.
Our operating segments are sensitive to the cyclical nature of the industries they serve. Our construction business is cyclical in response to economic conditions and construction demand and is also seasonal and dependent on favorable weather conditions, with a decrease in construction activity during the winter months. Our packaging products are affected by seasonal and weather-related factors including the consumption of beverages and the size and quality of food crops.
If we are not able to continue our technological innovation and successful introduction of new products, our customers may turn to other suppliers to meet their requirements.
The specialty chemicals industry and the end-use applications into which we sell our products experience ongoing technological change and product improvements. A key element of our business strategy is to invest in research and development activities with the goal of introducing new high-performance, technically differentiated products. We may not be successful in developing new technology and products that successfully compete with products introduced by our competitors, and our customers may not accept or may have lower demand for, our new products. If we fail to keep pace with evolving technological innovations or fail to improve our products in response to our customers’ needs, then our business, financial condition and results of operations could be adversely affected as a result of reduced sales of our products.
Prices for certain raw materials are volatile and can have a significant effect on our manufacturing and supply chain strategies as we seek to maximize our profitability. If we are unable to successfully adjust our strategies in response to volatile raw materials prices, such volatility could have a negative effect on our earnings in future periods.
We use petroleum-based materials, natural gas derivatives and other materials in the manufacture of our products. Prices for these materials are volatile and can have a significant effect on our pricing, sales, manufacturing and supply chain strategies as we seek to maximize our profitability. Our ability to successfully adjust strategies in response to volatile raw material prices by increasing prices for our products and services, reducing costs or taking other actions is a significant factor in maintaining or improving our profitability. If we are unable to successfully adjust our strategies in response to volatile prices, such volatility could have a negative effect on our sales and earnings in future periods.
13
A substantial portion of our raw materials are commodities whose prices fluctuate as market supply and demand fundamentals change. We attempt to manage exposure to price volatility of major commodities through:
• | long-term supply contracts; |
• | customer contracts that permit adjustments for changes in prices of commodity-based materials and energy; and |
• | forward buying programs that layer in our expected requirements systematically over time; |
Although we regularly assess our exposure to raw material price volatility, we cannot always predict the prospects of volatility and we cannot always cover the risk in a cost-effective manner.
We have a policy of maintaining, when available, multiple sources of supply for raw materials. However, certain of our raw materials may be provided by single sources of supply. We may not be able to obtain sufficient raw materials due to unforeseen developments that would cause an interruption in supply. Even if we have multiple sources of supply for raw materials, these sources may not make up for the loss of a major supplier.
The global scope of our operations subjects us to the risks of doing business in foreign countries, which could adversely affect our business, financial condition and results of operations.
We operate our business on a global scale with approximately 60% of our 2016 sales outside the United States. We operate in approximately 35 countries and in over 30 currencies. We currently have many production facilities, technical centers and administrative and sales offices located outside North America, including facilities and offices in Europe, the Middle East, Africa, Asia Pacific and Latin America. We expect non-U.S. sales to continue to represent a substantial majority of our revenue. Accordingly, our business is subject to risks related to the differing legal, political, social and economic conditions and regulatory requirements of many jurisdictions as well as risks related to the political relationship between the foreign countries in which we conduct business and the United States. Risks inherent in non-U.S. operations include the following:
• | commercial agreements may be more difficult to enforce and receivables more difficult to collect; |
• | intellectual property rights may be more difficult to enforce; |
• | we may experience increased shipping costs, disruptions in shipping or reduced availability of freight transportation; |
• | we may have difficulty transferring our profits or capital from foreign operations to other countries where such funds could be more profitably deployed; |
• | we may experience unexpected adverse changes in export duties, quotas and tariffs and difficulties in obtaining export licenses; |
• | some foreign countries have adopted, and others may impose, additional withholding taxes or other restrictions on foreign trade or investment, including currency exchange and capital controls; |
• | foreign governments may nationalize private enterprises; |
• | our business and profitability in a particular country could be affected by political or economic repercussions on a domestic, country specific or global level from terrorist activities and the response to such activities; |
• | we may be affected by unexpected adverse changes in foreign laws or regulatory requirements; and |
• | unanticipated events, such as geopolitical changes, could adversely affect our foreign operations. |
Our success as a global business will depend, in part, upon our ability to succeed in differing legal, regulatory, economic, social and political conditions by developing, implementing and maintaining policies and strategies that are effective in each location where we do business.
14
Our operations in Venezuela have been, and may in the future continue to be, adversely affected by political and economic instability in the country.
Our ability to manage our Venezuelan operations has been and will continue to be negatively affected by difficult conditions in Venezuela, including continuing high inflation and the significant devaluation of the Venezuelan bolivar. Government regulations regarding price increases limit our ability to offset the effects of high inflation and the currency devaluations. Import authorization controls and the limited availability of foreign exchange limit our ability to import raw materials needed for the production of our products. In addition, labor laws limit our ability to manage overhead costs and, at times, production has been negatively impacted by local labor issues. Additional government actions could have further adverse impacts on our business, results of operations, cash flows and financial condition, as could further deterioration in the Venezuelan economy resulting from the decline in the price of oil or from other factors. We have no assurance that we will be able to sustain operations in Venezuela. Economic factors as well as further government actions affecting our ability to do business (including the possibility of nationalization, expropriation of assets or other similar actions) could affect our results of operations, cash flows and financial condition.
For additional information regarding these and other risks associated with our operations in Venezuela, refer to Item 7, “Management’s Discussion and Analysis of Financial Condition and Results of Operations.”
Global, regional and local economic weakness and political uncertainty could adversely affect our business and financial performance.
Economic and geopolitical uncertainty continues to exist across the globe, including with respect to the United Kingdom’s vote to leave the European Union (“Brexit”), the failed military coup in Turkey in July 2016 which has led to continued political turmoil in Turkey as the government operates under a state of emergency, and ongoing corruption scandals in Brazil. Our business and financial performance depend significantly on macroeconomic and geopolitical conditions and the demand for our products and services in the markets in which we compete. Recent economic weakness and political uncertainty in various markets throughout the world, whether related to Brexit, the political situations in Turkey and/or Brazil, or otherwise, have resulted, and may in the future result, in decreased revenue, gross margin or earnings and in increased expenses.
Certain of our customer relationships outside of the United States are with governmental entities and we could be materially and adversely affected by violations of the U.S. Foreign Corrupt Practices Act ("FCPA") and similar worldwide anti-bribery laws in non-U.S. jurisdictions.
The FCPA and similar worldwide anti-bribery laws in non-U.S. jurisdictions generally prohibit companies and their intermediaries from making improper payments to non-U.S. officials for the purpose of obtaining or retaining business. Because certain of our customer relationships outside of the United States are with governmental entities, we are subject to such anti-bribery laws. Our policies mandate compliance with these anti-bribery laws. We operate in many parts of the world that have experienced governmental corruption to some degree, and in certain circumstances strict compliance with anti-bribery laws may conflict with local customs and practices. Despite our training and compliance programs our internal control policies and procedures may not always protect us from reckless or criminal acts committed by our employees or agents. Violations of anti-bribery laws or allegations of such violations, could disrupt our business and result in a material adverse effect on our results of operations, financial condition and cash flows.
15
We are exposed to currency exchange rate changes that impact our profitability and these risks could increase as a result of recent global political uncertainty and other risks in international markets.
We are exposed to currency exchange rate risk through our U.S. and non-U.S. operations. Changes in currency exchange rates may materially affect our operating results. For example, changes in currency exchange rates may affect the relative prices at which we and our competitors sell products in the same region and the cost of materials used in our operations. A substantial portion of our net sales and assets are denominated in currencies other than the U.S. dollar. When the U.S. dollar strengthens against other currencies, at a constant level of business, our reported sales, earnings, assets and liabilities are reduced because the non-U.S. currencies translate into fewer U.S. dollars. In addition, since we manufacture a portion of our construction products and packaging products in emerging regions using raw materials from suppliers in the U.S., Europe and other advanced economies, changes in the values of the currencies of these emerging regions versus the U.S. dollar, the euro and the currencies of other advanced economies in which we purchase raw materials, may adversely affect our raw material costs.
We incur a currency transaction risk whenever one of our operating subsidiaries enters into either a purchase or a sales transaction using a currency different from the operating subsidiary's functional currency. Given the volatility of exchange rates, we may not be able to manage our currency transaction risks effectively, which may expose our financial condition or results of operations to significant additional risk.
We have debt obligations that could restrict our business, adversely impact our financial condition, results of operations or cash flows or restrict our ability to return cash to shareholders.
As of December 31, 2016, we had $830.9 million of indebtedness outstanding. The amount of and terms governing the Company's indebtedness may have material effects on our business, including to:
• | require us to dedicate a substantial portion of our cash flow to debt payments, thereby reducing funds available for working capital, capital expenditures, acquisitions, research and development, distributions to holders of company common stock and other purposes; |
• | restrict us from making strategic acquisitions or taking advantage of favorable business opportunities; |
• | limit our flexibility in planning for or reacting to, changes in our business and the industries in which we operate; |
• | increase our vulnerability to adverse economic, credit and industry conditions, including recessions; |
• | make it more difficult for us to satisfy our debt service and other obligations; |
• | place us at a competitive disadvantage compared to our competitors that have relatively less debt; and |
• | limit our ability to borrow additional funds or to dispose of assets to raise funds, if needed, for working capital, capital expenditures, acquisitions, research and development and other purposes. |
We may also incur substantial additional indebtedness in the future. If we incur additional debt, the risks related to our indebtedness may intensify.
We require liquidity to service the Company's debt and to fund operations, capital expenditures, research and development efforts, acquisitions and other corporate expenses.
Our ability to fund operations, capital expenditures, research and development efforts, acquisitions and other corporate expenses, including repayment of our debt, depends on our ability to generate cash through future operating performance, which is subject to economic, financial, competitive, legislative, regulatory and other factors. Many of these factors are beyond our control. We cannot be certain that our businesses will generate sufficient cash or that future borrowings will be available to us in amounts sufficient to fund all of our requirements. If we are unable to generate sufficient cash to fund all of our requirements, we may need to pursue one or more alternatives, such as to:
• | reduce or delay planned capital expenditures, research and development spending or acquisitions; |
• | obtain additional financing or restructure or refinance all or a portion of our debt on or before maturity; |
16
• | sell assets or businesses; and |
• | sell additional equity. |
Any reduction or delay in planned capital expenditures, research and development spending or acquisitions or sales of assets or businesses may materially and adversely affect our future revenue prospects. In addition, we cannot be certain that we will be able to raise additional equity capital, restructure or refinance any of our debt or obtain additional financing on commercially reasonable terms or at all.
Restrictions imposed by agreements governing our indebtedness limit our ability to operate our business, finance our future operations or capital needs or engage in other business activities. If we fail to comply with certain restrictions under these agreements, our debt could be accelerated and the Company may not have sufficient cash to pay the accelerated debt.
The agreements governing our indebtedness contain various covenants that limit, among other things, our ability, and the ability of certain of our subsidiaries, to:
• | incur certain liens; |
• | enter into sale and leaseback transactions; and |
• | consolidate, merge or sell all or substantially all of our assets or the assets of our guarantors. |
As a result of these covenants, we are limited in the manner in which we can conduct our business, and may be unable to engage in favorable business activities or finance future operations or capital needs. Accordingly, these restrictions may limit our flexibility to operate our business. A failure to comply with the restrictions contained in these agreements, including maintaining the financial ratios required by our credit facilities, could lead to an event of default which could result in an acceleration of the indebtedness. We cannot assure you that our future operating results will be sufficient to enable us to comply with the covenants contained in the agreements governing our indebtedness or to remedy any such default. In addition, in the event that repayment of our debt is accelerated pursuant to the terms of these agreements, we may not have or be able to obtain sufficient funds to make such accelerated payments.
Our indebtedness exposes us to interest expense increases if interest rates increase.
As of December 31, 2016, we had approximately $318 million, or 38%, of our borrowings at variable interest rates exposing us to interest rate risk. If interest rates increase, our debt service obligations on the variable rate indebtedness would increase even though the amount borrowed would remain the same, and our net income would decrease. An increase of 1% in the interest rates payable on our variable rate indebtedness at December 31, 2016 would increase our annual estimated debt-service requirements by approximately $3 million, assuming our consolidated variable interest rate indebtedness outstanding remains the same.
We have unfunded and underfunded pension plan liabilities. We will require future operating cash flow to fund these liabilities. We have no assurance that we will generate sufficient cash to satisfy these obligations.
We maintain U.S. and non-U.S. defined benefit pension plans covering current and former employees who meet or met age and service requirements. Our net pension liability and cost is materially affected by the discount rate used to measure pension obligations, the longevity and actuarial profile of our workforce, the level of plan assets available to fund those obligations and the actual and expected long-term rate of return on plan assets. Significant changes in investment performance or a change in the portfolio mix of invested assets can result in corresponding increases and decreases in the valuation of plan assets or in a change in the expected rate of return on plan assets. In addition, any changes in the discount rate could result in a significant increase or decrease in the valuation of pension obligations, affecting the reported funded status of our pension plans as well as the net periodic pension cost in the following years. Similarly, changes in the expected return on plan assets can result in significant changes in the net periodic pension cost in the following years.
17
When consistent with our business strategies, we intend to pursue acquisitions, joint ventures and other transactions that complement or expand our businesses. We may not be able to complete proposed transactions and even if completed, the transactions may not achieve the earnings, cash flow or returns on investment that we had contemplated.
We have recently completed a number of acquisitions that we believe will contribute to our future success. We intend to continue to pursue opportunities to buy other businesses or technologies that could complement, enhance or expand our current businesses or product lines or that might otherwise offer us growth opportunities. We may have difficulty identifying appropriate opportunities or, if we do identify opportunities, we may not be successful in completing transactions for a number of reasons. Any transactions that we are able to identify and complete may involve a number of risks, including:
• | the diversion of management's attention from our existing businesses to integrate the operations and personnel of the acquired or combined business or joint venture; |
• | possible adverse effects on our operating results during the integration process; |
• | failure of the acquired business to achieve expected operational objectives; and |
• | our possible inability to achieve the intended objectives of the transaction. |
In addition, we may not be able to successfully or profitably integrate, operate, maintain and manage any newly acquired operations or their employees. We may not be able to maintain uniform standards, controls, procedures and policies, which may lead to operational inefficiencies.
Our results of operations could be adversely affected by warranty claims and product liability.
We provide standard warranties that our products perform according to their specifications and do not have material defects. In particular, for a limited number of high value construction projects we warrant the performance of some products for periods of 10 to 20 years. Our products are generally sold to the commercial construction, residential construction and food packaging industries and they often constitute an integral part of our customers’ products. If our products do not meet specifications, are otherwise defective, or are used contrary to our instructions or in applications for which they are not designed, they may contribute to damage to our customers’ products, the end users of our customers’ products and buildings and other installations that contain our products. Although we take measures to avoid product defects and instruct our customers on the proper use of our products, if a substantial warranty claim or product liability lawsuit is brought against us, the cost of defending the claim or lawsuit could be significant and any adverse determination could have a material adverse effect on our results of operations.
We manufacture and sell products into many global jurisdictions where our efforts to contractually limit our liability (e.g., by defining a maximum liability, disclaiming implied or other statutory forms of liability or by waiving certain types of damages, including consequential, indirect and non-proximately caused damages) may not be enforceable or may be found by a court to not apply in a particular situation.
We work with dangerous materials that can injure our employees, damage our facilities and disrupt our operations.
Some of our operations involve the handling of hazardous materials that may pose the risk of fire, explosion or the release of hazardous substances. Such events could result from terrorist attacks, natural disasters or operational failures, and might cause injury or loss of life to our employees and others, environmental contamination, and property damage. These events might cause a temporary shutdown of an affected plant or portion thereof, and we could be subject to penalties or claims as a result. A disruption of our operations caused by these or other events could have a material adverse effect on our results of operations.
18
We may be required to spend large amounts of money for environmental compliance.
As a manufacturer of specialty chemicals and specialty materials, we are subject to stringent regulations under numerous U.S. federal, state, local and foreign environmental, health and safety laws and regulations relating to the generation, storage, handling, discharge, disposition and stewardship of hazardous wastes and other materials. We expend funds to comply with such laws and regulations and have established a policy to minimize our emissions to the environment. Nevertheless, legislative, regulatory and economic uncertainties (including existing and potential laws and regulations pertaining to climate change) make it difficult for us to project future spending for these purposes and we may be required to expend additional funds to remain in compliance.
Some of our employees are unionized, represented by works councils or employed subject to local laws that are less favorable to employers than the laws in the United States.
As of December 31, 2016, we had approximately 2,950 total employees, of which approximately 815 were employed in the United States. Of our total U.S. employees, approximately 85 are unionized. In addition, a large number of our employees are employed in countries in which employment laws provide greater bargaining or other rights to employees than the laws in the United States. Such employment rights require us to work collaboratively with the legal representatives of the employees to effect any changes to labor arrangements. For example, most of our employees in Europe are represented by works councils that have co-determination rights on any changes in conditions of employment, including salaries and benefits and staff changes, and may impede efforts to restructure our workforce. A strike, work stoppage or slowdown by our employees or significant dispute with our employees, whether or not related to these negotiations, could result in a significant disruption of our operations or higher ongoing labor costs.
We may be subject to claims of infringement of the intellectual property rights of others, which could hurt our business or financial performance.
Although each of our core businesses monitors and conducts watches on third party patents in an attempt to avoid encroaching upon the intellectual property rights of others, from time to time we may receive claims from our competitors or others alleging that our processes or products infringe or otherwise interfere with their intellectual property rights. Any claims that our products or processes infringe or interfere with the intellectual property rights of others, regardless of the merit or resolution of the claims, could cause us to incur significant costs in responding to, defending and resolving the claims, and may divert the efforts and attention of our management and technical personnel from our business. If we are found to be infringing or otherwise violating the intellectual property rights of others, we may be liable for damages, including damages that may have occurred from our customers using any infringing products. We may be required to cease selling or manufacturing the allegedly infringing product, to contest the invalidity or enforceability of the third party patent, to redesign our products or processes to avoid the third party patent, to pay a license fee in order to commercialize under the third party patent, or to take other measures to avoid costs required to defend against such third party claims of patent infringement. Even if we ultimately prevail, the existence of the lawsuit could prompt our customers to switch to products that are not the subject of infringement suits.
We are subject to business continuity risks associated with centralization of certain administrative functions.
We have centralized certain administrative functions in a few designated centers around the world, to improve efficiency and reduce costs. To the extent that these central locations are disrupted or disabled, key business processes, such as invoicing, payments and general management operations, could be interrupted.
A failure of our information technology infrastructure could adversely impact our business and operations.
We rely upon the capacity, reliability and security of our information technology (IT) infrastructure and our ability to expand and continually update this infrastructure in response to the changing needs of our business. If we experience a problem with the functioning of an important IT system or a security breach of our IT systems, the resulting disruptions could have an adverse effect on our business.
19
We and certain of our third-party vendors receive and store personal information in connection with our human resources operations and other aspects of our business. Despite our implementation of security measures, our IT systems are vulnerable to damages from computer viruses, natural disasters, unauthorized access, cyber-attack and other similar disruptions. Any system failure, accident or security breach could result in disruptions to our operations. A material network breach in the security of our IT systems could include the theft of our intellectual property, trade secrets or customer information. To the extent that any disruptions or security breach results in a loss or damage to our data or an inappropriate disclosure of confidential or customer information, it could cause significant damage to our reputation, affect our relationships with our customers, lead to claims against us and ultimately harm our business. In addition, we may be required to incur significant costs to protect against damage caused by these disruptions or security breaches in the future.
Risks Relating to the Separation
If the distribution and certain related transactions fail to qualify under applicable Internal Revenue Code provisions, Grace, the Company and Grace shareholders could be subject to significant tax liabilities and, in certain circumstances, the Company could be required to indemnify Grace for material taxes and other related amounts pursuant to indemnification obligations under the Tax Sharing Agreement.
As a condition to the distribution that effected the Separation, Grace was required to receive an opinion of counsel, in form and substance satisfactory to Grace in its sole discretion, regarding the U.S. federal income tax treatment of the distribution and certain related transactions. The opinion of counsel was based upon and relied on, among other things, certain facts and assumptions, as well as certain representations, statements and undertakings of Grace and us, including those relating to our and Grace's past and future conduct. If any of these representations, statements or undertakings were, or become, inaccurate or incomplete, or if Grace or we breach any of its or our covenants in the Separation documents, such as the Tax Sharing Agreement, the opinion of counsel may be invalid and the conclusions reached therein could be jeopardized.
Notwithstanding the opinion of counsel, the Internal Revenue Service (the “IRS”) could determine that the distribution and certain related transactions failed to qualify under applicable Internal Revenue Code provisions if it determines that any of the representations, assumptions or undertakings upon which the opinion of counsel were based were false or have been violated, or if it disagrees with the conclusions in the opinion of counsel. The opinion of counsel is not binding on the IRS and there can be no assurance that the IRS will not assert a contrary position.
If the distribution is determined to fail to qualify under applicable Internal Revenue Code provisions, then, in general, Grace may recognize taxable gain as if it had sold our common stock in a taxable sale for its fair market value (unless Grace and GCP jointly make an election under Section 336(e) of the Internal Revenue Code (the “Code”) with respect to the distribution, in which case, in general, we would (i) recognize taxable gain as if we had sold all of our assets in a taxable sale in exchange for an amount equal to the fair market value of our common stock and the assumption of all of our liabilities and (ii) obtain a related step up in the basis of our assets), and Grace shareholders at the time of the distribution who received shares of our common stock in the distribution would be subject to tax as if they had received a taxable distribution equal to the fair market value of such shares.
Under the Tax Sharing Agreement entered into between Grace and GCP, we may be required to indemnify Grace against any additional taxes and related amounts resulting from (1) an acquisition under certain circumstances of all or a portion of our equity securities or assets, whether by merger or otherwise (and regardless of whether we participated in or otherwise facilitated the acquisition), (2) other actions that we may take or fail to, or (3) any of our representations or undertakings made in connection with the Separation and the distribution being incorrect or violated. Any such indemnity obligations could be material. In addition, Grace, GCP and our respective subsidiaries may incur certain tax costs in connection with the Separation, including non-U.S. tax costs resulting from Separations in non-U.S. jurisdictions, which may be material.
20
U.S. federal income tax consequences may restrict our ability to engage in desirable strategic or capital-raising transactions following the distribution.
Under current law, a separation can be rendered taxable to the parent corporation and its shareholders as a result of certain post-separation acquisitions of shares or assets of the spun-off corporation. For example, a separation may result in taxable gain to the parent corporation under Section 355(e) of the Tax Code if the Separation were later deemed to be part of a plan (or series of related transactions) pursuant to which one or more persons, directly or indirectly, acquire shares representing a 50 percent or greater interest (by vote or value) in the spun-off corporation. To preserve the U.S. federal income tax treatment of the Separation and distribution, and in addition to our indemnity obligation described immediately above, the Tax Sharing Agreement restricts GCP, for the two-year period following the distribution, except in specified circumstances, from:
• | Entering into any transaction pursuant to which all or a portion of our assets or shares of our common stock would be acquired, whether by merger or otherwise; |
• | Issuing GCP equity securities beyond certain thresholds; |
• | Repurchasing our shares other than in certain open-market transactions; |
• | Ceasing to actively conduct or run certain of our businesses; or |
• | Taking or failing to take any other action that jeopardizes the expected U.S. federal income tax treatment of the Separation and certain related transactions. |
These restrictions may limit our ability to pursue certain equity issuances, strategic transactions or other transactions that may maximize the value of our business.
In connection with the Separation, Grace agreed to indemnify the Company for certain liabilities and we have agreed to indemnify Grace for certain liabilities. If the Company is required to act on these indemnities to Grace, we may need to divert cash to meet those obligations and our financial results could be negatively impacted. The Grace indemnity may not be sufficient to insure the Company against the full amount of liabilities for which it may be allocated responsibility, and Grace may not be able to satisfy its indemnification obligations in the future.
Pursuant to the Separation and Distribution Agreement and the Tax Sharing Agreement, Grace agreed to indemnify us for certain liabilities, and we agreed to indemnify Grace for certain liabilities, and we agreed to indemnify Grace in each case for uncapped amounts, as discussed further in “Certain Relationships and Related Transactions-Agreements with Grace.” Indemnities that we may be required to provide Grace are not subject to any cap, may be significant and could negatively impact our business, particularly indemnities relating to our actions that could impact the U.S. federal income tax treatment of the distribution and certain related transactions. Third parties could also seek to hold us responsible for any of the liabilities that Grace has agreed to retain. Further, the indemnity from Grace may not be sufficient to protect us against the full amount of such liabilities, and Grace may not be able to fully satisfy its indemnification obligations in the future. Moreover, even if we ultimately succeed in recovering from Grace any amounts for which we are held liable, we may be temporarily required to bear these losses ourselves. Each of these risks could negatively affect our business, results of operations and financial condition.
Certain of Grace’s insurance policies may not cover us for losses associated with occurrences prior to the Separation.
In connection with the Separation, we entered into agreements with Grace to address several matters associated with the Separation, including insurance coverage. Post-Separation, some of Grace’s insurance policies may not cover us for certain losses associated with occurrences prior to the Separation.
21
Several members of our Board of Directors and management may have actual or potential conflicts of interest because of their ownership of shares of common stock of Grace.
Several members of our Board of Directors and management own common stock of Grace and/or stock options to purchase common stock of Grace or other equity-based awards because of their current or prior relationships with Grace, which could create, or appear to create, potential conflicts of interest when our directors and executive officers are faced with decisions that could have different implications for Grace and our Company. See “Management.”
Risks Relating to Ownership of GCP Common Stock
Our share price may fluctuate significantly.
The market price of our common stock could fluctuate significantly due to a number of factors, many of which are beyond our control, including:
• | fluctuations in our quarterly or annual earnings results or those of other companies in the industry; |
• | failures of our operating results to meet the estimates of securities analysts or the expectations of shareholders or changes by securities analysts in their estimates of our future earnings; |
• | announcements made by us or our customers, suppliers or competitors; |
• | changes in laws or regulations which adversely affect us or our industry; |
• | changes in accounting standards, policies, guidance, interpretations or principles; |
• | general economic, industry and stock market conditions; |
• | future sales of company common stock by shareholders; |
• | future issuances of our common stock by us; and |
• | the other factors described in these “Risk Factors” and other parts of this Annual Report on Form 10-K. |
Provisions in the Company’s corporate documents, the Tax Sharing Agreement and Delaware law could delay or prevent a change-in-control of the Company, even if that change may be considered beneficial by some Company shareholders.
The existence of some provisions in our certificate of incorporation, our bylaws and of Delaware law could discourage, delay or prevent a change in control of the Company that a shareholder may consider favorable. These include provisions:
• | authorization of a large number of shares of common stock that are not yet issued, which may permit our Board of Directors to issue shares to persons friendly to current management, thereby protecting the continuity of the Company's management, or which could be used to dilute the stock ownership of persons seeking to obtain control of the Company; |
• | prohibition on shareholders calling special meetings and taking action by written consent; |
• | advance notice requirements for nominations of candidates for election to the Company's Board of Directors and for proposing matters to be acted on by shareholders at the annual shareholder meetings; |
• | the temporary classification of our Board of Directors; and |
• | supermajority voting requirements for certain amendments to the Company’s certificate of incorporation or shareholder proposals for amendments to the Company’s bylaws. |
In addition, since the Separation, the Company has been and is subject to Section 203 of the Delaware General Corporation Law, which may have an anti-takeover effect with respect to transactions not approved in advance by the Company's Board of Directors, including discouraging takeover attempts that might result in a premium over the market price for shares of company common stock.
22
We believe these provisions protect our shareholders from coercive or otherwise unfair takeover tactics by requiring potential acquirers to negotiate with our Board of Directors and by providing the Board of Directors with more time to assess any acquisition proposal as compared to its long term plan as a standalone company. However, these provisions apply even if a proposal may be considered beneficial by some shareholders and could delay or prevent an acquisition that our Board of Directors determines is not in the best interests of GCP and our shareholders.
In addition, an acquisition or further issuance of our stock could trigger the application of Section 355(e) of the Code. The Company may not be able to engage in desirable strategic or capital-raising transactions following the distribution. Under the Tax Sharing Agreement, the Company would be required to indemnify Grace for any resulting tax and related amounts, and this indemnity obligation might discourage, delay or prevent a change of control that you may consider favorable.
The Company may issue preferred stock with terms that could dilute the voting power or reduce the value of company common stock.
Our certificate of incorporation authorizes it to issue, without the approval of our shareholders, one or more classes or series of preferred stock having such designation, powers, preferences and relative, participating, optional and other special rights, including preferences over our common stock respecting dividends and distributions, as our Board of Directors generally may determine. The terms of one or more classes or series of preferred stock could dilute the voting power or reduce the value of company common stock. For example, we could grant holders of preferred stock the right to elect some number of directors in all events or on the happening of specified events or the right to veto specified transactions. Similarly, the repurchase or redemption rights or liquidation preferences that we could assign to holders of preferred stock could affect the residual value of the common stock.
The Company does not expect to pay any cash dividends for the foreseeable future.
We currently intend to retain future earnings to finance our business. As a result, GCP does not expect to pay any cash dividends for the foreseeable future. All decisions regarding the payment of dividends by GCP will be made by our Board of Directors from time to time in accordance with applicable law. There can be no assurance that we will have sufficient surplus under Delaware law to be able to pay any dividends at any time in the future. This may result from extraordinary cash expenses, actual expenses exceeding contemplated costs, funding of capital expenditures, increases in reserves or other currently unknown reasons. If we do not pay dividends, the price of our common stock must appreciate in order for you to receive a gain on your investment. This appreciation may not occur. Further, you may have to sell some or all of your shares of our common stock in order to generate cash flow from your investment.
Item 1B. UNRESOLVED STAFF COMMENTS
None.
Item 2. PROPERTIES
We operate manufacturing plants and other facilities (including offices, warehouses, labs and other service facilities) throughout the world. Some of these plants and facilities are shared among our operating segments. We consider our major operating properties to be in good operating condition and suitable for their current use. We believe that, after taking planned expansion into account, the productive capacity of our plants and other facilities is generally adequate for current operations. The tables below summarize our primary facilities by operating segment and region as of December 31, 2016.
23
Number of Facilities(1) | ||||||||||||||
North America | Europe Middle East Africa (EMEA) | Asia Pacific | Latin America | Total | ||||||||||
Specialty Construction Chemicals | 12 | 7 | 18 | 6 | 43 | |||||||||
Specialty Building Materials | 6 | 5 | 4 | — | 15 | |||||||||
Darex Packaging Technologies | 2 | 6 | 5 | 3 | 16 | |||||||||
(1) | Shared facilities are counted in all applicable operating segments. The total number of facilities included in the above table, without regard to sharing amongst operating segments, is 64. |
Number of Facilities—Leased(1) | ||||||||||||||
North America | Europe Middle East Africa (EMEA) | Asia Pacific | Latin America | Total | ||||||||||
Specialty Construction Chemicals | 4 | 3 | 14 | 5 | 26 | |||||||||
Specialty Building Materials | 1 | 3 | 3 | — | 7 | |||||||||
Darex Packaging Technologies | — | 2 | 2 | 3 | 7 | |||||||||
(1) | Shared facilities are counted in all applicable operating segments. |
Number of Facilities—Owned(1) | ||||||||||||||
North America | Europe Middle East Africa (EMEA) | Asia Pacific | Latin America | Total | ||||||||||
Specialty Construction Chemicals | 8 | 4 | 4 | 1 | 17 | |||||||||
Specialty Building Materials | 5 | 2 | 1 | — | 8 | |||||||||
Darex Packaging Technologies | 2 | 4 | 3 | — | 9 | |||||||||
___________________________________________________________________________________________________________________
(1) | Shared facilities are counted in all applicable operating segments. |
We own our principal facilities. With respect to our other facilities, we either own, lease or hold them under a land lease arrangement. Our corporate headquarters is in Cambridge, Massachusetts, and we also lease and operate a shared services facility in Manila, Philippines. Our largest facilities are located in Chicago, Illinois; Cambridge, Massachusetts; and Epernon, France. We also have numerous smaller locations around the world. SCC requires a greater number of facilities to service its customers than SBM or Darex as many of its products are water-based and are delivered to numerous distributors, concrete production locations, cement production locations and job sites. (See Note 3, "Properties and Equipment," to the Consolidated Financial Statements in Item 8).
In connection with our credit agreement, we have executed security agreements with respect to certain of our larger United States facilities. As of December 31, 2016, mortgages or deeds of trust were in effect with respect to facilities in Mount Pleasant, Tennessee and Chicago, Illinois. A description of our credit agreement may be found within Note 5, "Debt and Other Financial Instruments," to the Consolidated Financial Statements in Item 8.
Item 3. LEGAL PROCEEDINGS
Information with respect to this item may be found in Note 9, "Commitments and Contingencies," to the Consolidated Financial Statements in Item 8, which is incorporated herein by reference.
Item 4. MINE SAFETY DISCLOSURES
Not applicable.
24
EXECUTIVE OFFICERS OF THE REGISTRANT
Our executive officers as of February 1, 2017 are listed in the following table. Each executive officer was elected by our Board of Directors to serve for a term of one year and until his successor is elected and qualified or until his earlier resignation or removal.
Name | Age | Position | ||
G. E. Poling | 61 | President and Chief Executive Officer | ||
D. P. Freeman | 53 | Vice President and Chief Financial Officer | ||
J. W. Kapples | 57 | Vice President, General Counsel and Secretary | ||
Z. Mahmood | 50 | Vice President and President, SBM and Global Operations | ||
K.R. Holland | 55 | Vice President and Chief Human Resources Officer | ||
Gregory E. Poling has served as GCP’s President and Chief Executive Officer since our separation from W.R. Grace & Co. (“Grace”) on February 3, 2016. Mr. Poling had been employed with Grace since 1977. He held positions in sales, marketing, business development and general management across all of Grace's operating segments. From 1977 to 1999, Mr. Poling held positions of increasing responsibility in Grace's construction products business. In 2005, Mr. Poling became President of Grace Davison (one of Grace's two operating segments at the time which included Darex) and a Vice President of W. R. Grace & Co. On November 3, 2011, Mr. Poling was elected President and Chief Operating Officer of W. R. Grace & Co.
Dean P. Freeman has served as GCP’s Vice President and Chief Financial Officer since our separation from Grace on February 3, 2016. Mr. Freeman joined Grace in September 2015 as Vice President, GCP Finance. He previously served as Interim Chief Executive Officer and President, from January to May 2014, and as Executive Vice President and Chief Financial Officer, from 2012 to October 2014, at Watts Water Technologies, a global provider of products and solutions for the residential, commercial and industrial markets. Mr. Freeman served as Senior Vice President of Finance and Treasurer of Flowserve Corporation from 2009 to 2011 and as Vice President, Finance and Chief Financial Officer of the Flowserve Pump Division from 2006 to 2009. Prior to Flowserve, Mr. Freeman served as Chief Financial Officer, Europe for The Stanley Works Corporation. Mr. Freeman has also served in financial executive and management roles of progressive responsibility with United Technologies Corporation and SPX Corporation.
John W. Kapples has served as GCP’s Vice President, General Counsel and Secretary since our separation from Grace on February 3, 2016. Mr. Kapples joined Grace in December 2015 as Vice President and General Counsel, GCP. He previously served as Vice President at Medtronic plc from February 2015 to August 2015, where he assisted with legal transition and integration matters related to Medtronic's acquisition of Covidien plc. From 2006 to 2015, Mr. Kapples served as Vice President and Secretary at Covidien, a medical device and pharmaceutical company. Prior to Covidien, Mr. Kapples served in management and legal roles of increasing responsibility at Raytheon Company.
Zain Mahmood has served as GCP’s Vice President and President, SBM and Global Operations, since our separation from Grace on February 3, 2016. Mr. Mahmood joined Grace in November 2015 as Vice President and President, SBM and Global Operations, GCP. He previously served from 2013 to 2015 as President and CEO at Demilec Inc., a polyurethane-based insulation and coatings manufacturer. From 2007 to 2012, Mr. Mahmood served as President and CEO at Parkson Corporation, a water and wastewater treatment equipment manufacturer. Prior to Parkson, Mr. Mahmood served in management roles of increasing responsibility with Johns Manville Corporation, ABB and AlliedSignal (currently Honeywell).
Kevin R. Holland joined GCP on January 17, 2017 as Vice President and Chief Human Resources Officer. Prior to joining GCP, he served during 2016 as a Senior Vice President and Chief Human Resources Officer at BrightStar Corporation, a $12 billion mobile technology services company. From 2005 to 2016, Mr. Holland was employed at Chiquita Brands International, where he served in management roles of increasing responsibility culminating in his position as Executive Vice President and Chief Administrative Officer. Previous positions include senior human resource roles with global businesses, including Molson Coors Brewing Company (2003 to 2005) and FedEx Kinko's (1999 to 2003).
25
PART II.
Item 5. MARKET FOR REGISTRANT'S COMMON EQUITY, RELATED SHAREHOLDER MATTERS AND ISSUER PURCHASES OF EQUITY SECURITIES
Our common stock is listed on the New York Stock Exchange ("NYSE") under the ticker symbol "GCP." There were 4,772 stockholders of record of our common stock as of December 31, 2016. The high and low common stock sales prices per share for 2016 are presented below.
2016 | |||||||
High | Low | ||||||
First quarter | $ | 20.67 | $ | 14.47 | |||
Second quarter | 27.01 | 19.51 | |||||
Third quarter | 30.12 | 25.18 | |||||
Fourth quarter | 30.12 | 25.10 | |||||
The high and low market prices per share of our common stock as reported by the NYSE for each full quarterly period of fiscal year 2015 are not provided as the common stock of GCP Applied Technologies, Inc. did not begin "regular way" trading on the NYSE until February 4, 2016.
Since the Separation, we have not paid a dividend to holders of our common stock. Further, we currently intend to retain future earnings to finance our business. As a result, we do not expect to pay any cash dividends for the foreseeable future. All decisions regarding the payment of dividends to our shareholders will be made by our Board of Directors from time to time in accordance with applicable law.
Recent Sales of Unregistered Equity Securities
None.
Issuer Purchases of Equity Securities
None.
26
STOCK PERFORMANCE GRAPH AND CUMULATIVE TOTAL RETURN
The graph below shows the cumulative total stockholder return, assuming the investment of $100 on February 4, 2016 (and the reinvestment of dividends thereafter), in each of GCP common stock, the Standard & Poor's (S&P) 1000 Index and the S&P 1500 Specialty Chemicals Index. The comparisons in the graph below are based on historical data and are not indicative of, or intended to forecast, future performance of our common stock.
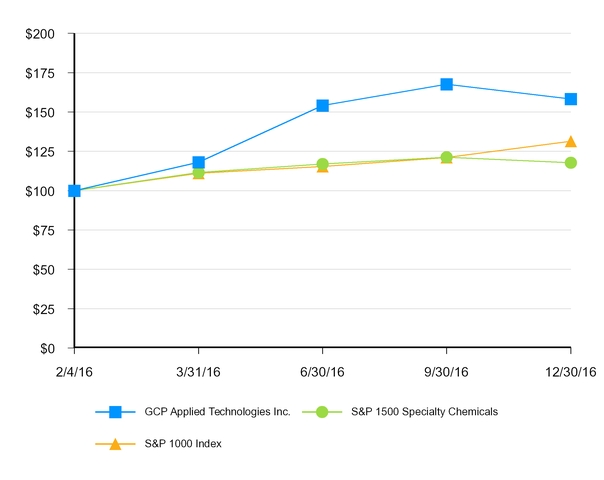
Fiscal 2016 | |||||||||||||||||||
2/4/16 | 3/31/16 | 6/30/16 | 9/30/16 | 12/30/16 | |||||||||||||||
GCP Applied Technologies Inc. | $ | 100 | $ | 118 | $ | 154 | $ | 168 | $ | 158 | |||||||||
S&P 1500 Specialty Chemicals | 100 | 111 | 117 | 121 | 118 | ||||||||||||||
S&P 1000 Index | 100 | 111 | 115 | 121 | 131 | ||||||||||||||
Item 6. SELECTED FINANCIAL DATA
The following selected consolidated financial data should be read in conjunction with the information contained in Item 7, “Management’s Discussion and Analysis of Financial Condition and Results of Operations,” and the Consolidated Financial Statements and notes thereto included in Item 8 of this Annual Report on Form 10-K, which are incorporated herein by reference, in order to understand the factors that may affect the comparability of the information presented below.
27
The statement of operations data for each of the years ended December 31, 2016, 2015 and 2014, and the balance sheet data as of December 31, 2016 and 2015 set forth below are derived from our audited Consolidated Financial Statements included elsewhere in this Annual Report on Form 10-K. We derived the statement of operations data for the year ended December 31, 2013 set forth below from our audited Consolidated Financial Statements included in our December 31, 2015 Annual Report on Form 10-K. We derived the statement of operations data for the year ended December 31, 2012 and the balance sheet data as of December 31, 2013 and 2012 set forth below from information that is included in our Registration Statement on Form 10, as filed with the SEC on January 12, 2016.
Prior to GCP's separation from Grace on February 3, 2016, our financial statements included expense allocations for certain functions provided by Grace as well as other Grace employees not solely dedicated to GCP, including, but not limited to, general corporate expenses related to finance, legal, information technology, human resources, communications, ethics and compliance, shared services, employee benefits and incentives and stock-based compensation. These expenses were allocated to GCP on the basis of direct usage when identifiable, with the remainder allocated on the basis of revenue, headcount or other measures. Management of the Company considers these allocations to be a reasonable reflection of the utilization of services by, or the benefits provided to, the Company. The allocations may not, however, reflect the expense the Company would have incurred as a standalone company for the periods presented prior to February 3, 2016. Actual costs that may have been incurred if the Company had been a standalone company would depend on a number of factors, including the chosen organizational structure, what functions were outsourced or performed by employees and strategic decisions made in areas such as information technology and infrastructure.
The selected consolidated financial data in this section are not intended to replace the Consolidated Financial Statements and are qualified in their entirety by the Consolidated Financial Statements and related notes included elsewhere in this Annual Report on Form 10-K.
Fiscal Year Ended December 31, | ||||||||||||||||||||
(in millions, except per share amounts) | 2016 | 2015 | 2014 | 2013 | 2012 | |||||||||||||||
Statement of Operations | ||||||||||||||||||||
Net sales | $ | 1,355.8 | $ | 1,418.6 | $ | 1,480.4 | $ | 1,442.3 | $ | 1,409.2 | ||||||||||
Net income | 73.8 | 40.9 | 135.5 | 111.3 | 86.3 | |||||||||||||||
Net income attributable to noncontrolling interests | (1.0 | ) | (0.8 | ) | (1.2 | ) | (1.6 | ) | (1.1 | ) | ||||||||||
Net income attributable to GCP | 72.8 | 40.1 | 134.3 | 109.7 | 85.2 | |||||||||||||||
Basic and diluted earnings per share(1) | ||||||||||||||||||||
Diluted earnings per share attributable to GCP | $ | 1.02 | $ | 0.57 | $ | 1.90 | $ | 1.56 | $ | 1.21 | ||||||||||
Average diluted shares outstanding | 71.7 | 70.5 | 70.5 | 70.5 | 70.5 | |||||||||||||||
Financial Position | ||||||||||||||||||||
Total assets | $ | 1,089.8 | $ | 833.1 | $ | 981.5 | $ | 986.4 | $ | 966.3 | ||||||||||
Long-term debt | 783.0 | — | — | 4.5 | 11.4 | |||||||||||||||
Long-term debt—related party | — | — | — | 9.3 | 20.1 | |||||||||||||||
_____________________________________________________________________________
(1) GCP's earnings per share amounts for 2015 and 2014 were calculated using the shares that were distributed to Grace shareholders immediately following the legal separation. For periods prior to February 3, 2016, it is assumed that there are no dilutive equity instruments as there were no GCP equity awards outstanding prior to the legal separation from Grace.
28
ITEM 7. MANAGEMENT'S DISCUSSION AND ANALYSIS OF FINANCIAL CONDITION AND RESULTS OF OPERATIONS
See "Analysis of Operations" for a discussion of our non-GAAP performance measures. Our references to "advanced economies" and "emerging regions" refer to classifications established by the International Monetary Fund.
Summary Description of Business
We are engaged in the production and sale of specialty construction chemicals, specialty building materials and packaging sealants and coatings through three global operating segments:
• | Specialty Construction Chemicals. Specialty Construction Chemicals ("SCC") provides products, technologies, and services that reduce the cost and improve the performance of cement, concrete, mortar, masonry and other cementitious based construction materials. |
• | Specialty Building Materials. Specialty Building Materials ("SBM") produces and sells sheet and liquid membrane systems and other products that protect both new and existing structures from water, air, and vapor penetration, and from fire damage. We also manufacture and sell specialized cementitious and chemical grouts used for soil consolidation and leak-sealing applications in addition to a moisture barrier system and installation tools for the flooring industry. |
• | Darex Packaging Technologies. Darex Packaging Technologies ("Darex") produces and sells sealants and coatings for consumer and industrial applications to protect the integrity of packaged products. |
We operate our business on a global scale with approximately 60% of our annual 2016 net sales from outside the United States. We operate in approximately 35 countries and transact in over 30 currencies. We manage our operating segments on a global basis to serve global markets. Currency fluctuations affect our reported results of operations, cash flows and financial position.
On January 27, 2016, GCP entered into a Separation and Distribution Agreement pursuant to which Grace agreed to transfer its Grace Construction Products operating segment and the packaging technologies business, operated under the “Darex” name, of its Grace Materials Technologies operating segment to GCP (the "Separation"). The Separation occurred on February 3, 2016, by means of a pro rata distribution to Grace stockholders of all of the outstanding shares of Company common stock (the "Distribution"). Under the Distribution, one share of Company common stock was distributed for each share of Grace common stock held as of the close of business on January 27, 2016. On February 4, 2016 GCP began "regular way" trading on the New York Stock Exchange under the ticker symbol "GCP."
Results of Operations
2016 Performance Summary
Following is a summary of our financial performance for the year ended December 31, 2016, compared with the prior year.
• | Net sales decreased 4.4% to $1.4 billion. |
• | Net income attributable to GCP shareholders was $72.8 million or $1.02 per diluted share, compared to net income attributable to GCP shareholders of $40.1 million or $0.57 per diluted share, for the prior year. Adjusted EPS was $1.41 per diluted share. |
• | Adjusted EBIT decreased 5.7% to $213.8 million. |
• | Adjusted EBIT Return On Invested Capital was 38.4% compared with 48.0% for the year ended December 31, 2015. |
29
2015 Performance Summary
Following is a summary of our financial performance for the year ended December 31, 2015, compared with the prior year.
• | Net sales decreased 4.2% to $1.4 billion. |
• | Net income attributable to GCP shareholders was $40.1 million or $0.57 per diluted share, compared to net income attributable to GCP shareholders of $134.3 million or $1.90 per diluted share, for the prior year. |
• | Adjusted EBIT increased 16.0% to $226.7 million. |
• | Adjusted EBIT Return On Invested Capital was 48.0% compared with 36.5% for the year ended December 31, 2014. |
Analysis of Operations for 2016, 2015 and 2014
We have set forth in the table below our key operating statistics with percentage changes for the years ended December 31, 2016, 2015 and 2014. Please refer to this Analysis of Operations when reviewing this Management's Discussion and Analysis of Financial Condition and Results of Operations.
Non-GAAP Financial Measures
The table below presents financial information in accordance with U.S. GAAP, as well as certain non-GAAP financial measures, which we describe below in further detail. We believe that the non-GAAP financial information supplements our discussions about the performance of our businesses, improves period-to-period comparability and provides insight to the information that our management uses to evaluate the performance of our businesses. Our management uses non-GAAP measures in financial and operational decision-making processes, for internal reporting, and as part of forecasting and budgeting processes, as these measures provide additional transparency to our core operations.
In the table, we have provided reconciliations of these non-GAAP financial measures to the most directly comparable financial measures calculated and presented in accordance with U.S. GAAP. These non-GAAP financial measures should not be considered substitutes for financial measures calculated in accordance with U.S. GAAP, and the financial results that we calculate and present in the table in accordance with U.S. GAAP, as well as the corresponding reconciliations from those results, should be carefully evaluated as part of our MD&A.
We define Adjusted EBIT (a non-GAAP financial measure) to be net income attributable to GCP shareholders adjusted for interest income; interest expense and related financing costs; income taxes; currency and other financial losses in Venezuela; restructuring and repositioning expenses and asset impairments; pension costs other than service and interest costs, expected returns on plan assets and amortization of prior service costs/credits; income and expense items related to certain product lines and investments; gains and losses on sales of businesses, product lines and certain other investments; third-party acquisition-related costs; the amortization of acquired inventory fair value adjustment; and certain other items that are not representative of underlying trends. Adjusted EBIT Margin means Adjusted EBIT divided by net sales. We use Adjusted EBIT to assess and measure our operating performance and in determining performance-based compensation. We use Adjusted EBIT as a performance measure because it provides improved period-to-period comparability for decision-making and compensation purposes and because it allows management to measure the ongoing earnings results of our strategic and operating decisions.
We define Adjusted EBITDA (a non-GAAP financial measure) to be Adjusted EBIT adjusted for depreciation and amortization. We use Adjusted EBITDA as a performance measure in making significant business decisions.
30
We define Adjusted Earnings Per Share (a non-GAAP financial measure) to be earnings per share ("EPS") on a diluted basis adjusted for costs related to restructuring and repositioning expenses and asset impairments; pension costs other than service and interest costs, expected return on plan assets and amortization of prior service costs/credits; gains and losses on sales of businesses, product lines and certain other investments; third-party acquisition-related costs; other financing costs associated with the modification or extinguishment of debt; certain other items that are not representative of underlying trends; and certain discrete tax items. We use Adjusted EPS as a performance measure to review our diluted earnings per share results on a consistent basis during the quarters of each fiscal year.
We define Adjusted Gross Profit (a non-GAAP financial measure) to be gross profit adjusted for pension-related costs; loss in Venezuela included in cost of goods sold; and the amortization of acquired inventory fair value adjustment. Adjusted Gross Margin means Adjusted Gross Profit divided by net sales. We use this performance measure to understand trends and changes and to make business decisions regarding core operations. We note that the devaluation loss in Venezuela results primarily from geopolitical factors.
We define Adjusted EBIT Return On Invested Capital (a non-GAAP financial measure) to be Adjusted EBIT (on a trailing four quarters basis) divided by the sum of net working capital, properties and equipment and certain other assets and liabilities. We use Adjusted EBIT Return On Invested Capital as a performance measure to review investments and to make capital allocation decisions.
Adjusted EBIT, Adjusted EBITDA, Adjusted EPS, Adjusted EBIT Return On Invested Capital and Adjusted Gross Profit do not purport to represent income measures as defined under U.S. GAAP. These measures are provided to investors and others to improve the period-to-period comparability and peer-to-peer comparability of our financial results and to ensure that investors understand the information we use to evaluate the performance of our businesses.
Adjusted EBIT has material limitations as an operating performance measure because it excludes costs related to income and expenses from restructuring and repositioning activities, which historically have been a material component of our net income. Adjusted EBITDA also has material limitations as an operating performance measure because it excludes the impact of depreciation and amortization expense. Our business is substantially dependent on the successful deployment of capital and depreciation and amortization expense is a necessary element of our costs. We compensate for the limitations of these measurements by using these indicators together with net income as measured under GAAP to present a complete analysis of our results of operations. Adjusted EBIT and Adjusted EBITDA should be evaluated together with net income measured under GAAP for a complete understanding of our results of operations.
31
We have provided in the following tables a reconciliation of these non-GAAP measures to the most directly comparable financial measure calculated and presented in accordance with U.S. GAAP.
Analysis of Operations (In millions) | 2016 | 2015 | % Change | 2014 | % Change | ||||||||||||
Net sales: | |||||||||||||||||
Specialty Construction Chemicals | $ | 623.8 | $ | 694.3 | (10.2 | )% | $ | 726.3 | (4.4 | )% | |||||||
Specialty Building Materials | 422.7 | 398.1 | 6.2 | % | 379.3 | 5.0 | % | ||||||||||
Darex Packaging Technologies | 309.3 | 326.2 | (5.2 | )% | 374.8 | (13.0 | )% | ||||||||||
Total GCP net sales | $ | 1,355.8 | $ | 1,418.6 | (4.4 | )% | $ | 1,480.4 | (4.2 | )% | |||||||
Net sales by region: | |||||||||||||||||
North America | $ | 572.8 | $ | 538.2 | 6.4 | % | $ | 503.9 | 6.8 | % | |||||||
Europe Middle East Africa (EMEA) | 321.3 | 341.1 | (5.8 | )% | 396.0 | (13.9 | )% | ||||||||||
Asia Pacific | 322.6 | 329.6 | (2.1 | )% | 349.7 | (5.7 | )% | ||||||||||
Latin America | 139.1 | 209.7 | (33.7 | )% | 230.8 | (9.1 | )% | ||||||||||
Total net sales by region | $ | 1,355.8 | $ | 1,418.6 | (4.4 | )% | $ | 1,480.4 | (4.2 | )% | |||||||
Profitability performance measures: | |||||||||||||||||
Adjusted EBIT(A): | |||||||||||||||||
Specialty Construction Chemicals segment operating income | $ | 72.6 | $ | 83.7 | (13.3 | )% | $ | 72.4 | 15.6 | % | |||||||
Specialty Building Materials segment operating income | 114.0 | 99.6 | 14.5 | % | 75.7 | 31.6 | % | ||||||||||
Darex Packaging Technologies segment operating income | 64.8 | 72.8 | (11.0 | )% | 74.1 | (1.8 | )% | ||||||||||
Corporate costs(B) | (29.2 | ) | (24.3 | ) | (20.2 | )% | (19.3 | ) | (25.9 | )% | |||||||
Certain pension costs(C) | (8.4 | ) | (5.1 | ) | (64.7 | )% | (7.5 | ) | 32.0 | % | |||||||
Adjusted EBIT (non-GAAP) | 213.8 | 226.7 | (5.7 | )% | 195.4 | 16.0 | % | ||||||||||
Currency and other financial losses in Venezuela | — | (73.2 | ) | NM | (1.0 | ) | NM | ||||||||||
Repositioning expenses | (15.3 | ) | — | NM | — | NM | |||||||||||
Restructuring expenses and asset impairments | (1.9 | ) | (11.6 | ) | 83.6 | % | (18.3 | ) | 36.6 | % | |||||||
Pension MTM adjustment and other related costs, net | (23.2 | ) | (15.0 | ) | (54.7 | )% | 18.6 | NM | |||||||||
Gain on termination and curtailment of pension and other postretirement plans | 0.8 | — | NM | — | NM | ||||||||||||
Third-party acquisition-related costs | (2.1 | ) | — | NM | — | NM | |||||||||||
Other financing costs | (1.2 | ) | — | NM | — | NM | |||||||||||
Amortization of acquired inventory fair value adjustment | (1.3 | ) | — | NM | — | NM | |||||||||||
Interest expense, net | (64.6 | ) | (2.5 | ) | NM | (4.8 | ) | 47.9 | % | ||||||||
Provision for income taxes | (32.2 | ) | (84.3 | ) | 61.8 | % | (55.6 | ) | (51.6 | )% | |||||||
Net income attributable to GCP shareholders (GAAP) | $ | 72.8 | $ | 40.1 | 81.5 | % | $ | 134.3 | (70.1 | )% | |||||||
Diluted EPS (GAAP) | $ | 1.02 | $ | 0.57 | $ | 1.90 | |||||||||||
Adjusted EPS (non-GAAP) | $ | 1.41 | |||||||||||||||
32
Analysis of Operations (In millions) | 2016 | 2015 | % Change | 2014 | % Change | ||||||||||||
Adjusted profitability performance measures: | |||||||||||||||||
Gross Profit: | |||||||||||||||||
Specialty Construction Chemicals | $ | 229.9 | $ | 244.3 | (5.9 | )% | $ | 244.8 | (0.2 | )% | |||||||
Specialty Building Materials | 196.7 | 179.5 | 9.6 | % | 158.0 | 13.6 | % | ||||||||||
Darex Packaging Technologies | 111.3 | 113.9 | (2.3 | )% | 121.0 | (5.9 | )% | ||||||||||
Adjusted Gross Profit (non-GAAP) | 537.9 | 537.7 | — | % | 523.8 | 2.7 | % | ||||||||||
Amortization of acquired inventory fair value adjustment | (1.3 | ) | — | NM | — | NM | |||||||||||
Loss in Venezuela in cost of goods sold | — | (13.7 | ) | NM | — | NM | |||||||||||
Pension costs in cost of goods sold | (7.9 | ) | (7.8 | ) | (1.3 | )% | 6.6 | NM | |||||||||
Total GCP Gross Profit (GAAP) | 528.7 | 516.2 | 2.4 | % | 530.4 | (2.7 | )% | ||||||||||
Gross Margin: | |||||||||||||||||
Specialty Construction Chemicals | 36.9 | % | 35.2 | % | 1.7 pts | 33.7 | % | 1.5 pts | |||||||||
Specialty Building Materials | 46.5 | % | 45.1 | % | 1.4 pts | 41.7 | % | 3.4 pts | |||||||||
Darex Packaging Technologies | 36.0 | % | 34.9 | % | 1.1 pts | 32.3 | % | 2.6 pts | |||||||||
Adjusted Gross Margin (non-GAAP) | 39.7 | % | 37.9 | % | 1.8 pts | 35.4 | % | 2.5 pts | |||||||||
Amortization of acquired inventory fair value adjustment | (0.1 | )% | — | % | NM | — | % | NM | |||||||||
Loss in Venezuela in cost of goods sold | — | % | (1.0 | )% | NM | — | % | NM | |||||||||
Pension costs in cost of goods sold | (0.6 | )% | (0.5 | )% | (0.1) pts | 0.4 | % | (0.9) pts | |||||||||
Total GCP Gross Margin (GAAP) | 39.0 | % | 36.4 | % | 2.6 pts | 35.8 | % | 0.6 pts | |||||||||
Adjusted EBIT(A)(B)(C): | |||||||||||||||||
Specialty Construction Chemicals segment operating income | $ | 72.6 | $ | 83.7 | (13.3 | )% | $ | 72.4 | 15.6 | % | |||||||
Specialty Building Materials segment operating income | 114.0 | 99.6 | 14.5 | % | 75.7 | 31.6 | % | ||||||||||
Darex Packaging Technologies segment operating income | 64.8 | 72.8 | (11.0 | )% | 74.1 | (1.8 | )% | ||||||||||
Corporate and certain pension costs | (37.6 | ) | (29.4 | ) | (27.9 | )% | (26.8 | ) | (9.7 | )% | |||||||
Total GCP Adjusted EBIT (non-GAAP) | 213.8 | 226.7 | (5.7 | )% | 195.4 | 16.0 | % | ||||||||||
Depreciation and amortization: | |||||||||||||||||
Specialty Construction Chemicals | $ | 20.0 | $ | 18.0 | 11.1 | % | $ | 18.5 | (2.7 | )% | |||||||
Specialty Building Materials | 9.6 | 7.8 | 23.1 | % | 8.6 | (9.3 | )% | ||||||||||
Darex Packaging Technologies | 6.4 | 4.8 | 33.3 | % | 5.5 | (12.7 | )% | ||||||||||
Corporate | 0.2 | 1.2 | (83.3 | )% | 1.4 | (14.3 | )% | ||||||||||
Total GCP | 36.2 | 31.8 | 13.8 | % | 34.0 | (6.5 | )% | ||||||||||
Adjusted EBITDA: | |||||||||||||||||
Specialty Construction Chemicals | $ | 92.6 | $ | 101.7 | (8.9 | )% | $ | 90.9 | 11.9 | % | |||||||
Specialty Building Materials | 123.6 | 107.4 | 15.1 | % | 84.3 | 27.4 | % | ||||||||||
Darex Packaging Technologies | 71.2 | 77.6 | (8.2 | )% | 79.6 | (2.5 | )% | ||||||||||
Corporate and certain pension costs | (37.4 | ) | (28.2 | ) | (32.6 | )% | (25.4 | ) | (11.0 | )% | |||||||
Total GCP Adjusted EBITDA (non-GAAP) | 250.0 | 258.5 | (3.3 | )% | 229.4 | 12.7 | % | ||||||||||
Adjusted EBIT Margin: | |||||||||||||||||
Specialty Construction Chemicals | 11.6 | % | 12.1 | % | (0.5) pts | 10.0 | % | 2.1 pts | |||||||||
Specialty Building Materials | 27.0 | % | 25.0 | % | 2.0 pts | 20.0 | % | 5.0 pts | |||||||||
Darex Packaging Technologies | 21.0 | % | 22.3 | % | (1.3) pts | 19.8 | % | 2.5 pts | |||||||||
Total GCP Adjusted EBIT Margin (non-GAAP) | 15.8 | % | 16.0 | % | (0.2) pts | 13.2 | % | 2.8 pts | |||||||||
Adjusted EBITDA Margin: | |||||||||||||||||
Specialty Construction Chemicals | 14.8 | % | 14.6 | % | 0.2 pts | 12.5 | % | 2.1 pts | |||||||||
Specialty Building Materials | 29.2 | % | 27.0 | % | 2.2 pts | 22.2 | % | 4.8 pts | |||||||||
Darex Packaging Technologies | 23.0 | % | 23.8 | % | (0.8) pts | 21.2 | % | 2.6 pts | |||||||||
Total GCP Adjusted EBITDA Margin (non-GAAP) | 18.4 | % | 18.2 | % | 0.2 pts | 15.5 | % | 2.7 pts | |||||||||
33
Analysis of Operations (In millions) | 2016 | 2015 | 2014 | ||||||||
Calculation of Adjusted EBIT Return On Invested Capital (trailing four quarters): | |||||||||||
Adjusted EBIT | $ | 213.8 | $ | 226.7 | $ | 195.4 | |||||
Invested Capital: | |||||||||||
Trade accounts receivable | 217.1 | 203.6 | 225.8 | ||||||||
Inventories | 121.6 | 105.3 | 122.9 | ||||||||
Accounts payable | (122.6 | ) | (109.0 | ) | (112.3 | ) | |||||
216.1 | 199.9 | 236.4 | |||||||||
Other current assets (excluding income taxes and related party loans receivable) | 41.2 | 34.5 | 38.6 | ||||||||
Properties and equipment, net | 232.2 | 197.1 | 197.5 | ||||||||
Goodwill | 119.3 | 102.5 | 114.0 | ||||||||
Technology and other intangible assets, net | 53.0 | 33.3 | 44.0 | ||||||||
Other assets (excluding capitalized financing fees) | 22.8 | 10.1 | 8.5 | ||||||||
Other current liabilities (excluding income taxes, restructuring, repositioning and accrued interest) | (110.5 | ) | (96.9 | ) | (95.0 | ) | |||||
Other liabilities (excluding other postretirement benefits liability) | (17.7 | ) | (8.6 | ) | (9.1 | ) | |||||
Total invested capital | $ | 556.4 | $ | 471.9 | $ | 534.9 | |||||
Adjusted EBIT Return On Invested Capital (non-GAAP) | 38.4 | % | 48.0 | % | 36.5 | % | |||||
___________________________________________________________________________________________________________________
Amounts may not add due to rounding.
(A) | GCP's segment operating income includes only GCP's share of income of consolidated joint ventures. |
(B) | Management allocates corporate costs to each segment to the extent such costs are directly attributable to the segments. |
(C) | Certain pension costs include only ongoing costs recognized quarterly, which include service and interest costs, expected returns on plan assets and amortization of prior service costs/credits. SCC, SBM and Darex segment operating income and corporate costs do not include any amounts for pension expense. Other pension related costs including annual mark-to-market adjustments, actuarial gains and losses, gains or losses from curtailments and terminations and other related costs are excluded from Adjusted EBIT. These amounts are not used by management to evaluate the performance of the GCP businesses and significantly affect the peer-to-peer and period-to-period comparability of our financial results. Mark-to-market adjustments, actuarial gains and losses, and other related costs relate primarily to changes in financial market values and actuarial assumptions and are not directly related to the operation of the GCP businesses. |
NM | Not meaningful. |
34
Adjusted EPS
The following table reconciles our Diluted EPS (GAAP) to our Adjusted EPS (non-GAAP).
Year Ended December 31, 2016 | |||||||||||||||
(In millions, except per share amounts) | Pre-Tax | Tax Effect | After-Tax | Per Share | |||||||||||
Diluted Earnings Per Share (GAAP) | $ | 1.02 | |||||||||||||
Repositioning expenses | $ | 15.3 | $ | 5.5 | $ | 9.8 | 0.14 | ||||||||
Restructuring expenses | 1.9 | 0.5 | 1.4 | 0.02 | |||||||||||
Gain on termination and curtailment of pension and other postretirement plans | (0.8 | ) | (0.3 | ) | (0.5 | ) | (0.01 | ) | |||||||
Pension MTM adjustment and other related costs, net | 23.2 | 8.0 | 15.2 | 0.21 | |||||||||||
Third-party acquisition-related costs | 2.1 | 0.8 | 1.3 | 0.02 | |||||||||||
Amortization of acquired inventory fair value adjustment | 1.3 | 0.5 | 0.8 | 0.01 | |||||||||||
Other financing costs | 1.2 | 0.5 | 0.7 | 0.01 | |||||||||||
Discrete tax items: | |||||||||||||||
Discrete tax items, including adjustments to uncertain tax positions | — | 1.2 | (1.2 | ) | (0.01 | ) | |||||||||
Adjusted EPS (non-GAAP) | $ | 1.41 | |||||||||||||
GCP Overview
Following is an overview of our financial performance for the years ended December 31, 2016, 2015 and 2014.
During these periods, we benefited from increased construction spending in North America, and to a lesser extent, increased construction spending in Asia Pacific. Sales volumes in Europe and Latin America have been weaker, particularly in Latin America. We generally expect these demand trends to continue through 2017. We also benefited from declining raw material costs in 2015 and 2016, which contributed to the increase in gross margin in these years. Prices for certain raw materials have begun to rise, and we anticipate modest cost inflation in 2017. Currency changes, due to the stronger U.S. dollar, have had a significant negative effect on revenue during this time period and we expect currency changes to continue to have a negative effect through 2017.
Net Sales and Gross Margin
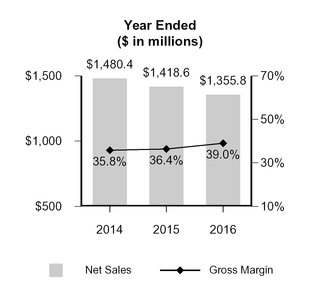
35
The following table identifies the year-over-year increase or decrease in sales attributable to changes in volume and/or mix, product price, the impact of currency translation and for changes in net sales in Venezuela for 2016.
2016 as a Percentage Increase (Decrease) from 2015 | ||||||||||||||
Net Sales Variance Analysis | Volume(1) | Price(1) | Currency Translation(1) | Net Sales in Venezuela | Total Change | |||||||||
Specialty Construction Chemicals | (0.9 | )% | 0.3 | % | (3.3 | )% | (6.3 | )% | (10.2 | )% | ||||
Specialty Building Materials | 7.4 | % | 0.5 | % | (1.7 | )% | — | % | 6.2 | % | ||||
Darex Packaging Technologies | 2.2 | % | (1.2 | )% | (3.2 | )% | (3.0 | )% | (5.2 | )% | ||||
Net sales | 2.3 | % | — | % | (2.8 | )% | (3.9 | )% | (4.4 | )% | ||||
By Region: | ||||||||||||||
North America | 6.5 | % | 0.1 | % | (0.2 | )% | — | % | 6.4 | % | ||||
Europe Middle East Africa | (1.4 | )% | (0.6 | )% | (3.8 | )% | — | % | (5.8 | )% | ||||
Asia Pacific | 1.6 | % | (2.0 | )% | (1.7 | )% | — | % | (2.1 | )% | ||||
Latin America | (3.5 | )% | 5.8 | % | (12.7 | )% | (23.3 | )% | (33.7 | )% | ||||
(1) | Excludes net sales in Venezuela. |
Net sales of $1,355.8 million for 2016 decreased $62.8 million or 4.4% compared with the prior year primarily due to a decrease of sales in Venezuela and unfavorable currency translation, partially offset by higher sales volume in SBM and Darex. The strengthening of the US dollar against the euro, British pound, Argentine peso and other global currencies resulted in unfavorable foreign exchange impacts, particularly in SCC and Darex. Excluding Venezuela, net sales for 2016 decreased 0.5% compared with the prior year.
Net sales in Venezuela decreased $55.9 million or 79.3% in 2016 compared with the prior year, primarily due to the devaluation of the Venezuelan bolivar in the third quarter of 2015 and further weakening against the U.S. dollar in 2016. See "Venezuela" below for further discussion.
The following table presents Venezuela's net sales, Adjusted Gross Profit, and Adjusted EBIT by operating segment as compared with the prior year.
Venezuela Financial Performance for the Year Ended December 31, 2016 | |||||||||||||||
($ in millions) | SCC | Darex | Corporate | Total Venezuela | |||||||||||
Net sales | $ | 8.5 | $ | 6.1 | $ | — | $ | 14.6 | |||||||
Adjusted Gross Profit | 4.2 | 3.8 | — | 8.0 | |||||||||||
Adjusted EBIT | 3.0 | 3.3 | (3.6 | ) | 2.7 | ||||||||||
Venezuela Financial Performance for the Year Ended December 31, 2015(1) | |||||||||||||||
($ in millions) | SCC | Darex | Corporate | Total Venezuela | |||||||||||
Net sales | $ | 54.4 | $ | 16.1 | $ | — | $ | 70.5 | |||||||
Adjusted Gross Profit | 29.0 | 6.3 | — | 35.3 | |||||||||||
Adjusted EBIT | 26.9 | 4.9 | (2.5 | ) | 29.3 | ||||||||||
36
Year Ended December 31, 2016 versus Year Ended December 31, 2015 - Change (%) | |||||||||||
SCC | Darex | Corporate | Total Venezuela | ||||||||
Net sales | (84.4 | )% | (62.1 | )% | NM | (79.3 | )% | ||||
Adjusted Gross Profit | (85.5 | )% | (39.7 | )% | NM | (77.3 | )% | ||||
Adjusted EBIT | (88.8 | )% | (32.7 | )% | 44.0 | % | (90.8 | )% | |||
__________________________
(1) | In the table above for the year ended December 31, 2015, Venezuela's Adjusted Gross Profit excludes the $13.7 million loss in Venezuela included in cost of goods sold and Adjusted EBIT excludes the $73.2 million currency and other financial losses in Venezuela incurred as a result of the currency devaluation in the third quarter of 2015. |
GCP's gross margin of 39.0% increased 260 basis points for 2016 compared with the prior year, primarily due to lower raw material cost, productivity improvements and a $13.7 million loss in Venezuela included in cost of goods sold in the third quarter of 2015 that did not repeat in 2016.
GCP's Adjusted Gross Margin of 39.7% for 2016 increased 180 basis points compared with the prior year, primarily due to lower raw material cost and productivity improvements.
The following table identifies the year-over-year increase or decrease in net sales attributable to changes in volume and/or mix, product price, the impact of currency translation and for changes in net sales in Venezuela for 2015.
2015 as a Percentage Increase (Decrease) from 2014 | ||||||||||||||
Net Sales Variance Analysis | Volume(1) | Price(1) | Currency Translation(1) | Net Sales in Venezuela | Total Change | |||||||||
Specialty Construction Chemicals | 0.8 | % | 0.1 | % | (8.4 | )% | 3.1 | % | (4.4 | )% | ||||
Specialty Building Materials | 8.5 | % | 1.1 | % | (4.6 | )% | — | % | 5.0 | % | ||||
Darex Packaging Technologies | (3.6 | )% | (0.5 | )% | (8.9 | )% | — | % | (13.0 | )% | ||||
Net sales | 1.7 | % | 0.2 | % | (7.6 | )% | 1.5 | % | (4.2 | )% | ||||
By Region: | ||||||||||||||
North America | 7.8 | % | (0.2 | )% | (0.8 | )% | — | % | 6.8 | % | ||||
Europe Middle East Africa | (0.1 | )% | — | % | (13.8 | )% | — | % | (13.9 | )% | ||||
Asia Pacific | 1.6 | % | (0.2 | )% | (7.1 | )% | — | % | (5.7 | )% | ||||
Latin America | (8.5 | )% | 2.1 | % | (12.4 | )% | 9.7 | % | (9.1 | )% | ||||
__________________________
(1) | Excludes net sales in Venezuela |
Net sales of $1,418.6 million for 2015 decreased $61.8 million or 4.2% compared with the prior year, primarily due to unfavorable currency translation, partially offset by improved pricing and higher sales volumes. Unfavorable currency translation against the U.S. dollar, primarily in Europe, impacted all operating segments. Higher sales volumes in SCC and SBM were partially offset by lower sales volumes in Darex.
Net sales in Venezuela increased $22.4 million or 46.6% in 2015 compared with the prior year, largely due to significant price inflation. See "Venezuela" below for further discussion.
The following table presents Venezuela's net sales, Adjusted Gross Profit, and Adjusted EBIT by operating segment as compared with the prior year.
Venezuela Financial Performance for the Year Ended December 31, 2015(1) | |||||||||||||||
($ in millions) | SCC | Darex | Corporate | Total VZ | |||||||||||
Net sales | $ | 54.4 | $ | 16.1 | $ | — | $ | 70.5 | |||||||
Adjusted Gross Profit | 29.0 | 6.3 | — | 35.3 | |||||||||||
Adjusted EBIT | 26.9 | 4.9 | (2.5 | ) | 29.3 | ||||||||||
37
Venezuela Financial Performance for the Year Ended December 31, 2014 | |||||||||||||||
($ in millions) | SCC | Darex | Corporate | Total VZ | |||||||||||
Net sales | $ | 31.7 | $ | 16.4 | $ | — | $ | 48.1 | |||||||
Adjusted Gross Profit | 15.9 | 5.6 | — | 21.5 | |||||||||||
Adjusted EBIT | 14.3 | 4.3 | (1.3 | ) | 17.3 | ||||||||||
Year Ended December 31, 2015 versus Year Ended December 31, 2014 - Change (%) | |||||||||||
SCC | Darex | Corp | Total VZ | ||||||||
Net sales | 71.6 | % | (1.8 | )% | NM | 46.6 | % | ||||
Adjusted Gross Profit | 82.4 | % | 12.5 | % | NM | 64.2 | % | ||||
Adjusted EBIT | 88.1 | % | 14.0 | % | 92.3 | % | 69.4 | % | |||
__________________________
1) | In the table above, Venezuela's Adjusted Gross Profit excludes the $13.7 million loss in Venezuela included in cost of goods sold and Adjusted EBIT excludes the $73.2 million currency and other financial losses in Venezuela incurred as a result of the currency devaluation in the third quarter of 2015. |
GCP's gross margin was 36.4% for 2015 compared with 35.8% for the prior year, an improvement of 60 basis points. The increase was primarily due to improved pricing and volume in SBM and SCC, as well as lower raw material costs in all segments, partially offset by higher pension-related costs and a $13.7 million loss in Venezuela recorded in cost of goods sold.
Adjusted Gross Margin was 37.9% for 2015 compared with 35.4% for the prior year, an improvement of 250 basis points. The increase was primarily due to improved pricing and lower raw material costs, partially offset by lower sales volume in Darex.
Net Income Attributable to GCP Shareholders
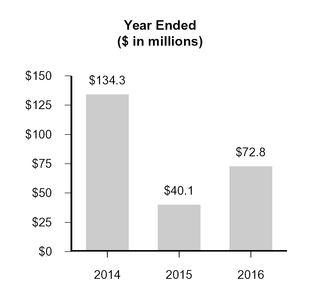
Net income attributable to GCP shareholders was $72.8 million for 2016, an increase of 81.5% compared with $40.1 million for the prior year. The increase was primarily due to the $73.2 million loss in Venezuela recorded in the third quarter of 2015 that did not repeat in 2016, lower income taxes and restructuring expenses and higher gross profit, partially offset by higher interest, repositioning and pension costs.
Net income was $40.1 million for 2015, a decrease of 70.1% compared with $134.3 million for the prior year. The decrease was primarily due to the $73.2 million loss in Venezuela recorded in the third quarter of 2015, and higher income taxes and pension costs.
38
Adjusted EBIT
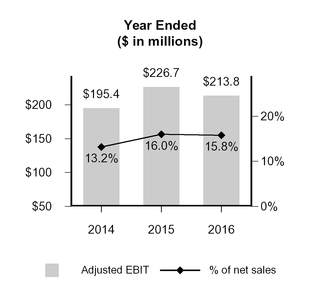
Adjusted EBIT was $213.8 million for 2016, a decrease of 5.7% compared with the prior year. The decrease was primarily due to a $26.6 million decrease in Venezuela’s Adjusted EBIT and an increase in pension costs, partially offset by higher gross profit driven by higher sales volumes and lower raw material costs. Excluding Venezuela, Adjusted EBIT increased 6.9%. Adjusted EBIT Margin of 15.8% declined slightly from the prior year primarily due to the adverse currency impacts of Venezuela.
Adjusted EBIT was $226.7 million for 2015, an increase of 16.0% compared with the prior year primarily due to higher sales volume, lower raw material costs, cost savings from our restructuring initiatives and improved pricing which more than offset unfavorable currency translation. Adjusted EBIT margin was 16.0% for 2015, an increase compared with 13.2% for the prior year. The increase was primarily due to higher coatings demand in Europe and North America from new product technology offset by adverse currency impacts in Venezuela and lower demand for our coatings and closure products in Asia Pacific and Latin America.
Adjusted EBIT Return On Invested Capital
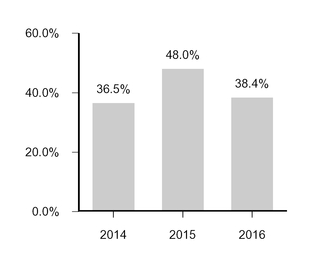
Adjusted EBIT Return On Invested Capital for 2016 was 38.4%, a decrease from 48.0% in 2015. The decrease was mainly driven by lower Adjusted EBIT and an increase in invested capital primarily due to the acquisition of Halex in the fourth quarter of 2016.
39
Adjusted EBIT Return On Invested Capital for 2015 was 48.0%, an increase from 36.5% for 2014. The increase was primarily due to increases in Adjusted EBIT offset by decreases in invested capital due in part to foreign currency translation.
We manage our operations with the objective of maximizing sales, earnings and cash flow over time. Doing so requires that we successfully balance our growth, profitability and working capital and other investments to support sustainable, long-term financial performance. We use Adjusted EBIT Return On Invested Capital as a performance measure in evaluating operating results, in making operating and investment decisions and in balancing the growth and profitability of our operations. Generally, we favor those businesses and investments that provide the highest return on invested capital.
Operating Segment Overview—Specialty Construction Chemicals (SCC)
Following is an overview of the financial performance of SCC for the years ended December 31, 2016, 2015 and 2014.
Net Sales—SCC
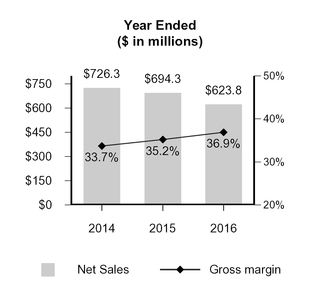
Net sales were $623.8 million for 2016, a decrease of $70.5 million or 10.2% compared with the prior year. The decrease in net sales was primarily due to sales in Venezuela, which declined $45.9 million or 84.4%, over the same period. Excluding Venezuela, net sales declined 3.8% from the prior year primarily due to the effects of foreign currency exchange and lower volumes, partially offset by price increases.
Sales volume increases in North America, Asia Pacific and Europe were more than offset by declines in Latin America, primarily in Brazil. Currency translation had an unfavorable impact in all regions, particularly Latin America. Price increases in Latin America and North America were partially offset by declines in Asia Pacific and EMEA.
Sales volumes declined in our Concrete business due to year-over-year declines in Latin America as a result of unfavorable macro-economic conditions, particularly in Brazil, which offset volume increases in North America and Europe. Sales volumes in our Cement business increased slightly primarily due to improved demand in Asia Pacific.
Sales were $694.3 million for 2015, a decrease of $32.0 million or 4.4% compared with the prior year. The sales decrease was primarily due to unfavorable currency translation in Europe and Latin America, partially offset by sales increases in Venezuela, improved pricing and an increase in sales volumes in North America, Asia Pacific and Europe.
40
Segment Operating Income (SOI) and Margin—SCC
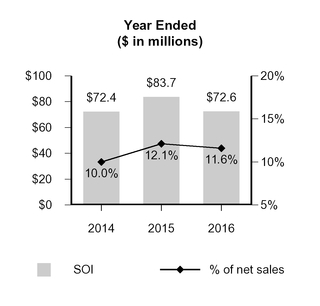
Gross profit was $229.9 million for 2016, a decrease of $14.4 million or 5.9% compared with the prior year, primarily due to lower gross profit in Venezuela, which declined $24.8 million in the same period. Gross margin was 36.9% compared with 35.2% for the prior year primarily due to lower raw material costs and increased productivity, partially offset by lower gross profit from Venezuela.
Segment operating income was $72.6 million for 2016, a decrease of $11.1 million or 13.3% compared with the prior year, primarily due to the reduction in gross profit and higher general and administrative expenses. Excluding Venezuela, segment operating income increased 22.5%. Segment operating margin for the year was 11.6%.
Gross profit was $244.3 million for 2015, a decrease of $0.5 million or 0.2% compared with the prior year. Gross margin was 35.2% compared with 33.7% for the prior year, primarily due to improved pricing in Venezuela, volume increases in North America and Asia Pacific and lower raw material costs.
Segment operating income was $83.7 million for 2015, an increase of $11.3 million or 15.6% compared with the prior year. Segment operating margin increased to 12.1%, an improvement of 210 basis points compared with the prior year. These increases primarily resulted from volume growth in North America, Asia Pacific and Europe in addition to lower raw material costs, productivity gains and lower operating expenses.
41
Operating Segment Overview—Specialty Building Materials (SBM)
Following is an overview of the financial performance of SBM for the years ended December 31, 2016, 2015 and 2014. SBM has minimal operations in Venezuela and is therefore not impacted by Venezuela's financial performance. The financial results of the Halex acquisition are included as of the November 9, 2016 acquisition date unless otherwise noted for comparative purposes.
Net Sales—SBM
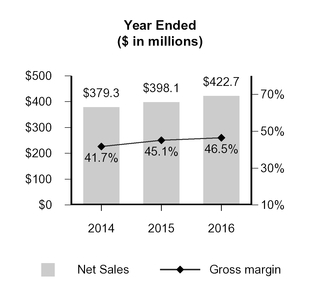
Net sales were $422.7 million for 2016, an increase of $24.6 million or 6.2% compared with the prior year including $6.6 million of sales from Halex. The increase was due to higher sales volumes, improved pricing and the acquisition of Halex, partially offset by unfavorable currency translation. Net sales increased in all product lines. Sales volume increases in North America, including Halex, and Latin America, were partially offset by declines in Europe and Asia Pacific.
Currency translation had an unfavorable impact in Europe and Asia Pacific due to the weakening of the local currencies against the U.S. dollar. Price increases in North America, Latin America and Europe were partially offset by declines in Asia Pacific.
Sales were $398.1 million for 2015, an increase of $18.8 million or 5.0% compared with the prior year. The sales increase was due to higher sales volumes and improved pricing, partially offset by unfavorable currency translation. Sales volumes increased primarily due to increases in the residential building and specialty construction product groups, driven by favorable market conditions in North America. Specialty construction products continued to expand its distribution in emerging regions but the emerging regions' increased sales volumes were offset by weakness in China and Mexico. Sales volumes in building envelope increased but were more than offset by unfavorable currency translation. Building envelope experienced sales volume growth in North America, Eastern Europe and the Middle East.
42
Segment Operating Income (SOI) and Margin—SBM
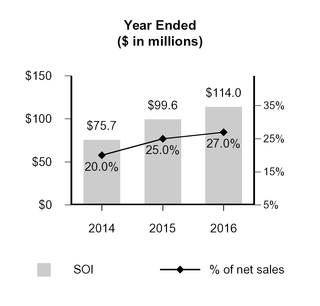
Gross profit was $196.7 million for 2016, an increase of $17.2 million or 9.6% compared with the prior year. Gross margin was 46.5% compared with 45.1% for the prior year. The increase is primarily due to higher net sales, raw material deflation, favorable product line mix and productivity.
Segment operating income was $114.0 million for 2016, an increase of $14.4 million or 14.5% compared with the prior year. Segment operating margin for the year was 27.0%, an increase of 200 basis points compared with the prior year, primarily due to increased gross margin, partially offset by higher general and administrative expenses.
Gross profit was $179.5 million for 2015, an increase of $21.5 million or 13.6% compared with the prior year. Gross margin was 45.1% compared with 41.7% for the prior year, primarily due to improved product mix, improved pricing and lower raw material costs.
Segment operating income was $99.6 million for 2015, an increase of $23.9 million or 31.6% compared with the prior year. Segment operating margin for 2015 increased to 25.0%, an improvement of 500 basis points compared to prior year. These increases were primarily due to the revenue growth driven by the residential building product group and specialty construction product line in addition to lower raw material costs, productivity gains and lower operating costs.
43
Operating Segment Overview—Darex Packaging Technologies (Darex)
Following is an overview of the financial performance of Darex for the years ended December 31, 2016, 2015 and 2014.
Net Sales—Darex
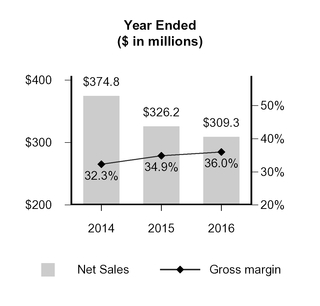
Net sales were $309.3 million for 2016, a decrease of $16.9 million or 5.2% compared with the prior year. The decrease was primarily due to sales in Venezuela which declined $10.0 million or 62.1% over the same period. Excluding Venezuela, net sales decreased 2.2% primarily due to unfavorable currency translation and lower price, partially offset by sales volume growth in Latin America and Asia Pacific.
Sales volumes increased in Latin America and Asia Pacific, primarily due to higher demand for Sealants and Coatings, and decreased in North America and EMEA, with lower demand across all products in these two regions.
Sales were $326.2 million for 2015, a decrease of 13.0% compared with the prior year. The sales decrease was primarily due to unfavorable currency translation and lower sales volumes. Sales volumes decreased primarily in Asia Pacific and Latin America due to lower demand for our coatings and closures products, partially offset by higher coatings demand in Europe and North America from new product technology. Sales volumes in sealants were lower due to a market shift from three-piece to two-piece cans. This trend stabilized in 2016. We implemented productivity initiatives which improved pricing, particularly in Venezuela to offset unfavorable currency translation in that country.
44
Segment Operating Income (SOI) and Margin—Darex
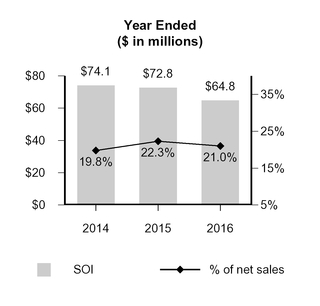
Gross profit was $111.3 million for 2016, a decrease of $2.6 million or 2.3% compared with the prior year, primarily due to a $2.5 million decline in Venezuela gross profit. Gross margin increased from 34.9% to 36.0% primarily due to lower raw material cost and productivity.
Segment operating income was $64.8 million for 2016, a decrease of $8.0 million or 11.0% from the prior year. The decrease was primarily due to a decline in gross profit, higher general and administrative expenses and a favorable impact from the sale of an operating asset in the prior year that did not repeat in 2016. Excluding Venezuela, segment operating income decreased 9.4%. Segment operating margin decreased 130 basis points.
Gross profit was $113.9 million for 2015, a decrease of 5.9% compared with the prior year. Gross margin was 34.9% compared with 32.3% for the prior year. The increase was primarily due to lower manufacturing costs and improved pricing, partially offset by lower sales volume.
Segment operating income was $72.8 million for 2015, a decrease of 1.8% compared with the prior year. Segment operating margin increased to 22.3%, an increase of 250 basis points. Operating income decreased due to a decline in gross profit, partially offset by lower operating expenses and the favorable impact from the sale of an operating asset.
45
Corporate Overview
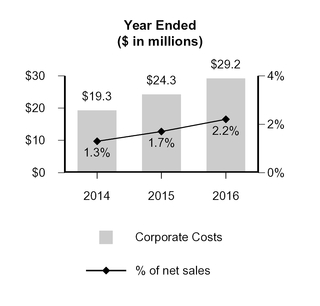
Corporate costs include certain functional costs, impacts of foreign exchange and other corporate costs such as certain performance-based incentive compensation and public company costs.
Corporate costs were $29.2 million for the year ended 2016, an increase of $4.9 million or 20.2% compared with 2015. The increase was primarily due to foreign exchange losses related to Venezuela, and higher public company costs and incentive compensation compared with similar costs allocated by Grace on a pre-Separation basis in the prior year.
Corporate costs for 2015 increased 25.9% compared with the prior year primarily due to increased insurance and incentive compensation costs.
Defined Benefit Pension and Gain on Termination and Curtailments
Defined benefit pension expense includes costs under U.S. and non-U.S. defined benefit pension plans that provide benefits to operating segment and corporate employees, as well as retirees and former employees of divested businesses where we retained these obligations.
Under mark-to-market ("MTM") accounting, our pension costs consist of two elements: 1) "Certain pension costs"—ongoing costs recognized quarterly, which include service and interest costs, expected returns on plan assets and amortization of prior service costs/credits; and 2) "Pension MTM adjustment and other related costs, net"—mark-to-market gains and losses recognized annually in the fourth quarter, or at an interim period should a significant event occur, resulting from changes in actuarial assumptions, such as discount rates and the difference between actual and expected returns on plan assets.
Certain pension costs were $8.4 million, $5.1 million and $7.5 million for the years ended December 31, 2016, 2015 and 2014, respectively. Actual pension costs incurred by GCP as a stand-alone company post-Separation were higher than the pension costs allocated by Grace in the periods prior to the Separation, resulting in the increase in 2016 versus the prior year.
During the fourth quarter of 2016, GCP terminated a pension plan at one non-U.S. location, resulting in a curtailment loss of $1.0 million. During the third quarter of 2016, GCP amended a pension plan at one non-U.S. location, resulting in a curtailment gain of $0.2 million. During the second quarter of 2016, GCP terminated a pension plan at one non-U.S. location, resulting in a curtailment gain of $1.4 million. For the year ended December 31, 2016, GCP recognized a total net gain of $0.6 million in operating income relating to non-U.S. pension plan curtailment and termination gains and losses.
46
Our annual pension mark-to-market adjustment was $(20.5) million, $(15.0) million and $18.6 million for the years ended December 31, 2016, 2015 and 2014, respectively. Key drivers for changes year over year are changes in the discount rate and demographic changes in the areas we operate. Other related expense was $2.7 million for the year ended December 31, 2016, which relates to a partial withdrawal assessment for our two union plans in the U.S. Pension mark-to-market and other related costs are reported in "Cost of goods sold" and "Selling, general and administrative expenses” within our Consolidated Statements of Operations based upon the functions of the employees to whom the pension adjustments relate.
Prior to the Separation, Grace sponsored funded and unfunded defined benefit pension and other postretirement benefit plans in which employees from GCP and other Grace businesses participated in (the “Shared Plans”). These Shared Plans were accounted for as multiemployer benefit plans. Accordingly, GCP did not record an asset or liability to recognize the funded status of these Shared Plans in the Balance Sheet prior to the Separation.
In the fourth quarter of 2015, in preparation for the Separation, certain international pension plans were legally separated resulting in approximately $4 million increase to net pension liabilities. GCP recorded the funded status for these international plans as of December 31, 2015. During the first quarter of 2016, certain Shared Plans in the U.S. were legally separated, resulting in approximately $44 million increase to net pension liabilities.
GCP’s allocated pension expense for the Shared Plans was $3.8 million and $5.3 million for the years ended December 31, 2015 and 2014, respectively, and is included in certain pension costs.
Grace provided postretirement life insurance benefits for retired employees of certain U.S. business units and certain divested business units. GCP’s allocated income for these postretirement life insurance benefits plan was $1.4 million and $0.7 million for the years ended December 31, 2015 and 2014, respectively. In the first quarter of 2016, the postretirement life insurance benefits plan liability related to GCP employees who were participants in this plan at the time of Separation was legally transferred to GCP, resulting in an increase of $0.1 million to "Other liabilities" in the Consolidated Balance Sheets. Additionally in the first quarter of 2016 and as part of the Separation, GCP assumed $0.8 million of prior service credit and $0.7 million of actuarial losses, both net of tax.
During the second quarter of 2016, GCP entered into an agreement to eliminate retiree life insurance benefits for one of its two remaining bargaining locations. This plan change was a negative plan amendment that resulted in a $1.0 million curtailment gain. During the fourth quarter of 2016, GCP entered into an agreement to eliminate retiree life insurance benefits for its remaining bargaining location. This was a plan termination resulting in a $0.8 million plan termination charge. The net impact of these plan changes during 2016 amounted to $0.2 million gain, which is recognized in operating income for the year ended December 31, 2016.
Restructuring and Repositioning Expenses
GCP incurred $1.9 million of restructuring expenses during the year ended December 31, 2016, compared with $11.6 million (including related asset impairments of $0.1 million) for the corresponding prior year. The decrease was due to fewer restructuring actions in 2016 compared to 2015.
GCP incurred $4.0 million of restructuring expenses and $14.3 million in related asset impairments for the year ended December 21, 2014. During 2014, GCP's concrete production management systems product line was not meeting performance expectations, resulting in reduced cash flow and increasing obligations, and, as a result, GCP evaluated the long-lived assets associated with this product line for impairment. After reviewing undiscounted cash flow information, GCP determined that the fair value of these long-lived assets was less than their carrying value and recorded an impairment charge of $9.8 million. During 2014, GCP also recorded an impairment charge of $4.5 million related to an unconsolidated investment.
47
Post-Separation, GCP has incurred expenses related to the transition to becoming a stand-alone public company. These costs are expected to range from $18.0 million to $20.0 million, with substantially all of these expenses expected to be incurred within 18 months of the Separation. Repositioning expenses for the year ended December 31, 2016 are presented below.
Repositioning Expenses (In millions) | 2016 | ||
Professional fees | $ | 7.8 | |
Software and IT implementation fees | 3.0 | ||
Employee-related costs | 4.5 | ||
Total repositioning expenses | $ | 15.3 | |
Interest and Financing Expenses
On January 27, 2016, GCP issued $525.0 million aggregate principal amount of 9.5% Senior Notes due 2023 (the “Notes”). Interest is payable semi-annually in arrears on February 1 and August 1 of each year, commencing on August 1, 2016.
On February 3, 2016, GCP entered into a credit agreement (the “Credit Agreement”) that provides for new senior secured credit facilities (the “Credit Facilities”) in an aggregate principal amount of $525.0 million, consisting of:
(a) term loan (the “Term Loan”) in an aggregate principal amount of $275.0 million maturing in 2022; and
(b) $250.0 million revolving credit facility (the "Revolving Loan") due in 2021.
The Term Loan principal balance is scheduled to be repaid in equal quarterly installments in aggregate annual amounts equal to 1.0% of the original principal amount. The interest rate per annum applicable to the Revolving Loan is equal to, at GCP’s option, either a base rate plus a margin ranging from 0.5% to 1.0% or LIBOR plus a margin ranging from 1.5% to 2.0%, in either case based upon the total leverage ratio of GCP and its restricted subsidiaries.
During the first quarter of 2016, GCP used certain proceeds from the Notes and Credit Facilities to fund a distribution to Grace in an amount of $750.0 million related to the Separation. Approximately $50 million was retained to meet operating requirements and to pay fees associated with the debt financing and other post-Separation costs. Related party debt of approximately $42 million and related interest was settled with Grace in connection with the Separation.
Net interest and financing expenses were $65.8 million for 2016, compared to $2.5 million in 2015, primarily due to issuance of $525.0 million in senior notes and $275.0 million in term loans.
On August 25, 2016, GCP refinanced the existing Credit Agreement with a syndicate of banks (the “Amended Credit Agreement”). The Amended Credit Agreement reduced the interest rate margins applicable to the Term Loan from base rate plus a margin of 3.5% or LIBOR plus a margin of 4.5% to a base rate plus a margin of 2.25% or LIBOR plus a margin of 3.25% at GCP’s option. The $274.3 million outstanding principal balance was replaced by a like aggregate $274.3 million principal balance with substantially similar terms to the Credit Agreement. In conjunction with the refinancing, the Company recognized $1.2 million of third-party financing costs, which are included in "Interest expense and related financing costs" in the Consolidated Statement of Operations.
On October 31, 2016, GCP borrowed on its Revolving Loan and used the funds, together with cash on hand, to acquire Halex Corporation. The $25.0 million draw was outstanding as of December 31, 2016, in addition to approximately $9 million in outstanding letters of credit. As such, available credit under our Revolving Loan was reduced to $216.0 million.
48
Income Taxes
Income tax expense for 2016, 2015 and 2014 was $32.2 million, $84.3 million and $55.6 million respectively, on income before income taxes of $106 million, $125.2 million and $191.1 million in 2016, 2015 and 2014, respectively.
Our effective tax rate was approximately 30%, 67% and 29% in 2016, 2015 and 2014, respectively.
Our 2016 effective tax rate of approximately 30% was lower than the 35% U.S. statutory rate primarily due to benefits recognized during the year including $5.3 million due to lower taxes in non-U.S. jurisdictions, $0.4 million due to the domestic production activities deduction, $0.6 million related to income tax credits and $1.6 million related to the release of reserves for uncertain tax positions, partially offset by $1.6 million for state local income taxes and $1.4 million for non-deductible expenses. The decrease in the rate compared with the prior year primarily results from the significant reduction in the cost of U.S. taxes on repatriation of foreign earnings and the non-deductible Venezuela charge.
Our 2015 effective tax rate of approximately 67% was higher than the 35% U.S. statutory rate primarily due to $24.7 million related to the Venezuela nondeductible charge, $19.9 million related to the repatriation of foreign earnings in connection with the Separation, $6.3 million related to state and local income taxes and $2.5 million for non-deductible expenses, partially offset by $8.0 million related to lower taxes in non-U.S. jurisdictions, $2.7 million related to the domestic production activities deduction and a $2.5 million benefit associated with the return to provision change in estimate. The increase in the rate compared with the prior year primarily results from the effect of Separation-related repatriation of foreign earnings, a higher percentage of earnings in jurisdictions with higher statutory rates, the effect of mark-to-market pension adjustments in jurisdictions with lower statutory rates and the 2015 nondeductible Venezuela charge, partially offset by a tax benefit in 2015 for a return to provision change in estimate.
Our 2014 effective tax rate of approximately 29% was lower than the 35% U.S. statutory rate primarily due to benefits recognized during the year including $12.3 million due to lower taxes in non-U.S. jurisdictions, $2.2 million due to the domestic production activities deduction and $1.9 million related to the release of reserves for uncertain tax positions, partially offset by $2.7 million for state and local income taxes and $2.5 million for non-deductible expenses.
Income taxes paid in cash, net of refunds, were $46.3 million, $75.6 million and $41.7 million in 2016, 2015 and 2014, respectively. Our annual cash tax rate was approximately 44%, 60% and 22% in 2016, 2015 and 2014, respectively. The cash tax rate includes cash taxes paid related to the Separation, net of benefits for tax-deductible, Separation-related costs, of $2.5 million, $19.7 million and zero in 2016, 2015 and 2014, respectively. These amounts include cash taxes paid to taxing authorities as well as tax payments which are deemed settled with Grace as the taxpayer during these time periods.
As of December 31, 2016, we had the intent and ability to indefinitely reinvest undistributed earnings of our foreign subsidiaries outside the United States.
In the 2015 first quarter, Grace announced its plan to separate into two publicly traded companies and has reassessed the capital structure and financial requirements of both Grace and GCP. Further, in connection with the Separation, Grace repatriated a total of $173.1 million of foreign earnings from foreign subsidiaries transferred to GCP pursuant to the Separation. Such amount was determined based on an analysis of each non-U.S. subsidiary's requirements for working capital, debt repayment and strategic initiatives. Grace and GCP also considered local country legal and regulatory restrictions. In 2015, we included tax expense of $19.9 million in the effective tax rate for repatriation attributable to both current and prior years' earnings. The tax effect of repatriation is determined by several variables including the tax rate applicable to the entity making the distribution, the cumulative earnings and associated foreign taxes of the entity and the extent to which those earnings may have already been taxed in the U.S.
49
GCP believes that the Separation is a one-time, non-recurring event and that recognition of deferred taxes of undistributed earnings during 2015 would not have occurred if not for the Separation. Subsequent to Separation, GCP expects undistributed prior year earnings of our foreign subsidiaries to remain permanently reinvested except in certain instances where repatriation of such earnings would result in minimal or no tax. GCP bases this assertion on:
(1) | the expectation that it will satisfy our U.S. cash obligations in the foreseeable future without requiring the repatriation of prior year foreign earnings; |
(2) | plans for significant and continued reinvestment of foreign earnings in organic and inorganic growth initiatives outside the U.S.; and |
(3) | remittance restrictions imposed by local governments. |
GCP will continually analyze and evaluate our cash needs to determine the appropriateness of our indefinite reinvestment assertion.
See Note 6, "Income Taxes," to the Consolidated Financial Statements for additional information regarding income tax.
Financial Condition, Liquidity and Capital Resources
Following is an analysis of our financial condition, liquidity and capital resources at December 31, 2016.
Our principal uses of cash generally have been capital investments, acquisitions and working capital investments. In connection with our Separation from Grace, we incurred $800.0 million of indebtedness, including $750.0 million borrowed to pay a distribution to Grace prior to the Separation and approximately $50 million retained to meet operating requirements and to pay Separation-related fees. We believe our liquidity and capital resources, including cash on hand, cash we expect to generate during 2017 and thereafter, future borrowings if any, and other available liquidity and capital resources, are sufficient to finance our operations and growth strategy and to meet our debt obligations.
Cash Resources and Available Credit Facilities
On February 3, 2016, GCP entered into a Credit Agreement (the “Credit Agreement”) that provided for senior secured credit facilities (the “Credit Facilities”) in an aggregate principal amount of $525.0 million, consisting of term loans (the “Term Loans”) in an aggregate principal amount of $275.0 million maturing in 2022 and of revolving loans (the “Revolving Loans”) in an aggregate principal amount of $250.0 million maturing in 2021. On October 31, 2016, GCP borrowed on its Revolving Loan and used the funds, together with cash on hand, to acquire Halex Corporation. The $25.0 million initial draw remained outstanding as of December 31, 2016.
At December 31, 2016, we had available liquidity of $420.5 million, consisting of $163.3 million in cash and cash equivalents ($62.8 million in the U.S.), $216.0 million available under our revolving credit facility and $41.2 million of available liquidity under various non-U.S. credit facilities. Our non-U.S. credit facilities are extended to various subsidiaries that use them primarily to issue bank guarantees supporting trade activity and to provide working capital during occasional cash shortfalls. We generally renew these credit facilities as they expire.
In 2016, we repatriated a total of $15.5 million of foreign earnings from our non-U.S. subsidiaries, which resulted in an insignificant amount of U.S. income tax expense. In conjunction with the Separation, we repatriated $173.1 million from our non-U.S. subsidiaries in the third and fourth quarters of 2015. We expect to have sufficient cash and liquidity in our non-U.S. subsidiaries to fund working capital and operating needs.
We expect to meet U.S. cash and liquidity requirements with cash on hand, cash we expect to generate during 2017 and thereafter, future borrowings if any, and other available liquidity including royalties and service fees from our foreign subsidiaries. We may also repatriate future foreign earnings if that results in minimal or no U.S. tax consequences. We expect to have sufficient cash and liquidity to finance our U.S. operations and growth strategy and to meet our debt obligations in the U.S.
50
The following table summarizes our non-U.S. credit facilities as of December 31, 2016.
(In millions) | Maximum Borrowing Amount | Available Liquidity | Expiration Date | ||||||
China | $ | 11.4 | $ | 5.7 | 2/3/2021 | ||||
India | 10.0 | 2.6 | 2/3/2021 | ||||||
Singapore | 7.6 | 7.6 | 2/3/2021 | ||||||
Brazil | 6.7 | 6.7 | 1/31/2017 | ||||||
Australia | 6.0 | 2.8 | 2/3/2021 | ||||||
Canada | 5.5 | 2.6 | 2/3/2021 | ||||||
Turkey | 3.2 | 1.9 | Open end | ||||||
Other countries | 11.9 | 11.3 | Open end | ||||||
Total | $ | 62.3 | $ | 41.2 | |||||
See Note 1, "Basis of Presentation and Summary of Significant Accounting and Financial Reporting Policies," to the Consolidated Financial Statements for a detailed discussion of our cash and cash equivalents.
Analysis of Cash Flows
The following table summarizes our cash flows for the years ended December 31, 2016, 2015 and 2014.
Year Ended December 31, | |||||||||||
(In millions) | 2016 | 2015 | 2014 | ||||||||
Net cash provided by operating activities | $ | 127.9 | $ | 151.8 | $ | 161.0 | |||||
Net cash (used in) provided by investing activities | (90.7 | ) | 10.7 | (75.6 | ) | ||||||
Net cash provided by (used in) financing activities | 31.7 | (128.2 | ) | (106.9 | ) | ||||||
Effect of currency exchange rate changes on cash and cash equivalents | (4.2 | ) | (56.6 | ) | (15.4 | ) | |||||
Increase (decrease) in cash and cash equivalents | 64.7 | (22.3 | ) | (36.9 | ) | ||||||
Cash and cash equivalents, beginning of period | 98.6 | 120.9 | 157.8 | ||||||||
Cash and cash equivalents, end of period | $ | 163.3 | $ | 98.6 | $ | 120.9 | |||||
Net cash provided by operating activities for the year was $127.9 million, compared with $151.8 million for the prior year. The year-over-year change was primarily due to cash paid for interest related to our term loan and senior notes, which were issued in 2016, primarily offset by a decrease in cash paid for income taxes and changes in other assets and liabilities.
Net cash provided by operating activities in 2015 was $151.8 million, compared with $161.0 million in the prior year. The year-over-year change was primarily due to improvement in Adjusted EBIT, which was more than offset by cash paid for income taxes.
Net cash used in investing activities for the year was $90.7 million, compared with net cash provided by investing activities of $10.7 million for the prior year. The year-over-year change was primarily due to the acquisition of Halex in the 2016 fourth quarter and the receipt of a payment from Grace of approximately $40 million on a related party note in 2015.
Net cash provided by investing activities in 2015 was $10.7 million compared with net cash used in investing activities of $75.6 million in the prior year. The year-over-year change in cash flow was primarily due to an increase in receipt of payments on loans from related party resulting from internal capital structure changes following Grace's emergence from Chapter 11 in 2014.
Net cash provided by financing activities for the year was $31.7 million, compared with net cash used in financing activities of $128.2 million in the prior year. The year-over-year change in cash flow was primarily due to proceeds from the issuance of bonds and indebtedness incurred during the first quarter of 2016, partially offset by a distribution paid to Grace and other transfers to Grace in connection with the Separation.
51
Net cash used in financing activities in 2015 was $128.2 million compared with $106.9 million in the prior year. The change in cash used in financing activities was primarily due to an increase in transfers to parent.
Included in net cash provided by operating activities for the years ended December 31, 2016, 2015 and 2014 are restructuring payments of $3.6 million, $10.9 million and $4.3 million, respectively, and repositioning payments of $17.7 million for the year ended December 31, 2016.
Debt and Other Contractual Obligations
Total debt outstanding at December 31, 2016 was $830.9 million. Set forth below are our contractual obligations as of December 31, 2016.
Payments Due by Period | |||||||||||||||||||
(In millions) | Total | Less than 1 Year | 1-3 Years | 4-5 Years | More Than 5 Years | ||||||||||||||
Debt(1) | $ | 830.9 | $ | 47.9 | $ | 6.8 | $ | 6.2 | $ | 770.0 | |||||||||
Expected interest payments on debt(2) | 387.0 | 64.2 | 124.7 | 123.3 | 74.8 | ||||||||||||||
Operating lease obligations | 44.5 | 11.2 | 13.6 | 6.1 | 13.6 | ||||||||||||||
Operating commitments(3) | 17.2 | 1.3 | 15.9 | — | — | ||||||||||||||
Pension funding requirements per ERISA(4) | 27.0 | — | 9.5 | 17.5 | — | ||||||||||||||
Pension funding requirements for non-U.S. pension plans(5) | 16.2 | 3.2 | 6.2 | 6.8 | — | ||||||||||||||
Total Contractual Obligations | $ | 1,322.8 | $ | 127.8 | $ | 176.7 | $ | 159.9 | $ | 858.4 | |||||||||
___________________________________________________________________________________________________________________
(1) | Debt includes our $525.0 million 9.5% Senior Notes due 2023, our $275.0 million Term Loan due 2022, amounts outstanding under our revolving credit facility due 2021 and other borrowings. See Note 5, "Debt and Other Financial Instruments," to the Consolidated Financial Statements for further details. |
(2) | Amounts are based on interest rates as of December 31, 2016, for principal debt outstanding as of December 31, 2016. |
(3) | Amounts do not include open purchase commitments, which are routine in nature and normally settle within 90 days. |
(4) | Based on the U.S. qualified pension plans' status as of December 31, 2016, minimum funding requirements under ERISA have been estimated for the next five years; amounts in subsequent years or additional payments we may make at our discretion have not yet been determined. |
(5) | Based on the non-U.S. pension plans' status as of December 31, 2016, funding requirements have been estimated for the next five years. Amounts in subsequent years have not yet been determined. |
As of December 31, 2016, GCP had approximately $7.4 million of unrecognized tax benefits and $2.3 million of related interest and penalties pertaining to uncertain tax positions. Included in these amounts are unrecognized tax benefits and related interest and penalties on items that have historically been included in tax returns filed by Grace. Included in such amounts is $3.7 million that is indemnified by Grace. GCP believes it is reasonably possible that total unrecognized tax benefits will decrease by $1.1 million within the next 12 months due to the statue expirations. Of this $1.1 million, $0.5 million is indemnified by Grace. For more information on our uncertain tax positions, see Note 6, "Income Taxes," to the Consolidated Financial Statements.
Off-Balance-Sheet Arrangements
As of December 31, 2016, we had no significant off-balance-sheet arrangements other than operating leases, guarantees and indemnification obligations and financial assurances, as described further in Note 9, "Commitments and Contingent Liabilities," to the Consolidated Financial Statements. These arrangements are not material to our overall liquidity and capital resources, market risk support or credit risk support.
Employee Benefit Plans
See Note 7, "Pension Plans and Other Postretirement Benefit Plans," to the Consolidated Financial Statements for further discussion of Pension Plans and Other Postretirement Benefit Plans.
52
Multiemployer Benefit Plans
Prior to the Separation, Grace sponsored funded and unfunded defined benefit pension and other postretirement benefit plans that employees from GCP and other Grace businesses participated in (the “Shared Plans”). For purposes of the financial statements in periods prior to the Separation, the Shared Plans were accounted for as multiemployer benefit plans. Accordingly, we did not record an asset or liability to recognize the funded status of these plans in periods presented prior to the Separation.
In the fourth quarter of 2015, in preparation for the Separation, certain international pension plans were legally separated. Previously, the funded status of these Shared Plans was not reflected on our balance sheet as the plans were accounted for as multiemployer benefit plans. Upon legal separation of the international plans in 2015, we recorded the funded status as of December 31, 2015, resulting in an approximate $4 million increase to net pension liabilities. In the first quarter of 2016, certain Shared Plans in the U.S. were legally separated, resulting in an approximate $44 million increase to net pension liabilities.
Our allocated expense for the defined benefit pension plans was $3.8 million and $5.3 million for the years ended December 31, 2015 and 2014, respectively. The related expense for the year ended December 31, 2016 was $8.4 million and included in the components of net periodic pension cost. In addition, we recorded pension curtailment and termination gains of $0.6 million during 2016, which are included in the components of net periodic benefit cost.
Our allocated income for the postretirement health care and life insurance benefits plan was $1.4 million and $0.7 million for the years ended December 31, 2015 and 2014, respectively. We recorded curtailment and termination gains of $0.2 million relating to this plan in 2016, which are included in the components of net periodic benefit cost. The Shared Plans, which are accounted for as multiemployer benefit plans as discussed above, are excluded from the discussion of defined benefit pension plans that follows.
Defined Contribution Retirement Plan
Prior to the Separation, Grace sponsored a defined contribution retirement plan for its employees in the U.S. in which our employees participated. This plan was qualified under section 401(k) of the U.S. tax code. For the years ended December 31, 2015 and 2014, we received an allocation of the total cost related to this benefit plan of $4.8 million and $4.5 million, respectively. As part of the Separation, we established a defined contribution retirement plan for GCP employees in the U.S., similar in design to the Grace defined contribution retirement plan. Currently, GCP contributes an amount equal to 100% of employee contributions, up to 6% of an individual employee's salary or wages. The GCP matching employer contribution percentages are consistent with the Grace plan. The related cost for the GCP defined contribution plan for the year ended December 31, 2016 was $4.6 million.
Defined Benefit Pension Plans
We sponsor defined benefit pension plans for our employees in the U.S., the U.K. and a number of other countries, and fund government-sponsored programs in other countries where we operate. Certain of our defined benefit pension plans are advance-funded and others are pay-as-you-go. The advance-funded plans are administered by trustees who direct the management of plan assets and arrange to have obligations paid when due. Our most significant advance-funded plans cover current and former salaried employees in the U.K. and employees covered by collective bargaining agreements at certain of our U.S. facilities. Our U.S. advance-funded plans are qualified under the U.S. tax code.
Fully-funded plans include several advance-funded plans where the fair value of the plan assets exceeds the projected benefit obligation ("PBO"). This group of plans was overfunded by $21.2 million as of December 31, 2016, and the overfunded status is reflected as "overfunded defined benefit pension plans" in the Consolidated Balance Sheets. Underfunded plans include a group of advance-funded plans that are underfunded on a PBO basis by a total of $58.5 million as of December 31, 2016. Additionally, we have several plans that are funded on a pay-as-you-go basis, and therefore, the entire PBO of $40.7 million at December 31, 2016, is unfunded. The combined balance of the underfunded and unfunded plans was $99.2 million as of December 31, 2016, and is presented as a liability on the Consolidated Balance Sheets as follows: $1.2 million in "Other current liabilities" and $98.0 million included in "Underfunded and unfunded defined benefit pension plans."
53
Based on the U.S. advance-funded plans' status as of December 31, 2016, there were no minimum required payments under ERISA. We made no contributions to these plans in 2015 and contributed $0.8 million to these plans in 2014. In 2016, we made an accelerated contribution to the trusts that hold assets of the U.S. qualified pension plans of approximately $1 million. We intend to fund non-U.S. pension plans based upon applicable legal requirements, as well as actuarial and trustee recommendations. We contributed $6.4 million, $2.4 million and $3.6 million to the non-U.S. pension plans in 2016, 2015 and 2014, respectively.
Tax Matters
See Note 6, "Income Taxes," to the Consolidated Financial Statements and "Income Taxes" above for additional discussion of our tax accounting matters including unrecognized tax benefits.
Other Contingencies
See Note 9, "Commitments and Contingent Liabilities," to the annual Financial Statements for a discussion of our other contingent matters.
Inflation
We recognize that inflationary pressures may have an adverse effect on us through higher asset replacement costs and higher raw materials and other operating costs. We try to minimize these impacts through effective control of operating expenses and productivity improvements as well as price increases to customers.
We estimate that the cost of replacing our property and equipment today is greater than its historical cost. Accordingly, our depreciation expense would be greater if the expense were stated on a current cost basis.
Venezuela
The operating environment in Venezuela is challenging, with high inflation, governmental restrictions in the form of currency exchange, price and margin controls, importation of raw materials, labor unrest, and the possibility of government actions such as further devaluations, business occupations or intervention and expropriation of assets. In addition, the foreign exchange controls in Venezuela limit our ability to repatriate earnings and the Venezuela subsidiary’s ability to remit dividends and pay intercompany balances at any official exchange rate or at all.
Effective January 1, 2010, we began to account for Venezuela as a highly inflationary economy. As a result, the functional currency of our Venezuelan subsidiary became the U.S. dollar; therefore, all translation adjustments are reflected in net income in the accompanying Consolidated Statements of Operations. The official exchange rate (CENCOEX) of 4.3 was used to remeasure our financial statements from bolivars to U.S. dollars upon Venezuela's designation as a highly inflationary economy.
In March 2013, the Venezuelan government launched a new foreign exchange mechanism called the "Complimentary System of Foreign Currency Acquirement" (or SICAD1). The SICAD1 operated similarly to an auction system and allowed entities in specific sectors to bid for U.S. dollars to be used for specified import transactions. In March 2014, the Venezuelan government launched another foreign exchange mechanism, known as the SICAD2, which operated similarly to the SICAD1. Neither the SICAD1 nor the SICAD2 changed or eliminated the official exchange rate of the bolivar to the U.S. dollar. Until September 30, 2015, we used the official exchange rate of 6.3 bolivars to one U.S. dollar for remeasurement purposes, which had not changed since February 13, 2013.
In February 2015, the Venezuelan government unified SICAD1 and SICAD2 into a single exchange mechanism, called SICAD. Additionally, a new exchange mechanism, SIMADI, was also implemented.
54
Based on company-specific and macroeconomic developments in Venezuela in the third quarter of 2015, including changed expectations about our ability to import raw materials at the official exchange rate in the future, the extended period of time since we have received payment at the official exchange rate, the increase in the rate of inflation and the weaker outlook for the Venezuelan economy, we determined that it was no longer appropriate to use the official exchange rate. Effective September 30, 2015, we began accounting for our results at the SIMADI rate. Based on the SIMADI rate of 199 bolivars to one U.S. dollar, we recorded a pre-tax charge of $73.2 million in the third quarter of 2015 to reflect the devaluation of net monetary assets and the impairment of non-monetary assets within our Venezuela subsidiary. This charge included $40.2 million for cash, $28.9 million for working capital and $4.1 million for properties and equipment; we recorded $13.7 million of this amount related to inventory to cost of goods sold and $59.6 million related to other assets and liabilities as a separate line item in our Consolidated Statements of Operations.
In mid-February 2016, changes to the currency exchange systems were announced which eliminated the SICAD exchange rate and replaced the name SIMADI rate with DICOM, a floating exchange rate. The DICOM rate was 675 bolivars to one U.S. dollar at the year ended 2016, an approximate 240% increase from the rate at December 31, 2015. Accordingly, the Company has recorded a $4.4 million loss within “Other (income) expense, net,” in the Consolidated Statements of Operations for the year ended December 31, 2016 to reflect the remeasurement of the Venezuela subsidiary’s net monetary assets to U.S. dollars.
As of December 31, 2016, we had $5.6 million of net monetary and non-monetary assets in our Venezuela subsidiary held in local currency, consisting primarily of cash and cash equivalents, trade accounts receivable, inventory, other current assets, accounts payable and other current liabilities. We believe, based on unofficial, open market exchange rates, the DICOM rate may continue to increase in 2017, which would adversely impact our financial results in Venezuela. For illustrative purposes only, using a hypothetical increase in the DICOM rate to 1,000 bolivar per U.S. dollar, we would record a loss of approximately $2 million based on the local currency net asset position of the Venezuela subsidiary as of December 31, 2016.
SCC and Darex have operated in Venezuela for several decades, with net sales in that country representing approximately 1% and 2%, respectively, of each segment’s net sales in 2016. For the year ended 2016, net sales in our Venezuela subsidiary was approximately 1% of total GCP net sales, compared with 5.0% in the prior year, primarily due to the currency devaluation in the third quarter of 2015 and the continued weakening of the local currency against the U.S. dollar in 2016. The following table presents net sales, gross profit, and Adjusted EBIT for our Venezuelan subsidiary for the year ended December 31, 2016 and the respective prior years.
(In millions) | 2016 | 2015(1) | 2014 | ||||||||
Net sales | $ | 14.6 | $ | 70.5 | $ | 48.1 | |||||
Adjusted Gross Profit | 8.0 | 35.3 | 21.5 | ||||||||
Adjusted EBIT | 2.7 | 29.3 | 17.3 | ||||||||
__________________________
(1) | In the table above for 2015, Venezuela's Adjusted Gross Profit excludes the $13.7 million loss in Venezuela included in cost of goods sold and Adjusted EBIT excludes the $73.2 million currency and other financial losses in Venezuela incurred as a result of the currency devaluation in the third quarter of 2015. |
The inability to use the Venezuela cash outside the country has not had a material impact on our ability to finance our global operations or meet our debt obligations.
Critical Accounting Estimates
The preparation of financial statements in conformity with GAAP requires that we make estimates and assumptions affecting the assets and liabilities reported at the date of the Financial Statements and the revenues and expenses reported for the periods presented. We believe that our accounting estimates are appropriate and the related balances are reasonable; however, actual amounts could differ from the original estimates, requiring adjustments in future periods. Changes in estimates are recorded in the period in which the change is identified. Our accounting policies are described in Note 1, "Basis of Presentation and Summary of Significant Accounting and Financial Reporting Policies," to the Consolidated Financial Statements. Critical accounting estimates are described in this section.
55
An accounting estimate is considered critical if the estimate requires management to make assumptions and judgments about matters that were highly uncertain at the time the estimate was made, if different estimates reasonably could have been used, or if changes in the estimate are reasonably likely to occur from period to period that could have a material impact on our financial condition or results of operations. As part of our disclosure controls and procedures, management has discussed the development, selection and disclosure of the critical accounting estimates with the Audit Committee of the GCP Board of Directors.
Contingent Liabilities
As disclosed in Item 3 and in Note 9, "Commitments and Contingent Liabilities," to the Consolidated Financial Statements, contingent liabilities may arise from circumstances such as legal disputes, environmental remediation, product liability and warranty claims, material commitments and income taxes. We establish reserves for loss contingencies associated with these matters when it is determined that a liability is probable and the amount can be reasonably estimated. We base our assessment of probable liabilities on the facts and circumstances known at the time the financial statements are prepared. For circumstances in which it is determined that a loss is probable, but only a range for the potential loss exists, we record the minimum amount of the range and make subsequent adjustments, if necessary, as better information becomes available.
Goodwill
Goodwill represents the excess of cost over the fair value of identifiable net assets of businesses acquired. Indefinite-lived intangible assets primarily consist of purchased technology, trademarks and trade names.
We review our goodwill and indefinite-lived intangible assets for impairment annually in the fourth quarter and whenever events or a change in circumstances indicate that the carrying amounts may not be fully recoverable. We test our goodwill for impairment at the reporting unit level, which we have defined as Specialty Construction Chemicals, Specialty Building Materials and Darex Packaging Technologies, by performing either a qualitative evaluation ("step 0") or a quantitative test ("two-step goodwill impairment test"). Qualitative factors may include, but are not limited to, economic, market and industry conditions, cost factors and overall financial performance of the reporting unit. If, after assessing these qualitative factors, we determine it is more likely than not that the carrying value is less than the fair value, then performing the two-step impairment test is unnecessary.
For the two-step impairment test, in step 1, we calculate the fair value of each reporting unit weighting the income approach and the market approach, which we then compare with the reporting unit's carrying value. For the income approach, we utilize discounted cash flows where the discount rate reflects the weighted average costs of capital. The income approach is most sensitive to the discount rate, long-term sales growth rates and forecasted operating margins. For the market approach, average revenue and earnings before interest, tax, depreciation and amortization multiples derived from our peer group are weighted and adjusted for size, risk and growth of the individual reporting unit to determine the reporting unit’s business enterprise fair value.
Changes in these estimates or a continued decline in general economic conditions could change our conclusion regarding an impairment of goodwill and potentially result in a non-cash impairment loss in a future period. If the fair value exceeds the carrying value, no further work is required and no impairment loss is recognized.
For indefinite-lived intangible assets, we utilize a relief-from-royalty method when applying the quantitative assessment. The relief-from-royalty method is most sensitive to the discount rate, royalty rate and long-term sales growth rates. If the carrying value of the indefinite-lived intangible asset exceeds its fair value, the carrying value is written down to fair value in the period identified.
During the annual impairment tests for the periods presented, we performed step 1 of the two-step goodwill impairment test and determined that the fair values of our reporting units significantly exceeded their carrying values and, therefore, we did not perform step 2. During the annual indefinite-lived intangible asset impairment tests for the periods presented, we performed a quantitative assessment and concluded that it was more likely than not that the carrying values were less than the fair values.
Pension and Other Postretirement Benefits Expenses and Liabilities
We sponsor defined benefit pension plans for our employees in the United States, the United Kingdom, and a number of other countries, and fund government-sponsored programs in other countries where we operate. See
56
Note 7, "Pension Plans and Other Postretirement Benefit Plans," to the Consolidated Financial Statements and "Employee Benefit Plans" above for a detailed discussion of our pension plans and other postretirement benefit plans.
In order to estimate our pension and other postretirement benefits expenses and liabilities, we evaluate the range of possible assumptions to be used in the calculation of pension and other postretirement benefits expenses and liabilities. We select the assumptions that we believe to be most indicative of factors such as participant demographics, past experiences and market indices, and provide the assumptions to independent actuaries. These assumptions are updated annually and primarily include factors such as discount rates, expected return on plan assets, mortality rates, retirement rates, and rate of compensation increase. The independent actuaries review our assumptions for reasonableness, and use the assumptions to calculate our estimated liability and future pension expense. We review the actuarial reports for reasonableness and adjust our expenses, assets and liabilities to reflect the amounts calculated in the actuarial reports.
The two key assumptions used in determining our pension benefit obligations and pension expense are the discount rate and expected return on plan assets. Our most significant pension assets and pension liabilities relate to U.S. and U.K. pension plans.
The assumed discount rate for pension plans reflects the market rates for high-quality corporate bonds currently available and is subject to change based on changes in overall market interest rates. For the U.S. pension plans, the assumed weighted average discount rate was selected in consultation with our independent actuaries, based on a yield curve constructed from a portfolio of high quality bonds for which the timing and amount of cash outflows approximate the estimated payouts of the plan. For the U.K. pension plan, the assumed weighted average discount rate was selected in consultation with our independent actuaries, based on a yield curve constructed from a portfolio of sterling-denominated high quality bonds for which the timing and amount of cash outflows approximate the estimated payouts of the plan.
We selected the expected return on plan assets for the U.S. qualified pension plans for 2016 in consultation with our independent actuaries, using an expected return model. The model determines the weighted average return for an investment portfolio based on the target asset allocation and expected future returns for each asset class, which were developed using a building block approach based on observable inflation, available interest rate information, current market characteristics and historical results. In determining the expected rate of return for the U.K. pension plan, we considered the trustees' strategic investment policy together with long-term historical returns and investment community forecasts for each asset class.
Income Taxes
We are a global enterprise with operations in approximately 35 countries. This global reach results in a complexity of tax regulations, which require assessments of applicable tax law and judgments in estimating our ultimate income tax liability. See Note 6, "Income Taxes," to the Consolidated Financial Statements for additional details regarding our estimates used in accounting for income tax matters including unrecognized tax benefits.
We recognize the tax benefit from an uncertain tax position only if it is more likely than not that the tax position will be sustained upon examination by the taxing authorities, based on the technical merits of the position. We measure tax benefits in our financial statements from such a position as the largest benefit that has a greater than fifty percent likelihood of being realized upon ultimate settlement. Unrecognized tax benefits are tax benefits claimed in our tax returns that do not meet these recognition and measurement standards.
We record a liability for unrecognized tax benefits when it is more likely than not that a tax position we have taken will not be sustained upon audit. We evaluate such likelihood based on relevant facts and tax law. We adjust our recorded liability for income tax matters due to changes in circumstances or new uncertainties, such as amendments to existing tax law. Our ultimate tax liability depends upon many factors, including negotiations with taxing authorities in the jurisdictions in which we operate, outcomes of tax litigation and resolution of disputes arising from federal, state, and foreign tax audits. Due to the varying tax laws in each jurisdiction, management, with the assistance of local tax advisors as necessary, assesses individual matters in each jurisdiction on a case-by-case basis. We research and evaluate our income tax positions, including why we believe they are compliant with income tax regulations and these positions are documented as appropriate.
Deferred income taxes result from the differences between the financial and tax basis of our assets and liabilities and are adjusted for changes in tax rates and tax laws when changes are enacted. If it is more likely
57
than not that all or a portion of deferred tax assets ("DTAs") will not be realized, a valuation allowance is provided. As of December 31, 2016 and 2015, we have recorded a valuation allowance of $2.3 million and $2.0 million, respectively, on DTAs, all of which relates to foreign net operating loss carryforwards.
The realization of DTAs is dependent on the generation of sufficient taxable income in the appropriate tax jurisdictions. In evaluating our ability to realize our DTAs, we consider all reasonably available positive and negative evidence, including recent earnings experience, expectations of future taxable income and the tax character of that income, the extended period of time over which the temporary differences become deductible and the carryforward and/or carryback periods available to us for tax reporting purposes in the related jurisdiction. In estimating future taxable income, we develop assumptions, including the amount of future federal, state and international pretax operating income that we can reasonably expect to generate, the reversal of temporary differences and the implementation of feasible and prudent tax planning strategies. We record a valuation allowance to reduce our DTAs to the amount that we believe is more likely than not to be realized.
We believe it is more likely than not that the net DTAs as of December 31, 2016, will be realized. If we were to determine that we would not be able to realize a portion of our net DTAs in the future, we would charge an adjustment to earnings in the period such determination was made. Conversely, if we were to make a determination that it is more likely than not that DTAs would be realized, we would reduce the related valuation allowance and record a benefit to earnings.
One of our subsidiaries, Grace Brasil Ltda. (“Grace Brasil”), holds a DTA equal to approximately $11.2 million (tax-effected) as of December 31, 2016. Due to the challenging economic and political climate in Brazil from the fourth quarter of 2015 to date, Grace Brasil incurred significant net operating losses ("NOLs") in 2015 and a small NOL in 2016. Based on these factors, we have evaluated our ability to utilize Grace Brasil’s DTA in future years.
In evaluating the recoverability of Grace Brasil's DTA at December 31, 2016 and 2015, we have considered all available evidence, both positive and negative, including but not limited to the following:
• | Under Brazilian tax law, net operating losses are carried forward indefinitely; |
• | Grace Brasil is forecasting pretax income in 2017 despite being in an economic trough; |
• | Grace Brasil has a demonstrated history of core earnings; |
• | Brazil is a critical market for GCP Applied Technologies and, as a result, we have a strong commitment to sustained long-term profitability in Brazil; |
• | The continuing challenge of Brazil’s economic and political climate. |
As of December 31, 2016 and 2015, we believe that the weight of the positive evidence outweighed the negative evidence regarding the realization of the net DTAs in Grace Brasil. We will continue to evaluate the ability to realize Grace Brasil’s net deferred tax assets on a quarterly basis.
Stock-Based Compensation
We have provided certain key employees equity awards in the form of stock options, performance-based units (“PBUs”) and restricted share units (“RSUs”) under the GCP 2016 Stock Incentive Plan.
In accordance with U.S. GAAP, we estimate the fair value of equity awards issued. The fair value of the awards is recognized as stock-based compensation expense over the vesting periods during which the recipients are required to provide service. We use the Black-Scholes option pricing model for determining the fair value of stock options granted, which requires management to make significant judgments and estimates regarding, for example, participant activity and market results. The use of different assumptions and estimates could have a material impact on the estimated fair value of stock option grants and related compensation costs. The input assumptions used in determining fair value are the expected life, expected volatility, risk-free interest rate and expected dividend yield.
PBUs granted in 2016 are based on a three-year cumulative adjusted earnings per share measure. The number of shares ultimately provided to an employee who received a 2016 PBU grant will be based on Company performance against this measure and can range from 0% to 200% of the target award based upon the level of achievement of this measure. PBU awards are remeasured each reporting period based on the expected payout of the award, which may range from 0% to 200% of the targets for such awards; therefore, these portions of the awards are subject to volatility until the payout is finally determined at the end of the performance period. See
58
Note 13, "Stock Incentive Plans," to the Consolidated Financial Statements for a detailed discussion of our stock incentive plans.
Corporate Cost Estimates
Our Consolidated Financial Statements include expenses of Grace allocated to us for certain functions provided by Grace in the periods prior to GCP's legal separation from Grace on February 3, 2016, including, but not limited to general corporate expenses related to finance, legal, information technology, human resources, communications, ethics and compliance, shared services, employee benefits and incentives and stock-based compensation. These expenses have been allocated to us on the basis of direct usage when identifiable, with the remainder allocated on the basis of revenue, headcount or other measures. These cost allocations are included in "Selling, general and administrative expenses" in the Consolidated Statements of Operations. Management considers these allocations to be a reasonable reflection of the utilization of services by, or the benefits provided to, the Company. The allocations may not, however, reflect the expense the Company would have incurred as a standalone company for the periods presented prior to February 3, 2016. Actual costs that may have been incurred if the Company had been a standalone company for the periods prior to the Separation would depend on a number of factors, including the chosen organizational structure, what functions were outsourced or performed by employees and strategic decisions made in areas such as information technology and infrastructure.
Recent Accounting Pronouncements
See Note 1, "Basis of Presentation and Summary of Significant Accounting and Financial Reporting Policies," to the Consolidated Financial Statements for a discussion of recent accounting pronouncements and their effect on us.
59
Item 7A. QUANTITATIVE AND QUALITATIVE DISCLOSURES ABOUT MARKET RISK
Our global operations, raw materials and energy requirements and debt obligations expose us to various market risks. The following is a discussion of our primary market risk exposures, how these exposures may be managed and certain quantitative data pertaining to these exposures. We use derivative financial instruments to mitigate certain of these risks.
Currency Exchange Rate Risk
Because we operate in approximately 35 countries, our results of operations are exposed to changes in currency exchange rates. We minimize exposure to these changes by matching revenue streams in volatile currencies with expenditures in the same currencies using currency forward contracts or swaps. However, we do not have a policy of hedging all exposures, as management does not believe that such a level of hedging would be cost-effective. We do not hedge translation exposures that are not expected to affect cash flows in the near-term.
Commodity Price Risk
We operate in markets where the prices of raw materials and energy are commonly affected by cyclical movements in the economy and other factors. The principal raw materials used in our products include amines, polycarboxylates, rubber and latex, solvents, naphthalene, sulfonate, lignins and saccharides. These commodities are generally available to be purchased from more than one supplier. In order to minimize the risk of increasing prices on certain raw materials and energy, we use a centralized supply chain organization for sourcing in order to optimize procurement activities. We have a risk management committee to review proposals to hedge purchases of raw materials and energy, but we do not currently use financial instruments to hedge these costs.
Interest Rate Risk
As of December 31, 2016, approximately $318 million of our borrowings were at variable interest rates. As a result, we are subject to interest rate risk. A 100 basis point increase in the interest rates payable on our variable rate debt as of December 31, 2016 would increase our annual interest expense by approximately $3 million.
60
Item 8. FINANCIAL STATEMENTS AND SUPPLEMENTARY DATA
TABLE OF CONTENTS
___________________________________________________________
The Financial Statement Schedule should be read in conjunction with the Consolidated Financial Statements and Notes thereto. Financial Statement Schedules not included have been omitted because they are not applicable or the required information is shown in the Consolidated Financial Statements or Notes thereto.
Report of Independent Registered Public Accounting Firm
To the Shareholders and Board of Directors of GCP Applied Technologies Inc.
In our opinion, the accompanying consolidated balance sheets and the related consolidated statements of operations, of comprehensive income (loss), of stockholders’ equity (deficit) and of cash flows present fairly, in all material respects, the financial position of GCP Applied Technologies Inc. and its subsidiaries (the “Company”) as of December 31, 2016 and 2015 and the results of their operations and their cash flows for each of the three years in the period ended December 31, 2016 in conformity with accounting principles generally accepted in the United States of America. In addition, in our opinion, the financial statement schedule presents fairly, in all material respects, the information set forth therein when read in conjunction with the related consolidated financial statements. These financial statements and financial statement schedule are the responsibility of the Company's management. Our responsibility is to express an opinion on these financial statements and financial statement schedule based on our audits. We conducted our audits of these financial statements in accordance with the standards of the Public Company Accounting Oversight Board (United States). Those standards require that we plan and perform the audit to obtain reasonable assurance about whether the financial statements are free of material misstatement. An audit includes examining, on a test basis, evidence supporting the amounts and disclosures in the financial statements, assessing the accounting principles used and significant estimates made by management, and evaluating the overall financial statement presentation. We believe that our audits provide a reasonable basis for our opinion.
/s/ PricewaterhouseCoopers LLP
Boston, Massachusetts
March 2, 2017
GCP Applied Technologies Inc. Consolidated Statements of Operations | |||||||||||
Year Ended December 31, | |||||||||||
(In millions, except per share amounts) | 2016 | 2015 | 2014 | ||||||||
Net sales | $ | 1,355.8 | $ | 1,418.6 | $ | 1,480.4 | |||||
Cost of goods sold | 827.1 | 902.4 | 949.9 | ||||||||
Gross profit | 528.7 | 516.2 | 530.5 | ||||||||
Selling, general and administrative expenses | 312.8 | 296.4 | 288.9 | ||||||||
Research and development expenses | 23.0 | 22.3 | 27.9 | ||||||||
Interest expense and related financing costs | 65.8 | 1.5 | 3.9 | ||||||||
Interest expense, net - related party | — | 1.2 | 0.9 | ||||||||
Repositioning expenses | 15.3 | — | — | ||||||||
Restructuring expenses and asset impairments | 1.9 | 11.6 | 18.3 | ||||||||
Loss in Venezuela | — | 59.6 | 1.0 | ||||||||
Other expense (income), net | 3.9 | (1.6 | ) | (1.5 | ) | ||||||
Total costs and expenses | 422.7 | 391.0 | 339.4 | ||||||||
Income before income taxes | 106.0 | 125.2 | 191.1 | ||||||||
Provision for income taxes | (32.2 | ) | (84.3 | ) | (55.6 | ) | |||||
Net income | 73.8 | 40.9 | 135.5 | ||||||||
Less: Net income attributable to noncontrolling interests | (1.0 | ) | (0.8 | ) | (1.2 | ) | |||||
Net income attributable to GCP shareholders | $ | 72.8 | $ | 40.1 | $ | 134.3 | |||||
Earnings Per Share Attributable to GCP Shareholders | |||||||||||
Basic earnings per share: | |||||||||||
Net income attributable to GCP shareholders | $ | 1.03 | $ | 0.57 | $ | 1.90 | |||||
Weighted average number of basic shares | 70.8 | 70.5 | 70.5 | ||||||||
Diluted earnings per share: | |||||||||||
Net income attributable to GCP shareholders | $ | 1.02 | $ | 0.57 | $ | 1.90 | |||||
Weighted average number of diluted shares | 71.7 | 70.5 | 70.5 | ||||||||
The Notes to Consolidated Financial Statements are an integral part of these statements.
63
GCP Applied Technologies Inc. Consolidated Balance Sheets | |||||||
(In millions, except par value and shares) | December 31, 2016 | December 31, 2015 | |||||
ASSETS | |||||||
Current Assets | |||||||
Cash and cash equivalents | $ | 163.3 | $ | 98.6 | |||
Trade accounts receivable, less allowance of $4.9 (2015—$6.2) | 217.1 | 203.6 | |||||
Inventories | 121.6 | 105.3 | |||||
Other current assets | 51.8 | 38.9 | |||||
Total Current Assets | 553.8 | 446.4 | |||||
Properties and equipment, net | 232.2 | 197.1 | |||||
Goodwill | 119.3 | 102.5 | |||||
Technology and other intangible assets, net | 53.0 | 33.3 | |||||
Deferred income taxes | 83.3 | 17.6 | |||||
Overfunded defined benefit pension plans | 21.2 | 26.1 | |||||
Other assets | 27.0 | 10.1 | |||||
Total Assets | $ | 1,089.8 | $ | 833.1 | |||
LIABILITIES AND STOCKHOLDERS' (DEFICIT) EQUITY | |||||||
Current Liabilities | |||||||
Debt payable within one year | $ | 47.9 | $ | 25.7 | |||
Accounts payable | 122.6 | 109.0 | |||||
Loans payable - related party | — | 42.3 | |||||
Other current liabilities | 141.0 | 125.5 | |||||
Total Current Liabilities | 311.5 | 302.5 | |||||
Debt payable after one year | 783.0 | — | |||||
Deferred income taxes | 8.9 | 8.7 | |||||
Unrecognized tax benefits | 9.7 | 5.2 | |||||
Underfunded and unfunded defined benefit pension plans | 98.0 | 34.0 | |||||
Other liabilities | 17.7 | 8.6 | |||||
Total Liabilities | 1,228.8 | 359.0 | |||||
Commitments and Contingencies - Note 9 | |||||||
Stockholders' (Deficit) Equity | |||||||
Net parent investment | — | 598.3 | |||||
Common stock issued, par value $0.01; 300,000,000 shares authorized; outstanding: 71,081,764 | 0.7 | — | |||||
Paid-in capital | 11.0 | — | |||||
Accumulated deficit | (4.7 | ) | — | ||||
Accumulated other comprehensive loss | (147.6 | ) | (127.7 | ) | |||
Treasury stock | (2.1 | ) | — | ||||
Total GCP Stockholders' (Deficit) Equity | (142.7 | ) | 470.6 | ||||
Noncontrolling interests | 3.7 | 3.5 | |||||
Total Stockholders' (Deficit) Equity | (139.0 | ) | 474.1 | ||||
Total Liabilities and Stockholders' (Deficit) Equity | $ | 1,089.8 | $ | 833.1 | |||
The Notes to Consolidated Financial Statements are an integral part of these statements.
64
GCP Applied Technologies Inc.
Consolidated Statements of Comprehensive Income (Loss)
Year Ended December 31, | |||||||||||
(In millions) | 2016 | 2015 | 2014 | ||||||||
Net income | $ | 73.8 | $ | 40.9 | $ | 135.5 | |||||
Other comprehensive income (loss): | |||||||||||
Defined benefit pension and other postretirement plans, net of income taxes | — | 0.4 | 0.1 | ||||||||
Currency translation adjustments | (19.9 | ) | (62.3 | ) | (41.4 | ) | |||||
Gain from hedging activities, net of income taxes | — | 0.2 | 0.2 | ||||||||
Other than temporary impairment of investment | — | — | 0.8 | ||||||||
Loss on securities available for sale, net of income taxes | — | — | (0.1 | ) | |||||||
Total other comprehensive income (loss) attributable to noncontrolling interests | 0.2 | (0.1 | ) | (2.5 | ) | ||||||
Total other comprehensive loss | (19.7 | ) | (61.8 | ) | (42.9 | ) | |||||
Comprehensive income (loss) | 54.1 | (20.9 | ) | 92.6 | |||||||
Less: Comprehensive (income) loss attributable to noncontrolling interests | (1.2 | ) | (0.7 | ) | 1.3 | ||||||
Comprehensive income (loss) attributable to GCP shareholders | $ | 52.9 | $ | (21.6 | ) | $ | 93.9 | ||||
The Notes to Consolidated Financial Statements are an integral part of these statements.
65
GCP Applied Technologies Inc.
Consolidated Statements of Stockholders' Equity (Deficit)
Common Stock | Treasury Stock | ||||||||||||||||||||||||||||||||||||
(In millions) | Number of Shares | Par Value | Number of Shares | Cost | Additional Paid in Capital | Accumulated Deficit | Net Parent Investment | Accumulated Other Comprehensive Loss | Noncontrolling Interests | Total Stockholders' Equity (Deficit) | |||||||||||||||||||||||||||
Balance at December 31, 2013 | — | $ | — | — | $ | — | $ | — | $ | — | $ | 624.9 | $ | (25.6 | ) | $ | 10.4 | $ | 609.7 | ||||||||||||||||||
Net income | — | — | — | — | — | — | 134.3 | — | 1.2 | 135.5 | |||||||||||||||||||||||||||
Other comprehensive loss | — | — | — | — | — | — | — | (40.4 | ) | (2.5 | ) | (42.9 | ) | ||||||||||||||||||||||||
Purchase of noncontrolling investment | — | — | — | — | — | — | — | — | (6.3 | ) | (6.3 | ) | |||||||||||||||||||||||||
Net transfer to parent | — | — | — | — | — | — | (88.6 | ) | — | — | (88.6 | ) | |||||||||||||||||||||||||
Balance, December 31, 2014 | — | — | — | — | — | — | 670.6 | (66.0 | ) | 2.8 | 607.4 | ||||||||||||||||||||||||||
Net income | — | — | — | — | — | — | 40.1 | — | 0.8 | 40.9 | |||||||||||||||||||||||||||
Other comprehensive loss | — | — | — | — | — | — | — | (61.7 | ) | (0.1 | ) | (61.8 | ) | ||||||||||||||||||||||||
Net transfer from parent | — | — | — | — | — | — | (112.4 | ) | — | — | (112.4 | ) | |||||||||||||||||||||||||
Balance, December 31, 2015 | — | — | — | — | — | — | 598.3 | (127.7 | ) | 3.5 | 474.1 | ||||||||||||||||||||||||||
Net income | — | — | — | — | — | 65.6 | 7.2 | — | 1.0 | 73.8 | |||||||||||||||||||||||||||
Net transfer to parent | — | — | — | — | — | — | (675.1 | ) | — | — | (675.1 | ) | |||||||||||||||||||||||||
Issuance of common stock and reclassification of net parent investment in connection with Separation | 70.5 | 0.7 | — | — | — | (70.3 | ) | 69.6 | — | — | — | ||||||||||||||||||||||||||
Issuance of common stock in connection with stock plans | 0.1 | — | — | — | — | — | — | — | — | — | |||||||||||||||||||||||||||
Share based compensation | — | — | — | — | 6.4 | — | — | — | — | 6.4 | |||||||||||||||||||||||||||
Exercise of stock options | 0.6 | — | — | — | 4.6 | — | — | — | — | 4.6 | |||||||||||||||||||||||||||
Treasury stock purchased under GCP 2016 Stock Incentive Plan | — | — | 0.1 | (2.1 | ) | — | — | — | — | — | (2.1 | ) | |||||||||||||||||||||||||
Other comprehensive loss | — | — | — | — | — | — | — | (19.9 | ) | 0.2 | (19.7 | ) | |||||||||||||||||||||||||
Noncontrolling interest dividend | — | — | — | — | — | — | — | — | (1.0 | ) | (1.0 | ) | |||||||||||||||||||||||||
Balance, December 31, 2016 | 71.2 | $ | 0.7 | 0.1 | $ | (2.1 | ) | $ | 11.0 | $ | (4.7 | ) | $ | — | $ | (147.6 | ) | $ | 3.7 | $ | (139.0 | ) | |||||||||||||||
The Notes to Consolidated Financial Statements are an integral part of these statements.
66
GCP Applied Technologies Inc. Consolidated Statements of Cash Flows | |||||||||||
Year Ended December 31, | |||||||||||
(In millions) | 2016 | 2015 | 2014 | ||||||||
OPERATING ACTIVITIES | |||||||||||
Net income | $ | 73.8 | $ | 40.9 | $ | 135.5 | |||||
Reconciliation to net cash provided by operating activities: | |||||||||||
Depreciation and amortization | 36.2 | 31.8 | 34.0 | ||||||||
Impairments of certain assets | — | — | 13.4 | ||||||||
Amortization of debt discount and financing costs | 2.8 | — | — | ||||||||
Stock-based compensation expense | 6.8 | 3.7 | 4.1 | ||||||||
Gain on termination and curtailment of pension and other postretirement plans | (0.8 | ) | — | — | |||||||
Currency and other losses in Venezuela | 4.4 | 73.2 | 1.0 | ||||||||
Deferred income taxes | (14.1 | ) | 8.7 | 13.9 | |||||||
Excess tax benefits from stock-based compensation | — | (8.2 | ) | (7.1 | ) | ||||||
Loss on disposal of property and equipment | 0.9 | 1.3 | 0.1 | ||||||||
Changes in assets and liabilities, excluding effect of currency translation: | |||||||||||
Trade accounts receivable | (16.4 | ) | (20.9 | ) | (1.0 | ) | |||||
Inventories | (9.3 | ) | (5.2 | ) | (24.5 | ) | |||||
Accounts payable | 9.2 | 1.9 | 5.5 | ||||||||
Pension assets and liabilities, net | 21.5 | 13.4 | (19.7 | ) | |||||||
Other assets and liabilities, net | 12.9 | 11.2 | 5.8 | ||||||||
Net cash provided by operating activities | 127.9 | 151.8 | 161.0 | ||||||||
INVESTING ACTIVITIES | |||||||||||
Capital expenditures | (45.3 | ) | (36.0 | ) | (37.5 | ) | |||||
Transfer from restricted cash and cash equivalents | — | — | 5.3 | ||||||||
Purchase of bonds | — | — | (2.8 | ) | |||||||
Proceeds from sale of bonds | — | — | 9.3 | ||||||||
Increase in lending to related party | — | — | (51.7 | ) | |||||||
Receipt of payment on loan from related party | — | 43.1 | 2.4 | ||||||||
Businesses acquired, net of cash acquired | (47.0 | ) | — | — | |||||||
Other investing activities | 1.6 | 3.6 | (0.6 | ) | |||||||
Net cash (used in) provided by investing activities | (90.7 | ) | 10.7 | (75.6 | ) | ||||||
FINANCING ACTIVITIES | |||||||||||
Borrowings under credit arrangements | 321.1 | 51.2 | 26.6 | ||||||||
Repayments under credit arrangements | (32.9 | ) | (56.5 | ) | (34.4 | ) | |||||
Borrowings under related party loans | — | 2.4 | 9.2 | ||||||||
Repayments under related party loans | — | (12.9 | ) | (8.9 | ) | ||||||
Proceeds from issuance of notes | 525.0 | — | — | ||||||||
Cash paid for debt financing costs | (18.2 | ) | — | — | |||||||
Share repurchase under GCP 2016 Stock Incentive Plan | (2.1 | ) | — | — | |||||||
Proceeds from exercise of stock options | 4.4 | — | — | ||||||||
Purchase of non-controlling interest in consolidated joint venture | — | — | (6.3 | ) | |||||||
Excess tax benefits from stock-based compensation | — | 8.2 | 7.1 | ||||||||
Noncontrolling interest dividend | (1.0 | ) | — | — | |||||||
Transfers to parent, net | (764.6 | ) | (120.6 | ) | (100.2 | ) | |||||
Net cash provided by (used in) financing activities | 31.7 | (128.2 | ) | (106.9 | ) | ||||||
Effect of currency exchange rate changes on cash and cash equivalents | (4.2 | ) | (56.6 | ) | (15.4 | ) | |||||
Increase (decrease) in cash and cash equivalents | 64.7 | (22.3 | ) | (36.9 | ) | ||||||
Cash and cash equivalents, beginning of period | 98.6 | 120.9 | 157.8 | ||||||||
Cash and cash equivalents, end of period | $ | 163.3 | $ | 98.6 | $ | 120.9 | |||||
Supplemental cash flow disclosures: | |||||||||||
Cash paid for income taxes, net of refunds | $ | 46.3 | $ | 22.8 | $ | 19.5 | |||||
Cash paid for income taxes, net of refunds--former Parent | $ | — | $ | 52.8 | $ | 22.2 | |||||
Cash paid for interest on notes and credit arrangements | $ | 39.3 | $ | 2.4 | $ | 4.4 | |||||
The Notes to Consolidated Financial Statements are an integral part of these statements.
67
Notes to Consolidated Financial Statements
1. Basis of Presentation and Summary of Significant Accounting and Financial Reporting Policies
On January 27, 2016, GCP entered into a Separation and Distribution Agreement pursuant to which Grace agreed to transfer its Grace Construction Products operating segment and the packaging technologies business, operated under the “Darex” name, of its Grace Materials Technologies operating segment to GCP (the "Separation"). The Separation occurred on February 3, 2016 by means of a pro rata distribution to Grace stockholders of all of the then-outstanding shares of Company common stock (the "Distribution"). Under the Distribution, one share of Company common stock was distributed for each share of Grace common stock held by Grace stockholders. No fractional shares were distributed. As a result of the Distribution, GCP is now an independent public company and its common stock is listed under the symbol "GCP" on the New York Stock Exchange.
GCP is engaged in the production and sale of specialty construction chemicals, specialty building materials and packaging products through three operating segments. Specialty Construction Chemicals ("SCC") manufactures and markets concrete admixtures and cement additives. Specialty Building Materials ("SBM") manufactures and markets sheet and liquid membrane systems that protect structures from water, air and vapor penetration, fireproofing products and a flooring barrier system that protects surface flooring from moisture and alkalinity damage, as well as flooring installation products and other products designed to protect the building envelope. Darex Packaging Technologies ("Darex") manufactures and markets packaging materials for use in beverage and food containers, industrial containers and other consumer and industrial applications.
Prior to the Separation, the Company operated as the Grace Construction Products operating segment and the Darex Packaging Technologies business.
The Separation was completed pursuant to various agreements with Grace related to the Separation. These agreements govern the relationship between GCP and Grace following the Separation and provided for the allocation of various assets, liabilities, rights and obligations. These agreements also include arrangements for transition services to be provided on a temporary basis by both parties.
Basis of Presentation
The financial statements for periods prior to the Separation have been prepared on a stand-alone basis and are derived from the consolidated financial statements and accounting records of Grace, as the Company's business operated as a combination of entities under common control of Grace. These financial statements reflect the historical basis and carrying values established when the Company was part of Grace. Subsequent to the Separation, the accompanying Consolidated Financial Statements are presented on a consolidated basis and include all of the accounts and operations of GCP and its majority-owned subsidiaries.
All transactions between GCP and Grace have been included in these financial statements. Prior to the Separation, all such transactions, other than intercompany loan transactions, are effectively considered to be settled for cash, in the Consolidated Financial Statements at the time the transactions were recorded. The intercompany loans payable to Grace and the related interest and cash flows, as presented in Note 5 "Debt and Other Financial Instruments", are reflected as "Borrowings under related party loans" and "Repayments under related party loans" in the Consolidated Statements of Cash Flows, as "Loans payable-related party" in the Consolidated Balance Sheets and as "Interest expense, net-related party" in the Consolidated Statements of Operations. Subsequent to the Separation, Grace is no longer a related party of the Company.
Prior to the Separation, the financial statements included expenses of Grace allocated to GCP for certain functions provided by Grace, including, but not limited to, general corporate expenses related to finance, legal, information technology, human resources, communications, ethics and compliance, environment health and safety, supply chain, shared services, employee benefits and incentives, insurance and stock-based compensation. These expenses were allocated to GCP on the basis of direct usage when identifiable, with the remainder allocated on the basis of revenue, headcount or other measures. These cost allocations were included in "Selling, general and administrative expenses" in the Statements of Operations. Most of these costs were included in segment operating income with only a portion included in corporate costs. Both GCP and Grace consider the basis on which the expenses have been allocated to be a reasonable reflection of the utilization of services provided to, or the benefit received by, GCP during the periods presented.
68
Subsequent to the Separation, GCP has performed most of these functions using its own resources or purchased services. However, Grace has continued to provide certain of these functions under a transition services agreement, which will remain in place for a period generally up to 18 months from the Separation. As of December 31, 2016, the activities subject to the transition services agreement were substantially complete. See Note 12, "Related Party Transactions and Transactions with Grace," for further description of the transition services agreement between GCP and Grace.
Prior to the Separation, the financial statements also included the assets and liabilities that were historically held at the Grace corporate level but were specifically identifiable or otherwise pushed down to GCP. The cash and cash equivalents held by Grace at the corporate level were not specifically identifiable to GCP and therefore were not allocated to GCP for any of the periods presented. Prior to the Separation, cash and cash equivalents in the Balance Sheets represent primarily cash held locally by entities included in the financial statements. Third-party debt and the related interest expense of Grace were not allocated to GCP for any of the periods presented as GCP was not the legal obligor of the debt and the Grace borrowings were not directly attributable to GCP's business.
The financial statements exclude all assets, liabilities, income, gains, costs and expenses reported by Grace related to asbestos and bankruptcy matters. Prior to the Separation, these matters were not allocated to GCP as Grace was the legal obligor for those liabilities and Grace is expected to pay all future liabilities and costs related to such matters as such matters were not historically managed by GCP. Grace retained full responsibility for these matters following the Separation and GCP has not indemnified Grace for any losses or payments associated with these matters.
Prior to the Separation, Grace used a centralized approach to cash management and financing of its operations and Grace funded GCP's operating and investing activities as needed. Prior to the Separation, cash transfers to and from the cash management accounts of Grace are reflected in the Statements of Cash Flows as “Transfers to parent, net.”
Noncontrolling Interests GCP conducts certain of its business through joint ventures with unaffiliated third parties. For joint ventures in which GCP has a controlling financial interest, GCP consolidates the results of such joint ventures in the Consolidated Financial Statements. GCP deducts the amount of income attributable to noncontrolling interests in the measurement of its consolidated net income. During the 2014 fourth quarter, GCP acquired the remaining 50% equity interest in its joint venture in Turkey for $11.7 million, making the business a wholly owned subsidiary of GCP.
Operating Segments GCP reports financial results of each of its operating segments that engage in business activities that generate revenues and expenses and whose operating results are regularly reviewed by GCP's chief operating decision maker.
Earnings per Share GCP computes basic earnings per share ("EPS") attributable to GCP shareholders by dividing net income attributable to GCP shareholders by weighted-average common shares outstanding during the period. GCP's diluted EPS calculation reflects the potential dilution beyond shares for basic EPS that could occur if securities or other contracts to issue common stock were exercised, converted into common stock, or resulted in the issuance of common stock that would have shared in GCP's earnings. GCP calculated its earnings per share for 2015 and 2014 using the shares that were distributed to Grace shareholders immediately following the Separation. For periods prior to the Separation, it is assumed that there are no dilutive equity instruments, as there were no equity awards in GCP outstanding prior to the Separation.
Use of Estimates The preparation of financial statements in conformity with GAAP requires management to make estimates and assumptions that affect the reported amount of assets and liabilities, disclosure of contingent assets and liabilities at the date of the Consolidated Financial Statements and the reported amounts of revenues and expenses for the periods presented. Actual amounts could differ from those estimates and the differences could be material. Changes in estimates are recorded in the period identified. GCP's accounting measurements that are most affected by management's estimates of future events are:
69
•Contingent liabilities, which depend on an assessment of the probability of loss and an estimate of ultimate resolution cost, that may arise from circumstances such as legal disputes, environmental remediation, product liability claims, material commitments (see Note 9, "Commitments and Contingent Liabilities,") and income taxes (see Note 6, "Income Taxes");
•Pension and postretirement liabilities that depend on assumptions regarding participant life spans, future inflation, discount rates and total returns on invested funds (see Note 7, "Pension Plans and Other Postretirement Benefit Plans); and
•Realization values of net deferred tax assets, which depend on projections of future taxable income (see Note 6, "Income Taxes").
Reclassifications Certain amounts in prior period financial statements have been reclassified to conform to the current period presentation. Such reclassifications have not materially affected previously reported amounts.
Certain amounts within "Net cash provided by operating activities" in the Company’s Consolidated Statements of Cash Flows for the years ended December 31, 2015 and 2014 have been reclassified to conform to current period presentation. These reclassifications had no effect on the previously reported cash flows from operating, investing and financing activities.
Revenue Recognition GCP recognizes revenue when all of the following criteria are satisfied: risk of loss and title transfer to the customer; the price is fixed and determinable; persuasive evidence of a sales arrangement exists; and collectability is reasonably assured. Risk of loss and title transfers to customers are based on individual contractual terms. Terms of delivery are generally included in customer contracts of sale, order confirmation documents and invoices.
Certain customer arrangements include conditions for volume rebates. GCP accrues a rebate allowance and reduces recorded sales for anticipated selling price adjustments at the time of sale. GCP regularly reviews rebate accruals based on actual and anticipated sales patterns.
Cash Equivalents Cash equivalents consist of liquid instruments and investments with maturities of three months or less when purchased. The recorded amounts approximate fair value.
Inventories Inventories are stated at the lower of cost or market. The method used to determine cost is first-in/first-out, or "FIFO." Market values for raw materials are based on current cost and, for other inventory classifications, net realizable value. Inventories are evaluated regularly for salability and slow moving and/or obsolete items are adjusted to expected salable value. Inventory values include direct and certain indirect costs of materials and production. Abnormal costs of production are expensed as incurred.
Long-Lived Assets Properties and equipment are stated at cost. Depreciation of properties and equipment is generally computed using the straight-line method over the estimated useful life of the asset. Estimated useful lives range from 20 to 40 years for buildings, 3 to 7 years for information technology equipment, 3 to 10 years for operating machinery and equipment and 5 to 10 years for furniture and fixtures. Interest is capitalized in connection with major project expenditures. Fully depreciated assets are retained in properties and equipment and related accumulated depreciation accounts until they are removed from service. In the case of disposals, assets and related accumulated depreciation are removed from the accounts and the net amount, less any proceeds from disposal, is charged or credited to earnings. Obligations for costs associated with asset retirements, such as requirements to restore a site to its original condition, are accrued at net present value and amortized along with the related asset.
Intangible assets with finite lives consist of technology, customer lists, trademarks and other intangibles and are amortized over their estimated useful lives, ranging from 1 to 20 years.
GCP reviews long-lived assets for impairment whenever events or changes in circumstances indicate that the carrying amount of an asset may not be fully recoverable. No impairment charges were required in 2016 and 2015; however, there were impairment charges recorded in 2014 (see Note 10, "Restructuring Expenses, Asset Impairments and Repositioning Expenses").
70
Goodwill Goodwill arises from certain business combinations. GCP reviews its goodwill for impairment on an annual basis in the fourth quarter and whenever events or changes in circumstances indicate that the carrying amount may not be fully recoverable. Recoverability is assessed at the reporting unit level most directly associated with the business combination that generated the goodwill. For the purpose of measuring impairment under the provisions of Financial Accounting Standards Board ("FASB") Accounting Standards Codification ("ASC") 350, "Intangibles—Goodwill and Other," GCP has identified its reporting units as its operating segments. GCP has evaluated its goodwill annually with no impairment charge required in any of the periods presented in its accompanying Consolidated Statements of Operations.
Income Tax As a global enterprise, GCP is subject to a complex array of tax regulations and must make assessments of applicable tax law and judgments in estimating its ultimate income tax liability. After the Separation, income tax expense and income tax balances represent GCP’s federal, state and foreign income taxes as an independent company. GCP will file a U.S. consolidated income tax return, along with foreign and state corporate income tax filings, as required. GCP's deferred taxes and effective tax rate may not be comparable to those of historical periods prior to the Separation. See Note 6, "Income Taxes," for details regarding estimates used in accounting for income tax matters including unrecognized tax benefits.
In the financial statements for periods prior to the Separation, income tax expense and tax balances were calculated using the separate return method as if GCP was a separate taxpayer, although GCP was included in tax returns filed by Grace. The separate return method applies ASC 740, Income Taxes, to the standalone financial statements of each member of a consolidated group as if the group member were a separate taxpayer and standalone enterprise. As a result, actual tax transactions included in the Consolidated Financial Statements of GCP may not be included in the separate financial statements of Grace. Further, the tax treatment of certain items reflected in the separate financial statements of Grace may not be reflected in the Consolidated Financial Statements and tax returns of GCP. For example, certain items such as net operating losses, credit carryforwards and valuation allowances that exist within Grace's financial statements may or may not exist in GCP's standalone financial statements.
With the exception of certain dedicated foreign entities, GCP did not maintain taxes payable to and from Grace and GCP was deemed to settle the annual current tax balances immediately with the legal entities liable for the taxes in the respective jurisdictions. These settlements are reflected as changes in net parent investment. The Consolidated Statements of Cash Flows reflect cash paid for income taxes, including GCP’s cash taxes paid to taxing authorities, as well as tax payments that are deemed settled with Grace as the taxpayer during these time periods.
Deferred tax assets and liabilities are recognized with respect to the expected future tax consequences of events that have been recorded in the Consolidated Financial Statements. If it is more likely than not that all or a portion of deferred tax assets will not be realized, a valuation allowance is provided against such deferred tax assets. The assessment of realization of deferred tax assets is performed based on the weight of the positive and negative evidence available to indicate whether the asset is recoverable, including tax planning strategies that are prudent and feasible.
Tax benefits from an uncertain tax position are recognized only if it is more likely than not that the tax position will be sustained upon examination by the taxing authorities based on the technical merits of the position. Tax benefits recognized in the financial statements from such a position are measured based on the largest benefit that has a greater than fifty percent likelihood of being realized upon ultimate settlement. GCP evaluates such likelihood based on relevant facts and tax law.
Pension Benefits GCP's method of accounting for actuarial gains and losses relating to its global defined benefit pension plans is referred to as "mark-to-market accounting." Under mark-to-market accounting, GCP's pension costs consist of two elements: 1) ongoing costs recognized quarterly, which include service and interest costs, expected returns on plan assets and amortization of prior service costs/credits; and 2) mark-to-market gains and losses recognized annually in the fourth quarter resulting from changes in actuarial assumptions, such as discount rates and the difference between actual and expected returns on plan assets. Should a significant event occur, GCP's pension obligation and plan assets would be remeasured at an interim period and the gains or losses on remeasurement would be recognized in that period.
71
Stock-Based Compensation Expense Prior to the Separation, GCP was allocated stock-based compensation expense from Grace related to GCP employees receiving awards denominated in Grace equity instruments. In accordance with an employee matters agreement entered into between Grace and GCP on January 27, 2016 in connection with the Separation (the "Employee Matters Agreement"), previously outstanding stock-based compensation awards granted under Grace's equity compensation programs prior to the Separation and held by certain executives and employees of GCP and Grace were adjusted to reflect the impact of the Separation on these awards. To preserve the aggregate intrinsic value of these stock-based compensation awards, as measured immediately before and immediately after the Separation, each holder of Grace stock-based compensation awards generally received an adjusted award consisting of either (i) both a stock-based compensation award denominated in Grace equity as it existed subsequent to the Separation and a stock-based compensation award denominated in GCP equity or (ii) solely a stock-based compensation award denominated in the equity of the company at which the person was employed following the Separation. In the Separation, the determination as to which type of adjustment applied to a holder’s previously outstanding Grace award was based upon the type of stock-based compensation award that was to be adjusted and the date on which the award was originally granted under the Grace equity compensation programs prior to the Separation. Under the Employee Matters Agreement, GCP retains certain obligations related to all stock- and cash-settled stock-based compensation awards denominated in GCP equity, regardless of whether the holder is a GCP or Grace employee.
Following the Separation, the Company records stock-based compensation expense for equity awards in accordance with the applicable authoritative accounting guidance. The Company recognizes expenses related to stock-based compensation payment transactions in which it receives employee services in exchange for equity instruments of the Company or liabilities that are based on the fair value of the Company’s equity instruments or that may be settled by the issuance of equity instruments. Stock-based compensation cost for restricted stock units (RSUs) and share-settled performance-based units (PBUs) are measured based on the Company’s common stock price on the date of grant. Cash-settled PBUs are remeasured at the end of each reporting period based on the closing fair market value of the Company’s common stock. The Company recognizes stock-based compensation cost as expense over the requisite service period, generally the vesting period of the award.
Currency Translation Assets and liabilities of foreign subsidiaries (other than those located in countries with highly inflationary economies) are translated into U.S. dollars at current exchange rates, while revenues, costs and expenses are translated at average exchange rates during each reporting period. The resulting currency translation adjustments are included in accumulated other comprehensive loss in the Consolidated Balance Sheets. The financial statements of any subsidiaries located in countries with highly inflationary economies are remeasured as if the functional currency were the U.S. dollar; the remeasurement creates translation adjustments that are reflected in net income in the Consolidated Statements of Operations.
Effective January 1, 2010, GCP began to account for its Venezuela subsidiary as a highly inflationary economy. As a result, the functional currency of its Venezuelan subsidiary became the U.S. dollar; therefore, all translation adjustments are reflected in net income in the accompanying Consolidated Statements of Operations. The official exchange rate (CENCOEX) of 4.3 was used to remeasure GCP's financial statements from bolivars to U.S. dollars upon Venezuela's designation as a highly inflationary economy. On February 8, 2013, the Venezuelan government announced that, effective February 13, 2013, the official exchange rate of the bolivar to U.S. dollar would devalue from 4.3 to 6.3. GCP continued to account for its results in Venezuela at the official exchange rate of 6.3 bolivars to one U.S. dollar until September 30, 2015. Based on developments in the third quarter of 2015, including changed expectations about GCP's ability to import raw materials into Venezuela at the official exchange rate and increased inflation, the Company determined that it was no longer appropriate to use the official exchange rate. Effective September 30, 2015, the Company began accounting for its results in Venezuela at the SIMADI rate. The Company recorded a pre-tax charge of $73.2 million in the third quarter of 2015 to reflect the devaluation of monetary assets and the impairment of non-monetary assets at the SIMADI rate of 199 bolivars to one U.S. dollar. The Company recorded $13.6 million of this amount related to inventory to cost of goods sold and $59.6 million related to other assets and liabilities as a separate line item in its Consolidated Statements of Operations for the year ended December 31, 2015, referred to as "Loss in Venezuela."
72
In mid-February 2016, changes to the currency exchange systems were announced that eliminated the SICAD exchange rate and replaced the name SIMADI rate with DICOM, a floating exchange rate. The DICOM rate of 675 bolivars to one U.S. dollar at December 31, 2016 has increased approximately 240% from the rate at December 31, 2015. Accordingly, the Company has recorded a $4.4 million loss within "Other expense (income), net" in its Consolidated Statements of Operations for the year ended December 31, 2016 to reflect the remeasurement of its Venezuela subsidiary's net monetary assets to U.S. dollars.
Recently Issued Accounting Standards
Business Combinations
In January 2017, the FASB issued Accounting Standards Update ("ASU") 2017-01, Business Combinations (Topic 805): Clarifying the Definition of a Business, which clarifies the definition of a business when evaluating whether transactions should be accounted for as acquisitions (or disposals) of assets or businesses. The update provides that when substantially all the fair value of the assets acquired is concentrated in a single identifiable asset or a group of similar identifiable assets, the set is not a business. The standard is effective for the Company on January 1, 2018, with early application permitted for certain transactions. GCP is currently evaluating the allowed transition methods and potential impact on its Consolidated Financial Statements and related disclosures.
Goodwill
In January 2017, the FASB issued ASU 2017-04, Intangibles—Goodwill and Other (Topic 350). This ASU modifies the concept of impairment from the condition that exists when the carrying amount of goodwill exceeds its implied fair value to the condition that exists when the carrying amount of a reporting unit exceeds its fair value, which eliminates Step 2 from the goodwill impairment test. The standard is effective for the Company for annual or any interim goodwill impairment tests beginning on or after January 1, 2020. Early adoption is permitted for interim or annual goodwill impairment tests performed on testing dates after January 1, 2017.
Income Taxes
In October 2016, the FASB issued ASU 2016-16, Income Taxes (Topic 740): Intra-Entity Transfers of Assets Other Than Inventory. This ASU requires recognition of the current and deferred income tax effects of an intra-entity asset transfer, other than inventory, when the transfer occurs, as opposed to current GAAP, which requires companies to defer the income tax effects until the asset has been sold to an outside party. The standard is effective for the Company on January 1, 2018, with early adoption permitted. GCP is currently evaluating the potential impact on its Consolidated Financial Statements and related disclosures.
Statement of Cash Flows
In August 2016, the FASB issued ASU 2016-15, Statement of Cash Flows (Topic 230): Classification of Certain Cash Receipts and Payments, which addresses eight specific cash flow presentation issues with the objective of reducing existing diversity in practice. ASU 2016-15 is effective for the Company on January 1, 2018 and requires a retrospective approach to adoption. GCP is currently evaluating the potential impact on its Consolidated Financial Statements and related disclosures.
Revenue from Contracts with Customers
In May 2014, the FASB issued ASU 2014-09, Revenue from Contracts with Customers (Topic 606). This update is intended to remove inconsistencies and weaknesses in revenue requirements; provide a more robust framework for addressing revenue issues; improve comparability of revenue recognition practices across entities, industries, jurisdictions and capital markets; provide more useful information to users of financial statements through improved disclosure requirements; and simplify the preparation of financial statements by reducing the number of requirements to which an entity must refer. The new requirements were to be effective for fiscal years beginning after December 15, 2016, and for interim periods within those fiscal years, with early adoption not permitted. In August 2015, the FASB issued ASU 2015-14, Revenue from Contracts with Customers—Deferral of the Effective Date, deferring the effective date by one year but permitting adoption as of the original effective date. The revised standard allows for two methods of adoption: (a) full retrospective adoption, meaning the standard is applied to all periods presented, or (b) modified retrospective adoption, meaning the cumulative effect of applying the new standard is recognized as an adjustment to the opening retained earnings balance. The standard will be
73
effective for the Company on January 1, 2018 and requires either a retrospective or a modified retrospective approach to adoption.
In addition to the expanded disclosures regarding revenue, this guidance may impact timing of revenue recognition in some arrangements with variable consideration or contracts for the sale of goods and services. GCP is currently evaluating the available transition methods and, given the diversity of the Company's business segments, the potential impact of the standard on its Consolidated Financial Statements and related disclosures. As a result, GCP will not adopt the standard early.
In May 2016, the FASB issued ASU 2016-12, Narrow-Scope Improvements and Practical Expedients, which clarifies aspects of ASU 2014-09, Revenue from Contracts with Customers (Topic 606), including non-cash consideration and provides a practical expedient for reflecting contract modifications upon transition. The Company is currently evaluating the impact of adopting ASU 2016-12, which will occur in conjunction with its adoption of the new revenue recognition standard promulgated in Topic 606.
In April 2016, the FASB issued ASU 2016-10, Identifying Performance Obligations and Licensing, which clarifies aspects of ASU 2014-09 pertaining to the identification of performance obligations and the licensing implementation guidance, while retaining the core principles for those areas. GCP is currently evaluating the impact of adopting ASU 2016-10, which will occur in conjunction with its adoption of Topic 606.
In March 2016, the FASB issued ASU 2016-08, Principal Versus Agent Considerations (Reporting Revenue Gross Versus Net), which amends the principal-versus-agent implementation guidance in Topic 606 and will affect whether an entity reports revenue on a gross or net basis. GCP is currently evaluating the impact of adopting ASU 2016-08, which will occur in conjunction with its adoption of Topic 606.
Leases
In February 2016, the FASB issued ASU 2016-02, Leases (Topic 842), which is intended to increase transparency and comparability among organizations by recognizing lease assets and lease liabilities on the balance sheet and disclosing key information about leasing arrangements. The core principle of Topic 842 is that a lessee should recognize the assets and liabilities that arise from leases. A lessee should recognize in the statement of financial position a liability to make lease payments (the lease liability) and a right-of-use asset representing its right to use the underlying asset for the lease term, including optional payments where they are reasonably certain to occur. The amendments in this update are effective for fiscal years beginning after December 15, 2018, including interim periods within those fiscal years, with early adoption permitted. GCP is currently evaluating the potential impact on its Consolidated Financial Statements and related disclosures.
Inventory
In July 2015, the FASB issued ASU 2015-11, Simplifying the Measurement of Inventory. The update requires that inventory be measured at the lower of cost or net realizable value for entities using FIFO or average cost methods. The new requirements are effective for fiscal years beginning after December 15, 2016, and for interim periods within those fiscal years, with early adoption permitted. GCP will adopt this standard for the 2017 first quarter and does not expect it to have a material effect on the Consolidated Financial Statements.
Recently Adopted Accounting Standards
Accounting for Stock Compensation
In March 2016, the FASB issued ASU 2016-09, Compensation - Stock Compensation (Topic 718): Improvements to Employee Share-Based Payment Accounting. The updated standard is intended to simplify several areas of accounting for share-based compensation arrangements, including the income tax impact, classification on the statement of cash flows and forfeitures.
74
The update requires that excess tax benefits and deficiencies be recorded in the income statement when the awards vest or are settled. It also eliminates the requirement that excess tax benefits be realized (reduce cash taxes payable) before being recognized. Previously, an entity could not recognize excess tax benefits if the tax deduction increased a net operating loss ("NOL") or tax credit carryforward. The updated standard no longer requires cash flows related to excess tax benefits to be presented as a financing activity separate from other income tax cash flows. The update also allows entities to repurchase more of an employee's shares for tax withholding purposes without triggering liability accounting, clarifies that all cash payments to taxing authorities made on an employee's behalf for withheld shares should be presented as a financing activity on the statement of cash flows and provides for an accounting policy election to account for forfeitures as they occur. The update is effective for annual periods beginning after December 15, 2016 and interim periods within those annual periods, with early adoption permitted.
GCP elected to early adopt this update in the 2016 third quarter and now recognizes excess tax benefits in the provision for income taxes rather than paid-in capital. Adoption of the update resulted in the recognition of excess tax benefits in the provision for income taxes of $0.8 million, $0.2 million and $0.9 million for the three month periods ended March 31, 2016, June 30, 2016 and September 30, 2016, respectively; $1.0 million for the six months ended June 30, 2016; and $1.9 million for the nine months ended September 30, 2016.
GCP has elected to continue to estimate forfeitures expected to occur to determine the amount of compensation expense to be recognized each period.
The presentation requirements for cash flows related to excess tax benefits resulted in an increase in cash provided by operating activities of $0.8 million and $1.0 million (with a corresponding reduction of cash provided by financing activities) for the three months ended March 31, 2016 and the six months ended June 30, 2016, respectively.
The tables below summarize the effects of the adoption of this update on GCP's previously reported results for the 2016 first and second quarters and for the six months ended June 30, 2016. GCP will revise its 2016 first and second quarter and 2016 six-month results accordingly in future filings to reflect its adoption of this update.
Consolidated Statements of Operations
Three Months Ended March 31, 2016 | Three Months Ended June 30, 2016 | Six Months Ended June 30, 2016 | |||||||||||||||||||||||||||||||||
(In millions, except per share amounts) | Previously Reported | Revised | Effect of Change | Previously Reported | Revised | Effect of Change | Previously Reported | Revised | Effect of Change | ||||||||||||||||||||||||||
Provision for income taxes | $ | (8.4 | ) | $ | (7.6 | ) | $ | 0.8 | $ | (12.8 | ) | $ | (12.6 | ) | $ | 0.2 | $ | (21.2 | ) | $ | (20.2 | ) | $ | 1.0 | |||||||||||
Net income | 17.4 | 18.2 | 0.8 | 30.4 | 30.6 | 0.2 | 47.8 | 48.8 | 1.0 | ||||||||||||||||||||||||||
Net income attributable to GCP shareholders | 17.0 | 17.8 | 0.8 | 30.1 | 30.3 | 0.2 | 47.1 | 48.1 | 1.0 | ||||||||||||||||||||||||||
Basic earnings per share: | |||||||||||||||||||||||||||||||||||
Net income attributable to GCP shareholders | $ | 0.24 | $ | 0.25 | $ | 0.01 | $ | 0.43 | $ | 0.43 | $ | — | $ | 0.67 | $ | 0.68 | $ | 0.01 | |||||||||||||||||
Diluted earnings per share: | |||||||||||||||||||||||||||||||||||
Net income attributable to GCP shareholders | $ | 0.24 | $ | 0.25 | $ | 0.01 | $ | 0.42 | $ | 0.42 | $ | — | $ | 0.66 | $ | 0.67 | $ | 0.01 | |||||||||||||||||
Weighted average number of diluted shares | 70.9 | 70.9 | — | 71.4 | 71.7 | 0.3 | 71.2 | 71.3 | 0.1 | ||||||||||||||||||||||||||
75
Consolidated Statements of Cash Flows
Three Months Ended March 31, 2016 | Six Months Ended June 30, 2016 | ||||||||||||||||||||||
(In millions) | Previously Reported | Revised | Effect of Change | Previously Reported | Revised | Effect of Change | |||||||||||||||||
Net cash provided by operating activities | $ | 23.7 | $ | 24.5 | $ | 0.8 | $ | 52.0 | $ | 53.0 | $ | 1.0 | |||||||||||
Net cash provided by financing activities | 15.6 | 14.8 | (0.8 | ) | 9.2 | 8.2 | (1.0 | ) | |||||||||||||||
Debt Issuance Costs
In August 2015, the FASB issued ASU 2015-15, Presentation and Subsequent Measurement of Debt Issuance Costs Associated with Line-of-Credit Arrangements. The update clarifies ASU 2015-03, allowing debt issuance costs related to line of credit arrangements to be deferred and presented as an asset and subsequently amortized ratably over the term of the line-of-credit arrangement, regardless of whether there are any outstanding borrowings on the line-of-credit arrangement. The new requirements are effective for fiscal years beginning after December 15, 2015, and for interim periods within those fiscal years, with early adoption permitted.
In April 2015, the FASB issued ASU 2015-03, Simplifying the Presentation of Debt Issuance Costs. The update requires that debt issuance costs related to a recognized debt liability be presented in the balance sheet as a direct deduction from the carrying amount of that debt liability, consistent with debt discounts.
GCP adopted both of these standards for the 2016 first quarter. Refer to Note 5, "Debt and Other Financial Instruments," for related information regarding GCP's credit facility, which the Company entered into in the 2016 first quarter.
2. Inventories
Inventories are stated at the lower of cost or market. GCP determines cost using the FIFO methodology. Inventories presented on GCP's Consolidated Balance Sheets consisted of the below.
December 31, | |||||||
(In millions) | 2016 | 2015 | |||||
Raw materials | $ | 45.6 | $ | 39.1 | |||
In process | 7.0 | 6.2 | |||||
Finished products and other | 69.0 | 60.0 | |||||
Total inventories | $ | 121.6 | $ | 105.3 | |||
Included above as "other" within "Finished products and other" are finished products purchased rather than produced by GCP of $11.4 million and $8.7 million as of December 31, 2016 and December 31, 2015, respectively.
76
3. Properties and Equipment
December 31, | |||||||
(In millions) | 2016 | 2015 | |||||
Land | $ | 8.4 | $ | 9.2 | |||
Buildings | 165.5 | 159.1 | |||||
Machinery, equipment and other | 448.1 | 425.3 | |||||
Information technology and equipment | 67.6 | 18.9 | |||||
Projects under construction | 28.4 | 14.7 | |||||
Properties and equipment, gross | 718.0 | 627.2 | |||||
Accumulated depreciation and amortization | (485.8 | ) | (430.1 | ) | |||
Properties and equipment, net | $ | 232.2 | $ | 197.1 | |||
As discussed in Note 12, "Related Party Transactions and Transactions with Grace," the 2016 amounts above reflect the impact of a non-cash transfer from parent in connection with the Separation of approximately $23 million. Depreciation and amortization expense relating to properties and equipment was $32.2 million, $27.3 million and $28.1 million, in 2016, 2015 and 2014, respectively.
4. Goodwill and Other Intangible Assets
The carrying amount of goodwill attributable to each operating segment and the changes in those balances during the years ended December 31, 2016 and 2015, are as presented below.
(In millions) | SCC | SBM | Darex | Total GCP | |||||||||||
Balance, December 31, 2014 | $ | 49.3 | $ | 59.4 | $ | 5.3 | $ | 114.0 | |||||||
Foreign currency translation | (5.1 | ) | (5.8 | ) | (0.5 | ) | (11.4 | ) | |||||||
Other adjustments | — | (0.1 | ) | — | (0.1 | ) | |||||||||
Balance, December 31, 2015 | $ | 44.2 | $ | 53.5 | $ | 4.8 | $ | 102.5 | |||||||
Foreign currency translation | (0.5 | ) | (0.6 | ) | (0.3 | ) | (1.4 | ) | |||||||
Acquisitions | 2.1 | 16.1 | — | 18.2 | |||||||||||
Balance, December 31, 2016 | $ | 45.8 | $ | 69.0 | $ | 4.5 | $ | 119.3 | |||||||
GCP's net book value of other intangible assets at December 31, 2016 and 2015 was $53.0 million and $33.3 million, respectively, detailed below.
December 31, 2016 | |||||||
(In millions) | Gross Carrying Amount | Accumulated Amortization | |||||
Customer lists | $ | 56.1 | $ | 21.0 | |||
Technology | 24.3 | 11.6 | |||||
Trademarks | 13.5 | 9.4 | |||||
Other | 11.9 | 10.8 | |||||
Total | $ | 105.8 | $ | 52.8 | |||
77
December 31, 2015 | |||||||
(In millions) | Gross Carrying Amount | Accumulated Amortization | |||||
Customer lists | $ | 39.2 | $ | 19.4 | |||
Technology | 17.9 | 10.2 | |||||
Trademarks | 13.7 | 9.3 | |||||
Other | 12.3 | 10.9 | |||||
Total | $ | 83.1 | $ | 49.8 | |||
Total indefinite-lived trademarks included above at December 31, 2016 and 2015 were $3.7 million and $3.9 million, respectively. Amortization expense related to intangible assets was $4.0 million, $4.6 million and $5.9 million in 2016, 2015 and 2014, respectively.
At December 31, 2016, estimated future annual amortization expense for intangible assets is presented below.
(In millions) | |||
2017 | $ | 4.4 | |
2018 | 4.3 | ||
2019 | 4.2 | ||
2020 | 4.2 | ||
2021 | 3.6 | ||
Thereafter | 28.6 | ||
Total | $ | 49.3 | |
In 2016, GCP acquired the intellectual property and related assets of Sensocrete and 100% of the stock of Halex Corporation. Refer to Note 16, "Acquisitions," for further discussion of the related intangible assets and goodwill.
5. Debt and Other Financial Instruments
Components of Debt
December 31, | |||||||
(In millions, except interest rate amounts) | 2016 | 2015 | |||||
9.5% Senior Notes due 2023, net of unamortized debt issuance costs of $7.3 at December 31, 2016 | $ | 517.7 | $ | — | |||
Term Loan due 2022, net of unamortized discount of $2.4 and unamortized debt issuance costs of $4.3 at December 31, 2016(1) | 266.2 | — | |||||
Revolving credit facility due 2021(2) | 25.0 | — | |||||
Related party | — | 42.3 | |||||
Other borrowings(3) | 22.0 | 25.7 | |||||
Total debt | 830.9 | 68.0 | |||||
Less debt payable within one year | 47.9 | 68.0 | |||||
Debt payable after one year | $ | 783.0 | $ | — | |||
Weighted average interest rates on related party debt | — | % | 3.3 | % | |||
Weighted average interest rates on total debt | 7.5 | % | 11.9 | % | |||
(1) | Interest at LIBOR +325 bps with a 75 bps LIBOR floor at December 31, 2016. |
(2) | Interest at LIBOR +200 bps at December 31, 2016. |
(3) | Represents borrowings under various lines of credit, primarily by non-U.S. subsidiaries. |
78
The principal maturities of debt outstanding (net of unamortized discounts and debt issuance costs) at December 31, 2016 are presented below.
(In millions) | |||
2017 | $ | 47.9 | |
2018 | 3.4 | ||
2019 | 3.4 | ||
2020 | 3.4 | ||
2021 | 2.8 | ||
Thereafter | 770.0 | ||
Total debt | $ | 830.9 | |
Credit Agreement
On February 3, 2016, GCP entered into a credit agreement (the “Credit Agreement”) that provides for new senior secured credit facilities (the “Credit Facilities”) in an aggregate principal amount of $525.0 million, consisting of:
(a) | term loan (the “Term Loan”) in an aggregate principal amount of $275.0 million maturing in 2022; and |
(b) | $250.0 million revolving credit facility (the "Revolving Loan") due in 2021. |
The Term Loan principal balance is scheduled to be repaid in equal quarterly installments in aggregate annual amounts equal to 1.0% of the original principal amount.
The Credit Agreement contains customary affirmative covenants, including, but not limited to (i) maintenance of legal existence and compliance with laws and regulations; (ii) delivery of consolidated financial statements and other information; (iii) payment of taxes; (iv) delivery of notices of defaults and certain other material events; and (v) maintenance of adequate insurance. The Credit Agreement also contains customary negative covenants, including but not limited to restrictions on (i) dividends on and redemptions of, equity interests and other restricted payments; (ii) liens; (iii) loans and investments; (iv) the sale, transfer or disposition of assets and businesses; (v) transactions with affiliates; and (vi) a maximum total leverage ratio. Certain debt covenants may restrict the entity's ability as it relates to dividends, acquisitions and other borrowings. The Credit Agreement contains conditions that would require mandatory principal payments in advance of the maturity date of the Term Loan and Revolving Credit Facility; the Company was in compliance with all terms as of December 31, 2016.
Events of default under the Credit Agreement include, but are not limited to: (i) failure to pay principal, interest, fees or other amounts under the Credit Agreement when due, taking into account any applicable grace period; (ii) any representation or warranty proving to have been incorrect in any material respect when made; (iii) failure to perform or observe covenants or other terms of the Credit Agreement subject to certain grace periods; (iv) a cross-default and cross-acceleration with certain other material debt; (v) bankruptcy events; (vi) certain defaults under ERISA and (vii) the invalidity or impairment of security interests. There are no events of default as of December 31, 2016.
The Credit Facilities are secured on a first priority basis by a perfected security interest in and mortgages on substantially all U.S. tangible and intangible personal property, financial assets, and real property owned by the Company in Chicago, Illinois and Mount Pleasant, Tennessee; a pledge of 100% of the equity of each material U.S. subsidiary of the Company; and 65% of the equity of the United Kingdom holding company. The carrying value of pledged assets to our Credit Facilities is approximately $461 million as of December 31, 2016.
79
On August 25, 2016, GCP refinanced the existing Credit Agreement with a syndicate of banks (the “Amended Credit Agreement”). The Amended Credit Agreement reduced the interest rate margins applicable to the Term Loan from base rate plus a margin of 3.5% or LIBOR plus a margin of 4.5% to a base rate plus a margin of 2.25% or LIBOR plus a margin of 3.25% at GCP’s option. The $274.3 million outstanding principal balance was replaced by a like aggregate $274.3 million principal balance with substantially similar terms to the Credit Agreement. In conjunction with the refinancing, the Company recognized accelerated amortization of $0.1 million for a portion of the associated previously deferred debt issuance costs and expensed $1.2 million of related third-party financing costs. These amounts are included in "Interest expense and related financing costs" in the Consolidated Statements of Operations for the year ended December 31, 2016.
The interest rate per annum applicable to the Revolving Loan is equal to, at GCP’s option, either a base rate plus a margin ranging from 0.5% to 1.0% or LIBOR plus a margin ranging from 1.5% to 2.0%, in either case based upon the total leverage ratio of GCP and its restricted subsidiaries. On October 31, 2016, GCP borrowed on its Revolving Loan and used the funds, together with cash on hand, to acquire Halex Corporation. The $25.0 million draw was outstanding as of December 31, 2016 alongside approximately $9 million in outstanding letters of credit, as such available credit under that facility was reduced to $216.0 million.
Senior Notes
On January 27, 2016, GCP issued $525.0 million aggregate principal amount of 9.5% Senior Notes due 2023 (the “Notes”). Interest is payable semi-annually in arrears on February 1 and August 1 of each year, commencing on August 1, 2016.
The Notes were issued subject to covenants that limit the Company's and certain of its subsidiaries’ ability, subject to certain exceptions and qualifications, to (i) create or incur liens on assets, (ii) incur additional debt (iii) sell certain assets (iv) make certain investments and acquisitions, merge or sell or otherwise dispose of all or substantially all assets.
During the first quarter 2016, GCP incurred debt issuance costs relating to issuance of the Notes, Term Loan and Revolving Loan of $8.0 million, $5.0 million and $5.2 million, respectively. GCP deducted the debt issuance costs relating to the Notes and the Term Loan from the carrying amounts presented on its Consolidated Balance Sheet and is amortizing those costs over the terms of the underlying obligations.
GCP classified debt issuance costs relating to the Revolving Loan in "Other assets" on its Consolidated Balance Sheet and is amortizing those costs over the term of the Revolving Loan. The unamortized portion of these costs as of December 31, 2016 was $4.2 million.
During the first quarter 2016, GCP used certain proceeds from the Notes and Credit Facilities to fund a distribution to Grace in an amount of $750.0 million related to the Separation. Approximately $50 million was retained to meet operating requirements and to pay fees associated with the debt financing and other post-Separation costs. Related party debt of approximately $42 million and related interest was settled with Grace in connection with the Separation.
Debt Fair Value
At December 31, 2016, the carrying amounts and fair values of GCP's debt are presented below.
December 31, 2016 | December 31, 2015 | ||||||||||||||
(In millions) | Carrying Amount | Fair Value | Carrying Amount | Fair Value | |||||||||||
9.5% Senior Notes due 2023 | $ | 517.7 | $ | 603.1 | $ | — | $ | — | |||||||
Term Loan due 2022 | 266.2 | 274.6 | — | — | |||||||||||
Revolving credit facility due 2021 | 25.0 | 25.0 | — | — | |||||||||||
Other borrowings | 22.0 | 22.0 | 68.0 | 68.0 | |||||||||||
Total debt | $ | 830.9 | $ | 924.7 | $ | 68.0 | $ | 68.0 | |||||||
80
Fair value is determined based on Level 2 inputs, including expected future cash flows (discounted at market interest rates), estimated current market prices and quotes from financial institutions. The increase in fair value of the Notes since issuance was driven by favorable demands in the marketplace.
6. Income Taxes
The income tax provision for the years ended December 31, 2016, 2015, and 2014 was $32.2 million, $84.3 million, and $55.6 million respectively, representing effective tax rates of 30.4%, 67.3%, and 29.1% respectively. The decrease in the Company's effective tax rate for the year ended December 31, 2016 compared to the same period in 2015 was primarily due to a 2015 repatriation of foreign earnings and the nondeductible loss in Venezuela recorded in 2015. The early adoption of ASU 2016-09 in 2016 reduced the effective tax rate by 1.9 percentage points, or $2.0 million, for the year ended December 31, 2016. The effects of early adoption of ASU 2016-09 are further discussed in Note 1, "Basis of Presentation and Summary of Significant Accounting and Financial Reporting Policies." The increase in the Company's effective tax rate for the year ended December 31, 2015 compared to the same period in 2014 primarily resulted from the effect of Separation-related repatriation of foreign earnings, a higher percentage of earnings in jurisdictions with higher statutory rates, the effect of mark-to-market pension adjustments in jurisdictions with lower statutory rates and the 2015 nondeductible Venezuela charge, partially offset by a tax benefit in 2015 for a return to provision change in estimate.
Provision for Income Taxes
The components of income before income taxes and the related provision for income taxes for 2016, 2015 and 2014 are presented below.
(In millions) | 2016 | 2015 | 2014 | ||||||||
Income before income taxes: | |||||||||||
Domestic | $ | 37.1 | $ | 97.2 | $ | 65.6 | |||||
Foreign | 68.9 | 28.0 | 125.5 | ||||||||
Total | $ | 106.0 | $ | 125.2 | $ | 191.1 | |||||
Benefit from (provision for) income taxes: | |||||||||||
Federal—current | $ | 6.1 | $ | 50.5 | $ | 23.3 | |||||
Federal—deferred | 3.9 | 1.0 | (3.6 | ) | |||||||
State and local—current | 2.3 | 9.5 | 4.7 | ||||||||
State and local—deferred | (0.2 | ) | 0.2 | (0.6 | ) | ||||||
Foreign—current | 19.6 | 25.6 | 29.2 | ||||||||
Foreign—deferred | 0.5 | (2.5 | ) | 2.6 | |||||||
Total | $ | 32.2 | $ | 84.3 | $ | 55.6 | |||||
The income by jurisdiction above does not reflect $15.5 million, $173.1 million and $7.9 million of domestic income resulting from repatriated earnings in 2016, 2015 and 2014, respectively.
81
The difference between the provision for income taxes at the U.S. federal income tax rate of 35.0% and GCP's overall income tax provision is summarized below.
(In millions) | 2016 | 2015 | 2014 | ||||||||
Tax provision at U.S. federal income tax rate | $ | 37.1 | $ | 43.8 | $ | 66.9 | |||||
Change in provision resulting from: | |||||||||||
Nondeductible Venezuela charge | — | 24.7 | — | ||||||||
Cost (benefit) from U.S. taxes on repatriation foreign earnings | — | 19.9 | (0.1 | ) | |||||||
Effect of tax rates in foreign jurisdictions | (5.3 | ) | (8.0 | ) | (12.3 | ) | |||||
State and local income taxes, net | 1.6 | 6.3 | 2.7 | ||||||||
Benefit from domestic production activities | (0.4 | ) | (2.7 | ) | (2.2 | ) | |||||
Return to provision – change in estimate | — | (2.5 | ) | — | |||||||
Nondeductible expenses | 1.4 | 2.5 | 2.5 | ||||||||
Research and other state credits | (0.6 | ) | — | — | |||||||
Adjustments to uncertain tax positions and other | (1.6 | ) | 0.3 | (1.9 | ) | ||||||
Provision for income taxes | $ | 32.2 | $ | 84.3 | $ | 55.6 | |||||
For 2015, (cost) benefit from U.S. taxes on foreign earnings includes repatriation of current and prior year earnings pursuant to the Separation and is discussed in further detail below under "Unrepatriated Foreign Earnings." The nondeductible Venezuela charge is the tax effect of the $73.2 million nondeductible charge recorded during the third quarter of 2015.
As also discussed in Note 1, on February 3, 2016, the Separation of Grace and GCP was completed. In conjunction with the Separation, GCP has increased its deferred tax assets and prepaid taxes in the U.S. by approximately $76 million, which primarily relates to the step up in tax basis and transfer of a net pension liability.
82
Deferred Tax Assets and Liabilities
At December 31, 2016 and 2015, the deferred tax assets and liabilities consisted of the below items.
(In millions) | December 31, 2016 | December 31, 2015 | |||||
Deferred tax assets: | |||||||
Foreign net operating loss carryforwards | $ | 12.0 | $ | 11.3 | |||
Research and development | 6.3 | 9.2 | |||||
Reserves and allowances | 14.6 | 7.9 | |||||
Pension benefits | 27.1 | 2.9 | |||||
Intangible assets/goodwill | 24.5 | — | |||||
Stock compensation | 4.4 | 6.0 | |||||
Foreign tax credits | 3.5 | — | |||||
Other | 2.8 | 1.6 | |||||
Total deferred tax assets | $ | 95.2 | $ | 38.9 | |||
Deferred tax liabilities: | |||||||
Properties and equipment | $ | (14.6 | ) | $ | (14.4 | ) | |
Intangible assets/goodwill | — | (12.7 | ) | ||||
Other | (3.8 | ) | (0.9 | ) | |||
Total deferred tax liabilities | $ | (18.4 | ) | $ | (28.0 | ) | |
Valuation Allowance: | |||||||
Foreign net operating loss carryforwards | (2.3 | ) | (2.0 | ) | |||
Net deferred tax assets (liabilities) | $ | 74.5 | $ | 8.9 | |||
In evaluating GCP's ability to realize its deferred tax assets ("DTAs"), GCP considers all reasonably available positive and negative evidence, including recent earnings experience, expectations of future taxable income and the tax character of that income, the period of time over which the temporary differences become deductible and the carryforward and/or carryback periods available to GCP for tax reporting purposes in the related jurisdiction. In estimating future taxable income, GCP relies upon assumptions and estimates about future activities, including the amount of future federal, state and foreign pretax operating income that GCP will generate; the reversal of temporary differences; and the implementation of feasible and prudent tax planning strategies. GCP records a valuation allowance to reduce deferred tax assets to the amount that it believes is more likely than not to be realized.
At December 31, 2016 and 2015, GCP has recorded a valuation allowance of $2.3 million and $2.0 million respectively, to reduce its net deferred tax assets to the amount that is more likely than not to be realized. The realization of deferred tax assets is dependent on the generation of sufficient taxable income in the appropriate tax jurisdictions. GCP believes it is more likely than not that the remaining deferred tax assets will be realized. If GCP were to determine that it would not be able to realize a portion of its deferred tax assets in the future, for which there is currently no valuation allowance, an adjustment to the deferred tax assets would be charged to earnings in the period such determination was made. Conversely, if GCP were to make a determination that it is more likely than not that deferred tax assets, for which there is currently a valuation allowance, would be realized, the related valuation allowance would be reduced and a benefit to earnings would be recorded.
Grace Brasil Ltda. (“Grace Brasil”), a wholly-owned subsidiary of the Company, holds a DTA equal to approximately $11.2 million (tax-effected) as of December 31, 2016. Due to the challenging economic and political climate in Brazil from the fourth quarter of 2015 to date, Grace Brasil incurred significant net operating losses ("NOLs") in 2015 and a small net operating loss in 2016. Based on these factors, the Company has evaluated its ability to utilize Grace Brasil’s DTA in future years.
In evaluating the recoverability of Grace Brasil's DTA at December 31, 2016 and 2015, the Company has considered all available evidence, both positive and negative, including but not limited to the following:
83
• | Under Brazilian tax law, net operating losses are carried forward indefinitely; |
• | Grace Brasil is forecasting pretax income in 2017 despite being in an economic trough; |
• | Grace Brasil has a demonstrated history of core earnings; |
• | Brazil is a critical market for GCP Applied Technologies and, as a result, the Company has a strong commitment to sustained long-term profitability in Brazil; |
• | The continuing challenge of Brazil’s economic and political climate. |
As of December 31, 2016 and 2015, the Company believes that the weight of the positive evidence outweighed the negative evidence regarding the realization of the net deferred tax assets in Grace Brasil. The Company will continue to evaluate the ability to realize Grace Brasil’s net deferred tax assets on a quarterly basis.
The Company has a U.S. net capital loss carryforward of $4.5 million that will expire at December 31, 2021 if not utilized. The Company has recorded a deferred tax asset of $1.6 million reflecting the benefit of such loss carryforward. Management believes it is more likely than not that such benefit will be recognized and accordingly has not recorded a valuation allowance against such asset.
The Company has $28.6 million of NOL carryforwards, the majority of which is in Brazil with an unlimited carryforward period.
The Company has $3.5 million of foreign tax credits that will begin to expire in 2025 if not utilized. The Company has $0.2 million of state research credits and $0.1 million of state investment tax credits that will expire in 2031 and 2019 respectively if not utilized. The Company believes it is more likely than not that such benefits will be recognized and accordingly has not recorded a valuation allowance against such asset.
Unrepatriated Foreign Earnings
As of December 31, 2016, the Company has the intent and ability to indefinitely reinvest undistributed earnings of its foreign subsidiaries outside the United States. GCP has not provided for U.S. federal, state and foreign deferred income taxes on $272.4 million of undistributed earnings of foreign subsidiaries. The unrecorded deferred tax liability associated with these earnings is $4.0 million. Earnings of $15.5 million, $173.1 million and $7.9 million were repatriated from non-U.S. GCP subsidiaries in 2016, 2015 and 2014, respectively, resulting in an insignificant amount of U.S. income tax expense or benefit in 2016 and 2014. The tax effect of the repatriation of foreign earnings in 2015 is discussed in detail below. The tax effect of the repatriation is determined by several variables, including the tax rate applicable to the entity making the distribution, the cumulative earnings and associated foreign taxes of the entity and the extent to which those earnings may have already been taxed in the U.S.
In 2015, Grace repatriated a total of $173.1 million of foreign earnings from foreign subsidiaries transferred to GCP pursuant to the Separation. Such amount was determined based on an analysis of each non-U.S. subsidiary's requirements for working capital, debt repayment and strategic initiatives. In 2015, on a stand-alone basis (see Note 1, "Basis of Presentation and Summary of Significant Accounting and Financial Reporting Policies"), GCP incurred $19.9 million in tax expense as a result of such repatriation, increasing the Company's 2015 effective tax rate by 15.9 percentage points when compared to the U.S. federal statutory rate.
GCP believes that the Separation is a one-time, non-recurring event and that recognition of deferred taxes of undistributed earnings during 2015 would not have occurred if not for the Separation. Subsequent to the Separation, GCP expects undistributed prior year earnings of its foreign subsidiaries to remain permanently reinvested except in certain instances where repatriation of such earnings would result in minimal or no tax. GCP bases this assertion on:
(1) | the expectation that it will satisfy its U.S. cash obligations in the foreseeable future without requiring the repatriation of prior year foreign earnings; |
(2) | plans for significant and continued reinvestment of foreign earnings in organic and inorganic growth initiatives outside the U.S.; and |
(3) | remittance restrictions imposed by local governments. |
84
GCP will continually analyze and evaluate its cash needs to determine the appropriateness of its indefinite reinvestment assertion.
In connection with the Separation, GCP and Grace entered into various agreements that govern the relationship between the parties going forward, including a tax matters agreement (the "Tax Sharing Agreement"). Under the Tax Sharing Agreement, which was entered into on the distribution date, GCP and Grace will indemnify and hold each other harmless in accordance with the principles outlined therein.
Unrecognized Tax Benefits
A reconciliation of the unrecognized tax benefits, excluding interest and penalties, for the three years ended December 31, 2016, are presented below.
(In millions) | Unrecognized Tax Benefits | ||
Balance, January 1, 2014 | $ | 7.7 | |
Additions for prior year tax positions | 0.7 | ||
Reductions for prior year tax positions and reclassifications | (0.4 | ) | |
Reductions for expirations of statute of limitations | (0.3 | ) | |
Settlements | (2.4 | ) | |
Balance, December 31, 2014 | 5.3 | ||
Additions for prior year tax positions | 0.3 | ||
Reductions for prior year tax positions and reclassifications | (0.8 | ) | |
Settlements | (0.9 | ) | |
Balance, December 31, 2015 | 3.9 | ||
Transfers from Parent | 4.1 | ||
Additions for prior year tax positions | 2.5 | ||
Reductions for prior year tax positions and reclassifications | — | ||
Reductions for expirations of statute of limitations | (1.1 | ) | |
Settlements | (2.0 | ) | |
Balance, December 31, 2016 | $ | 7.4 | |
The balance of unrecognized tax benefits as of December 31, 2016, 2015 and 2014 of $7.4 million, $3.9 million and $5.3 million, respectively, if recognized, would affect the effective tax rate. GCP accrues potential interest and any associated penalties related to uncertain tax positions within "Provision for income taxes" in the Consolidated Statements of Operations. The balances of unrecognized tax benefits in the preceding table do not include accrued interest and penalties. The total amount of interest and penalties accrued on uncertain tax positions and included in the Consolidated Balance Sheets as of December 31, 2016 and 2015 was $2.3 million and $1.3 million, respectively, net of applicable federal income tax benefits.
Unrecognized tax benefits from GCP's operations are included in the Consolidated Financial Statements including those that in certain jurisdictions have historically been included in tax returns filed by Grace. In such instances, uncertain tax positions related to GCP's operations may be indemnified by Grace. As of December 31, 2016, 2015 and 2014, the amount of unrecognized tax benefits considered obligations of Grace (including both interest and penalties) were $3.7 million, $2.1 million and $2.1 million, respectively.
GCP believes it is reasonably possible that in the next 12 months the amount of the liability for unrecognized tax benefits could decrease by approximately $1.1 million, of which $0.5 million is indemnified by Grace.
GCP files U.S. federal income tax returns as well as income tax returns in various state and foreign jurisdictions. Unrecognized tax benefits relate to income tax returns for tax years that remain subject to examination by the relevant tax authorities. Since GCP's operations have historically been included in federal and state returns filed by Grace, the information reflected below for the U.S. relates to historical Grace returns.
85
The following table summarizes open tax years by major jurisdiction.
Tax Jurisdiction(1) | Examination in Progress | Examination Not Initiated | |
United States—Federal | None | None | |
United States—States | None | 2015 | |
Italy | None | 2009-2014 | |
France | None | 2014-2015 | |
Germany | None | 2014-2015 | |
India | 2013-2014 | 2015 | |
Malaysia | None | 2014-2015 | |
Argentina | 2002-2007 | 2008-2015 | |
China | None | None | |
Russia | 2015 | None | |
Canada | None | 2014-2015 | |
Indonesia | 2013 | 2014-2015 | |
___________________________________________________________________________________________________________________
(1) | Includes federal, state, provincial or local jurisdictions, as applicable. |
7. Pension Plans and Other Postretirement Benefit Plans
Multiemployer Benefit Plans Prior to the Separation, Grace sponsored funded and unfunded defined benefit pension and other postretirement benefit plans in which GCP employees and employees from other Grace businesses participated in (the “Shared Plans”). These Shared Plans were accounted for as multiemployer benefit plans. Accordingly, GCP did not record an asset or liability to recognize the funded status of these Shared Plans in the Balance Sheet prior to the Separation.
In the fourth quarter of 2015, in preparation for the Separation, certain international pension plans were legally separated resulting in an approximate $4 million increase to net pension liabilities. GCP recorded the funded status for these international plans as of December 31, 2015. During the first quarter of 2016, certain Shared Plans in the U.S. were legally separated, resulting in an approximate $44 million increase to net pension liabilities on the Consolidated Balance Sheet. The funded status of these plans as of December 31, 2016 is included in the Net Funded Status table below.
GCP’s allocated pension expense for the Shared Plans was $3.8 million and $5.3 million for the years ended December 31, 2015 and 2014, respectively. The related expense for the year ended December 31, 2016 is included in the Components of Net Periodic Benefit Cost (Income) table below.
Postretirement Benefits Other Than Pensions Grace provided postretirement life insurance benefits for retired employees of certain U.S. business units and certain divested business units. GCP’s allocated income for these postretirement life insurance benefits plan was $1.4 million and $0.7 million for the years ended December 31, 2015 and 2014, respectively.
In the first quarter of 2016, the postretirement life insurance benefits plan liability related to GCP employees who were participants in this plan at the time of Separation was legally transferred to GCP, resulting in an increase of $0.1 million to other liabilities. Additionally as part of the Separation, GCP assumed $0.8 million of prior service credit and $0.7 million of actuarial losses, both net of tax.
During 2016, GCP entered into an agreement to eliminate retiree life insurance benefits for its two remaining bargaining locations. The net impact of these curtailment and termination plan changes amounted to a $0.2 million gain recognized in operating income for the year ended December 31, 2016.
Pension Plans GCP sponsors certain defined benefit pension plans, primarily in the U.S. and the U.K. in which GCP employees participate. These plans cover current and former employees of certain business units and divested business units who meet age and service requirements. Benefits are generally based on final average salary and years of service. GCP funds its U.S. qualified pension plans in accordance with U.S. federal laws and
86
regulations. Non-U.S. pension plans are funded under a variety of methods, as required under local laws and customs.
GCP records an asset or liability to recognize the funded status of these pension plans in its Consolidated Balance Sheets. Net funded status and net periodic benefit cost as of December 31, 2016 are shown below.
The following table presents the funded status of GCP's overfunded, underfunded and unfunded defined pension plans:
(In millions) | December 31, 2016 | December 31, 2015 | |||||
Overfunded defined benefit pension plans | $ | 21.2 | $ | 26.1 | |||
Underfunded defined benefit pension plans | (58.5 | ) | (8.0 | ) | |||
Unfunded defined benefit pension plans | (39.5 | ) | (26.0 | ) | |||
Total underfunded and unfunded defined benefit pension plans | (98.0 | ) | (34.0 | ) | |||
Pension liabilities included in other current liabilities | (1.2 | ) | (1.1 | ) | |||
Net funded status | $ | (78.0 | ) | $ | (9.0 | ) | |
Overfunded plans include several advance-funded plans for which the fair value of the plan assets exceeds the projected benefit obligation ("PBO"). This group of plans was overfunded by $21.2 million as of December 31, 2016 and the overfunded status is reflected as assets in "Overfunded defined benefit pension plans" in the Consolidated Balance Sheets. Underfunded plans include a group of advance-funded plans that are underfunded on a PBO basis. Unfunded plans include several plans that are funded on a pay-as-you-go basis and therefore, the entire PBO is unfunded. As of December 31, 2016, the combined balance of $99.2 million for the underfunded and unfunded plans included as liabilities in the Consolidated Balance Sheet is comprised of current and non-current components of $1.2 million in "Other current liabilities" and $98.0 million in "Underfunded and unfunded defined benefit pension plans," respectively.
During 2016, pension plans at certain non-U.S. locations were curtailed or terminated. For the year ended December 31, 2016, GCP recognized a total net gain of $0.6 million in operating income relating to non-U.S. pension plan curtailment and termination gains and losses.
At the December 31, 2016 measurement date for GCP's defined benefit pension plans, the PBO was $423.6 million compared to $306.2 million as of December 31, 2015. The increase is primarily due to the exclusion of approximately $116 million of PBO for certain Shared Plans as of December 31, 2015. These plans were accounted for as multiemployer plans and, therefore, GCP did not record an asset or liability for these plans as of December 31, 2015. The PBO basis reflects the present value (based on weighted average discount rate of 4.27% for U.S. plans and 2.42% for non-U.S. plans as of December 31, 2016) of vested and non-vested benefits earned from employee service to date, based upon current services and estimated future pay increases for active employees.
A full remeasurement of pension assets and pension liabilities is performed annually based on GCP's estimates and actuarial valuations. These valuations reflect the terms of the plan and use participant-specific information as well as certain key assumptions provided by management.
87
Analysis of Plan Accounting and Funded Status The following table summarizes the changes in benefit obligations and fair values of retirement plan assets during 2016 and 2015:
Defined Benefit Pension Plans | |||||||||||||||||||||||
(In millions) | U.S. | Non-U.S. | Total | ||||||||||||||||||||
2016 | 2015 | 2016 | 2015 | 2016 | 2015 | ||||||||||||||||||
Change in Projected Benefit Obligation (PBO): | |||||||||||||||||||||||
Benefit obligation at beginning of year(1) | $ | 125.7 | $ | 12.9 | $ | 296.8 | $ | 285.7 | $ | 422.5 | $ | 298.6 | |||||||||||
Service cost | 6.1 | 0.3 | 3.3 | 3.1 | 9.4 | 3.4 | |||||||||||||||||
Interest cost | 4.7 | 0.5 | 7.8 | 9.2 | 12.5 | 9.7 | |||||||||||||||||
Plan participants' contributions | — | — | 0.4 | 0.5 | 0.4 | 0.5 | |||||||||||||||||
Settlements/curtailments | — | — | (7.1 | ) | (1.0 | ) | (7.1 | ) | (1.0 | ) | |||||||||||||
Actuarial loss (gain) | 14.0 | (0.9 | ) | 33.9 | 5.4 | 47.9 | 4.5 | ||||||||||||||||
Benefits paid | (2.9 | ) | (0.5 | ) | (15.5 | ) | (11.8 | ) | (18.4 | ) | (12.3 | ) | |||||||||||
Assumption of plan liabilities | — | — | — | 19.0 | — | 19.0 | |||||||||||||||||
Currency exchange translation adjustments | — | — | (43.6 | ) | (16.2 | ) | (43.6 | ) | (16.2 | ) | |||||||||||||
Benefit obligation at end of year | $ | 147.6 | $ | 12.3 | $ | 276.0 | $ | 293.9 | $ | 423.6 | $ | 306.2 | |||||||||||
Change in Plan Assets: | |||||||||||||||||||||||
Fair value of plan assets at beginning of year(2) | $ | 81.1 | $ | 12.2 | $ | 287.5 | $ | 294.8 | $ | 368.6 | $ | 307.0 | |||||||||||
Actual return on plan assets | 7.1 | (0.4 | ) | 32.2 | 1.2 | 39.3 | 0.8 | ||||||||||||||||
Employer contributions | 1.0 | — | 6.4 | 2.4 | 7.4 | 2.4 | |||||||||||||||||
Plan participants' contributions | — | — | 0.4 | 0.5 | 0.4 | 0.5 | |||||||||||||||||
Settlements | — | — | (5.1 | ) | (1.5 | ) | (5.1 | ) | (1.5 | ) | |||||||||||||
Benefits paid | (2.9 | ) | (0.5 | ) | (15.5 | ) | (11.8 | ) | (18.4 | ) | (12.3 | ) | |||||||||||
Assumption of plan assets | — | — | — | 14.9 | — | 14.9 | |||||||||||||||||
Currency exchange translation adjustments | — | — | (46.6 | ) | (14.6 | ) | (46.6 | ) | (14.6 | ) | |||||||||||||
Fair value of plan assets at end of year | $ | 86.3 | $ | 11.3 | $ | 259.3 | $ | 285.9 | $ | 345.6 | $ | 297.2 | |||||||||||
Funded status at end of year (PBO basis) | $ | (61.3 | ) | $ | (1.0 | ) | $ | (16.7 | ) | $ | (8.0 | ) | $ | (78.0 | ) | $ | (9.0 | ) | |||||
Amounts recognized in the Consolidated Balance Sheets: | |||||||||||||||||||||||
Noncurrent assets | $ | — | $ | — | $ | 21.2 | $ | 26.1 | $ | 21.2 | $ | 26.1 | |||||||||||
Current liabilities | (0.2 | ) | — | (1.0 | ) | (1.1 | ) | (1.2 | ) | (1.1 | ) | ||||||||||||
Noncurrent liabilities | (61.1 | ) | (1.0 | ) | (36.9 | ) | (33.0 | ) | (98.0 | ) | (34.0 | ) | |||||||||||
Net amount recognized | $ | (61.3 | ) | $ | (1.0 | ) | $ | (16.7 | ) | $ | (8.0 | ) | $ | (78.0 | ) | $ | (9.0 | ) | |||||
Amounts recognized in Accumulated Other Comprehensive Income: | |||||||||||||||||||||||
Prior service credit | — | — | (0.1 | ) | (0.2 | ) | (0.1 | ) | (0.2 | ) | |||||||||||||
Net amount recognized | $ | — | $ | — | $ | (0.1 | ) | $ | (0.2 | ) | $ | (0.1 | ) | $ | (0.2 | ) | |||||||
___________________________________________________________________________________________________________________
(1) | As discussed above, the beginning balances for 2016 include $113.4 million (U.S.) and $2.9 million (non-U.S.) related to certain Shared Plans that were accounted for as multiemployer plans prior to the Separation. |
(2) | The beginning balances for 2016 include $69.8 million (U.S.) and $1.6 million (non-U.S.) related to certain Shared Plans that were accounted for as multiemployer plans prior to the Separation. |
88
Defined Benefit Pension Plans | |||||||||||
(In millions) | U.S. | Non-U.S. | |||||||||
2016 | 2015 | 2016 | 2015 | ||||||||
Weighted Average Assumptions Used to Determine Benefit Obligations as of December 31: | |||||||||||
Discount rate | 4.27 | % | 4.40 | % | 2.42 | % | 3.24 | % | |||
Rate of compensation increase | 4.70 | % | NM | 3.78 | % | 3.60 | % | ||||
Weighted Average Assumptions Used to Determine Net Periodic Benefit Cost for Years Ended December 31: | |||||||||||
Discount rate | 4.53 | % | 3.95 | % | 3.26 | % | 3.39 | % | |||
Expected return on plan assets | 6.25 | % | 5.75 | % | 3.50 | % | 3.87 | % | |||
Rate of compensation increase | 4.70 | % | NM | 3.78 | % | 3.12 | % | ||||
___________________________________________________________________________________________________________________
NM Not meaningful
Components of Net Periodic Benefit Cost (Income) and Other Amounts Recognized in Other Comprehensive Loss (Income) | 2016 | 2015 | 2014 | ||||||||||||||||||||||||||||||||
(In millions) | U.S. | Non-U.S. | Other | U.S. | Non-U.S. | Other | U.S. | Non-U.S. | Other | ||||||||||||||||||||||||||
Net Periodic Benefit Cost (Income)(1) | |||||||||||||||||||||||||||||||||||
Service cost | $ | 6.1 | $ | 3.3 | $ | — | $ | 0.3 | $ | 3.1 | $ | — | $ | 0.2 | $ | 3.2 | $ | — | |||||||||||||||||
Interest cost | 4.7 | 7.8 | — | 0.5 | 9.2 | — | 0.5 | 12.0 | — | ||||||||||||||||||||||||||
Expected return on plan assets | (5.0 | ) | (8.6 | ) | — | (0.8 | ) | (11.0 | ) | — | (0.6 | ) | (12.9 | ) | — | ||||||||||||||||||||
Amortization of prior service cost (credit) | 0.1 | — | (0.1 | ) | 0.1 | — | — | 0.1 | — | — | |||||||||||||||||||||||||
Amortization of net deferred actuarial loss | — | — | 0.1 | — | — | — | — | — | — | ||||||||||||||||||||||||||
Gain on termination and curtailment of pension and other postretirement plans | — | (0.6 | ) | (0.2 | ) | — | — | — | — | — | — | ||||||||||||||||||||||||
Annual mark-to-market adjustment | 11.9 | 8.6 | — | 0.2 | 14.2 | — | 0.9 | (18.7 | ) | — | |||||||||||||||||||||||||
Net periodic benefit cost (income)(1) | $ | 17.8 | $ | 10.5 | $ | (0.2 | ) | $ | 0.3 | $ | 15.5 | $ | — | $ | 1.1 | $ | (16.4 | ) | $ | — | |||||||||||||||
Other Changes in Plan Assets and Benefit Obligations Recognized in Other Comprehensive Loss (Income) | |||||||||||||||||||||||||||||||||||
Amortization of prior service cost | $ | (0.1 | ) | $ | — | $ | — | $ | (0.1 | ) | $ | — | $ | — | $ | (0.1 | ) | $ | — | $ | — | ||||||||||||||
Assumption of prior service credit | — | — | — | — | (0.5 | ) | — | — | — | — | |||||||||||||||||||||||||
Total recognized in other comprehensive income | (0.1 | ) | — | — | (0.1 | ) | (0.5 | ) | — | (0.1 | ) | — | — | ||||||||||||||||||||||
Total recognized in net periodic benefit cost (income) and other comprehensive loss (income) | $ | 17.7 | $ | 10.5 | $ | (0.2 | ) | $ | 0.2 | $ | 15.0 | $ | — | $ | 1.0 | $ | (16.4 | ) | $ | — | |||||||||||||||
___________________________________________________________________________________________________________________
(1) | Includes expense that was allocated to Grace of $0.1 million and $0.4 million for the years ended December 31, 2015 and 2014, respectively. GCP allocates such expense excluding any mark-to-market adjustment. |
GCP will not amortize any prior service cost for the defined benefit pension plans from accumulated other comprehensive income into net periodic benefit cost (income) over the next fiscal year.
The accumulated benefit obligation for all defined benefit pension plans was approximately $388 million and $289 million as of December 31, 2016 and 2015, respectively.
89
Pension Plans with Underfunded or Unfunded Accumulated Benefit Obligation (In millions) | U.S. | Non-U.S. | Total | ||||||||||||||||||||
2016 | 2015 | 2016 | 2015 | 2016 | 2015 | ||||||||||||||||||
Projected benefit obligation | $ | 147.4 | $ | 12.1 | $ | 42.1 | $ | 40.4 | $ | 189.5 | $ | 52.5 | |||||||||||
Accumulated benefit obligation | 124.5 | 12.1 | 36.2 | 33.4 | 160.7 | 45.5 | |||||||||||||||||
Fair value of plan assets | 86.2 | 11.1 | 5.0 | 6.6 | 91.2 | 17.7 | |||||||||||||||||
Estimated Expected Future Benefit Payments Reflecting Future Service for the Fiscal Years Ending (In millions) | Pension Plans | Total Payments | ||||||
U.S. | Non-U.S.(1) | |||||||
Benefit Payments | Benefit Payments | |||||||
2017 | 5.5 | 11.2 | 16.7 | |||||
2018 | 5.9 | 11.6 | 17.5 | |||||
2019 | 6.3 | 11.3 | 17.6 | |||||
2020 | 7.1 | 11.6 | 18.7 | |||||
2021 | 7.9 | 11.7 | 19.6 | |||||
2022 - 2026 | 48.9 | 63.0 | 111.9 | |||||
___________________________________________________________________________________________________________________
(1) | Non-U.S. estimated benefit payments for 2017 and future periods have been translated at the applicable December 31, 2016 exchange rates. |
Discount Rate Assumption The assumed discount rate for pension plans reflects the market rates for high-quality corporate bonds currently available and is subject to change based on changes in overall market interest rates. For the U.S. qualified pension plans, the assumed weighted average discount rate of 4.27% as of December 31, 2016 was selected in consultation with independent actuaries based on a yield curve constructed from a portfolio of high quality bonds for which the timing and amount of cash outflows approximate the estimated payouts of the plan.
As of December 31, 2016 and 2015, the U.K. pension plan represented approximately 78% and 80%, respectively, of the benefit obligation of the non-U.S. pension plans. The assumed weighted average discount rate as of December 31, 2016, for the U.K., 2.06%, was selected in consultation with independent actuaries based on a yield curve constructed from a portfolio of sterling-denominated high quality bonds for which the timing and amount of cash outflows approximate the estimated payouts of the plan. The assumed discount rates for the remaining non-U.S. pension plans were determined based on the nature of the liabilities, local economic environments and available bond indices.
As of December 31, 2015, GCP changed its approach to measuring the service and interest cost components of the Company's defined benefit pension expense. Previously, GCP estimated service and interest costs using a single weighted-average discount rate derived from the same yield curve that was used to measure the projected benefit obligation. For 2016, GCP elected to measure service and interest costs by applying the specific spot rates along that yield curve to the plans' liability cash flows, which enhances the precision of the Company's measurement by aligning the timing of the plans' liability cash flows to the corresponding spot rates on the yield curve. GCP applied this change in accounting estimate prospectively for 2016, resulting in an immaterial impact to the Company’s financial condition and results of operations as of and for the year ended December 31, 2016.
Investment Guidelines for Advance-Funded Pension Plans The investment goal for the U.S. qualified pension plans subject to advance funding is to earn a long-term rate of return consistent with the related cash flow profile of the underlying benefit obligation. The plans are pursuing a well-defined risk management strategy designed to reduce investment risks as their funded status improves.
The U.S. qualified pension plans have adopted a diversified set of portfolio management strategies to optimize the risk reward profile of the plans:
• | Liability hedging portfolio: primarily invested in intermediate-term and long-term investment grade corporate bonds in actively managed strategies. |
90
• | Growth portfolio: invested in a diversified set of assets designed to deliver performance in excess of the underlying liabilities with controls regarding the level of risk. |
• | U.S. equity securities: the portfolio contains domestic equities that are passively managed to the S&P 500 and Russell 2000 benchmark and an allocation to an active portfolio benchmarked to the Russell 2000. |
• | Non-U.S. equity securities: the portfolio contains non-U.S. equities in an actively managed strategy. Currency futures and forward contracts may be held for the sole purpose of hedging existing currency risk in the portfolio. |
• | Other investments: may include (a) high yield bonds: fixed income portfolio of securities below investment grade; and (b) global real estate securities: portfolio of diversified REIT and other liquid real estate related securities. These portfolios combine income generation and capital appreciation opportunities from developed markets globally. |
• | Liquidity portfolio: invested in short-term assets intended to pay periodic plan benefits and expenses. |
For 2016, the expected long-term rate of return on assets for the U.S. qualified pension plans was 6.25%.
The expected return on plan assets for the U.S. qualified pension plans for 2016 was selected, in consultation with GCP's independent actuaries, using an expected return model. The model determines the weighted average return for an investment portfolio based on the target asset allocation and expected future returns for each asset class, which were developed using a building block approach based on observable inflation, available interest rate information, current market characteristics and historical results.
The target allocation of investment assets at December 31, 2016 and the actual allocation at December 31, 2016 and 2015 for GCP's U.S. qualified pension plans were as follows:
Target Allocation | Percentage of Plan Assets December 31, | |||||||
U.S. Qualified Pension Plans Asset Category | 2016 | 2016 | 2015 | |||||
U.S. equity securities | 25 | % | 25 | % | 11 | % | ||
Non-U.S. equity securities | 11 | % | 15 | % | 7 | % | ||
Short-term debt securities | 1 | % | 1 | % | 6 | % | ||
Intermediate-term debt securities | 5 | % | 4 | % | 28 | % | ||
Long-term debt securities | 50 | % | 50 | % | 46 | % | ||
Other investments | 8 | % | 5 | % | 2 | % | ||
Total | 100 | % | 100 | % | 100 | % | ||
91
The following tables present the fair value hierarchy for GCP's proportionate share of the U.S. qualified pension plan assets measured at fair value, which are held in a trust by GCP, as of December 31, 2016 and 2015.
December 31, 2016 | |||||||||||||||
(In millions) | Total | Quoted Prices in Active Markets for Identical Assets or Liabilities (Level 1) | Significant Other Observable Inputs (Level 2) | Significant Unobservable Inputs (Level 3) | |||||||||||
U.S. equity group trust funds | $ | 21.8 | $ | — | $ | 21.8 | $ | — | |||||||
Non-U.S. equity group trust funds | 13.1 | — | 13.1 | — | |||||||||||
Corporate bond group trust funds—intermediate-term | 3.2 | — | 3.2 | — | |||||||||||
Corporate bond group trust funds—long-term | 42.7 | — | 42.7 | — | |||||||||||
Other fixed income group trust funds | 4.3 | — | 4.3 | — | |||||||||||
Common/collective trust funds | 1.2 | — | 1.2 | — | |||||||||||
Annuity and immediate participation contracts | — | — | — | — | |||||||||||
Total Assets | $ | 86.3 | $ | — | $ | 86.3 | $ | — | |||||||
December 31, 2015 | |||||||||||||||
(In millions) | Total | Quoted Prices in Active Markets for Identical Assets or Liabilities (Level 1) | Significant Other Observable Inputs (Level 2) | Significant Unobservable Inputs (Level 3) | |||||||||||
U.S. equity group trust funds | $ | 1.2 | $ | — | $ | 1.2 | $ | — | |||||||
Non-U.S. equity group trust funds | 0.8 | — | 0.8 | — | |||||||||||
Corporate bond group trust funds—intermediate-term | 3.1 | — | 3.1 | — | |||||||||||
Corporate bond group trust funds—long-term | 5.2 | — | 5.2 | — | |||||||||||
Other fixed income group trust funds | 0.2 | — | 0.2 | — | |||||||||||
Common/collective trust funds | 0.6 | — | 0.6 | — | |||||||||||
Annuity and immediate participation contracts | 0.2 | — | 0.2 | — | |||||||||||
Total Assets | $ | 11.3 | $ | — | $ | 11.3 | $ | — | |||||||
Non-U.S. pension plans accounted for approximately 75% and 96% of total global pension assets at December 31, 2016 and 2015, respectively. Each of these plans, where applicable, follows local requirements and regulations. Some of the local requirements include the establishment of a local pension committee, a formal statement of investment policy and procedures and routine valuations by plan actuaries.
The target allocation of investment assets for non-U.S. pension plans varies depending on the investment goals of the individual plans. The plan assets of the U.K. pension plan represent approximately 91% of the total non-U.S. pension plan assets at December 31, 2016 and 2015. In determining the expected rate of return for the U.K. pension plan, the trustees' strategic investment policy has been considered together with long-term historical returns and investment community forecasts for each asset class. The expected return by sector has been combined with the actual asset allocation to determine the 2016 expected long-term return assumption of 3.24%.
92
The target allocation of investment assets at December 31, 2016 and the actual allocation at December 31, 2016 and 2015, for the U.K. pension plan are as follows:
Target Allocation | Percentage of Plan Assets December 31, | |||||||
United Kingdom Pension Plan Asset Category | 2016 | 2016 | 2015 | |||||
Diversified growth funds | 9 | % | 8 | % | 10 | % | ||
U.K. gilts | 31 | % | 31 | % | 29 | % | ||
U.K. corporate bonds | 10 | % | 11 | % | 8 | % | ||
Insurance contracts | 50 | % | 50 | % | 53 | % | ||
Total | 100 | % | 100 | % | 100 | % | ||
The plan assets for the other countries represent approximately 9% in the aggregate of total non-U.S. pension plan assets at December 31, 2016 and 2015, respectively.
The following table presents the fair value hierarchy for the non-U.S. pension plan assets measured at fair value as of December 31, 2016:
Fair Value Measurements at December 31, 2016, Using | |||||||||||||||
(In millions) | Total | Quoted Prices in Active Markets for Identical Assets or Liabilities (Level 1) | Significant Other Observable Inputs (Level 2) | Significant Unobservable Inputs (Level 3) | |||||||||||
Common/collective trust funds | $ | 130.1 | $ | — | $ | 130.1 | $ | — | |||||||
Government and agency securities | 1.8 | — | 1.8 | — | |||||||||||
Corporate bonds | 8.1 | — | 8.1 | — | |||||||||||
Insurance contracts and other investments(1) | 116.5 | — | — | 116.5 | |||||||||||
Cash | 2.8 | 2.8 | — | — | |||||||||||
Total Assets | $ | 259.3 | $ | 2.8 | $ | 140.0 | $ | 116.5 | |||||||
___________________________________________________________________________________________________________________
(1) | In October 2015, the trustees of the U.K. pension plan entered into a contract with an insurance company to secure the benefits for current retirees and hedge the risk of future inflation and changes in longevity with a buy-in contract. At December 31, 2016, the fair value of the insurance contract has been determined using a discounted cash flow approach that maximizes observable inputs, such as current yields on similar instruments but includes adjustments for certain risks that may not be observable, such as credit and liquidity risks. |
The following table presents a summary of the changes in the fair value of the plans' Level 3 assets for the year ended December 31, 2016.
(In millions) | Insurance Contracts | ||
Balance, December 31, 2015 | $ | 138.5 | |
Actual return on plan assets relating to assets still held at year-end | 10.0 | ||
Purchases, sales and settlements, net | — | ||
Transfers out for benefit payments | (7.7 | ) | |
Currency exchange translation adjustments | (24.3 | ) | |
Balance, December 31, 2016 | $ | 116.5 | |
93
The following table presents the fair value hierarchy for the non-U.S. pension plan assets measured at fair value as of December 31, 2015.
Fair Value Measurements at December 31, 2015, Using | |||||||||||||||
(In millions) | Total | Quoted Prices in Active Markets for Identical Assets or Liabilities (Level 1) | Significant Other Observable Inputs (Level 2) | Significant Unobservable Inputs (Level 3) | |||||||||||
Common/collective trust funds | $ | 142.3 | $ | — | $ | 142.3 | $ | — | |||||||
Government and agency securities | 1.3 | — | 1.3 | — | |||||||||||
Corporate bonds | 1.1 | — | 1.1 | — | |||||||||||
Insurance contracts and other investments(1) | 140.6 | — | 2.1 | 138.5 | |||||||||||
Cash | 0.6 | 0.6 | — | — | |||||||||||
Total Assets | $ | 285.9 | $ | 0.6 | $ | 146.8 | $ | 138.5 | |||||||
___________________________________________________________________________________________________________________
(1) | In October 2015, the trustees of the U.K. pension plan entered into a contract with an insurance company to secure the benefits for current retirees and hedge the risk of future inflation and changes in longevity with a buy-in contract. At December 31, 2015, the fair value of the insurance contract has been determined using a discounted cash flow approach that maximizes observable inputs, such as current yields on similar instruments but includes adjustments for certain risks that may not be observable, such as credit and liquidity risks. |
Plan Contributions and Funding GCP intends to satisfy its funding obligations under the U.S. qualified pension plans and to comply with all of the requirements of the Employee Retirement Income Security Act of 1974, as amended ("ERISA"). For ERISA purposes, funded status is calculated on a different basis than under GAAP. In 2016, GCP made an accelerated contribution to the trusts that hold assets of the U.S. qualified pension plans of approximately $1 million. Based on the U.S. qualified pension plans' status as of December 31, 2016, there are no minimum requirements under ERISA for 2017.
GCP intends to fund non-U.S. pension plans based on applicable legal requirements as well as actuarial and trustee recommendations. GCP expects to contribute approximately $3 million to non-U.S. pension plans in 2017.
Defined Contribution Retirement Plan As part of the Separation, GCP established a defined contribution retirement plan for its employees in the United States, similar in design to the Grace defined contribution retirement plan. This plan is qualified under section 401(k) of the U.S. tax code. Currently, GCP contributes an amount equal to 100% of employee contributions, up to 6% of an individual employee's salary or wages. GCP's cost included in selling, general and administrative expenses related to this benefit plan for the year ended December 31, 2016 was $4.6 million, compared with GCP's allocated cost related to this benefit plan of $4.8 million and $4.5 million for the years ending December 31, 2015 and 2014, respectively.
94
8. Other Balance Sheet Accounts
(In millions) | December 31, 2016 | December 31, 2015 | |||||
Other Current Assets: | |||||||
Non-trade receivables | $ | 27.8 | $ | 25.5 | |||
Prepaid expenses | 13.4 | 8.9 | |||||
Income tax receivable(2) | 10.6 | 4.4 | |||||
Marketable securities | — | 0.1 | |||||
Total other current assets | $ | 51.8 | $ | 38.9 | |||
(In millions) | December 31, 2016 | December 31, 2015 | |||||
Other Current Liabilities: | |||||||
Customer volume rebates | $ | 34.8 | $ | 33.5 | |||
Accrued compensation(1) | 36.3 | 27.1 | |||||
Income tax payable(2) | 8.0 | 23.3 | |||||
Accrued interest | 20.8 | 3.9 | |||||
Pension liabilities | 1.2 | 1.1 | |||||
Other accrued liabilities | 39.9 | 36.6 | |||||
Total other current liabilities | $ | 141.0 | $ | 125.5 | |||
(1) | Accrued compensation in the table above includes salaries and wages as well as estimated current amounts due under the annual and long-term incentive programs. |
(2) | Income tax items above do not include amounts due from/to Grace. |
9. Commitments and Contingent Liabilities
Purchase Commitments GCP uses purchase commitments to ensure supply and to minimize the volatility of certain key raw materials including lignins, polycarboxylates, amines and other materials. Such commitments are for quantities that GCP fully expects to use in its normal operations.
Guarantees and Indemnification Obligations GCP is a party to many contracts containing guarantees and indemnification obligations. These contracts primarily consist of:
• | Product warranties with respect to certain products sold to customers in the ordinary course of business. These warranties typically provide that products will conform to specifications. GCP accrues a general warranty liability at the time of sale based on historical experience and on a transaction-specific basis according to individual facts and circumstances. Both the liability and annual expense related to product warranties are immaterial to the Consolidated Financial Statements. |
• | Performance guarantees offered to customers. GCP has not established a liability for these arrangements based on past performance. |
• | Contracts providing for the sale of a former business unit or product line in which GCP has agreed to indemnify the buyer against liabilities arising prior to the closing of the transaction, including environmental liabilities. |
• | The Tax Sharing Agreement, which may require GCP, in certain circumstances, to indemnify Grace if the Separation, together with certain related transactions, does not qualify under Section 355 and certain other relevant provisions of the Internal Revenue Code (the "Code"). If GCP is required to indemnify Grace under the Tax Sharing Agreement, it could be subject to significant tax liabilities. |
95
Environmental Matters GCP is subject to loss contingencies resulting from extensive and evolving federal, state, local and foreign environmental laws and regulations relating to the generation, storage, handling, discharge, disposition and stewardship of hazardous waste and other materials. GCP accrues for anticipated costs associated with response efforts where an assessment has indicated that a probable liability has been incurred and the cost can be reasonably estimated. As of December 31, 2016, GCP did not have any material environmental liabilities.
GCP's environmental liabilities are reassessed whenever circumstances become better defined or response efforts and their costs can be better estimated. These liabilities are evaluated based on currently available information, including the progress of remedial investigations at each site, the current status of discussions with regulatory authorities regarding the method and extent of remediation at each site, existing technology, prior experience in contaminated site remediation and the apportionment of costs among potentially responsible parties.
Financial Assurances Financial assurances have been established for a variety of purposes, including insurance and environmental matters and other matters. At December 31, 2016, GCP had gross financial assurances issued and outstanding of approximately $9 million, composed of standby letters of credit.
Lawsuits and Investigations From time to time, GCP and its subsidiaries are parties to, or targets of, lawsuits, claims, investigations and proceedings which are managed and defended in the ordinary course of business. While GCP is unable to predict the outcome of these matters, it does not believe, based upon currently available facts, that the ultimate resolution of any of such pending matters will have a material adverse effect on its overall financial condition, results of operations or cash flows.
Accounting for Contingencies Although the outcome of each of the matters discussed above cannot be predicted with certainty, GCP has assessed its risk and has made accounting estimates and disclosures as required under GAAP.
At December 31, 2016, minimum future non-cancelable payments for operating leases are summarized below.
(In millions) | |||
2017 | $ | 11.2 | |
2018 | 8.3 | ||
2019 | 5.3 | ||
2020 | 3.6 | ||
2021 | 2.5 | ||
Thereafter | 13.6 | ||
$ | 44.5 | ||
GCP's rental expense for operating leases was $15.4 million, $21.6 million and $22.6 million in 2016, 2015 and 2014, respectively.
10. Restructuring and Repositioning Expenses
Restructuring Expenses and Asset Impairments
GCP's Board of Directors approves all major restructuring programs that may involve the discontinuance of significant product lines or the shutdown of significant facilities. From time to time, GCP takes additional restructuring actions, including involuntary terminations that are not part of a major program. GCP accounts for these costs, which are reflected in "Restructuring expenses and asset impairments" in its Consolidated Statements of Operations, in the period that the related liabilities are incurred.
In 2016, GCP incurred 1.9 million ($1.2 million in SCC and $0.7 million in SBM) of restructuring expenses comprised of severance-related costs associated with the Separation, as well as costs incurred for plant closures during the fourth quarter.
96
In 2015, GCP incurred restructuring expenses of $11.5 million ($6.5 million in SCC, $3.2 million in SBM and $1.8 million in Darex), which were the result of changes in the business environment and the business structure.
During 2014, GCP's concrete production management systems product line was not meeting performance expectations, resulting in reduced cash flow and increasing obligations. GCP evaluated its concrete production management systems product line long-lived assets for impairment. After reviewing undiscounted cash flow information, GCP determined that the fair value of these long-lived assets was less than their carrying value and recorded an impairment charge of $9.8 million ($3.8 million of equipment, $5.5 million of technology and $0.5 million of intellectual property). The remaining fair value of these assets subsequent to impairment was $8.2 million ($5.6 million of equipment, $2.3 million of technology and $0.3 million of intellectual property). During 2014, GCP also recorded an impairment charge of $4.5 million related to an unconsolidated investment. The remaining fair value of this investment subsequent to impairment was zero.
GCP had restructuring liabilities of $1.1 million, $1.4 million and $0.8 million as of December 31, 2016, 2015 and 2014, respectively, related to severance actions taken during the years then ended. Substantially all remaining costs related to the 2015 and 2016 programs are expected to be paid by December 31, 2017.
Year Ended December 31, | |||||||||||
Restructuring Expenses and Asset Impairments (In millions) | 2016 | 2015 | 2014 | ||||||||
Severance and other | $ | 1.9 | $ | 11.5 | $ | 4.0 | |||||
Asset impairments | — | 0.1 | 14.3 | ||||||||
Total restructuring expenses and asset impairments | $ | 1.9 | $ | 11.6 | $ | 18.3 | |||||
December 31, | |||||||||||
Restructuring Liability (In millions) | 2016 | 2015 | 2014 | ||||||||
Beginning balance | $ | 1.4 | $ | 0.8 | $ | 1.1 | |||||
Accruals for severance and other costs | 1.9 | 11.5 | 4.0 | ||||||||
Payments | (3.6 | ) | (10.9 | ) | (4.3 | ) | |||||
Impact of foreign currency and other | 1.4 | — | — | ||||||||
Ending balance | $ | 1.1 | $ | 1.4 | $ | 0.8 | |||||
97
Repositioning Expenses
Post-Separation, GCP has incurred expenses related to its transition to a stand-alone public company. The Company expects to incur these repositioning expenses, ranging from $18.0 million to $20.0 million, within 18 months of the Separation. Repositioning expenses primarily relate to the following:
• | accounting, tax, legal and other professional costs pertaining to the Separation and establishment as a stand-alone public company; |
• | costs relating to information technology systems and marketing expense for repackaging and re-branding; |
• | employee-related costs that would not be incurred absent the Separation primarily relating to compensation, benefits, retention bonuses related to new or transitioning employees; and |
• | recruitment and relocation costs associated with hiring and relocating employees. |
Due to the scope and complexity of these activities, the range of estimated repositioning expenses could increase or decrease and the timing of incurrence could change.
For the year ended December 31, 2016, GCP incurred repositioning expenses as presented below.
Repositioning Expenses (In millions) | 2016 | ||
Professional fees | $ | 7.8 | |
Software and IT implementation fees | 3.0 | ||
Employee-related costs | 4.5 | ||
Total repositioning expenses | $ | 15.3 | |
GCP accounts for these costs, which are reflected in "Repositioning expenses" in the accompanying Consolidated Statement of Operations, in the period incurred. Substantially all of these costs have been or are expected to be settled in cash. Total cash payments for the year ended December 31, 2016 were $17.7 million for professional fees and employee-related costs, $6.9 million for capital expenditures and $2.5 million for taxes. GCP did not incur any repositioning expenses for the years ended December 31, 2015 and 2014.
11. Other Comprehensive Loss
The following tables present the pre-tax, tax and after-tax components of GCP's other comprehensive loss for the years ended December 31, 2016, 2015 and 2014.
Year Ended December 31, 2016 | Pre-Tax Amount | Tax (Expense)/Benefit | After-Tax Amount | ||||||||
(In millions) | |||||||||||
Defined benefit pension and other postretirement plans: | |||||||||||
Amortization of net prior service credit | $ | (0.1 | ) | $ | — | $ | (0.1 | ) | |||
Amortization of net actuarial gain | 0.1 | — | 0.1 | ||||||||
Assumption of net prior service credit | 1.2 | (0.4 | ) | 0.8 | |||||||
Assumption of net actuarial loss | (1.1 | ) | 0.4 | (0.7 | ) | ||||||
Other changes in funded status | (0.1 | ) | — | (0.1 | ) | ||||||
Benefit plans, net | — | — | — | ||||||||
Currency translation adjustments | (19.9 | ) | — | (19.9 | ) | ||||||
Other comprehensive loss attributable to GCP shareholders | $ | (19.9 | ) | $ | — | $ | (19.9 | ) | |||
98
Year Ended December 31, 2015 | Pre-Tax Amount | Tax (Expense)/Benefit | After-Tax Amount | ||||||||
(In millions) | |||||||||||
Defined benefit pension and other postretirement plans: | |||||||||||
Amortization of net prior service cost included in net periodic benefit cost | $ | 0.1 | $ | (0.1 | ) | $ | — | ||||
Assumption of net prior service credit | 0.5 | (0.1 | ) | 0.4 | |||||||
Benefit plans, net | 0.6 | (0.2 | ) | 0.4 | |||||||
Currency translation adjustments | (62.3 | ) | — | (62.3 | ) | ||||||
Gain from hedging activities | 0.4 | (0.2 | ) | 0.2 | |||||||
Other comprehensive loss attributable to GCP shareholders | $ | (61.3 | ) | $ | (0.4 | ) | $ | (61.7 | ) | ||
Year Ended December 31, 2014 (In millions) | Pre-Tax Amount | Tax (Expense)/Benefit | After-Tax Amount | ||||||||
Defined benefit pension and other postretirement plans: | |||||||||||
Amortization of net prior service cost included in net periodic benefit cost | $ | 0.1 | $ | — | $ | 0.1 | |||||
Benefit plans, net | 0.1 | — | 0.1 | ||||||||
Currency translation adjustments | (41.4 | ) | — | (41.4 | ) | ||||||
Gain from hedging activities | 0.2 | — | 0.2 | ||||||||
Other than temporary impairment of investment | 0.8 | — | 0.8 | ||||||||
Loss on securities available for sale | (0.1 | ) | — | (0.1 | ) | ||||||
Other comprehensive loss attributable to GCP shareholders | $ | (40.4 | ) | $ | — | $ | (40.4 | ) | |||
The following tables present the changes in accumulated other comprehensive income (loss), net of tax, for the years ended December 31, 2016, 2015 and 2014.
Year Ended December 31, 2016 (In millions) | Defined Benefit Pension and Other Postretirement Plans | Currency Translation Adjustments | (Loss) Gain from Hedging Activities | Unrealized (Loss) Gain on Investment | Gain (Loss) on Securities Available for Sale | Total | ||||||||||||||||||
Beginning balance | $ | 0.1 | $ | (127.8 | ) | $ | — | $ | — | $ | — | $ | (127.7 | ) | ||||||||||
Other comprehensive loss before reclassifications | — | (19.9 | ) | (1.2 | ) | — | — | (21.1 | ) | |||||||||||||||
Amounts reclassified from accumulated other comprehensive income | — | — | 1.2 | — | — | 1.2 | ||||||||||||||||||
Net current-period other comprehensive loss | — | (19.9 | ) | — | — | — | (19.9 | ) | ||||||||||||||||
Ending balance | $ | 0.1 | $ | (147.7 | ) | $ | — | $ | — | $ | — | $ | (147.6 | ) | ||||||||||
99
Year Ended December 31, 2015 (In millions) | Defined Benefit Pension and Other Postretirement Plans | Currency Translation Adjustments | (Loss) Gain from Hedging Activities | Unrealized (Loss) Gain on Investment | Gain (Loss) on Securities Available for Sale | Total | |||||||||||||||||
Beginning balance | $ | (0.3 | ) | $ | (65.5 | ) | $ | (0.2 | ) | $ | — | $ | — | $ | (66.0 | ) | |||||||
Other comprehensive income (loss) before reclassifications | 0.4 | (62.3 | ) | 0.2 | — | — | (61.7 | ) | |||||||||||||||
Amounts reclassified from accumulated other comprehensive income | — | — | — | — | — | — | |||||||||||||||||
Net current-period other comprehensive income (loss) | 0.4 | (62.3 | ) | 0.2 | — | — | (61.7 | ) | |||||||||||||||
Ending balance | $ | 0.1 | $ | (127.8 | ) | $ | — | $ | — | $ | — | $ | (127.7 | ) | |||||||||
Year Ended December 31, 2014 (In millions) | Defined Benefit Pension and Other Postretirement Plans | Currency Translation Adjustments | (Loss) Gain from Hedging Activities | Unrealized (Loss) Gain on Investment | Gain (Loss) on Securities Available for Sale | Total | |||||||||||||||||
Beginning balance | $ | (0.4 | ) | $ | (24.1 | ) | $ | (0.4 | ) | $ | (0.8 | ) | $ | 0.1 | $ | (25.6 | ) | ||||||
Other comprehensive loss before reclassifications | — | (41.4 | ) | (0.4 | ) | — | (0.7 | ) | (42.5 | ) | |||||||||||||
Amounts reclassified from accumulated other comprehensive income | 0.1 | — | 0.6 | 0.8 | 0.6 | 2.1 | |||||||||||||||||
Net current-period other comprehensive income (loss) | 0.1 | (41.4 | ) | 0.2 | 0.8 | (0.1 | ) | (40.4 | ) | ||||||||||||||
Ending balance | $ | (0.3 | ) | $ | (65.5 | ) | $ | (0.2 | ) | $ | — | $ | — | $ | (66.0 | ) | |||||||
GCP is a global enterprise operating in approximately 35 countries with local currency generally deemed to be the functional currency for accounting purposes. The currency translation adjustments reflect translation of the balance sheets valued in local currencies to the U.S. dollar as of the end of each period presented and translation of revenues and expenses at average exchange rates for each period presented.
See Note 7 to the Consolidated Financial Statements for a discussion of pension plans and other postretirement benefit plans.
12. Related Party Transactions and Transactions with Grace
Related Parties
All contracts with related parties are at rates and terms that GCP believes are comparable with those that could be entered into with independent third parties. Subsequent to the Separation, transactions with Grace represent third-party transactions.
100
Allocation of General Corporate Expenses
Prior to the Separation, the financial statements included expense allocations for certain functions provided by Grace as well as other Grace employees not solely dedicated to GCP, including, but not limited to, general corporate expenses related to finance, legal, information technology, human resources, communications, ethics and compliance, shared services, employee benefits and incentives and stock-based compensation. These expenses were allocated to GCP on the basis of direct usage when identifiable, with the remainder allocated on the basis of revenue, headcount or other measures. Between January 1, 2016 and the Separation, GCP was allocated $2.0 million of general corporate expenses, which is primarily included within "Selling, general and administrative expenses" in the accompanying Consolidated Statement of Operations. For the years ended December 31, 2015 and 2014, Grace allocated $54.8 million and $52.1 million, respectively, of general corporate expenses to GCP.
The expense allocations from Grace prior to the Separation included costs associated with defined benefit pension and other postretirement benefit plans (the “Shared Plans”) sponsored by Grace in which certain of GCP's employees participated. GCP accounted for such Shared Plans as multiemployer benefit plans. Accordingly, GCP did not record an asset or liability to recognize the funded status of the Shared Plans. As part of the Separation, Grace has split certain Shared Plans and transferred the assets and liabilities of such plans related to GCP employees to GCP. The expense allocations were determined on a basis that GCP considered to be a reasonable reflection of the utilization of or benefit received by GCP for the services provided by Grace. The allocations may not, however, reflect the expense GCP would have incurred as an independent company for the periods presented.
Transition Services Agreement
In connection with the Separation, the Company entered into a transition services agreement pursuant to which GCP and Grace provide various services to each other on a temporary, transitional basis.
The services provided by Grace to GCP for periods prior to the Separation primarily included information technology, treasury, tax administration, accounting, financial reporting and human resources. Following the Separation, Grace has continued to provide some of these services on a transitional basis, which the Company generally expects to occur for a period of up to 18 months from the date of Separation.
Tax Sharing Agreement
The Tax Sharing Agreement governs the parties’ respective rights, responsibilities and obligations with respect to tax liabilities and benefits, tax attributes, the preparation and filing of tax returns, the control of audits and other tax proceedings and other matters regarding taxes. In general and subject to the terms of the Tax Sharing Agreement, GCP is responsible for all U.S. federal, state and foreign taxes (and any related interest, penalties or audit adjustments) reportable on a GCP separate return (a return that does not include Grace or any of its subsidiaries); and Grace is responsible for all U.S. federal, state and foreign income taxes (and any related interest, penalties or audit adjustments) reportable on a consolidated, combined or unitary return that includes Grace or any of its subsidiaries and GCP or any of its subsidiaries. As of the balance sheet date, GCP has included $3.7 million of indemnified receivables in other assets.
In addition, the Tax Sharing Agreement imposes certain restrictions on GCP and its subsidiaries (including restrictions on share issuances, business combinations, sales of assets and similar transactions) that are designed to preserve the qualification of the Distribution, together with certain related transactions, under Section 355 and certain other relevant provisions of the Code. The Tax Sharing Agreement provides special rules that allocate tax liabilities in the event the Distribution, together with certain related transactions, does not so qualify. In general, under the Tax Sharing Agreement, each party is expected to be responsible for any taxes imposed on and certain related amounts payable by, GCP or Grace that arise from the failure of the Distribution and certain related transactions, to qualify under Section 355 and certain other relevant provisions of the Code, to the extent that the failure to so qualify is attributable to actions, events or transactions relating to such party’s respective stock, assets or business, or a breach of the relevant representations or covenants made by such party in the Tax Sharing Agreement.
101
Parent Company Equity
Net transfers to parent are included within "Net parent investment" on the Consolidated Statements of Stockholders' (Deficit) Equity. The components of the "Net transfer to parent" as of December 31, 2016, 2015 and 2014 are presented below.
Year Ended December 31, | |||||||||||
(In millions) | 2016 | 2015 | 2014 | ||||||||
Cash pooling and general financing activities | $ | (688.0 | ) | $ | (306.1 | ) | $ | (259.7 | ) | ||
GCP expenses funded by parent | 6.6 | 54.6 | 63.4 | ||||||||
Corporate costs allocations | 2.0 | 54.8 | 52.1 | ||||||||
Provision for income taxes | 4.3 | 84.3 | 55.6 | ||||||||
Total net transfers to parent | (675.1 | ) | (112.4 | ) | (88.6 | ) | |||||
Share-based compensation | — | (3.7 | ) | (4.1 | ) | ||||||
Other, net | (89.5 | ) | (4.5 | ) | (7.5 | ) | |||||
Transfers to parent, net per Consolidated Statements of Cash Flows | $ | (764.6 | ) | $ | (120.6 | ) | $ | (100.2 | ) | ||
Other, net for the year ended December 31, 2016, amounted to $89.5 million and includes primarily the non-cash transfer from parent of approximately $44 million of net pension liabilities, approximately $23 million of fixed assets and the non-cash settlement of approximately $42 million of related-party debt, deferred tax items, and other items.
As discussed in Note 5, GCP used proceeds from the Notes and Credit Facilities to fund a distribution to Grace in an amount of $750.0 million related to the Separation. This distribution is reflected as a component of transfers to parent in the table above.
13. Stock Incentive Plans
GCP has provided certain key employees equity awards in the form of stock options, PBUs and RSUs under the GCP 2016 Stock Incentive Plan, which was adopted at Separation. Certain employees and members of the Board of Directors are eligible to receive stock-based compensation, including stock, stock options, RSUs and PBUs.
Prior to the Separation, GCP employees participated in the Grace share-based compensation plans. For periods prior to the Separation, the following sections disclose certain activity of these awards granted to direct employees of GCP. Awards to Grace’s corporate staff that provided services to GCP are excluded from the following disclosures; however, the expense for those awards is included in expense allocated to GCP for certain corporate functions historically performed by Grace.
In accordance with the Employee Matters Agreement, previously outstanding stock-based compensation awards granted under Grace’s equity compensation programs prior to the Separation and held by certain executives and employees of GCP and Grace were adjusted to reflect the impact of the Separation on these awards. To preserve the aggregate intrinsic value of Grace awards held prior to the Separation, as measured immediately before and immediately after the Separation, each holder of Grace stock-based compensation awards generally received an adjusted award consisting of either (i) both a stock-based compensation award denominated in Grace equity as it existed subsequent to the Separation and a stock-based compensation award denominated in GCP equity or (ii) solely a stock-based compensation award denominated in the equity of the company at which the person was employed following the Separation. In the Separation, the determination as to which type of adjustment applied to a holder’s previously outstanding Grace award was based upon the type of stock-based compensation award that was to be adjusted and the date on which the award was originally granted under the Grace equity compensation programs prior to the Separation. Adjusted awards consisting of stock-based compensation awards denominated in GCP equity are considered issued under the GCP 2016 Stock Incentive Plan. These adjusted awards generally will be subject to the same vesting conditions and other terms that applied to the original Grace award to which these adjusted awards relate, before the Separation.
102
Under the Employee Matters Agreement, GCP is obligated to settle all of the stock-based compensation awards denominated in GCP equity, regardless of whether the holders are employees of GCP or Grace. Likewise, Grace is obligated to settle all of the stock-based compensation awards denominated in Grace shares, regardless of whether the holders are employees of GCP or Grace. As a result, GCP has recorded a liability for cash-settled awards held by Grace employees. The adjustment of the original Grace awards that resulted in the issuance of GCP stock-based compensation awards resulted in an immaterial charge in the first quarter of 2016.
In accordance with certain provisions of the GCP 2016 Stock Incentive Plan, GCP repurchases shares issued to certain holders of GCP awards in order to fulfill statutory tax withholding requirements for the employee. In the year ended December 31, 2016, GCP repurchased approximately 112,205 shares under these provisions. These purchases are reflected as "Treasury stock purchased under 2016 Stock Incentive Plan" in the Consolidated Statements of (Deficit) Equity.
As of December 31, 2016, 1,637,301 shares of common stock were available for issuance under the GCP 2016 Stock Incentive Plan.
Total stock-based compensation cost included in "Selling, general and administrative expenses" in the Consolidated Statements of Operations is $7.5 million, $4.7 million and $4.8 million for the years ended December 31, 2016, 2015 and 2014, respectively. Stock-based compensation expense prior to the Separation was allocated to GCP based on the portion of Grace’s equity compensation programs in which GCP employees participated.
The total income tax benefit recognized for stock‐based compensation arrangements was $4.8 million, $1.7 million and $1.8 million for the years ended December 31, 2016, 2015 and 2014, respectively. The Company early adopted ASU 2016-9 during 2016 and as a result recognized an additional $2.0 million of tax benefit for the year ended December 31, 2016.
Stock Options
Stock options are non-qualified and are set at exercise prices not less than 100% of the market value on the date of grant (market value is the average of the high price and low price from that trading day). Stock option awards that relate to Grace stock options originally granted prior to the Separation have a contractual term of five years from the original date of grant. Stock option awards granted post-Separation have a contractual term of seven years from the original date of grant. Generally, stock options vest in substantially equal amounts each year over three years from the date of grant.
GCP and Grace, to the extent awards were granted prior to the Separation, value stock options using the Black-Scholes option pricing model, which was developed for use in estimating the fair value of traded options. The risk-free rate is based on the U.S. Treasury yield curve published as of the grant date, with maturities approximating the expected term of the options. GCP and Grace estimate the expected term of the options according to the simplified method as allowed by ASC 718-20, Awards Classified as Equity, whereby the average between the vesting period and contractual term is used. GCP estimated the expected volatility using an industry peer group.
The following summarizes GCP's and Grace's assumptions for estimating the fair value of stock options granted during 2016, 2015 and 2014:
Year Ended December 31, | |||||
Assumptions used to calculate expense for stock option | 2016 | 2015 | 2014 | ||
Risk-free interest rate | 0.93 - 1.24% | 1.3% | 1.25% | ||
Average life of options (years) | 4 - 5 | 3 - 4 | 3 - 4 | ||
Volatility | 29.6 – 33.2% | 23.0 – 27.2% | 28.2 – 28.7% | ||
Dividend yield | — | — | — | ||
Average fair value per stock option | $4.89 | $18.43 | $21.08 | ||
103
The following table sets forth information relating to such options denominated in GCP stock during 2016.
Stock Option Activity | Number Of Shares (in thousands) | Weighted Average Exercise Price | Weighted Average Remaining Contractual Term (years) | Aggregated Intrinsic Value (in thousands) | ||||||||
Outstanding, December 31, 2015 | — | $ | — | |||||||||
Converted on February 3, 2016 | 2,236 | 14.36 | ||||||||||
Options exercised | 811 | 10.08 | ||||||||||
Options forfeited | 52 | 16.58 | ||||||||||
Options expired | — | — | ||||||||||
Options granted | 749 | 17.23 | ||||||||||
Outstanding, December 31, 2016 | 2,122 | 16.92 | 3.57 | $ | 20,748 | |||||||
Exercisable December 31, 2016 | 895 | $ | 15.43 | 1.75 | $ | 20,748 | ||||||
The aggregate intrinsic values in the table above represent the total pre-tax intrinsic value (the difference between GCP's closing stock price on the last trading day of December 31, 2016 and the exercise price, multiplied by the number of in-the-money options) that would have been received by the option holders had all option holders exercised their in-the-money options at period end. The amount changes based on the fair market value of GCP's stock. The intrinsic value of all options exercised in the years ended December 31, 2016, 2015 2014 was $9.3 million, $8.4 million and $3.1 million, respectively.
Total unrecognized stock-based compensation expense for stock options outstanding at December 31, 2016, was $1.6 million and the weighted-average period over which this expense will be recognized is approximately one year.
Restricted Stock Units and Performance Based Units
Upon Separation, certain previously outstanding RSUs and PBUs granted under Grace's equity compensation programs prior to the Separation were adjusted, in accordance with the Employee Matters Agreement, such that holders of these original Grace RSUs and PBUs received RSUs denominated in GCP equity.
RSUs generally vest over a three year period, with vesting in substantially equal amounts each year over three years and some vesting 100% after the third year from the date of grant. A smaller number of RSUs were designated as sign-on awards and used for purposes of attracting key employees and to cover outstanding awards from a prior employer and vest 100% after two years.
GCP’s RSU activity for the year ended December 31, 2016 is presented below.
RSU Activity | Number Of Shares (in thousands) | Weighted Average Grant Date Fair Value | ||||
Outstanding, December 31, 2015 | — | $ | — | |||
Converted on February 3, 2016 | 265 | 17.00 | ||||
RSUs settled | 31 | 16.90 | ||||
RSUs forfeited | 23 | 17.29 | ||||
RSUs granted | 327 | 17.36 | ||||
RSUs outstanding, December 31, 2016 | 538 | $ | 17.22 | |||
RSUs vested and outstanding | 77 | $ | 17.23 | |||
During 2016, 101,046 RSUs with an average grant date fair value of $17.15 vested. During 2016, GCP distributed approximately 25,000 shares and $0.5 million of cash to settle RSUs. GCP expects that approximately
104
42% of the 76,636 RSUs that vested and remain outstanding as of December 31, 2016, none of the 67,050 RSUs vesting in 2017, 34% of the 158,887 RSUs vesting in 2018 and none of the 235,275 RSUs vesting in 2019, will be settled in cash, with the remaining percentages of these RSUs to be settled in GCP stock.
During the year ended December 31, 2016, GCP granted 155,501 PBUs under the GCP 2016 Stock Incentive Plan to Company employees. These awards vest in February 2019 subject to continued employment through the payment date and have a weighted average grant date fair value of $17.04. GCP anticipates that 100% of the PBUs will be settled in GCP common stock upon vesting. During 2016, 8,695 PBUs were forfeited.
PBUs granted in 2016 are based on a three year cumulative adjusted earnings per share measure. The number of shares ultimately provided to an employee who received a 2016 PBU grant will be based on Company performance against this measure and can range from 0% to 200% of the target award based upon the level of achievement of this measure. The awards will be settled in 2019 once actual performance against the measure, which is measured over fiscal years 2016-2018, is certified by the Compensation Committee.
PBUs and RSUs are recorded at fair value at the date of grant. The common stock-settled portion of each such award is considered an equity award, with the stock compensation expense being determined based on GCP’s stock price on the grant date. The cash settled portion of the award is considered a liability award with the liability being remeasured each reporting period based on GCP’s then current stock price. PBU awards are remeasured each reporting period based on the expected payout of the award, which may range from 0% to 200% of the targets for such awards; therefore, these portions of the awards are subject to volatility until the payout is finally determined at the end of the performance period.
As of December 31, 2016, $7.2 million of total unrecognized compensation expense related to the RSU and PBU awards is expected to be recognized over the remaining weighted-average service period of 1.6 years.
14. Operating Segment Information
GCP is engaged in the production and sale of specialty construction chemicals, specialty building materials and packaging products through three operating segments. SCC manufactures and markets concrete admixtures and cement additives. SBM manufactures and markets sheet and liquid membrane systems that protect structures from water, air and vapor penetration, fireproofing and other products designed to protect the building envelope. Darex manufactures and markets packaging materials for use in beverage and food containers, industrial containers and other consumer and industrial applications.
The table below presents information related to GCP's operating segments. Only those corporate expenses directly related to the operating segments are allocated for reporting purposes. GCP excludes certain functional costs, impacts of foreign exchange (related primarily to Venezuela) and other corporate costs such as certain performance-based incentive compensation and public company costs from segment operating income. GCP also excludes pension costs, including certain ongoing defined benefit pension costs recognized quarterly, which include service and interest costs, the effect of expected returns on plan assets and amortization of prior service costs/credits, from the calculation of segment operating income. GCP believes that the exclusion of certain corporate costs and pension costs provides a better indicator of its operating segment performance as such costs are not managed at an operating segment level.
105
Operating Segment Data
(In millions) | 2016 | 2015 | 2014 | ||||||||
Net Sales | |||||||||||
Specialty Construction Chemicals | $ | 623.8 | $ | 694.3 | $ | 726.3 | |||||
Specialty Building Materials | 422.7 | 398.1 | 379.3 | ||||||||
Darex Packaging Technologies | 309.3 | 326.2 | 374.8 | ||||||||
Total | $ | 1,355.8 | $ | 1,418.6 | $ | 1,480.4 | |||||
Segment Operating Income | |||||||||||
Specialty Construction Chemicals segment operating income | $ | 72.6 | $ | 83.7 | $ | 72.4 | |||||
Specialty Building Materials segment operating income | 114.0 | 99.6 | 75.7 | ||||||||
Darex Packaging Technologies segment operating income | 64.8 | 72.8 | 74.1 | ||||||||
Total segment operating income | $ | 251.4 | $ | 256.1 | $ | 222.2 | |||||
Depreciation and Amortization | |||||||||||
Specialty Construction Chemicals | $ | 20.0 | $ | 18.0 | $ | 18.5 | |||||
Specialty Building Materials | 9.6 | 7.8 | 8.6 | ||||||||
Darex Packaging Technologies | 6.4 | 4.8 | 5.5 | ||||||||
Corporate | 0.2 | 1.2 | 1.4 | ||||||||
Total | $ | 36.2 | $ | 31.8 | $ | 34.0 | |||||
Capital Expenditures | |||||||||||
Specialty Construction Chemicals | $ | 23.6 | $ | 21.8 | $ | 24.3 | |||||
Specialty Building Materials | 5.7 | 7.0 | 6.3 | ||||||||
Darex Packaging Technologies | 4.4 | 5.9 | 6.7 | ||||||||
Corporate | 11.6 | 1.3 | 0.2 | ||||||||
Total | $ | 45.3 | $ | 36.0 | $ | 37.5 | |||||
Total Assets | |||||||||||
Specialty Construction Chemicals | $ | 335.9 | $ | 318.4 | $ | 329.0 | |||||
Specialty Building Materials | 273.3 | 227.4 | 247.3 | ||||||||
Darex Packaging Technologies | 148.6 | 121.2 | 157.4 | ||||||||
Corporate | 332.0 | 166.1 | 247.8 | ||||||||
Total | $ | 1,089.8 | $ | 833.1 | $ | 981.5 | |||||
Corporate costs include certain functional costs and other corporate costs such as certain performance-based compensation and public company costs.
106
Reconciliation of Operating Segment Data to Financial Statements
Total segment operating income for the years ended December 31, 2016, 2015 and 2014 are reconciled below to "Income before income taxes" presented in the accompanying Consolidated Statements of Operations.
Year Ended December 31, | |||||||||||
(In millions) | 2016 | 2015 | 2014 | ||||||||
Total segment operating income | $ | 251.4 | $ | 256.1 | $ | 222.2 | |||||
Corporate costs | (29.2 | ) | (24.3 | ) | (19.3 | ) | |||||
Certain pension costs | (8.4 | ) | (5.1 | ) | (7.5 | ) | |||||
Currency and other financial losses in Venezuela | — | (73.2 | ) | (1.0 | ) | ||||||
Repositioning expenses | (15.3 | ) | — | — | |||||||
Restructuring expenses and asset impairments | (1.9 | ) | (11.6 | ) | (18.3 | ) | |||||
Pension MTM adjustment and other related costs, net | (23.2 | ) | (15.0 | ) | 18.6 | ||||||
Gain on termination and curtailment of pension and other postretirement plans | 0.8 | — | — | ||||||||
Third-party acquisition-related costs | (2.1 | ) | — | — | |||||||
Other financing costs | (1.2 | ) | — | — | |||||||
Amortization of acquired inventory fair value adjustment | (1.3 | ) | — | — | |||||||
Interest expense, net | (64.6 | ) | (2.5 | ) | (4.8 | ) | |||||
Net income attributable to noncontrolling interests | 1.0 | 0.8 | 1.2 | ||||||||
Income before income taxes | $ | 106.0 | $ | 125.2 | $ | 191.1 | |||||
Sales by Product Group
Year Ended December 31, | |||||||||||
(In millions) | 2016 | 2015 | 2014 | ||||||||
Specialty Construction Chemicals: | |||||||||||
Concrete | $ | 469.1 | $ | 532.7 | $ | 541.9 | |||||
Cement | 154.7 | 161.6 | 184.4 | ||||||||
Total SCC Sales | $ | 623.8 | $ | 694.3 | $ | 726.3 | |||||
Specialty Building Materials: | |||||||||||
Building Envelope | $ | 236.3 | $ | 234.7 | $ | 236.3 | |||||
Residential Building Products | 89.2 | 79.3 | 59.2 | ||||||||
Specialty Construction Products | 97.2 | 84.1 | 83.8 | ||||||||
Total SBM Sales | $ | 422.7 | $ | 398.1 | $ | 379.3 | |||||
Darex Packaging Technologies: | |||||||||||
Sealants | $ | 211.7 | $ | 221.2 | $ | 254.8 | |||||
Coatings | 97.6 | 105.0 | 120.0 | ||||||||
Total Darex Sales | $ | 309.3 | $ | 326.2 | $ | 374.8 | |||||
Total Sales | $ | 1,355.8 | $ | 1,418.6 | $ | 1,480.4 | |||||
107
Geographic Area Data
The table below presents information related to the geographic areas in which GCP operates. Sales are attributed to geographic areas based on customer location. With the exception of the U.S. as presented below, there are no individually significant countries with sales exceeding 10% of total sales. Brazil and Belgium each have long-lived assets of approximately 10%-12% of total long-lived assets. There are no other individually significant countries with long-lived assets exceeding 10% of total long-lived assets.
Year Ended December 31, | |||||||||||
(In millions) | 2016 | 2015 | 2014 | ||||||||
Net Sales | |||||||||||
United States | $ | 540.3 | $ | 507.4 | $ | 468.4 | |||||
Canada and Puerto Rico | 32.5 | 30.8 | 35.5 | ||||||||
Total North America | 572.8 | 538.2 | 503.9 | ||||||||
Europe Middle East Africa | 321.3 | 341.1 | 396.0 | ||||||||
Asia Pacific | 322.6 | 329.6 | 349.7 | ||||||||
Latin America | 139.1 | 209.7 | 230.8 | ||||||||
Total | $ | 1,355.8 | $ | 1,418.6 | $ | 1,480.4 | |||||
Properties and Equipment, net | |||||||||||
United States | $ | 131.1 | $ | 91.9 | $ | 87.8 | |||||
Canada and Puerto Rico | 2.7 | 2.5 | 2.7 | ||||||||
Total North America | 133.8 | 94.4 | 90.5 | ||||||||
Europe Middle East Africa (EMEA) | 43.2 | 45.7 | 47.0 | ||||||||
Asia Pacific | 39.9 | 42.1 | 40.9 | ||||||||
Latin America | 15.3 | 14.9 | 19.1 | ||||||||
Total | $ | 232.2 | $ | 197.1 | $ | 197.5 | |||||
Goodwill, Intangibles and Other Assets | |||||||||||
United States | $ | 85.6 | $ | 34.1 | $ | 34.8 | |||||
Canada and Puerto Rico | 7.7 | 2.8 | 2.9 | ||||||||
Total North America | 93.3 | 36.9 | 37.7 | ||||||||
Europe Middle East Africa (EMEA) | 56.3 | 61.1 | 69.7 | ||||||||
Asia Pacific | 21.4 | 22.1 | 23.4 | ||||||||
Latin America | 28.3 | 25.8 | 35.7 | ||||||||
Total | $ | 199.3 | $ | 145.9 | $ | 166.5 | |||||
108
15. Earnings Per Share
The following table shows a reconciliation of the numerators and denominators used in calculating basic and diluted earnings per share.
(In millions, except per share amounts) | 2016 | 2015 | 2014 | ||||||||
Numerators | |||||||||||
Net income attributable to GCP shareholders | $ | 72.8 | $ | 40.1 | $ | 134.3 | |||||
Denominators | |||||||||||
Weighted average common shares—basic calculation | 70.8 | 70.5 | 70.5 | ||||||||
Dilutive effect of employee stock awards | 0.9 | — | — | ||||||||
Weighted average common shares—diluted calculation | 71.7 | 70.5 | 70.5 | ||||||||
Basic earnings per share | $ | 1.03 | $ | 0.57 | $ | 1.90 | |||||
Diluted earnings per share | $ | 1.02 | $ | 0.57 | $ | 1.90 | |||||
The Company calculates basic and diluted earnings per common share assuming the number of shares of GCP common stock outstanding on February 3, 2016 had been outstanding at the beginning of each period presented. For periods prior to the Separation, it is assumed that there are no dilutive equity instruments as there were no equity awards in GCP outstanding prior to the Separation. See Note 1, "Basis of Presentation and Summary of Significant Accounting and Financial Reporting Policies," for further discussion of the Separation.
There were approximately 0.1 million anti-dilutive options and 0.1 million anti-dilutive RSUs outstanding on a weighted-average basis as of December 31, 2016.
As of December 31, 2016, GCP repurchased 112,205 shares of Company common stock for $2.1 million in connection with its equity compensation programs.
16. Acquisitions
On August 9, 2016, GCP acquired the intellectual property and related assets of Sensocrete, a Canadian technology company in the ready mix concrete industry. This acquisition did not have a material effect on the Company's financial statements for the periods presented.
On November 9, 2016, GCP acquired 100% of the stock of Halex Corporation ("Halex") a North American supplier of specialty moisture barrier flooring underlayment products, seam tapes, other flooring and accessories, for total consideration of $47.0 million, net of $1.4 million of cash acquired and subject to customary purchase price adjustments. The Company believes that the addition of Halex and its products, including the proprietary VersaShield rolled moisture barrier flooring membrane, opens new growth opportunities in the building envelope industry by providing customers with differentiated products in interior environments while leveraging the Company's existing sales and distribution channels.
The acquisition of Halex has been accounted for as a business combination and is included within the GCP SBM operating and reportable segment. The acquisition purchase price has been allocated to the tangible net assets and identifiable intangible assets acquired based on their estimated fair values at the acquisition date in accordance with ASC 805, Business Combinations. The excess of the purchase price over the fair value of the tangible net assets and identifiable intangible assets acquired was recorded as goodwill. The $16.1 million of goodwill recognized is attributable to the revenue growth and operating synergies the Company expects to realize from this acquisition and will be deductible for U.S. income tax purposes over a period of 15 years.
The Company’s estimates and assumptions used in determining the estimated fair values of the net assets acquired are subject to change within the measurement period (up to one year from the acquisition date) as a result of additional information obtained with regards to facts and circumstances that existed as of the acquisition date. The purchase price allocation is preliminary. The primary areas of the purchase price allocation that are not yet finalized relate to the final settlement of the purchase price adjustments and the amount of the residual goodwill.
109
The following table presents the aggregate purchase price allocation, including those items that were preliminary allocations, as of the fiscal year ended December 31, 2016.
(In millions) | Net Assets Acquired | ||
Accounts receivable | $ | 3.2 | |
Other current assets | 0.5 | ||
Inventories | 9.7 | ||
Properties and equipment | 1.4 | ||
Goodwill | 16.1 | ||
Intangible assets | 20.4 | ||
Accounts payable | (1.9 | ) | |
Other current liabilities | (2.2 | ) | |
Other liabilities | (0.2 | ) | |
Net assets acquired | $ | 47.0 | |
The table below presents the intangible assets acquired as part of the acquisition of Halex and the periods over which they will be amortized.
Amount (In millions) | Weighted-Average Amortization Period (in years) | ||||
Customer Lists | $ | 16.5 | 15.0 | ||
Trademarks | 0.2 | 10.0 | |||
Technology | 3.7 | 12.0 | |||
Total | $ | 20.4 | |||
17. Quarterly Summary and Statistical Information (Unaudited)
(In millions, except per share amounts) | March 31 | June 30 | September 30 | December 31(1) | ||||||||||||
2016 | ||||||||||||||||
Net sales | $ | 314.1 | $ | 366.3 | $ | 342.5 | $ | 332.9 | ||||||||
Gross profit | 121.2 | 148.4 | 136.0 | 123.1 | ||||||||||||
Net income attributable to GCP shareholders | 17.8 | 30.3 | 21.3 | 3.4 | ||||||||||||
Net income per share:(2) | ||||||||||||||||
Basic earnings per share: | ||||||||||||||||
Net income | $ | 0.25 | $ | 0.43 | $ | 0.30 | $ | 0.05 | ||||||||
Diluted earnings per share: | ||||||||||||||||
Net income | $ | 0.25 | $ | 0.42 | $ | 0.30 | $ | 0.05 | ||||||||
________________________________
(1) | In the fourth quarter of 2016, GCP recorded a pension mark-to-market adjustment of $20.5 million. Refer to Note 7, "Pension Plans and Other Postretirement Benefit Plans." |
(2) | Per share results for the four quarters may differ from full-year per share results, as a separate computation of the weighted average number of shares outstanding is made for each quarter presented. |
110
(In millions, except per share amounts) | March 31 | June 30 | September 30(1) | December 31(2) | ||||||||||||
2015 | ||||||||||||||||
Net sales | $ | 322.7 | $ | 373.7 | $ | 389.7 | $ | 332.5 | ||||||||
Gross profit | 111.3 | 142.9 | 143.9 | 118.1 | ||||||||||||
Net income attributable to GCP shareholders | 20.5 | 27.2 | (15.3 | ) | 7.7 | |||||||||||
Net income per share:(3) | ||||||||||||||||
Basic earnings per share: | ||||||||||||||||
Net income | $ | 0.29 | $ | 0.39 | $ | (0.22 | ) | $ | 0.11 | |||||||
Diluted earnings per share: | ||||||||||||||||
Net income | $ | 0.29 | $ | 0.39 | $ | (0.22 | ) | $ | 0.11 | |||||||
________________________________
(1) | In the third quarter of 2015, GCP recorded a pre-tax charge of $73.2 million to reflect the devaluation of net monetary assets and the impairment of non-monetary assets within its Venezuela subsidiary. Refer to Note 1, "Basis of Presentation and Summary of Significant Accounting and Financial Reporting Policies." |
(2) | In the fourth quarter of 2015, GCP recorded a pension mark-to-market adjustment of $15.0 million. Refer to Note 7, "Pension Plans and Other Postretirement Benefit Plans." |
(3) | GCP Earnings per share for 2015 were calculated using the shares that were distributed to Grace shareholders immediately following the Separation. For periods prior to the Separation it is assumed that there are no dilutive equity instruments as there were no GCP equity awards outstanding prior to the Separation. |
18. Subsequent Event
Binding Offer Letter for Divestiture of the Darex Business
On March 2, 2017, the Company entered into a final, binding and irrevocable offer letter (the “Offer Letter”) with Henkel AG & Co. KGaA (“Henkel”), pursuant to which Henkel made a binding offer (the "Offer") to acquire the Company’s Darex Packaging Technologies business for approximately $1.05 billion. This transaction would position the Company to focus on the growth opportunities in its construction and building materials markets.
In connection with the Offer, the Company has agreed to initiate the employee consultation process with its relevant works councils (the “Consultation Process”). The Company may accept the Offer by executing and delivering to Henkel a countersignature to the proposed stock and asset purchase agreement (the “stock and asset purchase agreement”) after the Consultation Process has concluded.
The Offer is valid until July 3, 2017; provided, however, that if the Consultation Process has not been completed by at least five business days prior to such date, the Company or Henkel may, subject to certain conditions, extend the Offer from time to time in consecutive increments of up to thirty days each, but in any event not beyond December 2, 2017.
The Offer was made on the terms and subject to the conditions of the proposed stock and asset purchase agreement, which was attached to the Offer Letter and executed by Henkel in connection with the making of the Offer. If the Offer is accepted, the completion of the transaction will be subject to customary closing conditions, including regulatory approvals, and will be expected to close in the middle of 2017.
Under the terms of the proposed stock and asset purchase agreement, the Company would sell to Henkel certain assets, and Henkel would assume certain liabilities, of Darex. The proposed stock and asset purchase agreement would contain various customary representations, warranties and covenants, and the parties would agree to indemnify each other for any breaches thereof, subject to specified time and amount limits and other exceptions.
The Company expects to classify Darex, which is an operating segment, as held for sale and to report Darex's financial results in discontinued operations beginning in the first quarter of 2017. Darex had sales of $309.3 million and segment operating income of $64.8 million for the year ended December 31, 2016. The Company is assessing the full financial impact that the potential transaction would have, including the impact of
111
potential restructuring initiatives that the Company may undertake to ensure its cost structure aligns with anticipated needs subsequent to a sale of Darex, as well as the gain that it would record related to the transaction for both tax and financial reporting purposes.
112
GCP APPLIED TECHNOLOGIES AND SUBSIDIARIES
FINANCIAL STATEMENT SCHEDULE II—VALUATION AND QUALIFYING ACCOUNTS AND RESERVES
(In millions)
For the Year Ended December 31, 2016
Balance at beginning of period | Additions charged to costs and expenses | Deductions | Other, net(1) | Balance at end of period | |||||||||||||||
Valuation and qualifying accounts deducted from assets: | |||||||||||||||||||
Allowances for notes and accounts receivable | $ | 6.2 | $ | 0.2 | $ | (1.9 | ) | $ | 0.4 | $ | 4.9 | ||||||||
Inventory obsolescence reserve | 3.1 | — | — | — | 3.1 | ||||||||||||||
Valuation allowance for deferred tax assets | 2.0 | 0.4 | (0.1 | ) | — | 2.3 | |||||||||||||
___________________________________________________________________________________________________________________
(1) | Various miscellaneous adjustments against reserves and effects of currency translation. |
For the Year Ended December 31, 2015
Balance at beginning of period | Additions charged to costs and expenses | Deductions | Other, net(1) | Balance at end of period | |||||||||||||||
Valuation and qualifying accounts deducted from assets: | |||||||||||||||||||
Allowances for notes and accounts receivable | $ | 4.8 | $ | 3.6 | $ | (2.9 | ) | $ | 0.7 | $ | 6.2 | ||||||||
Inventory obsolescence reserve | 4.4 | — | (1.3 | ) | — | 3.1 | |||||||||||||
Valuation allowance for deferred tax assets | 1.8 | 0.5 | (0.3 | ) | — | 2.0 | |||||||||||||
___________________________________________________________________________________________________________________
(1) | Various miscellaneous adjustments against reserves and effects of currency translation. |
For the Year Ended December 31, 2014
Balance at beginning of period | Additions charged to costs and expenses | Deductions | Other, net(1) | Balance at end of period | |||||||||||||||
Valuation and qualifying accounts deducted from assets: | |||||||||||||||||||
Allowances for notes and accounts receivable | $ | 4.9 | $ | 2.1 | $ | (2.6 | ) | $ | 0.4 | $ | 4.8 | ||||||||
Inventory obsolescence reserve | 3.9 | 0.5 | — | — | 4.4 | ||||||||||||||
Valuation allowance for deferred tax assets | 1.6 | 0.2 | — | — | 1.8 | ||||||||||||||
___________________________________________________________________________________________________________________
(1) | Various miscellaneous adjustments against reserves and effects of currency translation. |
113
Item 9. CHANGES IN AND DISAGREEMENTS WITH ACCOUNTANTS ON ACCOUNTING AND FINANCIAL DISCLOSURE
None.
Item 9A. CONTROLS AND PROCEDURES
Management’s Evaluation of Disclosure Controls and Procedures
As of the end of the period covered by this report, our principal executive officer and principal financial officer evaluated the effectiveness of our disclosure controls and procedures (as defined in Rule 13a-15(e) of the Exchange Act). Based on the evaluation as of December 31, 2016, our principal executive officer and principal financial officer concluded that our disclosure controls and procedures were effective to provide reasonable assurance that the information required to be disclosed in reports that we file or submit under the Exchange Act is accumulated and communicated to management, and made known to our principal executive officer and principal financial officer, on a timely basis to ensure that it is recorded, processed, summarized and reported within the time periods specified in the SEC’s rules and forms.
Management’s Annual Report on Internal Control Over Financial Reporting
This annual report does not include a report of management’s assessment regarding internal control over financial reporting or an attestation report of the Company’s independent registered accounting firm due to a transition period established by rules of the SEC for newly public companies.
Changes in Internal Control over Financial Reporting
There were no changes in our internal control over financial reporting during the fourth quarter of 2016 that have materially affected or are reasonably likely to materially affect our internal control over financial reporting.
Item 9B. OTHER INFORMATION
None.
PART III.
Item 10. DIRECTORS, EXECUTIVE OFFICERS AND CORPORATE GOVERNANCE
Information regarding members of our Board of Directors will be contained in our definitive proxy statement for the 2017 Annual Meeting of Stockholders ("2017 Proxy Statement") under the captions “Proposal One: Election of Directors” and “Corporate Governance” and is incorporated herein by reference. Information regarding our executive officers is contained in Part I of this Form 10-K under the caption "Executive Officers of the Registrant." The information contained in the 2017 Proxy Statement under the captions “Corporate Governance - Section 16(a) Beneficial Ownership Reporting Compliance” and ”Corporate Governance - Audit Committee” is incorporated herein by reference.
We have adopted a code of ethics that applies to all of our directors, officers, employees and representatives. Information regarding our code of ethics will be contained in our 2017 Proxy Statement under the caption “Corporate Governance-Code of Ethics and Conflicts of Interest” and is incorporated herein by reference.
Information regarding the procedures by which our stockholders may recommend nominees to our Board of Directors will be contained in our 2017 Proxy Statement under the caption “Corporate Governance-Director Nomination Process; Shareholder Recommendations for Director Nominees.”
Item 11. EXECUTIVE COMPENSATION
This information will be contained in our 2017 Proxy Statement under the captions “Executive Compensation” and “Corporate Governance - Director Compensation” and is incorporated herein by reference.
Item 12. SECURITY OWNERSHIP OF CERTAIN BENEFICIAL OWNERS AND MANAGEMENT AND RELATED STOCKHOLDER MATTERS
Information regarding security ownership of certain beneficial owners and for directors and executive officers
will be contained in our 2017 Proxy Statement under the caption “Other Information - Stock Ownership of Certain Beneficial Owners and Management” and is incorporated herein by reference. Information regarding securities authorized for issuance under our equity compensation plans will be contained in our 2017 Proxy Statement under the caption “Other Information - Equity Compensation Plan Information” and is incorporated herein by reference.
Item 13. CERTAIN RELATIONSHIPS AND RELATED TRANSACTIONS AND DIRECTOR INDEPENDENCE
This information will be contained in our 2017 Proxy Statement under the captions “Other Information - Transactions with Related Persons,” “Proposal One: Election of Directors” and “Corporate Governance - Number and Independence of Directors” and is incorporated herein by reference.
Item 14. PRINCIPAL ACCOUNTANT FEES AND SERVICES
This information will be contained in our 2017 Proxy Statement under the caption “Proposal Two: Ratification of the Appointment of Independent Registered Public Accounting Firm - Principal Accountant Fees and Services” and is incorporated herein by reference.
115
PART IV.
Item 15. EXHIBITS AND FINANCIAL STATEMENT SCHEDULES
(a) Financial Statements and Schedules.
(1) and (2) | The required information is set forth in Item 8—"Financial Statements and Supplementary Data." |
(3) Exhibit Index:
Exhibit No. | Exhibit | Location | ||
2.1 | Separation and Distribution Agreement, dated as of January 27, 2016, by and among W.R. Grace & CO., W.R. Grace & Co. - Conn., and GCP Applied Technologies Inc. | Exhibit 2.1 to Form 8-K filed 1/28/16, SEC File No. 1-37533 | ||
3.1 | Amended and Restated Certificate of Incorporation of GCP Applied Technologies Inc. | Exhibit 3.1 to Form 8-K filed 2/4/16, SEC File No. 1-37533 | ||
3.2 | Amended and Restated Bylaws of GCP Applied Technologies Inc. | Exhibit 3.2 to Form 8-K filed 2/4/16, SEC File No. 1-37533 | ||
4.1 | Indenture, dated as of January 27, 2016, by and among GCP Applied Technologies Inc., the guarantors party thereto and Wilmington Trust, National Association, as trustee. | Exhibit 4.1 to Form 8-K filed 1/28/16, SEC File No. 1-37533 | ||
4.2 | Form of 9.50% Note due 2023 (included as Exhibit A to Exhibit 4.1) | Exhibit 4.2 to Form 8-K filed 1/28/16, SEC File No. 1-37533 | ||
10.1 | Tax Sharing Agreement, dated January 27, 2016, by and among W.R. Grace & Co., W.R. Grace & Co. - Conn. and GCP Applied Technologies Inc. | Exhibit 10.1 to Form 8-K filed 1/28/16, SEC File No. 1-37533 | ||
10.2 | Employee Matters Agreement, dated January 27, 2016, by and among W.R. Grace & Co., W.R. Grace & Co. - Conn. and GCP Applied Technologies Inc. | Exhibit 10.2 to Form 8-K filed 1/28/16, SEC File No. 1-37533 | ||
10.3 | Transition Services Agreement, dated January 27, 2016, by and between W.R. Grace & Co. - Conn. and GCP Applied Technologies Inc. | Exhibit 10.3 to Form 8-K filed 1/28/16, SEC File No. 1-37533 | ||
10.4 | Cross-License Agreement, dated January 27, 2016, by and among GCP Applied Technologies Inc., W.R. Grace & Co. - Conn. and Grace GmbH & Co. KG. | Exhibit 10.4 to Form 8-K filed 1/28/16, SEC File No. 1-37533 | ||
10.5 | Grace Transitional License Agreement, dated January 27, 2016, by and between W.R. Grace & Co. - Conn. and GCP Applied Technologies Inc. | Exhibit 10.5 to Form 8-K filed 1/28/16, SEC File No. 1-37533 | ||
10.6 | Credit Agreement, dated February 3, 2016, by and among GCP Applied Technologies, Grace Construction Products Limited, Grace NV, the lenders party thereto from time to time and Deutsche Bank AG New York Branch, as the administrative agent. | Exhibit 10.1 to Form 8-K filed 2/4/16, SEC File No. 1-37533 | ||
10.7 | First Amendment to Credit Agreement, dated August 25, 2016, by and among GCP Applied Technologies, Grace Construction Products Limited, GCP Applied Technologies NV (Formerly Grace NV), the lenders party thereto from time to time and Deutsche Bank AG New York Branch, as the administrative agent. | Exhibit 10.1 to Form 8-K filed 8/25/16, SEC File No. 1-37533 | ||
10.8 | GCP Applied Technologies Inc. 2016 Stock Incentive Plan.* | Exhibit 10.5 to Form 8-K filed 2/4/16, SEC File No. 1-37533 | ||
10.9 | Severance Plan for Leadership Team Officers of GCP Applied Technologies Inc.* | Exhibit 10.2 to Form 8-K filed 2/4/16, SEC File No. 1-37533 | ||
10.10 | GCP Applied Technologies Inc. Supplemental Executive Retirement Plan.* | Filed Herewith | ||
10.11 | GCP Applied Technologies Inc. Executive Salary Protection Plan.* | Exhibit 10.3 to Form 8-K filed 2/4/16, SEC File No. 1-37533 | ||
10.12 | Form of GCP Applied Technologies Inc. Change in Control Severance Agreement.* | Exhibit 10.4 to Form 8-K filed 2/4/16, SEC File No. 1-37533 | ||
116
Exhibit No. | Exhibit | Location | ||
10.13 | GCP Applied Technologies Inc. Executive Annual Incentive Compensation Plan.* | Exhibit 10.11 to Form 10-K filed 3/30/16, SEC File No. 1-37533 | ||
10.14 | Form of 2014 Nonstatutory Stock Option Agreement.* | Exhibit 4.4 to Form S-8 filed 1/28/16, SEC File No. 333-209158 | ||
10.15 | Form of 2015 Nonstatutory Stock Option Agreement.* | Exhibit 4.5 to Form S-8 filed 1/28/16, SEC File No. 333-209158 | ||
10.16 | Form of 2015 Restricted Stock Unit Agreement.* | Exhibit 4.6 to Form S-8 filed 1/28/16, SEC File No. 333-209158 | ||
10.17 | Form of Leadership Grant Nonstatutory Stock Option Agreement.* | Exhibit 10.2 to Form 8-K filed 2/11/16, SEC File No. 1-37533 | ||
10.18 | Form of Leadership Grant Restricted Stock Unit Agreement.* | Exhibit 10.1 to Form 8-K filed 2/11/16, SEC File No. 1-37533 | ||
10.19 | Form of GCP Applied Technologies Inc. Restricted Stock Unit Award Agreement.* | Exhibit 10.17 to Form 10-K filed 3/30/16, SEC File No. 1-37533 | ||
10.20 | Form of GCP Applied Technologies Inc. Stock Option Award Agreement.* | Exhibit 10.18 to Form 10-K filed 3/30/16, SEC File No. 1-37533 | ||
10.21 | Form of GCP Applied Technologies Inc. Performance-Based Stock Unit Award Agreement.* | Exhibit 10.19 to Form 10-K filed 3/30/16, SEC File No. 1-37533 | ||
10.22 | Transition Agreement dated October 5, 2016 between GCP Applied Technologies Inc. and William J. McCall.* | Exhibit 10.1 to Form 8-K filed 10/7/16, SEC File No. 1-37533 | ||
10.23 | Kevin Holland Offer Letter dated November 29, 2016* | Filed Herewith | ||
21 | List of Subsidiaries of GCP Applied Technologies Inc. | Filed herewith | ||
23 | Consent of PricewaterhouseCoopers LLP, Independent Registered Public Accounting Firm. | Filed herewith | ||
24 | Powers of Attorney. | Filed herewith | ||
31.1 | Certification of Chief Executive Officer pursuant to Rule 13a-14(a) of the Securities Exchange Act of 1934, as amended (the Exchange Act). | Filed herewith | ||
31.2 | Certification of Chief Financial Officer pursuant to Rule 13a-14(a) of the Exchange Act. | Filed herewith | ||
32 | Certification of the Chief Executive Officer and the Chief Financial Officer pursuant to Rule 13a-14(b) of the Exchange Act and 18 U.S.C. Section 1350, as adopted pursuant to Section 906 of the Sarbanes-Oxley Act of 2002.** | Furnished herewith | ||
101 | XBRL | Furnished herewith | ||
_________________________________________________________________________________________
* Management contract or compensatory plan.
** Exhibit 32 is furnished herewith and shall not be deemed to be filed under the Securities Exchange Act of 1934.
(b) See Item 15(a)(3) above.
(c) See Item 15(a)(1) and (2) above.
117
Item 16. FORM 10-K SUMMARY
Not applicable.
118
SIGNATURES
Pursuant to the requirements of Section 13 or 15(d) of the Securities Exchange Act of 1934, the registrant has duly caused this Report to be signed on its behalf by the undersigned, thereunto duly authorized.
GCP Applied Technologies Inc. (Registrant) | ||
By: | /s/ GREGORY E. POLING | |
Gregory E. Poling President and Chief Executive Officer (Principal Executive Officer) | ||
By: | /s/ DEAN P. FREEMAN | |
Dean P. Freeman Vice President and Chief Financial Officer (Principal Financial Officer) | ||
By: | /s/ KENNETH S. KOROTKIN | |
Kenneth S. Korotkin Vice President, Controller and Chief Accounting Officer (Principal Accounting Officer) | ||
Dated: March 2, 2017
Pursuant to the requirements of the Securities Exchange Act of 1934, this Report has been signed below by the following persons on behalf of the registrant and in the capacities indicated on March 2, 2017.
Signature | Title | |||
Marcia J. Avedon* | Director | |||
Ronald C. Cambre* | Non-Executive Chairman of the Board | |||
Janice K. Henry* | Director | |||
Phillip J. Mason* | Director | |||
Elizabeth Mora* | Director | |||
Danny R. Shepherd* | Director | |||
/s/ GREGORY E. POLING | President, Chief Executive Officer and Director (Principal Executive Officer) | |
(Gregory E. Poling) | ||
/s/ DEAN P. FREEMAN | Vice President and Chief Financial Officer (Principal Financial Officer) | |
(Dean P. Freeman) | ||
/s/ KENNETH S. KOROTKIN | Vice President, Controller and Chief Accounting Officer (Principal Accounting Officer) | |
(Kenneth S. Korotkin) | ||
________________________________________________________________________________________________________________
* By signing his name hereto, John W. Kapples is signing this document on behalf of each of the persons indicated above pursuant to powers of attorney duly executed by such persons and filed with the Securities and Exchange Commission
By: | /s/ JOHN W. KAPPLES | |
John W. Kapples (Attorney-in-Fact) | ||
119