Attached files
| file | filename |
|---|---|
| EX-99.1 - EX-99.1 - Great Elm Capital Group, Inc. | d628287dex991.htm |
| 8-K - 8-K - Great Elm Capital Group, Inc. | d628287d8k.htm |
Exhibit 99.2
Great Elm Capital Group, Inc. Investor Presentation – Quarter Ended September 30, 2018 November 9, 2018 © 2018 Great Elm Capital Group, Inc.
Disclaimer Statements in this presentation that are “forward-looking” statements, including, but not limited to, statements regarding potential or expected IRRs, cash-on-cash returns, collection of incentive fees and net operating loss utilization, involve risks and uncertainties that may individually or collectively impact the matters described herein. Investors are cautioned not to place undue reliance on any such forward-looking statements, which speak only as of the date they are made and represent Great Elm Capital Group, Inc.’s (“Great Elm” or “GEC”) assumptions and expectations in light of currently available information. Great Elms assumes no obligation to, and expressly disclaims any duty to, update any forward-looking statements contained in this presentation or to conform prior statements to actual results or revised expectations, expect as required by law. These statements involve risks, variables and uncertainties, and Great Elm’s actual performance results may differ from those projected, and any such differences may be material. For information on certain factors that could cause actual events or results to differ materially from Great Elm’s expectations, please see Great Elm’s filings with the Securities and Exchange Commission (the “SEC”), including its most recent annual report on Form 10-K and subsequent reports on Forms 10-Q and 8-K. Additional information relating to Great Elm’s financial position and results of operations is also contained in Great Elm’s annual and quarterly reports filed with the SEC, which are available for download at its website www.greatelmcap.com or at the SEC website www.sec.gov. Non-GAAP Financial Measures The SEC has adopted rules to regulate the use in filings with the SEC, and in public disclosures, of financial measures that are not in accordance with US GAAP, such as adjusted earnings before interest, taxes, depreciation and amortization (“Adjusted EBITDA”). See the Appendix for important information regarding the use of non-GAAP financial measures and reconciliations of non-GAAP measures to their most directly comparable GAAP measures. Valley Healthcare Group (“VHG”) and Northwest Medical (“NWM”) Financial Information As private entities, VHG’s and NWM’s historic financial information has not been prepared in accordance with Regulation S-X. When Regulation S-X compliant financial information is available and included in Great Elm’s SEC filings following the date hereof, the presentation of this financial information may change from that presented in this presentation, and any such changes may be material. This presentation does not constitute an offer of any securities for sale. © 2018 Great Elm Capital Group, Inc. 2
Table of Contents Slide(s) 4—7 Organizational Overview 8—14 Operating Companies 15—18 Investment Management 19—22 Real Estate 23—26 Financial Review 27—28 Summary 29 Q&A 30—33 Appendix © 2018 Great Elm Capital Group, Inc. 3
Organizational Overview © 2018 Great Elm Capital Group, Inc. 4
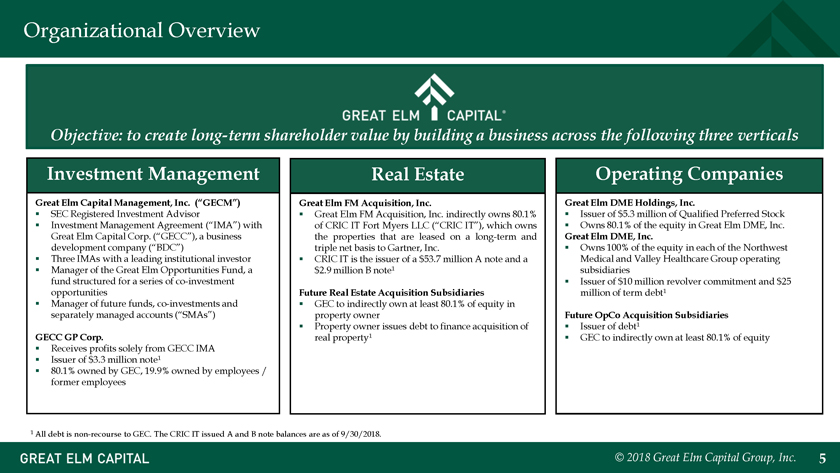
Organizational Overview Objective: to create long-term shareholder siness across the following three verticals Investment Management Real Estate Operating Companies Great Elm Capital Management, Inc. (“GECM”) Great Elm FM Acquisition, Inc. Great Elm DME Holdings, Inc. ï,§ SEC Registered Investment Advisor ï,§ Great Elm FM Acquisition, Inc. indirectly owns 80.1% ï,§ Issuer of $5.3 million of Qualified Preferred Stock ï,§ Investment Management Agreement (“IMA”) with of CRIC IT Fort Myers LLC (“CRIC IT”), which owns ï,§ Owns 80.1% of the equity in Great Elm DME, Inc. Great Elm Capital Corp. (“GECC”), a business the properties that are leased on a long-term and Great Elm DME, Inc. development company (“BDC”) triple net basis to Gartner, Inc. ï,§ Owns 100% of the equity in each of the Northwest ï,§ Three IMAs with a leading institutional investor ï,§ CRIC IT is the issuer of a $53.7 million A note and a Medical and Valley Healthcare Group operating ï,§ Manager of the Great Elm Opportunities Fund, a $2.9 million B note1 subsidiaries fund structured for a series of co-investment ï,§ Issuer of $10 million revolver commitment and $25 opportunities Future Real Estate Acquisition Subsidiaries million of term debt1 ï,§ Manager of future funds, co-investments and ï,§ GEC to indirectly own at least 80.1% of equity in separately managed accounts (“SMAs”) property owner Future OpCo Acquisition Subsidiaries ï,§ Property owner issues debt to finance acquisition of ï,§ Issuer of debt1 GECC GP Corp. real property1 ï,§ GEC to indirectly own at least 80.1% of equity ï,§ Receives profits solely from GECC IMA ï,§ Issuer of $3.3 million note1 ï,§ 80.1% owned by GEC, 19.9% owned by employees / former employees 1 All debt is non-recourse to GEC. The CRIC IT issued A and B note balances are as of 9/30/2018. © 2018 Great Elm Capital Group, Inc. 5
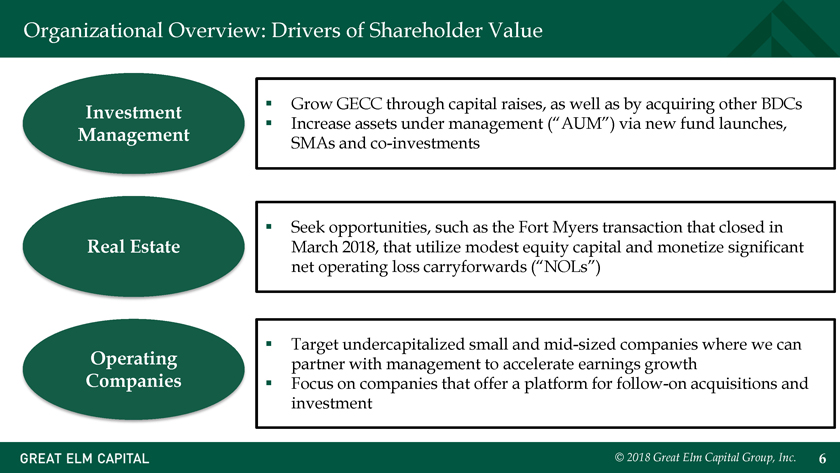
Organizational Overview: Drivers of Shareholder Value Investment ï,§ Grow GECC through capital raises, as well as by acquiring other BDCs ï,§ Increase assets under management (“AUM”) via new fund launches, Management SMAs and co-investments ï,§ Seek opportunities, such as the Fort Myers transaction that closed in Real Estate March 2018, that utilize modest equity capital and monetize significant net operating loss carryforwards (“NOLs”) ï,§ Target undercapitalized small and mid-sized companies where we can Operating partner with management to accelerate earnings growth Companies ï,§ Focus on companies that offer a platform for follow-on acquisitions and investment © 2018 Great Elm Capital Group, Inc. 6
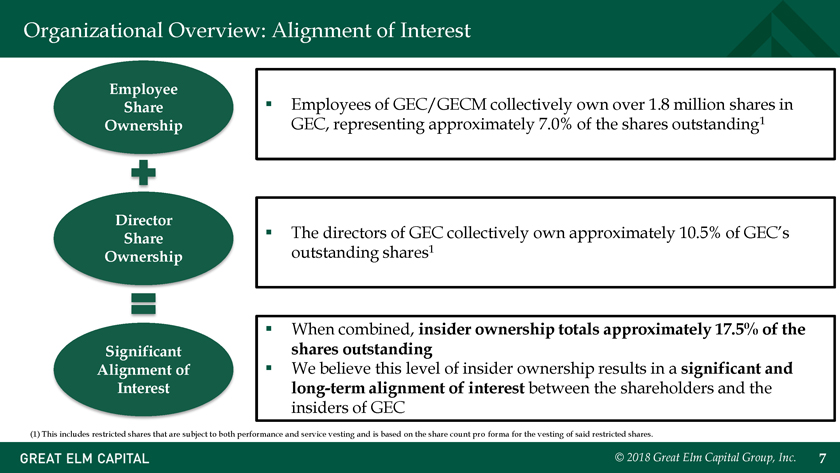
Organizational Overview: Alignment of Interest Employee Employees of GEC/GECM collectively own over 1.8 shares Share ï,§ million in Ownership GEC, representing approximately 7.0% of the shares outstanding1 Director Share ï,§ The directors of GEC collectively own approximately 10.5% of GEC’s outstanding shares1 Ownership ï,§ When combined, insider ownership totals approximately 17.5% of the Significant shares outstanding Alignment of ï,§ We believe this level of insider ownership results in a significant and Interest long-term alignment of interest between the shareholders and the insiders of GEC (1) This includes restricted shares that are subject to both performance and service vesting and is based on the share count pro forma for the vesting of said restricted shares. © 2018 Great Elm Capital Group, Inc. 7
Operating Companies: Valley Healthcare Group & Northwest Medical © 2018 Great Elm Capital Group, Inc. 8
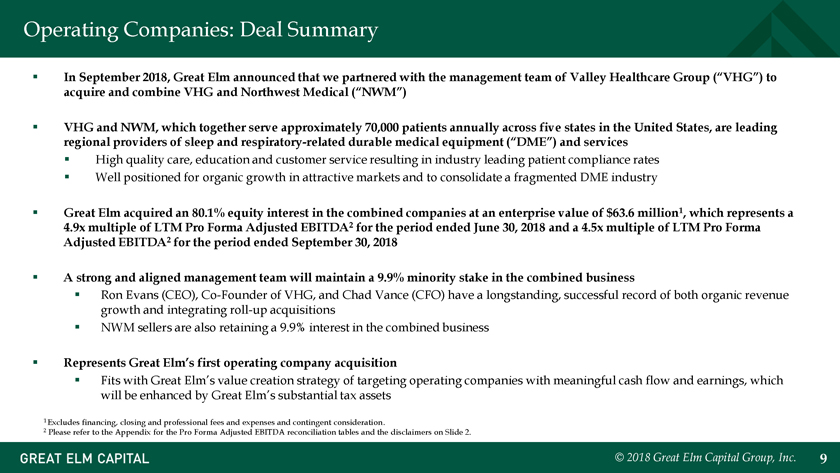
Operating Companies: Deal Summary ï,§ In September 2018, Great Elm announced that we partnered with the management team of Valley Healthcare Group (“VHG”) to acquire and combine VHG and Northwest Medical (“NWM”) ï,§ VHG and NWM, which together serve approximately 70,000 patients annually across five states in the United States, are leading regional providers of sleep and respiratory-related durable medical equipment (“DME”) and services ï,§ High quality care, education and customer service resulting in industry leading patient compliance rates ï,§ Well positioned for organic growth in attractive markets and to consolidate a fragmented DME industry ï,§ Great Elm acquired an 80.1% equity interest in the combined companies at an enterprise value of $63.6 million1, which represents a 4.9x multiple of LTM Pro Forma Adjusted EBITDA2 for the period ended June 30, 2018 and a 4.5x multiple of LTM Pro Forma Adjusted EBITDA2 for the period ended September 30, 2018 ï,§ A strong and aligned management team will maintain a 9.9% minority stake in the combined business ï,§ Ron Evans (CEO), Co-Founder of VHG, and Chad Vance (CFO) have a longstanding, successful record of both organic revenue growth and integrating roll-up acquisitions ï,§ NWM sellers are also retaining a 9.9% interest in the combined business ï,§ Represents Great Elm’s first operating company acquisition ï,§ Fits with Great Elm’s value creation strategy of targeting operating companies with meaningful cash flow and earnings, which will be enhanced by Great Elm’s substantial tax assets 1 Excludes financing, closing and professional fees and expenses and contingent consideration. 2 Please refer to the Appendix for the Pro Forma Adjusted EBITDA reconciliation tables and the disclaimers on Slide 2. © 2018 Great Elm Capital Group, Inc. 9
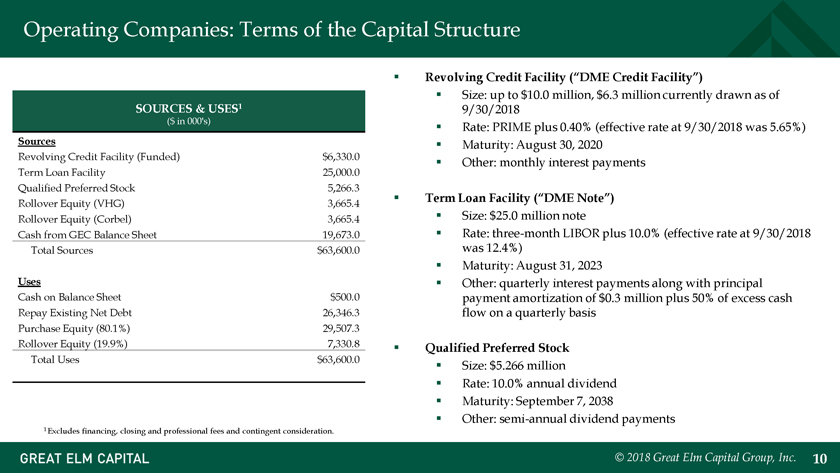
Operating Companies: Terms of the Capital Structure ï,§ Revolving Credit Facility (“DME Credit Facility”) ï,§ Size: up to $10.0 million, $6.3 million currently drawn as of SOURCES & USES1 9/30/2018 ($ in 000’s) Rate: PRIME plus 0.40% (effective rate 9/30/2018 was 5.65%) ï,§ at Sources ï,§ Maturity: August 30, 2020 Revolving Credit Facility (Funded) $6,330.0 ï,§ Other: monthly interest payments Term Loan Facility 25,000.0 Qualified Preferred Stock 5,266.3 ï,§ Term Loan Facility (“DME Note”) Rollover Equity (VHG) 3,665.4 Rollover Equity (Corbel) 3,665.4 ï,§ Size: $25.0 million note Cash from GEC Balance Sheet 19,673.0 ï,§ Rate: three-month LIBOR plus 10.0% (effective rate at 9/30/2018 Total Sources $63,600.0 was 12.4%) ï,§ Maturity: August 31, 2023 Uses ï,§ Other: quarterly interest payments along with principal Cash on Balance Sheet $500.0 payment amortization of $0.3 million plus 50% of excess cash Repay Existing Net Debt 26,346.3 flow on a quarterly basis Purchase Equity (80.1%) 29,507.3 Rollover Equity (19.9%) 7,330.8 ï,§ Qualified Preferred Stock Total Uses $63,600.0 Size: $5.266 million ï,§ ï,§ Rate: 10.0% annual dividend ï,§ Maturity: September 7, 2038 ï,§ Other: semi-annual dividend payments 1 Excludes financing, closing and professional fees and contingent consideration. © 2018 Great Elm Capital Group, Inc. 10
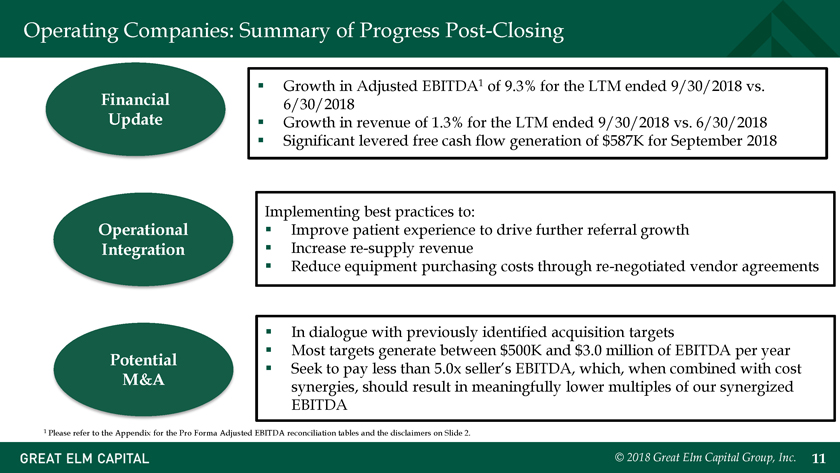
Operating Companies: Summary of Progress Post-Closing ï,§ Growth in Adjusted EBITDA1 of 9.3% for the LTM ended 9/30/2018 vs. Financial 6/30/2018 Update ï,§ Growth in revenue of 1.3% for the LTM ended 9/30/2018 vs. 6/30/2018 ï,§ Significant levered free cash flow generation of $587K for September 2018 Implementing best practices to: Operational ï,§ Improve patient experience to drive further referral growth Integration ï,§ Increase re-supply revenue ï,§ Reduce equipment purchasing costs through re-negotiated vendor agreements ï,§ In dialogue with previously identified acquisition targets ï,§ Most targets generate between $500K and $3.0 million of EBITDA per year Potential ï,§ Seek to pay less than 5.0x seller’s EBITDA, which, when combined with cost M&A synergies, should result in meaningfully lower multiples of our synergized EBITDA 1 Please refer to the Appendix for the Pro Forma Adjusted EBITDA reconciliation tables and the disclaimers on Slide 2. © 2018 Great Elm Capital Group, Inc. 11
Operating Companies: Financial Update ï,§ For the LTM ended September 30, 2018, VHG and NWM would have generated $14.1 million in Pro Forma Adjusted EBITDA1, growth of 9.3% over the previously disclosed $12.9 million of Pro Forma Adjusted EBITDA1 for the LTM period ended June 30, 2018 ï,§ For the LTM ended September 30, 2018, VHG and NWM would have generated $47.7 million in revenue, representing growth of 1.3% over the previously disclosed $47.1 million of revenue for the LTM period ended June 30, 2018 ï,§ For the month of September 2018, VHG and NWM generated $4.1 million in total revenue and $1.3 million in Adjusted EBITDA1,2 with approximately $490,000 of capex. For this same period, VHG and NWM generated $830,000 in unlevered free cash flow and $587,000 in levered free cash flow ï,§ Driving this growth are increases in active rentals and new patient set-ups at both VHG and NWM with referrals stable across all regions 1 Please refer to the Appendix for the Pro Forma Adjusted EBITDA reconciliation tables and the disclaimers on Slide 2. 2 September 2018 numbers were adjusted for one-time expenses and exclude cost synergies. © 2018 Great Elm Capital Group, Inc. 12
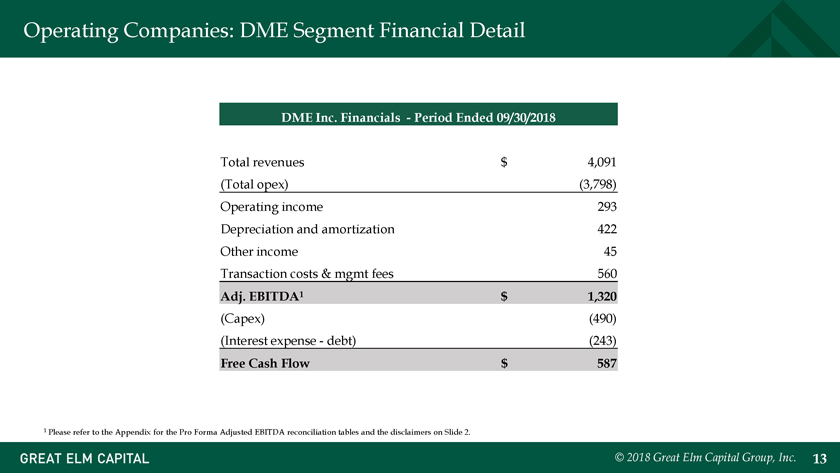
Operating Companies: DME Segment Financial Detail DME Inc. Financials —Period Ended 09/30/2018 Total revenues $ 4,091 (Total opex) (3,798) Operating income 293 Depreciation and amortization 422 Other income 45 Transaction costs & mgmt fees 560 Adj. EBITDA1 $ 1,320 (Capex) (490) (Interest expense—debt) (243) Free Cash Flow $ 587 1 Please refer to the Appendix for the Pro Forma Adjusted EBITDA reconciliation tables and the disclaimers on Slide 2. © 2018 Great Elm Capital Group, Inc. 13
Operating Companies: Potential M&A ï,§ One of the compelling investment considerations for the DME platform was the opportunity to partner with a seasoned management team who has successfully integrated seven acquisitions (prior to the GEC transaction) to consolidate a fragmented industry of approximately 6,000 medical equipment providers ï,§ The VHG and NWM management team is currently in preliminary dialogue with several potential acquisition targets that generate EBITDA ranging from $500K to $3 million, seeking to acquire businesses at less than 5x the seller’s EBITDA. The team is evaluating acquisition targets in both existing geographies and new potential markets ï,§ Importantly, if this dialogue comes to fruition, we believe we can drive cost synergies with most, if not all, of these targets, allowing our acquisition multiple to be lower than the seller’s sale multiple, as we have seen many sub-scale providers achieving lower margins than those demonstrated by VHG and NWM. We also believe we can port best practices to improve patient compliance and referrals, thus ultimately driving revenue “synergies” © 2018 Great Elm Capital Group, Inc. 14
Investment Management © 2018 Great Elm Capital Group, Inc. 15
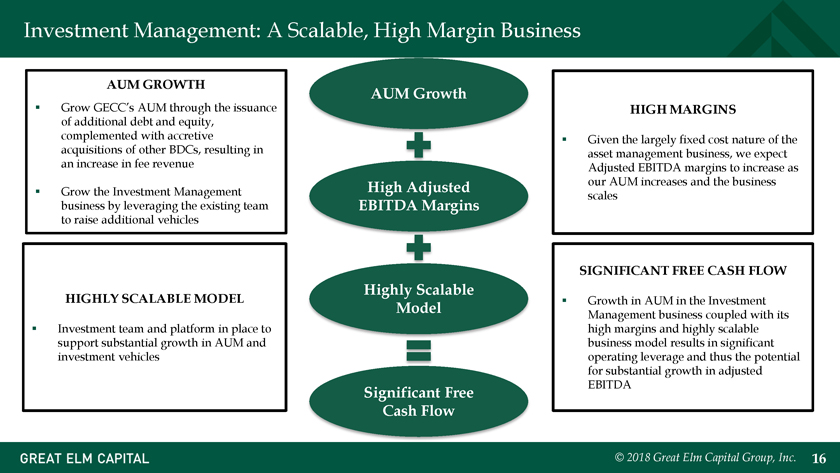
Investment Management: A Scalable, High Margin Business AUM GROWTH AUM Growth ï,§ Grow GECC’s AUM through the issuance HIGH MARGINS of additional debt and equity, complemented with accretive ï,§ Given the largely fixed cost nature of the acquisitions of other BDCs, resulting in asset management business, we expect an increase in fee revenue Adjusted EBITDA margins to increase as our AUM increases and the business ï,§ Grow the Investment Management High Adjusted scales business by leveraging the existing team EBITDA Margins to raise additional vehicles SIGNIFICANT FREE CASH FLOW Highly Scalable HIGHLY SCALABLE MODEL ï,§ Growth in AUM in the Investment Model Management business coupled with its ï,§ Investment team and platform in place to high margins and highly scalable support substantial growth in AUM and business model results in significant investment vehicles operating leverage and thus the potential for substantial growth in adjusted EBITDA Significant Free Cash Flow © 2018 Great Elm Capital Group, Inc. 16
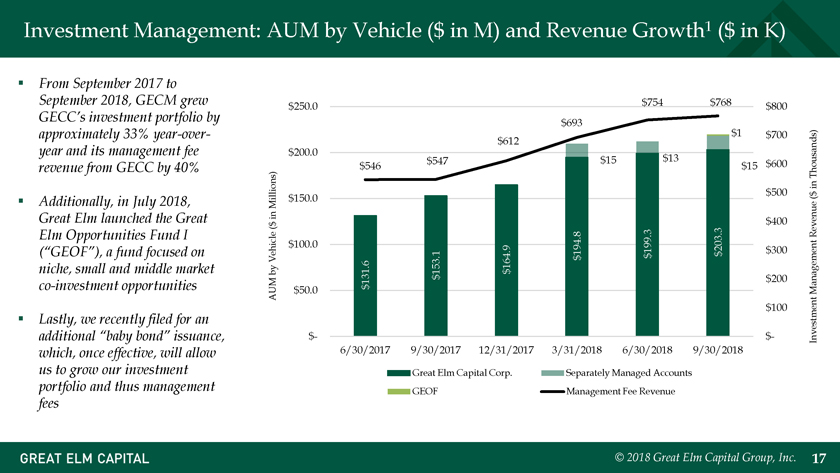
Investment Management: AUM by Vehicle ($ in M) and Revenue Growth1 ($ in K) ï,§ From September 2017 to September 2018, GECM grew $754 $768 $250.0 $800 GECC’s investment portfolio by $693 $1 approximately 33% year-over- $700 $612 year and its management fee $200.0 $547 $15 $13 $546 $15 $600 revenue from GECC by 40% Thousands) in $500 $ ï,§ Additionally, in July 2018, Millions) $150.0 ( in Great Elm launched the Great $ $400 Elm Opportunities Fund I ( Revenue $100.0 (“GEOF”), a fund focused on 194.8 199.3 203.3 $300 $$ Vehicle $ niche, small and middle market 164.9 by 153.1$ $ $200 131.6 co-investment opportunities $50.0 $ Management AUM ï,§ Lastly, we recently filed for an $100 additional “baby bond” issuance, $- $- Investment which, once effective, will allow 6/30/2017 9/30/2017 12/31/2017 3/31/2018 6/30/2018 9/30/2018 us to grow our investment Great Elm Capital Corp. Separately Managed Accounts portfolio and thus management GEOF Management Fee Revenue fees © 2018 Great Elm Capital Group, Inc. 17
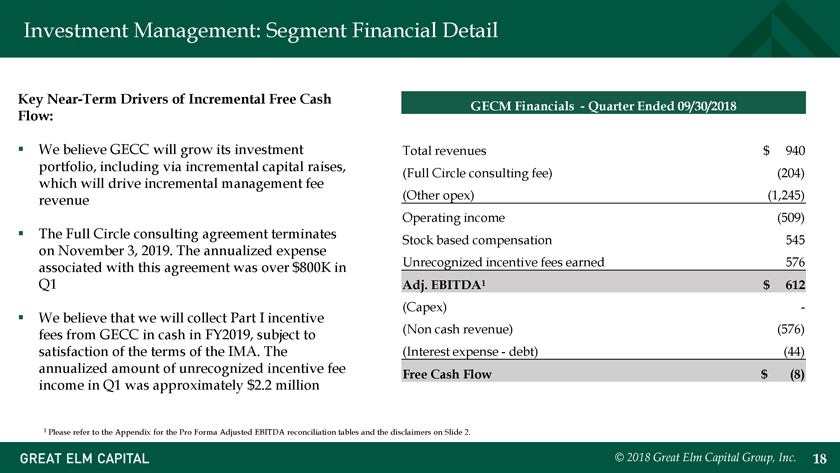
Investment Management: Segment Financial Detail Key Near-Term Drivers of Incremental Free Cash GECM Financials —Quarter Ended 09/30/2018 Flow: ï,§ We believe GECC will grow its investment Total revenues $ 940 portfolio, including via incremental capital raises, (Full Circle consulting fee) (204) which will drive incremental management fee (Other opex) (1,245) revenue Operating income (509) ï,§ The Full Circle consulting agreement terminates Stock based compensation 545 on November 3, 2019. The annualized expense Unrecognized incentive fees earned 576 associated with this agreement was over $800K in Q1 Adj. EBITDA1 $ 612 (Capex) —ï,§ We believe that we will collect Part I incentive fees from GECC in cash in FY2019, subject to (Non cash revenue) (576) satisfaction of the terms of the IMA. The (Interest expense—debt) (44) annualized amount of unrecognized incentive fee Free Cash Flow $ (8) income in Q1 was approximately $2.2 million 1 Please refer to the Appendix for the Pro Forma Adjusted EBITDA reconciliation tables and the disclaimers on Slide 2. © 2018 Great Elm Capital Group, Inc. 18

Real Estate © 2018 Great Elm Capital Group, Inc. 19
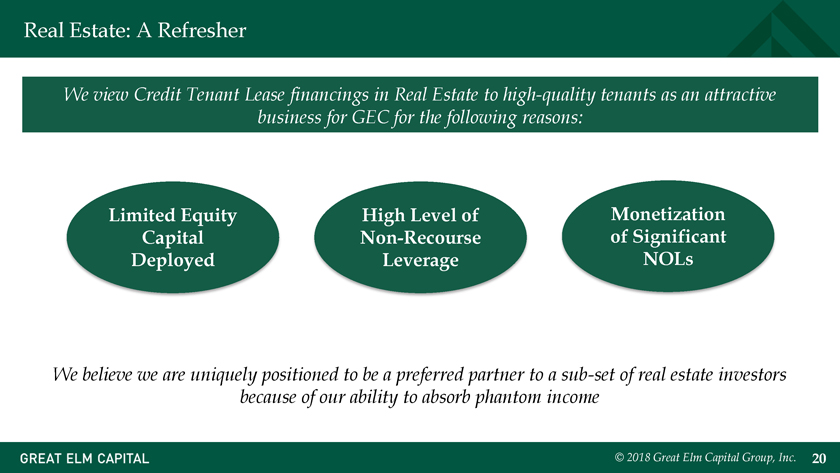
Real Estate: A Refresher We view Credit Tenant Lease financings in Real Estate to high-quality tenants as an attractive business for GEC for the following reasons: Limited Equity High Level of Monetization Capital Non-Recourse of Significant Deployed Leverage NOLs We believe we are uniquely positioned to be a preferred partner to a sub-set of real estate investors because of our ability to absorb phantom income © 2018 Great Elm Capital Group, Inc. 20
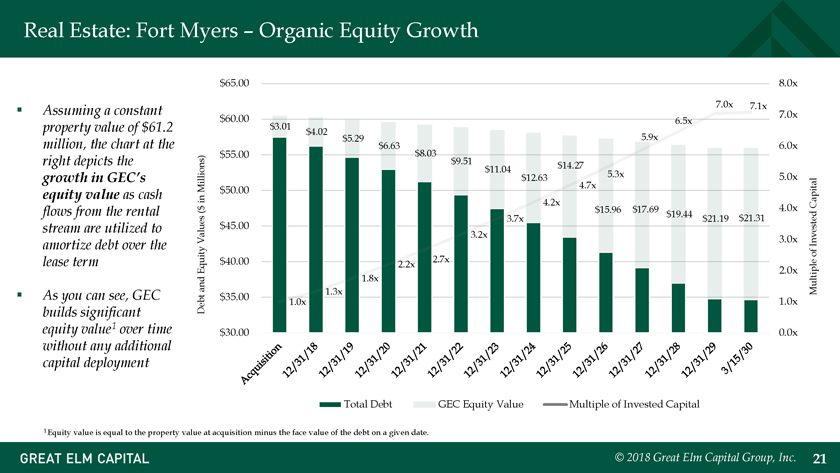
Real Estate: Fort Myers – Organic Equity Growth $65.00 8.0x ï,§ Assuming a constant 7.0x 7.1x $60.00 7.0x 6.5x property value of $61.2 $3.01 $4.02 million, the chart at the $5.29 5.9x $6.63 6.0x $55.00 $8.03 right depicts the $9.51 $11.04 $14.27 5.3x growth in GEC’s $12.63 5.0x Millions) $50.00 4.7x equity value as cash in $ 4.2x Capital flows from the rental ( $15.96 $17.69 4.0x 3.7x $19.44 $21.19 $21.31 stream are utilized to $45.00 3.2x Values 3.0x amortize debt over the Invested of lease term $40.00 2.7x 2.2x Equity 2.0x and 1.8x ï,§ As you can see, GEC $35.00 1.3x Multiple Debt 1.0x 1.0x builds significant equity value1 over time $30.00 0.0x without any additional capital deployment Total Debt GEC Equity Value Multiple of Invested Capital 1 Equity value is equal to the property value at acquisition minus the face value of the debt on a given date. © 2018 Great Elm Capital Group, Inc. 21
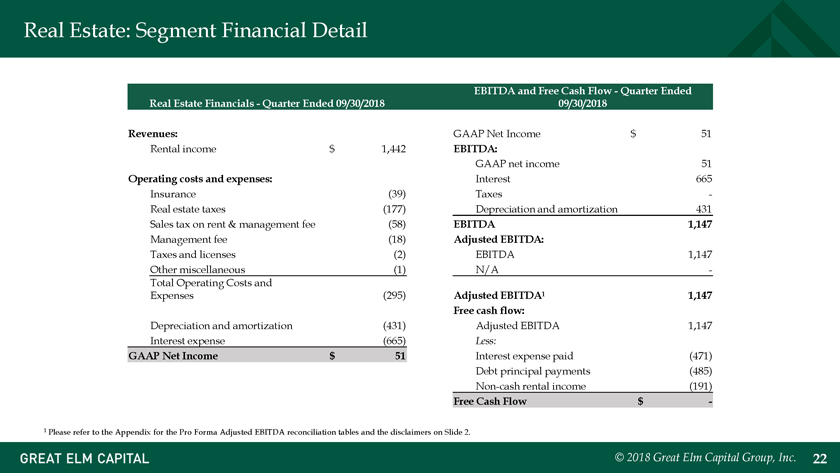
Real Estate: Segment Financial Detail EBITDA and Free Cash Flow—Quarter Ended Real Estate Financials—Quarter Ended 09/30/2018 09/30/2018 Revenues: GAAP Net Income $ 51 Rental income $ 1,442 EBITDA: GAAP net income 51 Operating costs and expenses: Interest 665 Insurance (39) Taxes -Real estate taxes (177) Depreciation and amortization 431 Sales tax on rent & management fee (58) EBITDA 1,147 Management fee (18) Adjusted EBITDA: Taxes and licenses (2) EBITDA 1,147 Other miscellaneous (1) N/A -Total Operating Costs and Expenses (295) Adjusted EBITDA1 1,147 Free cash flow: Depreciation and amortization (431) Adjusted EBITDA 1,147 Interest expense (665) Less: GAAP Net Income $ 51 Interest expense paid (471) Debt principal payments (485) Non-cash rental income (191) Free Cash Flow $ —1 Please refer to the Appendix for the Pro Forma Adjusted EBITDA reconciliation tables and the disclaimers on Slide 2. © 2018 Great Elm Capital Group, Inc. 22

Financial Review © 2018 Great Elm Capital Group, Inc. 23
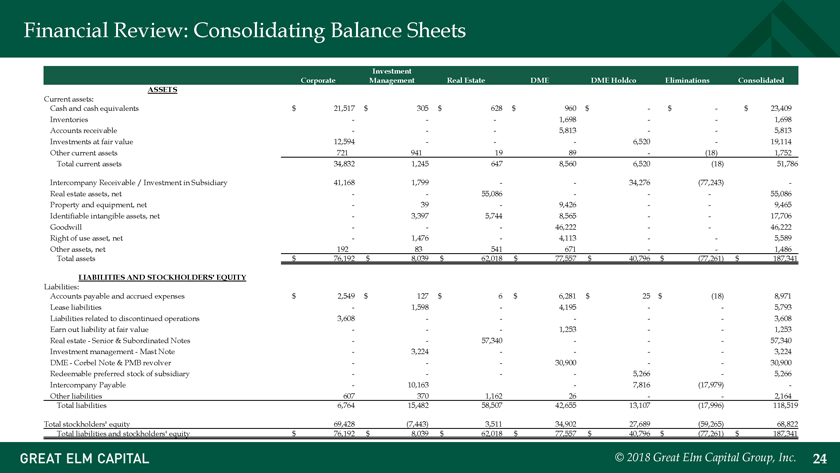
Financial Review: Consolidating Balance Sheets Investment Corporate Management Real Estate DME DME Holdco Eliminations Consolidated ASSETS Current assets: Cash and cash equivalents $ 21,517 $ 305 $ 628 $ 960 $ —$ — $ 23,409 Inventories — — 1,698 — — 1,698 Accounts receivable — — — 5,813 — — 5,813 Investments at fair value 12,594 — — — 6,520 — 19,114 Other current assets 721 941 19 89 — (18) 1,752 Total current assets 34,832 1,245 647 8,560 6,520 (18) 51,786 Intercompany Receivable / Investment in Subsidiary 41,168 1,799 — 34,276 (77,243) — Real estate assets, net — 55,086 — — — 55,086 Property and equipment, net — 39— 9,426 — — 9,465 Identifiable intangible assets, net — 3,397 5,744 8,565 — — 17,706 Goodwill —— 46,222 — — 46,222 Right of use asset, net — 1,476— 4,113 — — 5,589 Other assets, net 192 83 541 671 — — 1,486 Total assets $ 76,192 $ 8,039 $ 62,018 $ 77,557 $ 40,796 $ (77,261) $ 187,341 LIABILITIES AND STOCKHOLDERS’ EQUITY Liabilities: Accounts payable and accrued expenses $ 2,549 $ 127 $ 6 $ 6,281 $ 25 $ (18) 8,971 Lease liabilities — 1,598— 4,195 — — 5,793 Liabilities related to discontinued operations 3,608 — — — — 3,608 Earn out liability at fair value —— 1,253 — — 1,253 Real estate—Senior & Subordinated Notes — 57,340 — — — 57,340 Investment management—Mast Note — 3,224— — — — 3,224 DME—Corbel Note & PMB revolver —— 30,900 — — 30,900 Redeemable preferred stock of subsidiary —— — 5,266 — 5,266 Intercompany Payable — 10,163 — 7,816 (17,979) — Other liabilities 607 370 1,162 26 — — 2,164 Total liabilities 6,764 15,482 58,507 42,655 13,107 (17,996) 118,519 Total stockholders’ equity 69,428 (7,443) 3,511 34,902 27,689 (59,265) 68,822 Total liabilities and stockholders’ equity $ 76,192 $ 8,039 $ 62,018 $ 77,557 $ 40,796 $ (77,261) $ 187,341 © 2018 Great Elm Capital Group, Inc. 24
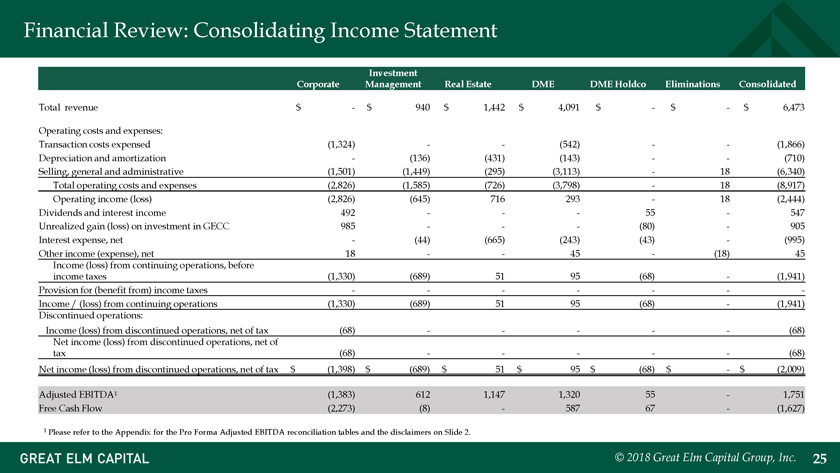
Financial Review: Consolidating Income Statement Investment Corporate Management Real Estate DME DME Holdco Eliminations Consolidated Total revenue $ —$ 940 $ 1,442 $ 4,091 $ —$ —$ 6,473 Operating costs and expenses: Transaction costs expensed (1,324) — — (542) — — (1,866) Depreciation and amortization — (136) (431) (143) — — (710) Selling, general and administrative (1,501) (1,449) (295) (3,113) — 18 (6,340) Total operating costs and expenses (2,826) (1,585) (726) (3,798) — 18 (8,917) Operating income (loss) (2,826) (645) 716 293 — 18 (2,444) Dividends and interest income 492 — — — 55 — 547 Unrealized gain (loss) on investment in GECC 985 — — — (80) — 905 Interest expense, net — (44) (665) (243) (43) — (995) Other income (expense), net 18 — — 45 — (18) 45 Income (loss) from continuing operations, before income taxes (1,330) (689) 51 95 (68) — (1,941) Provision for (benefit from) income taxes — — — — — — -Income / (loss) from continuing operations (1,330) (689) 51 95 (68) — (1,941) Discontinued operations: Income (loss) from discontinued operations, net of tax (68) — — — — — (68) Net income (loss) from discontinued operations, net of tax (68) — — — — — (68) Net income (loss) from discontinued operations, net of tax $ (1,398) $ (689) $ 51 $ 95 $ (68) $ —$ (2,009) Adjusted EBITDA1 (1,383) 612 1,147 1,320 55 — 1,751 Free Cash Flow (2,273) (8) — 587 67 — (1,627) 1 Please refer to the Appendix for the Pro Forma Adjusted EBITDA reconciliation tables and the disclaimers on Slide 2. © 2018 Great Elm Capital Group, Inc. 25
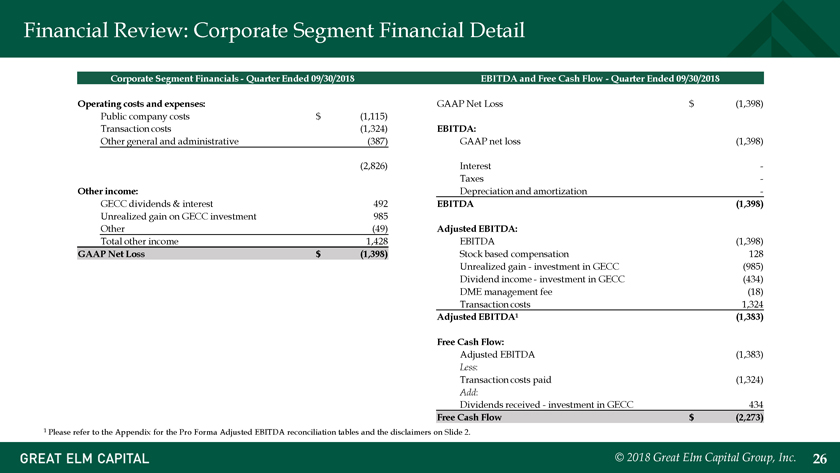
Financial Review: Corporate Segment Financial Detail Corporate Segment Financials—Quarter Ended 09/30/2018 EBITDA and Free Cash Flow—Quarter Ended 09/30/2018 Operating costs and expenses: GAAP Net Loss $ (1,398) Public company costs $ (1,115) Transaction costs (1,324) EBITDA: Other general and administrative (387) GAAP net loss (1,398) (2,826) Interest -Taxes -Other income: Depreciation and amortization -GECC dividends & interest 492 EBITDA (1,398) Unrealized gain on GECC investment 985 Other (49) Adjusted EBITDA: Total other income 1,428 EBITDA (1,398) GAAP Net Loss $ (1,398) Stock based compensation 128 Unrealized gain—investment in GECC (985) Dividend income—investment in GECC (434) DME management fee (18) Transaction costs 1,324 Adjusted EBITDA1 (1,383) Free Cash Flow: Adjusted EBITDA (1,383) Less: Transaction costs paid (1,324) Add: Dividends received—investment in GECC 434 Free Cash Flow $ (2,273) 1 Please refer to the Appendix for the Pro Forma Adjusted EBITDA reconciliation tables and the disclaimers on Slide 2. © 2018 Great Elm Capital Group, Inc. 26
Summary © 2018 Great Elm Capital Group, Inc. 27
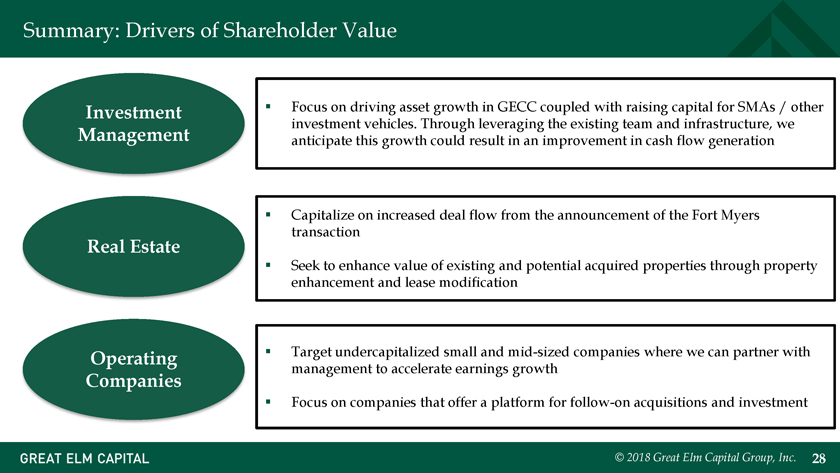
Summary: Drivers of Shareholder Value Investment ï,§ Focus on driving asset growth in GECC coupled with raising capital for SMAs / other investment vehicles. Through leveraging the existing team and infrastructure, we Management anticipate this growth could result in an improvement in cash flow generation ï,§ Capitalize on increased deal flow from the announcement of the Fort Myers Real Estate transaction ï,§ Seek to enhance value of existing and potential acquired properties through property enhancement and lease modification Operating ï,§ Target undercapitalized small and mid-sized companies where we can partner with management to accelerate earnings growth Companies ï,§ Focus on companies that offer a platform for follow-on acquisitions and investment © 2018 Great Elm Capital Group, Inc. 28
Q&A © 2018 Great Elm Capital Group, Inc. 29
Appendix © 2018 Great Elm Capital Group, Inc. 30
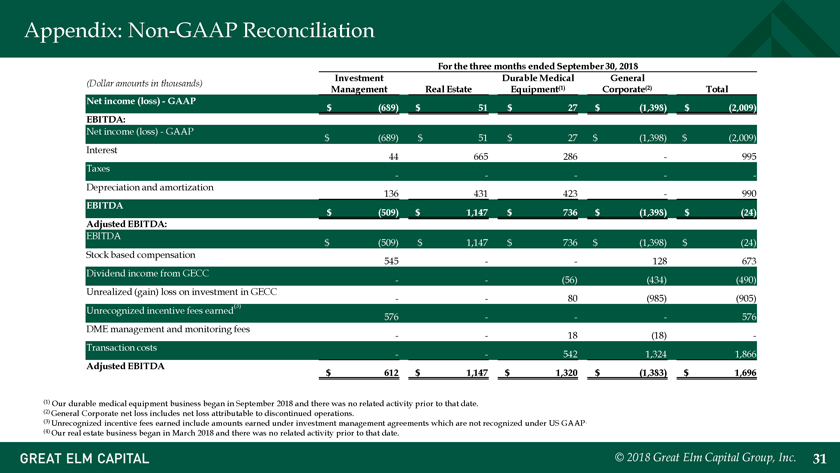
Appendix: Non-GAAP Reconciliation For the three months ended September 30, 2018 Investment Durable Medical General (Dollar amounts in thousands) Management Real Estate Equipment(1) Corporate(2) Total Net income (loss)—GAAP $ (689) $ 51 $ 27 $ (1,398) $ (2,009) EBITDA: Net income (loss)—GAAP $ (689) $ 51 $ 27 $ (1,398) $ (2,009) Interest 44 665 286 — 995 Taxes — — — — -Depreciation and amortization 136 431 423 — 990 EBITDA $ (509) $ 1,147 $ 736 $ (1,398) $ (24) Adjusted EBITDA: EBITDA $ (509) $ 1,147 $ 736 $ (1,398) $ (24) Stock based compensation 545 — — 128 673 Dividend income from GECC — — (56) (434) (490) Unrealized (gain) loss on investment in GECC (3) — — 80 (985) (905) Unrecognized incentive fees earned 576 — — — 576 DME management and monitoring fees — — 18 (18) -Transaction costs — — 542 1,324 1,866 Adjusted EBITDA $ 612 $ 1,147 $ 1,320 $ (1,383) $ 1,696 (1) Our durable medical equipment business began in September 2018 and there was no related activity prior to that date. (2) General Corporate net loss includes net loss attributable to discontinued operations. (3) Unrecognized incentive fees earned include amounts earned under investment management agreements which are not recognized under US GAAP. (4) Our real estate business began in March 2018 and there was no related activity prior to that date. © 2018 Great Elm Capital Group, Inc. 31
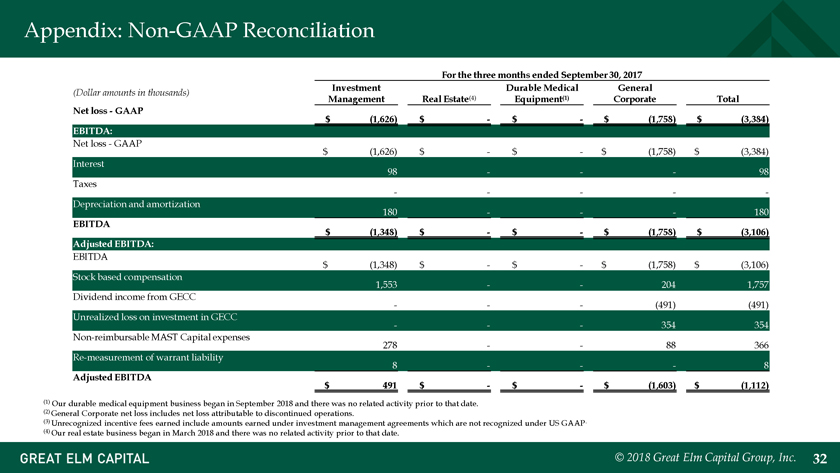
Appendix: Non-GAAP Reconciliation For the three months ended September 30, 2017 Investment Durable Medical General (Dollar amounts in thousands) Management Real Estate(4) Equipment(1) Corporate Total Net loss—GAAP $ (1,626) $ —$ —$ (1,758) $ (3,384) EBITDA: Net loss—GAAP $ (1,626) $ —$ —$ (1,758) $ (3,384) Interest 98 — — — 98 Taxes — — — — -Depreciation and amortization 180 — — — 180 EBITDA $ (1,348) $ —$ —$ (1,758) $ (3,106) Adjusted EBITDA: EBITDA $ (1,348) $ —$ —$ (1,758) $ (3,106) Stock based compensation 1,553 — — 204 1,757 Dividend income from GECC — — — (491) (491) Unrealized loss on investment in GECC — — — 354 354 Non-reimbursable MAST Capital expenses 278 — — 88 366 Re-measurement of warrant liability 8 — — — 8 Adjusted EBITDA $ 491 $ —$ —$ (1,603) $ (1,112) (1) Our durable medical equipment business began in September 2018 and there was no related activity prior to that date. (2) General Corporate net loss includes net loss attributable to discontinued operations. (3) Unrecognized incentive fees earned include amounts earned under investment management agreements which are not recognized under US GAAP. (4) Our real estate business began in March 2018 and there was no related activity prior to that date. © 2018 Great Elm Capital Group, Inc. 32
Appendix: Contact Information Investor Relations Meaghan K. Mahoney Senior Vice President 800 South Street, Suite 230 Waltham, MA 02453 Phone: +1 (617) 375-3006 investorrelations@greatelmcap.com © 2018 Great Elm Capital Group, Inc. 33