Attached files
Table of Contents
UNITED STATES
SECURITIES AND EXCHANGE COMMISSION
Washington, D.C. 20549
FORM 10-K
| x | ANNUAL REPORT PURSUANT TO SECTION 13 OR 15(d) OF THE SECURITIES EXCHANGE ACT OF 1934 |
For the fiscal year ended June 30, 2012
or
| ¨ | TRANSITION REPORT PURSUANT TO SECTION 13 OR 15(d) OF THE SECURITIES EXCHANGE ACT OF 1934 |
For the transition period from to
Commission file number: 001-16073
UNWIRED PLANET, INC.
(Exact name of registrant as specified in its charter)
| Delaware | 94-3219054 | |
| State or other jurisdiction of incorporation or organization |
(I.R.S. Employer Identification No.) | |
| 2100 Seaport Blvd. Redwood City, California | 94063 | |
| (Address of principal executive offices) | (Zip Code) |
Registrant’s telephone number, including area code
(650) 480-8000
Securities registered pursuant to Section 12(b) of the Act:
| Title of each class |
Name of each exchange on which registered | |
| Common Stock, $0.001 Par Value | The NASDAQ Stock Market LLC (NASDAQ Global Select Market) |
Securities registered pursuant to section 12(g) of the Act:
None
(Title of Class)
Indicate by check mark if the registrant is a well-known seasoned issuer, as defined in Rule 405 of the Securities Act. Yes ¨ No x
Indicate by check mark if the registrant is not required to file reports pursuant to Section 13 or Section 15(d) of the Act. Yes ¨ No x
Indicate by check mark whether the registrant (1) has filed all reports required to be filed by Section 13 or 15(d) of the Securities Exchange Act of 1934 during the preceding 12 months (or for such shorter period that the registrant was required to file such reports), and (2) has been subject to such filing requirements for the past 90 days. Yes x No ¨
Indicate by check mark whether the registrant has submitted electronically and posted on its corporate Web site, if any, every Interactive Data File required to be submitted and posted pursuant to Rule 405 of Regulation S-T (§232.405 of this chapter) during the preceding 12 months (or for such shorter period that the registrant was required to submit and post such files). Yes x No ¨
Indicate by check mark if disclosure of delinquent filers pursuant to Item 405 of Regulation S-K (§229.405 of this chapter) is not contained herein, and will not be contained, to the best of registrant’s knowledge, in definitive proxy or information statements incorporated by reference in Part III of this Form 10-K or any amendment to this Form 10-K. x
Indicate by check mark whether the registrant is a large accelerated filer, an accelerated filer, a non-accelerated filer, or a smaller reporting company. See the definitions of “large accelerated filer,” “accelerated filer,” and “smaller reporting company” in Rule 12b-2 of the Exchange Act.
| Large accelerated filer ¨ | Accelerated filer x | |
| Non-accelerated filer ¨ (Do not check if a smaller reporting company) |
Smaller reporting company ¨ |
Indicate by check mark whether the registrant is a shell company (as defined in Rule 12b-2 of the Act): Yes ¨ No x
The aggregate market value of the voting stock held by non-affiliates of the registrant was approximately $134,990,661 as of December 31, 2011 based upon the closing sale price on the NASDAQ Global Select Market reported for such date. Shares of Common Stock held by each officer and director have been excluded in that such persons may be deemed to be affiliates. Shares of Common Stock held by other persons, including persons who own more than 5% of the outstanding shares of common stock, have not been excluded in that such persons are not deemed to be affiliates. This determination of affiliate status is not necessarily a conclusive determination for other purposes.
There were 90,311,159 shares of the registrant’s Common Stock issued and outstanding as of August 31, 2012.
DOCUMENTS INCORPORATED BY REFERENCE
The following documents, or portions thereof, are incorporated by reference into the following parts of this Form 10-K:
Proxy Statement for the 2012 Annual Meeting of Stockholders—Part III, Items 10, 11, 12, 13 and 14.
Table of Contents
| Page | ||||||
| PART I |
||||||
| Item 1. |
1 | |||||
| Item 1A. |
4 | |||||
| Item 1B. |
12 | |||||
| Item 2. |
12 | |||||
| Item 3. |
12 | |||||
| Item 4. |
14 | |||||
| PART II |
||||||
| Item 5. |
15 | |||||
| Item 6. |
16 | |||||
| Item 7. |
Management’s Discussion and Analysis of Financial Condition and Results of Operations |
17 | ||||
| Item 7A. |
31 | |||||
| Item 8. |
32 | |||||
| Item 9. |
Changes in and Disagreements With Accountants on Accounting and Financial Disclosure |
34 | ||||
| Item 9A. |
34 | |||||
| Item 9B. |
34 | |||||
| PART III |
||||||
| Item 10. |
35 | |||||
| Item 11. |
35 | |||||
| Item 12. |
Security Ownership of Certain Beneficial Owners and Management and Related Stockholder Matters |
35 | ||||
| Item 13. |
Certain Relationships and Related Transactions, and Director Independence |
36 | ||||
| Item 14. |
36 | |||||
| PART IV |
||||||
| Item 15. |
37 | |||||
| 38 | ||||||
Table of Contents
Forward-Looking Statements
In addition to historical information, this Annual Report on Form 10-K (“Annual Report”) contains forward-looking statements within the meaning of Section 27A of the Securities Act of 1933, as amended (the “Securities Act”), and Section 21E of the Securities Exchange Act of 1934 (the “Exchange Act”). These forward-looking statements are based upon current expectations and beliefs of our management and are subject to numerous risks and uncertainties, including economic and market variables. Words such as “expects”, “intends”, “plans”, “believes”, “estimates” and similar expressions identify such forward-looking statements. Forward-looking statements include, among other things, statements regarding our ability to successfully realize the value of our intellectual property, our success in litigation and enforcement actions, the information and expectations concerning our future financial performance and potential or expected growth in the markets which relate to our intellectual property, business strategy, projected plans and objectives, the regulatory environment related to our business and our intellectual property, anticipated cost savings from restructurings, and our estimates with respect to future operating results. These forward-looking statements are merely predictions, not historical facts, and are subject to risks and uncertainties that could cause actual results to differ materially from those indicated in the forward-looking statements. These risks and uncertainties include our ability to realize the value of our patents, the uncertainty of our business model, the risks associated with patent litigation, the uncertainty of the regulatory environment, our ability to acquire patents, our ability to retain management and key personnel, and the other risks discussed below in “Item 1A. Risk Factors.” The occurrence of the events described above or in “Item 1A. Risk Factors” below could harm our business, results of operations and financial condition. These forward-looking statements are made as of the date of this Annual Report and we undertake no obligation to revise or publicly release the results of any revision to these forward-looking statements. Readers should carefully review the risk factors described below and in any subsequently filed reports.
PART I
Unwired Planet, Inc. (referred to as “Unwired Planet”, “our”, “we” or “us”) is an intellectual property and technology licensing company. Over the years, we have amassed a patent portfolio of approximately 200 issued United States and foreign patents and approximately 75 pending applications, many of which are considered formative to mobile communications and span smart devices, cloud technologies and unified messaging.
Unwired Planet, formerly known as Openwave Systems Inc., was incorporated in 1994 as a Delaware corporation, and we completed our initial public offering in June 1999. Our principal executive offices are located at 2100 Seaport Boulevard, Redwood City, CA 94063. Our telephone number is (650) 480-8000. Our Annual Report on Form 10-K, Quarterly Reports on Form 10-Q, Current Reports on Form 8-K, and amendments to those reports filed or furnished pursuant to the Securities Exchange Act of 1934, are available free of charge through our website at www.unwiredplanet.com, as soon as reasonably practicable after we file or furnish such material with the Securities and Exchange Commission (SEC). Information contained on our website is not incorporated by reference to this Annual Report.
Unwired Planet is focused on pursuing a multi-pronged strategy to realize the value of our patent portfolio, which ranges from direct licensing or sale of our patents, litigation, joint ventures, and partnering with one or more intellectual property specialists. We generate revenue by licensing our patented innovations and technologies to companies that develop mobile communications software infrastructure or hardware and/or develop mobile communications products. Our goal is to continue to create additional licensing opportunities.
1
Table of Contents
Background
Our company began in 1994 as Libris, Inc. and quickly became known as Unwired Planet. In 1999, Unwired Planet acquired Apiion, Ltd. of Belfast, Ireland and changed its name to Phone.com. After acquiring several high-tech startup companies and merging with Software.com in 2001, we changed our name to Openwave Systems, Inc., focusing on the development and delivery of mobile and fixed broadband software infrastructure to a global base of communication service providers.
In January 2012, we announced the pursuit of strategic alternatives to divest our product businesses and narrow our focus on our intellectual property business. On February 1, 2012, we sold our location business to Persistent Telecom Solutions Inc. (“Persistent”), a wholly-owned subsidiary of Persistent Systems Ltd., a leader in software product development. On April 30, 2012, we completed the sale of our mediation and messaging product businesses to Openwave Mobility, Inc. (formerly, OM1, Inc., “Openwave Mobility”), a portfolio company of Marlin Equity Partners, a private investment firm.
Unwired Planet is now solely focused on a multi-pronged intellectual property strategy that includes, among other things, licensing and, when necessary, litigation to protect the value of its patent portfolio. In May 2012, we officially changed our name back to Unwired Planet, a name which recalls the formative years when many of our foundational mobile communication patents were filed, and began trading on NASDAQ under the new symbol: UPIP.
Target Licensees
In October 2010, we signed our first licensing agreement with Mobixell/724, and in November 2011 we announced a licensing deal with Microsoft that covers our portfolio of approximately 200 patents.
In August 2011, we filed a complaint with the International Trade Commission (“ITC”) in Washington, DC, against Apple Inc. (“Apple”) and Research In Motion Limited in order to protect our intellectual property that pertains to how mobile devices connect to the Internet. We also simultaneously filed a similar complaint in federal district court in Delaware. We believe that these large companies should pay us to use the technologies that we invented—particularly in light of the substantial revenue these companies have earned from devices that we believe use our patented technology.
Intellectual Property Focus
Unwired Planet established many of the foundational patents that allow mobile devices to connect to the Internet. Over the years, we have amassed a patent portfolio of approximately 200 issued United States and foreign patents and approximately 75 pending applications, many of which are considered foundational to mobile communications.
Unwired Planet’s founding team was among the first to consider and solve the technical and practical problems of accessing useful data on mobile devices, such as the Internet, user data and access to a variety of personal and enterprise applications, solutions for which are reflected in our earliest patents. Developing and deploying these groundbreaking solutions led to a robust and continuous pattern of creativity and innovation in mobility. Inventors at Unwired Planet focused on many forms of data and improved ways in which this data could be transferred, accessed, secured and used, both from the perspective of a mobile device and from the perspective of networks and servers communicating with mobile devices.
2
Table of Contents
For example, Unwired Planet and its subsidiaries invented in the areas of wireless push and broadcast, device provisioning and application access, messaging, location services, advertising, mobile payments, fleet management, authentication and privacy. Unwired Planet contributed fundamental principles to the marketplace of ideas upon which today’s mobile industry is built, with broad contributions benefiting wireless network operators, smartphone manufacturers, cloud service providers and essentially all mobile application developers.
Operating Environment and Trends
A licensing strategy requires other parties to be reasonable and willing to work out a fair royalty arrangement. In fact, many of these parties have teams in place precisely for the purpose of delaying or avoiding such a royalty discussion. Our potential licensees’ willingness and ability to pay reasonable royalties is, in part, affected by the number of patents infringed by a particular licensee product, the concentration of the holders of those patents, the licensee’s cost of licensing those patents, and the profitability of the infringing product.
Reasonable royalties for our patented inventions are best secured through negotiated license agreements thereby avoiding the uncertainties of litigation. Obtaining reasonable royalties for the use of our patents is generally dependent upon:
| • | Demonstrating infringement of claimed inventions; |
| • | Defeating arguments that our patents are invalid or unenforceable; and |
| • | Providing data supporting the royalties we are seeking. |
Some of the companies that we believe use our patented technology may not voluntarily enter into license agreements. As a result, we have developed abilities to plan, execute and sustain litigation campaigns and enforcements to protect our patent portfolio.
Competition
We believe that our principal competition for our patents may come from our prospective licensees, some of whom are evaluating and developing products based on technologies that they contend or may contend will not require a license from us. These companies include but are not limited to: communication service providers, handset manufacturers, software providers using mobile communications and mobile product companies. To the extent that these companies perceive there is no requirement to pay Unwired Planet royalties, or to the extent other factors influence the industry, our licensees and prospective licensees may adopt and promote alternative technologies. Even to the extent we determine that such alternative technologies infringe our patents, there can be no assurance that we would be able to negotiate agreements that would result in royalties being paid to us without litigation, which could be costly and the results of which would be uncertain. Litigation has been, and may continue to be, required to enforce and protect our intellectual property rights.
Employees
As of June 30, 2012, we had 37 employees. We anticipate a further reduction in our headcount once we complete the performance of services under the Transition Services Agreement (“TSA”) we entered into with Openwave Mobility, the buyer of the mediation and messaging product lines.
3
Table of Contents
Financial Information about Geographic Areas
For Unwired Planet’s financial information about geographic areas, please see Note 5 to the Consolidated Financial Statements included in this Annual Report on Form 10-K.
Our business is subject to a number of risks, many of which are described below. If any of the events described in these risks factors actually occur, our business, financial condition or results of operations could be materially and adversely affected, which would likely have a corresponding impact on the value of our common stock. Further, the risk factors described below could cause actual results to differ materially from the results contemplated by the forward-looking statements contained in this report. These risk factors should be reviewed carefully.
Risks Related to Our Business
Our efforts to realize the value of our patents may not be successful, which may lead to expensive and time-consuming litigation.
We rely on patent laws to protect our intellectual property or proprietary rights, although we believe that other factors such as the technological and creative skills of our personnel are also essential to maintaining a technology leadership position. We also rely on trademark law to protect the value of our corporate brand and reputation. In addition, we have divested our product businesses and intend to take actions to realize the value of our patent portfolio by pursuing patent licensing agreements and/or litigation. These efforts may not result in additional revenues, and may also result in counter-claims of non-infringement or invalidity being raised by third parties.
Despite our efforts to license and protect our intellectual property and proprietary rights, unauthorized parties may copy or otherwise obtain and use our technology or trademarks. Effectively policing and enforcing our intellectual property is time consuming and costly, and the steps taken by us may not prevent infringement of our intellectual property or proprietary rights and trademarks, particularly in foreign countries where in many instances the local laws or legal systems do not offer the same level of protection as in the United States.
We have brought legal action against Apple Inc. and Research In Motion in our efforts to realize the value of our patents, which may be expensive and time-consuming and may lead to outcomes and counterclaims against us that may have an adverse effect on our business.
We have filed a complaint with the ITC in Washington, DC, with Apple Inc. (“Apple”), Research In Motion Ltd. and Research In Motion Corp. as proposed respondents, requesting that the ITC bar Apple and the Research In Motion entities from importing into the United States their products, including smart devices and tablet computers, that infringe our patents cited in the complaint. The complaint alleges that Apple and RIM infringe upon four of our patents that cover technology that gives consumers access to the Internet from their mobile devices. We also filed a similar complaint against Apple and RIM in the federal district court of Delaware, asserting the same claims and seeking an injunction and damages. These lawsuits may be time consuming and costly, and result in the significant diversion of management’s attention. Further, as is typical in lawsuits like these, Apple and RIM have asserted counterclaims challenging the validity of our patents. Although we believe that our position is well founded, intellectual property litigation is uncertain, and if we are not able to prevail on our claims, our ability to collect royalties from our patents will be substantially undermined.
4
Table of Contents
We may become involved in litigation proceedings related to our former customers.
We have retained certain ongoing liabilities with respect to indemnification claims related to our former customers that were initiated prior to the closing of the sale of our Messaging and Mediation product businesses to Openwave Mobility and the sale of our location product business to Persistent Telecom Solutions. Although we have not elected to do so in the past, we may elect to seek a license or otherwise settle outstanding claims of infringement. Any litigation related to such indemnification claims could be costly and time consuming and could divert our management and key personnel from our intellectual property strategy and our business operations. The complexity of the technology involved increases the risks associated with intellectual property litigation. Royalty or licensing arrangements, if required, may not be available on terms acceptable to us, if at all. Any infringement claim successfully asserted against us by one of our former customers which arose prior to the closing of the sale of our Messaging and Mediation product business or the sale of our location products for which we have retained liability could result in costly litigation as well as the payment of substantial damages or an injunction.
Our revenues may be unpredictable, and this may harm our financial condition.
Our business strategy to realize the value of our patent portfolio, which may include acquiring patents and patent applications, is expected to be unpredictable and volatile with respect to revenues in future periods. Our patent portfolio includes 200 issued U.S. and foreign patents and 75 pending patent applications and covers technologies used in a wide variety of industries. Acquisitions of additional intellectual property may expand and diversify our revenue generating opportunities. However, due to the nature of a licensing business and uncertainties regarding the amount and timing of the receipt of license and other fees from licensees or potential infringers, stemming primarily from uncertainties regarding the outcome of enforcement actions, the growth rates of our existing licensees and certain other factors, our revenues may vary significantly from quarter to quarter, which could make our business difficult to manage, adversely affect our business and operating results, cause our quarterly results to fall below market expectations and adversely affect the market price of our common stock.
Focusing our business model on realizing the value of our intellectual property is a relatively recent initiative and may not result in anticipated benefits.
We announced the divestiture of our products business in April 2012 and are focusing our efforts on realizing the value of our intellectual property. We have a limited operating history and a limited track record with respect to our intellectual property strategy, which could make it difficult to evaluate our current business and future prospects. We have encountered and will continue to encounter risks and difficulties frequently experienced by companies with evolving business strategies. If we do not manage these risks successfully, our business and operating results will be adversely affected. In addition, our intellectual property strategy may have other adverse consequences, such as employee attrition, the loss of employees with valuable knowledge or expertise or a negative impact on employee morale. Our strategy may place increased demands on our personnel and could adversely affect our ability to attract and retain talent, and to perform our accounting, finance and administrative functions. We may not realize all of the anticipated benefits of our prior or any future strategies.
We have a history of losses and we may not be able to achieve or maintain consistent profitability.
We have a history of losses and may not be able to maintain consistent profitability. Except for fiscal 2006, we have incurred annual net losses since our inception. As of June 30, 2012, we had an accumulated deficit of approximately
5
Table of Contents
$3.1 billion, which includes approximately $2.1 billion of goodwill amortization and impairment. We expect to continue to spend significant amounts to execute our intellectual property initiatives, which may not generate significant revenue in future periods. Our prospects must be considered in light of the risks, expenses, delays and difficulties frequently encountered by companies with business strategies similar to ours.
If we are unable to substantially utilize our net operating loss carryforwards, our financial results will be adversely affected.
As of June 30, 2012, we had net operating loss, or NOL, carryforwards for U.S. federal and state income tax purposes of approximately $1.6 billion and $601.8 million, respectively. Under Section 382 of the Internal Revenue Code, a corporation that undergoes an “ownership change” may be subject to limitations on its ability to utilize its pre-change NOLs to offset future taxable income. In general, an ownership change occurs if the aggregate stock ownership of certain stockholders (generally 5% stockholders, applying certain look-through and aggregation rules) increases by more than 50% over such stockholders’ lowest percentage ownership during the testing period (generally three years). Purchases of our common stock in amounts greater than specified levels, which will be beyond our control, could create a limitation on our ability to utilize our NOLs for tax purposes in the future. Although we have taken steps to preserve our ability to utilize our NOLs, such efforts may not be successful. Limitations imposed on our ability to utilize NOLs could cause U.S. federal and state income taxes to be paid earlier than would be paid if such limitations were not in effect and could cause such NOLs to expire unused, in each case reducing or eliminating the benefit of such NOLs. Furthermore, we may not be able to generate sufficient taxable income to utilize our NOLs before they expire. If any of these events occur, we may not derive some or all of the expected benefits from our NOLs. In addition, at the state level there may be periods during which the use of NOLs is suspended or otherwise limited, which would accelerate or may permanently increase state taxes owed.
If we are unable to successfully maintain or license existing patents or develop and acquire new patents and patent applications, our ability to generate revenues could be substantially impaired.
Our ability to compete in the future will depend on our continued efforts and success in licensing existing patents, including maintaining and prosecuting our patents properly, and may include acquiring new patents and patent applications with licensing and enforcement opportunities. While we expect for the foreseeable future to have sufficient liquidity and capital resources to maintain the level of maintenance and/or acquisitions necessary, various factors may require us to have greater liquidity and capital resources than we currently expect. If we are unable to successfully maintain and license our existing patents and acquire new patents and patent applications, our ability to generate revenues could be substantially impaired and our business and financial condition could be materially harmed.
Our success may depend in part upon our ability to retain the best legal counsel to represent us in patent enforcement litigation.
The success of our intellectual property licensing business may depend upon our ability to retain the best legal counsel to prosecute patent infringement litigation. As our patent enforcement actions increase, it may become more difficult to find the best legal counsel to handle all of our cases because many of the best law firms may have a conflict of interest that prevents their representation of us.
6
Table of Contents
In connection with patent enforcement actions that we may conduct, a court may rule that we have violated certain statutory, regulatory, federal, local or governing rules or standards, which may expose us to certain material liabilities.
In connection with any of our patent enforcement actions, it is possible that a defendant may request and/or a court may rule that we have violated statutory authority, regulatory authority, federal rules, local court rules, or governing standards relating to the substantive or procedural aspects of such enforcement actions. In such event, a court may issue monetary sanctions against us or award attorney’s fees and/or expenses to a defendant(s), which could be material, and if we are required to pay such monetary sanctions, attorneys’ fees and/or expenses, such payment could materially harm our operating results and our financial position.
Our exposure to uncontrollable outside influences, including new legislation and court rulings or actions by the United States Patent and Trademark Office, could adversely affect our ability to execute on our patent strategy and licensing initiatives and our results of operations.
We may spend a significant amount of resources to enforce existing and any newly acquired patents. If new legislation, regulations or rules are implemented either by Congress, the U.S. Patent and Trademark Office, or USPTO, or the courts that impact the patent application process, the patent enforcement process or the rights of patent holders, these changes could negatively affect our expenses and revenue. For example, new rules regarding the burden of proof in patent enforcement actions could significantly increase the cost of any enforcement actions, and new standards or limitations on liability for patent infringement could negatively impact our revenue derived from such enforcement actions.
In addition, it is difficult to predict the outcome of patent enforcement litigation at the trial level and the amount of time it may take to complete an enforcement action. It is often difficult for juries and trial judges to understand complex patents and patent applications, and as a result, there is a higher rate of successful appeals in patent enforcement litigation than more standard business litigation. Such appeals are expensive and time consuming, resulting in increased costs and delayed revenue. Although we intend to diligently pursue enforcement litigation, we cannot predict with significant reliability the decisions made by juries and trial courts.
Our acquisitions of patents and patent applications may be time consuming, complex and costly, which could adversely affect our operating results.
Our acquisitions of patents and patent applications may be time consuming, complex and costly to consummate. We may utilize many different transaction structures in our acquisitions and the terms of the acquisition agreements may be very heavily negotiated. As a result, we may incur significant operating expenses during the negotiations even where the acquisition is ultimately not consummated. In addition, as a result of any future acquisitions, we might need to issue additional equity securities, spend our cash or incur debt or assume significant liabilities, any of which could adversely affect our business and results of operations. Even if we successfully acquire particular patents, there is no guarantee that we will generate sufficient revenue related to those patents to offset the acquisition costs. While we intend to conduct confirmatory due diligence on the patents we are considering for acquisition, we may acquire patents from a seller who does not have proper title to those assets. In those cases, we may be required to spend significant resources to defend our interests in the patents and, if we are not successful, our acquisition may be invalid, in which case we could lose part or all of our investment in the patents.
7
Table of Contents
We may be unable to effectively manage future growth, if any, that we may achieve.
As a result of our efforts to control costs through restructurings and otherwise, our ability to effectively manage and control any future growth may be limited. To manage any growth, our management must continue to improve our operational, information and financial systems, procedures and controls and expand, train, retain and manage our employees. If our systems, procedures and controls are inadequate to support our operations, any expansion could decrease or stop, and investors may lose confidence in our operations or financial results. If we are unable to manage growth effectively, our business and operating results could be adversely affected, and any failure to develop and maintain adequate internal controls could cause the trading price of our shares to decline substantially.
Compliance with laws, rules and regulations relating to corporate governance and public disclosure may result in additional expenses.
Federal securities laws, rules and regulations, as well as NASDAQ rules and regulations, require companies to maintain extensive corporate governance measures, impose comprehensive reporting and disclosure requirements, set strict independence and financial expertise standards for audit and other committee members and impose civil and criminal penalties for companies and their chief executive officers, chief financial officers and directors for securities law violations. These laws, rules and regulations and the interpretation of these requirements are evolving, and we are making investments to evaluate current practices and to continue to achieve compliance. As a result, our compliance programs have increased and will continue to increase general and administrative expenses and have diverted and will continue to divert management’s time and attention from revenue-generating activities. Further, in July 2010, Congress enacted the Dodd-Frank Wall Street Reform and Consumer Protection Act (the “Dodd-Frank Act”) which includes various provisions requiring the Securities and Exchange Commission to adopt new rules and regulations with respect to enhanced investor protection, corporate governance and executive compensation. We expect the Dodd-Frank Act and the rules and regulations promulgated thereunder to increase our legal and financial compliance costs and to make some activities more time consuming and costly.
As we reduce our management and other personnel in connection with and following the sale of our businesses, our remaining management team and other personnel may face increased demands and we may not be able to operate our business effectively, execute on our business objectives or comply with the laws and regulations applicable to us.
In connection with the sale of our businesses, we have and will continue to reduce our personnel, including members of management. As a result, future members of management and our personnel may face significant demands in order to operate our business. If our management is unable to effectively operate our business and pursue our business objectives as a result of the reduction in personnel and other resources, our results of operations could suffer and the market price of our stock could decline.
As a public company, we are subject to the Exchange Act, the Sarbanes-Oxley Act, the Dodd-Frank Act, the listing requirements of NASDAQ and other applicable securities rules and regulations requiring us to, among other things, satisfy certain corporate governance requirements, file periodic reports with respect to our business and operating results and maintain effective disclosure controls and procedures and internal control over financial reporting. Our management and other personnel currently do, and will continue to, devote a substantial amount of time and resources to ensure that we comply with these requirements. However, with the reduction in personnel due to the sale of our businesses, the demands on our management and other personnel will increase and their time and attention may
8
Table of Contents
be diverted. We may need to hire more employees in the future or engage outside consultants to ensure that we are able to comply with these requirements, which will increase our costs and expenses. If we are not able to comply with the requirements of the rules and regulations applicable to us in a timely manner, we could be subject to sanctions or investigations by the SEC or other regulatory authorities, which would require additional financial and management resources, and our investors may not have access to timely information.
We face litigation risks that could have a material adverse effect on our company.
We may be the subject of private or government actions. For example, in the past we have been the subject of several shareholder derivative lawsuits relating to our past option grants and practices. Litigation may be time-consuming, expensive and disruptive to normal business operations, and the outcome of litigation is difficult to predict. The defense of these lawsuits may result in significant expense and a diversion of management’s time and attention from the operation of our business, which could impede our ability to achieve our business objectives and an unfavorable outcome may have a material adverse effect on our business, financial condition and results of operations. Additionally, any amount that we may be required to pay to satisfy a judgment or settlement of litigation may not be covered by insurance. Under our charter and the indemnification agreements that we have entered into with our officers and directors, we are required to indemnify, and advance expenses to them in connection with their participation in proceedings arising out of their service to us. There can be no assurance that any of these payments will not be material.
Our revolving credit facility with Silicon Valley Bank contains restrictive covenants that limit our discretion in the operation of our business, which could have a materially adverse effect on our business, financial condition and results of operations.
In January 2009, we entered into a $40.0 million secured revolving credit facility with Silicon Valley Bank, as subsequently amended, which contains numerous restrictive covenants that require us to comply with and maintain specified financial tests and ratios, thereby restricting our ability to:
| • | Incur debt; |
| • | Incur liens; |
| • | Redeem or prepay subordinated debt; |
| • | Make acquisitions of businesses or entities to sell specified assets; |
| • | Make investments, including loans, guarantees and advances; |
| • | Make capital expenditures beyond a specified threshold; |
| • | Engage in transactions with affiliates; |
| • | Pay dividends or limit the amount of stock repurchases; and |
| • | Enter into specified restrictive agreements. |
Our ability to comply with covenants contained in our credit agreement may be affected by events beyond our control, including prevailing economic, financial and industry conditions.
9
Table of Contents
Our current credit agreement is secured by a pledge of all of our assets. If we were to default under our current credit agreement, including a default of our financial covenants, and were unable to obtain a waiver or an amendment for such a default, the lender would have a right to foreclose on our assets in order to satisfy our obligations, if any, under the current credit agreement and could require us to put up cash collateral for any outstanding letter of credit balances. Any such action on the part of the lender against us could have a materially adverse impact on our business, financial condition and results of operations. On January 23, 2012, we entered into an amendment to extend the maturity of the secured revolving credit facility to February 28, 2012 and reduce the amount of the line of credit facility from $40.0 million to $25.0 million. On April 12, 2012, we entered into an amendment to extend the maturity of the secured revolving credit facility to April 28, 2013 and set minimum EBITDA levels. On May 4, 2012, we entered into an amendment to reduce the amount of the line of credit from $25.0 million to $18.0 million, delete the Borrowing Base requirement, delete the minimum EBITDA covenant, delete the fee on undrawn amounts, and modify the Liquidity Coverage Ratio definition.
If we are unable to extend the maturity of the secured revolving credit facility for an additional twelve month period, our business could be adversely affected.
We depend on recruiting and retaining key management with patent and intellectual property experience.
Our performance depends on attracting and retaining key management and other employees with the requisite expertise. In particular, our future success depends in part on the continued service of our employees, including key executives. Competition for qualified personnel in the San Francisco Bay Area in which we are located is significant. We believe that there are only a limited number of persons with the requisite skills to serve in many of our key positions, and it is generally difficult to hire and retain these persons. Furthermore, it may become more difficult to hire and retain key persons as a result of our past restructurings, any future restructurings, and our past stock performance. Competitors may in the future attempt to recruit our employees. In the event of turnover within key positions, integration of new employees will require additional time and resources, which could adversely affect our business plan. If we are unable to attract or retain qualified personnel, our business could be adversely affected.
Risks Related to Owning Our Common Stock
Our quarterly operating results may fluctuate significantly as a result of factors outside of our control, which could cause the market price of our common stock to decline.
We expect our revenues and operating results to vary from quarter to quarter. As a consequence, our operating results in any single quarter may not meet the expectations of securities analysts and investors, which could cause the price of our common stock to decline. Our licensing revenue is difficult to forecast and is likely to fluctuate from quarter to quarter.
Factors that may lead to significant fluctuation in our operating results include, but are not limited to:
| • | restructuring or impairment charges we may take; |
| • | the timing of the receipt of periodic license fee payments; |
| • | fluctuations in the net number of active licensees period to period; |
10
Table of Contents
| • | costs related to acquisitions, alliances, licenses and other efforts to expand our operations; |
| • | the timing of payments under the terms of any license agreements into which we may enter; |
| • | expenses related to, and the timing and results of, patent filings and other enforcements proceedings relating to intellectual property rights; |
| • | revenue recognition and other accounting policies; |
| • | the perceived relevance and value in our existing patent asset portfolio by existing or potential licensees; |
| • | changes in and timing of new governmental, statutory and industry association laws, regulations, procedures or requirements; |
| • | fluctuations in currency exchange rates; and |
| • | industry and economic conditions, including competitive pressures or conditions that affect the intellectual property risk and management of existing or potential licensees. |
Our operating results could be impacted by the amount and timing of operating costs and capital expenditures relating to our business and our ability to accurately estimate and control costs. Most of our expenses, such as compensation for current employees and lease payments for facilities and equipment, are largely fixed. In addition, our expense levels are based, in part, on our expectations regarding future revenues. As a result, any shortfall in revenues relative to our expectations could cause significant changes in our operating results from period to period. In this regard, our bookings may not be indicative of revenue that will be recognized in current or subsequent periods. Due to the foregoing factors, we believe period-to-period comparisons of our historical operating results may be of limited use. In any event, we may be unable to meet our internal projections or the projections of securities analysts and investors. If we are unable to do so, we expect that, as in the past, the trading price of our stock may fall dramatically.
Provisions of our corporate documents and Delaware law may discourage an acquisition of our business, which could affect our stock price.
Our charter and bylaws may inhibit changes of control that are not approved by our Board of Directors. In particular, our certificate of incorporation includes provisions for a classified Board of Directors, authorizes the Board of Directors to issue preferred stock without stockholder approval, prohibit cumulative voting in director elections and prohibits stockholders from taking action by written consent. Further, our bylaws include provisions that prohibit stockholders from calling special meetings and require advance notice for stockholder proposals or nomination of directors. We are also subject to Section 203 of the Delaware General Corporation Law, which generally prevents a person who becomes the owner of 15 percent or more of the corporation’s outstanding voting stock from engaging in specified business combinations for three years unless specified conditions are satisfied. These provisions could have the effect of delaying or preventing changes in control or management.
Our stock price has been and is likely to continue to be volatile and you may not be able to resell shares of our common stock at or above the price you paid, if at all.
The trading price of our common stock has experienced wide fluctuations due to the factors discussed in this risk factors section and elsewhere in this Annual Report. In addition, the stock market in general has, and the NASDAQ Global Market and technology companies in particular have, experienced extreme price and volume fluctuations. These trading prices and valuations may not be sustainable. These broad market and industry factors may decrease the
11
Table of Contents
market price of our common stock, regardless of our actual operating performance. In addition, in the past, following periods of volatility in the overall market and the market price of a company’s securities, securities class action litigation has often been instituted against companies that experienced such volatility. This litigation, if instituted against us, regardless of its outcome, could result in substantial costs and a diversion of our management’s attention and resources.
Item 1B. Unresolved Staff Comments.
None.
Our principal office is located in Redwood City, California, where we lease approximately 144,000 square feet under a sublease agreement that terminates on June 29, 2013. We also have other facility leases in other locations in the United States, including our former headquarters which comprises approximately 283,000 square feet and which is currently under a sublease that expires April 29, 2013. The future lease payments, net of sublease income, for our former headquarters is included in accrued restructuring costs in our consolidated balance sheet.
We believe that our facilities are sufficient for our purposes for the foreseeable future.
Simmonds v. Credit Suisse Group, et al.
On October 3, 2007, Vanessa Simmonds, a purported stockholder of Unwired Planet, filed suit in the U.S. District Court for the Western District of Washington (“Western District Court”) against Credit Suisse Group, Bank of America Corporation, and JPMorgan Chase & Co., the lead underwriters of our initial public offering in June 1999, alleging violations of Section 16(b) of the Exchange Act, 15 U.S.C. § 78p(b). The complaint seeks to recover from the lead underwriters any “short-swing profits” obtained by them in violation of Section 16(b). The suit names us as a nominal defendant, contains no claims against us, and seeks no relief from us. Simmonds filed an Amended Complaint on February 25, 2008 (the “Amended Complaint”), naming as defendants Credit Suisse Securities (USA), Robertson Stephens, Inc., J.P. Morgan Securities, Inc., and again naming Bank of America Corporation. The Amended Complaint asserts substantially similar claims as those set forth in the initial complaint.
On March 12, 2009, the Western District Court entered its judgment in the case and granted the moving issuers’ motion to dismiss, finding plaintiff’s demand letters were insufficient to put the issuers on notice of the claims asserted against them. The Western District Court also granted the underwriters’ motion to dismiss as to the claims arising from the non-moving issuers’ IPOs, finding plaintiff’s claims were time-barred under the applicable statute of limitations.
Following an appeal to the United States Court of Appeals for the Ninth Circuit (the “Ninth Circuit”), on December 2, 2010, the Ninth Circuit affirmed the Western District Court’s decision to dismiss the moving issuers’ cases on the grounds that plaintiff’s demand letters were insufficient to put the issuers on notice of the claims asserted against them and further ordered that the dismissals be made with prejudice. The Ninth Circuit, however, reversed and remanded the Western District Court’s decision on the underwriters’ motion to dismiss as to the claims arising from the non-moving issuers’ IPOs, finding plaintiff’s claims were not time-barred under the applicable statute of
12
Table of Contents
limitations. In remanding, the Ninth Circuit advised the non-moving issuers and underwriters to file in the Western District Court the same challenges to plaintiff’s demand letters that moving issuers had filed.
On January 18, 2011, the Ninth Circuit denied all petitions for rehearing and petitions for rehearing en banc. On January 25, 2011, the Ninth Circuit granted the underwriters’ motion to stay the issuance of the mandate and ordered that the mandate in the cases involving the non-moving issuers be stayed for ninety days pending the filing of a petition for writ of certiorari in the United States Supreme Court. On January 26, 2011, the Ninth Circuit granted the appellant’s motion and ruled that the mandate in all cases is stayed for ninety days pending the appellant’s filing of a petition for writ of certiorari in the United States Supreme Court. On April 5, 2011, the plaintiff filed a Petition for Writ of Certiorari with the United States Supreme Court seeking reversal of the Ninth Circuit’s December 2, 2010 decision. On April 15, 2011, underwriter defendants filed a Petition for Writ of Certiorari with the United States Supreme Court seeking reversal of the Ninth Circuit’s December 2, 2010 decision relating to the statute of limitations issue.
On June 27, 2011, the United States Supreme Court denied Simmonds’ petition regarding the demand issue and granted the underwriters’ position relating to the statute of limitations issue. Oral argument in that case was held on November 29, 2011. On March 26, 2012, the Supreme Court vacated the Ninth Circuit’s holding that petitioner’s claims were not time barred, and remanded the cases to the District Court for proceedings consistent with the Supreme Court’s opinions.
On June 7, 2012, the mandate of the Ninth Circuit was formally entered. On June 11, 2012, Plaintiffs voluntarily dismissed the case with prejudice as to the adequacy-of-the-pre-suit demand issue, and without prejudice as to all other issues.
No amount has been accrued as of June 30, 2012, as a loss is not considered probable or reasonably estimable.
In the Matter of Certain Devices of Mobile Communication
On August 31, 2011, we filed a complaint with the International Trade Commission (“ITC”) in Washington, DC, with Apple Inc. (“Apple”), Research In Motion Ltd. and Research In Motion Corp. as proposed respondents, requesting that the ITC bar Apple and the Research In Motion entities (“RIM”) from importing into the United States their products, including smart devices and tablet computers, that infringe certain of our patents. The complaint alleges that Apple and RIM infringe upon four of our patents that cover technology that, among other things, give consumers access to the Internet from their mobile devices. The ITC matter is currently scheduled for substantive hearing commencing October 15, 2012, though dates in a legal proceeding are always subject to change at the discretion of the presiding judge.
Openwave Systems Inc. v. Apple Inc., Research in Motion Ltd, and Research in Motion Corp.
On August 31, 2011, we filed a complaint in the Federal District Court for the District of Delaware against Apple and RIM, again alleging that Apple and RIM products infringe certain of our patents, seeking among other things a declaration that our patents cited in the complaint have been infringed by Apple and RIM and that these patents are valid and enforceable, damages as a result of the infringement, and an injunction against further infringement. This action is stayed pending the outcome of the ITC case. This matter is stayed pending October 15, 2012.
13
Table of Contents
From time to time, we may be involved in litigation or other legal proceedings, including those noted above, relating to or arising out of its day-to-day operations or otherwise. Litigation is inherently uncertain, and we could experience unfavorable rulings. Should we experience an unfavorable ruling, there exists the possibility of a material adverse impact on its financial condition, results of operations, cash flows or on its business for the period in which the ruling occurs and/or in future periods.
Indemnification claims
Prior to the sale of our product businesses, our software license and services agreements generally included a limited indemnification provision for claims from third parties relating to our intellectual property. In connection with the sale of our product businesses, we retain certain ongoing liabilities with respect to indemnification claims related to our former customers that were initiated prior to the sale of the Location business line and the Messaging and Mediation product businesses. As of June 30, 2012, no amount is accrued for indemnifications as there were no existing claims where a loss is considered probable. Historically, costs related to these indemnification provisions have been infrequent and we are unable to estimate the maximum potential impact of these indemnification provisions on its future results of operations.
Three of our licensees are seeking indemnification from us under their respective license agreements in connection with being named as defendants in two matters pending in the United States District Court for the Eastern District of Texas captioned Unified Messaging Solutions, Inc. v. Google, et al. (Civil Action No. 6:11cv00464) and Unified Messaging Solutions, Inc. v. Facebook, et al. (Civil Action No. 6:11cv00120 (the “Actions”). Plaintiff in the Actions alleges that the licensees’ web-based communication services infringe patents allegedly owned by the plaintiff and the licensees claim that their web-based services are comprised of products licensed from us. We have assumed the defense on behalf of two of the licensees. With respect to the third, the licensee is conducting its own defense and has requested that we indemnify it for one-third of its defense costs and any damages awarded.
As of June 30, 2012, no amount is accrued for indemnifications as there were no existing claims where a loss is considered probable. Historically, costs related to these indemnification provisions have been infrequent and we are unable to estimate the maximum potential impact of these indemnification provisions on its future results of operations.
Item 4. Mine Safety Disclosures.
Not applicable.
14
Table of Contents
PART II
Item 5. Market for Registrant’s Common Equity, Related Stockholder Matters and Issuer Purchases of Equity Securities.
Price Range of Common Stock
Our common stock is listed for quotation on the NASDAQ Global Select Market under the symbol “UPIP.” The following table sets forth the reported high and low closing sales prices for our common stock for the fiscal periods indicated.
| Stock price by quarter |
High | Low | ||||||
| Fiscal year ended June 30, 2012: |
||||||||
| First quarter |
$ | 2.50 | $ | 1.26 | ||||
| Second quarter |
$ | 1.77 | $ | 1.46 | ||||
| Third quarter |
$ | 2.61 | $ | 1.65 | ||||
| Fourth quarter |
$ | 3.10 | $ | 2.15 | ||||
| Fiscal year ended June 30, 2011: |
||||||||
| First quarter |
$ | 2.14 | $ | 1.59 | ||||
| Second quarter |
$ | 2.43 | $ | 1.68 | ||||
| Third quarter |
$ | 2.58 | $ | 1.98 | ||||
| Fourth quarter |
$ | 2.43 | $ | 2.02 | ||||
Holders
As of August 31, 2012 there were 335 holders of record of our common stock. Because many of our shares of common stock are held by brokers and other institutions on behalf of stockholders, we are unable to estimate the total number of stockholders represented by these record holders.
Dividend Policy
Our policy has been to retain future earnings for reinvestment in our business, and accordingly, we have not paid cash dividends other than a special one-time cash dividend paid in June 2007, and we do not anticipate paying cash dividends in the foreseeable future. Further, our line of credit restricts our ability to pay dividends.
15
Table of Contents
Performance Graph
The information contained in the Performance Graph shall not be deemed to be “soliciting material” or “filed” with the SEC or subject to the liabilities of Section 18 of the Exchange Act, except to the extent that we specifically incorporate it by reference into a document filed under the Securities Act or the Exchange Act.
The following graph compares the cumulative total stockholder return on our common stock, the NASDAQ Composite Index, and the S&P Telecommunication Services Index. The graph assumes that $100 was invested in our common stock, the NASDAQ Composite Index and the S&P Telecommunication Services Index on June 30, 2007, and calculates the return quarterly through June 30, 2012. The stock price performance on the following graph is not necessarily indicative of future stock price performance.
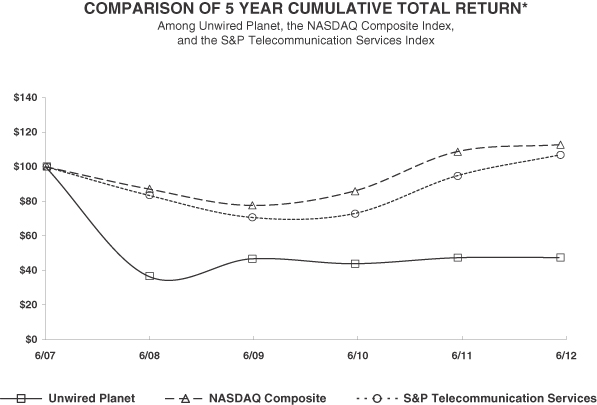
*$100 invested on 6/30/07 in stock or index, including reinvestment of dividends.
Fiscal year ending June 30.
Copyright© 2012 S&P, a division of The McGraw-Hill Companies Inc. All rights reserved.
Item 6. Selected Financial Data.
The following selected financial data should be read in conjunction with our consolidated financial statements and related notes thereto and with “Management’s Discussion and Analysis of Financial Condition and Results of Operations” included elsewhere in this Annual Report.
16
Table of Contents
The following table sets forth selected Consolidated Statements of Operations and Consolidated Balance Sheet data, revised to reflect Musiwave, Client and the product operations as discontinued operations, for fiscal 2012, 2011, 2010, 2009 and 2008 (in thousands, except per share data):
| Fiscal Year ended June 30, | ||||||||||||||||||||
| 2012 | 2011 | 2010 | 2009 | 2008 | ||||||||||||||||
| Selected Consolidated Statements of Operations Data: |
||||||||||||||||||||
| Total revenues |
$ | 15,050 | $ | 4,019 | $ | — | $ | — | $ | — | ||||||||||
| Total operating expenses |
24,020 | 11,356 | 11,901 | 13,718 | 10,487 | |||||||||||||||
| Operating loss from continuing operations |
(8,970 | ) | (7,337 | ) | (11,901 | ) | (13,718 | ) | (10,487 | ) | ||||||||||
| Net income (loss) from continuing operations |
(8,150 | ) | (8,105 | ) | (11,929 | ) | (24,081 | ) | (6,846 | ) | ||||||||||
| Discontinued operations: |
||||||||||||||||||||
| Net income (loss) from discontinued operations, net of tax |
(27,577 | ) | (17,379 | ) | 1,556 | (63,795 | ) | (51,206 | ) | |||||||||||
| Gain on sale of discontinued operations |
50,294 | (9,764 | ) | 4,516 | 2,000 | 36,190 | ||||||||||||||
| Total income (loss) from discontinued operations |
22,717 | (27,143 | ) | 6,072 | (61,795 | ) | (15,016 | ) | ||||||||||||
| Net income (loss) |
$ | 14,567 | $ | (35,248 | ) | $ | (5,857 | ) | $ | (85,876 | ) | $ | (21,862 | ) | ||||||
| Basic and diluted net income (loss) per share: |
||||||||||||||||||||
| Continuing operations |
$ | (0.09 | ) | $ | (0.10 | ) | $ | (0.14 | ) | $ | (0.29 | ) | $ | (0.09 | ) | |||||
| Discontinued operations |
$ | 0.26 | $ | (0.32 | ) | $ | 0.07 | $ | (0.75 | ) | $ | (0.18 | ) | |||||||
| Basic and diluted net income (loss) per share |
$ | 0.17 | $ | (0.42 | ) | $ | (0.07 | ) | $ | (1.04 | ) | $ | (0.27 | ) | ||||||
| Shares used in computing basic and diluted net income (loss) |
86,354 | 84,577 | 83,500 | 82,956 | 82,465 | |||||||||||||||
| As of June 30, | ||||||||||||||||||||
| 2012 | 2011 | 2010 | 2009 | 2008 | ||||||||||||||||
| Selected Consolidated Balance Sheets Data: |
||||||||||||||||||||
| Cash, cash equivalents and restricted cash and short-term investments |
$ | 83,569 | $ | 81,213 | $ | 106,146 | $ | 109,082 | $ | 224,851 | ||||||||||
| Long-term investments and restricted cash and investments |
9,423 | 15,630 | 13,222 | 17,618 | 52,419 | |||||||||||||||
| Total assets |
97,493 | 147,817 | 188,609 | 208,367 | 504,744 | |||||||||||||||
| Convertible subordinated debt, net |
— | — | — | — | 149,842 | |||||||||||||||
| Total stockholders’ equity |
$ | 68,629 | $ | 42,945 | $ | 72,759 | $ | 72,696 | $ | 154,015 | ||||||||||
Item 7. Management’s Discussion and Analysis of Financial Condition and Results of Operations.
The following discussion should be read in conjunction with the consolidated financial statements and notes included elsewhere in this Annual Report. The following discussion contains forward-looking statements that reflect our plans, estimates and beliefs. Our actual results could differ materially from those discussed in the forward-looking statements. Factors that could cause or contribute to these differences include, but are not limited to, those discussed below and those listed in the Risk Factor section contained above in Item 1A.
Since our inception in 1994, Unwired Planet and its predecessor companies have invested in and patented certain intellectual property for the mobile internet industry, some of which we believe are foundational in allowing mobile devices to connect to the Internet.
On January 12, 2012, we announced our pursuit of strategic alternatives for our product operations. On February 1, 2012, we announced the sale of our location product operations to Persistent Systems for a purchase price of $6.0 million. On April 30, 2012, we sold the mediation and messaging product operations to Openwave Mobility for a
17
Table of Contents
purchase price of $49.6 million. We accounted for the sale of the location product line and the sale of the mediation and messaging product lines as a discontinued operation. Accordingly, the condensed consolidated financial statements have been revised for all periods presented to reflect the location, mediation and messaging businesses as discontinued operations. Unless noted otherwise, the following discussions pertain to our continuing operations.
The pursuit of strategic alternatives was designed to allow us to focus on realizing the value of our intellectual property. For example, on August 31, 2011, we announced we had filed complaints against Apple Inc. and Research In Motion Limited in order to protect our intellectual property pertaining to how mobile devices connect to the Internet. This litigation is ongoing. During the first quarter of fiscal 2012, we entered into a license agreement with a third-party whereby we licensed rights to all of our patents for a fee of $15.0 million which was received during the second quarter of fiscal 2012. Additionally, during the first quarter of fiscal 2011 we licensed a number of patents to a competitor which generated $4.0 million in patent revenue for the period. As we execute our licensing plans, we anticipate the related revenue in future periods to be unpredictable and volatile. Additionally, legal costs associated with our efforts to license and protect our intellectual property and proprietary rights could be material in any given period, and are unpredictable and volatile. Effectively policing and enforcing our intellectual property is time consuming and costly. In addition, there can be no assurance that any ongoing or future litigation will be successful.
Critical Accounting Policies and Judgments
We believe that there are several accounting policies that are critical to understanding our business and prospects for our future performance, as these policies affect the reported amounts of revenue and other significant areas that involve management’s judgment and estimates. These significant accounting policies are:
| • | Classification among continuing and discontinued operations; |
| • | Revenue recognition; |
| • | Stock-based compensation; |
| • | Valuation of investments; and |
| • | Restructuring-related assessments. |
These policies, and our procedures related to these policies, are described in detail below. In addition, please refer to the Notes to Consolidated Financial Statements for further discussion of our accounting policies.
Classification among continuing and discontinued operations
Due to the sale of our remaining product businesses in 2012, we have presented financial results for the product businesses in discontinued operations. As the majority of costs related to employees and operations in the past related to our product operations, we identified costs we considered to be related to the ongoing intellectual property business for presentation in continuing operations. Costs we identified as relating to continuing operations include costs related to all personnel dedicated to our patent initiatives, including external legal fees and support personnel. Additionally, certain general and administrative costs were included, which are equivalent to the resources we expect to have on an ongoing basis after our transition to an intellectual property business. This includes costs related to our CEO and CFO, as well as accounting, information systems, and support personnel. All compensation, benefits, stock-based compensation and restructuring costs, if any, associated with these positions were included in ongoing operations. Additionally, we included costs related to being a public company, such as external audit costs,
18
Table of Contents
costs associated with the Sarbanes-Oxley Act, board of directors fees, SEC filings and NASDAQ fees. Facilities and information technology costs were allocated based upon the percentage of headcount of the employees assumed to be working primarily for the intellectual property business. Restructuring costs related to facilities remained in continuing operations, as we have retained the related liabilities. All other historical costs were classified as discontinued operations as they were considered necessary to support the product business.
.
Revenue Recognition
We recognize revenue from the licensing of our intellectual property when the following fundamental criteria are met: (i) persuasive evidence of an arrangement exists, (ii) delivery has occurred, (iii) the sales price is fixed or determinable, and (iv) collection of resulting receivables is reasonably assured. To date, revenue from upfront payments from licensees for the licensing of our patents has been recognized when the arrangement is mutually signed, since there has been no delivery or future performance obligation and the other three criteria are met upon signing the arrangement. When patent licensing arrangements include royalties for future sales of the licensees’ products using our licensed patented technology, revenue is recognized when the royalty report is received from the licensee, at which time the fixed and determinable criteria is met.
Stock-based Compensation
Stock-based compensation is recorded utilizing the fair value recognition provisions of accounting guidance, which requires the use of judgment and estimates in performing multiple calculations. We have estimated the expected volatility as an input into the Black-Scholes-Merton valuation formula when assessing the fair value of options granted. Our estimate of volatility was based upon the historical volatility experienced in our stock price, as well as implied volatility in market traded options on our common stock when appropriate. During fiscal 2012, 2011 and 2010, implied volatility was not utilized in our valuation of options granted due to the lack of option contracts with a strike price similar to our stock option grants. To the extent volatility of our stock price increases in the future, our estimates of the fair value of options granted in the future could increase, thereby increasing stock-based compensation expense in future periods. Our expected term of options granted is derived from actual post-vesting option cancellation and exercise experience, as well as the average midpoint between vesting and the contractual term for outstanding options.
Valuation of Investments
As of June 30, 2012 and June 30, 2011, $2.2 million and $4.4 million, respectively, in auction rate securities (“ARS”), recorded in long-term investments on the consolidated balance sheet, were considered illiquid based upon lack of recent auction results. We estimated the fair value of these auction rate securities based on: (1) financial standing of the issuer; (2) size of position held and the liquidity of the market; (3) contractual restrictions on disposition; (4) pending public offering with respect to the financial instrument; (5) pending reorganization activity affecting the financial instrument; (6) reported prices and the extent of the public trading in similar financial instruments of the issuer or comparable companies; (7) ability of the issuer to obtain required financing; (8) changes in the economic conditions affecting the issuer; (9) a recent purchase of the sale of a security of the issuer; (10) pricing by other dealers in similar securities; (11) financial statements of any underlying ARS portfolio investments; (12) successful auction/early redemption; (13) failing auctions until maturity; or (14) default and the estimated cash flows for each scenario. Other factors are considered, such as interest rate effects, liquidity, trinomial probabilities, recovery rates, value of the investments held by the issuer and the financial condition and credit ratings of the issuer, insurers, and parent companies, as applicable. Assumptions of probabilities of default, probabilities of passing auction,
19
Table of Contents
and probabilities of earning the maximum rate for each period are based upon the risks, the underlying investments collateralizing the ARS, the maturity date of the ARS, the maximum rate of the ARS and current market conditions, and third party professional judgment. We recorded other-than-temporary and realized losses in the consolidated statements of operations of $1.1 million and $1.7 million during fiscal 2011 and 2010, respectively, related to these securities. There were no other-than-temporary and realized losses in the consolidated statements of operations during fiscal 2012.
Restructuring–related Assessments
Our critical accounting policy and judgment as it relates to restructuring-related assessments includes our estimate of facility costs. To determine the facility costs, which consist of the loss after our cost recovery efforts from subleasing a building, some estimates were made related to: (1) the time period over which the relevant building would remain vacant; (2) sublease terms; and (3) sublease rates, including common area charges. The facility cost is an estimate that may be adjusted in the future upon triggering events (such as changes in estimates of time and rates to sublease, based upon current market conditions, or changes in actual sublease rates).
Summary of Operating Results for Fiscal 2012, 2011 and 2010
Revenues
We generate patent revenue, which is derived from licensing our intellectual property.
To date our patent revenues have been from two licensees, as shown in the following table:
| % of Total Revenue Fiscal Year Ended June 30, |
||||||||||||
| 2012 | 2011 | 2010 | ||||||||||
| Microsoft |
100 | % | — | — | ||||||||
| Mobixell Networks |
— | 100 | % | — | ||||||||
The following table presents the key revenue information for fiscal 2012, 2011 and 2010, respectively (dollars in thousands):
| Fiscal Year ended June 30, | Percent Change FY 2012 from FY 2011 |
Percent Change FY 2011 from FY 2010 |
||||||||||||||||||
| 2012 | 2011 | 2010 | ||||||||||||||||||
| Revenues: |
||||||||||||||||||||
| Patents |
$ | 15,050 | $ | 4,019 | $ | — | 274 | % | N/A | |||||||||||
|
|
|
|
|
|
|
|||||||||||||||
| Total revenues |
$ | 15,050 | $ | 4,019 | $ | — | ||||||||||||||
|
|
|
|
|
|
|
|||||||||||||||
| Percent of revenues: |
||||||||||||||||||||
| Patents |
100 | % | 100 | % | N/A | |||||||||||||||
|
|
|
|
|
|||||||||||||||||
| Total revenues |
100 | % | 100 | % | N/A | |||||||||||||||
|
|
|
|
|
|||||||||||||||||
Patents Revenues
During the first quarter of fiscal 2012, we entered into a license agreement with Microsoft whereby we licensed them rights to all of our patents for a fee of $15.0 million which was received during the second quarter of fiscal 2012. During the first quarter of fiscal 2011, we entered into a license agreement for a fee of $4.0 million plus future royalties from domestic sales of products and related services covered under the patent license after September 22, 2010.
20
Table of Contents
Our patent initiative was approved by our Board of Directors in fiscal 2011, thus there are no patent revenues in fiscal 2010.
Operating Expenses
The following table represents operating expenses for fiscal 2012, 2011 and 2010, respectively (dollars in thousands):
| Fiscal Year ended June 30, | ||||||||||||||||||||
| 2012 | Percent Increase (Decrease) |
2011 | Percent Increase (Decrease) |
2010 | ||||||||||||||||
| Sales and marketing expense |
$ | 614 | 100 | % | $ | — | N/A | $ | — | |||||||||||
| Patent initiative expense |
13,089 | 285 | % | 3,398 | 1145 | % | 273 | |||||||||||||
| General and administrative |
7,651 | 33 | % | 5,732 | -19 | % | 7,079 | |||||||||||||
| Restructuring and other costs |
2,666 | 20 | % | 2,226 | -51 | % | 4,549 | |||||||||||||
|
|
|
|
|
|
|
|||||||||||||||
| Total operating expenses |
$ | 24,020 | 112 | % | $ | 11,356 | -5 | % | $ | 11,901 | ||||||||||
|
|
|
|
|
|
|
|||||||||||||||
| Percent of revenues |
||||||||||||||||||||
| Sales and marketing |
4 | % | N/A | N/A | ||||||||||||||||
| Patent initiative expense |
87 | % | 85 | % | N/A | |||||||||||||||
| General and administrative |
51 | % | 143 | % | N/A | |||||||||||||||
Sales and marketing expense
Sales and marketing expenses include salary and benefit expenses and travel expenses for our marketing personnel, as well as any commissions related to our patent revenues. Sales and marketing expenses also include the costs of public relations, promotional materials and other market development programs.
The $0.6 million of sales and marketing expense incurred during fiscal 2012 primarily consists of commissions of $0.4 million incurred during the first quarter of fiscal 2012 in connection with the patent deal signed in that quarter, as well as $0.2 million in marketing expense incurred during the fourth quarter of fiscal 2012. Prior to fiscal 2012, patent revenues were not subject to a commission plan and our marketing activities were related to the discontinued operations.
Patent initiative expenses
Patent initiative expenses include legal and consulting costs related to defending or asserting our patents, as well as labor costs for employees engaged in these activities on a full-time basis.
During the fiscal year ended June 30, 2012, patent initiative expenses increased by 285% compared with the prior year. This increase is primarily due to a $9.3 million increase in legal expenses associated with patent litigation, which includes legal fees supporting the ITC case filed and announced in August 2011. Additionally, there was an increase of approximately $0.4 million related to labor and associated costs as the resources allocated to the patent department increased.
During the fiscal year ended June 30, 2011, we incurred approximately $3.4 million in patent initiative expenses. The Board of Directors approved our patent strategy during fiscal 2011, and as such the only comparable charges in fiscal 2010 relate to labor and associated costs.
21
Table of Contents
General and administrative expenses
General and administrative expenses consist principally of salary and benefit expenses, travel expenses, and facility costs for our finance, legal, information services and executive personnel. General and administrative expenses also include outside accounting and legal fees.
During the fiscal year ended June 30, 2012, general and administrative costs increased 33% compared with the prior year. This increase is primarily due to an increase of $1.4 million in stock-based compensation expense, mainly due to charges related to stock grants modified upon the departure of two members of the Board of Directors and several key employees upon the sale of the products business, as well as restricted stock grants to key employees in the third quarter of fiscal 2012. There was a $0.3 million increase in salary and related costs, as more resources were allocated in support of Unwired Planet in order to establish new procedures to transition to our new business model. Also, overall costs associated with general legal costs, public company expenses and facility costs increased by approximately $0.5 million. These increases were offset by a decrease of approximately $0.2 million in professional fees associated with accounting and auditing.
During the fiscal year ended June 30, 2011, general and administrative costs decreased 19% compared with the corresponding period in the prior year. This decrease was primarily due to a decrease of $1.0 million in professional fees associated with accounting and auditing, a $0.7 million decline in labor costs, as well as a one-time severance payment of $0.3 million to a former executive in fiscal 2010. This decrease was partially offset by an increase in overall costs associated with general legal costs, public company expenses and facility costs of approximately $0.6 million.
Restructuring and Other Costs
Restructuring and other costs increased by 20% in fiscal 2012 as compared with fiscal 2011. This increase was related to an increase of $0.6 million in expense related to severance payments to two former executives, as well as an increase of $0.2 million in new restructuring charges and adjustments to prior restructurings incurred during fiscal 2012 when compared with the prior year’s period. These increases were partially offset by a decrease of $0.4 million in accretion expense.
Restructuring and other costs decreased by 51% in fiscal 2011 as compared with fiscal 2010. This decrease was related to a decrease of $1.8 million in new restructuring charges and adjustments to prior restructurings incurred during fiscal 2011 when compared with the prior year’s period, which primarily relates to a $1.3 million charge for a facility that was restructured in fiscal 2010. In fiscal 2010, there was a $0.2 million accelerated depreciation charge, with no such comparable charge in fiscal 2011. Additionally, there was a decline of $0.3 million in accretion expense during fiscal 2011 when compared to the prior year’s period.
Interest Income
Interest income totaled $0.3 million, $0.6 million and $0.8 million for fiscal 2012, 2011 and 2010, respectively. The decrease in interest income over the last three years is primarily attributed to lower interest rates and lower investment balances due to cash used for operations.
22
Table of Contents
Interest Expense
We incurred interest expense during fiscal 2012, 2011 and 2010 of $0.4 million, $0.5 million, and $0.6 million, respectively. The majority of our interest expense relates to the line of credit facility and letters of credit entered into during the third quarter of fiscal 2009.
Other Expense, net
Other expense, net totaled $0.4 million, $0.8 million and $0.2 million for fiscal 2012, 2011 and 2010, respectively. The decrease in other expense, net in fiscal 2012 when compared with the prior year’s period primarily relates to the $0.9 million realized loss on investments realized in fiscal 2011. This savings was slightly offset by a $0.6 million increase in charges related to foreign exchange rate losses on foreign denominated assets and liabilities. The increase in other expense, net when comparing fiscal 2011 with the prior year’s period, primarily relates to the receipt of two legal settlement payments totaling $1.9 million in fiscal 2010, with no such receipts in the fiscal 2011. Additionally, this increase was offset by a decline in realized losses and other-than-temporary impairments of approximately $1.4 million from fiscal 2010. The remaining amounts primarily relate to foreign exchange gains and losses on foreign denominated assets and liabilities.
Income Taxes
Income tax (benefit) expense totaled $(1.3) million and $0.1 million for fiscal 2012 and 2011, respectively. There was no income tax (benefit) expense related to continuing operations in fiscal 2010. Income taxes in all periods consisted of US federal and state income taxes. Fiscal 2012 tax expense was $1.4 million lower than the prior year primarily due to recording a tax benefit from continuing operations in fiscal 2012 as a result of the gain on sale of discontinued operations.
In light of our history of operating losses, we recorded a valuation allowance for all of our net deferred tax assets, as we are presently unable to conclude that it is more likely than not that the deferred tax assets in excess of deferred tax liabilities will be realized.
As of June 30, 2012, we had net operating loss carryforwards for federal and state income tax purposes of approximately $1.6 billion and $601.8 million, respectively.
Discontinued Operations
We completed the sale of our location product line on February 1, 2012. On April 30, 2012, we completed the disposition of the mediation and messaging product lines, which completed the divestiture of the product business. We classified the product business’ financial results as discontinued operations in our condensed consolidated financial statements for all periods presented. The net assets associated with the messaging and mediation businesses were considered “held-for-sale” from March 31, 2012, until they were sold on April 30, 2012, and all prior periods have been revised in the condensed consolidated balance sheet and condensed consolidated statement of operations to reflect the messaging and mediation businesses as a discontinued operation. Unwired Planet and Openwave Mobility also entered into a transition services agreement (“TSA”) under which we will provide accounting and other services to Openwave Mobility for a period not to exceed six months. Openwave Mobility is paying a flat fee for these services per month. Any costs of providing these services that are incremental to the flat fee will be reflected in discontinued operations on the statement of operations in future periods.
23
Table of Contents
During fiscal 2008, we sold our Client operations to Purple Labs, a private company based in Chambéry, France. During the first quarter of fiscal 2011, $2.0 million of the escrowed funds associated with the sale was distributed to Myriad AG (formerly Purple Labs) and the remaining $2.2 million was released to us, and was recorded as an additional $2.2 million gain on sale of discontinued operation in the condensed consolidated statement of operations.
On August 28, 2011, we entered into an agreement with Myriad (the “Agreement”) for the purposes of settling all existing litigation between us and Myriad in connection with the sale of our client business to Purple Labs in June 2008. The Agreement terminated specified sections of an intellectual property licensing agreement which was entered into in connection with the sale of our client business that occurred in June 2008, clarified which patents were transferred with the sale of the client business and which remained our property, contained a mutual covenant not to sue, and provided that we would pay $12.0 million to Myriad. The payment of $12.0 million occurred in September 2011, and was recorded as a loss on sale of discontinued operations in our statement of operations for the fiscal year ended June 30, 2011.
Net loss from discontinued operations increased by $10.2 million in fiscal 2012 as compared with fiscal 2011. This was a result of the $46.5 million decline in revenues, offset by corresponding reductions in cost of revenues as well as lower operating expenses during the same period. Likewise, discontinued operations experienced a net loss of $17.4 million in fiscal 2011 compared to net income of $1.6 million in fiscal 2010. This was a result of a $31.8 million decline in revenues, including a $7.3 million decline in license revenues, from fiscal 2010, offset by corresponding reductions in cost of revenues as well as lower operating expenses during the same period. See Note 3 of Notes to Consolidated Financial Statements for further information regarding the classification of these businesses as a discontinued operation.
The increase in the gain on sale of discontinued operations in fiscal 2012 when compared with fiscal 2011 primarily relates to the $45.1 million gain recognized from the sale of the products business to Openwave Mobility in the fourth quarter of fiscal 2012, as well as to the loss of $12.0 million recognized in fiscal 2011 related to the settlement payment to Myriad with no such comparable loss being recognized in fiscal 2012.
The decline in gain on sale of discontinued operations in fiscal 2011 when compared with fiscal 2010 primarily relates to the loss of $12.0 million recognized in fiscal 2011 related to the settlement payment to Myriad, with no such comparable loss being recognized in fiscal 2010.
Liquidity and Capital Resources
Working Capital and Cash Flows
The following table presents selected financial information and statistics as of June 30, 2012, 2011 and 2010, respectively (dollars in thousands):
| As of June 30, | ||||||||||||||||||||
| 2012 | Percent change |
2011 | Percent change |
2010 | ||||||||||||||||
| Working capital |
60,451 | 19 | % | $ | 50,704 | -36 | % | $ | 84,491 | |||||||||||
| Cash and cash investments: |
||||||||||||||||||||
| Cash and cash equivalents |
39,709 | -16 | % | 47,266 | -22 | % | 60,935 | |||||||||||||
| Short-term investments |
43,860 | 29 | % | 33,947 | -25 | % | 45,211 | |||||||||||||
| Long-term investments |
9,423 | -40 | % | 15,630 | 21 | % | 12,865 | |||||||||||||
| Restricted cash |
— | N/A | — | -100 | % | 357 | ||||||||||||||
|
|
|
|
|
|
|
|||||||||||||||
| Total cash and investments |
$ | 92,992 | -4 | % | $ | 96,843 | -19 | % | $ | 119,368 | ||||||||||
|
|
|
|
|
|
|
|||||||||||||||
24
Table of Contents
| Fiscal Year ended June 30, | ||||||||||||
| 2012 | 2011 | 2010 | ||||||||||
| Cash provided by (used for) operating activities |
$ | (43,628 | ) | $ | (21,485 | ) | $ | (9,224 | ) | |||
| Cash provided by (used for) investing activities |
$ | 34,167 | $ | 5,788 | $ | (22,174 | ) | |||||
| Cash provided by (used for) financing activities |
$ | 1,904 | $ | 2,028 | $ | 788 | ||||||
We have obtained a majority of our cash and investments through public offerings of common stock, including a common stock offering in December 2005 which raised $277.8 million in net proceeds. In fiscal 2008, we sold Musiwave and our Client operations, resulting in $56.0 million of net proceeds in fiscal 2008, $11.7 million in fiscal 2009, $4.5 million in fiscal 2010 and $2.2 million in fiscal 2011. Additionally, in fiscal 2012, we sold our product businesses which resulted in $51.4 million of net proceeds in fiscal 2012. We also entered into a $40.0 million revolving credit facility on January 23, 2009, which we have amended several times, including an amendment entered into on January 23, 2012 to reduce the revolving credit facility to $25.0 million, lower the Borrowing Base from a starting point of $20.0 million to $15.0 million plus eligible accounts receivable and extend the maturity date to February 28, 2012.
On January 20, 2012, we received a consent from Silicon Valley Bank to sell the Location product business. On February 24, 2012, we entered into an amendment to extend the maturity of the secured revolving credit facility to March 29, 2012. On March 29, 2012, we entered into an amendment to extend the maturity to April 28, 2012 and set the EBITDA covenant minimum level for March 31, 2012. On April 12, 2012, we entered into an amendment to extend the maturity of the secured revolving credit facility to April 28, 2013 and set minimum EBITDA levels. On April 30, 2012, we received a consent from Silicon Valley Bank to sell the mediation and messaging product businesses. On May 4, 2012, we entered into an amendment to reduce the amount of the line of credit from $25.0 million to $18.0 million, delete the Borrowing Base requirement, delete the minimum EBITDA covenant, delete the fee on undrawn amounts, and modify the Liquidity Coverage Ratio definition. Although we plan to extend the maturity beyond this date, there can be no guarantee of an extension. Failure to extend the line of credit would require letters of credit to have cash collateral, which would be reflected as Restricted cash as opposed to Cash and equivalents once collateralized.
As of June 30, 2012, June 30, 2011 and June 30, 2010, we had letters of credit outstanding against the revolving credit facility totaling $17.5 million, $18.2 million, and $17.9 million, respectively, reducing the available borrowings on the revolving credit facility. Our letters of credit expire between October 2012 and June 2013. We intend to renew them, but there is no guarantee of renewal. The revolving credit line is secured by a blanket lien on all of our assets and contains financial and reporting covenants customary to these types of credit facilities agreements which we are required to satisfy as a condition of the agreement. In particular, the revolving credit facility requires that we meet a specified minimum monthly liquidity ratio. In addition, the revolving credit facility requires us to provide to the bank annual financial projections, promptly report any material legal actions, and timely pay material taxes and file all required tax returns and reports. Further, without the bank’s consent, we cannot take some material actions, such as change any material line of business, sell our business, acquire other entities, incur liens, make capital expenditures beyond a specified threshold, or engage in transactions with affiliates. As of June 30, 2012, we were in compliance with all debt covenants.
While we believe that our current working capital and anticipated cash flows from operations will be adequate to meet our cash needs for daily operations and capital expenditures for at least the next 12 months, we may elect to raise additional capital through the sale of additional equity or debt securities, or sell some assets. If additional funds are raised through the issuance of additional debt securities, these securities could have rights, preferences and privileges
25
Table of Contents
senior to holders of common stock, and the terms of any debt could impose restrictions on our operations. The sale of additional equity or convertible debt securities could result in additional dilution to our stockholders, and additional financing may not be available in amounts or on terms acceptable to us.
If additional financing is necessary and we are unable to obtain the additional financing, we may be required to reduce the scope of our planned intellectual property initiatives and marketing efforts, which could harm our business, financial condition and operating results. In the meantime, we will continue to manage our cash and investment portfolio in a manner designed to facilitate adequate cash and cash equivalents to fund our operations as well as future acquisitions, if any.
Working Capital
Our working capital, defined as current assets of the continuing operations less current liabilities of the continuing operations, increased by approximately $9.7 million, or 19%, from June 30, 2011 to June 30, 2012. The increase in working capital balances is primarily attributed to the $51.4 million in proceeds from the sale of the products business in fiscal 2012, partially offset by the $43.6 million cash used for operations in fiscal 2012.
Cash, cash equivalents and short and long-term investments decreased by $3.9 million as of June 30, 2012 as compared with June 30, 2011, primarily due to the $43.6 million of cash used for operations in fiscal 2012, as well as the $12.0 million payment made related to the settlement of the Myriad litigation, partially offset by the $51.4 million in proceeds from the sales of the products business received in fiscal 2012.
Cash Used for Operating Activities
Cash used for operating activities totaled $43.6 million, $21.5 million, and $9.2 million for fiscal 2012, 2011 and 2010, respectively.
In fiscal 2012, we had two main drivers of the use of cash. The first driver was that our net income, excluding the impact of non-cash items and the gain on the sale of discontinued operations, was a use of cash of $22.1 million. The second driver was that we also experienced $13.2 million of a restructuring liability decrease during the fiscal year ended June 30, 2012, which included $4.9 million in severance paid to employees impacted by the restructuring announced in August 2011. We expect another $0.1 million of severance to be paid relating to this restructuring plan during the remainder of fiscal 2013. Additionally, we had other working capital changes as shown on the consolidated statement of cash flows.
The $21.5 million in cash used for operating activities in fiscal 2011 was primarily due to the $28.5 million net loss adjusted for non-cash items, $13.9 million in restructuring payments and the $8.5 million decline in deferred revenue related to discontinued operations, which represents a reduction in billings in advance of revenue recognized. These uses of cash were offset by changes in working capital balances of $29.4 million, primarily related to a decline in accounts receivable and an increase in accrued liabilities related to discontinued operations as discussed above.
The $9.2 million in cash used for operating activities in fiscal 2010 was primarily due to the $11.0 million in restructuring payments, offset by the $4.5 million in cash generated by net income adjusted for non-cash items.
26
Table of Contents
Cash Provided by (Used for) Investing Activities
Cash flows provided by (used for) investing activities during fiscal 2012, 2011 and 2010 totaled $34.2 million, $5.8 million and $(22.2) million, respectively.
The $28.4 million increase in our cash flows provided by investing activities for fiscal 2012 as compared with fiscal 2011 was primarily due to the $51.4 million net cash flow related to the product business sales in fiscal 2012, which was partially offset by the payment of the $12.0 million related to the settlement of the Myriad litigation as well as the purchase, net of maturities, of short and long-term investments.
The $28.0 million increase in our cash flows provided by investing activities for fiscal 2011 as compared with fiscal 2010 was primarily due to the $33.3 million increase in proceeds from the sale and maturity of short-term investments. This increase was partially offset by a decline in purchases and proceeds from the sale and maturity of long-term investments of $5.2 million.
Cash Flows Provided by Financing Activities
Cash flows provided by financing activities during fiscal 2012, 2011 and 2010 totaled $1.9 million, $2.0 million and $0.8 million, respectively.
Net cash provided by financing activities during fiscal 2012 was $1.9 million, from the exercise of stock options and the purchase of shares pursuant to the employee stock purchase plan.
Net cash provided by financing activities during fiscal 2011 was $2.0 million, from the exercise of stock options and the purchase of shares pursuant to the employee stock purchase plan.
Net cash provided by financing activities during fiscal 2010 was $0.8 million, from the exercise of stock options and the purchase of shares pursuant to the employee stock purchase plan, net of amounts paid for the fee on the line of credit.
Long-Term Debt Obligations, Restructuring Plans and Operating Lease Obligations
As of June 30, 2012, our principal commitments consisted of obligations outstanding under operating leases.
On January 23, 2009, we entered into a secured revolving credit facility with Silicon Valley Bank for up to $40.0 million. On January 20, 2010, we entered into two amendments to the $40.0 million revolving credit facility with Silicon Valley Bank to modify the definition of EBITDA. Additionally, on April 14, 2010, we entered into another amendment to the $40.0 million revolving credit facility with Silicon Valley Bank to extend the maturity date to January 23, 2012, as well as to modify the commitment fee and several definitions, including EBITDA, Borrowing Base, and Investments. On April 16, 2012, an amendment was entered into to extend the maturity to April 29, 2013. On May 4, 2012, we entered into an amendment to reduce the amount of the line of credit from $25.0 million to $18.0 million, delete the Borrowing Base requirement, delete the minimum EBITDA covenant, delete the fee on undrawn amounts, and modify the Liquidity Coverage Ratio definition. Although we plan to extend the maturity beyond this date, there can be no guarantee of an extension. Failure to extend the line of credit would require letters of credit to have cash collateral, which would be reflected as Restricted cash as opposed to Cash and cash equivalents once collateralized.
27
Table of Contents
We may borrow, repay and re-borrow under the revolving credit facility at any time up to the maturity date. As of June 30, 2012, the revolving credit facility bears interest at 4% per annum. For each letter of credit issued, we are required to pay 0.75% per annum on the face amount of the letter of credit. Annually, we are required to pay a commitment fee to the lender. In January 2010, we paid a $0.2 million commitment fee to the lender. In January 2011, we paid a $0.1 million commitment fee to the lender. In April 2012, we paid a $75 thousand commitment fee to the lender.
As of June 30, 2012 and June 30, 2011, we had letters of credit outstanding against the revolving credit facility totaling $17.5 million and $18.2 million, respectively, reducing the available borrowings on the revolving credit facility.
The revolving credit line is secured by a blanket lien on all of our assets and contains certain financial and reporting covenants customary to these types of credit facilities agreements which we are required to satisfy as a condition of the agreement. In particular, the revolving credit facility requires that we meet a minimum monthly liquidity ratio. As of May 4, 2012, the minimum four quarter EBITDA covenant was deleted. In addition, the revolving credit facility requires us to provide to the bank annual financial projections, promptly report any material legal actions, and timely pay material taxes and file all required tax returns and reports. Further, without the bank’s consent, we cannot take certain material actions, such as change any material line of business, sell our business, acquire other entities, incur liens, make capital expenditures beyond a certain threshold, or engage in transactions with affiliates. As of June 30, 2012 we were in compliance with all debt covenants.
On August 1, 2011, we announced a restructuring, which we refer to as the FY2012 Restructuring, to better align our resources among our operational groups and to reduce costs and improve operating efficiencies by reducing operating costs inline with revenue. The FY2012 Restructuring resulted in $4.9 million in pre-tax restructuring and related charges associated with the FY2012 Restructuring’s employee termination benefits. As of March 31, 2012, $4.3 million of these charges were moved to discontinued operations and $0.6 million remained in continuing operations. We expect to pay the current accrued charges for employee termination benefits during the first quarter of fiscal 2013. During the second quarter of fiscal 2012, we recognized $1.4 million in facilities charges associated with a facility we exited during the second quarter under the FY2012 Restructuring. The lease payments will be paid over the term of the remaining lease.
On February 3, 2011, we announced a restructuring referred to as the FY2011 Restructuring to consolidate our resources, primarily in development, and improve operating efficiencies. As such, during the three months ended March 31, 2011, we incurred approximately $2.0 million in pre-tax restructuring and related charges associated with the FY2011 Restructuring’s employee termination benefits. As of March 31, 2012, these charges were moved to discontinued operations as part of the sale of the products businesses.
On October 29, 2009, we announced a restructuring referred to as the FY2010 Restructuring to consolidate our resources, primarily in development, and improve operating efficiencies. As such, during fiscal 2010, we incurred approximately $0.8 million in pre-tax restructuring and related charges associated with the FY2010 Restructuring’s employee termination benefits and $0.2 million in accelerated depreciation on fixed assets associated with a facility identified for restructuring. As of March 31, 2012, the $0.8 million in employee termination benefits were moved to discontinued operations as part of the sale of the products businesses. During the third and fourth quarter of fiscal 2010, we recognized $1.3 million in facilities charges associated with a facility we exited during the third quarter under the FY2010 Restructuring. The lease payments will be paid over the term of the remaining lease.
28
Table of Contents
On March 16, 2009, we announced a restructuring referred to as the FY2009 Restructuring in an effort to consolidate our resources, primarily in development and support, and improve operating efficiencies. As such, during fiscal 2009, we incurred approximately $3.5 million in facilities charges associated with a facility identified for restructuring. During fiscal 2010, we recognized $2.0 million in facilities charges associated with two facilities we exited under the FY2009 Restructuring. The lease payments will be paid over the term of the remaining lease.
On February 28, 2005, we entered into a sublease agreement (the “Sublease Agreement”) to lease office space in a building at 2100 Seaport Boulevard in Redwood City, California. The Sublease Agreement covers approximately 144,000 square feet which serve as our corporate headquarters. We vacated our prior corporate headquarters located at 1400 Seaport Boulevard, Redwood City, California as of June 1, 2005.
The terms of the Sublease Agreement began on May 1, 2005 and will end on June 29, 2013. The Sublease Agreement is a triple-net sublease. The average base rent for the remaining term of the lease will be approximately $1.6 million per year. The rent obligations are being expensed on a straight-line basis, over the term of the lease beginning upon the date the premises became available for entry in February 2005.
Our prior headquarters facility lease was entered into in March 2000 for approximately 283,000 square feet of office space located at 1400 Seaport Boulevard, Redwood City, California. Lease terms that commenced in April 2001 require a base rent of $3.25 per square foot per month as provided by the lease agreement which will increase by 3.5% annually on the anniversary of the initial month of the commencement of the lease. The lease is for a period of 12 years from the commencement date of the lease. The future costs of this lease, net of future sublease income, is recorded as a restructuring liability on the consolidated balance sheets against which future lease payments will be recorded.
Contractual Obligations
We also have numerous facility operating leases at other locations in the United States and throughout the world.
Future minimum lease payments under all non-cancelable operating leases with terms in excess of one year and future contractual sublease income were as follows at June 30, 2012 (in thousands):
| 2013 | 2014 | 2015 | Total | |||||||||||||
| Contractual obligation: |
||||||||||||||||
| Gross operating lease obligations |
$ | 16,567 | $ | 1,336 | $ | 450 | $ | 18,353 | ||||||||
| Less: contractual sublease income |
(3,613 | ) | (728 | ) | (240 | ) | (4,581 | ) | ||||||||
|
|
|
|
|
|
|
|
|
|||||||||
| Net operating lease obligations |
$ | 12,954 | $ | 608 | $ | 210 | $ | 13,772 | ||||||||
|
|
|
|
|
|
|
|
|
|||||||||
Additionally, we have $0.9 million in unrecognized tax benefits, which may or may not become payable in future periods.
Off-Balance Sheet Arrangements
We do not have any off-balance sheet arrangements that have or are reasonably likely to have a current or future effect on our financial condition, changes in financial condition, revenues or expenses, results of operations, liquidity, capital expenditures or capital resources that are material to investors.
29
Table of Contents
Recently Adopted Accounting Pronouncements
Effective January 1, 2012, we adopted the following accounting guidance for fair value measurement on a prospective basis:
Accounting Standards Update No. 2011-04, Fair Value Measurement (Topic 820), Amendments to Achieve Common Fair Value Measurement and Disclosure Requirements in U.S. GAAP and IFRS (“Update 2011-04”). Update 2011-04 amends the requirements related to fair value measurement, in particular changing the wording used to describe many requirements in Generally Accepted Accounting Principles (“GAAP”) for measuring fair value and for disclosing information about fair value measurements. The amendments also serve to clarify the FASB’s intent about the application of existing fair value measurement requirements. The amended guidance is effective for interim and annual periods beginning after December 15, 2011, and is applied prospectively. We adopted this guidance beginning in the third quarter of fiscal 2012. The adoption of Update 2011-04 did not have a material impact on our condensed consolidated financial statements, results of operations or cashflows.
Recent Accounting Pronouncements Not Yet Adopted
Accounting Standards Update No. 2010-28, Intangibles—Goodwill and Other (Topic 350), When to Perform Step 2 of the Goodwill Impairment Test for Reporting Units with Zero or Negative Carrying Amounts (“Update 2010-28”). Update 2010-28 amends the criteria for performing Step 2 of the goodwill impairment test for reporting units with zero or negative carrying amounts and requires performing Step 2 if qualitative factors indicate that it is more likely than not that a goodwill impairment exists. Update 2010-28 is effective for fiscal years beginning after December 15, 2011. The adoption of this guidance is not expected to have a material impact on our condensed consolidated financial position, results of operations or cash flows.
Accounting Standards Update No. 2011-05, Comprehensive Income (Topic 220), Presentation of Comprehensive Income (“Update 2011-05”). Update 2011-05 allows the option of presenting the total of comprehensive income, the components of net income, and the components of other comprehensive income either in a single continuous statement of comprehensive income or in two separate but consecutive statements. Additionally, Update 2011-05 requires companies to present on the face of the financial statements reclassification adjustments for items that are reclassified from other comprehensive income to net income in the statement(s) where the components of net income and the components of other comprehensive income are presented. In December 2011, Accounting Standards Update No. 2011-12, Comprehensive Income (Topic 22) Deferral of the Effective Date for Amendments to the Presentation of Reclassifications of Items Out of Comprehensive Income in Accounting Standards Update No. 2011-05, was issued. The amended guidance is effective for fiscal years, and interim periods within those years, beginning after December 15, 2011, and is applied retrospectively. Adoption of this guidance is not expected to have a material impact on our condensed consolidated financial statements.
Accounting Standards Update No. 2011-08, Intangibles—Goodwill and Other (Topic 350)—Testing Goodwill for Impairment (“Update 2011-08”), allows entities to use a qualitative approach to test goodwill for impairment. Update 2011-08 permits an entity to first perform a qualitative assessment to determine whether it is more likely than not that the fair value of a reporting unit is less than its carrying value. If it is concluded that this is the case, it is necessary to perform the currently prescribed two-step goodwill impairment test. Otherwise, the two-step goodwill impairment test is not required. Update 2011-08 is effective for annual and interim goodwill impairment tests performed for fiscal years beginning after December 15, 2011, with early adoption permitted. Adoption of this guidance is not expected to have a material impact on our condensed consolidated financial statements.
30
Table of Contents
Item 7A. Quantitative and Qualitative Disclosures About Market Risk
Foreign Currency Risk
We have operated internationally and are exposed to potentially adverse movements in foreign currency rate changes. With the disposition of our product businesses as of April 30, 2012, we expect to have a significantly reduced exposure to foreign currency rate changes. Prior to April 30, 2012, we had entered into foreign exchange derivative instruments to reduce our exposure to foreign currency rate changes on receivables, payables and intercompany balances denominated in a nonfunctional currency. The objective of these derivatives was to neutralize the impact of foreign currency exchange rate movements on our operating results. These derivatives may require us to exchange currencies at rates agreed upon at the inception of the contracts. These contracts reduce the exposure to fluctuations in exchange rate movements because the gains and losses associated with foreign currency balances and transactions are generally offset with the gains and losses of the foreign exchange forward contracts. We do not enter into foreign exchange transactions for trading or speculative purposes, nor do we hedge foreign currency exposures in a manner that entirely offsets the effects of movement in exchange rates. We do not designate our foreign exchange forward contracts as accounting hedges and, accordingly, we adjust these instruments to fair value through earnings in the period of change in their fair value. Net foreign exchange transaction losses included in Other income (expense), net in the accompanying condensed consolidated statements of operations totaled $(0.4) million, $0.1 million and $(44,000) for the fiscal years 2012, 2011 and 2010. As of June 30, 2012, we had no forward contracts.
As of June 30, 2011, our forward contracts were as follows (notional amounts in thousands):
| Currency |
Notional Amount |
Foreign Currency per USD |
Date of Maturity |
|||||||||
| AUD |
1,600 | 1.05 | 7/29/2011 | |||||||||
| CAD |
2,100 | 1.01 | 7/29/2011 | |||||||||
| EUR |
1,250 | 0.69 | 7/29/2011 | |||||||||
| JPY |
200,000 | 80.93 | 7/29/2011 | |||||||||
As of June 30, 2011, the nominal value multiplied by the USD exchange rate of these forward contracts was $8.2 million. Our mark-to-market net unrealized gain on these contracts as of June 30, 2011 was $0.1 million.
Interest Rate Risk
As of June 30, 2012, we had cash and cash equivalents, short-term and long-term investments of $93.0 million, compared with $96.8 million as of June 30, 2011. Our exposure to market risks for changes in interest rates relates primarily to money market accounts, certificates of deposit, corporate bonds, government securities, and auction rate securities. We place our investments with high credit quality issuers that have a rating by Moody’s of A2 or higher and Standard & Poors of A or higher, and, by policy, limit the amount of the credit exposure to any one issuer. Our general policy is to limit the risk of principal loss and ensure the safety of invested funds by limiting market and credit risk. All highly liquid investments with a maturity of less than three months at the date of purchase are considered to be cash equivalents; all investments with maturities of three months or greater are classified as available-for-sale and considered to be short-term investments; all investments with maturities of greater than one year are classified as available-for-sale and considered to be long-term investments.
31
Table of Contents
The following is a table of our available-for-sale investments within investments and cash and cash equivalents by expected maturity in the consolidated balance sheet at June 30, 2012 (in thousands):
| Expected maturity for the year ending June 30, |
Cost Value | Fair Value | ||||||||||||||||||
| 2013 | 2014 | Thereafter | June 30, 2012 Total |
June 30, 2012 Total |
||||||||||||||||
| U.S. Government Agencies |
$ | 3,297 | $ | 2,767 | $ | — | $ | 6,064 | $ | 6,070 | ||||||||||
| Certificates of Deposit |
2,220 | — | — | 2,220 | 2,220 | |||||||||||||||
| Commercial Paper |
7,844 | — | — | 7,844 | 7,844 | |||||||||||||||
| Corporate Bonds |
32,001 | 4,428 | — | 36,429 | 36,412 | |||||||||||||||
| Auction Rate Securities |
— | — | 3,038 | 3,038 | 2,237 | |||||||||||||||
|
|
|
|
|
|
|
|
|
|
|
|||||||||||
| Total |
$ | 45,362 | $ | 7,195 | $ | 3,038 | $ | 55,595 | $ | 54,783 | ||||||||||
|
|
|
|
|
|
|
|
|
|
|
|||||||||||
| Weighted-average interest rate |
0.7 | % | ||||||||||||||||||
The following is a table of our available-for-sale investments within investments and cash and cash equivalents by expected maturity in the consolidated balance sheet at June 30, 2011 (in thousands):
| Expected maturity for the year ending June 30, |
Cost Value | Fair Value | ||||||||||||||||||
| 2012 | 2013 | Thereafter | June 30, 2011 Total |
June 30, 2011 Total |
||||||||||||||||
| U.S. Government Agencies |
$ | 2,412 | $ | 3,499 | $ | — | $ | 5,911 | $ | 5,927 | ||||||||||
| Certificates of Deposit |
240 | 240 | — | 480 | 480 | |||||||||||||||
| Commercial Paper |
10,691 | — | — | 10,691 | 10,691 | |||||||||||||||
| Corporate Bonds |
20,609 | 7,486 | — | 28,095 | 28,097 | |||||||||||||||
| Auction Rate Securities |
— | — | 5,237 | 5,237 | 4,382 | |||||||||||||||
|
|
|
|
|
|
|
|
|
|
|
|||||||||||
| Total |
$ | 33,952 | $ | 11,225 | $ | 5,237 | $ | 50,414 | $ | 49,577 | ||||||||||
|
|
|
|
|
|
|
|
|
|
|
|||||||||||
| Weighted-average interest rate |
0.7 | % | ||||||||||||||||||
Item 8. Financial Statements and Supplementary Data.
Our Consolidated Financial Statements, together with related notes and the report of independent registered public accounting firm KPMG LLP are set forth on the pages indicated in Item 15.
32
Table of Contents
Quarterly Results of Operations
The following tables set forth a summary of our unaudited quarterly operating results for each of the eight quarters in the period ended June 30, 2012. All quarters have been revised as necessary to reflect the product businesses, Musiwave and Client operations as discontinued operations. See Note 3 to the consolidated financial statements for further detail. The information has been derived from our unaudited consolidated financial statements that, in management’s opinion, have been prepared on a basis consistent with the audited consolidated financial statements contained elsewhere in this Annual Report and include all adjustments, consisting only of normal recurring adjustments, necessary for a fair presentation of this information when read in conjunction with our audited consolidated financial statements and notes thereto. The operating results for any quarter are not necessarily indicative of results to be expected for any future period.
| Fiscal Year ended June 30, 2012 | Fiscal Year ended June 30, 2011 | |||||||||||||||||||||||||||||||
| Fourth Quarter |
Third Quarter |
Second Quarter |
First Quarter |
Fourth Quarter |
Third Quarter |
Second Quarter |
First Quarter |
|||||||||||||||||||||||||
| Total revenues |
$ | 4 | $ | 20 | $ | 5 | $ | 15,021 | $ | 10 | $ | 8 | $ | 1 | $ | 4,000 | ||||||||||||||||
| Total operating costs and expenses |
7,579 | 5,837 | 6,268 | 4,336 | 3,646 | 2,778 | 2,615 | 2,317 | ||||||||||||||||||||||||
|
|
|
|
|
|
|
|
|
|
|
|
|
|
|
|
|
|||||||||||||||||
| Operating income (loss) from continuing operations |
$ | (7,575 | ) | $ | (5,817 | ) | $ | (6,263 | ) | $ | 10,685 | $ | (3,636 | ) | $ | (2,770 | ) | $ | (2,614 | ) | $ | 1,683 | ||||||||||
| Net income (loss) from continuing operations |
$ | (4,043 | ) | $ | (5,781 | ) | $ | (9,073 | ) | $ | 10,747 | $ | (4,184 | ) | $ | (3,237 | ) | $ | (2,404 | ) | $ | 1,720 | ||||||||||
| Net income from discontinued operation |
(9,237 | ) | (8,917 | ) | (1,317 | ) | (8,106 | ) | (3,776 | ) | (7,587 | ) | (2,131 | ) | (3,885 | ) | ||||||||||||||||
| Gain (loss) on sale of discontinued operations |
45,133 | 5,161 | — | — | (12,000 | ) | — | — | 2,236 | |||||||||||||||||||||||
| Net income (loss) |
$ | 31,853 | $ | (9,537 | ) | $ | (10,390 | ) | $ | 2,641 | $ | (19,960 | ) | $ | (10,824 | ) | $ | (4,535 | ) | $ | 71 | |||||||||||
| Basic net income (loss) from continuing operations per share |
$ | (0.05 | ) | $ | (0.07 | ) | $ | (0.11 | ) | $ | 0.12 | $ | (0.05 | ) | $ | (0.04 | ) | $ | (0.03 | ) | $ | 0.02 | ||||||||||
| Basic net income from discontinued operations per share |
$ | 0.41 | $ | (0.04 | ) | $ | (0.01 | ) | $ | (0.09 | ) | $ | (0.18 | ) | $ | (0.09 | ) | $ | (0.03 | ) | $ | (0.02 | ) | |||||||||
| Basic net income (loss) per share |
$ | 0.36 | $ | (0.11 | ) | $ | (0.12 | ) | $ | 0.03 | $ | (0.23 | ) | $ | (0.13 | ) | $ | (0.06 | ) | $ | 0.00 | |||||||||||
| Diluted net income (loss) from continuing operations per share |
$ | (0.05 | ) | $ | (0.07 | ) | $ | (0.11 | ) | $ | 0.12 | $ | (0.05 | ) | $ | (0.04 | ) | $ | (0.03 | ) | $ | 0.02 | ||||||||||
| Diluted net income from discontinued operations per share |
$ | 0.41 | $ | (0.04 | ) | $ | (0.01 | ) | $ | (0.09 | ) | $ | (0.18 | ) | $ | (0.09 | ) | $ | (0.03 | ) | $ | (0.02 | ) | |||||||||
| Diluted net income (loss) per share |
$ | 0.36 | $ | (0.11 | ) | $ | (0.12 | ) | $ | 0.03 | $ | (0.23 | ) | $ | (0.13 | ) | $ | (0.06 | ) | $ | 0.00 | |||||||||||
| Shares used in computing: |
||||||||||||||||||||||||||||||||
| Basic net income (loss) per share |
88,200 | 86,146 | 85,594 | 85,482 | 85,216 | 84,761 | 84,324 | 84,017 | ||||||||||||||||||||||||
| Diluted net income (loss) per share |
88,200 | 86,146 | 85,594 | 86,432 | 85,216 | 84,761 | 84,324 | 84,928 | ||||||||||||||||||||||||
For quarters previously reported, immaterial reclassifications have been made among operating costs related to continued operations and discontinued operations due to refinements in our allocation methodology following the sale of the products business.
33
Table of Contents
Item 9. Changes in and Disagreements With Accountants on Accounting and Financial Disclosure.
None.
Item 9A. Controls and Procedures.
Disclosure Controls and Procedures
Our management has evaluated, under the supervision and with the participation of our Chief Executive Officer and Chief Financial Officer, the effectiveness of our disclosure controls and procedures as of June 30, 2012. Based on their evaluation as of June 30, 2012, our Chief Executive Officer and Chief Financial Officer have concluded that our disclosure controls and procedures (as defined in Rules 13a-15(e) and 15d-15(e) under the Securities Exchange Act of 1934) were effective at the reasonable assurance level to ensure that the information required to be disclosed by us in this Annual Report was (i) recorded, processed, summarized and reported within the time periods specified in the SEC’s rules and regulations and (ii) accumulated and communicated to our management, including our Chief Executive Officer and Chief Financial Officer, to allow timely decisions regarding required disclosure.
Our management, including our Chief Executive Officer and Chief Financial Officer, does not expect that our disclosure controls and procedures or our internal controls over financial reporting will prevent all error and all fraud. A control system, no matter how well conceived and operated, can provide only reasonable, not absolute, assurance that the objectives of the control system are met. Further, the design of a control system must reflect the fact that there are resource constraints and the benefits of controls must be considered relative to their costs. Because of the inherent limitations in all control systems, no evaluation of controls can provide absolute assurance that all control issues and instances of fraud, if any, within Unwired Planet, Inc. have been detected.
Management’s Annual Report on Internal Control over Financial Reporting
Our management is responsible for establishing and maintaining adequate internal control over financial reporting (as defined in Rule 13a-15(f) under the Securities Exchange Act of 1934, as amended). Our management assessed the effectiveness of our internal control over financial reporting as of June 30, 2012. In making this assessment, our management used the criteria set forth by the Committee of Sponsoring Organizations of the Treadway Commission (“COSO”) in Internal Control-Integrated Framework. Our management has concluded that, as of June 30, 2012, our internal control over financial reporting is effective based on these criteria. Management reviewed the results of its assessment with our Audit Committee. The effectiveness of our internal control over financial reporting as of June 30, 2012 has been audited by KPMG, LLP, an independent registered public accounting firm, as stated in its report which is included in the consolidated financial statements of this Annual Report, and incorporated by reference here.
Changes in Internal Control over Financial Reporting
There were no changes in our internal control over financial reporting during the fourth quarter of fiscal 2012 that have materially affected, or are reasonably likely to materially affect our internal control over financial reporting other than controls over financial processes that no longer are relevant following our sale of the products business are no longer performed by the Company.
None.
34
Table of Contents
PART III
Item 10. Directors, Executive Officers and Corporate Governance.
Directors. Information concerning our Directors, including with respect to procedures by which security holders may recommend nominees to our Board of Directors and with respect to the composition of our Audit Committee, is incorporated herein by reference to the sections entitled “Proposal 1—Election of Directors” and “Board Committees and Meetings” contained in our definitive Proxy Statement with respect to our Annual Meeting of Stockholders to be filed with the Securities and Exchange Commission not later than October 29, 2012 in connection with the solicitation of proxies for the Unwired Planet, Inc. 2012 Annual Meeting of Stockholders (the “Proxy Statement”).
Executive Officers. Information concerning our Executive Officers is set forth in the section entitled “Executive Officers” contained in our Proxy Statement and is incorporated herein by reference.
Section 16(a) Beneficial Ownership Reporting Compliance. Information concerning compliance with Section 16(a) of the Securities Act of 1934 is set forth in the section titled “Section 16(a) Beneficial Ownership Reporting Compliance” contained in our Proxy Statement and is incorporated herein by reference.
Code of Conduct and Ethics. The information required by this Item with respect to our code of conduct and ethics is set forth in the section titled “Code of Conduct and Ethics” contained in our Proxy Statement and is incorporated herein by reference.
Item 11. Executive Compensation.
The information required by this Item is set forth in the Proxy Statement under the captions “Board Committees and Meetings,” “Compensation Discussion and Analysis,” “Compensation Committee Report,” “Compensation of Executive Officers,” “Director Compensation” and other sections relating to executive and director compensation. Such information is incorporated herein by reference.
| Item 12. Security | Ownership of Certain Beneficial Owners and Management and Related Stockholder Matters. |
The information required by this Item with respect to security ownership of beneficial owners and management is set forth in the Proxy Statement under the caption, “Security Ownership of Certain Beneficial Owners and Management.” Such information is incorporated herein by reference.
Equity Compensation Plan Information
| Fiscal Year ended June 30, 2012 | ||||||||||||
| Number of shares to be issued upon exercise of outstanding options, warrants and rights |
Weighted-average exercise price of outstanding options, warrants and rights |
Number of shares remaining available for future issuance under equity compensation plans (excluding shares reflected in the first column) |
||||||||||
| (shares in thousands) | ||||||||||||
| Equity compensation plans approved by stockholders |
7,958 | $ | 3.01 | 5,333 | ||||||||
| Equity compensation plans not approved by stockholders |
344 | $ | 4.15 | 281 | ||||||||
|
|
|
|
|
|||||||||
| Total (1) |
8,302 | $ | 3.06 | 5,614 | ||||||||
|
|
|
|
|
|||||||||
35
Table of Contents
| (1) | This table does not include compensation plans from which we are no longer issuing shares, except for the future issuance of shares upon exercise of options that are still outstanding. |
Unwired Planet’s 2001 Stock Compensation Plan
This plan provides for the grant of non-qualified stock options, restricted stock bonus awards, and rights to acquire restricted stock to employees, directors (including non-employee directors) and consultants. A maximum of 4,068,128 shares of our common stock may be issued under this plan, of which 533,333 shares are reserved for issuance to non-officer employees. Shares returning to the plan upon cancellation of outstanding options or the unvested portion of restricted stock bonus awards may be made subject to future awards.
This plan is administered by our Board of Directors, which is entitled to delegate this administration at any time to a Board of Directors committee or sub-committee designated to administer it. The Board of Directors or committee that administers this plan has the full power to select the individuals to whom awards will be granted and to make any combination of awards to any participants. The Board of Directors or committee that administers the plan may set the exercise price for options at, above or below the fair market value of our common stock on the date of grant. Options granted under this plan generally have a term of no more than ten years from the date of grant.
The Board of Directors or committee that administers this plan may also determine the terms of the awards granted, including the exercise or purchase price for an option or stock purchase right, the number of shares subject to each award, the term of the award, and the vesting and/or exercisability provisions applicable to the award.
If we merge with, or are acquired by, another company, awards outstanding under this plan may be assumed or equivalent awards substituted by our acquirer. However, if our acquirer does not agree to assume or substitute for outstanding awards, the awards shall terminate upon the closing of the merger or acquisition.
This plan will continue in effect until terminated by the Board of Directors. The Board of Directors may amend, alter or discontinue the plan, but no amendment, alteration or discontinuation of this plan shall be made without the written consent of a participant, if such participant’s rights would be diminished under any previously granted award.
Item 13. Certain Relationships and Related Transactions, and Director Independence.
Information concerning our Directors independence is incorporated herein by reference to the section entitled “Board Committees and Meetings” contained in the Proxy Statement, and information with respect to related transactions is incorporated herein by reference to the section titled “Transactions with Related Persons” contained in the Proxy Statement.
Item 14. Principal Accounting Fees and Services.
The information required by this Item is set forth in the Proxy Statement under the Proposal titled “Ratification of Selection of Independent Registered Public Accounting Firm.” Such information is incorporated herein by reference.
36
Table of Contents
PART IV
Item 15. Exhibits, Financial Statement Schedules.
| (a) | The following documents are filed as part of this report: |
(1) Financial Statements. The list of Consolidated Financial Statements and Report of KPMG LLP, independent registered public accounting firm filed as part of this Annual Report is set forth in the Index to Consolidated Financial Statements at page F-1, which is incorporated by reference here.
(2) Exhibits. See the Exhibit Index which follows the signature page of this Annual Report, which is incorporated by reference here.
37
Table of Contents
Pursuant to the requirements of Section 13 or 15(d) of the Securities Exchange Act of 1934, the registrant has duly caused this report to be signed on its behalf by the undersigned, thereunto duly authorized.
| UNWIRED PLANET, INC. | ||
| By: |
/S/ MICHAEL C. MULICA | |
| Michael C. Mulica | ||
| Chief Executive Officer | ||
| Date: September 6, 2012 | ||
| By: |
/S/ ANNE K. BRENNAN | |
| Anne K. Brennan | ||
| Chief Financial Officer | ||
| Date: September 6, 2012 | ||
POWER OF ATTORNEY
Each person whose signature appears below constitutes and appoints Michael C. Mulica and Anne K. Brennan, jointly and severally, his or her attorneys-in-fact and agents, each with the power of substitution, for him or her and in his or her name, place or stead, in any and all capacities, to sign any and all amendments to this Annual Report on Form 10-K, and to file the same, with exhibits and other documents in connection therewith, with the Securities and Exchange Commission, granting to each attorney-in-fact and agent, full power and authority to do and perform each and every act and thing requisite and necessary to be done in and about the premises, as fully as he or she might or could do in person, and ratifying and confirming all that the attorneys-in-fact and agents, or his or her substitute or substitutes, may do or cause to be done by virtue hereof.
Pursuant to the requirements of the Securities Exchange Act of 1934, this report has been signed below by the following persons on behalf of the registrant and in the capacities and on the dates indicated.
| Signature |
Title |
Date | ||
| /S/ MICHAEL C. MULICA Michael C. Mulica |
Chief Executive Officer and Director (Principal Executive Officer) |
September 6, 2012 | ||
| /S/ ANNE K. BRENNAN Anne K. Brennan |
Chief Financial Officer (Principal Financial and Accounting Officer) |
September 6, 2012 | ||
| /S/ PETER A. FELD Peter A. Feld |
Chairman of the Board |
September 6, 2012 | ||
| /S/ GERALD D. HELD Gerald D. Held |
Director |
September 6, 2012 | ||
| /S/ BRIAN M. BEATTIE Brian M. Beattie |
Director |
September 6, 2012 | ||
38
Table of Contents
| Signature |
Title |
Date | ||
| /S/ ROBIN A. ABRAMS Robin A. Abrams |
Director |
September 6, 2012 | ||
| /S/ DAVID C. NAGEL David C. Nagel |
Director |
September 6, 2012 | ||
| /S/ HENRY R. NOTHHAFT Henry R. Nothhaft |
Director |
September 6, 2012 | ||
39
Table of Contents
INDEX TO CONSOLIDATED FINANCIAL STATEMENTS
F-1
Table of Contents
Report of Independent Registered Public Accounting Firm
The Board of Directors and Stockholders
Unwired Planet, Inc.:
We have audited the accompanying consolidated balance sheets of Unwired Planet, Inc. and subsidiaries as of June 30, 2012 and 2011, and the related consolidated statements of operations, stockholders’ equity and comprehensive income (loss), and cash flows for each of the years in the three-year period ended June 30, 2012. We also have audited Unwired Planet, Inc.’s internal control over financial reporting as of June 30, 2012, based on criteria established in Internal Control—Integrated Framework issued by the Committee of Sponsoring Organizations of the Treadway Commission (COSO). Unwired Planet, Inc.’s management is responsible for these consolidated financial statements, for maintaining effective internal control over financial reporting, and for its assessment of the effectiveness of internal control over financial reporting, included in the accompanying Management’s Annual Report on Internal Control over Financial Reporting appearing under item 9A. Our responsibility is to express an opinion on these consolidated financial statements and an opinion on the Company’s internal control over financial reporting based on our audits.
We conducted our audits in accordance with the standards of the Public Company Accounting Oversight Board (United States). Those standards require that we plan and perform the audits to obtain reasonable assurance about whether the financial statements are free of material misstatement and whether effective internal control over financial reporting was maintained in all material respects. Our audits of the consolidated financial statements included examining, on a test basis, evidence supporting the amounts and disclosures in the financial statements, assessing the accounting principles used and significant estimates made by management, and evaluating the overall financial statement presentation. Our audit of internal control over financial reporting included obtaining an understanding of internal control over financial reporting, assessing the risk that a material weakness exists, and testing and evaluating the design and operating effectiveness of internal control based on the assessed risk. Our audits also included performing such other procedures as we considered necessary in the circumstances. We believe that our audits provide a reasonable basis for our opinions.
A company’s internal control over financial reporting is a process designed to provide reasonable assurance regarding the reliability of financial reporting and the preparation of financial statements for external purposes in accordance with generally accepted accounting principles. A company’s internal control over financial reporting includes those policies and procedures that (1) pertain to the maintenance of records that, in reasonable detail, accurately and fairly reflect the transactions and dispositions of the assets of the company; (2) provide reasonable assurance that transactions are recorded as necessary to permit preparation of financial statements in accordance with generally accepted accounting principles, and that receipts and expenditures of the company are being made only in accordance with authorizations of management and directors of the company; and (3) provide reasonable assurance regarding prevention or timely detection of unauthorized acquisition, use, or disposition of the company’s assets that could have a material effect on the financial statements.
Because of its inherent limitations, internal control over financial reporting may not prevent or detect misstatements. Also, projections of any evaluation of effectiveness to future periods are subject to the risk that controls may become inadequate because of changes in conditions, or that the degree of compliance with the policies or procedures may deteriorate.
In our opinion, the consolidated financial statements referred to above present fairly, in all material respects, the financial position of Unwired Planet, Inc. and subsidiaries as of June 30, 2012 and 2011, and the results of their
F-2
Table of Contents
operations and their cash flows for each of the years in the three-year period ended June 30, 2012, in conformity with U.S. generally accepted accounting principles. Also in our opinion, Unwired Planet, Inc. maintained, in all material respects, effective internal control over financial reporting as of June 30, 2012, based on criteria established in Internal Control—Integrated Framework issued by the Committee of Sponsoring Organizations of the Treadway Commission.
/s/ KPMG LLP
Santa Clara, California
September 6, 2012
F-3
Table of Contents
CONSOLIDATED BALANCE SHEETS
(In thousands, except per share amounts)
| June 30, | ||||||||
| 2012 | 2011 | |||||||
| ASSETS | ||||||||
| Current assets: |
||||||||
| Cash and cash equivalents |
$ | 39,709 | $ | 47,266 | ||||
| Short-term investments |
43,860 | 33,947 | ||||||
| Prepaid and other current assets |
3,960 | 2,687 | ||||||
| Current assets of discontinued operations |
— | 35,414 | ||||||
|
|
|
|
|
|||||
| Total current assets |
87,529 | 119,314 | ||||||
| Property and equipment, net |
452 | 1,475 | ||||||
| Long-term investments |
9,423 | 15,630 | ||||||
| Deposits and other assets |
89 | 114 | ||||||
| Noncurrent assets of discontinued operations |
— | 11,284 | ||||||
|
|
|
|
|
|||||
| Total assets |
$ | 97,493 | $ | 147,817 | ||||
|
|
|
|
|
|||||
| LIABILITIES AND STOCKHOLDERS’ EQUITY | ||||||||
| Current liabilities: |
||||||||
| Accounts payable |
$ | 6,088 | $ | 2,271 | ||||
| Accrued liabilities |
8,119 | 5,265 | ||||||
| Accrued settlement related to discontinued operation sold in 2008 |
— | 12,000 | ||||||
| Accrued restructuring costs |
12,871 | 13,660 | ||||||
| Current liabilities of discontinued operations |
— | 48,376 | ||||||
|
|
|
|
|
|||||
| Total current liabilities |
27,078 | 81,572 | ||||||
| Accrued restructuring costs, net of current portion |
827 | 12,515 | ||||||
| Long-term taxes payable and other |
959 | 1,415 | ||||||
| Noncurrent liabilities of discontinued operations |
— | 9,370 | ||||||
|
|
|
|
|
|||||
| Total liabilities |
28,864 | 104,872 | ||||||
|
|
|
|
|
|||||
| Commitments and contingencies (see Note 9) |
||||||||
| Stockholders’ equity: |
||||||||
| Preferred stock, $0.001 par value; 5,000 shares authorized and zero outstanding |
— | — | ||||||
| Common stock, $0.001 par value; 1,000,000 shares authorized; 89,595 and 85,640 issued and outstanding, respectively |
89 | 85 | ||||||
| Additional paid-in capital |
3,202,080 | 3,191,775 | ||||||
| Accumulated other comprehensive loss |
(784 | ) | (1,592 | ) | ||||
| Accumulated deficit |
(3,132,756 | ) | (3,147,323 | ) | ||||
|
|
|
|
|
|||||
| Total stockholders’ equity |
68,629 | 42,945 | ||||||
|
|
|
|
|
|||||
| Total liabilities and stockholders’ equity |
$ | 97,493 | $ | 147,817 | ||||
|
|
|
|
|
|||||
See accompanying notes to consolidated financial statements.
F-4
Table of Contents
CONSOLIDATED STATEMENTS OF OPERATIONS
(In thousands, except per share data)
| Fiscal Year ended June 30, | ||||||||||||
| 2012 | 2011 | 2010 | ||||||||||
| Revenues: |
||||||||||||
| Patents |
$ | 15,050 | $ | 4,019 | $ | — | ||||||
|
|
|
|
|
|
|
|||||||
| Total revenues |
15,050 | 4,019 | — | |||||||||
|
|
|
|
|
|
|
|||||||
| Operating costs and expenses: |
||||||||||||
| Sales and marketing expense |
614 | — | — | |||||||||
| Patent initiative expense |
13,089 | 3,398 | 273 | |||||||||
| General and administrative |
7,651 | 5,732 | 7,079 | |||||||||
| Restructuring and other costs |
2,666 | 2,226 | 4,549 | |||||||||
|
|
|
|
|
|
|
|||||||
| Total operating expenses |
24,020 | 11,356 | 11,901 | |||||||||
|
|
|
|
|
|
|
|||||||
| Operating loss from continuing operations |
(8,970 | ) | (7,337 | ) | (11,901 | ) | ||||||
| Interest income |
327 | 565 | 805 | |||||||||
| Interest expense |
(434 | ) | (466 | ) | (590 | ) | ||||||
| Other expense, net |
(362 | ) | (752 | ) | (243 | ) | ||||||
|
|
|
|
|
|
|
|||||||
| Loss from continuing operations |
(9,439 | ) | (7,990 | ) | (11,929 | ) | ||||||
| Income taxes |
(1,289 | ) | 115 | — | ||||||||
|
|
|
|
|
|
|
|||||||
| Net loss from continuing operations |
(8,150 | ) | (8,105 | ) | (11,929 | ) | ||||||
| Discontinued operations: |
||||||||||||
| Net income (loss) from discontinued operations, net of tax |
(27,577 | ) | (17,379 | ) | 1,556 | |||||||
| Gain (loss) on sale of discontinued operations, net of tax |
50,294 | (9,764 | ) | 4,516 | ||||||||
|
|
|
|
|
|
|
|||||||
| Gain (loss) from discontinued operations |
22,717 | (27,143 | ) | 6,072 | ||||||||
|
|
|
|
|
|
|
|||||||
| Net income (loss) |
$ | 14,567 | $ | (35,248 | ) | $ | (5,857 | ) | ||||
|
|
|
|
|
|
|
|||||||
| Basic and diluted net income (loss) per share from: |
||||||||||||
| Continuing operations |
$ | (0.09 | ) | $ | (0.10 | ) | $ | (0.14 | ) | |||
| Discontinued operations |
$ | 0.26 | $ | (0.32 | ) | $ | 0.07 | |||||
|
|
|
|
|
|
|
|||||||
| Net loss |
$ | 0.17 | $ | (0.42 | ) | $ | (0.07 | ) | ||||
|
|
|
|
|
|
|
|||||||
| Shares used in computing: |
||||||||||||
| Basic and diluted net income (loss) per share |
86,354 | 84,577 | 83,500 | |||||||||
| Supplemental disclosures: |
||||||||||||
| Total other-than-temporary impairments |
$ | — | $ | (1,071 | ) | $ | (2,026 | ) | ||||
| Portion of other-than-temporary impairments included in other comprehensive loss |
— | — | 360 | |||||||||
|
|
|
|
|
|
|
|||||||
| Net other-than-temporary impairments |
— | (1,071 | ) | (1,666 | ) | |||||||
| Other investment gains |
— | 163 | (606 | ) | ||||||||
|
|
|
|
|
|
|
|||||||
| Total net investment losses in Other expense, net |
$ | — | $ | (908 | ) | $ | (2,272 | ) | ||||
|
|
|
|
|
|
|
|||||||
See accompanying notes to consolidated financial statements.
F-5
Table of Contents
CONSOLIDATED STATEMENTS OF STOCKHOLDERS’ EQUITY AND COMPREHENSIVE LOSS
Fiscal Year ended June 30, 2012
(In thousands)
| Common stock | Additional
paid-in Capital |
Accumulated
other comprehensive loss |
Accumulated deficit |
Total
stockholders’ equity |
Comprehensive gain (loss) |
|||||||||||||||||||||||
| Shares | Amount | |||||||||||||||||||||||||||
| Balances as of June 30, 2011 |
85,640 | $ | 85 | $ | 3,191,775 | $ | (1,592 | ) | $ | (3,147,323 | ) | $ | 42,945 | |||||||||||||||
| Issuance of common stock related to stock option exercises |
3,958 | 4 | 2,396 | — | — | 2,400 | ||||||||||||||||||||||
| Issuance of common stock related to ESPP |
85 | — | 118 | — | — | 118 | ||||||||||||||||||||||
| Restricted stock grants, net |
178 | — | — | — | — | — | ||||||||||||||||||||||
| Repurchases of restricted stock from employees |
(266 | ) | — | (614 | ) | — | — | (614 | ) | |||||||||||||||||||
| Stock-based compensation |
— | — | 8,405 | — | — | 8,405 | ||||||||||||||||||||||
| Comprehensive income: |
||||||||||||||||||||||||||||
| Net income |
— | — | — | — | 14,567 | 14,567 | $ | 14,567 | ||||||||||||||||||||
| Foreign currency translation adjustment |
— | — | — | 771 | — | 771 | 771 | |||||||||||||||||||||
| Unrealized gain on available-for-sale securities |
— | — | — | 37 | — | 37 | 37 | |||||||||||||||||||||
|
|
|
|||||||||||||||||||||||||||
| Total comprehensive income |
— | — | — | $ | 15,375 | |||||||||||||||||||||||
|
|
|
|
|
|
|
|
|
|
|
|
|
|
|
|||||||||||||||
| Balances as of June 30, 2012 |
89,595 | $ | 89 | $ | 3,202,080 | $ | (784 | ) | $ | (3,132,756 | ) | $ | 68,629 | |||||||||||||||
|
|
|
|
|
|
|
|
|
|
|
|
|
|||||||||||||||||
See accompanying notes to consolidated financial statements.
F-6
Table of Contents
UNWIRED PLANET, INC.
CONSOLIDATED STATEMENTS OF STOCKHOLDERS’ EQUITY AND COMPREHENSIVE LOSS—(CONTINUED)
Fiscal Year ended June 30, 2011
(In thousands)
| Common stock | Additional
paid-in Capital |
Accumulated
other comprehensive loss |
Accumulated deficit |
Total
stockholders’ equity |
Comprehensive gain (loss) |
|||||||||||||||||||||||
| Shares | Amount | |||||||||||||||||||||||||||
| Balances as of June 30, 2010 |
84,210 | $ | 84 | $ | 3,187,265 | $ | (2,515 | ) | $ | (3,112,075 | ) | $ | 72,759 | |||||||||||||||
| Issuance of common stock related to stock option exercises |
1,111 | 1 | 1,627 | — | — | 1,628 | ||||||||||||||||||||||
| Issuance of common stock related to ESPP |
230 | — | 400 | — | — | 400 | ||||||||||||||||||||||
| Restricted stock grants, net |
108 | — | — | — | — | — | ||||||||||||||||||||||
| Repurchases of restricted stock from employees |
(19 | ) | — | — | — | — | — | |||||||||||||||||||||
| Stock-based compensation |
— | — | 2,483 | — | — | 2,483 | ||||||||||||||||||||||
| Comprehensive loss: |
||||||||||||||||||||||||||||
| Net loss |
— | — | — | — | (35,248 | ) | (35,248 | ) | $ | (35,248 | ) | |||||||||||||||||
| Unrealized gain on available-for-sale securities |
— | — | — | 923 | — | 923 | 923 | |||||||||||||||||||||
|
|
|
|||||||||||||||||||||||||||
| Total comprehensive loss |
$ | (34,325 | ) | |||||||||||||||||||||||||
|
|
|
|
|
|
|
|
|
|
|
|
|
|
|
|||||||||||||||
| Balances as of June 30, 2011 |
85,640 | $ | 85 | $ | 3,191,775 | $ | (1,592 | ) | $ | (3,147,323 | ) | $ | 42,945 | |||||||||||||||
|
|
|
|
|
|
|
|
|
|
|
|
|
|||||||||||||||||
See accompanying notes to consolidated financial statements.
F-7
Table of Contents
UNWIRED PLANET, INC.
CONSOLIDATED STATEMENTS OF STOCKHOLDERS’ EQUITY AND COMPREHENSIVE LOSS—(CONTINUED)
Fiscal Year ended June 30, 2010
(In thousands)
| Common stock | Additional
paid-in Capital |
Accumulated
other comprehensive loss |
Accumulated deficit |
Total
stockholders’ equity |
Comprehensive gain (loss) |
|||||||||||||||||||||||
| Shares | Amount | |||||||||||||||||||||||||||
| Balances as of June 30, 2009 |
83,454 | $ | 83 | $ | 3,184,263 | $ | (5,432 | ) | $ | (3,106,218 | ) | $ | 72,696 | |||||||||||||||
| Issuance of common stock related to stock option exercises |
405 | 1 | 609 | — | — | 610 | ||||||||||||||||||||||
| Issuance of common stock related to ESPP |
243 | — | 379 | — | — | 379 | ||||||||||||||||||||||
| Restricted stock grants |
108 | — | — | — | — | — | ||||||||||||||||||||||
| Stock-based compensation |
— | — | 2,014 | — | — | 2,014 | ||||||||||||||||||||||
| Comprehensive loss: |
||||||||||||||||||||||||||||
| Net loss |
— | — | — | — | (5,857 | ) | (5,857 | ) | $ | (5,857 | ) | |||||||||||||||||
| Unrealized gain on available-for-sale securities |
— | — | — | 2,917 | — | 2,917 | 2,917 | |||||||||||||||||||||
|
|
|
|||||||||||||||||||||||||||
| Total comprehensive loss |
$ | (2,940 | ) | |||||||||||||||||||||||||
|
|
|
|
|
|
|
|
|
|
|
|
|
|
|
|||||||||||||||
| Balances as of June 30, 2010 |
84,210 | $ | 84 | $ | 3,187,265 | $ | (2,515 | ) | $ | (3,112,075 | ) | $ | 72,759 | |||||||||||||||
|
|
|
|
|
|
|
|
|
|
|
|
|
|||||||||||||||||
See accompanying notes to consolidated financial statements.
F-8
Table of Contents
CONSOLIDATED STATEMENTS OF CASH FLOWS
(In thousands)
| Fiscal Year ended June 30, | ||||||||||||
| 2012 | 2011 | 2010 | ||||||||||
| Cash flows from operating activities: |
||||||||||||
| Net income (loss) |
$ | 14,567 | $ | (35,248 | ) | $ | (5,857 | ) | ||||
| Gain on sale of discontinued operations |
(50,294 | ) | (2,236 | ) | (4,516 | ) | ||||||
| Adjustments to reconcile net loss to net cash provided by (used for) operating activities: |
||||||||||||
| Depreciation and amortization of intangibles |
4,011 | 6,896 | 7,110 | |||||||||
| Stock-based compensation |
8,405 | 2,483 | 2,014 | |||||||||
| Noncash restructuring charges and other |
691 | 1,109 | 1,439 | |||||||||
| Net noncash tax benefits |
(1,289 | ) | (3,411 | ) | — | |||||||
| Accelerated depreciation on restructured property and equipment |
— | — | 242 | |||||||||
| (Gain)/loss on disposal of property and equipment |
276 | 86 | 1,005 | |||||||||
| Amortization/(accretion) of premiums/discounts on investments |
1,037 | 1,261 | 899 | |||||||||
| Realized losses and impairments of non-marketable securities, net |
— | 921 | 2,272 | |||||||||
| Recovery of (provision for) doubtful accounts |
447 | (351 | ) | (69 | ) | |||||||
| Changes in operating assets and liabilities, net of effect of acquired or disposed assets and liabilities: |
||||||||||||
| Accounts receivable |
(4,308 | ) | 9,369 | 16 | ||||||||
| Prepaid assets, deposits, and other assets |
6,805 | 6,068 | 6,365 | |||||||||
| Accounts payable |
104 | 2,750 | (1,007 | ) | ||||||||
| Accrued liabilities |
(3,715 | ) | 11,174 | (4,858 | ) | |||||||
| Accrued restructuring costs |
(13,160 | ) | (13,882 | ) | (10,961 | ) | ||||||
| Deferred revenue |
(7,205 | ) | (8,474 | ) | (3,318 | ) | ||||||
|
|
|
|
|
|
|
|||||||
| Net cash provided by (used for) operating activities |
(43,628 | ) | (21,485 | ) | (9,224 | ) | ||||||
|
|
|
|
|
|
|
|||||||
| Cash flows from investing activities: |
||||||||||||
| Purchases of property and equipment |
(523 | ) | (4,045 | ) | (3,159 | ) | ||||||
| Restricted cash and investments |
— | 357 | 418 | |||||||||
| Settlement related to discontinued operation sold in 2008 |
(12,000 | ) | — | — | ||||||||
| Proceeds from sale of discontinued operations, net |
51,399 | 2,236 | 4,516 | |||||||||
| Purchases of short-term investments |
(35,872 | ) | (46,241 | ) | (49,351 | ) | ||||||
| Proceeds from sales and maturities of short-term investments |
37,471 | 65,420 | 32,139 | |||||||||
| Purchases of long-term investments |
(8,516 | ) | (18,055 | ) | (14,429 | ) | ||||||
| Proceeds from sales and maturities of long-term investments |
2,208 | 6,116 | 7,692 | |||||||||
|
|
|
|
|
|
|
|||||||
| Net cash provided by (used for) investing activities |
34,167 | 5,788 | (22,174 | ) | ||||||||
|
|
|
|
|
|
|
|||||||
| Cash flows from financing activities: |
||||||||||||
| Fee on line of credit |
— | — | (200 | ) | ||||||||
| Proceeds from issuance of common stock |
1,786 | 1,628 | 609 | |||||||||
| Employee stock purchase plan |
118 | 400 | 379 | |||||||||
|
|
|
|
|
|
|
|||||||
| Net cash provided by (used for) financing activities |
1,904 | 2,028 | 788 | |||||||||
|
|
|
|
|
|
|
|||||||
| Net decrease in cash and cash equivalents |
(7,557 | ) | (13,669 | ) | (30,610 | ) | ||||||
| Cash and cash equivalents at beginning of year |
47,266 | 60,935 | 91,545 | |||||||||
|
|
|
|
|
|
|
|||||||
| Cash and cash equivalents at end of year |
$ | 39,709 | $ | 47,266 | $ | 60,935 | ||||||
|
|
|
|
|
|
|
|||||||
| Cash paid for income taxes |
$ | 660 | $ | 722 | $ | 1,860 | ||||||
|
|
|
|
|
|
|
|||||||
| Cash paid for interest |
$ | 434 | $ | 466 | $ | 506 | ||||||
|
|
|
|
|
|
|
|||||||
| Non-cash investing and financing activities: |
||||||||||||
| Transfers among short-term and long-term investments |
$ | 12,465 | $ | 8,984 | $ | 11,266 | ||||||
|
|
|
|
|
|
|
|||||||
See accompanying notes to consolidated financial statements.
F-9
Table of Contents
NOTES TO CONSOLIDATED FINANCIAL STATEMENTS
June 30, 2012, 2011 and 2010
(1) Organization
Unwired Planet, Inc. (the “Company”), was incorporated in Delaware in 1994 and established many of the foundational patents that allow mobile devices to connect to the Internet. Over the years, the Company has amassed a patent portfolio of approximately 200 issued United States and foreign patents and approximately 75 pending applications, some of which the Company believe are foundational in allowing mobile devices to connect to the Internet.
(2) Significant Accounting Policies
(a) Basis of Presentation and Principles of Consolidation
The accompanying consolidated financial statements include the accounts of the Company and its wholly-owned subsidiaries. All intercompany accounts and transactions have been eliminated in consolidation.
The Company announced the sale of the location product line on February 1, 2012 to Persistent Systems. On April 16, 2012, the Company announced the disposition of the mediation and messaging product lines, which were the Company’s remaining product-related businesses. The Company accounted for the sale of the location, mediation and messaging product lines as a discontinued operation. Accordingly, the consolidated financial statements have been revised for all periods presented to reflect both the location and the mediation and messaging businesses as discontinued operations. On April 30, 2012, the Company completed the sale of the mediation and messaging businesses to Openwave Mobility, Inc. (formerly, OM 1, Inc.) (“Openwave Mobility”), a portfolio company of Marlin Equity Partners.
(b) Classification Among Continuing and Discontinued Operations
Due to the sale of the Company’s remaining product businesses in 2012, the Company has presented financial results for the product businesses in discontinued operations. As the majority of costs related to employees and operations in the past related to product operations, the Company identified costs it considered to be related to the ongoing intellectual property business for presentation in continuing operations. Costs the Company identified as relating to continuing operations include costs related to all personnel dedicated to its patent initiatives, including external legal fees and support personnel. Additionally, certain general and administrative costs were included, which are equivalent to the resources the Company expects to have on an ongoing basis after its transition to an intellectual property business. This includes the Company’s CEO and CFO, as well as accounting, information systems, and support personnel. All compensation, benefits, stock-based compensation and restructuring costs, if any, associated with these positions were included in ongoing operations. Additionally, the Company included costs related to being a public company, such as external audit costs, costs associated with the Sarbanes-Oxley Act, board of directors fees, SEC filings and NASDAQ fees. Facilities and information technology costs were allocated based upon the percentage of headcount of the employees assumed to be working primarily for the intellectual property business. Restructuring costs related to facilities remained in continuing operations, as we have retained the related liabilities. All other historical costs were classified as discontinued operations as they were considered necessary to support the product businesses.
Unless noted otherwise, discussions in the Notes to Consolidated Financial Statements pertain to continuing operations.
F-10
Table of Contents
(c) Use of Estimates and Business Risks
The preparation of consolidated financial statements in conformity with the accounting principles generally accepted in the United States of America requires management to make estimates and assumptions that affect the reported amounts of assets and liabilities and disclosure of contingent assets and liabilities at the date of the consolidated financial statements and the reported amounts of revenues and expenses during the reporting period. Actual results could differ from those estimates.
On January 12, 2012, the Company announced its pursuit of strategic alternatives for its product operations. On February 1, 2012, the Company announced the sale of its location product operations for a purchase price of $6.0 million. On April 16, 2012, the Company announced the disposition of the mediation and messaging businesses. The sale of these businesses was designed to allow the Company to focus on realizing the value of its intellectual property, which is likely to require significant legal expense in pursuing payments for the licensing of the Company’s patents. For example, on August 31, 2011, the Company announced it filed complaints against Apple Inc. and Research In Motion Limited in order to protect its intellectual property on how mobile devices connect to the Internet. This litigation is ongoing. During the first quarter of fiscal 2012, we entered into a license agreement with Microsoft whereby we licensed rights to all of our patents for a fee of $15.0 million which was received during the second quarter of fiscal 2012. Additionally, during the first quarter of fiscal 2011 we licensed a number of patents to a competitor which generated $4.0 million in patent revenue for the period.
The Company currently derives its ongoing patent royalty revenues from one licensee. The timing of future patent licensing transactions, if any, can create significant variability in the timing and level of Company revenues and profitability.
(d) Cash, Cash Equivalents and Short- and Long-Term Investments
Cash and cash equivalents are comprised of cash and highly liquid investments with remaining maturities of 90 days or less at the date of purchase. Cash equivalents are comprised of short-term investments with an investment rating by any two of the following: Moody’s of A-2 or higher, or by Standard & Poor’s of A1 or higher. The Company is exposed to credit risk in the event of default by the financial institutions or the issuers of these investments to the extent of the amounts recorded on the consolidated balance sheet are in excess of amounts that are insured by the FDIC.
The Company classifies its short and long-term investments in debt and marketable equity securities as available-for-sale. Available-for-sale securities are carried at fair value with unrealized gains and losses recorded in accumulated other comprehensive income (loss) until realized or a loss is considered to be other than temporary. The Company uses the specific-identification method in determining cost in calculating realized gains and losses.
(e) Property and Equipment
Property and equipment are recorded at cost less accumulated depreciation and amortization. Depreciation is calculated using the straight-line method over the estimated useful lives of the respective assets, generally three to five years. Leasehold improvements are amortized over the shorter of the estimated useful lives of the assets or the lease term.
(f) Revenue Recognition
The Company recognizes revenue from the licensing of the Company’s intellectual property when the following fundamental criteria are met: (i) persuasive evidence of an arrangement exists, (ii) delivery has occurred, (iii) the sales
F-11
Table of Contents
price is fixed or determinable, and (iv) collection of resulting receivables is reasonably assured. To date, our patent license agreements have provided for the grant of perpetual licenses, covenants-not-to-sue, and releases from any pending litigation, upon execution of the agreement. To date, revenue from upfront payments from licensees for the licensing of the Company’s patents has been recognized when the arrangement is mutually signed, since there has been no delivery or future performance obligation and the other three criteria are met upon signing the arrangement. When patent licensing arrangements include royalties for future sales of the licensee’s products using our licensed patented technology, revenue is recognized when the royalty report is received from the licensee, at which time the fixed and determinable criteria is met.
(g) Advertising Expense
Advertising and promotion costs are charged to expense as incurred. Advertising costs totaled $0.2 million for fiscal 2012. There were no advertising costs related to the continuing operations recognized in fiscal 2011 and 2010. The Company records advertising expense in sales and marketing in the consolidated statements of operations.
(h) Stock-based Compensation
The Company recognizes expense for the fair value of its stock-based compensation awards.
The following table illustrates stock-based compensation recognized in the consolidated statements of operations by category of award (in thousands):
| Fiscal Year ended June 30, | ||||||||||||
| 2012 | 2011 | 2010 | ||||||||||
| Stock-based compensation related to: |
||||||||||||
| Grants of nonvested stock |
$ | 1,031 | $ | 183 | $ | 224 | ||||||
| Stock options granted to employees and directors |
801 | 219 | 191 | |||||||||
| Discontinued operations |
6,573 | 2,081 | 1,599 | |||||||||
|
|
|
|
|
|
|
|||||||
| Stock-based compensation recognized in the statements of operations |
$ | 8,405 | $ | 2,483 | $ | 2,014 | ||||||
|
|
|
|
|
|
|
|||||||
During fiscal 2012, the Company accelerated the vesting of 168,000 shares of stock and extended the exercise period of 148,000 shares of stock held by two former directors of the Company. Additionally, the Company accelerated the vesting of approximately 257,813 shares of stock and extended the exercise period of approximately 1.2 million shares of stock held by several key employees who departed the Company. As a result of these modifications, the Company recorded approximately $0.8 million in stock-based compensation expense, which represents the incremental value of the modified awards. Additionally, during the third quarter of fiscal 2012, the Company granted approximately 2.2 million shares of restricted stock units to key employees. The vesting of the restricted stock units accelerated during the fourth quarter of fiscal 2012 upon the closing of the sale of the mediation and messaging product businesses, and resulted in $4.2 million in stock-based compensation expense being recorded during fiscal 2012. Of this $4.2 million, $3.2 million was recorded in discontinued operations in fiscal 2012.
During fiscal 2012, 2011 and 2010, tax benefits related to stock option expense were immaterial.
The Company amortizes stock-based compensation for awards granted on a straight-line basis over the requisite service (vesting) period for the entire award.
(i) Foreign Currency Translation and Derivative Financial Instruments
The functional currency of the Company’s foreign subsidiaries is the United States Dollar (“USD”).
F-12
Table of Contents
Current assets and current liabilities recorded in foreign subsidiaries are translated into USD at year-end exchange rates and revenues and expenses are translated at average exchange rates during the year. The effects of foreign currency translation adjustments for subsidiaries are included in other expense, net in the consolidated statements of operations. All transactional gains or losses on foreign currency transactions are recognized in other expense, net in the consolidated statements of operations.
The Company has operated internationally and is exposed to potentially adverse movements in foreign currency rate changes. With the disposition of the Company’s product businesses as of April 30, 2012, the Company expects to have a significantly reduced exposure to foreign currency rate changes. Prior to April 30, 2012, the Company had entered into foreign exchange derivative instruments to reduce its exposure to foreign currency rate changes on receivables, payables and intercompany balances denominated in a nonfunctional currency. The objective of these contracts is to neutralize the impact of foreign currency exchange rate movements on the Company’s operating results. The Company manages its foreign currency exchange rate risk by entering into contracts to sell or buy foreign currency to reduce its exposure to currency fluctuations involving anticipated and current foreign currency exposures. Forward contracts require the Company to exchange currencies at rates agreed upon at the inception of the contracts. Option contracts give the Company the right to buy or sell, but not an obligation to buy or sell, on rates agreed upon at inception of the contracts. These contracts reduce the exposure to fluctuations in exchange rate movements because the gains and losses associated with foreign currency balances and transactions are generally offset with the gains and losses of the foreign exchange forward and option contracts. The Company does not designate its foreign exchange forward and option contracts as accounting hedges as defined by accounting guidance for derivatives and hedging, accordingly, changes in fair value of these contracts are recorded in continuing operations. Net foreign exchange gains (losses) included in other expense, net in the accompanying consolidated statements of operations totaled $(0.4) million, $0.1 million and $(44,000) for fiscal 2012, 2011 and 2010, respectively. As of June 30, 2012, the Company had no outstanding forward contracts.
As of June 30, 2011, the Company had the following outstanding forward contracts (notional amounts in thousands):
| Currency |
Notional Amount |
Foreign Currency per USD |
Date of Maturity |
|||||||||
| AUD |
1,600 | 1.05 | 7/29/2011 | |||||||||
| CAD |
2,100 | 1.01 | 7/29/2011 | |||||||||
| EUR |
1,250 | 0.69 | 7/29/2011 | |||||||||
| JPY |
200,000 | 80.93 | 7/29/2011 | |||||||||
As of June 30, 2011, the nominal value multiplied by the USD exchange rate of these forward contracts was $8.2 million. The Company’s mark-to-market net unrealized gain on these contracts as of June 30, 2011 was $0.1 million.
(j) Income Taxes
Income taxes are accounted for under the asset and liability method. Deferred tax assets and liabilities are recognized for the future tax consequences attributable to differences between the financial statement carrying amount of existing assets and liabilities and their respective tax basis and operating loss and tax credit carry-forwards. Deferred tax assets and liabilities are measured using enacted tax rates expected to apply to taxable income in the years in which those temporary differences are expected to be recovered or settled. The effect on deferred tax assets and liabilities of a change in tax rates is recognized in income in the period that includes the enactment date. Valuation allowances are established when necessary in order to reduce deferred tax assets to the amounts expected to be recovered.
F-13
Table of Contents
(k) Comprehensive Loss
Comprehensive loss includes net loss, unrealized gains (losses) on available for sale securities, and foreign currency translation adjustments for subsidiaries whose functional currency is not the USD. Tax effects of comprehensive loss have not been material. The Company reports the components of comprehensive loss on its consolidated statements of stockholders’ equity and comprehensive (loss) income. The balance of accumulated foreign currency translation adjustments at June 30, 2011 was $(0.8) million. Upon the sale of the product businesses in April 2012, the balance of accumulated foreign currency translation adjustment was eliminated. The amount of accumulated unrealized loss on available-for-sale securities at June 30, 2012 and 2011 was $0.8 million and $0.8 million, respectively.
The following table sets forth the components of accumulated other comprehensive loss for fiscal 2012, 2011 and 2010 (in thousands):
| Unrealized Gain (Loss) on: |
||||||||||||
| Available for Sale Securities |
Foreign Currency Translation |
Total | ||||||||||
| Balance at June 30, 2009 |
(4,661 | ) | (771 | ) | (5,432 | ) | ||||||
| Net change in fair value recorded in accumulated OCI |
2,026 | — | 2,026 | |||||||||
| Net realized losses reclassified to earnings |
891 | — | 891 | |||||||||
|
|
|
|
|
|
|
|||||||
| Balance at June 30, 2010 |
(1,744 | ) | (771 | ) | (2,515 | ) | ||||||
| Net change in fair value recorded in accumulated OCI |
16 | — | 16 | |||||||||
| Net realized losses reclassified to earnings |
907 | — | 907 | |||||||||
|
|
|
|
|
|
|
|||||||
| Balance at June 30, 2011 |
(821 | ) | (771 | ) | (1,592 | ) | ||||||
| Net change in fair value recorded in accumulated OCI |
37 | — | 37 | |||||||||
| Net realized losses reclassified to earnings |
— | — | — | |||||||||
| Impact of sale of discontinued operations |
— | 771 | 771 | |||||||||
|
|
|
|
|
|
|
|||||||
| Balance at June 30, 2012 |
$ | (784 | ) | $ | — | $ | (784 | ) | ||||
|
|
|
|
|
|
|
|||||||
The components of accumulated other comprehensive loss were as follows as of the dates noted (in thousands):
| June 30, 2012 |
June 30, 2011 |
|||||||
| Net unrealized gains (losses) on marketable securities: |
||||||||
| Unrealized gain (loss) on marketable securities not other-than-temporarily impaired |
$ | (11 | ) | $ | 18 | |||
| Unrealized loss on marketable securities other-than-temporarily impaired |
(801 | ) | (855 | ) | ||||
|
|
|
|
|
|||||
| Net unrealized loss on marketable securities |
(812 | ) | (837 | ) | ||||
| Interest on marketable securities |
28 | 16 | ||||||
| Cumulative translation adjustments |
— | (771 | ) | |||||
|
|
|
|
|
|||||
| Total Accumulated other comprehensive loss |
$ | (784 | ) | $ | (1,592 | ) | ||
|
|
|
|
|
|||||
(l) Financial Instruments and Concentration of Risk
The carrying value of financial instruments, including cash and cash equivalents, short-term investments and accounts payable, approximates fair value due to the short-term nature of these financial instruments. Financial instruments that subject the Company to concentrations of credit risk consist primarily of cash and cash equivalents and marketable investments.
F-14
Table of Contents
Cash and cash equivalents and short and long term investments are held with large and established financial institutions.
The Company currently derives its ongoing patent royalty revenues from one licensee. The timing of future patent licensing transactions, if any, can create significant variability in the timing and level of Company revenues and profitability.
(m) Net Income (Loss) Per Share
Basic net income (loss) per share has been computed using the weighted average number of shares of common stock outstanding during the period, less shares subject to repurchase. The following table presents the calculation of basic and diluted net income (loss) per share (in thousands, except per share amounts):
| Fiscal Year ended June 30, | ||||||||||||
| 2012 | 2011 | 2010 | ||||||||||
| Net income (loss): |
||||||||||||
| Net loss from continuing operations |
$ | (8,150 | ) | $ | (8,105 | ) | $ | (11,929 | ) | |||
| Net income (loss) from discontinued operations, net of tax |
22,717 | (27,143 | ) | 6,072 | ||||||||
|
|
|
|
|
|
|
|||||||
| Net income (loss) |
$ | 14,567 | $ | (35,248 | ) | $ | (5,857 | ) | ||||
|
|
|
|
|
|
|
|||||||
| Weighted average shares: |
||||||||||||
| Weighted average shares of common stock outstanding |
86,567 | 84,781 | 83,712 | |||||||||
| Weighted average shares of restricted stock subject to repurchase |
(213 | ) | (204 | ) | (212 | ) | ||||||
|
|
|
|
|
|
|
|||||||
| Weighted average shares used in computing basic net income (loss) per common share |
86,354 | 84,577 | 83,500 | |||||||||
| Dilutive effect of restricted stock subject to repurchase |
— | — | — | |||||||||
| Dilutive effect of employee stock options |
— | — | — | |||||||||
|
|
|
|
|
|
|
|||||||
| Weighted average shares used in computing diluted net income (loss) per share |
86,354 | 84,577 | 83,500 | |||||||||
|
|
|
|
|
|
|
|||||||
| Net income (loss) per share: |
||||||||||||
| Basic and diluted: |
||||||||||||
| Net loss from continuing operations |
$ | (0.09 | ) | $ | (0.10 | ) | $ | (0.14 | ) | |||
| Net income (loss) from discontinued operations |
$ | 0.26 | $ | (0.32 | ) | $ | 0.07 | |||||
|
|
|
|
|
|
|
|||||||
| Net loss |
$ | 0.17 | $ | (0.42 | ) | $ | (0.07 | ) | ||||
|
|
|
|
|
|
|
|||||||
The following table sets forth potential shares of common stock that are not included in the diluted net income (loss) per share calculation because to do so would be antidilutive for the periods indicated below (in thousands):
| Fiscal Year ended June 30, | ||||||||||||
| 2012 | 2011 | 2010 | ||||||||||
| Weighted average effect of potential common stock: |
||||||||||||
| Unvested common stock subject to repurchase |
213 | 204 | 212 | |||||||||
| Options that would have been included in the computation of dilutive shares outstanding had the Company reported net income from continuing operations, prior to applying the treasury method |
2,876 | 3,636 | 5,000 | |||||||||
| Options that were excluded from the computation of dilutive shares outstanding because the total assumed proceeds exceeded the average market value of the Company’s common stock during the fiscal year |
7,730 | 7,018 | 3,846 | |||||||||
F-15
Table of Contents
(3) Discontinued Operations
a) Product Business
On January 12, 2012, the Company announced its pursuit of strategic alternatives for its product operations. On February 1, 2012, the Company sold its non-core business, Location, to a subsidiary of Persistent Systems Ltd (“Persistent Systems”) for $6.0 million in cash, with $0.6 million of that amount being placed in an escrow account for a period of one year, to secure indemnification claims made by Persistent Systems, if any. The Company recorded a pre-tax gain on sale of discontinued operations of approximately $5.2 million, excluding the $0.6 million in escrow, within discontinued operations in the third quarter of fiscal 2012.
On April 16, 2012, the Company announced an agreement had been reached to sell its mediation and messaging businesses. On April 30, 2012, the Company completed the sale of the mediation and messaging businesses to Openwave Mobility, a portfolio company of Marlin Equity Partners. These sales complete the divestiture of Unwired Planet’s product business. As such, the historical results of the product business will be reclassified and presented as discontinued operations in future financial statement filings. Openwave Mobility paid $49.6 million in cash, subject to certain working capital adjustments thereto as provided in the Asset Purchase and Sale Agreement, upon the closing of the transaction. As of June 30, 2012, the Company has estimated and recorded a liability related to working capital adjustments of $1.3 million. The purchase price is subject to an additional potential liability up to $1.3 million, regarding working capital adjustments, which are currently in dispute with the buyer. Additional purchase price adjustments, if any, will be reflected as gain/(loss) on sale of discontinued operation in the period determined.
The Company and Openwave Mobility also entered into a transition services agreement (“TSA”) under which the Company will provide accounting and other services to Openwave Mobility for a period not to exceed six months. Openwave Mobility is paying a flat fee for these services per month. Any costs of providing these services that are incremental to the flat fee will be reflected in discontinued operations on the statement of operations in future periods.
Upon these sales of the location, mediation and messaging businesses, the product businesses’ financial results have been classified as a discontinued operation in our consolidated financial statements for all periods presented. The net assets associated with the remaining product businesses were classified as “held-for-sale” from March 31, 2012 until their disposition on April 30, 2012.
The financial results of the product business included in discontinued operations were as follows (in thousands):
| Fiscal Year ended June 30, | ||||||||||||
| 2012 | 2011 | 2010 | ||||||||||
| Revenue of discontinued operations |
$ | 105,009 | $ | 151,527 | $ | 183,304 | ||||||
|
|
|
|
|
|
|
|||||||
| Loss from discontinued operations |
(22,069 | ) | (15,569 | ) | 4,520 | |||||||
| Income tax (benefit) expense |
5,508 | 1,810 | 2,964 | |||||||||
|
|
|
|
|
|
|
|||||||
| Net loss from discontinued operations, net of taxes |
$ | (27,577 | ) | $ | (17,379 | ) | $ | 1,556 | ||||
|
|
|
|
|
|
|
|||||||
F-16
Table of Contents
The following table presents the carrying amounts of major classes of assets and liabilities relating to the discontinued operation at June 30, 2012 and June 30, 2011 (in thousands):
| June 30, 2011 | ||||
| Assets: |
||||
| Accounts receivable, net |
$ | 22,293 | ||
| Prepaid and other current assets |
13,121 | |||
|
|
|
|||
| Total current assets of discontinued operations |
35,414 | |||
| Property and equipment, net |
5,205 | |||
| Deposits and other assets |
5,258 | |||
| Goodwill |
267 | |||
| Intangible assets, net |
554 | |||
|
|
|
|||
| Total non-current assets of discontinued operations |
$ | 11,284 | ||
| Liabilities: |
||||
| Accounts payable |
$ | 4,743 | ||
| Accrued liabilities |
14,545 | |||
| Deferred revenue |
29,088 | |||
|
|
|
|||
| Total current liabilities of discontinued operations |
48,376 | |||
| Deferred revenue, net of current portion |
9,370 | |||
|
|
|
|||
| Total non-current liabilities of discontinued operations |
$ | 9,370 | ||
b) Client Operations
During fiscal 2008, the Company sold its Client operations to Purple Labs, a private company based in Chambéry, France. The terms of the agreement include initial consideration of $20.0 million in cash received by the Company in June 2008, and a note receivable of $5.8 million that was paid in July 2008.
Additionally, upon the sale in June 2008, $4.2 million was placed in escrow by Purple Labs, originally to be held until September 30, 2009, to secure indemnification claims made by Purple Labs, if any. On September 23, 2009, Myriad AG (formerly known as Purple Labs) (“Myriad”) made claims against the escrow in excess of $4.2 million and therefore the funds were not released from escrow. On September 24, 2010, the parties agreed to release $2.0 million from the escrow to Myriad and the remaining balance of $2.2 million, plus accrued interest, to the Company. This amount was recognized as a gain on sale of discontinued operations in the first quarter of fiscal 2011.
On August 28, 2011, the Company entered into an agreement with Myriad (the “Agreement”) for the purposes of settling all existing litigation between the Company and Myriad in connection with the Company’s sale of the client business to Purple Labs in June 2008. The Agreement terminated specified sections of an intellectual property licensing agreement which was entered into in connection with the sale of its client business that occurred in June 2008, clarified which patents were transferred with the sale of the client business and which remained the property of the Company, contained a mutual covenant not to sue, and provided that the Company would pay to Myriad $12.0 million. The payment of $12.0 million occurred in September 2011, and was recorded as a loss on discontinued operations in the fourth quarter of fiscal 2011.
The Client operations financial results have been classified as a discontinued operation in the Company’s condensed consolidated statements of operations for each period presented.
F-17
Table of Contents
The financial results of Client operations included in discontinued operations were as follows (in thousands):
| Fiscal Year ended June 30, | ||||||||||||
| 2012 | 2011 | 2010 | ||||||||||
| Revenue of discontinued operation |
$ | — | $ | — | $ | — | ||||||
|
|
|
|
|
|
|
|||||||
| Income from discontinued operation |
— | — | — | |||||||||
| Income tax benefit (expense) |
— | (3,411 | ) | — | ||||||||
|
|
|
|
|
|
|
|||||||
| Income from discontinued operation, net of taxes |
— | 3,411 | — | |||||||||
| Gain (loss) on sale of discontinued operation |
— | (9,764 | ) | — | ||||||||
|
|
|
|
|
|
|
|||||||
| Total income from discontinued operation |
$ | — | $ | (6,353 | ) | $ | — | |||||
|
|
|
|
|
|
|
|||||||
(4) Recent Accounting Pronouncements
Recently Adopted Accounting Pronouncements
Effective January 1, 2012, the Company adopted the following accounting guidance for fair value measurement on a prospective basis:
Accounting Standards Update No. 2011-04, Fair Value Measurement (Topic 820), Amendments to Achieve Common Fair Value Measurement and Disclosure Requirements in U.S. GAAP and IFRS (“Update 2011-04”). Update 2011-04 amends the requirements related to fair value measurement, in particular changing the wording used to describe many requirements in Generally Accepted Accounting Principles (“GAAP”) for measuring fair value and for disclosing information about fair value measurements. The amendments also serve to clarify the FASB’s intent about the application of existing fair value measurement requirements. The amended guidance is effective for interim and annual periods beginning after December 15, 2011, and is applied prospectively. The Company adopted this guidance beginning in the third quarter of fiscal 2012. The adoption of Update 2011-04 did not have a material impact on the Company’s consolidated financial statements, results of operations or cashflows.
Recently Issued Accounting Pronouncements
Accounting Standards Update No. 2010-28, Intangibles—Goodwill and Other (Topic 350), When to Perform Step 2 of the Goodwill Impairment Test for Reporting Units with Zero or Negative Carrying Amounts (“Update 2010-28”). Update 2010-28 amends the criteria for performing Step 2 of the goodwill impairment test for reporting units with zero or negative carrying amounts and requires performing Step 2 if qualitative factors indicate that it is more likely than not that a goodwill impairment exists. Update 2010-28 is effective for fiscal years beginning after December 15, 2011. The adoption of this guidance is not expected to have a material impact on the Company’s consolidated financial position, results of operations or cash flows.
Accounting Standards Update No. 2011-05, Comprehensive Income (Topic 220), Presentation of Comprehensive Income (“Update 2011-05”). Update 2011-05 allows the option of presenting the total of comprehensive income, the components of net income, and the components of other comprehensive income either in a single continuous statement of comprehensive income or in two separate but consecutive statements. Additionally, Update 2011-05 requires companies to present on the face of the financial statements reclassification adjustments for items that are reclassified from other comprehensive income to net income in the statement(s) where the components of net income and the components of other comprehensive income are presented. In December 2011, Accounting Standards Update No. 2011-12, Comprehensive Income (Topic 22) Deferral of the Effective Date for Amendments to the Presentation of Reclassifications of Items Out of Comprehensive Income in Accounting Standards Update No. 2011-05, was issued. The
F-18
Table of Contents
amended guidance is effective for fiscal years, and interim periods within those years, beginning after December 15, 2011, and is applied retrospectively. Adoption of this guidance is not expected to have a material impact on the Company’s consolidated financial statements.
Accounting Standards Update No. 2011-08, Intangibles—Goodwill and Other (Topic 350)—Testing Goodwill for Impairment (“Update 2011-08”), allows entities to use a qualitative approach to test goodwill for impairment. Update 2011-08 permits an entity to first perform a qualitative assessment to determine whether it is more likely than not that the fair value of a reporting unit is less than its carrying value. If it is concluded that this is the case, it is necessary to perform the currently prescribed two-step goodwill impairment test. Otherwise, the two-step goodwill impairment test is not required. Update 2011-08 is effective for annual and interim goodwill impairment tests performed for fiscal years beginning after December 15, 2011, with early adoption permitted. Adoption of this guidance is not expected to have a material impact on the Company’s consolidated financial statements.
(5) Geographic, Segment and Significant Customer Information
The Company’s Chief Executive Officer (“CEO”) is considered to be the Company’s chief operating decision maker. The CEO reviews financial information presented on a consolidated basis for purposes of making operating decisions and assessing financial performance.
The Company has organized its operations based on a single operating segment.
The Company’s long-lived assets residing in countries other than in the United States are insignificant and thus have not been disclosed.
All of the Company’s revenues related to the ongoing intellectual property business have been from two licensees, as shown in the following table (in thousands):
| % of Total Revenue Fiscal Year Ended June 30, |
||||||||||||
| 2012 | 2011 | 2010 | ||||||||||
| Microsoft |
100 | % | — | — | ||||||||
| Mobixell Networks |
— | 100 | % | — | ||||||||
F-19
Table of Contents
(6) Balance Sheet Components
(a) Cash, cash equivalents, and investments
The following tables summarize the Company’s cash, cash equivalents and investments (in thousands):
| June 30, 2012 | ||||||||||||||||
| Amortized cost |
Unrealized gains |
Unrealized losses |
Estimated fair value |
|||||||||||||
| Cash |
$ | 721 | $ | — | $ | — | $ | 721 | ||||||||
| Money Market Funds |
37,488 | — | — | 37,488 | ||||||||||||
| Certificate of Deposit |
2,220 | — | — | 2,220 | ||||||||||||
| Commercial Paper |
7,844 | — | — | 7,844 | ||||||||||||
| U.S. Government Agencies |
6,064 | 7 | (1 | ) | 6,070 | |||||||||||
| Auction Rate Securities |
3,038 | — | (801 | ) | 2,237 | |||||||||||
| Corporate Bonds |
36,429 | 10 | (27 | ) | 36,412 | |||||||||||
|
|
|
|
|
|
|
|
|
|||||||||
| $ | 93,804 | $ | 17 | $ | (829 | ) | $ | 92,992 | ||||||||
|
|
|
|
|
|
|
|
|
|||||||||
| Included in cash and cash equivalents |
$ | 39,709 | $ | — | $ | — | $ | 39,709 | ||||||||
| Included in short-term investments |
43,863 | 17 | (20 | ) | 43,860 | |||||||||||
| Included in long-term investments |
10,232 | — | (809 | ) | 9,423 | |||||||||||
|
|
|
|
|
|
|
|
|
|||||||||
| $ | 93,804 | $ | 17 | $ | (829 | ) | $ | 92,992 | ||||||||
|
|
|
|
|
|
|
|
|
|||||||||
| June 30, 2011 | ||||||||||||||||
| Amortized cost |
Unrealized gains |
Unrealized losses |
Estimated fair value |
|||||||||||||
| Cash |
$ | 8,050 | $ | — | $ | — | $ | 8,050 | ||||||||
| Money Market Funds |
39,216 | — | — | 39,216 | ||||||||||||
| Certificate of Deposit |
480 | — | — | 480 | ||||||||||||
| Commercial Paper |
10,691 | — | — | 10,691 | ||||||||||||
| U.S. Government Agencies |
5,911 | 18 | (2 | ) | 5,927 | |||||||||||
| Auction Rate Securities |
5,237 | — | (855 | ) | 4,382 | |||||||||||
| Corporate Bonds |
28,095 | 14 | (12 | ) | 28,097 | |||||||||||
|
|
|
|
|
|
|
|
|
|||||||||
| $ | 97,680 | $ | 32 | $ | (869 | ) | $ | 96,843 | ||||||||
|
|
|
|
|
|
|
|
|
|||||||||
| Included in cash and cash equivalents |
$ | 47,266 | $ | — | $ | — | $ | 47,266 | ||||||||
| Included in short-term investments |
33,952 | 7 | (12 | ) | 33,947 | |||||||||||
| Included in long-term investments |
16,462 | 25 | (857 | ) | 15,630 | |||||||||||
|
|
|
|
|
|
|
|
|
|||||||||
| $ | 97,680 | $ | 32 | $ | (869 | ) | $ | 96,843 | ||||||||
|
|
|
|
|
|
|
|
|
|||||||||
(b) Property and equipment, net
Property and equipment consisted of the following (in thousands):
| June 30, | ||||||||
| 2012 | 2011 | |||||||
| Computer equipment and software |
$ | 18,863 | $ | 45,109 | ||||
| Furniture and equipment |
64 | 298 | ||||||
| Leasehold improvements |
2,038 | 2,038 | ||||||
|
|
|
|
|
|||||
| 20,965 | 47,445 | |||||||
| Less: accumulated depreciation |
(20,513 | ) | (45,970 | ) | ||||
|
|
|
|
|
|||||
| $ | 452 | $ | 1,475 | |||||
|
|
|
|
|
|||||
F-20
Table of Contents
Depreciation expense, including depreciation from discontinued operations, was $3.5 million, $5.2 million and $5.4 million for fiscal 2012, 2011 and 2010, respectively.
(c) Accrued Liabilities
Accrued liabilities consisted of the following (in thousands):
| June 30 | ||||||||
| 2012 | 2011 | |||||||
| Accrued employee compensation |
$ | 1,145 | $ | 1,281 | ||||
| Income taxes payable |
1,043 | 876 | ||||||
| Accrued professional fees |
4,131 | 1,315 | ||||||
| Escheat liabilities |
439 | 454 | ||||||
| Withholding taxes payable |
198 | 266 | ||||||
| Other accrued liabilities |
1,163 | 1,073 | ||||||
|
|
|
|
|
|||||
| $ | 8,119 | $ | 5,265 | |||||
|
|
|
|
|
|||||
(7) Financial Instruments
Cash and cash equivalents
Cash and cash equivalents are comprised of cash and highly liquid investments with remaining maturities of 90 days or less at the date of purchase. Cash equivalents are comprised of short-term investments with an investment rating of any two of the following: Moody’s of A-2 or higher, or by Standard & Poor’s of A1 or higher at the time of purchase. The Company is exposed to credit risk in the event of default by the financial institutions or the issuers of these investments to the extent the amounts recorded on the balance sheet are in excess of amounts that are insured by the FDIC.
Investments
The Company’s investment policy is consistent with the definition of available-for-sale securities. From time to time, the Company may sell certain securities but the objectives are generally not to generate profits on short-term differences in price. The following tables show the Company’s available-for-sale investments within investments and cash and cash equivalents in the consolidated balance sheet (in thousands):
| Expected maturity for the year ending June 30, |
Cost Value | Fair Value | ||||||||||||||||||
| 2013 | 2014 | Thereafter | June 30, 2012 Total |
June 30, 2012 Total |
||||||||||||||||
| U.S. Government Agencies |
$ | 3,297 | $ | 2,767 | $ | — | $ | 6,064 | $ | 6,070 | ||||||||||
| Certificates of Deposit |
2,220 | — | — | 2,220 | 2,220 | |||||||||||||||
| Commercial Paper |
7,844 | — | — | 7,844 | 7,844 | |||||||||||||||
| Corporate Bonds |
32,001 | 4,428 | — | 36,429 | 36,412 | |||||||||||||||
| Auction Rate Securities |
— | — | 3,038 | 3,038 | 2,237 | |||||||||||||||
|
|
|
|
|
|
|
|
|
|
|
|||||||||||
| Total |
$ | 45,362 | $ | 7,195 | $ | 3,038 | $ | 55,595 | $ | 54,783 | ||||||||||
|
|
|
|
|
|
|
|
|
|
|
|||||||||||
F-21
Table of Contents
| June 30, 2012 | ||||||||||||||||
| Amortized cost |
Unrealized gains |
Unrealized losses |
Estimated fair value |
|||||||||||||
| U.S. Government Agencies |
$ | 6,064 | $ | 7 | $ | (1 | ) | $ | 6,070 | |||||||
| Commercial Paper |
7,844 | — | — | 7,844 | ||||||||||||
| Certificates of Deposit |
2,220 | — | — | 2,220 | ||||||||||||
| Corporate Bonds |
36,429 | 10 | (27 | ) | 36,412 | |||||||||||
| Auction Rate Securities |
3,038 | — | (801 | ) | 2,237 | |||||||||||
|
|
|
|
|
|
|
|
|
|||||||||
| $ | 55,595 | $ | 17 | $ | (829 | ) | $ | 54,783 | ||||||||
|
|
|
|
|
|
|
|
|
|||||||||
Temporary and Other-Than-Temporary Impairments On Available-For-Sale Securities
As of each balance sheet date, the Company reviews its investments in an unrealized loss position for impairment in accordance with guidance issued by the FASB and the SEC in order to determine whether an impairment is temporary or other-than-temporary (“OTTI”). When an unrealized loss on a security is considered temporary, the Company records the unrealized loss in other comprehensive income (loss) and not in earnings.
An OTTI occurs when it is anticipated that the amortized cost will not be recovered for a security in an unrealized loss position. In such situations, the amount of OTTI recorded in earnings is the entire difference between the security’s amortized cost and its fair value when either: (i) the Company has the intent to sell the security; or (ii) it is more likely than not that the Company will be required to sell the security before recovery of the decline in fair value below amortized cost. If neither of these two conditions exists, only the difference between the amortized cost basis of the security and the present value of projected future cash flows expected to be collected is recognized as an OTTI charge in earnings (“credit loss”). If the fair value is less than the present value of projected future cash flows expected to be collected, this portion of OTTI relates to other-than credit factors (“noncredit loss”) and is recorded as other comprehensive income (loss) within stockholders’ equity.
In the fiscal years ended June 30, 2011 and 2010, the Company had OTTI charges in earnings of $1.1 million and $1.7 million respectively, recorded in other expense, net. There were no OTTI charges during fiscal 2012.
The following tables show the gross unrealized losses and fair value of the Company’s investments with unrealized losses, aggregated by investment category and length of time that individual securities have been in a continuous unrealized loss position (in thousands):
| As of June 30, 2012 | ||||||||||||||||||||||||
| Less Than 12 Months | 12 Months or Greater | Total | ||||||||||||||||||||||
| Fair Value |
Unrealized Loss |
Fair Value |
Unrealized Loss |
Fair Value |
Unrealized Loss |
|||||||||||||||||||
| U.S. Government Agencies |
$ | 2,765 | $ | (1 | ) | $ | — | $ | — | $ | 2,765 | $ | (1 | ) | ||||||||||
| Corporate Bonds |
30,750 | (27 | ) | — | — | 30,750 | (27 | ) | ||||||||||||||||
| Auction Rate Securities |
— | — | 2,237 | (801 | ) | 2,237 | (801 | ) | ||||||||||||||||
|
|
|
|
|
|
|
|
|
|
|
|
|
|||||||||||||
| $ | 33,515 | $ | (28 | ) | $ | 2,237 | $ | (801 | ) | $ | 35,752 | $ | (829 | ) | ||||||||||
|
|
|
|
|
|
|
|
|
|
|
|
|
|||||||||||||
As of June 30, 2012, the Company had 54 investments in an unrealized loss position.
F-22
Table of Contents
| As of June 30, 2011 | ||||||||||||||||||||||||
| Less Than 12 Months | 12 Months or Greater | Total | ||||||||||||||||||||||
| Fair Value |
Unrealized Loss |
Fair Value |
Unrealized Loss |
Fair Value |
Unrealized Loss |
|||||||||||||||||||
| U.S. Government Agencies |
$ | 2,300 | $ | (2 | ) | $ | — | $ | — | $ | 2,300 | $ | (2 | ) | ||||||||||
| Corporate Bonds |
14,096 | (12 | ) | — | — | 14,096 | (12 | ) | ||||||||||||||||
| Auction Rate Securities |
— | — | 4,382 | (855 | ) | 4,382 | (855 | ) | ||||||||||||||||
|
|
|
|
|
|
|
|
|
|
|
|
|
|||||||||||||
| $ | 16,396 | $ | (14 | ) | $ | 4,382 | $ | (855 | ) | $ | 20,778 | $ | (869 | ) | ||||||||||
|
|
|
|
|
|
|
|
|
|
|
|
|
|||||||||||||
As of June 30, 2011, the Company had 27 investments in an unrealized loss position.
The table below presents activity related to the credit loss component recognized in earnings (in thousands):
| Cumulative OTTI credit losses recognized as of July 1, 2009 |
$ | (6,125 | ) | |
| OTTI charges related to securities with previous credit losses |
(1,666 | ) | ||
| Less: OTTI charges related to securities sold |
6,360 | |||
|
|
|
|||
| Cumulative OTTI credit losses recognized as of June 30, 2010 |
(1,431 | ) | ||
| OTTI charges related to securities with previous credit losses |
(439 | ) | ||
| Less: OTTI charges related to securities sold |
1,408 | |||
|
|
|
|||
| Cumulative OTTI credit losses recognized as of June 30, 2011 |
(462 | ) | ||
| OTTI charges related to securities with previous credit losses |
— | |||
| Less: OTTI charges related to securities sold |
— | |||
|
|
|
|||
| Cumulative OTTI credit losses recognized as of June 30, 2012 |
$ | (462 | ) | |
|
|
|
All OTTI’s recognized in earnings in the fiscal years ended June 30, 2011 and 2010 were for securities with previously recognized credit impairments. During the fiscal year ended June 30, 2012 there were no OTTI charges in earnings.
In March 2011, the Company had the intent to sell one ARS investment and in April 2011, two of the ARS were sold. The sale of one of these ARS resulted in proceeds of $2.5 million in the fourth quarter of fiscal 2011 and recognition of an OTTI charge of $0.4 million in the third quarter of fiscal 2011 for the ARS classified as “intent to sell” due to the Company’s discussions with the buyer of that ARS as of March 31, 2011. Proceeds of $2.3 million and an OTTI charge of $0.6 million was recognized in the fourth quarter of fiscal 2011 for the ARS not classified as “intent to sell” as of March 31, 2011.
There was a realized gain of $0.3 million recorded during the fiscal year ended June 30, 2011 from the sales of two available-for-sale securities. Realized gains and losses are included in other income (expense), net in the consolidated statement of operations.
The redemption of an enhanced cash money market fund resulted in proceeds of $1.4 million and the recognition of realized gains of $0.1 million in the first quarter of fiscal 2010.
In December 2009, one of the ARS was tendered. The tender of this ARS resulted in proceeds of $2.3 million and recognition of realized loss of $0.4 million in the second quarter of fiscal 2010.
In December 2009, the Company determined it had the intent to sell three ARS, and as such recorded an OTTI charge of $0.2 million in the second quarter of fiscal 2010. In January 2010, the three ARS’s were sold resulting in proceeds of $2.4 million and a realized loss of $0.2 million in the third quarter of fiscal 2010. The Company sold an additional ARS in January 2010 for proceeds of $0.6 million and recognition of a realized loss of $0.2 million.
F-23
Table of Contents
Fair Value Measurement
The FASB has established a consistent framework for measuring fair value on either a recurring or nonrecurring basis whereby inputs, used in valuation techniques, are assigned a hierarchical level. The following are the hierarchical levels of inputs to measure fair value:
| • | Level 1: Observable inputs that reflect quoted prices (unadjusted) for identical assets or liabilities in active markets. |
| • | Level 2: Inputs reflect quoted prices for identical assets or liabilities in markets that are not active; quoted prices for similar assets or liabilities in active markets; inputs other than quoted prices that are observable for the assets or liabilities; or inputs that are derived principally from or corroborated by observable market data by correlation or other means. |
| • | Level 3: Unobservable inputs reflecting the Company’s own assumptions incorporated in valuation techniques used to determine fair value. These assumptions are required to be consistent with market participant assumptions that are reasonably available. |
The carrying value of the Company’s cash and cash equivalents approximates their fair value and is based on Level 1 inputs. The carrying value of the Company’s accounts payable, accrued liabilities and restructuring liabilities approximates their fair value due to the short-term nature of these instruments and is based on Level 2 inputs. The Company recognizes transfers between levels of the hierarchy based on the fair values of the respective financial instruments at the end of the reporting period in which the transfer occurred. There were no transfers between levels of the fair value hierarchy during the fiscal year ended June 30, 2012.
The following tables summarize the Company’s financial assets and liabilities measured at fair value on a recurring basis, by level within the fair value hierarchy:
| Fair value of securities as of June 30, 2011 | ||||||||||||||||
| Quoted Prices in Active Markets for Identical Assets (Level 1) |
Significant Other Observable Inputs (Level 2) |
Significant Unobservable Inputs (Level 3) |
Total | |||||||||||||
| Assets | ||||||||||||||||
| Cash and cash equivalents: |
||||||||||||||||
| Money Market Funds |
$ | 37,488 | $ | — | $ | — | $ | 37,488 | ||||||||
| Commercial Paper |
1,500 | — | — | 1,500 | ||||||||||||
| Short-term investments: |
||||||||||||||||
| Certificates of Deposit |
2,220 | — | — | 2,220 | ||||||||||||
| Commercial Paper |
6,344 | — | — | 6,344 | ||||||||||||
| Corporate Bonds |
31,991 | — | — | 31,991 | ||||||||||||
| U.S. Government Agencies |
3,305 | — | — | 3,305 | ||||||||||||
| Long-term investments: |
||||||||||||||||
| Corporate Bonds |
4,421 | — | — | 4,421 | ||||||||||||
| U.S. Government Agencies |
2,765 | — | — | 2,765 | ||||||||||||
| Auction Rate Securities |
— | — | 2,237 | 2,237 | ||||||||||||
|
|
|
|
|
|
|
|
|
|||||||||
| Total Assets |
$ | 90,034 | $ | — | $ | 2,237 | $ | 92,271 | ||||||||
|
|
|
|
|
|
|
|
|
|||||||||
F-24
Table of Contents
| Fair value of securities as of June 30, 2011 | ||||||||||||||||
| Quoted Prices in Active Markets for Identical Assets (Level 1) |
Significant Other Observable Inputs (Level 2) |
Significant Unobservable Inputs (Level 3) |
Total | |||||||||||||
| Assets | ||||||||||||||||
| Cash and cash equivalents: |
||||||||||||||||
| Money Market Funds |
$ | 39,216 | $ | — | $ | — | $ | 39,216 | ||||||||
| Short-term investments: |
||||||||||||||||
| Certificates of Deposit |
240 | — | — | 240 | ||||||||||||
| U.S. Government Agencies |
2,414 | — | — | 2,414 | ||||||||||||
| Corporate Bonds |
20,602 | — | — | 20,602 | ||||||||||||
| Commercial Paper |
10,691 | — | — | 10,691 | ||||||||||||
| Long-term investments: |
||||||||||||||||
| U.S. Government Agencies |
3,513 | — | — | 3,513 | ||||||||||||
| Corporate Bonds |
7,495 | — | — | 7,495 | ||||||||||||
| Certificates of Deposit |
240 | — | — | 240 | ||||||||||||
| Auction Rate Securities |
— | — | 4,382 | 4,382 | ||||||||||||
|
|
|
|
|
|
|
|
|
|||||||||
| Total Assets |
$ | 84,411 | $ | — | $ | 4,382 | $ | 88,793 | ||||||||
|
|
|
|
|
|
|
|
|
|||||||||
| Liabilities | ||||||||||||||||
| Foreign Currency Derivatives |
$ | 115 | $ | — | $ | — | $ | 115 | ||||||||
|
|
|
|
|
|
|
|
|
|||||||||
| Total Liabilities |
$ | 115 | $ | — | $ | — | $ | 115 | ||||||||
|
|
|
|
|
|
|
|
|
|||||||||
Auction Rate Securities
As of June 30, 2012, a $2.2 million auction rate security, recorded in long-term investments on the consolidated balance sheet, was considered illiquid based upon a lack of auction results beginning in fiscal 2008. The Company estimated the fair value of this ARS based on (1) financial standing of the issuer; (2) size of position held and the liquidity of the market; (3) contractual restrictions on disposition; (4) pending public offering with respect to the financial instrument; (5) pending reorganization activity affecting the financial instrument; (6) reported prices and the extent of the public trading in similar financial instruments of the issuer or comparable companies; (7) ability of the issuer to obtain required financing; (8) changes in the economic conditions affecting the issuer; (9) a recent purchase of the sale of a security of the issuer; (10) pricing by other dealers in similar securities; (11) financial statements of any underlying ARS portfolio investments; (12) successful auction/early redemption; (13) failing auctions until maturity; or (14) default and the estimated cash flows for each scenario. Other factors were considered, such as interest rate effects, liquidity, trinomial probabilities, recovery rates, value of the investments held by the issuer and the financial condition and credit ratings of the issuer, insurers, and parent companies, as applicable.
Assumptions of probabilities of default, probabilities of passing auction, and probabilities of earning the maximum rate for each period are based upon the risks, the underlying investments collateralizing the ARS, the maturity date of the ARS, the maximum rate of the ARS and current market conditions, and third party professional judgment.
The ARS is “Triple X” structured obligations of special purpose reinsurance entities associated with life insurance companies. On May 3, 2012, the ARS related to federal education student loans programs was bought back by the investment broker at par value of $2.2 million. As of June 30, 2012, the ARS instrument remaining was rated BBB by Standard and Poor’s and all of the $3.5 million par value of this illiquid investments is insured against defaults of principal and interest by third party insurance companies.
F-25
Table of Contents
The following table represents the reconciliation of the beginning and ending balances of the Company’s ARS measured at fair value on a recurring basis using significant unobservable inputs (Level 3) during the fiscal year ended June 30, 2012 (in thousands):
| Fair Value Measurements Using Significant (Level 3) ARS |
||||
| Balance at June 30, 2009 |
$ | 14,044 | ||
| Change in unrealized losses included in other comprehensive income |
2,226 | |||
| Other-than-temporary impairment |
(1,666 | ) | ||
| Sale of ARS |
(5,325 | ) | ||
|
|
|
|||
| Balance at June 30, 2010 |
9,279 | |||
| Change in unrealized losses included in other comprehensive income |
921 | |||
| Other-than-temporary impairment |
(1,071 | ) | ||
| Sale of ARS |
(4,747 | ) | ||
|
|
|
|||
| Balance at June 30, 2011 |
4,382 | |||
| Change in unrealized losses included in other comprehensive income |
55 | |||
| Sale of ARS |
(2,200 | ) | ||
|
|
|
|||
| Balance at June 30, 2012 |
$ | 2,237 | ||
|
|
|
|||
(8) Borrowings
Credit Agreement
On January 23, 2009, the Company and Silicon Valley Bank entered into a secured revolving credit facility for up to $40.0 million. On January 20, 2010, the Company entered into two amendments to the $40.0 million revolving credit facility with Silicon Valley Bank to modify the definition of EBITDA. Additionally, on April 14, 2010, the Company entered into another amendment to the $40.0 million revolving credit facility with Silicon Valley Bank to extend the maturity date to January 23, 2012, as well as to modify the commitment fee and several definitions, including EBITDA, Borrowing Base, and Investments. The Company entered into a Waiver and Amendment on April 26, 2011 to modify the EBITDA covenant minimum levels. The Company entered into an Amendment on September 6, 2011 to modify several definitions including the Borrowing Base. On January 23, 2012, the Company entered into an Amendment to extend the maturity of the secured revolving credit facility to February 28, 2012, reduce the amount of the line of credit facility from $40.0 million to $25.0 million, and lower the Borrowing Base from a starting point of $20.0 million to $15.0 million plus eligible accounts receivable. On January 20, 2012, the Company received a consent from Silicon Valley Bank to sell the Location product business. On February 24, 2012, the Company entered into an Amendment to extend the maturity of the secured revolving credit facility to March 29, 2012. On March 29, 2012, the Company entered into an Amendment to extend the maturity to April 28, 2012 and set the EBITDA covenant minimum level for March 31, 2012. On April 12, 2012, the Company entered into an Amendment to extend the maturity of the secured revolving credit facility to April 28, 2013 and set minimum EBITDA levels. On April 30, 2012, the Company received a consent from Silicon Valley Bank to sell the mediation and messaging product businesses. On May 4, 2012, the Company entered into an amendment to reduce the amount of the line of credit from $25.0 million to $18.0 million, delete the Borrowing Base requirement, delete the minimum EBITDA covenant, delete the fee on undrawn amounts, and modify the Liquidity Coverage Ratio definition.
The Company may borrow, repay and re-borrow under the revolving credit facility at any time up to the maturity date. As of June 30, 2012, the revolving credit facility bears interest at 4% per annum. For each letter of credit issued,
F-26
Table of Contents
the Company is required to pay 0.75% per annum on the face amount of the letter of credit. Annually, the Company is required to pay a commitment fee to the lender. In January 2010, the Company paid a $0.2 million commitment fee to the lender. In January 2011, the Company paid a $0.1 million commitment fee to the lender. In April 2012, the Company paid a $75 thousand commitment fee to the lender.
As of June 30, 2012, the Company had letters of credit outstanding against the revolving credit facility totaling $17.5 million, reducing the available borrowings on the revolving credit facility.
The revolving credit line is secured by a blanket lien on all of the Company’s assets and contains certain financial and reporting covenants customary to these types of credit facilities agreements which the Company is required to satisfy as a condition of the agreement. In particular, the revolving credit facility requires that the Company meet certain minimum monthly liquidity ratios. In addition, the revolving credit facility requires the Company to provide to the bank annual financial projections, promptly report any material legal actions, and timely pay material taxes and file all required tax returns and reports. Further, without the bank’s consent, the Company cannot take certain material actions, such as change any material line of business, sell the Company’s business, acquire other entities, incur liens, make capital expenditures beyond a certain threshold, or engage in transactions with affiliates. As of June 30, 2012, the Company was in compliance with all debt covenants.
(9) Commitments and Contingencies
(a) Leases
On February 28, 2005, the Company entered into a sublease agreement (the “Sublease Agreement”) with Informatica Corporation (“Informatica”) to lease office space in the building known as 2100 Seaport Boulevard (Floors 1-4) in Redwood City, California. The Sublease Agreement covers approximately 144,000 square feet (collectively, the “Premises”). The Premises serve as the Company’s corporate headquarters and the Company vacated its previous corporate headquarters located at 1400 Seaport Boulevard, Redwood City, California as of June 1, 2005.
The terms of the Sublease Agreement began on May 1, 2005 and end on April 30, 2013. The Sublease Agreement is a triple-net sublease. The average base rent for the remaining term of the lease shall be approximately $1.6 million per year. The rent obligations are being expensed on a straight-line basis, over the term of the lease beginning upon the date the premises became available for entry in February 2005.
The Company also has numerous facility operating leases at other locations in the United States and other countries. Future minimum lease payments under all non-cancelable operating leases with terms in excess of one year and future contractual sublease income were as follows at June 30, 2012 (in thousands):
| Year Ending June 30, |
Future Lease Payments |
Future Contractual Sublease Income |
Net Future Lease Payments |
|||||||||
| 2013 |
$ | 16,567 | $ | (3,613 | ) | $ | 12,954 | |||||
| 2014 |
1,336 | (728 | ) | 608 | ||||||||
| 2015 |
450 | (240 | ) | 210 | ||||||||
|
|
|
|
|
|
|
|||||||
| Total |
$ | 18,353 | $ | (4,581 | ) | $ | 13,772 | |||||
|
|
|
|
|
|
|
|||||||
Rent expense for fiscal 2012, 2011 and 2010, was approximately $3.3 million, $4.5 million and $5.0 million, respectively, net of sublease income of $1.5 million, $1.3 million and $1.2 million for fiscal 2012, 2011 and 2010,
F-27
Table of Contents
respectively. Net future lease payments include $13.7 million of accrued restructuring-related lease obligations (see Note 11 “Restructuring and Related Costs”).
(b) Litigation
Simmonds v. Credit Suisse Group, et al
On October 3, 2007, Vanessa Simmonds, a purported stockholder of the Company, filed suit in the U.S. District Court for the Western District of Washington (“Western District Court”) against Credit Suisse Group, Bank of America Corporation, and JPMorgan Chase & Co., the lead underwriters of the Company’s initial public offering in June 1999, alleging violations of Section 16(b) of the Exchange Act, 15 U.S.C. § 78p(b). The complaint seeks to recover from the lead underwriters any “short-swing profits” obtained by them in violation of Section 16(b). The suit names the Company as a nominal defendant, contains no claims against the Company, and seeks no relief from the Company. Simmonds filed an Amended Complaint on February 25, 2008 (the “Amended Complaint”), naming as defendants Credit Suisse Securities (USA), Robertson Stephens, Inc., J.P. Morgan Securities, Inc., and again naming Bank of America Corporation. The Amended Complaint asserts substantially similar claims as those set forth in the initial complaint.
On March 12, 2009, the Western District Court entered its judgment in the case and granted the moving issuers’ motion to dismiss, finding plaintiff’s demand letters were insufficient to put the issuers on notice of the claims asserted against them. The Western District Court also granted the underwriters’ motion to dismiss as to the claims arising from the non-moving issuers’ IPOs, finding plaintiff’s claims were time-barred under the applicable statute of limitations.
Following an appeal to the United States Court of Appeals for the Ninth Circuit (the “Ninth Circuit”), on December 2, 2010, the Ninth Circuit affirmed the Western District Court’s decision to dismiss the moving issuers’ cases on the grounds that plaintiff’s demand letters were insufficient to put the issuers on notice of the claims asserted against them and further ordered that the dismissals be made with prejudice. The Ninth Circuit, however, reversed and remanded the Western District Court’s decision on the underwriters’ motion to dismiss as to the claims arising from the non-moving issuers’ IPOs, finding plaintiff’s claims were not time-barred under the applicable statute of limitations. In remanding, the Ninth Circuit advised the non-moving issuers and underwriters to file in the Western District Court the same challenges to plaintiff’s demand letters that moving issuers had filed.
On January 18, 2011, the Ninth Circuit denied all petitions for rehearing and petitions for rehearing en banc. On January 25, 2011, the Ninth Circuit granted the underwriters’ motion to stay the issuance of mandate and ordered that the mandate in the cases involving the non-moving issuers is stayed for ninety days pending the filing of a petition for writ of certiorari in the United States Supreme Court. On January 26, 2011, the Ninth Circuit granted the appellant’s motion and ruled that the mandate in all cases is stayed for ninety days pending the appellant’s filing of a petition for writ of certiorari in the United States Supreme Court. On April 5, 2011, the plaintiff filed a Petition for Writ of Certiorari with the United States Supreme Court seeking reversal of the Ninth Circuit’s December 2, 2010 decision. On April 15, 2011, underwriter defendants filed a Petition for Writ of Certiorari with the United States Supreme Court seeking reversal of the Ninth Circuit’s December 2, 2010 decision relating to the statute of limitations issue.
On June 27, 2011, the United States Supreme Court denied Simmonds’ petition regarding the demand issue and granted the underwriters’ position relating to the statute of limitations issue. Oral argument in that case was held on
F-28
Table of Contents
November 29, 2011. On March 26, 2012, the Supreme Court vacated the Ninth Circuit’s holding that petitioner’s claims were not time barred, and remanded the cases to the District Court for proceedings consistent with the Supreme Court’s opinions.
On June 7, 2012, the mandate of the Ninth Circuit was formally entered. On June 11, 2012, Plaintiffs voluntarily dismissed the case with prejudice as to the adequacy-of-the-pre-suit demand issue, and without prejudice as to all other issues.
No amount has been accrued as of June 30, 2012, as a loss is not considered probable or reasonably estimable.
In the Matter of Certain Devices of Mobile Communication
On August 31, 2011, the Company filed a complaint with the International Trade Commission (“ITC”) in Washington, DC, with Apple Inc. (“Apple”), Research In Motion Ltd. and Research In Motion Corp. as proposed respondents, requesting that the ITC bar Apple and the Research In Motion entities (“RIM”) from importing into the United States their products, including smart devices and tablet computers, that infringe certain of the Company’s patents. The complaint alleges that Apple and RIM infringe upon four of the Company’s patents that cover technology that, among other things, give consumers access to the Internet from their mobile devices. The ITC matter is currently scheduled for substantive hearing commencing October 15, 2012, though dates in a legal proceeding are always subject to change at the discretion of the presiding judge.
Openwave Systems Inc. v. Apple Inc., Research in Motion Ltd, and Research in Motion Corp.
On August 31, 2011, the Company filed a complaint in the Federal District Court for the District of Delaware against Apple and RIM, again alleging that Apple and RIM products infringe certain of the Company’s patents, seeking among other things a declaration that the Company’s patents cited in the complaint have been infringed by Apple and RIM and that these patents are valid and enforceable, damages as a result of the infringement, and an injunction against further infringement. This matter is stayed pending October 15, 2012.
From time to time, the Company may be involved in litigation or other legal proceedings, including those noted above, relating to or arising out of its day-to-day operations or otherwise. Litigation is inherently uncertain, and the Company could experience unfavorable rulings. Should the Company experience an unfavorable ruling, there exists the possibility of a material adverse impact on its financial condition, results of operations, cash flows or on its business for the period in which the ruling occurs and/or in future periods.
Indemnification claims
Prior to the sale of the Company’s product businesses, the Company’s software license and services agreements generally included a limited indemnification provision for claims from third parties relating to its intellectual property. In connection with the sale of the Company’s product businesses, the Company retains certain ongoing liabilities with respect to indemnification claims related to its former customers that were initiated prior to the sale of the Location business line and the Messaging and Mediation product businesses. As of June 30, 2012, no amount is accrued for indemnifications as there were no existing claims where a loss is considered probable. Historically, costs related to these indemnification provisions have been infrequent and the Company is unable to estimate the maximum potential impact of these indemnification provisions on its future results of operations.
Three licensees of the Company are seeking indemnification from the Company under their respective license agreements in connection with being named as defendants in two matters pending in the United States District Court
F-29
Table of Contents
for the Eastern District of Texas captioned Unified Messaging Solutions, Inc. v. Google, et al. (Civil Action No. 6:11cv00464) and Unified Messaging Solutions, Inc. v. Facebook, et al. (Civil Action No. 6:11cv00120 (the “Actions”). Plaintiff in the Actions alleges that the licensees’ web-based communication services infringe patents allegedly owned by the plaintiff and the licensees claim that their web-based services are comprised of products licensed from the Company. The Company has assumed the defense on behalf of two of the licensees. With respect to the third, the licensee is conducting its own defense and has requested that the Company indemnify it for one-third of its defense costs and any damages awarded.
As of June 30, 2012, no amount is accrued for indemnifications as there were no existing claims where a loss is considered probable. Historically, costs related to these indemnification provisions have been infrequent and the Company is unable to estimate the maximum potential impact of these indemnification provisions on its future results of operations.
Purchase price adjustments
On April 16, 2012, the Company announced an agreement had been reached to sell its mediation and messaging businesses. On April 30, 2012, the Company completed the sale of the mediation and messaging businesses to Openwave Mobility, a portfolio company of Marlin Equity Partners. These sales complete the divestiture of Unwired Planet’s product business. Openwave Mobility paid $49.6 million in cash, subject to certain adjustments thereto as provided in the Asset Purchase and Sale Agreement, upon the closing of the transaction. As of June 30, 2012, the Company has estimated and recorded a liability related to working capital adjustments of $1.3 million. The purchase price is subject to an additional potential liability up to $1.3 million, related to working capital adjustments , which are currently in dispute with Openwave Mobility. Additional purchase price adjustments, if any, will be reflected as gain/(loss) on sale of discontinued operation in the period determined.
(10) Stockholders’ Equity
(a) Tax Benefits Preservation Agreement
On January 28, 2012, the Company entered into a Tax Benefits Preservation Agreement that entitles each holder of the Company’s common stock to purchase one ten-thousandth of a share of Series A Junior Participating Cumulative Preferred Stock at a price of $15 per one ten-thousandth of a share, subject to adjustment, upon the occurrence of certain requirements.
(b) Stock Plans
On October 16, 2005, the Company’s 1995 Plan (formerly the Software.com, Inc. 1995 Stock Option Plan) (the “1995 Stock Plan”) expired, and, accordingly, options can no longer be granted from the 1995 Stock Plan. A total of 17,743,215 shares of common stock had previously been authorized for issuance under the 1995 Stock Plan. As of June 30, 2012, options to purchase a total of 357,093 shares were outstanding under the 1995 Stock Plan.
On September 25, 2006, the Company’s 1996 Stock Plan (formerly the Phone.com, Inc. 1996 Stock Plan) (the “1996 Stock Plan”) expired and, accordingly, options can no longer be granted from the 1996 Stock Plan. A total of 12,262,282 shares of common stock had previously been authorized for issuance under the 1996 Stock Plan. As of June 30, 2012, options to purchase a total of 371,281 shares were outstanding under the 1996 Stock Plan.
The Openwave Systems Inc. Amended and Restated 1999 Directors’ Equity Compensation Plan (the “Directors’ Stock Plan”) which was approved by the stockholders at the Company’s annual meeting held on December 3, 2009, provides
F-30
Table of Contents
for the grant of non-statutory stock options to non-employee directors (“Outside Directors”). Under the Directors’ Stock Plan, a total of 1,650,000 shares of the Company’s common stock have been reserved for issuance. Options and awards granted to new or existing Outside Directors under the Directors’ Stock Plan vest ratably over a period of three years. The Directors’ Stock Plan also provides for the acceleration of options upon the dismissal of an Outside Director from the Board upon or within 24 months following a change in control of the Company. The exercise price of options granted under the Directors’ Stock Plan is equal to the fair market value of the Company’s common stock on the date of grant. The exercise price of nonvested shares granted under the Directors’ Stock Plan is $0.00. Under the Directors’ Stock Plan, stock option grants have a term of ten years. As of June 30, 2012, the Company had a total of 167,211 shares of common stock available for grant, and options for a total of 900,122 shares were outstanding under the Directors’ Stock Plan.
The Openwave Systems Inc. 2001 Stock Compensation Plan (“2001 Stock Plan”) provides for the issuance of non-statutory stock options, nonvested stock bonus awards and nonvested stock purchase awards to directors, employees and consultants of the Company. The 2001 Stock Plan serves as the successor to certain plans of the Company and plans acquired by the Company. No further grants will be made under the predecessor plans; however, each outstanding option granted under a predecessor plan shall continue to be governed by the terms and conditions of the predecessor plan under which it was granted. A total of 4,068,128 shares of common stock have been reserved for issuance under the 2001 Stock Plan. Under the 2001 Stock Plan, the exercise price for non-statutory options is determined by the plan administrator and may be above or below the fair market value of the Company’s common stock on the date of grant. Options issued under the 2001 Stock Plan generally expire ten years from the date of grant. Vesting periods are determined by the plan administrator and generally provide for shares to vest ratably over a period of three to four years, with options for new employees generally including a one-year cliff period. As of June 30, 2012, the Company had a total of 281,257 shares of common stock available for grant, and a total of 343,694 shares outstanding under the 2001 Stock Plan.
The Openwave Systems Inc. Amended and Restated 2006 Stock Incentive Plan, as amended (“2006 Stock Plan”), which was approved by the stockholders at the Company’s annual meeting held on December 4, 2008, provides incentive stock options, non-statutory stock options, restricted stock purchase rights and stock appreciation rights to employees and consultants of the company and its affiliates. The plan also provides restricted stock bonus, phantom stock units, restricted stock units, performance shares bonus and performance share units (“Full-Value Stock Award”). A total of 17,000,000 shares of common stock have been reserved for issuance under the 2006 Stock Plan. Each share of common stock issued pursuant to a stock award issued under this Plan shall reduce the Share Reserve by one (1) share; provided, however that for each Full-Value Stock Award, the share reserve shall be reduced by one and one-half (1.5) shares. The exercise price of options granted under the 2006 Stock Plan is usually equal to the fair market value of the Company’s common stock on the date of grant. The exercise price of nonvested shares granted under the 2006 Stock Plan is $0.00. Options issued under the 2006 Stock Plan generally expire ten years from the date of grant. Vesting periods are determined by the plan administrator and generally provide for shares to vest ratably over a period of three to four years, with options for new employees generally including a one-year cliff period. As of June 30, 2012, the Company had a total of 5,165,797 shares of common stock available for grant, and awards for a total of 6,329,940 shares were outstanding under the 2006 Stock Plan.
F-31
Table of Contents
The following table summarizes the number of common shares available for issuance under the plans discussed above as of June 30, 2012:
| June 30, 2012 |
||||
| 1995 and 1996 Stock Plans |
— | |||
| 2001 Stock Plan |
281,257 | |||
| Directors’ Stock Plan |
167,211 | |||
| 2006 Stock Plan |
5,165,797 | |||
|
|
|
|||
| 5,614,265 | ||||
|
|
|
|||
(c) Stock Purchase Rights
Certain outstanding stock purchase rights are subject to a restricted stock purchase agreement whereby the Company has the right to repurchase the stock upon the voluntary or involuntary termination of the purchaser’s employment with the Company at the purchaser’s purchase price. The Company’s repurchase right lapses at a rate determined by the stock plan administrator but at a minimum rate of 20% per year. Through June 30, 2012, the Company has issued 6,377,402 shares under restricted stock purchase agreements, of which 470,892 shares have been repurchased and 180,000 shares remain subject to repurchase at a weighted-average purchase price of $0.00 per share.
(d) Employee Stock Purchase Plans
In January 2007, the Company reinstated and amended the Openwave Systems Inc. 1999 Employee Stock Purchase Plan (“ESPP”) which was suspended in October 2002.
The ESPP provides for an automatic annual increase of authorized shares (“Evergreen shares”) on the first day of fiscal 2005 through 2009, equal to the lesser of 268,417 shares or 1% of the shares outstanding on the last day of the immediately preceding fiscal year. As of June 30, 2012, the ESPP had 4,810,959 shares authorized. Of these shares, 1,259,775 shares are currently available for issuance.
During fiscal 2012, 2011 and 2010, 84,740, 229,638 and 242,792 shares, respectively, were purchased by employees under the ESPP.
The ESPP is intended to qualify under Section 423 of the Internal Revenue Code and contains one six-month purchase period within a six month offering period. Eligible employees may purchase common stock through payroll deductions of up to 20% of compensation. The price of common stock purchased under the ESPP is the lower of 85% of the fair market value of the Company’s common stock at the beginning of the six month offering period and the end of the purchase period.
The fair value used in recording the stock-based compensation expense, on a straight-line basis, associated with the ESPP is estimated for each offering period using the Black-Scholes-Merton option pricing model that uses the assumptions noted in the following table. Expected volatilities are based on the historical volatility of the Company’s common stock over the six months. The expected term is six months, coinciding with the offering period. The risk-free rate for the expected term of the option is based on the U.S. Treasury yield curve in effect at the time of grant.
F-32
Table of Contents
| Fiscal Year ended June 30, | ||||||||||||
| 2012 | 2011 | 2010 | ||||||||||
| Expected volatility |
52.7 - 92.0 | % | 47.1 - 53.1 | % | 54.7 - 62.5 | % | ||||||
| Expected dividends |
— | — | — | |||||||||
| Expected term (in years) |
0.5 | 0.5 | 0.5 | |||||||||
| Risk-free rate |
0.1 | % | 0.1 - 0.2 | % | 0.2 | % | ||||||
(e) Stock-based compensation
The fair value of each option grant is estimated on the date of grant using the Black-Scholes-Merton option pricing model and assumptions noted in the following table. The Company estimated the expected volatility as an input into the Black-Scholes-Merton valuation formula when assessing the fair value of options granted. The Company’s estimate of volatility was based upon the historical volatility experienced in its stock price, as well as implied volatility in the market traded options on the Unwired Planet, Inc.’s common stock when appropriate. During fiscal 2012, 2011 and 2010 implied volatility was not utilized in the Company’s valuation of options granted due to the lack of option contracts with a strike price similar to our stock option grants. To the extent volatility of its stock price increases in the future, the Company’s estimates of the fair value of options granted in the future could increase, thereby increasing stock-based compensation expense in future periods. The Company’s expected term of options granted is derived from actual post-vesting option cancellation and exercise experience, as well as the average midpoint between vesting and the contractual term for outstanding options.
The weighted average assumptions used were as follows for fiscal 2012, 2011 and 2010:
| Fiscal Year ended June 30, | ||||||||||||
| 2012 | 2011 | 2010 | ||||||||||
| Expected volatility |
72.2 - 78.5 | % | 60.6 - 71.1 | % | 65.8 - 77.2 | % | ||||||
| Expected dividends |
— | — | — | |||||||||
| Expected term (in years) |
3.60 - 6.07 | 3.32 - 6.16 | 3.11 - 6.01 | |||||||||
| Risk-free rate |
0.6 - 1.2 | % | 0.9 - 1.8 | % | 1.4 - 2.6 | % | ||||||
The Company determines the fair value of nonvested shares based on the NASDAQ closing stock price on the date of grant.
F-33
Table of Contents
A summary of option activity through June 30, 2012 is presented below (in thousands except per share amounts):
| Options |
Shares | Weighted Average Exercise Price |
Weighted Average Remaining Contractual Term (years) |
Aggregate Intrinsic Value |
||||||||||||
| Outstanding at June 30, 2009 |
8,414 | $ | 3.91 | |||||||||||||
| Options granted |
1,727 | 2.46 | ||||||||||||||
| Exercised |
(405 | ) | 1.50 | |||||||||||||
| Forfeited, canceled or expired |
(908 | ) | 6.13 | |||||||||||||
|
|
|
|
|
|||||||||||||
| Outstanding at June 30, 2010 |
8,828 | $ | 3.51 | |||||||||||||
| Options granted |
4,060 | 2.08 | ||||||||||||||
| Exercised |
(1,111 | ) | 1.46 | |||||||||||||
| Forfeited, canceled or expired |
(1,888 | ) | 3.21 | |||||||||||||
|
|
|
|
|
|||||||||||||
| Outstanding at June 30, 2011 |
9,889 | $ | 3.21 | |||||||||||||
| Options granted |
7,277 | 1.15 | ||||||||||||||
| Exercised |
(3,958 | ) | 0.61 | |||||||||||||
| Forfeited, canceled or expired |
(4,906 | ) | 2.50 | |||||||||||||
|
|
|
|
|
|||||||||||||
| Outstanding at June 30, 2012 |
8,302 | $ | 3.06 | 3.74 | $ | 3,927 | ||||||||||
|
|
|
|
|
|
|
|
|
|||||||||
| Vested and Expected to Vest at June 30, 2012 |
7,642 | $ | 3.19 | 3.33 | $ | 3,439 | ||||||||||
|
|
|
|
|
|
|
|
|
|||||||||
| Exercisable at June 30, 2012 |
5,715 | $ | 3.73 | 1.67 | $ | 2,033 | ||||||||||
|
|
|
|
|
|
|
|
|
|||||||||
The weighted average grant date fair value of options granted during fiscal 2012, 2011 and 2010 was $1.38, $0.90 and $1.32. The total intrinsic value of options exercised during fiscal 2012, 2011 and 2010 was $1.7 million, $0.8 million and $0.4 million. Upon the exercise of options, the Company issues new common stock from its authorized shares.
A summary of the activity of the Company’s nonvested shares through June 30, 2012 is presented below (in thousands except per share amounts):
| Nonvested Shares |
Shares | Grant Date Fair Value Per Share |
||||||
| Nonvested at June 30, 2009 |
196 | $ | 2.04 | |||||
| Nonvested shares granted |
108 | 2.29 | ||||||
| Vested |
(82 | ) | 2.52 | |||||
| Forfeited |
— | 0.00 | ||||||
|
|
|
|
|
|||||
| Nonvested at June 30, 2010 |
222 | $ | 1.98 | |||||
| Nonvested shares granted |
108 | 2.37 | ||||||
| Vested |
(110 | ) | 2.14 | |||||
| Forfeited |
(23 | ) | 2.07 | |||||
|
|
|
|
|
|||||
| Nonvested at June 30, 2011 |
197 | $ | 2.07 | |||||
| Nonvested shares granted |
151 | 1.67 | ||||||
| Vested |
(168 | ) | 1.86 | |||||
| Forfeited |
— | — | ||||||
|
|
|
|
|
|||||
| Nonvested at June 30, 2012 |
180 | $ | 1.93 | |||||
|
|
|
|
|
|||||
F-34
Table of Contents
The total fair value of shares vested, including discontinued operations, during fiscal 2012 and 2011 was $0.3 million and $0.2 million, respectively.
As of June 30, 2012, there was $2.3 million of total unrecognized compensation cost, which includes amounts related to employees providing transitional services that will be included in discontinued operations, related to all unvested share awards and options. That cost is expected to be recognized on a declining basis as the shares vest over the next four years.
The impact on the Company’s results of operations of recording stock-based compensation for fiscal 2012, 2011 and 2010 is as follows (in thousands):
| Years Ended June 30, | ||||||||||||
| 2012 | 2011 | 2010 | ||||||||||
| Stock-based compensation by category: |
||||||||||||
| Sales and marketing expense |
$ | 15 | $ | — | $ | — | ||||||
| Patent initiative expense |
43 | — | — | |||||||||
| General and administrative |
1,774 | 402 | 415 | |||||||||
| Discontinued operations |
6,573 | 2,081 | 1,599 | |||||||||
|
|
|
|
|
|
|
|||||||
| $ | 8,405 | $ | 2,483 | $ | 2,014 | |||||||
|
|
|
|
|
|
|
|||||||
(11) Restructuring and Related Costs
As a result of the Company’s change in strategy and its desire to improve its cost structure, the Company has announced several restructurings. These restructurings include the fiscal 2012 restructuring (FY2012 Restructuring), fiscal 2010 restructuring (FY2010 Restructuring), fiscal 2009 restructuring (FY2009 Restructuring), fiscal 2008 restructuring (FY2008 Restructuring), fiscal 2007 fourth quarter restructuring (FY2007 Q4 Restructuring), the fiscal 2007 first quarter restructuring (FY2007 Restructuring), as well as restructuring plans initiated in prior years.
F-35
Table of Contents
The following tables set forth the restructuring activity through June 30, 2012 (in thousands):
| FY 02 to FY
09 Restructuring Plans |
FY 10 Restructuring Plans |
FY 11 Restructuring Plan |
FY 12 Restructuring Plan |
Total | ||||||||||||||||||||||||||||||||
| Facility (3) | Severance (2) | Facility (3) | Severance (2) | Severance (2) | Facility (3) | Severance (2) | Severance (3) | Accrual | ||||||||||||||||||||||||||||
| Accrual balances as of June 30, 2009 |
$ | 48,568 | $ | 1,602 | $ | — | $ | — | $ | — | $ | — | $— | $ | — | $ | 50,170 | |||||||||||||||||||
| Activity for fiscal 2010: |
||||||||||||||||||||||||||||||||||||
| New charges and adjustments to estimates (1) |
1,791 | (242 | ) | 1,313 | 817 | 3,679 | ||||||||||||||||||||||||||||||
| Application of rent paid previously |
(1,700 | ) | — | — | — | (1,700 | ) | |||||||||||||||||||||||||||||
| Accretion expense |
1,430 | — | 9 | — | 1,439 | |||||||||||||||||||||||||||||||
| Cash paid, net |
(12,432 | ) | (1,295 | ) | (212 | ) | (701 | ) | (14,640 | ) | ||||||||||||||||||||||||||
|
|
|
|
|
|
|
|
|
|
|
|||||||||||||||||||||||||||
| Accrual balances as of June 30, 2010 |
37,657 | 65 | 1,110 | 116 | 38,948 | |||||||||||||||||||||||||||||||
| Activity for fiscal 2011: |
||||||||||||||||||||||||||||||||||||
| New charges and adjustments to estimates |
760 | (5 | ) | 356 | (18 | ) | 2,046 | 3,139 | ||||||||||||||||||||||||||||
| Accretion expense |
1,090 | — | 19 | — | — | 1,109 | ||||||||||||||||||||||||||||||
| Cash paid, net |
(14,297 | ) | (60 | ) | (737 | ) | (98 | ) | (1,829 | ) | (17,021 | ) | ||||||||||||||||||||||||
|
|
|
|
|
|
|
|
|
|
|
|
|
|||||||||||||||||||||||||
| Accrual balances as of June 30, 2011 |
25,210 | — | 748 | — | 217 | 26,175 | ||||||||||||||||||||||||||||||
| Activity for fiscal 2012: |
||||||||||||||||||||||||||||||||||||
| New charges and adjustments to estimates |
(48 | ) | 7 | (12 | ) | 1,411 | 4,327 | 618 | 6,303 | |||||||||||||||||||||||||||
| Accretion expense |
680 | 10 | — | 1 | — | — | 691 | |||||||||||||||||||||||||||||
| Cash paid, net |
(13,324 | ) | (432 | ) | (205 | ) | (610 | ) | (4,327 | ) | (573 | ) | (19,471 | ) | ||||||||||||||||||||||
|
|
|
|
|
|
|
|
|
|
|
|
|
|
|
|||||||||||||||||||||||
| Accrual balances as of June 30, 2012 |
$ | 12,518 | $ | 333 | $ | — | $ | 802 | $ | — | $ | 45 | $ | 13,698 | ||||||||||||||||||||||
|
|
|
|
|
|
|
|
|
|
|
|
|
|
|
|||||||||||||||||||||||
| (1) | Total charges does not include $0.2 million of accelerated depreciation of fixed assets as represented on the Company’s consolidated statement of operations under restructuring and other costs for fiscal 2010. |
| (2) | These amounts relate to discontinued operations. |
| (3) | These amounts relate to continuing operations. |
Facility
Facility costs represent the closure and downsizing costs of facilities that were consolidated or eliminated due to the restructurings. Closure and downsizing costs include payments required under lease contracts, less any applicable sublease income after the properties were abandoned, lease buyout costs and restoration costs associated with certain lease arrangements. To determine the lease loss portion of the closure and downsizing costs, certain estimates were made related to: (1) the time period over which the relevant building would remain vacant, (2) sublease terms and (3) sublease rates, including common area charges. As of June 30, 2012, the Company has sublease contracts in place for all of but one of its exited facilities. The Company has four sites that have been vacated under restructuring plans as of June 30, 2012.
Restructuring Plans
The Company implemented a restructuring plan in fiscal 2012 to better align the Company’s resources among its operational groups, reduce costs and improve operating efficiencies. As such, during the second quarter of fiscal 2012, the Company incurred $1.4 million in facility charges associated with restructuring reduction of space used for the Company’s headquarters under this plan. The Company expects to pay the remaining $0.8 million facilities related accrual through June 30, 2013.
The Company implemented the FY2010 Restructuring to consolidate the Company’s resources, primarily in development, and improve operating efficiencies. As such, during fiscal 2010, the Company incurred approximately
F-36
Table of Contents
$0.2 million in accelerated depreciation on fixed assets associated with a facility identified for restructuring. During fiscal 2010, the Company recognized $1.3 million in facilities charges associated with a facility the Company exited during the year under the FY2010 Restructuring. During fiscal 2011, a sublease for the facility under this restructuring was signed, which resulted in an additional restructuring charge of $0.4 million. The lease payments will be paid over the term of the remaining lease. Of the remaining $0.3 million facilities related accrual, the Company expects to pay $0.2 million through June 30, 2013 and $0.1 million from July 2013 through January 2014.
The Company implemented the FY2009 Restructuring to consolidate the Company’s resources, primarily in development and support, and improve operating efficiencies. As such, during fiscal 2009, the Company incurred approximately $3.4 million in facilities charges associated with a facility identified for restructuring and $0.1 million in accelerated depreciation on fixed assets associated with facilities identified for restructuring. During fiscal 2010, the Company revised the estimated sublease terms associated with these facilities, which resulted in an additional restructuring charge of $2.0 million. During fiscal 2011, a sublease for one of the facilities under this restructuring was signed, which resulted in an additional restructuring charge of $0.7 million. Of the remaining $1.4 million facilities related accrual, the Company expects to pay $0.6 million through June 30, 2013 and $0.8 million from July 2013 through November 2014.
The following table summarizes the expected future payments for restructuring liabilities by fiscal year (in thousands):
| Year ending June 30, |
Cash Obligation |
Sublease Income |
Net Estimated Cash Payable |
|||||||||
| 2013 |
19,261 | (6,234 | ) | 13,027 | ||||||||
| 2014 |
1,631 | (1,023 | ) | 608 | ||||||||
| 2015 |
499 | (232 | ) | 267 | ||||||||
|
|
|
|
|
|
|
|||||||
| $ | 21,391 | $ | (7,489 | ) | $ | 13,902 | ||||||
|
|
|
|
|
|
|
|||||||
The Company’s restructuring liabilities are recorded at net present value. Over time, the net present value increases to equal the amount of the net future cash payments, removing the need for time-based discounting. Accretion expense reflects the increase in the net present value during the relevant period. Future accretion expense on the restructured facility obligations above is $0.2 million, which will be recorded as restructuring expense over the life of the respective leases.
(12) Income Taxes
Loss from continuing operations before provision for income taxes is comprised of the following (in thousands):
| Fiscal Year ended June 30, | ||||||||||||
| 2012 | 2011 | 2010 | ||||||||||
| Domestic |
$ | (9,439 | ) | $ | (7,990 | ) | $ | (10,468 | ) | |||
| Foreign |
— | — | — | |||||||||
|
|
|
|
|
|
|
|||||||
| Total |
$ | (9,439 | ) | $ | (7,990 | ) | $ | (10,468 | ) | |||
|
|
|
|
|
|
|
|||||||
F-37
Table of Contents
The provision for income taxes includes the following (in thousands):
| Fiscal Year ended June 30, | ||||||||||||
| 2012 | 2011 | 2010 | ||||||||||
| Current: |
||||||||||||
| Domestic income tax |
$ | (3,790 | ) | $ | — | $ | — | |||||
| Foreign income tax |
— | — | — | |||||||||
| Deferred: |
||||||||||||
| Foreign |
2,501 | 115 | — | |||||||||
|
|
|
|
|
|
|
|||||||
| Total |
$ | (1,289 | ) | $ | 115 | $ | — | |||||
|
|
|
|
|
|
|
|||||||
The Company recorded an income tax expense (benefit) relating to discontinued operations of $5.5 million, $(1.6) million and $3.0 million during fiscal 2012, 2011 and 2010, respectively, which is excluded from the table above.
The following table reconciles the expected corporate federal income tax expense (benefit) (computed by multiplying the Company’s loss before income taxes by the statutory income tax rate of 35%) to the Company’s income tax expense (in thousands):
| Fiscal Year ended June 30, | ||||||||||||
| 2012 | 2011 | 2010 | ||||||||||
| Federal tax benefit at statutory rate |
$ | (3,304 | ) | $ | (2,797 | ) | $ | (3,664 | ) | |||
| State taxes |
(486 | ) | — | — | ||||||||
| Effect of foreign operations |
2,501 | 115 | — | |||||||||
| Net operating losses not benefited, net |
— | 2,797 | 3,664 | |||||||||
|
|
|
|
|
|
|
|||||||
| Total tax expense |
$ | (1,289 | ) | $ | 115 | $ | — | |||||
|
|
|
|
|
|
|
|||||||
The tax effect of temporary differences that give rise to significant portions of the Company’s deferred tax assets and liabilities are as follows (in thousands):
| June 30, | ||||||||
| 2012 | 2011 | |||||||
| Deferred tax assets: |
||||||||
| Net operating loss carryforwards |
$ | 593,321 | $ | 611,703 | ||||
| Accruals and allowances not deductible for tax purposes |
14,286 | 9,870 | ||||||
| Research and development credit and other credits carry-forwards |
51,333 | 50,434 | ||||||
| Intangible assets related to acquisitions |
(0 | ) | 15,687 | |||||
| Stock based compensation |
982 | 9,276 | ||||||
|
|
|
|
|
|||||
| Total deferred tax assets, gross |
659,922 | 696,970 | ||||||
| Less: valuation allowance |
(659,922 | ) | (694,277 | ) | ||||
|
|
|
|
|
|||||
| Total deferred tax assets, net |
$ | — | $ | 2,693 | ||||
|
|
|
|
|
|||||
In light of the Company’s recent history of operating losses, the Company has recorded a valuation allowance for all of its federal and state deferred tax assets, as it is presently unable to conclude that it is more likely than not that federal and state deferred tax assets in excess of deferred tax liabilities will be realized.
During fiscal 2012, the Company recorded a valuation allowance of $2.5 million against the beginning foreign deferred tax asset balance following the Company’s announcement that it was pursuing strategic alternatives for the
F-38
Table of Contents
mediation and messaging product operations, which created uncertainty regarding the ability of certain foreign subsidiaries to generate future taxable income. As a result of the sale of the product business, the Company does not have any foreign deferred tax assets as of June 30, 2012.
Approximately $250.5 million of the valuation allowance for deferred tax assets relating to net operating loss carryforwards is attributable to employee stock option deductions, the benefit from which will be allocated to additional paid-in capital rather than current earnings when and if subsequently realized. The benefit from approximately $8.5 million of the total $51.3 million valuation allowance for deferred tax assets related to research and development credit carryforwards will be allocated to additional paid-in capital rather than current earnings when and if subsequently realized.
As of June 30, 2012, the Company had net operating loss carryforwards for federal and state income tax purposes of approximately $1.6 billion and $601.8 million, respectively. In addition, the Company has gross federal and California research and development credit carryforwards of approximately $30.1 million and $21.2 million. The federal net operating loss carryforwards and research and development credit carryforwards will expire from 2018 through 2032. The California research and development credits may be carried forward indefinitely. The California net operating loss carryforwards will expire from 2013 through 2032.
Under Internal Revenue Code Section 382, the utilization of a corporation’s net operating loss (“NOL”) carryforwards is limited following a change in ownership (as defined by the Internal Revenue Code) of greater than 50% within a three-year NOL period. If it is determined that prior equity transactions limit the Company’s NOL carryforwards, the annual limitation will be determined by multiplying the market value of the Company on the date of the ownership change by the federal long-term tax-exempt rate. Any amount exceeding the annual limitation may be carried forward to future years for the balance of the NOL carryforward period.
The Company’s policy is to include interest and penalties related to unrecognized tax benefits in tax expense on the Company’s consolidated statement of operations. As of June 30, 2012, no amount is accrued for interest associated with tax liabilities.
The sale of the product business did not include a transfer of the Company’s gross unrecognized tax benefits reflected in long-term taxes payable and other in the consolidated balance sheet. To the extent these estimated liabilities are adjusted, the difference will be reported as discontinued operations in the statement of operations in the period adjusted, since it relates to foreign withholding taxes on product revenues.
F-39
Table of Contents
During fiscal 2010, 2011 and 2012, the total amount of gross unrecognized tax benefit activity was as follows (in thousands):
| Balance as of June 30, 2009 |
$ | 5,623 | ||
| Additions based on tax positions related to current year |
406 | |||
| Reductions for tax positions of prior years |
(213 | ) | ||
| Lapse of statute of limitations |
(622 | ) | ||
| Settlements |
(785 | ) | ||
| Impact of currency fluctuation |
(236 | ) | ||
|
|
|
|||
| Balance as of June 30, 2010 |
4,173 | |||
| Additions based on tax positions related to current year |
155 | |||
| Reductions for tax positions of prior years |
153 | |||
| Lapse of statute of limitations |
(3,652 | ) | ||
| Settlements |
— | |||
| Impact of currency fluctuation |
198 | |||
|
|
|
|||
| Balance as of June 30, 2011 |
1,027 | |||
| Additions based on tax positions related to current year |
48 | |||
| Additions for tax positions of prior years |
240 | |||
| Reductions for tax positions of prior years |
(239 | ) | ||
| Lapse of statute of limitations |
(130 | ) | ||
| Impact of currency fluctuation |
(28 | ) | ||
|
|
|
|||
| Balance as of June 30, 2012 |
$ | 918 | ||
|
|
|
The total amount of gross unrecognized tax benefits was $0.9 million as of June 30, 2012. All of the tax expense or benefit realized during fiscal 2010, 2011 and 2012 related to changes in unrecognized tax benefits was recorded as net income or expense from discontinued operations. Changes in the Company’s gross unrecognized tax benefits as of June 30, 2012, if any, will be reflected in discontinued operations since the amounts relate to foreign withholding tax on prior revenues relating to the product operations.
Although timing of the resolution and/or closure on the Company’s unrecognized tax benefits is highly uncertain, the Company does not believe it is reasonably possible that the unrecognized tax benefits would materially change in the next 12 months.
The Company files U.S. federal, U.S. state and foreign tax returns. The Company’s U.S. federal tax return for fiscal 2009 is currently under examination by the Internal Revenue Service. Although the outcome of the examination is uncertain, we do not expect the results to have a material impact on the financial statements. Because of net operating loss carryforwards, substantially all of the Company’s tax years, from fiscal 1995 through fiscal 2011, remain open to state tax examinations with the exception of Alabama, Massachusetts and Texas. Most of the Company’s foreign jurisdictions have three or four open tax years at any point in time.
F-40
Table of Contents
Exhibit Index
| Exhibit |
Description | |||
| 2.2 | Asset Purchase and Sale Agreement, dated April 15, 2012 between Unwired Planet, Inc. (as successor in interest to Openwave Systems Inc., the “Company”) and OM1, Inc. (incorporated herein by reference to Exhibit 2.1 to the Company’s Current Report on Form 8-K filed with the Securities and Exchange Commission on April 16, 2012 (Commission No. 001-16703)). | |||
| 3.1 | Restated Certificate of Incorporation of the Company (incorporated by reference to Exhibit 3.1 to the Company’s annual report on Form 10-K filed with the Securities and Exchange Commission on September 7, 2010 (Commission No. 001-16703)). | |||
| 3.2 | Certificate of Ownership and Merger merging Unwired Planet, Inc. with and into Openwave Systems Inc. (incorporated by reference to Exhibit 3.3 to the Company’s Quarterly Report on Form 10-Q filed with the Securities and Exchange Commission on May 10, 2012 (Commission No. 001-16703)). | |||
| 3.3 | Amended and Restated Bylaws of the Company (incorporated by reference to Exhibit 3.1 to the Company’s Current Report on Form 8-K filed with the Securities and Exchange Commission on September 12, 2011 (Commission No. 001-16703)). | |||
| 3.4 | Certificate of Designations of Series A Junior Participating Cumulative Preferred Stock of the Company. classifying and designating the Series A Junior Participating Cumulative Preferred Stock (incorporated by reference to Exhibit 3.1 to the Company’s Registration Statement on Form 8-A filed with the Securities and Exchange Commission on January 30, 2012 (Commission No. 001-16703)). | |||
| 4.1 | Form of the Company’s Common Stock Certificate (incorporated by reference to Exhibit 4.1 to the Company’s Annual Report on Form 10-K filed with the Securities and Exchange Commission on August 28, 2003 (Commission No. 001-16703)). | |||
| 4.2 | Tax Benefits Preservation Agreement, dated as of January 28, 2012, between the Company and Computershare Trust Company, N.A., as Rights Agent (incorporated by reference to Exhibit 4.1 to the Company’s Registration Statement on Form 8-A filed with the Securities and Exchange Commission on January 30, 2012 (Commission No. 001-16703)). | |||
| 4.3 | Exemption Agreement dated April 9, 2012, between the Company and Quantum Partners LP (incorporated by reference to the Company’s Current Report on Form 8-K filed with the Securities and Exchange Commission on April 9, 2012 (Commission No. 001-16073)). | |||
| 10.1 | Lease Agreement by and between the Company and Pacific Shores Center LLC dated February 4, 2000 (incorporated by reference to Exhibit 10.19 to the Company’s Quarterly Report on Form 10-Q filed with the Securities and Exchange Commission on May 15, 2000 (Commission No. 001-16703)). | |||
| 10.2 | * | Openwave Systems Inc. 1996 Stock Plan (incorporated by reference to Exhibit 10.2 to the Company’s Quarterly Report on Form 10-Q filed with the Securities and Exchange Commission on May 15, 2001 (Commission No. 001-16703)). | ||
| 10.3 | * | Form of Indemnity Agreement for Officers and Directors (incorporated by reference to Exhibit 10.16 to the Company’s Annual Report on Form 10-K filed with the Securities and Exchange Commission on September 28, 2001 (Commission No. 001-16703)). | ||
| 10.4 | * | Openwave Systems Inc. 1999 Employee Stock Purchase Plan, as amended and restated effective November 1, 2006 (incorporated by reference to Exhibit 99.7 to the Company’s registration statement on Form S-8 filed with the Securities and Exchange Commission on February 14, 2007 (Commission No. 001-16703)). | ||
| 10.5 | * | Openwave Systems Inc. 2001 Stock Compensation Plan, amended and restated effective as of August 7, 2002 (incorporated by reference to Exhibit 10.1 to the Company’s Annual Report on Form 10-K filed with the Securities and Exchange Commission on September 30, 2002 (Commission No. 001-16703)). | ||
| 10.6 | * | Form of US Stock Option Agreement (incorporated by reference to Exhibit 10.3 to the Company’s Quarterly Report on Form 10-Q filed with the Securities and Exchange Commission on May 12, 2004 (Commission No. 001-16703)). | ||
Table of Contents
| Exhibit |
Description | |||
| 10.7* | Form of International Stock Option Agreement (incorporated by reference to Exhibit 10.4 to the Company’s Quarterly Report on Form 10-Q filed with the Securities and Exchange Commission on May 12, 2004 (Commission No. 001-16703)). | |||
| 10.8* | Openwave Systems Inc. Amended and Restated Executive Severance Benefit Policy, amended effective September 15, 2012 (incorporated by reference to Exhibit 10.7 to the Company’s Quarterly Report on Form 10-Q filed with the Securities and Exchange Commission on February 8, 2012 (Commission No. 001-16703)). | |||
| 10.9* | Form of Change of Control Severance Agreement (incorporated by reference to Exhibit 10.23 to the Company’s Annual Report on Form 10-K filed with the Securities and Exchange Commission on September 15, 2008 (Commission No. 001-16703)). | |||
| 10.10 | * | Form of Amended and Restated Change of Control Severance Agreement (incorporated by reference to Exhibit 10.1 to the Company’s Quarterly Report on Form 10-Q filed with the Securities and Exchange Commission on February 8, 2012 (Commission No. 001-16703)). | ||
| 10.11 | * | Form of Change of Control Severance Agreement for the Holding Company (incorporated by reference to Exhibit 10.4 to the Company’s Quarterly Report on Form 10-Q filed with the Securities and Exchange Commission on February 8, 2012 (Commission No. 001-16703)). | ||
| 10.12 | * | Form of Change of Control Severance Agreement for the Messaging Business Unit (incorporated by reference to Exhibit 10.5 to the Company’s Quarterly Report on Form 10-Q filed with the Securities and Exchange Commission on February 8, 2012 (Commission No. 001-16703)). | ||
| 10.13 | * | Form of Change of Control Severance Agreement for the Mediation Business Unit (incorporated by reference to Exhibit 10.6 to the Company’s Quarterly Report on Form 10-Q filed with the Securities and Exchange Commission on February 8, 2012 (Commission No. 001-16703)). | ||
| 10.14 | * | First Amendment to Amended and Restated Change of Control Severance Agreement (incorporated by reference to Exhibit 10.1 to the Company’s Current Report on Form 8-K filed with the Securities and Exchange Commission on August 3, 2012 (Commission No. 001-16703)). | ||
| 10.15 | * | Openwave Systems Inc. Amended and Restated 2006 Stock Incentive Plan, amended and restated effective November 11, 2011 (incorporated by reference to Exhibit 10.8 to the Company’s Quarterly Report on Form 10-Q filed with the Securities and Exchange Commission on February 8, 2012 (Commission No. 001-16703)).). | ||
| 10.16 | Form of 2006 Stock Incentive Plan Restricted Stock Unit Grant Notice 2011 (incorporated by reference to Exhibit 10.9 to the Company’s Quarterly Report on Form 10-Q filed with the Securities and Exchange Commission on February 8, 2012 (Commission No. 001-16703)). | |||
| 10.17 | * | Openwave Systems Inc. Amended and Restated 1999 Directors’ Equity Compensation Plan, amended and restated effective December 3, 2009 (incorporated by reference to Exhibit 99.1 to the Company’s registration statement on Form S-8 filed with the Securities and Exchange Commission on December 4, 2009 (Commission No. 001-16703)). | ||
| 10.18 | * | Form of Notice of Stock Option Grant and Form of Stock Option Agreement (incorporated by reference to Exhibit 99.2 to the Company’s registration statement on Form S-8 filed with the Securities and Exchange Commission on with the Securities and Exchange Commission on December 4, 2009 (Commission No. 001-16703)) | ||
| 10.19 | * | Form of Restricted Stock Bonus Agreement (incorporated by reference to Exhibit 99.3 to the Company’s registration statement on Form S-8 filed with the Securities and Exchange Commission on December 4, 2009 (Commission No. 001-16703)). | ||
| 10.20 | Loan and Security Agreement dated as of January 23, 2009, between the Company and Silicon Valley Bank (incorporated by reference to Exhibit 10.1 to the Company’s Current Report on Form 8-K filed with the Securities and Exchange Commission on January 28, 2009 (Commission No. 001-16703)). | |||
Table of Contents
| Exhibit |
Description | |||
| 10.21 | Amendment No. 1 to Loan and Security Agreement between the Company and Silicon Valley Bank dated January 20, 2010 (incorporated by reference to Exhibit 10.6 to the Company’s Quarterly Report on Form 10-Q filed with the Securities and Exchange Commission on February 5, 2010 (Commission No. 001-16703)). | |||
| 10.22 | Amendment No. 2 to Loan and Security Agreement between the Company and Silicon Valley Bank dated January 20, 2010 (incorporated by reference to Exhibit 10.7 to the Company’s Quarterly Report on Form 10-Q filed with the Securities and Exchange Commission on February 5, 2010 (Commission No. 001-16703)). | |||
| 10.23 | Amendment No. 3 to Loan and Security Agreement between the Company and Silicon Valley Bank dated April 14, 2010 (incorporated by reference to Exhibit 10.5 to the Company’s Quarterly Report on Form 10-Q filed with the Securities and Exchange Commission on May 7, 2010 (Commission No. 001-16703)). | |||
| 10.24 | Amendment No. 4 to Loan and Security Agreement and Limited Waiver between the Company and Silicon Valley Bank dated April 26, 2011 (incorporated by reference to Exhibit 10.2 to the Company’s Quarterly Report on Form 10-Q filed with the Securities and Exchange Commission on May 6, 2011 (Commission No. 001-16703)). | |||
| 10.25 | Amendment No. 5 to Loan and Security Agreement between the Company and Silicon Valley Bank dated September 6, 2011 (incorporated by reference to Exhibit 10.4 to the Company’s Quarterly Report on Form 10-Q filed with the Securities and Exchange Commission on November 7, 2011 (Commission No. 001-16703)). | |||
| 10.26 | Amendment No. 6 to Loan and Security Agreement between the Company and Silicon Valley Bank dated January 23, 2012 (incorporated by reference to Exhibit 10.10 to the Company’s Quarterly Report on Form 10-Q filed with the Securities and Exchange Commission on February 8, 2012 (Commission No. 001-16703)). | |||
| 10.27 | Amendment No. 7 to Loan and Security Agreement between the Company and Silicon Valley Bank dated February 24, 2012 (incorporated by reference to Exhibit 10.1 to the Company’s Quarterly Report on Form 10-Q filed with the Securities and Exchange Commission on May 10, 2012 (Commission No. 001-16703)). | |||
| 10.28 | Amendment No. 8 to Loan and Security Agreement between the Company and Silicon Valley Bank dated March 29, 2012 (incorporated by reference to Exhibit 10.2 to the Company’s Quarterly Report on Form 10-Q filed with the Securities and Exchange Commission on May 10, 2012 (Commission No. 001-16703)). | |||
| 10.29 | Amendment No. 9 to Loan and Security Agreement between the Company and Silicon Valley Bank dated April 16, 2012 (incorporated by reference to Exhibit 10.3 to the Company’s Quarterly Report on Form 10-Q filed with the Securities and Exchange Commission on May 10, 2012 (Commission No. 001-16703)). | |||
| 10.30 | Amendment No. 10 to Loan and Security Agreement between the Company and Silicon Valley Bank dated May 4, 2012 (incorporated by reference to Exhibit 10.5 to the Company’s Quarterly Report on Form 10-Q filed with the Securities and Exchange Commission on May 10, 2012 (Commission No. 001-16703)). | |||
| 10.31 | Limited Waiver to Loan and Security Agreement dated February 1, 2011 (incorporated by reference to Exhibit 10.1 to the Company’s Quarterly Report on Form 10-Q filed February 8, 2011). | |||
| 10.32 | * | Employment Offer Letter between the Company and Anne Brennan dated March 31, 2010 (incorporated by reference to Exhibit 10.1 to the Company’s Quarterly Report on Form 10-Q filed with the Securities and Exchange Commission on May 7, 2010 (Commission No. 001-16703)). | ||
| 10.33 | * | Employment Offer Letter between the Company and Kenneth D. Denman dated October 28, 2008 (incorporated by reference to Exhibit 10.24 to the Company’s Annual Report on Form 10-K filed with the Securities and Exchange Commission on September 7, 2010 (Commission No. 001-16703)). | ||
Table of Contents
| Exhibit |
Description | |||
| 10.34 | * | Employment Offer Letter between the Company and John Giere dated June 16, 2009 (incorporated by reference to Exhibit 10.27 to the Company’s Annual Report on Form 10-K filed with the Securities and Exchange Commission on September 7, 2010 (Commission No. 001-16703)). | ||
| 10.35 | * | Openwave Systems Inc. Amended and Restated Fiscal Year (FY) 2012 Executive Corporate Incentive Plan (incorporated by reference to Exhibit 10.3 to the Company’s Quarterly Report on Form 10-K filed with the Securities and Exchange Commission on November 7, 2011 (Commission No. 001-16703)). | ||
| 10.36 | * | Separation Letter Agreement between the Company and Kenneth D. Denman dated September 9, 2011 (incorporated by reference to Exhibit 10.1 to the Company’s Quarterly Report on Form 10-Q filed with the Securities and Exchange Commission on November 7, 2011 (Commission No. 001-16703)). | ||
| 10.37 | * | Employment Offer Letter between the Company and Michael C. Mulica dated October 3, 2011 (incorporated by reference to Exhibit 10.2 to the Company’s Quarterly Report on Form 10-Q filed with the Securities and Exchange Commission on November 7, 2011 (Commission No. 001-16703)). | ||
| 10.38 | * | Form of Letter Agreement with Directors Resigning from the Board of Directors (incorporated by reference to Exhibit 10.1 to the Company’s Current Report on Form 8-K filed with the Securities and Exchange Commission on March 28, 2012 (Commission No. 001-16703)). | ||
| 10.39 | * | Employment Agreement between the Company and Timothy M. Robbins dated June 11, 2012 effective December 2011. | ||
| 10.40 | * | Employment Agreement between the Company and Daniel Mendez dated June 11, 2012 effective December 2011. | ||
| 21.1 | Subsidiaries of the Company. | |||
| 23.1 | Consent of Independent Registered Public Accounting Firm. | |||
| 31.1 | Certification of the Chief Executive Officer pursuant to Section 302 of the Sarbanes-Oxley Act of 2002. | |||
| 31.2 | Certification of the Chief Financial Officer pursuant to Section 302 of the Sarbanes-Oxley Act of 2002. | |||
| 32.1 | Certifications of the Chief Executive Officer and Chief Financial Officer pursuant to 18 U.S.C. Section 1350, as adopted pursuant to Section 906 of the Sarbanes-Oxley Act of 2002. | |||
| 101.INS | ** | XBRL Instance Document | ||
| 101.SCH | ** | XBRL Taxonomy Extension Schema Document | ||
| 101.CAL | ** | XBRL Taxonomy Extension Calculation Linkbase Document | ||
| 101.DEF | ** | XBRL Taxonomy Extension Definition Linkbase Document | ||
| 101.LAB | ** | XBRL Taxonomy Extension Label Linkbase Document | ||
| 101.PRE | ** | XBRL Taxonomy Extension Presentation Linkbase Document | ||
| * | Indicates a management contract or compensatory plan or arrangement |
| ** | As permitted by Rule 405(a)(2) of Regulation S-T, XBRL Interactive Data files with detailed tagging will be filed by amendment to this Annual Report on Form 10-K within 30 days of the filing date of this Annual Report on Form 10-K. |