Attached files
| file | filename |
|---|---|
| EX-32.2 - EXHIBIT 32.2 - Corvus Gold Inc. | exh_322.htm |
| EX-32.1 - EXHIBIT 32.1 - Corvus Gold Inc. | exh_321.htm |
| EX-31.2 - EXHIBIT 31.2 - Corvus Gold Inc. | exh_312.htm |
| EX-31.1 - EXHIBIT 31.1 - Corvus Gold Inc. | exh_311.htm |
| EX-23.2 - EXHIBIT 23.2 - Corvus Gold Inc. | exh_232.htm |
| EX-23.1 - EXHIBIT 23.1 - Corvus Gold Inc. | exh_231.htm |
UNITED STATES
SECURITIES AND EXCHANGE COMMISSION
Washington, D.C. 20549
FORM 10-Q
| ☒ | QUARTERLY REPORT PURSUANT TO SECTION 13 OR 15(d) OF THE SECURITIES EXCHANGE ACT OF 1934 | |
| For the quarterly period ended February 28, 2018 | ||
| OR | ||
| ☐ | TRANSITION REPORT PURSUANT TO SECTION 13 OR 15(d) OF THE SECURITIES EXCHANGE ACT OF 1934 | |
For the transition period from to
| Commission file number: 000-55447 |
![]()
CORVUS GOLD INC.
(Exact Name of Registrant as Specified in its Charter)
| British Columbia, Canada | 98-0668473 |
| (State or other jurisdiction of incorporation or organization) |
(I.R.S. Employer Identification No.) |
| 1750-700 West Pender Street | |
| Vancouver, British Columbia, Canada, | V6C 1G8 |
| (Address of Principal Executive Offices) | (Zip code) |
Registrant’s telephone number, including area code: (604) 638-3246
Indicate by check mark whether the registrant (1) has filed all reports required to be filed by Section 13 or 15(d) of the Securities Exchange Act of 1934 during the preceding 12 months (or for such shorter period that the registrant was required to file such reports), and (2) has been subject to such filing requirements for the past 90 days.
Yes ☒ No ☐
Indicate by check mark whether the registrant has submitted electronically and posted on its corporate Web site, if any, every Interactive Data File required to be submitted and posted pursuant to Rule 405 of Regulation S-T (§232.405 of this chapter) during the preceding 12 months (or for such shorter period that the registrant was required to submit and post such files).
Yes ☒ No ☐
Indicate by check mark whether the registrant is a large accelerated filer, an accelerated filer, a non-accelerated filer a smaller reporting company or an emerging growth company. See the definitions of “large accelerated filer,” “accelerated filer,” “smaller reporting company,” and “emerging growth company” in Rule 12b-2 of the Exchange Act.
| Large accelerated filer ☐ | Accelerated filer ☐ |
|
Non-accelerated filer ☐ (Do not check if a smaller reporting company) |
Small reporting company ☒ |
| Emerging growth company ☒ |
If an emerging growth company, indicate by check mark if the registrant has elected not to use the extended transition period for complying with any new or revised financial accounting standards provided pursuant to Section 13(a) of the Exchange Act. ☒
Indicate by check mark whether the registrant is a shell company (as defined in Rule 12b-2 of the Exchange Act). Yes ☐ No ☒
As of April 9, 2018, the registrant had 104,255,175 common shares outstanding.
Table of Contents
CORVUS GOLD INC.
CONDENSED INTERIM CONSOLIDATED BALANCE SHEETS
(Expressed in Canadian dollars)
| February 28, 2018 | May 31, 2017 | |||||||
| (Unaudited) | ||||||||
| ASSETS | ||||||||
| Current assets | ||||||||
| Cash and cash equivalents | $ | 4,571,455 | $ | 1,300,553 | ||||
| Accounts receivable | 26,816 | 13,524 | ||||||
| Prepaid expenses | 318,516 | 249,176 | ||||||
| Total current assets | 4,916,787 | 1,563,253 | ||||||
| Property and equipment (note 3) | 60,535 | 69,529 | ||||||
| Capitalized acquisition costs (note 4) | 5,166,527 | 4,527,740 | ||||||
| Total assets | $ | 10,143,849 | $ | 6,160,522 | ||||
| LIABILITIES AND SHAREHOLDERS’ EQUITY | ||||||||
| Current liabilities | ||||||||
| Accounts payable and accrued liabilities (note 6) | $ | 349,316 | $ | 293,085 | ||||
| Total current liabilities | 349,316 | 293,085 | ||||||
| Asset retirement obligations (note 4) | 346,682 | 340,176 | ||||||
| Total liabilities | 695,998 | 633,261 | ||||||
| Shareholders’ equity | ||||||||
| Share capital (note 5) | 83,606,486 | 72,670,170 | ||||||
| Contributed surplus (note 5) | 12,866,347 | 12,480,784 | ||||||
| Accumulated other comprehensive income - cumulative translation differences | 1,060,424 | 1,348,070 | ||||||
| Deficit accumulated during the exploration stage | (88,085,406 | ) | (80,971,763 | ) | ||||
| Total shareholders’ equity | 9,447,851 | 5,527,261 | ||||||
| Total liabilities and shareholders’ equity | $ | 10,143,849 | $ | 6,160,522 | ||||
Nature and continuance of operations (note 1)
Approved on behalf of the Directors:
| “Jeffrey Pontius” | Director | |
| “Anton Drescher” | Director |
These accompanying notes form an integral part of these condensed interim consolidated financial statements
| 3 |
CORVUS GOLD INC.
CONDENSED INTERIM CONSOLIDATED STATEMENTS OF OPERATIONS AND COMPREHENSIVE LOSS
(Unaudited)
(Expressed in Canadian dollars)
| Three months ended February 28, | Nine months ended February 28, | |||||||||||||||
| 2018 | 2017 | 2018 | 2017 | |||||||||||||
| Expenses | ||||||||||||||||
| Administration | $ | 105 | $ | 92 | $ | 316 | $ | 545 | ||||||||
| Consulting fees (notes 5 and 6) | 183,224 | 164,869 | 468,982 | 456,531 | ||||||||||||
| Depreciation (note 3) | 4,468 | 5,537 | 13,477 | 16,544 | ||||||||||||
| Exploration expenditures (notes 4 and 5) | 1,623,436 | 877,567 | 4,075,384 | 2,107,236 | ||||||||||||
| Insurance | 49,151 | 47,597 | 147,279 | 105,913 | ||||||||||||
| Investor relations (notes 5 and 6) | 226,370 | 224,332 | 616,295 | 564,355 | ||||||||||||
| Office and miscellaneous | 30,453 | 27,818 | 108,437 | 89,931 | ||||||||||||
| Professional fees (note 5) | 94,610 | 82,433 | 194,435 | 206,356 | ||||||||||||
| Regulatory | 47,778 | 35,954 | 86,311 | 67,809 | ||||||||||||
| Rent | 17,241 | 27,961 | 79,484 | 80,309 | ||||||||||||
| Travel | 31,422 | 23,097 | 163,960 | 107,415 | ||||||||||||
| Wages and benefits (notes 5 and 6) | 570,899 | 482,674 | 1,033,069 | 1,045,682 | ||||||||||||
| Total operating expenses | (2,879,157 | ) | (1,999,931 | ) | (6,987,429 | ) | (4,848,626 | ) | ||||||||
| Other income (expense) | ||||||||||||||||
| Interest income | 6,445 | 5,729 | 12,567 | 24,059 | ||||||||||||
| Foreign exchange loss | (58,884 | ) | (1,065 | ) | (138,781 | ) | (4,860 | ) | ||||||||
| Total other income (expense) | (52,439 | ) | 4,664 | (126,214 | ) | 19,199 | ||||||||||
| Net loss for the period | (2,931,596 | ) | (1,995,267 | ) | (7,113,643 | ) | (4,829,427 | ) | ||||||||
| Other comprehensive income (loss) | ||||||||||||||||
| Exchange difference on translating foreign operations | (38,904 | ) | (65,148 | ) | (287,646 | ) | 77,877 | |||||||||
| Comprehensive loss for the period | $ | (2,970,500 | ) | $ | (2,060,415 | ) | $ | (7,401,289 | ) | $ | (4,751,550 | ) | ||||
| Basic and diluted loss per share | $ | (0.03 | ) | $ | (0.02 | ) | $ | (0.07 | ) | $ | (0.05 | ) | ||||
| Weighted average number of shares outstanding | 103,961,579 | 92,369,582 | 100,301,808 | 91,936,432 | ||||||||||||
These accompanying notes form an integral part of these condensed interim consolidated financial statements
| 4 |
CORVUS GOLD INC.
CONDENSED INTERIM CONSOLIDATED STATEMENTS OF CASH FLOWS
(Unaudited)
(Expressed in Canadian dollars)
NINE MONTHS ENDED FEBRUARY 28,
| 2018 | 2017 | |||||||
| Operating activities | ||||||||
| Net loss for the period | $ | (7,113,643 | ) | $ | (4,829,427 | ) | ||
| Add items not affecting cash: | ||||||||
| Depreciation | 13,477 | 16,544 | ||||||
| Stock-based compensation (note 5) | 508,865 | 453,788 | ||||||
| Foreign exchange loss | 138,781 | 4,860 | ||||||
| Changes in non-cash items: | ||||||||
| Accounts receivable | (13,292 | ) | (1,334 | ) | ||||
| Prepaid expenses | (69,340 | ) | (112,963 | ) | ||||
| Accounts payable and accrued liabilities | 56,231 | 51,881 | ||||||
| Cash used in operating activities | (6,478,921 | ) | (4,416,651 | ) | ||||
| Financing activities | ||||||||
| Cash received from issuance of shares | 10,073,362 | 2,701,000 | ||||||
| Share issuance costs | (107,348 | ) | (17,554 | ) | ||||
| Cash provided by financing activities | 9,966,014 | 2,683,446 | ||||||
| Investing activities | ||||||||
| Expenditures on property and equipment | (7,710 | ) | (7,739 | ) | ||||
| Capitalized acquisition costs | (38,384 | ) | (66,876 | ) | ||||
| Cash used in investing activities | (46,094 | ) | (74,615 | ) | ||||
| Effect of foreign exchange on cash | (170,097 | ) | 5,513 | |||||
| Increase (Decrease) in cash and cash equivalents | 3,270,902 | (1,802,307 | ) | |||||
| Cash and cash equivalents, beginning of the period | 1,300,553 | 4,783,519 | ||||||
| Cash and cash equivalents, end of the period | $ | 4,571,455 | $ | 2,981,212 | ||||
Supplemental cash flow information (note 9)
These accompanying notes form an integral part of these condensed interim consolidated financial statements
| 5 |
CORVUS GOLD INC.
CONDENSED INTERIM CONSOLIDATED STATEMENT OF CHANGES IN EQUITY
(Unaudited)
(Expressed in Canadian dollars)
NINE MONTHS ENDED FEBRUARY 28, 2018
| Number of shares | Amount | Contributed Surplus | Accumulated Other Comprehensive Income – Cumulative Translation Differences | Deficit | Total | |||||||||||||||||||
| Balance, May 31, 2017 | 92,369,582 | $ | 72,670,170 | $ | 12,480,784 | $ | 1,348,070 | $ | (80,971,763 | ) | $ | 5,527,261 | ||||||||||||
| Net loss for the period | - | - | - | - | (7,113,643 | ) | (7,113,643 | ) | ||||||||||||||||
| Shares issued for cash | ||||||||||||||||||||||||
| Private placement | 10,603,933 | 9,903,499 | - | - | - | 9,903,499 | ||||||||||||||||||
| Exercise of stock options | 256,660 | 169,863 | - | - | - | 169,863 | ||||||||||||||||||
| Share issued for capitalized acquisition costs | 1,025,000 | 847,000 | - | - | - | 847,000 | ||||||||||||||||||
| Other comprehensive income (loss) | ||||||||||||||||||||||||
| Exchange difference on translating foreign operations | - | - | - | (287,646 | ) | - | (287,646 | ) | ||||||||||||||||
| Share issuance costs | - | (107,348 | ) | - | - | - | (107,348 | ) | ||||||||||||||||
| Reclassification of contributed surplus on exercise of stock options | - | 123,302 | (123,302 | ) | - | - | - | |||||||||||||||||
| Stock-based compensation | - | - | 508,865 | - | - | 508,865 | ||||||||||||||||||
| Balance, February 28, 2018 | 104,255,175 | $ | 83,606,486 | $ | 12,866,347 | $ | 1,060,424 | $ | (88,085,406 | ) | $ | 9,447,851 | ||||||||||||
These accompanying notes form an integral part of these condensed interim consolidated financial statements
| 6 |
| 1. | NATURE AND CONTINUANCE OF OPERATIONS |
On August 25, 2010, International Tower Hill Mines Ltd. (“ITH”) completed a Plan of Arrangement (the “Arrangement”) whereby its existing Alaska mineral properties (other than the Livengood project) and related assets and the North Bullfrog mineral property and related assets in Nevada (collectively, the “Nevada and Other Alaska Business”) were indirectly spun out into a new public company, being Corvus Gold Inc. (“Corvus” or the “Company”). As part of the Arrangement, ITH transferred its wholly-owned subsidiary Corvus Gold Nevada Inc. (“Corvus Nevada”) (which held the North Bullfrog property), to Corvus and a wholly-owned Alaskan subsidiary of ITH, Talon Gold Alaska, Inc. sold to Raven Gold Alaska Inc. (“Raven Gold”), the Terra, Chisna, LMS and West Pogo properties. As a consequence of the completion of the Arrangement, the Terra, Chisna, LMS, West Pogo and North Bullfrog properties were transferred to Corvus.
The Company was incorporated on April 13, 2010 under the Business Corporations Act (British Columbia). These condensed interim consolidated financial statements reflect the cumulative operating results of the predecessor, as related to the mineral properties that were transferred to the Company from June 1, 2006.
The Company is engaged in the business of acquiring, exploring and evaluating mineral properties, and either joint venturing or developing these properties further or disposing of them when the evaluation is completed. At February 28, 2018, the Company had interests in properties in Nevada, U.S.A.
The business of mining and exploration involves a high degree of risk and there can be no assurance that current exploration programs will result in profitable mining operations. The Company has no source of revenue, and has significant cash requirements to meet its administrative overhead and maintain its mineral property interests. The recoverability of amounts shown for mineral properties is dependent on several factors. These include the discovery of economically recoverable reserves, the ability of the Company to obtain the necessary financing to complete the development of these properties, and future profitable production or proceeds from disposition of mineral properties. The carrying value of the Company’s mineral properties does not reflect current or future values.
These condensed interim consolidated financial statements have been prepared on a going concern basis, which presume the realization of assets and discharge of liabilities in the normal course of business for the foreseeable future. The Company’s ability to continue as a going concern is dependent upon achieving profitable operations and/or obtaining additional financing.
In assessing whether the going concern assumption is appropriate, management takes into account all available information about the future within one year from the date the condensed interim consolidated financial statements are issued. There is substantial doubt upon the Company’s ability to continue as going concern, as explained in the following paragraphs.
The Company has sustained significant losses from operations, has negative cash flows, and has an ongoing requirement for capital investment to explore its mineral properties. As at February 28, 2018, the Company had working capital of $4,567,471 compared to working capital of $1,270,168 as at May 31, 2017. On July 6, 2017, the Company closed a non-brokered private placement equity financing and issued 6,200,000 common shares at a price of $0.75 per common share for gross proceeds of $4,650,000. On December 7, 2017, the Company closed a non-brokered private placement equity financing and issued 2,829,130 common shares at a price of $1.15 per common share for gross proceeds of $3,253,499 and 1,574,803 common shares at a price of $1.27 per common share for gross proceeds of $2,000,000. Based on its current plans, budgeted expenditures, and cash requirements, the Company has sufficient cash to finance its current plans for the 12 months from the date the condensed interim consolidated financial statements are issued.
The Company expects that it will need to raise substantial additional capital to accomplish its business plan over the next several years. There is no assurance that additional capital or other types of financing will be available if needed or that these financings will be on terms at least as favourable to the Company as those previously obtained, or at all. Should such financing not be available in that time-frame, the Company will be required to reduce its activities and will not be able to carry out all of its presently planned exploration and development activities on its currently anticipated scheduling.
These condensed interim consolidated financial statements do not include any adjustments to the amounts and classification of assets and liabilities that might be necessary should the Company be unable to continue in business.
All currency amounts are stated in Canadian dollars unless noted otherwise.
| 7 |
| 2. | SIGNIFICANT ACCOUNTING POLICIES |
Basis of presentation
These unaudited condensed interim consolidated financial statements have been prepared in accordance with accounting principles generally accepted in the United States (“U.S. GAAP”) for interim financial information and with the instructions to Form 10-Q and Article 10 of Regulation S-X under the Securities Exchange Act of 1934, as amended. Accordingly, they do not include all of the information and footnotes required by U.S. GAAP for annual financial statements. These unaudited condensed interim consolidated financial statements should be read in conjunction with the audited consolidated financial statements for the year ended May 31, 2017 as filed in our Annual Report on Form 10-K. In the opinion of the Company’s management these financial statements reflect all adjustments, consisting of normal recurring adjustments, necessary to present fairly the Company’s financial position at February 28, 2018 and the results of its operations for the nine months then ended. Operating results for the nine months ended February 28, 2018 are not necessarily indicative of the results that may be expected for the year ending May 31, 2018. The 2017 year-end balance sheet data was derived from audited financial statements but does not include all disclosures required by U.S. GAAP.
The preparation of financial statements in conformity with U.S. GAAP requires management to make judgments, estimates and assumptions that affect the reported amounts of assets and liabilities and disclosure of contingent assets and liabilities at the date of the financial statements, and the reported amounts of revenues and expenses during the period. These judgments, estimates and assumptions are continuously evaluated and are based on management’s experience and knowledge of the relevant facts and circumstances. While management believes the estimates to be reasonable, actual results could differ from those estimates and could impact future results of operations and cash flows.
Basis of consolidation
These unaudited condensed interim consolidated financial statements include the accounts of the Company and its wholly-owned subsidiaries (collectively, the “Group”), Corvus Gold (USA) Inc. (“Corvus USA”) (a Nevada corporation), Corvus Nevada (a Nevada corporation), Raven Gold (an Alaska corporation), SoN Land and Water LLC (“SoN”) (a Nevada limited liability company) and Mother Lode Mining Company LLC (a Nevada limited liability company). All intercompany transactions and balances were eliminated upon consolidation.
Loss per share
Basic loss per share is calculated using the weighted average number of common shares outstanding during the period. The Company uses the treasury stock method to compute the dilutive effect of options, warrants and similar instruments. Under this method, the dilutive effect on earnings (loss) per share is calculated presuming the exercise of outstanding options, warrants and similar instruments. It assumes that the proceeds of such exercise would be used to repurchase common shares at the average market price during the period. However, the calculation of diluted loss per share excludes the effects of various conversions and exercise of options and warrants that would be anti-dilutive. For the period ended February 28, 2018, 9,861,900 outstanding stock options (2017 – 8,846,900) were not included in the calculation of diluted earnings (loss) per share as their inclusion was anti-dilutive.
Recent accounting pronouncements
The Company continually assesses any new accounting pronouncements to determine their applicability. When it is determined that a new accounting pronouncement affects the Company's financial reporting, the Company undertakes a study to determine the consequences of the change to its consolidated financial statements and assures that there are proper controls in place to ascertain that the Company’s consolidated financial statements properly reflect the change.
In May 2014, the Financial Accounting Standards Board (“FASB”) issued Accounting Standards Updates (“ASU”) No. 2014-09, Revenue from Contracts with Customers. ASU 2014-09 has been modified multiple times since its initial release. This ASU outlines a single comprehensive model for entities to use in accounting for revenue arising from contracts with customers and will replace most existing revenue recognition guidance in U.S. GAAP when it becomes effective. ASU 2014-09, as amended, becomes effective for annual reporting periods beginning after December 15, 2017. Early adoption is permitted. The Company is currently evaluating the impact that this standard will have on its financial statements and related disclosures, which are expected to be insignificant until the Company begins to generate revenue. The standard permits the use of either the retrospective or cumulative effect transition method. The Company has not yet selected a transition method.
| 8 |
In March 2016, the FASB issued ASU No. 2016-02, Leases. The main difference between the provisions of ASU No. 2016-02 and previous U.S. GAAP is the recognition of right-of-use assets and lease liabilities by lessees for those leases classified as operating leases under previous U.S. GAAP. ASU No. 2016-02 retains a distinction between finance leases and operating leases, and the recognition, measurement, and presentation of expenses and cash flows arising from a lease by a lessee have not significantly changed from previous U.S. GAAP. For leases with a term of 12 months or less, a lessee is permitted to make an accounting policy election by class of underlying asset not to recognize right-of-use assets and lease liabilities. The accounting applied by a lessor is largely unchanged from that applied under previous U.S. GAAP. In transition, lessees and lessors are required to recognize and measure leases at the beginning of the earliest period presented using a modified retrospective approach. This ASU is effective for public business entities in fiscal years, and interim periods within those fiscal years, beginning after December 15, 2018. Early adoption is permitted as of the beginning of any interim or annual reporting period. The Company has not yet determined the effect of the standard on its ongoing reporting.
In March 2016, the FASB issued ASU No. 2016-04, Liabilities-Extinguishment of Liabilities: Recognition of Breakage for Certain Prepaid Stored Value Products. ASU No. 2016-04 contains specific guidance for the derecognition of prepaid stored-value product liabilities within the scope of this ASU. This ASU is effective for public entities for annual and interim periods beginning after December 15, 2017. Early adoption is permitted as of the beginning of any interim or annual reporting period. The Company does not expect this ASU to have a material effect on its consolidated financial statements and related disclosures.
In June 2016, the FASB issued ASU No. 2016-13, Credit Losses, Measurement of Credit Losses on Financial Instruments. ASU No. 2016-13 significantly changes how entities will measure credit losses for most financial assets and certain other instruments that are not measured at fair value through net income. The standard will replace the current incurred loss approach with an expected loss model for instruments measured at amortized cost. Entities will apply the standard's provisions as a cumulative-effect adjustment to retained earnings as of the beginning of the first reporting period in which the guidance is effective. This ASU is effective for public entities for annual and interim periods beginning after December 15, 2019. Early adoption is permitted for all entities for annual periods beginning after December 15, 2018, and interim periods therein. The Company has not yet determined the effect of this standard on its ongoing reporting.
In August 2016, the FASB issued ASU No. 2016-15, Statement of Cash Flows - Classification of Certain Cash Receipts and Cash Payments. ASU No. 2016-15 is intended to reduce diversity in how certain cash receipts and cash payments are presented in the statement of cash flows. The new guidance clarifies the classification of cash activity related to debt prepayment or debt extinguishment costs, settlement of zero-coupon debt instruments, contingent consideration payments made after a business combination, proceeds from the settlement of insurance claims, proceeds from the settlement of corporate and bank-owned life insurance policies, distributions received from equity-method investments, and beneficial interests in securitization transactions. The guidance also describes a predominance principle pursuant to which cash flows with aspects of more than one class that cannot be separated should be classified based on the activity that is likely to be the predominant source or use of cash flow. This ASU is effective for public entities for annual and interim periods beginning after December 15, 2017. Early adoption is permitted as of the beginning of any interim or annual reporting period. The Company is currently evaluating the impact this standard will have on its financial statements and related disclosures, but does not expect it to have a material effect on the Company's consolidated financial statements and related disclosures.
In October 2016, the FASB issued ASU No. 2016-16, Income Taxes: Intra-Entity Transfers of Assets Other Than Inventory. ASU 2016-16 requires entities to account for the income tax effects of intercompany sales and transfers of assets other than inventory when the transfer occurs rather than current guidance which requires companies to defer the income tax effects of intercompany transfers of assets until the asset has been sold to an outside party or otherwise recognized. This ASU is effective for public entities for annual and interim periods beginning after December 15, 2017. Early adoption is permitted as of the beginning of any interim or annual reporting period. The Company is currently evaluating the impact this standard will have on its financial statements and related disclosures.
In November 2016, the FASB issued ASU No. 2016-18, Statement of Cash Flows - Restricted Cash. ASU 2016-18 requires entities to show the changes in the total of cash, cash equivalents, restricted cash and restricted cash equivalents in the statement of cash flows. When cash, cash equivalents, restricted cash and restricted cash equivalents are presented in more than one line item on the balance sheet, a reconciliation of the totals in the statement of cash flows to the related captions in the balance sheet is required. This ASU is effective for public entities for annual and interim periods beginning after December 15, 2017. Early adoption is permitted as of the beginning of any interim or annual reporting period. The Company is currently evaluating the impact this standard will have on its financial statements and related disclosures.
| 9 |
In May 2017, the FASB issued ASU 2017-09, Scope of Modification Accounting. ASU 2017-09 clarifies the guidance on when to apply modification accounting under ASC 718, Compensation-Stock Compensation for changes to the terms or conditions of share-based payment awards. The amendments are effective for annual reporting periods, and interim periods within those annual periods, beginning after December 15, 2017, and should be applied prospectively. Early adoption is permitted. The Company is currently evaluating the impact this standard will have on its financial statements and related disclosures, but does not expect it to have a material effect on the Company’s consolidated financial statements and related disclosures.
| 3. | PROPERTY AND EQUIPMENT |
| Computer Equipment | Vehicles | Tent | Total | |||||||||||||
| Cost | ||||||||||||||||
| Balance, May 31, 2017 | $ | 78,341 | $ | 92,094 | $ | 67,500 | $ | 237,935 | ||||||||
| Additions | 7,710 | - | - | 7,710 | ||||||||||||
| Currency translation adjustments | (3,073 | ) | (4,714 | ) | (3,455 | ) | (11,242 | ) | ||||||||
| Balance, February 28, 2018 | $ | 82,978 | $ | 87,380 | $ | 64,045 | $ | 234,403 | ||||||||
| Depreciation | ||||||||||||||||
| Balance, May 31, 2017 | $ | 53,544 | $ | 78,466 | $ | 36,396 | $ | 168,406 | ||||||||
| Depreciation for the period | 6,221 | 2,877 | 4,379 | 13,477 | ||||||||||||
| Currency translation adjustments | (2,216 | ) | (3,984 | ) | (1,815 | ) | (8,015 | ) | ||||||||
| Balance, February 28, 2018 | $ | 57,549 | $ | 77,359 | $ | 38,960 | $ | 173,868 | ||||||||
| Carrying amounts | ||||||||||||||||
| Balance, May 31, 2017 | $ | 24,797 | $ | 13,628 | $ | 31,104 | $ | 69,529 | ||||||||
| Balance, February 28, 2018 | $ | 25,429 | $ | 10,021 | $ | 25,085 | $ | 60,535 | ||||||||
| 4. | MINERAL PROPERTIES |
The Company had the following activity related to capitalized acquisition costs:
| North Bullfrog | Mother Lode | Total | ||||||||||
| (note 4a)) | (note 4b)) | |||||||||||
| Balance, May 31, 2017 | $ | 4,527,740 | $ | - | $ | 4,527,740 | ||||||
| Acquisition costs | ||||||||||||
| Cash payments (note 4a)(ii)(1)) | 38,384 | - | 38,384 | |||||||||
| Shares issued (notes 4a)(ii)(1), 4b) and 5) | 37,000 | 810,000 | 847,000 | |||||||||
| Asset retirement obligations | - | 23,918 | 23,918 | |||||||||
| Currency translation adjustments | (231,710 | ) | (38,805 | ) | (270,515 | ) | ||||||
| Balance, February 28, 2018 | $ | 4,371,414 | $ | 795,113 | $ | 5,166,527 | ||||||
| 10 |
The following table presents costs incurred for exploration and evaluation activities for the nine months ended February 28, 2018:
| North Bullfrog | Mother Lode | Total | ||||||||||
| (note 4a)) | (note 4b)) | |||||||||||
| Exploration costs: | ||||||||||||
| Assay | $ | 44,148 | $ | 576,806 | $ | 620,954 | ||||||
| Drilling | (3,265 | ) | 1,423,671 | 1,420,406 | ||||||||
| Equipment rental | 15,698 | 65,678 | 81,376 | |||||||||
| Field costs | 32,121 | 236,373 | 268,494 | |||||||||
| Geological/ Geophysical | 66,473 | 456,948 | 523,421 | |||||||||
| Land maintenance & tenure | 267,977 | 125,699 | 393,676 | |||||||||
| Permits | 6,395 | 92,254 | 98,649 | |||||||||
| Studies | 473,213 | 115,415 | 588,628 | |||||||||
| Travel | 10,243 | 69,537 | 79,780 | |||||||||
| Total expenditures for the period | $ | 913,003 | $ | 3,162,381 | $ | 4,075,384 | ||||||
The following table presents costs incurred for exploration and evaluation activities for the nine months ended February 28, 2017:
| North Bullfrog | Total | |||||||
| (note 4a)) | ||||||||
| Exploration costs: | ||||||||
| Assay | $ | 453,955 | $ | 453,955 | ||||
| Drilling | 757,628 | 757,628 | ||||||
| Equipment rental | 51,543 | 51,543 | ||||||
| Field costs | 119,438 | 119,438 | ||||||
| Geological/ Geophysical | 231,923 | 231,923 | ||||||
| Land maintenance & tenure | 282,104 | 282,104 | ||||||
| Permits | 26,928 | 26,928 | ||||||
| Studies | 129,356 | 129,356 | ||||||
| Travel | 54,361 | 54,361 | ||||||
| Total expenditures for the period | $ | 2,107,236 | $ | 2,107,236 | ||||
| a) | North Bullfrog Project, Nevada |
The Company’s North Bullfrog project consists of certain leased patented lode mining claims and federal unpatented mining claims owned 100% by the Company.
| (i) | Interests acquired from Redstar Gold Corp. |
On October 9, 2009, a US subsidiary of ITH at the time (Corvus Nevada) completed the acquisition of all of the interests of Redstar Gold Corp. (“Redstar”) and Redstar Gold U.S.A. Inc. (“Redstar US”) in the North Bullfrog project, which consisted of the following leases:
| (1) | Pursuant to a mining lease and option to purchase agreement made effective October 27, 2008 between Redstar and an arm’s length limited liability company, Redstar has leased (and has the option to purchase) 12 patented mining claims referred to as the “Connection” property. The ten-year, renewable mining lease requires advance minimum royalty payments (recoupable from production royalties, but not applicable to the purchase price if the option to purchase is exercised) of USD 10,800 (paid) on signing and annual payments for the first three anniversaries of USD 10,800 (paid) and USD 16,200 for every year thereafter (paid to October 27, 2017). Redstar has an option to purchase the property (subject to the net smelter return (“NSR”) royalty below) for USD 1,000,000 at any time during the life of the lease. Production is subject to a 4% NSR royalty, which may be purchased by the lessee for USD 1,250,000 per 1% (USD 5,000,000 for the entire royalty). |
| 11 |
| (2) | Pursuant to a mining lease made and entered into as of May 8, 2006 between Redstar and two arm’s length individuals, Redstar has leased three patented mining claims which form part of the North Bullfrog project holdings. The lease is for an initial term of ten years, and for so long thereafter as mining activities continue on the claims or contiguous claims held by the lessee. The lessee is required to pay advance minimum royalty payments (recoupable from production royalties) of USD 4,000 on execution, USD 3,500 on each of May 8, 2007, 2008 and 2009 (paid), USD 4,500 on May 8, 2010 and each anniversary thereafter, adjusted for inflation (paid to May 8, 2017). The lessor is entitled to receive a 2% NSR royalty on all production, which may be purchased by the lessee for USD 1,000,000 per 1% (USD 2,000,000 for the entire royalty). |
| (3) | Pursuant to a mining lease made and entered into as of May 8, 2006 between Redstar and an arm’s length private Nevada corporation, Redstar has leased two patented mining claims which form part of the North Bullfrog project holdings. The lease is for an initial term of ten years, and for so long thereafter as mining activities continue on the claims or contiguous claims held by the lessee. The lessee is required to pay advance minimum royalty payments (recoupable from production royalties) of USD 2,000 on execution, USD 2,000 on each of May 8, 2007, 2008 and 2009 (paid), USD 3,000 on May 8, 2010 and each anniversary thereafter, adjusted for inflation (paid to May 8, 2017). The lessor is entitled to receive a 3% NSR royalty on all production, which may be purchased by the lessee for USD 850,000 per 1% (USD 2,550,000 for the entire royalty). On May 29, 2014, the parties signed a First Amendment Agreement whereby the Lease is amended to provide that in addition to the Advance Minimum Royalty payments payable in respect of the Original Claims, the lessee will now pay to the lessor Advance Minimum Royalty payments in respect of the Yellow Rose Claims of USD 2,400 on execution, USD 2,400 on each of May 29, 2015, 2016 and 2017 (paid to May 29, 2017), USD 3,600 on May 29, 2018 and each anniversary thereafter. The Lessor is entitled to receive a 3% NSR royalty on all production from the Yellow Rose claims, which may be purchased by the lessee for USD 770,000 per 1% (USD 2,310,000 for the entire royalty). |
| (4) | Pursuant to a mining lease made and entered into as of May 16, 2006 between Redstar and an arm’s length individual, Redstar has leased 12 patented mineral claims which form part of the North Bullfrog project holdings. The lease is for an initial term of ten years, and for so long thereafter as mining activities continue on the claims or contiguous claims held by the lessee. The lessee is required to pay advance minimum royalty payments (recoupable from production royalties) of USD 20,500 on execution and USD 20,000 on each anniversary thereafter (paid to May 16, 2017). The lessor is entitled to receive a 4% NSR royalty on all production, which may be purchased by the lessee for USD 1,000,000 per 1% (USD 4,000,000 for the entire royalty). |
| (5) | Pursuant to a mining lease made and entered into as of May 22, 2006 between Redstar and two arm’s length individuals, Redstar has leased three patented mineral claims which form part of the North Bullfrog project holdings. The lease is for an initial term of ten years, and for so long thereafter as mining activities continue on the claims or contiguous claims held by the lessee. The lessee is required to pay advance minimum royalty payments (recoupable from production royalties) of USD 8,000 on execution, USD 4,800 on each of May 22, 2007, 2008 and 2009 (paid), USD 7,200 on May 22, 2010 and each anniversary thereafter, adjusted for inflation (paid to May 22, 2017). The lessor is entitled to receive a 2% NSR royalty on all production, which may be purchased by the lessee for USD 1,000,000 per 1% (USD 2,000,000 for the entire royalty). |
| (6) | Pursuant to a mining lease made and entered into as of June 16, 2006 between Redstar and an arm’s length individual, Redstar has leased one patented mineral claims which form part of the North Bullfrog project holdings. The lease is for an initial term of ten years, and for so long thereafter as mining activities continue on the claims or contiguous claims held by the lessee. The lessee is required to pay advance minimum royalty payments (recoupable from production royalties) of USD 2,000 on execution, USD 2,000 on each of June 16, 2007, 2008 and 2009 (paid), USD 3,000 on June 16, 2010 and each anniversary thereafter, adjusted for inflation (paid to June 16, 2017). The lessor is entitled to receive a 2% NSR royalty on all production, which may be purchased by the lessee for USD 1,000,000 per 1% (USD 2,000,000 for the entire royalty). |
As a consequence of the acquisition of Redstar and Redstar US’s interest in the foregoing leases, Corvus Nevada is now the lessee under all of such leases.
| 12 |
| (ii) | Interests acquired directly by Corvus Nevada |
| (1) | Pursuant to a mining lease and option to purchase agreement made effective December 1, 2007 between Corvus Nevada and a group of arm’s length limited partnerships, Corvus Nevada has leased (and has the option to purchase) patented mining claims referred to as the “Mayflower” claims which form part of the North Bullfrog project. The terms of the lease/option are as follows: |
Terms: Initial term of five years, commencing December 1, 2007, with the option to extend the lease for an additional five years. The lease will continue for as long thereafter as the property is in commercial production or, alternatively, for an additional three years if Corvus Nevada makes advance minimum royalty payments of USD 100,000 per year (which are recoupable against actual production royalties). Pursuant to an extension agreement dated January 15, 2016 and fully executed and effective as of November 22, 2017, the parties agreed to extend the lease and option granted for an additional ten years with the same lease payment terms.
Lease Payments: USD 5,000 (paid) and 25,000 common shares of ITH (delivered) following regulatory acceptance of the transaction; and an additional USD 5,000 and 20,000 common shares on each of the first through fourth lease anniversaries (paid and issued). Pursuant to an agreement with the lessors, in lieu of the 20,000 ITH common shares due December 1, 2010, Corvus Nevada paid USD 108,750 on November 10, 2010 and delivered 46,250 common shares of the Company on December 2, 2010. If Corvus Nevada elects to extend the lease for a second five-year term, it will pay USD 10,000 and deliver 50,000 common shares of ITH upon election being made, and an additional 50,000 common shares of ITH on each of the fifth through ninth anniversaries (USD 10,000 paid on October 31, 2012 and 50,000 common shares of ITH delivered on October 25, 2012 paid with cash of $126,924; USD 10,000 paid on November 13, 2013 and 50,000 common shares of ITH delivered on November 25, 2013 paid with cash of $35,871; USD 10,000 paid on November 17, 2014 and 50,000 common shares of ITH delivered on November 7, 2014 paid with cash of $21,200; USD 10,000 paid on November 23, 2015 and 50,000 common shares of ITH delivered on November 5, 2015 paid with cash of $19,237; USD 10,000 paid on November 17, 2016 and 50,000 common shares of ITH, purchased for $53,447 in the market by the Company, were delivered on November 10, 2016; and USD 10,000 paid on November 22, 2017 and 50,000 common shares of ITH, purchased for $25,655 in the market by the Company, were delivered on November 30, 2017).
Anti-Dilution: Pursuant to an amended agreement agreed to by the lessors in March 2015, the Company shall deliver a total of 85,000 common shares (issued) of the Company for the years 2011 to 2014 (2011: 10,000 common shares; 2012 to 2014: 25,000 common shares each year). All future payments will be satisfied by the delivery of an additional ½ common shares of the Company for each of the ITH common shares due per the original agreement (issued 25,000 common shares of the Company on November 18, 2015; 25,000 shares of the Company on November 18, 2016 and 25,000 shares of the Company on November 30, 2017).
Work Commitments: USD 100,000 per year for the first three years (incurred), USD 200,000 per year for the years 4 – 6 (incurred) and USD 300,000 for the years 7 – 10 (incurred). Excess expenditures in any year may be carried forward. If Corvus Nevada does not incur the required expenditures in year one, the deficiency is required to be paid to the lessors.
Retained Royalty: Corvus Nevada will pay the lessors a NSR royalty of 2% if the average gold price is USD 400 per ounce or less, 3% if the average gold price is between USD 401 and USD 500 per ounce and 4% if the average gold price is greater than USD 500 per ounce.
| (2) | Pursuant to a mining lease and option to purchase made effective March 1, 2011 between Corvus Nevada and an arm’s length individual, Corvus Nevada has leased, and has the option to purchase, two patented mineral claims which form part of the North Bullfrog project holdings. The lease is for an initial term of ten years, subject to extension for an additional ten years (provided advance minimum royalties are timely paid), and for so long thereafter as mining activities continue on the claims. The lessee is required to pay advance minimum royalty payments (recoupable from production royalties, but not applicable to the purchase price if the option to purchase is exercised) of USD 20,000 on execution (paid), USD 25,000 on each of March 1, 2012 (paid), 2013 (paid) and 2014 (paid), USD 30,000 on March 1, 2015 and each anniversary thereafter (paid to March 1, 2018), adjusted for inflation. The lessor is entitled to receive a 2% NSR royalty on all production. The lessee may purchase the royalty for USD 1,000,000 per 1%. If the lessee purchases the entire royalty (USD 2,000,000) the lessee will also acquire all interest of the lessor in the subject property. |
| (3) | Pursuant to a purchase agreement made effective March 28, 2013, Corvus Nevada agreed to purchase the surface rights of five patented mining claims owned by two arm’s length individuals for USD 160,000 paid on closing (March 28, 2013). The terms include payment by Corvus Nevada of a fee of USD 0.02 per ton of overburden to be stored on the property, subject to payment for a minimum of 12 million short tons. The minimum tonnage fee (USD 240,000) bears interest at 4.77% per annum from closing and is evidenced by a promissory note due on the sooner of the commencing of use of the property for waste materials storage or December 31, 2015 (balance paid December 17, 2015). As a result, the Company recorded $406,240 (USD 400,000) in acquisition costs with $157,408 paid in cash and the remaining $248,832 (USD 240,000) in promissory note payable during the year ended May 31, 2013. |
| 13 |
| (4) | In December 2013, SoN completed the purchase of a parcel of land approximately 30 kilometres north of the North Bullfrog project which carries with it 1,600 acre feet of irrigation water rights. The cost of the land and associated water rights was cash payment of $1,100,118 (USD 1,034,626). |
| (5) | On March 30, 2015, Lunar Landing, LLC signed a lease agreement with Corvus Nevada to lease private property containing the three patented Sunflower claims to Corvus Nevada, which are adjacent to the Yellow Rose claims leased in 2014. The term of the lease is three years with provision to extend the lease for an additional seven years, and an advance minimum royalty payment of USD 5,000 per year with USD 5,000 paid upon signing (paid to March 2018). The lease includes a 4% NSR royalty on production, with an option to purchase the royalty for USD 500,000 per 1% or USD 2,000,000 for the entire 4% royalty. The lease also includes the option to purchase the property for USD 300,000. |
| b) | Mother Lode Property, Nevada |
Pursuant to a purchase agreement made effective June 9, 2017 between Corvus Nevada and Goldcorp USA, Inc. (“Goldcorp USA”), Corvus Nevada has acquired 100% of the Mother Lode property (the “Mother Lode Property”). In addition, Corvus Nevada staked two additional adjacent claim blocks to the Mother Lode Property. In connection with the acquisition, the Company issued 1,000,000 common shares at a price of $0.81 per common share to Goldcorp USA (note 5). The Mother Lode Property is subject to an NSR in favour of Goldcorp USA. The NSR pays 1% from production at the Mother Lode Property when the price of gold is less than USD 1,400 per ounce and an additional 1% NSR for a total of 2% NSR when gold price is greater than or equal to USD 1,400 per ounce.
Acquisitions
The acquisition of title to mineral properties is a detailed and time-consuming process. The Company has taken steps, in accordance with industry norms, to verify title to mineral properties in which it has an interest. Although the Company has taken every reasonable precaution to ensure that legal title to its properties is properly recorded in the name of the Company (or, in the case of an option, in the name of the relevant optionor), there can be no assurance that such title will ultimately be secured.
Environmental Expenditures
The operations of the Company may in the future be affected from time to time in varying degrees by changes in environmental regulations, including those for future site restoration and reclamation costs. Both the likelihood of new regulations and their overall effect upon the Company vary greatly and are not predictable. The Company’s policy is to meet or, if possible, surpass standards set by relevant legislation by application of technically proven and economically feasible measures.
Environmental expenditures that relate to ongoing environmental and reclamation programs are charged against earnings as incurred or capitalized and amortized depending on their future economic benefits. Estimated future site reclamation costs, when the ultimate liability is reasonably determinable, are charged against earnings over the estimated remaining life of the related business operation, net of expected recoveries.
The Company estimates that the fair value of the liability for asset retirement as a result of exploration activities is $346,682 (USD 270,000) (May 31, 2017 - $340,176 (USD 252,000)). The fair value of the liability was determined to be equal to the estimated reclamation costs. Due to the early stage of the projects, and that extractive activities have not yet begun, the Company is unable to predict with any precision the timing of the cash flow related to the reclamation activities.
| 14 |
| 5. | SHARE CAPITAL |
Authorized
Unlimited common shares without par value.
Share issuances
During the period ended February 28, 2018:
| a) | On June 9, 2017, the Company issued 1,000,000 common shares in connection with the acquisition of the Mother Lode Property (note 4b)), with a fair value of $810,000. The Company paid an additional $7,703 in share issuance costs. |
| b) | On July 6, 2017, the Company closed a non-brokered private placement equity financing and issued 6,200,000 common shares at a price of $0.75 per common share for gross proceeds of $4,650,000. In connection with the financing, the Company paid an additional $14,788 in share issuance costs. |
| c) | On November 30, 2017, the Company issued 25,000 common shares in connection with the lease on the Mayflower property (note 4a)(ii)(1)), with a fair value of $37,000. |
| d) | An aggregate of 256,660 common shares were issued on exercise of 256,660 stock options for gross proceeds of $169,863. |
| e) | On December 7, 2017, the Company closed a non-brokered private placement equity financing and issued 2,829,130 common shares at a price of $1.15 per common share for gross proceeds of $3,253,499, and 1,574,803 common shares at a price of $1.27 per common share for gross proceeds of $2,000,000. In connection with the financing, the Company paid an additional $84,857 in share issuance costs. |
Stock options
Stock options awarded to employees and non-employees by the Company are measured and recognized in the Condensed Interim Consolidated Statement of Operations and Comprehensive Loss over the vesting period.
The Company has adopted an incentive stock option plan, first adopted in 2010 and then amended in 2013 (the “Amended 2010 Plan”). The essential elements of the Amended 2010 Plan provide that the aggregate number of common shares of the Company’s share capital that may be made issuable pursuant to options granted under the Amended 2010 Plan (together with any other shares which may be issued under other share compensation plans of the Company) may not exceed 10% of the number of issued common shares of the Company at the time of the granting of the options. Options granted under the Amended 2010 Plan will have a maximum term of ten years. The exercise price of options granted under the Amended 2010 Plan will not be less than the greater of the market price of the common shares (as defined by TSX, currently defined as the 5 day volume weighted average price for the five trading days immediately preceding the date of grant) or the closing market price of the Company’s common shares for the trading day immediately preceding the date of grant, or such other price as may be agreed to by the Company and accepted by the TSX. Options granted under the Amended 2010 Plan vest immediately, unless otherwise determined by the directors at the date of grant.
| 15 |
A summary of the status of the stock option plan as of February 28, 2018, and May 31, 2017, and changes during the periods are presented below:
| Nine months ended February 28, 2018 | Year ended May 31, 2017 | |||||||||||||||
| Number of Options | Weighted Average Exercise Price | Number of Options | Weighted Average Exercise Price | |||||||||||||
| Balance, beginning of the period | 8,846,900 | $ | 0.87 | 7,981,000 | $ | 0.85 | ||||||||||
| Granted | 1,840,000 | 0.77 | 1,135,000 | 1.02 | ||||||||||||
| Exercised | (256,660 | ) | (0.66 | ) | (200,000 | ) | (0.50 | ) | ||||||||
| Forfeited | (568,340 | ) | (0.93 | ) | (69,100 | ) | (0.93 | ) | ||||||||
| Balance, end of the period | 9,861,900 | $ | 0.85 | 8,846,900 | $ | 0.87 | ||||||||||
The weighted average remaining contractual life of options outstanding at February 28, 2018 was 1.94 years (May 31, 2017 – 1.85 years).
Stock options outstanding are as follows:
| February 28, 2018 | May 31, 2017 | |||||||||||||||||||||||
| Expiry Date | Exercise Price | Number of Options | Exercisable at Period- End | Exercise Price | Number of Options | Exercisable at Year- End | ||||||||||||||||||
| November 17, 2016* | $ | - | - | - | $ | 0.67 | 210,000 | 210,000 | ||||||||||||||||
| May 1, 2017* | $ | - | - | - | $ | 0.73 | 50,000 | 50,000 | ||||||||||||||||
| May 29, 2017* | $ | - | - | - | $ | 0.92 | 300,000 | 300,000 | ||||||||||||||||
| September 19, 2017* | $ | 0.96 | 1,966,900 | 1,966,900 | $ | 0.96 | 2,016,900 | 2,016,900 | ||||||||||||||||
| October 29, 2017 | $ | - | - | - | $ | 0.96 | 100,000 | 100,000 | ||||||||||||||||
| August 16, 2018 | $ | 0.76 | 2,095,000 | 2,095,000 | $ | 0.76 | 2,120,000 | 2,120,000 | ||||||||||||||||
| September 8, 2019 | $ | 1.40 | 1,250,000 | 1,250,000 | $ | 1.40 | 1,265,000 | 1,265,000 | ||||||||||||||||
| September 9, 2020 | $ | 0.46 | 625,000 | 625,000 | $ | 0.46 | 640,000 | 426,240 | ||||||||||||||||
| November 13, 2020 | $ | 0.49 | 1,000,000 | 1,000,000 | $ | 0.49 | 1,010,000 | 672,660 | ||||||||||||||||
| June 22, 2018 | $ | - | - | - | $ | 1.02 | 50,000 | 33,300 | ||||||||||||||||
| September 15, 2021 | $ | 0.91 | 1,085,000 | 722,610 | $ | 0.91 | 1,085,000 | 361,305 | ||||||||||||||||
| July 31, 2022 | $ | 0.77 | 1,840,000 | - | $ | - | - | - | ||||||||||||||||
| 9,861,900 | 7,659,510 | 8,846,900 | 7,555,405 | |||||||||||||||||||||
*The Company’s share trading policy (the “Policy”) requires that all restricted persons and others who are subject to the Policy refrain from conducting any transactions involving the purchase or sale of the Company’s securities, during the period in any quarter commencing 30 days prior to the scheduled issuance of the next quarter or year-end public disclosure of the financial results as well as when there is material data on hand. In accordance with the terms of the Amended 2010 Plan, if stock options are set to expire during a restricted period and are not exercised prior to any such restriction, they will not expire but instead will be available for exercise for ten days after such restrictions are lifted.
The Company uses the fair value method for determining stock-based compensation for all options granted during the periods. The fair value of options granted was $951,067 (2017 - $691,819), determined using the Black-Scholes option pricing model based on the following weighted average assumptions:
| For the nine months ended February 28, | 2018 | 2017 | ||||||
| Risk-free interest rate | 1.65 | % | 0.71 | % | ||||
| Expected life of options (in years) | 5 | 4.87 | ||||||
| Annualized volatility | 79.14 | % | 85.96 | % | ||||
| Dividend yield | 0 | % | 0 | % | ||||
| Exercise price | $ | 0.77 | $ | 0.91 | ||||
| Fair value per share | $ | 0.52 | $ | 0.61 | ||||
Annualized volatility was determined by reference to historic volatility of the Company.
| 16 |
Stock-based compensation has been allocated to the same expenses as cash compensation paid to the same employees or consultants, as follows:
| For the nine months ended February 28, | 2018 | 2017 | ||||||
| Consulting fees | $ | 231,065 | $ | 233,281 | ||||
| Exploration expenditures – Geological/geophysical | 41,166 | 23,366 | ||||||
| Investor relations | 69,817 | 55,431 | ||||||
| Professional fees | 5,511 | 5,112 | ||||||
| Wages and benefits | 161,306 | 136,598 | ||||||
| $ | 508,865 | $ | 453,788 | |||||
| 6. | RELATED PARTY TRANSACTIONS |
The Company entered into the following transactions with related parties:
| For the nine months ended February 28, | 2018 | 2017 | ||||||
| Consulting fees to CFO | $ | 101,667 | $ | 90,000 | ||||
| Wages and benefits to CEO and COO | 703,888 | 638,564 | ||||||
| Directors fees (included in consulting fees) | 104,250 | 101,250 | ||||||
| Fees to former Vice President of Corporate Communications (included in investor relations) | - | 137,500 | ||||||
| Stock-based compensation to related parties | 377,128 | 372,155 | ||||||
| $ | 1,286,933 | $ | 1,339,469 | |||||
As at February 28, 2018, included in accounts payable and accrued liabilities was $7,053 (May 31, 2017 – $18,271) in expenses owing to companies related to officers and officers of the Company.
These amounts were unsecured, non-interest bearing and had no fixed terms or terms of repayment. Accordingly, fair value could not be readily determined.
The Company has also entered into change of control agreements with officers of the Company. In the case of termination, the officers are entitled to an amount equal to a multiple (ranging from two times to three times) of the sum of the annual base salary then payable to the officer, the aggregate amount of bonus(es) (if any) paid to the officer within the calendar year immediately preceding the Effective Date of Termination, and an amount equal to the vacation pay which would otherwise be payable for the one year period next following the Effective Date of Termination.
| 7. | GEOGRAPHIC SEGMENTED INFORMATION |
The Company operates in one industry segment, the Mineral Resources industry, and in two geographical segments, Canada and the United States. All current exploration activities are conducted in the United States. The significant asset categories identifiable with these geographical areas are as follows:
| Canada | United States | Total | ||||||||||
| February 28, 2018 | ||||||||||||
| Capitalized acquisition costs | $ | - | $ | 5,166,527 | $ | 5,166,527 | ||||||
| Property and equipment | $ | 12,063 | $ | 48,472 | $ | 60,535 | ||||||
| May 31, 2017 | ||||||||||||
| Capitalized acquisition costs | $ | - | $ | 4,527,740 | $ | 4,527,740 | ||||||
| Property and equipment | $ | 8,367 | $ | 61,162 | $ | 69,529 | ||||||
| 17 |
| For the period ended February 28, | 2018 | 2017 | ||||||
| Net loss for the period – Canada | $ | (1,938,545 | ) | $ | (1,582,642 | ) | ||
| Net loss for the period – United States | (5,175,098 | ) | (3,246,785 | ) | ||||
| Net loss for the period | $ | (7,113,643 | ) | $ | (4,829,427 | ) | ||
| 8. | SUBSIDIARIES |
Significant subsidiaries for the nine months ended February 28, 2018 and 2017 are:
| Country of Incorporation | Principal Activity | The Company’s effective interest for 2018 | The Company’s effective interest for 2017 | |||||||||
| Corvus Gold (USA) Inc. | USA | Holding company | 100 | % | 100 | % | ||||||
| Raven Gold Alaska Inc. | USA | Exploration company | 100 | % | 100 | % | ||||||
| Corvus Gold Nevada Inc. | USA | Exploration company | 100 | % | 100 | % | ||||||
| SoN Land & Water LLC | USA | Exploration company | 100 | % | 100 | % | ||||||
| Mother Lode Mining Company LLC | USA | Exploration company | 100 | % | N/A | |||||||
| 9. | SUPPLEMENTAL CASH FLOW INFORMATION |
| For the nine months ended February 28, | 2018 | 2017 | ||||||
| Supplemental cash flow information | ||||||||
| Interest paid | $ | - | $ | - | ||||
| Income taxes paid (received) | $ | - | $ | - | ||||
| Non-cash financing and investing transactions | ||||||||
| Shares issued to acquire mineral properties | $ | 847,000 | $ | 18,000 | ||||
| Reclassification of contributed surplus on exercise of stock options | $ | 123,302 | $ | - | ||||
| 18 |
ITEM 2. MANAGEMENT’S DISCUSSION AND ANALYSIS OF FINANCIAL CONDITION AND RESULTS OF OPERATIONS
The following discussion and analysis should be read in conjunction with our unaudited condensed interim consolidated financial statements for the nine months ended February 28, 2018, and the related notes thereto, which have been prepared in accordance with generally accepted accounting principles in the United States (“U.S. GAAP”). This discussion and analysis contains forward-looking statements and forward-looking information that involve risks, uncertainties and assumptions. Our actual results may differ materially from those anticipated in these forward-looking statements and information as a result of many factors. See section heading “Note Regarding Forward-Looking Statements” below. All currency amounts are stated in Canadian dollars unless noted otherwise.
CAUTIONARY NOTE TO U.S. INVESTORS REGARDING ESTIMATES OF MEASURED, INDICATED AND INFERRED RESOURCES AND PROVEN AND PROBABLE RESERVES
Corvus Gold Inc. (“we”, “us”, “our,” “Corvus” or the “Company”) is a mineral exploration company engaged in the acquisition and exploration of mineral properties. The mineral estimates in the Technical Report (as defined below) referenced in this Quarterly Report on Form 10-Q have been prepared in accordance with the requirements of the securities laws in effect in Canada, which differ from the requirements of United States securities laws. As used in the Technical Report referenced in this Quarterly Report on Form 10-Q, the terms “mineral reserve”, “proven mineral reserve” and “probable mineral reserve” are Canadian mining terms as defined in accordance with Canadian National Instrument 43-101 “Standards of Disclosure for Mineral Projects” (“NI 43-101”) and the Canadian Institute of Mining, Metallurgy and Petroleum (the “CIM”) Definition Standards on Mineral Resources and Mineral Reserves, adopted by the CIM Council, as amended. These definitions differ materially from the definitions in the United States Securities and Exchange Commission (“SEC”) Industry Guide 7 (“SEC Industry Guide 7”). Under SEC Industry Guide 7 standards, a “final” or “bankable” feasibility study is required to report reserves, the three-year historical average price is used in any reserve or cash flow analysis to designate reserves, and the primary environmental analysis or report must be filed with the appropriate governmental authority.
In addition, the terms “mineral resource”, “measured mineral resource”, “indicated mineral resource” and “inferred mineral resource” are defined in and required to be disclosed by NI 43-101; however, these terms are not defined terms under SEC Industry Guide 7 and are normally not permitted to be used in reports and registration statements filed with the SEC. Investors are cautioned not to assume that all or any part of a mineral deposit in these categories will ever be converted into reserves. “Inferred Mineral Resources” have a great amount of uncertainty as to their existence, and great uncertainty as to their economic and legal feasibility. It cannot be assumed that all, or any part, of an inferred mineral resource will ever be upgraded to a higher category. Under Canadian rules, estimates of inferred Mineral Resources may not form the basis of feasibility or pre-feasibility studies, except in rare cases. Investors are cautioned not to assume that all or any part of an inferred mineral resource exists or is economically or legally mineable. Disclosure of “contained ounces” in a resource is permitted disclosure under Canadian regulations; however, the SEC normally only permits issuers to report mineralization that does not constitute “reserves” by SEC standards as in place tonnage and grade without reference to unit measures.
Accordingly, information contained in this report and the Technical Report referenced in this report contain descriptions of our mineral deposits that may not be comparable to similar information made public by U.S. companies subject to the reporting and disclosure requirements under the United States federal securities laws and the rules and regulations thereunder.
CAUTIONARY NOTE TO ALL INVESTORS CONCERNING ECONOMIC ASSESSMENTS THAT INCLUDE INFERRED RESOURCES AND HISTORICAL ESTIMATES
The Company currently holds or has the right to acquire interests in an advanced stage exploration project in Nye County, Nevada referred to as the North Bullfrog Project (the “NBP”) and interests in the Mother Lode Property. Mineral resources that are not mineral reserves have no demonstrated economic viability. The preliminary economic assessment included in the Technical Report on the NBP is preliminary in nature and includes “inferred Mineral Resources” that have a great amount of uncertainty as to their existence, and are considered too speculative geologically to have economic considerations applied to them that would enable them to be categorized as mineral reserves. It cannot be assumed that all, or any part, of an inferred mineral resource will ever be upgraded to a higher category. Under Canadian rules, estimates of inferred Mineral Resources may not form the basis of feasibility or pre-feasibility studies. There is no certainty that such inferred Mineral Resources at the NBP will ever be realized. Mineral resources that are not mineral reserves do not have demonstrated economic viability. Investors are cautioned not to assume that all or any part of an inferred mineral resource exists or is economically or legally mineable. Readers should refer to the Technical Report for additional information.
The historic estimates (Inter-Rock Gold Inc. Annual Report 1996, subsequently changed to Inter-Rock Minerals Inc. available on www.sedar.com) for the Mother Lode Property contained in this report should not be relied upon. These estimates are not NI 43-101 compliant. While the Company considers these historical estimates to be relevant to investors as it may indicate the presence of mineralization, a qualified person for the Company has not done sufficient work to classify the historical estimates as current Mineral Resources as defined by NI 43-101 and the Company is not treating these historical estimates as a current mineral resource.
| 19 |
NOTE REGARDING FORWARD-LOOKING STATEMENTS
This Quarterly Report on Form 10-Q and the exhibits attached hereto contain “forward-looking statements” within the meaning of the United States Private Securities Litigation Reform Act of 1995, as amended, and “forward-looking information” within the meaning of applicable Canadian securities legislation, collectively “forward-looking statements”. Such forward-looking statements concern our anticipated results and developments in the operations of the Company in future periods, planned exploration activities, the adequacy of the Company’s financial resources and other events or conditions that may occur in the future. Forward-looking statements are frequently, but not always, identified by words such as “expects,” “anticipates,” “believes,” “intends,” “estimates,” “potential,” “possible” and similar expressions, or statements that events, conditions or results “will,” “may,” “could” or “should” (or the negative and grammatical variations of any of these terms) occur or be achieved. These forward-looking statements may include, but are not limited to, statements concerning:
| · | the Company’s strategies and objectives, both generally and in respect of its specific mineral properties; |
| · | the timing of decisions regarding the timing and costs of exploration programs with respect to, and the issuance of the necessary permits and authorizations required for, the Company’s exploration programs, including for the NBP and the Mother Lode Property; |
| · | the Company’s estimates of the quality and quantity of the Mineral Resources at its mineral properties; |
| · | the timing and cost of planned exploration programs of the Company, and the timing of the receipt of results therefrom; |
| · | the Company’s future cash requirements and use of proceeds of sales; |
| · | general business and economic conditions; |
| · | the Company’s ability to meet its financial obligations as they come due, and the ability to raise the necessary funds to continue operations; |
| · | the Company’s expectation that it will be able to add additional mineral projects of merit to its assets; |
| · | the potential for the existence or location of additional high-grade veins at the NBP, or high-grade mineralization at the Mother Lode Property; |
| · | the potential to expand Company’s existing deposits and discover new deposits; |
| · | the potential for any delineation of higher grade mineralization at the NBP or Mother Lode Property; |
| · | the potential for there to be one or more additional vein zones; |
| · | the potential discovery and delineation of mineral deposits/resources/reserves and any expansion thereof beyond the current estimate; |
| · | the potential for the NBP or the Mother Lode Property mineralization systems to continue to grow and/or to develop into a major new higher-grade, bulk tonnage, Nevada gold discovery; |
| · | the Company’s expectation that it will be able to build itself into a non-operator gold producer with significant carried interests and royalty exposure; |
| · | that the Company will operate at a loss |
| · | that the Company will need to scale back anticipated costs and activities or raise additional funds; |
| · | that the Company will have to raise substantial additional capital to accomplish its business plan over the next couple of years; |
| · | the historic estimates of the Mother Lode Property as an indication of the presence of mineralization; |
| · | the estimated reclamation and asset retirement costs; |
| · | the plans related to the development of the Mother Lode Property and the NBP; and |
| · | the Mother Lode Property work plan and mine development plan/program. |
Such forward-looking statements reflect the Company’s current views with respect to future events and are subject to certain known and unknown risks, uncertainties and assumptions. Many factors could cause actual results, performance or achievements to be materially different from any future results, performance or achievements that may be expressed or implied by such forward-looking statements, including, among others, risks related to:
| · | our requirement of significant additional capital; |
| · | our limited operating history; |
| · | our history of losses; |
| · | cost increases for our exploration and, if warranted, development projects; |
| · | our properties being in the exploration stage; |
| · | mineral exploration and production activities; |
| · | our lack of mineral production from our properties; |
| · | estimates of Mineral Resources; |
| · | changes in mineral resource estimates; |
| · | differences in United States and Canadian mineral reserve and mineral resource reporting; |
| 20 |
| · | our exploration activities being unsuccessful; |
| · | fluctuations in gold, silver and other metal prices; |
| · | our ability to obtain permits and licenses for production; |
| · | government and environmental regulations that may increase our costs of doing business or restrict our operations; |
| · | proposed legislation that may significantly affect the mining industry; |
| · | land reclamation requirements; |
| · | competition in the mining industry; |
| · | equipment and supply shortages; |
| · | tax issues; |
| · | current and future joint ventures and partnerships; |
| · | our ability to attract qualified management; |
| · | the ability to enforce judgment against certain of our Directors; |
| · | currency fluctuations; |
| · | claims on the title to our properties; |
| · | surface access on our properties; |
| · | potential future litigation; |
| · | our lack of insurance covering all our operations; |
| · | our status as a “passive foreign investment company” under US federal tax code; and |
| · | the common shares. |
Should one or more of these risks or uncertainties materialize, or should underlying assumptions prove incorrect, actual results may vary materially from those described herein. This list is not exhaustive of the factors that may affect any of the Company’s forward-looking statements. Forward-looking statements are statements about the future and are inherently uncertain, and actual achievements of the Company or other future events or conditions may differ materially from those reflected in the forward-looking statements due to a variety of risks, uncertainties and other factors, including without limitation those discussed in Part I, Item 1A, Risk Factors, of our Annual Report on Form 10-K, as filed with the SEC on June 29, 2017, which are incorporated herein by reference, as well as other factors described elsewhere in this report and the Company’s other reports filed with the SEC.
The Company’s forward-looking statements contained in this Quarterly Report on Form 10-Q are based on the beliefs, expectations and opinions of management as of the date of this report. The Company does not assume any obligation to update forward-looking statements if circumstances or management’s beliefs, expectations or opinions should change, except as required by law. For the reasons set forth above, investors should not attribute undue certainty to or place undue reliance on forward-looking statements.
Current Business Activities
General
The Company’s material mineral property is the NBP, an advanced exploration stage project in Nevada which has a number of high-priority, bulk tonnage and high-grade vein targets (held through Corvus Nevada, a Nevada subsidiary). In addition to the NBP, the Company has acquired the Mother Lode Property which is located approximately 12 miles to the south east of the NBP. The Mother Lode Property was mined in the late 1980s and has substantial gold mineralization remaining unexploited extending to the north of the existing open pit mine.
The primary focus of the Company will be to leverage its exploration expertise to expand its existing deposits and discover major new gold deposits. Other than with respect to the ongoing exploration of the NBP, the Company’s strategy is to leverage its other non-core assets by maintaining a retained royalty.
Highlights of activities during the period and to the date of this MD&A include:
| · | A technical report prepared in accordance with NI 43-101 titled, “Technical Report and Preliminary Economic Assessment for Combined Mill and Heap Leach Processing at the North Bullfrog Project, Bullfrog Mining District, Nye County, Nevada” (the “Technical Report”) with an effective date of October 31, 2017 was filed on SEDAR on December 15, 2017. |
| · | The Technical Report expanded the Measured and Indicated Mineral Resource categories of the NBP by 30% as compared to the Mineral Resource reported in 2015. |
| · | The updated Mineral Resource identified a Phase I Measured and Indicated Mineral Resource portion with 35 million tonnes containing 904 thousand ounces (“k-ozs”) of gold at an average grade of 0.8 grams per tonne (“g/t”) and 5,459 k-ozs of silver at an average grade of 4.86 g/t, targeted for processing by an oxide mill circuit and a heap leach.* |
| 21 |
| · | A maiden sulphide Measured and Indicated Mineral Resource estimation was defined for the Phase I project with 89,000 ounces of gold and 343,000 ounces of silver at a grade of 1.46 g/t gold and 5.64 g/t silver in 1.89 million tonnes utilizing Ambient Atmospherics Oxidation (AAO) processing in the proposed mill facility.* |
| · | A total Phase II Measured and Indicated Mineral Resource estimation of 855,000 ounces of gold and 2,565,000 ounces of silver at 0.22 g/t gold and 0.65 g/t silver in 123 million tonnes of mineralized material was included.* |
| · | A private placement was completed in December 2017 in which Corvus issued 2,829,130 common shares at $1.15 per share and 1,574,803 common shares at $1.27 per share raising a total of $5,253,500. |
| · | Phase I of the Mother Lode drilling program completed 910 metres (“m”) in 3 core holes and 12,090 m in 39 reverse circulation (“RC”) holes between September 25 and December 16, 2017. |
| · | Phase II of the Mother Lode drilling began on January 8, 2018, with a total of 17 RC holes drilled for 5,400 m by the end of March. |
| · | Baseline characterization activities at NBP continued with the water quality sampling of monitor wells and springs, and meteorological monitoring reports, which are submitted to the Nevada Department of Environmental Protection quarterly. |
* - See Cautionary Note Regarding to U.S. Investors Regarding Estimates of Measured, Indicated and Inferred Resources and Proven and Probable Reserves above.
Corporate Financial Activities
The Company announced the completion of a $5,253,499 private placement on December 7, 2017, where the Company issued 2,829,130 common shares at a price of $1.15 each to institutional shareholders and 1,574,803 common shares at a price of $1.27 each to a key strategic shareholder. No warrants were issued. The Company expects that the proceeds of the financing will fully fund the Company’s planned 2018 exploration program at its new Mother Lode Property.
Nevada Properties
North Bullfrog Project
Our principal mineral property is the NBP, a gold exploration project located in northwestern Nye County, Nevada, in the Northern Bullfrog Hills about 10 kilometres (“km”)north of the town of Beatty. The NBP does not have any known proven or probable reserves under SEC Industry Guide 7 and the project is exploratory in nature. The Technical Report is available under Corvus’ SEDAR profile at www.sedar.com and EDGAR profile at www.sec.gov. The Technical Report is referred to herein for informational purposes only and is not incorporated herein by reference. The Technical Report contains disclosure regarding Mineral Resources that are not Guide 7 compliant proven or probable reserves. See “Cautionary Note to U.S. Investors Regarding Estimates of Measured, Indicated and Inferred Resources and Proven and Probable Reserves” above.
The NBP is located in the Bullfrog Hills of northwestern Nye County, Nevada (Figure 1). The NBP covers about 7,223 hectares of patented and unpatented mining claims in Sections 20, 21, 25, 26, 27, 28, 29, 32, 33, 34, 35, and 36 of T10S, R46E; sections 1, 2, 11, 12, 13, and 14 of T11S, R46E; section 31 of T10S, R47E; and sections 6, 9, 15, 16, and 17 T11S, R47E, MDBM. We have a total of nine option/lease agreements in place that give us control of an aggregate of 51 patented lode mining claims (Figure 2). Corvus Nevada owns an additional five patented claims (the Millman claims) and a 430 acre property with 1600 acre-feet of water rights located north of NBP in the Sacrobatus hydrographic basin (Basin 146).
| 22 |

Figure 1. Property Map showing the Location of the North Bullfrog Project.

Figure 2. Property Map of the North Bullfrog Project, Blue
outline shows the NBP boundary
and red areas are the Leased Private Land (UTm NAD 27 Zone 11).
Updated NBP Mineral Resources
Corvus announced an updated Mineral Resource estimation incorporating all drill results through to 2017 at the Company’s 100% owned NBP. The updated Mineral Resource estimation utilizes a two phase approach. “Phase I” is an early stage, higher grade mix of predominantly oxide mill processing and oxide heap leach processing while “Phase II” includes mainly heap leach mineralization. The Mineral Resources estimates (Measured, Indicated and Inferred) are based on economic constraints using Whittle TM software (see Table 4) and assumes open pit mining and a gold price of USD 1,250 per ounce and a silver price of USD 16.50 per ounce. Figure 3 shows the locations of the projected open pits at the NBP and displays the mineralization areas in the defined Phase I & II.
| 23 |

Figure 3. Locations of pit constrained, Phase I & II NBP Resources
The new Mineral Resource estimation reflects the benefits of the drilling conducted during 2016 and 2017, which expanded and improved the definition of the YellowJacket vein/stockwork zone, allowing the mine plan to deliver higher average grade mineralization from the YellowJacket zone in Phase I with high gold and silver recoveries. This new Mineral Resource has been estimated in accordance with NI 43-101 using a gold price of USD 1,250 per ounce and silver price of USD 16.50 per ounce. The Mineral Resources are tabulated for Phase I, Phase II and Total Mineral Resources in Tables 1, 2 and 3, where they are also subdivided by mill or heap leach process.
Table 1
Phase I, Measured, Indicated, and Inferred Mineral Resource Estimations for the NBP constrained by Whittle TM pit volumes, including both the YellowJacket Vein/Stockwork and Disseminated Oxide Mineralization at a gold price of USD 1,250 per ounce and a silver price of USD 16.50 per ounce
| Table 1a - Phase I, Total Mineral Resource | |||||
| tonnes (k) | Grade (g/t Au) | k-Ounces Au | Grade (g/t Ag) | k-Ounces Ag | |
| Measured | 10,415 | 1.08 | 362 | 7.59 | 2,540 |
| Indicated | 24,557 | 0.69 | 542 | 3.70 | 2,919 |
| Total M&I | 34,972 | 0.80 | 904 | 4.86 | 5,459 |
| Inferred | 5,908 | 0.31 | 59 | 0.74 | 140 |
| Table 1b - Phase I, Mill Mineral Resource (oxide and sulfide) | |||||
| tonnes (k) | Grade (g/t Au) | k-Ounces Au | Grade (g/t Ag) | k-Ounces Ag | |
| Measured | 5,221 | 1.79 | 300 | 12.72 | 2,136 |
| Indicated | 5,582 | 1.75 | 314 | 11.86 | 2,128 |
| Total M&I | 10,803 | 1.77 | 614 | 12.28 | 4,264 |
| Inferred | 49 | 1.90 | 3 | 18.41 | 29 |
| Table 1c - Phase I, Mill Mineral Resource (sulfide) | |||||
| tonnes (k) | Grade (g/t Au) | k-Ounces Au | Grade (g/t Ag) | k-Ounces Ag | |
| Measured | 756 | 1.32 | 32 | 5.35 | 130 |
| Indicated | 1,137 | 1.56 | 57 | 5.83 | 213 |
| Total M&I | 1,893 | 1.46 | 89 | 5.64 | 343 |
| Inferred | 15 | 2.07 | 1 | 16.59 | 8 |
| 24 |
| Table 1d - Phase I, Heap Leach Mineral Resource | |||||
| tonnes (k) | Grade (g/t Au) | k-Ounces Au | Grade (g/t Ag) | k-Ounces Ag | |
| Measured | 5,194 | 0.37 | 62 | 2.42 | 404 |
| Indicated | 18,975 | 0.37 | 228 | 1.30 | 791 |
| Total M&I | 24,169 | 0.37 | 290 | 1.54 | 1,195 |
| Inferred | 5,859 | 0.30 | 56 | 0.59 | 111 |
*See Cautionary Note Regarding to U.S. Investors Regarding Estimates of Measured, Indicated and Inferred Resources and Proven and Probable Reserves above
**The Mineral Resources above are effective as of October 31, 2017
***Mineral Resources that are not Mineral Reserves do not have demonstrated economic viability
****Includes Sulfide Mineral Resources discussed below
Table 2
Phase II, Measured, Indicated, and Inferred Mineral Resource Estimate for the NBP constrained by Whittle TM pit volumes, including both the YellowJacket Vein/Stockwork and Disseminated Oxide Mineralization at a gold price of USD 1,250 per ounce and a silver price of USD 16.50 per ounce
| Table 2a - Phase II, Total Mineral Resource | |||||
| tonnes (k) | Grade (g/t Au) | k-Ounces Au | Grade (g/t Ag) | k-Ounces Ag | |
| Measured | 10,129 | 0.26 | 84 | 1.04 | 338 |
| Indicated | 113,009 | 0.21 | 771 | 0.61 | 2,227 |
| Total M&I | 123,138 | 0.22 | 855 | 0.65 | 2,565 |
| Inferred | 58,877 | 0.19 | 367 | 0.48 | 902 |
| Table 2b - Phase II, Mill Mineral Resource (oxide & sulfide) | |||||
| tonnes (k) | Grade (g/t Au) | k-Ounces Au | Grade (g/t Ag) | k-Ounces Ag | |
| Measured | 798 | 1.01 | 26 | 3.27 | 84 |
| Indicated | 2,733 | 1.04 | 91 | 2.96 | 260 |
| Total M&I | 3,531 | 1.03 | 117 | 3.03 | 344 |
| Inferred | 67 | 1.39 | 3 | 2.32 | 5 |
| Table 2c - Phase II, Mill Mineral Resource (sulfide) | |||||
| tonnes (k) | Grade (g/t Au) | k-Ounces Au | Grade (g/t Ag) | k-Ounces Ag | |
| Measured | 401 | 1.24 | 16 | 2.48 | 32 |
| Indicated | 1,402 | 1.18 | 53 | 1.82 | 82 |
| Total M&I | 1,803 | 1.19 | 69 | 1.97 | 114 |
| Inferred | 61 | 1.53 | 3 | 2.04 | 4 |
| Table 2d - Phase II, Heap Leach Mineral Resource | |||||
| tonnes (k) | Grade (g/t Au) | k-Ounces Au | Grade (g/t Ag) | k-Ounces Ag | |
| Measured | 9,331 | 0.19 | 58 | 0.85 | 254 |
| Indicated | 110,276 | 0.19 | 680 | 0.55 | 1,967 |
| Total M&I | 119,607 | 0.19 | 738 | 0.58 | 2,221 |
| Inferred | 58,810 | 0.19 | 364 | 0.47 | 897 |
**See Cautionary Note Regarding to U.S. Investors Regarding Estimates of Measured, Indicated and Inferred Resources and Proven and Probable Reserves above
**The Mineral Resources above are effective as of October 31, 2017
***Mineral Resources that are not Mineral Reserves do not have demonstrated economic viability
****Includes Sulfide Mineral Resources discussed below
| 25 |
Table 3
Measured, Indicated, and Inferred Total Mineral Resource Estimate for the NBP constrained by Whittle TM pit volumes, including both the YellowJacket Vein/Stockwork and Disseminated Oxide Mineralization at a gold price of USD 1,250 per ounce and a silver price of USD 16.50 per ounce
| Table 3a - Total Mineral Resource, Phase I & II | |||||
| tonnes (k) | Grade (g/t Au) | k-Ounces Au | Grade (g/t Ag) | k-Ounces Ag | |
| Measured | 20,544 | 0.68 | 446 | 4.36 | 2,878 |
| Indicated | 137,566 | 0.30 | 1,314 | 1.16 | 5,146 |
| Total M&I | 158,110 | 0.35 | 1,760 | 1.58 | 8,024 |
| Inferred | 64,785 | 0.20 | 426 | 0.50 | 1,042 |
| Table 3b - Total Mill Mineral Resource (oxide and sulfide), Phase I & II | |||||
| tonnes (k) | Grade (g/t Au) | k-Ounces Au | Grade (g/t Ag) | k-Ounces Ag | |
| Measured | 6,019 | 1.68 | 326 | 11.47 | 2,220 |
| Indicated | 8,315 | 1.51 | 405 | 8.93 | 2,388 |
| Total M&I | 14,334 | 1.59 | 731 | 10.00 | 4,608 |
| Inferred | 116 | 1.61 | 6 | 9.12 | 34 |
| Table 3c - Total Mill Mineral Resource (sulfide), Phase I & II | |||||
| tonnes (k) | Grade (g/t Au) | k-Ounces Au | Grade (g/t Ag) | k-Ounces Ag | |
| Measured | 1,157 | 1.29 | 48 | 4.35 | 162 |
| Indicated | 2,539 | 1.35 | 110 | 3.61 | 295 |
| Total M&I | 3,696 | 1.33 | 158 | 3.85 | 457 |
| Inferred | 76 | 1.64 | 4 | 4.91 | 12 |
| Table 3d - Total Heap Leach Resource, Phase I & II | |||||
| tonnes (k) | Grade (g/t Au) | k-Ounces Au | Grade (g/t Ag) | k-Ounces Ag | |
| Measured | 14,525 | 0.26 | 120 | 1.41 | 658 |
| Indicated | 129,251 | 0.22 | 909 | 0.66 | 2,758 |
| Total M&I | 143,776 | 0.22 | 1,029 | 0.74 | 3,416 |
| Inferred | 64,669 | 0.20 | 420 | 0.48 | 1,008 |
**See Cautionary Note Regarding to U.S. Investors Regarding Estimates of Measured, Indicated and Inferred Resources and Proven and Probable Reserves above
**The Mineral Resources above are effective as of October 31, 2017
***Mineral Resources that are not Mineral Reserves do not have demonstrated economic viability
****Includes Sulfide Mineral Resources discussed below
The Mineral Resource estimation is based on 766 drill holes with 27,729 gold composites. Geologic volumes were defined by geologic interpretations and used to constrain the estimation. Heap leach resources were estimated by Ordinary Kriging. The YellowJacket vein and stockworks were estimated using Inverse Distance estimations. To estimate the reasonable prospects of eventual economic extraction, Metal Mining Consultants Inc. confined the resources to mining volumes defined by WhittleTM analysis using the input parameters defined in Table 4. There are no legal, political or environmental risks known to the Company at this time that could materially affect the potential development of the Mineral Resources.
Table 4
WhittleTM Input Parameters used for the NBP Mineral Resource Estimation
| Parameter | Unit | Mayflower 1 | Jolly Jane 1 | Sierra Blanca 1 | YellowJacket 2 | Sulfide 3 |
| Mining Cost |
USD/total tonne |
1.64 | 1.42 | 1.54 | 1.54 | 1.54 |
|
Au Cut-Off 4 |
g/t | 0.1 | 0.1 | 0.1 | 0.35 | 0.71 |
| Processing Cost |
USD/process tonne |
1.72 | 1.72 | 1.15 | 11.84 | 25.6 |
| Au Recovery |
% | 70.0 | 72.0 | 73.8 | 86.6 | 91.0 |
| Ag Recovery |
% | 8.0 | 8.0 | 6.3 | 74.3 | 57.2 |
| Admin Cost |
USD/process tonne |
0.5 | 0.5 | 0.45 | 0.45 | 0.45 |
| Refining & Sales |
USD/tonne | 0.07 | 0.04 | 0.02 | 0.11 | 0.11 |
| Au Selling Price |
USD/oz | 1,250 | 1,250 | 1,250 | 1,250 | 1,250 |
| Slope Angle |
Degrees | 50 | 50 | 50 | 50 | 50 |
1 assumes heap leach processing of disseminated mineralization
2 assumes Gravity - CIL mill processing of YellowJacket mineralization
3 assumes Ambient Atmospheric Oxidation mill processing of Sulfide mineralization
4 break-even grade derived from Whittle input parameters at USD 1,250 per ounce gold price, and USD 16.50 per ounce silver price
| 26 |
Sulfide Mineral Resource
Sulfide Mineral Resources have been added to the NBP Mineral Resources based on previously identified materials that lie within the YellowJacket zone and 2017 drilling in the Swale and Liberator areas. The majority of the identified sulfide mineralization is along the YellowJacket zone and was previously identified as waste material. Metallurgical test work on sulfide mineralization from the Sierra Blanca, Pioneer Tuff, Rhyolite and Dacite rock types in the YellowJacket area indicate high gold and silver recoveries possible using flotation to produce a concentrate, fine grinding of the concentrate, oxidation of the concentrate using the AAO method followed by cyanide leaching of the resulting filter cake. Gold recoveries with this processing approach ranged between 87% and 94% as indicated in Table 5, which lists the gold recovery to the concentrate, the concentration ratio and the overall gold recovery from the testing (NR 17-9, June 21, 2017). Both Soda Ash and Trona were used in the tests as the neutralizing agent and the tests were conducted by Hazen Research Inc., based in Golden, Colorado.
Table 5
NBP Concentrate AAO Testing
| Sample Unit | Gold Recovery to Concentrate | Concentration Ratio (mineralized tonne to concentrate) | Post AAO CN Gold Recovery (from concentrate) |
Overall Gold Recovery (from mineralized tonne) |
| Soda Ash | ||||
| Sierra Blanca | 94% | 9:1 | 99% | 93% |
| Pioneer Tuff | 94% | 14:1 | 100% | 94% |
| Rhyolite | 89% | 14:1 | 100% | 89% |
| Dacite | 88% | 5:1 | 100% | 88% |
| Trona | ||||
| Sierra Blanca | 94% | 9:1 | 97% | 91% |
| Pioneer Tuff | 94% | 14:1 | 99% | 93% |
| Rhyolite | 89% | 14:1 | 98% | 87% |
| Dacite | 88% | 5:1 | 99% | 87% |
The sulfide Mineral Resources within the WhittleTM pit shells have been included in the Mill Mineral Resource tables presented earlier. Operating costs and gold recoveries have been developed for use in the WhittleTM analysis and are included in Table 4. The breakdown of the Sulfide Mineral Resource are listed in Tables 1, 2 and 3.
NBP Project Development Activities
Monitoring programs to develop baseline characterization data for support of future permitting activities continued during the period. Water quality monitoring wells and surface springs were sampled in March 2018.
The Company operates a meteorological monitoring station at NBP and submitted its latest quarterly report to NBP in January 2018.
Mother Lode Property, Nevada
On June 9, 2017, the Company acquired the Mother Lode Property (Figure 4), which is located approximately six kilometres east of Beatty, Nevada, in Nye County. The Mother Lode Property is in the Bare Mountain District, and was previously mined by Gold Search Inc. The Company acquired the 13 Federal mining claims comprising the Mother Lode Property from Goldcorp USA. The Company staked an additional 105 claims (the MN claim group) to the northwest of the Mother Lode Property claims and an additional 22 claims (the ME claim group) to the east of the Mother Lode Property claims. The MN claim group was expanded again by an additional 54 claims during the third quarter 2017-2018, as surface exploration work revealed potential for mineralized targets similar to previously defined systems immediately to the south.
With the acquisition of the Mother Lode Property, the Company initiated an exploration program to verify historic results and evaluate the resource expansion potential of the asset. The Company does not currently consider the Mother Lode Property to be a material property to the Company. The Mother Lode Property does not have any known proven or probable reserves under SEC Industry Guide 7 and is exploratory in nature.
The Mother Lode Property is located in Nye County, Nevada in the Bare Mountain District, south and east of the community of Beatty, Nevada. The Mother Lode Property consists of 194 unpatented Federal mining claims covering about 1,570 hectares in Sections 35 and 36 of T11S, R47E, Sections 1, 2, 8, 9, 10, 11, 12, 13, 15, 16, and 17 of T12S, R47E and Sections 6, 7, 8, 9, 16, 17 and 18 of T12S, R48E, MDBM”
| 27 |
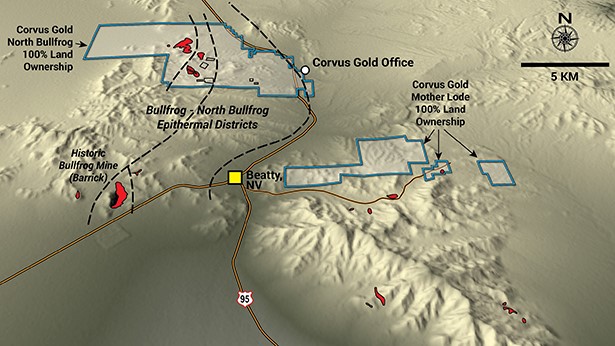
Figure 4. Map showing the Mother Lode Property location and property layout; including map showing the location of Mother Lode Property with respect to the NBP and the community of Beatty, NV
The Company began its Phase I, Mother Lode Property drill program which utilized up to three drill rigs (two reverse circulation and one core), in September 2017. The initial program completed 13,000 metres of drilling and focused on confirming the existing 172-hole database consisting of drilling results developed by previous exploration companies and mine operators at the Mother Lode site. The initial program addressed resource expansion and exploration targets in four main zones of historic mineralization. Phase II of the Mother Lode drilling program began in early January 2018 with a single RC drilling rig.
The drilling results to date, have begun to verify and supplement the historic drill data, and are delineating mineralization into two zones (an upper and lower zone). Preliminary results for 52 holes have been released between October 11, 2017 and April 5, 2018, consisting of intervals in each hole with significant gold mineralization. Results for holes ML17-001 to -015 were reported in NR17-14 (October 11, 2017), NR17-15 (October 25, 2017), NR17-17 (November 7, 2017) and NR17-19 (December 12, 2017). Table 6 lists significant drilling results for holes ML17-016 to -042 and ML18-043 to -052, for which preliminary results have become available in 2018. Refer to news releases NR18-1 (January 10, 2018), NR18-2 (January 18, 2018), NR18-3 (February 1, 2018), NR18-5 (February 22, 2018), NR18-6 (March 1, 2018), NR18-7 (March 22, 2018) and NR18-8 (April 5, 2018) for information on assay results, data verification, drilling parameters and locations of the drill holes. Figure 5 shows the location of holes ML17-016 to -042 and ML18-043 to -052, with respect to the Mother Lode open pit and the Mother Lode claim boundaries. These drill holes have confirmed the presence of a thick central zone of mineralization with continuity along strike. Step out drilling to west and east of the main zone have now indicated the potential of extensions of the mineralization in both directions, and a new target, called Flatiron (Figure 6) has been identified in the west portion of the Mother Lode claims.
| 28 |
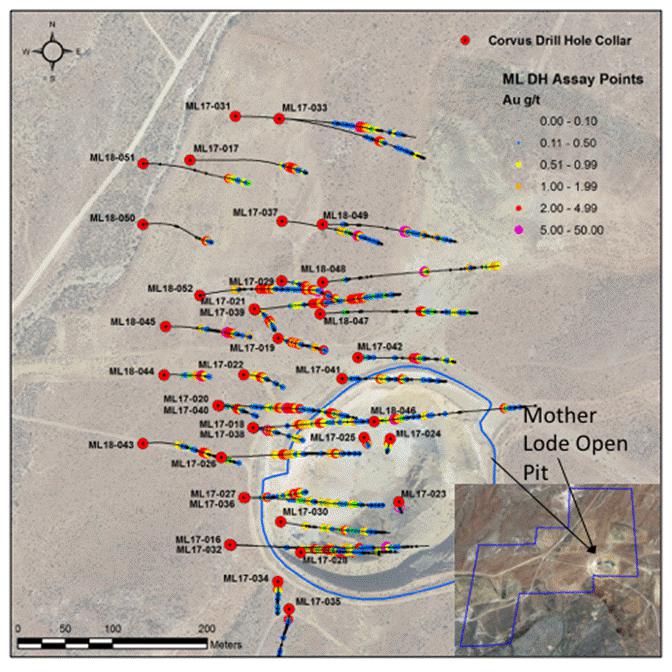
Figure 5. Map with inset showing the Mother Lode claim boundary (blue) and the locations of boreholes with preliminary results reported between January 1 and April 5, 2018
Table 6
Phase I & II - Mother Lode Significant Drilling Results
(Reported intercepts are not true widths as there is currently insufficient data to calculate true orientation in space. Mineralized intervals are calculated using a 0.3 g/t cutoff unless otherwise indicated below)
| Drill Hole # | from (m) | to (m) | Interval (m) | Gold (g/t) | Silver (g/t) | Comment |
| ML17-016 | 140.21 | 143.26 | 3.05 | 1.04 | 0.26 | South end of deposit |
| AZ 090 dip-45 | 158.50 | 167.64 | 9.14 | 1.11 | 0.20 | |
| inc | 161.54 | 166.12 | 4.58 | 1.62 | 0.22 | |
| 175.26 | 184.40 | 9.14 | 0.98 | 1.96 | New Deep In-pit Zone | |
| inc | 179.83 | 182.88 | 3.05 | 2.36 | 3.31 | New Deep In-pit Zone |
| 216.41 | 228.60 | 12.19 | 0.96 | 1.61 | New Deep In-pit Zone | |
| inc | 217.93 | 219.46 | 1.52 | 5.52 | 4.09 | New Deep In-pit Zone |
| 29 |
| ML17-017 | 268.22 | 272.80 | 4.58 | 0.68 | 0.59 | Northwest Extension |
| AZ 090 dip-70 | 291.08 | 326.14 | 35.06 | 1.97 | 2.09 | Northwest Extension |
| inc | 292.61 | 324.61 | 32.00 | 2.10 | 2.17 | Northwest Extension |
| 347.47 | 352.04 | 4.57 | 0.55 | 0.33 | Northwest Extension |
| ML17-018 | 105.16 | 187.45 | 82.29 | 1.11 | n/a | Drilled west of ML17-006 |
| inc | 105.16 | 132.59 | 27.43 | 1.57 | 1.32 | |
| inc | 156.97 | 172.21 | 15.24 | 1.72 | 2.75 | |
| 202.69 | 208.79 | 6.10 | 0.60 | n/a | ||
| 220.98 | 227.08 | 6.10 | 0.62 | 0.51 | ||
| AZ 090 dip-65 | 236.22 | 245.36 | 9.14 | 1.09 | 1.65 | New Deep Main Zone |
| inc | 240.79 | 245.36 | 4.57 | 1.41 | 2.61 | New Deep Main Zone |
| ML17-019 | 92.96 | 109.73 | 16.77 | 0.47 | 0.57 | Drilled west of ML17-004 |
| AZ 090 dip-87 | 146.30 | 213.36 | 67.06 | 1.32 | 1.92 | |
| inc | 147.83 | 166.12 | 18.29 | 1.49 | 3.08 | |
| inc | 170.69 | 176.78 | 6.09 | 1.13 | 0.73 | |
| inc | 182.88 | 211.84 | 28.96 | 1.58 | 1.99 | |
| 291.08 | 294.13 | 3.05 | 0.96 | 0.47 | ||
| 336.80 | 345.95 | 9.15 | 0.86 | 1.36 | New Deep Main Zone | |
| inc | 336.80 | 339.85 | 3.05 | 1.95 | 3.19 | New Deep Main Zone |
| 30 |
| ML17-020 | 120.40 | 216.41 | 96.01 | 1.35 | 1.24 | Using 0.1 g/t cutoff |
| AZ 090 dip-65 | 121.92 | 143.26 | 21.34 | 0.49 | 0.60 | Drilled west of ML17-007 |
| 147.83 | 167.64 | 19.81 | 1.82 | 1.23 | ||
| 172.21 | 210.31 | 38.10 | 2.12 | 1.98 | ||
| inc | 173.74 | 196.60 | 22.86 | 3.08 | 2.21 | |
| 259.08 | 265.18 | 6.10 | 0.49 | 2.22 | New Deep Main Zone | |
| 271.27 | 298.70 | 27.43 | 1.31 | 3.90 | New Deep Main Zone | |
| inc | 275.84 | 283.46 | 7.62 | 3.46 | 9.98 | New Deep Main Zone |
| ML17-021 | 100.58 | 126.49 | 25.91 | 0.44 | 0.49 | Drilled west of ML17-005 |
| AZ 090 dip-45 | 147.83 | 178.31 | 30.48 | 2.54 | 1.92 | |
| 227.08 | 262.13 | 35.05 | 1.95 | 2.48 | ||
| inc | 227.08 | 246.89 | 19.81 | 2.28 | 2.05 | |
| inc | 251.46 | 262.13 | 10.67 | 2.07 | 4.20 | |
| ML17-022 | 102.11 | 124.97 | 22.86 | 0.41 | 0.37 | Drilled west of ML17-009 |
| AZ 090 dip-85 | 129.54 | 153.92 | 24.38 | 0.74 | 0.80 | |
| inc | 131.06 | 135.64 | 4.58 | 1.34 | 1.71 | |
| 170.69 | 216.41 | 45.72 | 1.33 | 1.25 | ||
| inc | 172.21 | 207.26 | 35.05 | 1.57 | 1.29 | |
| 329.18 | 338.33 | 9.15 | 0.40 | 0.30 | New Deep Main Zone |
| ML17-023 | 64.01 | 67.06 | 3.05 | 0.81 | 1.96 | |
| AZ 360 dip-90 | 79.25 | 99.06 | 19.81 | 0.73 | 1.23 | |
| inc | 89.92 | 94.49 | 4.57 | 1.21 | 1.93 | |
| 103.63 | 111.25 | 7.62 | 2.69 | 2.60 | New Deep In-pit Zone |
| ML17-024 | 0.00 | 15.24 | 15.24 | 2.76 | 1.42 | |
| AZ 360 dip-90 | 19.81 | 41.15 | 21.34 | 0.58 | 0.30 | |
| 79.25 | 112.78 | 33.53 | 0.94 | 1.37 | ||
| inc | 82.30 | 100.58 | 18.28 | 1.40 | 1.79 | |
| 117.35 | 129.54 | 12.19 | 0.56 | 0.38 | New Deep In-pit Zone | |
| 140.21 | 149.35 | 9.14 | 0.55 | 2.72 | New Deep In-pit Zone |
| 31 |
| ML17-025 | 0.00 | 50.29 | 50.29 | 1.74 | 1.17 | |
| inc | 0.00 | 19.81 | 19.81 | 2.26 | 1.60 | |
| inc | 24.38 | 42.67 | 18.29 | 1.99 | 1.13 | |
| AZ 360 dip-90 | 86.87 | 108.20 | 21.33 | 1.59 | 2.11 | |
| inc | 86.87 | 103.63 | 16.76 | 1.90 | 2.53 | |
| 138.68 | 141.73 | 3.05 | 2.90 | 0.85 | New Deep In-pit Zone | |
| 150.88 | 164.59 | 13.71 | 1.41 | 4.39 | New Deep In-pit Zone | |
| inc | 152.40 | 158.50 | 6.10 | 2.09 | 6.61 | New Deep In-pit Zone |
| ML-17-026 AZ 090 dip-65 |
126.49 | 172.21 | 45.72 | 1.33 | 1.73 | West of hole ML17-014 |
| inc | 126.49 | 129.54 | 3.05 | 1.47 | 2.01 | >1g/t cut |
| inc | 144.78 | 169.16 | 24.38 | 1.72 | 2.03 | >1g/t cut |
| 178.31 | 185.93 | 7.62 | 0.57 | 2.44 | ||
| 242.32 | 266.70 | 24.38 | 0.93 | 2.28 | New deep in-pit zone | |
| inc | 249.94 | 256.03 | 6.09 | 1.75 | 2.86 | >1g/t cut |
| ML-17-027 AZ 090 dip-65 |
124.97 | 156.97 | 32.00 | 0.49 | 1.02 | West of hole ML17-008 |
| inc | 150.88 | 153.92 | 3.05 | 1.03 | 1.62 | >1g/t cut |
| 172.21 | 176.78 | 4.57 | 0.78 | 0.94 | ||
| 181.36 | 213.36 | 32.00 | 0.63 | 1.28 | ||
| inc | 188.98 | 192.02 | 3.05 | 1.33 | 3.52 | >1g/t cut |
| 233.17 | 251.46 | 18.29 | 0.44 | 0.88 | New deep in-pit zone |
| ML-17-028 AZ 090 dip-65 |
73.15 | 124.97 | 51.82 | 1.86 | 0.88 | East of hole ML17-016 |
| inc | 83.82 | 103.63 | 19.81 | 3.43 | 1.28 | >1g/t cut |
| inc | 115.82 | 121.92 | 6.10 | 2.37 | 2.60 | >1g/t cut |
| 167.64 | 172.21 | 4.57 | 0.74 | 2.10 | New deep in-pit zone |
| 32 |
| ML-17-029 AZ 090 dip-85 |
103.63 | 112.78 | 9.15 | 0.43 | 0.19 | West of hole ML17-010 |
| 117.35 | 123.44 | 6.09 | 0.73 | 1.59 | ||
| 161.54 | 179.83 | 18.29 | 1.84 | 1.46 | ||
| 193.55 | 196.60 | 3.05 | 0.46 | 1.56 | ||
| 204.22 | 240.79 | 36.57 | 1.85 | 3.15 | ||
| inc | 211.84 | 237.74 | 25.90 | 2.37 | 3.75 | >1g/t cut |
| 277.37 | 286.51 | 9.14 | 1.17 | 2.41 | ||
| inc | 278.89 | 284.99 | 6.10 | 1.56 | 2.39 | >1g/t cut |
| 320.04 | 338.33 | 18.29 | 0.90 | 3.47 | ||
| inc | 321.56 | 326.14 | 4.57 | 2.55 | 6.59 | >1g/t cut |
| ML-17-030 AZ 090 dip-65 |
59.44 | 62.48 | 3.04 | 0.93 | 0.58 | West of hole ML17-023 |
| 100.58 | 105.16 | 4.57 | 0.67 | 0.12 | ||
| 112.78 | 117.35 | 4.57 | 0.89 | 0.06 | ||
| 144.78 | 155.45 | 10.67 | 0.97 | 0.99 | ||
| 161.54 | 164.59 | 3.05 | 0.35 | 1.55 | ||
| 169.16 | 172.21 | 3.05 | 0.37 | 0.43 | ||
| 176.78 | 179.83 | 3.05 | 0.35 | 0.53 | ||
| 185.93 | 198.12 | 12.19 | 0.80 | 0.55 | New deep in-pit zone | |
| inc | 190.50 | 193.55 | 3.05 | 1.58 | 1.01 | >1g/t cut |
| ML-17-031 AZ 090 dip-70 |
313.94 | 347.47 | 33.53 | 1.60 | 3.13 | NW of hole ML17-003 |
| inc | 313.94 | 332.23 | 18.29 | 2.47 | 4.12 | >1g/t cut |
| ML-17-032 AZ 360 dip-90 |
137.16 | 172.21 | 35.05 | 0.93 | 1.22 | West of hole ML17-016 |
| inc | 161.54 | 172.21 | 10.67 | 1.78 | 1.24 | >1g/t cut |
| 181.36 | 195.07 | 13.71 | 1.24 | 1.36 | ||
| inc | 187.45 | 193.55 | 6.10 | 2.02 | 2.58 | >1g/t cut |
| 199.64 | 213.36 | 13.72 | 0.86 | 2.45 | New deep in-pit zone | |
| 231.65 | 243.84 | 12.19 | 0.81 | 0.63 | New deep in-pit zone |
| 33 |
| ML-17-033 AZ 090 dip-70 |
294.13 | 306.32 | 12.19 | 2.31 | 2.05 | North of hole ML17-003 |
| inc | 294.13 | 301.75 | 7.62 | 3.39 | 2.58 | >1g/t cut |
| ML17-034 | 100.58 | 123.44 | 22.86 | 1.18 | 3.27 |
Drilled SW of Pit New Upper Ox Zone |
| 134.11 | 150.88 | 16.77 | 0.50 | 7.28 | ||
| AZ 360 dip-90 | 254.51 | 257.56 | 3.05 | 0.39 | 0.44 |
| ML17-036 | 143.26 | 152.40 | 9.14 | 0.76 | n/a |
West of ML17-027 New Upper Ox Zone |
| inc | 147.83 | 150.88 | 3.05 | 1.45 | 2.31 | >1 g/t |
| AZ 090 dip-85 | 158.50 | 164.59 | 6.09 | 0.97 | 1.69 | New Upper Ox Zone |
| 230.12 | 236.22 | 6.10 | 0.60 | 2.50 | ||
| 257.56 | 265.18 | 7.62 | 0.71 | 0.48 | ||
| 280.42 | 324.61 | 44.19 | 1.33 | 1.40 | New Deep In-Pit Zone | |
| inc | 280.42 | 284.99 | 4.57 | 2.16 | 1.10 | >1 g/t |
| inc | 295.66 | 313.94 | 18.28 | 2.10 | 2.50 | >1 g/t |
| ML17-037 | 188.98 | 211.84 | 22.86 | 0.77 | 0.52 | East of ML17-13 |
| inc | 196.60 | 199.64 | 3.05 | 1.03 | 0.51 | >1g/t cut |
| inc | 205.74 | 208.79 | 3.05 | 1.21 | 0.56 | >1g/t cut |
| AZ 090 dip-70 | 246.89 | 259.08 | 12.19 | 2.69 | 2.64 | New East Zone |
| inc | 248.41 | 257.56 | 9.15 | 3.31 | 3.03 | >1g/t cut |
| ML17-038 | 132.59 | 185.93 | 53.34 | 1.57 | 1.96 | West of ML17-018 |
| inc | 132.59 | 144.78 | 12.19 | 2.29 | 2.29 | >1g/t cut |
| inc | 149.35 | 179.83 | 30.48 | 1.61 | 1.85 | >1g/t cut |
| AZ 090 dip-85 | 281.94 | 304.80 | 22.86 | 0.49 | 0.37 | |
| 309.37 | 321.56 | 12.19 | 0.87 | 3.29 | New Deep In-Pit Zone | |
| inc | 315.47 | 320.04 | 4.57 | 1.22 | 5.66 | >1g/t cut |
| 34 |
| ML17-039 | 100.58 | 105.16 | 4.57 | 0.46 | 0.15 |
West of ML17-021 New Upper Ox Zone |
| AZ 090 dip-85 | 112.78 | 124.97 | 12.19 | 0.56 | 0.40 | New Upper Ox Zone |
| 182.88 | 252.98 | 70.10 | 1.45 | 1.98 | West Ext - Main Zone | |
| inc | 192.02 | 246.89 | 54.87 | 1.72 | 2.18 | >1g/t cut |
| ML17-040 | 106.68 | 109.73 | 3.05 | 0.36 | n/a |
West of ML17-020 New Upper Ox Zone |
| AZ 090 dip-85 | 124.97 | 128.02 | 3.05 | 0.36 | n/a | New Upper Ox Zone |
| 140.21 | 152.40 | 12.19 | 0.49 | n/a | New Upper Ox Zone | |
| 185.93 | 216.41 | 30.48 | 1.80 | n/a | West Ext – Main Zone | |
| inc | 185.93 | 213.36 | 27.43 | 1.91 | n/a | >1g/t cut |
| ML17-041 | 89.92 | 115.82 | 25.90 | 0.77 | 0.38 | East of ML17-001 |
| inc | 96.01 | 99.06 | 3.05 | 2.65 | 1.06 | >1g/t cut |
| AZ 090 dip-65 | 150.88 | 166.12 | 15.24 | 0.89 | 1.99 | New East Zone |
| inc | 150.88 | 160.02 | 9.14 | 1.28 | 2.63 | >1g/t cut |
| ML17-042 | 24.38 | 32.00 | 7.62 | 0.31 | 0.33 | East of ML17-011 |
| 150.88 | 179.83 | 28.95 | 2.02 | 1.86 | New East Zone | |
| inc | 150.88 | 172.21 | 21.33 | 2.62 | 2.43 | >1g/t cut |
| AZ 090 dip-70 | 239.27 | 245.36 | 6.09 | 0.43 | 5.46 | Lower Ox Zone |
| ML17-035 AZ 180 dip-85 |
80.77 | 85.34 | 4.57 | 1.55 | n/a | Drilled SW of Pit |
| ML18-043 | 124.97 | 128.02 | 3.05 | 0.63 | n/a |
West of ML17-027 New Upper Ox Zone |
| 137.16 | 143.26 | 6.10 | 0.55 | n/a | New Upper Ox Zone | |
| 220.98 | 248.41 | 27.43 | 1.81 | n/a | West ext. – Main Zone | |
| inc | 224.03 | 246.89 | 22.86 | 2.05 | n/a | >1 g/t |
| AZ 085 dip-70 | 333.76 | 341.38 | 7.62 | 0.44 | n/a |
| 35 |
| ML18-044 | 207.26 | 222.50 | 15.24 | 0.37 | n/a |
West of ML17-022 New Upper Ox Zone |
| AZ 085 dip-85 | 230.12 | 251.46 | 21.34 | 0.92 | n/a | New Upper Ox Zone |
| inc | 234.70 | 239.27 | 4.57 | 1.22 | n/a | >1 g/t |
| inc | 243.84 | 249.94 | 6.10 | 1.14 | n/a | >1 g/t |
| 256.03 | 281.94 | 25.91 | 2.32 | n/a | West ext. – Main Zone | |
| inc | 259.08 | 280.42 | 21.34 | 2.69 | n/a | >1 g/t |
| ML18-045 | 169.16 | 176.78 | 7.62 | 0.52 | n/a |
West of ML17-039 New Upper Ox Zone |
| AZ 085 dip-80 | 184.40 | 187.45 | 3.05 | 0.46 | n/a | New Upper Ox Zone |
| 256.03 | 295.66 | 39.63 | 2.45 | n/a | West ext. – Main Zone | |
| inc | 256.03 | 289.56 | 33.53 | 2.84 | n/a | >1 g/t |
| ML18-046 | 21.34 | 51.82 | 30.48 | 2.05 | n/a |
West of ML17-027 Upper East Zone |
| inc | 35.05 | 47.24 | 12.19 | 4.45 | n/a | >1 g/t |
| 85.34 | 91.44 | 6.10 | 0.77 | n/a | ||
| AZ 083 dip-55 | 216.41 | 225.55 | 9.14 | 0.95 | n/a | Lower East Zone |
| inc | 217.93 | 220.98 | 3.05 | 2.05 | n/a | >1 g/t |
| ML18-047 | 193.55 | 205.37 | 11.82 | 1.77 | n/a |
West of ML17-022 Lower East Zone |
| inc | 193.55 | 201.17 | 7.62 | 2.57 | n/a | >1 g/t |
| 216.41 | 220.98 | 4.57 | 0.32 | n/a | ||
| AZ 085 dip-60 | 256.03 | 266.70 | 10.67 | 0.42 | n/a |
| ML18-048 | 51.82 | 54.86 | 3.05 | 0.41 | n/a |
East of ML17-037 Upper East Zone |
| 210.31 | 214.88 | 4.57 | 3.61 | n/a | East H-G Zone | |
| AZ 085 dip-65 | 320.04 | 341.38 | 21.34 | 0.77 | n/a | New Far-East Zone |
| inc | 332.23 | 339.85 | 7.62 | 1.20 | n/a | >1 g/t |
| 36 |
| ML18-049 | 230.12 | 237.74 | 7.62 | 21.77 | n/a |
East of ML17-010 East H-G Zone |
| 248.41 | 252.98 | 4.57 | 0.27 | n/a | ||
| AZ 085 dip-70 | 277.37 | 280.42 | 3.05 | 1.20 | n/a |
|
ML18-050 Az 085 dip-65 |
345.95 | 367.28 | 21.33 | 2.00 | n/a |
West of ML17-013 Main ML Zone |
| ML18-051 | 356.62 | 385.57 | 28.95 | 1.02 | n/a |
West of ML 17-017 East H-G Zone |
| inc | 356.62 | 371.86 | 15.24 | 1.56 | n/a | 1 g/t cut |
| AZ 085 dip-70 | 400.81 | 416.05 | 15.24 | 0.45 | n/a | Lower OX Zone to the EOH |
| ML18-052 | 132.59 | 155.45 | 22.86 | 0.67 | n/a |
West of ML 17-021 Upper LG Zone |
| inc | 149.35 | 153.92 | 4.57 | 1.30 | n/a | 1 g/t cut |
| AZ 085 dip-75 | 230.12 | 283.46 | 53.34 | 1.90 | n/a | Main ML Zone |
| inc | 230.12 | 277.37 | 47.25 | 2.09 | n/a | 1 g/t cut |
| 385.57 | 426.72 | 41.15 | 1.52 | n/a | Lower OX Zone to the EOH | |
| inc | 385.57 | 399.29 | 13.72 | 2.09 | n/a | 1g/t cut |
| inc | 408.43 | 414.53 | 6.10 | 2.74 | n/a | 1g/t cut |
Surface exploration at Mother Lode has identified new targets along the Daisy, Secret Pass and Sterling trends, which have motivated the Company to expand its claim packages to the northwest and southeast of the Mother Lode claims. Targets in these extensions areas are named Sawtooth, Coronet and Willy’s, and the locations are indicated with respect to the Mother Lode claims by the map in Figure 6. During this reporting period, the MN claim group was expanded to west by locating 54 additional claims to cover the Sawtooth exploration area.
| 37 |

Figure 6. Map of new District-wide exploration project beyond the core Mother Lode deposit area, with areas for local expansion of the Mother Lode mineralization denoted by stars within the Mother Lode claims.
The Mother Lode Project is not part of the North Bullfrog Project, and currently there is insufficient drilling or analysis for estimation of a Mineral Resource. Therefore, Mother Lode continues to be a non-material property.
Qualified Person and Quality Control/Quality Assurance
Jeffrey A. Pontius (CPG 11044), a qualified person as defined by NI 43-101, has supervised the preparation of the scientific and technical information that forms the basis for the disclosure in this Quarterly Report on Form Q-10, and has approved the disclosure herein. Mr. Pontius is not independent of Corvus, as he is the Company’s Chief Executive Officer & President and holds common shares and incentive stock options in Corvus.
Carl E. Brechtel, (Nevada PE 008744 and Registered Member 353000 of SME), a qualified person as defined by NI 43-101, has coordinated execution of the work outlined in this Quarterly Report on Form Q-10, and has approved the disclosure herein. Mr. Brechtel is not independent of Corvus, as he is the Company’s Chief Operating Officer and holds common shares and incentive stock options in Corvus.
The work program at the Mother Lode Property was designed and supervised by Mark Reischman, Corvus Gold’s Nevada Exploration Manager, who is responsible for all aspects of the work, including the quality control/quality assurance program. On-site personnel at the project log and track all samples prior to sealing and shipping. Quality control is monitored by the insertion of blind certified standard reference materials and blanks into each sample shipment. All resource sample shipments are sealed and shipped to American Assay Laboratories (“AAL”) in Reno, Nevada, for preparation and assaying. AAL is independent of the Company. AAL’s quality control system complies with the requirements for the International Standards ISO 9001:2000 and ISO 17025:1999. Analytical accuracy and precision are monitored by the analysis of reagent blanks, reference material and replicate samples. Carl Brechtel, a Qualified Person, has verified the data underlying the information disclosed herein by reviewing the reports of AAL and all procedures undertaken for QA/QC. All matters were consistent and accurate accordingly to his professional judgment. There were no limitations on the verification process.
| 38 |
For additional information on the NBP project, including information relating to exploration, data verification and the mineral resource estimates, see the Technical Report, which is available under Corvus’ SEDAR profile at www.sedar.com and EDGAR profile at www.sec.gov. The Technical Report is referred to herein for informational purposes only and is not incorporated herein by reference. The Technical Report contains disclosure regarding Mineral Resources that are not Guide 7 compliant proven or probable reserves, see “Cautionary Note to U.S. Investors Regarding Estimates of Measured, Indicated and Inferred Resources and Proven and Probable Reserves” above.
Results of Operations
Nine months ended February 28, 2018 Compared to Nine months ended February 28, 2017
For the nine months ended February 28, 2018, the Company had a net loss of $7,113,643 compared to a net loss of $4,829,427 in the comparative period of the prior year. Included in net loss was $508,865 (2017 - $453,788) in stock-based compensation charges which is a result of stock options granted and vested during the current period and previously granted stock options which vested during the period. The increase in loss of $2,284,216 in the nine month period of the current year was due to a combination of factors discussed below.
The primary factor for the increase in the net loss was the exploration expenditures of $4,075,384 incurred in the current period compared to $2,107,236 in the comparative period of the prior year. The exploration activities of the Company increased mainly due to an increase of $1,950,348 incurred in the exploration in the current period compared with the comparative period of the prior year as the Company secured additional financing in July and December 2017 and focused its exploration efforts on the two Nevada properties and partly due to increased stock-based compensation charges of $41,166 during the current year compared to $23,366 in the prior year. Management expects increases in exploration costs over prior periods are likely to continue in the immediate future periods.
Consulting expenses increased to $468,982 (2017 - $456,531) mainly due to increased consulting fees of $14,667 during the current period compared with the comparative period of the prior year, and decreased stock-based compensation charges of $231,065 during the current period compared to $233,281 in the comparative period of the prior year.
Insurance expenses increased to $147,279 (2017 - $105,913) mainly due to increased insurance premiums as a result of increased Director and Officer Liability coverage during the current period compared with the comparative period of the prior year.
Investor relations expenses increased to $616,295 (2017 - $564,355) and travel expenses increased to $163,960 (2017 - $107,415) mainly due to increase in investor relations-related travels, advertising, marketing and conference attended, property tours conducted during the current period as part of the Company’s efforts to secure additional financing. Investor relations expenses also increase in part due to increased stock-based compensation charges of $69,817 during the current period compared to $55,431 in the comparative period of the prior year.
Office expenses increased to $108,437 ($89,931) mainly due to the moving expenses associated with the Company moving its Denver office location in October 2017.
Professional fees decreased to $194,435 (2017 - $206,356) due to the adjustment of prior years’ audit over accrual.
Regulatory expenses increased to $86,311 (2017 - $67,809) mainly due to an increase in the base and variable fee paid to the TSX, an increase from $18,096 in 2017 to $31,202 in 2018.
Wages and benefits decreased to $1,033,069 (2017 - $1,045,682) mainly due to a decrease of $37,321 in wages and benefits in the current period mainly as a result of adjustment in wages of several senior executive officers and the severance pay to a former employee in the comparative period of the prior year offset by increased stock-based compensation charges of $161,306 during the current period compared to $136,598 in the comparative period of the prior year.
Other expense categories that reflected only moderate changes period over period were administration expenses of $316 (2017 - $545), depreciation expenses of $13,477 (2017 - $16,544), and rent expenses of $79,484 (2017 - $80,309).
Other items amounted to a loss of $126,214 compared to an income of $19,199 in the comparative period of the prior year. There was an increase in foreign exchange loss of $138,781 (2017 - $4,860), which is the result of factors outside of the Company’s control and a decrease in interest income of $12,567 (2017 - $24,059) as a result of less investment in cashable GIC’s during the current period.
| 39 |
Three Months Ended February 28, 2018 Compared to Three Months Ended February 28, 2017
For the three months ended February 28, 2018, the Company had a net loss of $2,931,596 compared to a net loss of $1,995,267 in the comparative period of the prior year. Included in net loss was $160,795 (2017 - $139,705) in stock-based compensation charges which is a result of previously granted stock options vesting during the period. The increased loss of $936,329 in the three month period of the current year was due to a combination of factors discussed below.
The primary factor for the increase in the net loss was the exploration expenditures of $1,623,436 incurred in the current period compared to $877,567 in the comparative period of the prior year. The exploration activities of the Company increased mainly due to an increase of $741,727 incurred in the exploration in the current period compared with the comparative period of the prior year as the Company secured additional financing in July and December 2017 and focused its exploration efforts on the two Nevada properties and partly due to increased stock-based compensation charges of $13,987 during the current year compared to $9,845 in the prior year. Management expects increases in exploration costs over prior periods are likely to continue in the immediate future periods.
Consulting fees increased to $183,224 (2017 - $164,869) mainly due to increased consulting fees of $11,667 during the current period and increased stock-based compensation charges of $73,807 during the current period compared to $67,119 in the prior period.
Professional fees increased to $94,610 (2017 - $82,433) due to the increased legal fees during the current period and increased stock-based compensation charges of $1,779 during the current period compared to $1,626 in the comparative period of the prior year.
Regulatory expenses increased to $47,778 (2017 - $35,954) mainly due to an increase in the base and variable fee paid to the TSX, an increase from $18,096 in 2017 to $31,202 in 2018.
Wages and benefits increased to $570,899 (2017 - $482,674) mainly due to increased wages and benefits of $82,475 during the current period and increased stock-based compensation charges of $49,177 during the current period compared to $43,427 in the prior period.
Other expense categories that reflected only moderate changes period over period were administration expenses of $105 (2017 - $92), depreciation expenses of $4,468 (2017 - $5,537), insurance expenses of $49,151 (2017 - $47,597), investor relations expenses of $226,370 (2017- $224,332), office expenses of $30,453 (2017 - $27,818), rent expenses of $17,241 (2017 - $27,961), and travel expenses of $31,422 (2017 - $23,097).
Other items amounted to a loss of $52,439 compared to an income of $4,664 in the comparative period of the prior year. There was an increase in foreign exchange loss of $58,884 (2017 - $1,065), which is the result of factors outside of the Company’s control and an increase in interest income of $6,445 (2017 - $5,729) as a result of more investment in cashable GIC’s during the current period.
Liquidity and Capital Resources
The Company has no revenue generating operations from which it can internally generate funds. To date, the Company’s ongoing operations have been financed by the sale of its equity securities by way of public offerings, private placements and the exercise of incentive stock options and share purchase warrants. The Company believes that it will be able to secure additional private placements and public financings in the future, although it cannot predict the size or pricing of any such financings. In addition, the Company can raise funds through the sale of interests in its mineral properties, although current market conditions have substantially reduced the number of potential buyers/acquirers of any such interest(s). This situation is unlikely to change until such time as the Company can develop a bankable feasibility study on one of its projects. When acquiring an interest in mineral properties through purchase or option, the Company will sometimes issue common shares to the vendor or optionee of the property as partial or full consideration for the property interest in order to conserve its cash.
The condensed interim consolidated financial statements have been prepared on a going concern basis, which presume the realization of assets and discharge of liabilities in the normal course of business for the foreseeable future. The Company’s ability to continue as a going concern is dependent upon achieving profitable operations and/or obtaining additional financing.
In assessing whether the going concern assumption is appropriate, management takes into account all available information about the future within one year from the date the condensed interim consolidated financial statements are issued. There is substantial doubt upon the Company’s ability to continue as going concern, as explained below and in the financial statements.
| 40 |
The Company has sustained significant losses from operations, has negative cash flows, and has an ongoing requirement for capital investment to explore its mineral properties. Based on its current plans, budgeted expenditures, and cash requirements, the Company has sufficient cash to finance its current plans for the 12 months from the date the condensed interim consolidated financial statement.
The Company reported cash and cash equivalents of $4,571,455 as at February 28, 2018 compared to $1,300,553 as at May 31, 2017. The change in cash position was the net result of $6,478,921 used for operating activities, $7,710 used on property and equipment, $38,384 used on capitalized acquisition costs, $9,966,014 received from the private placements of common shares in July and December 2017 (net of share issue costs), and exercise of stock options during the period ended February 28, 2018.
As at February 28, 2018, the Company had working capital of $4,567,471 compared to working capital of $1,270,168 as at May 31, 2017. On July 6, 2017, the Company closed a non-brokered private placement equity financing and issued 6,200,000 common shares at a price of $0.75 per share for gross proceeds of $4,650,000. On December 7, 2017, the Company closed a non-brokered private placement equity financing and issued 2,829,130 common shares at a price of $1.15 per share for gross proceeds of $3,253,499 and 1,574,803 common shares at a price of $1.27 per common share for gross proceeds of $2,000,000. The Company expects that it will operate at a loss for the foreseeable future and believes the current cash and cash equivalents will be sufficient for it to maintain its currently held properties, and fund its currently anticipated general and administrative costs until May 31, 2019. Following May 31, 2019, the Company will need to scale back anticipated activities and costs or raise additional financing to fund operations through the year ending May 31, 2020. The Company’s current anticipated operating expenses are $1,493,000 until May 31, 2018 and $3,740,000 until February 28, 2019. The Company’s anticipated monthly burn rate averages approximately $498,000 for March 2018 to May 2018, where approximately $174,000 is budgeted for administrative purposes and approximately $324,000 is for planned exploration expenditures related to the completion of the ongoing exploration programs at the NBP and the Mother Lode Property. From March 2018 to February 2019, the Company’s anticipated monthly burn rate averages approximately $312,000, of which $231,000 is budgeted for administrative purposes and approximately $81,000 is for planned exploration expenditures related to the ongoing exploration programs at the NBP and the Mother Lode Property. In any event, the Company will be required to raise additional funds, again through public or private equity financings, prior to the end of September 2019 in order to continue in business. Should such financing not be available in that time-frame, the Company will be required to reduce its activities and will not be able to carry out all of its presently planned exploration and development activities at the NBP and the Mother Lode Property on its currently anticipated scheduling.
Despite the Company’s success to date in raising significant equity financing to fund its operations, there is significant uncertainty that the Company will be able to secure any additional financing in the current or future equity markets. See “Risk Factors – We will require additional financing to fund exploration and, if warranted, development and production” in the Company’s Annual Report on Form 10-K as filed with the SEC on June 29, 2017. Failure to obtain additional financing could have a material adverse effect on our financial condition and results of operation and could cast uncertainty on our ability to continue as a going concern. The quantity of funds to be raised and the terms of any proposed equity financing that may be undertaken will be negotiated by management as opportunities to raise funds arise. Specific plans related to the use of proceeds will be devised once any financing has been completed and management knows what funds will be available for these purposes. Due to this uncertainty, if the Company is unable to secure additional financing, it may be required to reduce all discretionary activities at the NBP and the Mother Lode Property to preserve its working capital to fund anticipated non-discretionary expenditures beyond the 2019 fiscal year.
The Company has no exposure to any asset-backed commercial paper. Other than cash held by its subsidiaries for their immediate operating needs in Alaska and Nevada, all of the Company’s cash reserves are on deposit with a major Canadian chartered bank. The Company does not believe that the credit, liquidity or market risks with respect thereto have increased as a result of the current market conditions. However, in order to achieve greater security for the preservation of its capital, the Company has, of necessity, been required to accept lower rates of interest, which has also lowered its potential interest income.
Off-Balance Sheet Arrangements
The Company has no off-balance sheet arrangements.
Environmental Regulations
The operations of the Company may in the future be affected from time to time in varying degrees by changes in environmental regulations, including those for future removal and site restoration costs. Both the likelihood of new regulations and their overall effect upon the Company vary greatly and are not predictable. The Company’s policy is to meet or, if possible, surpass standards set by relevant legislation by application of technically proven and economically feasible measures.
| 41 |
Certain U.S. Federal Income Tax Considerations for U.S. Holders
The Company has been a “passive foreign investment company” (“PFIC”) for U.S. federal income tax purposes in recent years and expects to continue to be a PFIC in the future. Current and prospective U.S. shareholders should consult their tax advisors as to the tax consequences of PFIC classification and the U.S. federal tax treatment of PFICs. Additional information on this matter is included in the Company’s Annual Report on Form 10-K as filed with the SEC on June 29, 2017, under “Certain United States Federal Income Tax Considerations”.
Emerging Growth Company Status
We qualify as an “emerging growth company” as defined in Section 101 of the Jumpstart our Business Startups Act as we do not have more than $1,000,000,000 in annual gross revenue and did not have such amount as of May 31, 2017, being the last day of our last fiscal year.
We may lose our status as an emerging growth company on the last day of our fiscal year during which (i) our annual gross revenue exceeds $1,000,000,000 or (ii) we issue more than $1,000,000,000 in non-convertible debt in a three-year period. We will lose our status as an emerging growth company if at any time we are deemed to be a large accelerated filer. We will lose our status as an emerging growth company on the last day of our fiscal year following the fifth anniversary of the date of the first sale of common equity securities pursuant to an effective registration statement (August 28, 2019).
As an emerging growth company, we are exempt from Section 404(b) of the Sarbanes-Oxley Act of 2002 and Section 14A (a) and (b) of the Securities Exchange Act of 1934. Such sections are provided below:
| · | Section 404(b) of the Sarbanes-Oxley Act of 2002 requires a public company’s auditor to attest to, and report on, management's assessment of its internal controls. |
| · | Sections 14A(a) and (b) of the Securities and Exchange Act, implemented by Section 951 of the Dodd-Frank Act, require companies to hold shareholder advisory votes on executive compensation and golden parachute compensation. |
As long as we qualify as an emerging growth company, we will not be required to comply with the requirements of Section 404(b) of the Sarbanes-Oxley Act of 2002 and Section 14A(a) and (b) of the Securities Exchange Act of 1934, we may however determine to voluntarily comply with such requirements in our discretion.
ITEM 3. QUANTITATIVE AND QUALITATIVE DISCLOSURES ABOUT MARKET RISK
Not applicable.
ITEM 4. CONTROLS AND PROCEDURES
Disclosure Controls and Procedures
As of February 28, 2018 an evaluation was carried out under the supervision of and with the participation of the Company’s management, including the Chief Executive Officer (the principal executive officer) and Chief Financial Officer (the principal financial officer and accounting officer), of the effectiveness of the design and operation of the Company’s disclosure controls and procedures (as defined in Rules 13a-15I and 15d-15(e) of the Exchange Act). Based on the evaluation, the Chief Executive Officer and the Chief Financial Officer have concluded that, as of February 28, 2018, the Company’s disclosure controls and procedures were effective in ensuring that: (i) information required to be disclosed in reports filed or submitted to the SEC under the Exchange Act is recorded, processed, summarized and reported within the time periods specified in applicable rules and forms and (ii) material information required to be disclosed in our reports filed under the Exchange Act is accumulated and communicated to management, including the Chief Executive Officer and Chief Financial Officer, in a manner that allows for accurate and timely decisions regarding required disclosures.
The effectiveness of our or any system of disclosure controls and procedures, however well designed and operated, can provide only reasonable assurance that the objectives of the system will be met and is subject to certain limitations, including the exercise of judgement in designing, implementing and evaluating controls and procedures and the assumptions used in identifying the likelihood of future events.
Changes in Internal Control over Financial Reporting
There were no changes in internal control over financial reporting during the period ended February 28, 2018 that have materially, or are reasonably likely to materially affect, the Company’s internal control over financial reporting.
| 42 |
None.
There have been no material changes from the risk factors set forth in our Annual Report on Form 10-K as filed with the SEC on June 29, 2017.
ITEM 2. UNREGISTERED SALES OF EQUITY SECURITIES AND USE OF PROCEEDS
Unregistered Sales of Equity Securities
All sales of unregistered equity securities during the period covered by this report were previously reported on Form 8-K.
Repurchase of Securities
None
ITEM 3. DEFAULTS UPON SENIOR SECURITIES
None.
ITEM 4. MINE SAFETY DISCLOSURES
Pursuant to Section 1503(a) of the Dodd-Frank Act, issuers that are operators, or that have a subsidiary that is an operator, of a coal or other mine in the United States are required to disclose specified information about mine health and safety in their periodic reports. These reporting requirements are based on the safety and health requirements applicable to mines under the Federal Mine Safety and Health Act of 1977 (the “Mine Act”) which is administered by the U.S. Department of Labor’s Mine Safety and Health Administration (“MSHA”). During the nine months period ended February 28, 2018, the Company and its subsidiaries and their properties or operations were not subject to regulation by MSHA under the Mine Act and thus no disclosure is required under Section 1503(a) of the Dodd-Frank Act.
On January 1, 2018, the Company amended Schedule B to the Consulting Agreement with Blue Pegasus Consulting Inc., dated June 1, 2011, as amended October 12, 2017, pursuant to which the Company contracts the services of its Chief Financial Officer, Peggy Wu (the “Consultant”). Pursuant to the amended Schedule B the Company increased the base amount of compensation to the Consultant from $6,666.67 per month to $7,500 per month.
| 43 |
| (1) | Submitted Electronically Herewith. Attached as Exhibit 101 to this report are the following formatted in XBRL (Extensible Business Reporting Language): (i) the Condensed Interim Consolidated Balance Sheets at February 28, 2018 and May 31, 2017, (ii) the Condensed Interim Consolidated Statements of Operations and Comprehensive Loss for the Nine Months and Three Months ended February 28, 2018 and February 28, 2017, (iii) the Condensed Interim Consolidated Statements of Cash Flows for the Nine Months Ended February 28, 2018 and February 28, 2017, (iv) the Condensed Interim Consolidated Statement of Changes in Equity for the Nine Months Ended February 28, 2018, (v) the Notes to the Condensed Interim Consolidated Financial Statements. |
| 44 |
Pursuant to the requirements of Section 13 or 15(d) of the Securities Exchange Act of 1934, the registrant has duly caused this report to be signed on its behalf by the undersigned, thereunto duly authorized.
CORVUS GOLD INC.
(the Registrant)
| By: | /s/ Jeffrey Pontius | ||
| Jeffrey Pontius | |||
| Chief Executive Officer | |||
| (Principal Executive Officer) | |||
| Date: April 9, 2018 | |||
| By: | /s/ Peggy Wu | ||
| Peggy Wu | |||
| Chief Financial Officer | |||
| (Principal Financial and Accounting Officer) | |||
| Date: April 9, 2018 | |||
45