Attached files
| file | filename |
|---|---|
| EX-32.1 - EXHIBIT 32.1 - Corvus Gold Inc. | v421031_ex32-1.htm |
| EX-23.4 - EXHIBIT 23.4 - Corvus Gold Inc. | v421031_ex23-4.htm |
| EX-23.3 - EXHIBIT 23.3 - Corvus Gold Inc. | v421031_ex23-3.htm |
| EX-23.2 - EXHIBIT 23.2 - Corvus Gold Inc. | v421031_ex23-2.htm |
| EX-23.1 - EXHIBIT 23.1 - Corvus Gold Inc. | v421031_ex23-1.htm |
| EX-31.1 - EXHIBIT 31.1 - Corvus Gold Inc. | v421031_ex31-1.htm |
| EX-31.2 - EXHIBIT 31.2 - Corvus Gold Inc. | v421031_ex31-2.htm |
| EX-32.2 - EXHIBIT 32.2 - Corvus Gold Inc. | v421031_ex32-2.htm |
UNITED STATES
SECURITIES AND EXCHANGE COMMISSION
Washington, D.C. 20549
FORM 10-Q
| x | QUARTERLY REPORT PURSUANT TO SECTION 13 OR 15(d) OF THE SECURITIES EXCHANGE ACT OF 1934 | |
| For the quarterly period ended August 31, 2015 | ||
| OR | ||
| ¨ | TRANSITION REPORT PURSUANT TO SECTION 13 OR 15(d) OF THE SECURITIES EXCHANGE ACT OF 1934 | |
For the transition period from to
| Commission file number: 000-55447 |

CORVUS GOLD INC.
(Exact Name of Registrant as Specified in its Charter)
| British Columbia, Canada | 98-0668473 |
| (State or other jurisdiction of incorporation or organization) |
(I.R.S. Employer Identification No.) |
| 2300-1177 West Hastings Street Vancouver, British Columbia, Canada, |
V6E 2K3 |
| (Address of Principal Executive Offices) | (Zip code) |
Registrant’s telephone number, including area code: (604) 638-3246
Indicate by check mark whether the registrant (1) has filed all reports required to be filed by Section 13 or 15(d) of the Securities Exchange Act of 1934 during the preceding 12 months (or for such shorter period that the registrant was required to file such reports), and (2) has been subject to such filing requirements for the past 90 days.
Yes x No ¨
Indicate by check mark whether the registrant has submitted electronically and posted on its corporate Web site, if any, every Interactive Data File required to be submitted and posted pursuant to Rule 405 of Regulation S-T (§232.405 of this chapter) during the preceding 12 months (or for such shorter period that the registrant was required to submit and post such files).
Yes x No ¨
Indicate by check mark whether the registrant is a large accelerated filer, an accelerated filer, a non-accelerated filer, or a smaller reporting company. See the definitions of “large accelerated filer,” “accelerated filer” and “smaller reporting company” in Rule 12b-2 of the Exchange Act. (Check one):
| Large Accelerated Filer ¨ | Accelerated Filer ¨ |
|
Non-Accelerated filer ¨ (Do not check if a smaller reporting company) |
Small Reporting company x |
Indicate by check mark whether the registrant is a shell company (as defined in Rule 12b-2 of the Exchange Act).Yes ¨ No x
As of October 8, 2015, the registrant had 84,424,248 Common Shares outstanding.
Table of Contents
| Page | ||
| PART I | FINANCIAL INFORMATION | |
| ITEM 1 | FINANCIAL STATEMENTS | 3 |
| ITEM 2 | MANAGEMENT’S DISCUSSION AND ANALYSIS OF FINANCIAL CONDITION AND RESULTS OF OPERATIONS | 19 |
| ITEM 3 | QUANTITATIVE AND QUALITATIVE DISCLOSURES ABOUT MARKET RISK | 40 |
| ITEM 4 | CONTROLS AND PROCEDURES | 40 |
| PART II | OTHER INFORMATION | |
| ITEM 1 | LEGAL PROCEEDINGS | 41 |
| ITEM 1A | RISK FACTORS | 41 |
| ITEM 2 | UNREGISTERED SALES OF EQUITY SECURITIES AND USE OF PROCEEDS | 41 |
| ITEM 3 | DEFAULTS UPON SENIOR SECURITIES | 42 |
| ITEM 4 | MINE SAFETY DISCLOSURES | 42 |
| ITEM 5 | OTHER INFORMATION | 42 |
| ITEM 6 | EXHIBITS | 43 |
| SIGNATURES | 44 |
CORVUS GOLD INC.
CONDENSED INTERIM CONSOLIDATED BALANCE SHEETS
(Expressed in Canadian dollars)
August 31, 2015 | May 31, 2015 | |||||||
| (Unaudited) | ||||||||
| ASSETS | ||||||||
| Current assets | ||||||||
| Cash and cash equivalents | $ | 3,637,665 | $ | 5,159,962 | ||||
| Accounts receivable | 28,108 | 26,015 | ||||||
| Prepaid expenses | 191,629 | 248,679 | ||||||
| Total current assets | 3,857,402 | 5,434,656 | ||||||
| Property and equipment (note 4) | 95,663 | 96,703 | ||||||
| Capitalized acquisition costs (note 5) | 5,142,115 | 4,866,634 | ||||||
| Total assets | $ | 9,095,180 | $ | 10,397,993 | ||||
| LIABILITIES AND SHAREHOLDERS’ EQUITY | ||||||||
| Current liabilities | ||||||||
| Accounts payable and accrued liabilities (note 8) | $ | 295,781 | $ | 419,228 | ||||
| Promissory note payable (note 6) | 315,768 | 298,488 | ||||||
| Total current liabilities | 611,549 | 717,716 | ||||||
| Asset retirement obligations (note 5) | 140,254 | 132,579 | ||||||
| Total liabilities | 751,803 | 850,295 | ||||||
| Shareholders’ equity | ||||||||
| Share capital (note 7) | 64,256,889 | 64,256,889 | ||||||
| Contributed surplus (note 7) | 11,542,167 | 11,247,286 | ||||||
| Accumulated other comprehensive income - cumulative translation differences | 1,175,439 | 853,349 | ||||||
| Deficit accumulated during the exploration stage | (68,631,118 | ) | (66,809,826 | ) | ||||
| Total shareholders’ equity | 8,343,377 | 9,547,698 | ||||||
| Total liabilities and shareholders’ equity | $ | 9,095,180 | $ | 10,397,993 | ||||
Nature and continuance of operations (note 2)
Subsequent events (note 12)
Approved on behalf of the Directors:
| “Jeffrey Pontius” | Director |
| “Anton Drescher” | Director |
These accompanying notes form an integral part of these condensed interim consolidated financial statements
3
CORVUS GOLD INC.
CONDENSED INTERIM CONSOLIDATED STATEMENTS OF OPERATIONS AND COMPREHENSIVE LOSS
(Unaudited)
(Expressed in Canadian dollars)
THREE MONTHS ENDED AUGUST 31,
| 2015 | 2014 | |||||||
| Operating expenses | ||||||||
| Administration | $ | 2,775 | $ | 3,015 | ||||
| Consulting fees (notes 7 and 8) | 192,393 | 168,826 | ||||||
| Depreciation (note 4) | 6,300 | 6,115 | ||||||
| Exploration expenditures (notes 5 and 7) | 790,059 | 1,489,088 | ||||||
| Insurance | 31,060 | 11,462 | ||||||
| Investor relations (notes 7 and 8) | 164,774 | 184,524 | ||||||
| Office and miscellaneous | 38,622 | 35,343 | ||||||
| Professional fees (notes 7 and 8) | 70,482 | 114,489 | ||||||
| Regulatory | 26,981 | 55,157 | ||||||
| Rent | 26,300 | 23,121 | ||||||
| Travel | 17,675 | 12,244 | ||||||
| Wages and benefits (notes 7 and 8) | 579,010 | 447,970 | ||||||
| Total operating expenses | (1,946,431 | ) | (2,551,354 | ) | ||||
| Other income (expense) | ||||||||
| Interest income | 5,565 | 1,770 | ||||||
| Gain on sale of capitalized acquisition costs (note 5(b)) | 25,728 | - | ||||||
| Unrealized loss on marketable securities | - | (38,977 | ) | |||||
| Foreign exchange gain (loss) | 93,846 | (38,457 | ) | |||||
| Total other income (expense) | 125,139 | (75,664 | ) | |||||
| Net loss for the period | (1,821,292 | ) | (2,627,018 | ) | ||||
| Other comprehensive income | ||||||||
| Exchange difference on translating foreign operations | 322,090 | 13,271 | ||||||
| Comprehensive loss for the period | $ | (1,499,202 | ) | $ | (2,613,747 | ) | ||
| Basic and diluted net loss per share | $ | (0.02 | ) | $ | (0.04 | ) | ||
| Weighted average number of shares outstanding | 80,168,928 | 70,694,919 | ||||||
These accompanying notes form an integral part of these condensed interim consolidated financial statements
4
CORVUS GOLD INC.
CONDENSED INTERIM CONSOLIDATED STATEMENTS OF CASH FLOWS
(Unaudited)
(Expressed in Canadian dollars)
THREE MONTHS ENDED AUGUST 31,
| 2015 | 2014 | |||||||
| Operating activities | ||||||||
| Net loss for the period | $ | (1,821,292 | ) | $ | (2,627,018 | ) | ||
| Add items not affecting cash: | ||||||||
| Depreciation | 6,300 | 6,115 | ||||||
| Stock-based compensation (note 7) | 294,881 | 456,481 | ||||||
| Gain on sale of capitalized acquisition costs (note 5(b)) | (25,728 | ) | - | |||||
| Unrealized loss on marketable securities | - | 38,977 | ||||||
| (Gain) loss on foreign exchange | (93,846 | ) | 38,457 | |||||
| Changes in non-cash items: | ||||||||
| Accounts receivable | (2,093 | ) | (33,057 | ) | ||||
| Prepaid expenses | 57,050 | (10,980 | ) | |||||
| Accounts payable and accrued liabilities | (123,447 | ) | (405,890 | ) | ||||
| Cash used in operating activities | (1,708,175 | ) | (2,536,915 | ) | ||||
| Financing activities | ||||||||
| Cash received from issuance of shares | - | 6,180,000 | ||||||
| Share issuance costs | - | (190,167 | ) | |||||
| Cash provided by financing activities | - | 5,989,833 | ||||||
| Investing activities | ||||||||
| Expenditures on property and equipment | - | (932 | ) | |||||
| Cash received from sale of capitalized acquisition costs | 25,728 | - | ||||||
| Cash provided by (used in) investing activities | 25,728 | (932 | ) | |||||
| Effect of foreign exchange on cash | 160,150 | (37,874 | ) | |||||
| Increase (decrease) in cash and cash equivalents | (1,522,297 | ) | 3,414,112 | |||||
| Cash and cash equivalents, beginning of the period | 5,159,962 | 3,227,970 | ||||||
| Cash and cash equivalents, end of the period | $ | 3,637,665 | $ | 6,642,082 | ||||
Supplemental cash flow information (note 11)
These accompanying notes form an integral part of these condensed interim consolidated financial statements
5
CORVUS GOLD INC.
CONDENSED INTERIM CONSOLIDATED STATEMENT OF CHANGES IN EQUITY
(Unaudited)
(Expressed in Canadian dollars)
| Number of shares | Amount | Contributed Surplus | Accumulated Other Comprehensive Income(Loss) – Cumulative Translation Differences | Deficit | Total | |||||||||||||||||||
| Balance, May 31, 2015 | 80,168,928 | $ | 64,256,889 | $ | 11,247,286 | $ | 853,349 | $ | (66,809,826 | ) | $ | 9,547,698 | ||||||||||||
| Net loss for the period | - | - | - | - | (1,821,292 | ) | (1,821,292 | ) | ||||||||||||||||
| Other comprehensive income | ||||||||||||||||||||||||
| Exchange difference on translating foreign operations | - | - | - | 322,090 | - | 322,090 | ||||||||||||||||||
| Stock-based compensation | - | - | 294,881 | - | - | 294,881 | ||||||||||||||||||
| Balance, August 31, 2015 | 80,168,928 | $ | 64,256,889 | $ | 11,542,167 | $ | 1,175,439 | $ | (68,631,118 | ) | $ | 8,343,377 | ||||||||||||
These accompanying notes form an integral part of these condensed interim consolidated financial statements
6
| CORVUS GOLD INC. |
| NOTES TO THE CONDENSED INTERIM CONSOLIDATED FINANCIAL STATEMENTS |
| (Unaudited) |
| (Expressed in Canadian dollars) |
| THREE MONTHS ENDED AUGUST 31, 2015 AND 2014 |
| 1. | PLAN OF ARRANGEMENT AND TRANSFER OF ASSETS |
On August 25, 2010, International Tower Hill Mines Ltd. (“ITH”) completed a Plan of Arrangement (the “Arrangement”) under the Business Corporations Act (British Columbia) (“BCBCA”) whereby its existing Alaska mineral properties (other than the Livengood project) and related assets and the North Bullfrog mineral property and related assets in Nevada (collectively, the “Nevada and Other Alaska Business”) were indirectly spun out into a new public company, being Corvus Gold Inc. (“Corvus” or the “Company”).
The Arrangement was approved by the board of directors of each of ITH and Corvus and by the shareholders of ITH and was accepted for filing by the Toronto Stock Exchange (“TSX”) on behalf of both ITH and Corvus. In connection with the completion of the Arrangement, the common shares of Corvus were listed on the TSX.
Under the Arrangement, each shareholder of ITH received (as a return of capital) one Corvus common share for every two ITH common shares held as at the effective date of the Arrangement and exchanged each old common share of ITH for a new common share of ITH. As part of the Arrangement, ITH transferred its wholly-owned subsidiary Corvus Gold Nevada Inc. (formerly Talon Gold Nevada Inc.) (“Corvus Nevada”), incorporated in Nevada, United States (which held the North Bullfrog property), to Corvus and a wholly-owned Alaskan subsidiary of ITH sold to Raven Gold Alaska Inc. (“Raven Gold”), incorporated in Alaska, United States, a wholly owned subsidiary of Corvus, the Terra, Chisna, LMS and West Pogo properties. As a consequence of the completion of the Arrangement, Corvus now holds the Terra, Chisna, LMS, West Pogo and North Bullfrog properties (the “Spin-out Properties”).
The Company’s consolidated financial statements reflect the Balance Sheets and Statement of Changes in Shareholders’ Equity of the Nevada and Other Alaska Business as if Corvus existed in its present form since the inception of the business on June 1, 2006. The financial statements have been presented under the predecessor basis of accounting with Balance Sheet amounts based on the amounts recorded by ITH. Management cautions readers of these financial statements that the allocation of expenses does not necessarily reflect future general and administrative expenses.
The deficit of the Company at August 25, 2010 was calculated on the basis of the ratio of costs incurred on the Spin-out Properties in each period as compared to the costs incurred on all mineral properties of ITH in each of these periods to the cumulative transactions relating to the Spin-out Properties from the date of acquisition of those mineral properties to August 25, 2010 and includes an allocation of ITH’s general and administrative expenses from the date of acquisition of those mineral properties to August 25, 2010. The allocation of general and administrative expense was calculated on the basis of the ratio of costs incurred on the Spin-out Properties in each prior year as compared to the costs incurred on all mineral properties and exploration costs of ITH in each of those prior years. Subsequent to August 25, 2010, ITH has not incurred any expenses on behalf of Corvus and therefore, no allocation of ITH expenses subsequent to that date has occurred.
| 2. | NATURE AND CONTINUANCE OF OPERATIONS |
The Company was incorporated on April 13, 2010 under the BCBCA. These consolidated financial statements reflect the cumulative operating results of the predecessor, as related to the mineral properties that were transferred to the Company from June 1, 2006.
The Company is engaged in the business of acquiring, exploring and evaluating mineral properties, and either joint venturing or developing these properties further or disposing of them when the evaluation is completed. At August 31, 2015, the Company had interests in properties in Alaska and Nevada, U.S.A.
The business of mining and exploration involves a high degree of risk and there can be no assurance that current exploration programs will result in profitable mining operations. The Company has no source of revenue, and has significant cash requirements to meet its administrative overhead and maintain its mineral property interests. The recoverability of amounts shown for mineral properties is dependent on several factors. These include the discovery of economically recoverable reserves, the ability of the Company to obtain the necessary financing to complete the development of these properties, and future profitable production or proceeds from disposition of mineral properties. The carrying value of the Company’s mineral properties does not reflect current or future values.
7
| CORVUS GOLD INC. |
| NOTES TO THE CONDENSED INTERIM CONSOLIDATED FINANCIAL STATEMENTS |
| (Unaudited) |
| (Expressed in Canadian dollars) |
| THREE MONTHS ENDED AUGUST 31, 2015 AND 2014 |
These condensed interim consolidated financial statements have been prepared on a going concern basis, which presume the realization of assets and discharge of liabilities in the normal course of business for the foreseeable future. The Company’s ability to continue as a going concern is dependent upon achieving profitable operations and/or obtaining additional financing.
In assessing whether the going concern assumption is appropriate, management takes into account all available information about the future within one year from the date the condensed interim consolidated financial statements are issued. There is substantial doubt upon the Company’s ability to continue as going concern, as explained in the following paragraphs.
The Company has sustained losses from operations, and has an ongoing requirement for capital investment to explore its mineral properties. As at August 31, 2015, the Company had working capital of $3,245,853 compared to working capital of $4,716,940 as at May 31, 2015. Based on its current plans, budgeted expenditures, and cash requirements, the Company does not have sufficient cash to finance its current plans for the 12 months from the date the condensed interim consolidated financial statement are issued and will be required to raise additional funds through public or private equity financings, significantly reduce exploration expenditures and administrative expenses, or consider other options such as sales of its mineral properties, in order to continue in business.
The Company also expects that it will need to raise substantial additional capital to accomplish its business plan over the next several years. Should such financing not be available in that time-frame, the Company will be required to reduce its activities and will not be able to carry out all of its presently planned exploration and development activities on its currently anticipated scheduling.
These condensed interim consolidated financial statements do not include any adjustments to the amounts and classification of assets and liabilities that might be necessary should the Company be unable to continue in business.
| 3. | SIGNIFICANT ACCOUNTING POLICIES |
Basis of presentation
These unaudited condensed consolidated interim financial statements have been prepared in accordance with accounting principles generally accepted in the United States (“U.S. GAAP”) for interim financial information and with the instructions to Form 10-Q and Article 10 of Regulation S-X under the Securities Exchange Act of 1934, as amended. Accordingly, they do not include all of the information and footnotes required by U.S. GAAP for annual financial statements. These unaudited condensed interim consolidated financial statements should be read in conjunction with the audited consolidated financial statements for the year ended May 31, 2015 as filed in our Annual Report on Form 10-K. In the opinion of the Company’s management these financial statements reflect all adjustments, consisting of normal recurring adjustments, necessary to present fairly the Company’s financial position at August 31, 2015 and the results of its operations for the three months then ended. Operating results for the three months ended August 31, 2015 are not necessarily indicative of the results that may be expected for the year ending May 31, 2016. The 2015 year-end balance sheet data was derived from audited financial statements but does not include all disclosures required by U.S. GAAP.
The preparation of financial statements in conformity with US GAAP requires management to make judgments, estimates and assumptions that affect the reported amounts of assets and liabilities and disclosure of contingent assets and liabilities at the date of the financial statements, and the reported amounts of revenues and expenses during the period. These judgments, estimates and assumptions are continuously evaluated and are based on management’s experience and knowledge of the relevant facts and circumstances. While management believes the estimates to be reasonable, actual results could differ from those estimates and could impact future results of operations and cash flows.
Basis of consolidation
These unaudited condensed interim consolidated financial statements include the accounts of the Company and its wholly-owned subsidiaries (collectively, the “Group”), Corvus Gold (USA) Inc. (“Corvus USA”) (a Nevada corporation), Corvus Gold Nevada Inc. (“Corvus Nevada”) (a Nevada corporation), Raven Gold Alaska Inc. (“Raven Gold”) (an Alaska corporation) and SoN Land and Water LLC (“SoN”) (a Nevada limited liability company). All intercompany transactions and balances were eliminated upon consolidation.
Earnings (loss) per share
Basic loss per share is calculated using the weighted average number of common shares outstanding during the period. The Company uses the treasury stock method to compute the dilutive effect of options, warrants and similar instruments. Under this method, the dilutive effect on earnings (loss) per share is calculated presuming the exercise of outstanding options, warrants and similar instruments. It assumes that the proceeds of such exercise would be used to repurchase common shares at the average market price during the period. However, the calculation of diluted loss per share excludes the effects of various conversions and exercise of options and warrants that would be anti-dilutive. For the period ended August 31, 2015, 7,376,334 outstanding stock options (2014 – 6,175,234) were not included in the calculation of diluted earnings (loss) per share as their inclusion was anti-dilutive.
8
| CORVUS GOLD INC. |
| NOTES TO THE CONDENSED INTERIM CONSOLIDATED FINANCIAL STATEMENTS |
| (Unaudited) |
| (Expressed in Canadian dollars) |
| THREE MONTHS ENDED AUGUST 31, 2015 AND 2014 |
| 4. | PROPERTY AND EQUIPMENT |
| Computer Equipment | Vehicles | Tent | Total | |||||||||||||
| Cost | ||||||||||||||||
| Balance, May 31, 2015 | $ | 58,946 | $ | 84,843 | $ | 62,185 | $ | 205,974 | ||||||||
| Currency translation adjustments | 2,979 | 4,912 | 3,600 | 11,491 | ||||||||||||
| Balance, August 31, 2015 | $ | 61,925 | $ | 89,755 | $ | 65,785 | $ | 217,465 | ||||||||
| Depreciation | ||||||||||||||||
| Balance, May 31, 2015 | $ | 32,635 | $ | 59,223 | $ | 17,413 | $ | 109,271 | ||||||||
| Depreciation for the period | 2,022 | 1,976 | 2,302 | 6,300 | ||||||||||||
| Currency translation adjustments | 1,672 | 3,485 | 1,074 | 6,231 | ||||||||||||
| Balance, August 31, 2015 | $ | 36,329 | $ | 64,684 | $ | 20,789 | $ | 121,802 | ||||||||
| Carrying amounts | ||||||||||||||||
| Balance, May 31, 2015 | $ | 26,311 | $ | 25,620 | $ | 44,772 | $ | 96,703 | ||||||||
| Balance, August 31, 2015 | $ | 25,596 | $ | 25,071 | $ | 44,996 | $ | 95,663 | ||||||||
| 5. | MINERAL PROPERTIES |
The Company had the following activity related to capitalized acquisition costs:
| Chisna | North Bullfrog | LMS | Total | |||||||||||||
| (note 5(a)) | (notes 5(d)) | (note 5(c)) | ||||||||||||||
| Balance, May 31, 2015 | $ | 631,205 | $ | 3,861,412 | $ | 374,017 | $ | 4,866,634 | ||||||||
| Acquisition costs | - | - | - | - | ||||||||||||
| Currency translation adjustments | 36,542 | 217,287 | 21,652 | 275,481 | ||||||||||||
| Balance, August 31, 2015 | $ | 667,747 | $ | 4,078,699 | $ | 395,669 | $ | 5,142,115 | ||||||||
9
| CORVUS GOLD INC. |
| NOTES TO THE CONDENSED INTERIM CONSOLIDATED FINANCIAL STATEMENTS |
| (Unaudited) |
| (Expressed in Canadian dollars) |
| THREE MONTHS ENDED AUGUST 31, 2015 AND 2014 |
The following table presents costs incurred for exploration and evaluation activities for the three months ended August 31, 2015:
| West Pogo | Chisna | North Bullfrog | LMS | Total | ||||||||||||||||
| (note 5(b)) | (note 5(a)) | (notes 5(d)) | (note 5(c)) | |||||||||||||||||
| Exploration costs: | ||||||||||||||||||||
| Assay | $ | - | $ | - | $ | 179,175 | $ | - | $ | 179,175 | ||||||||||
| Drilling | - | - | 137,820 | - | 137,820 | |||||||||||||||
| Equipment rental | - | - | 9,676 | - | 9,676 | |||||||||||||||
| Field costs | 181 | 90 | 27,466 | 162 | 27,899 | |||||||||||||||
| Geological/ Geophysical | - | 6,210 | 143,228 | - | 149,438 | |||||||||||||||
| Land maintenance & tenure | - | - | 204,475 | - | 204,475 | |||||||||||||||
| Permits | - | - | 632 | - | 632 | |||||||||||||||
| Studies | - | - | 194,022 | - | 194,022 | |||||||||||||||
| Transportation | - | - | - | 823 | 823 | |||||||||||||||
| Travel | - | 913 | 21,244 | - | 22,157 | |||||||||||||||
| 181 | 7,213 | 917,738 | 985 | 926,117 | ||||||||||||||||
| Cost recovery | (23,802 | ) | (7,418 | ) | - | (104,838 | ) | (136,058 | ) | |||||||||||
| Total expenditures for the period | $ | (23,621 | ) | $ | (205 | ) | $ | 917,738 | $ | (103,853 | ) | $ | 790,059 | |||||||
The following table presents costs incurred for exploration and evaluation activities for the three months ended August 31, 2014:
| West Pogo | Chisna | North Bullfrog | LMS | Total | ||||||||||||||||
| (note 5(b)) | (note 5(a)) | (notes 5(d)) | (note 5(c)) | |||||||||||||||||
| Exploration costs: | ||||||||||||||||||||
| Aircraft services | $ | - | $ | 11,202 | $ | - | $ | - | $ | 11,202 | ||||||||||
| Assay | - | 8,865 | 211,632 | - | 220,497 | |||||||||||||||
| Drilling | - | - | 320,811 | - | 320,811 | |||||||||||||||
| Equipment rental | - | 1,466 | 102,388 | - | 103,854 | |||||||||||||||
| Field costs | 1,966 | 5,541 | 103,467 | 66 | 111,040 | |||||||||||||||
| Geological/ Geophysical | 3,558 | 1,811 | 224,429 | 27,220 | 257,018 | |||||||||||||||
| Land maintenance & tenure | - | - | 159,186 | - | 159,186 | |||||||||||||||
| Studies | - | - | 246,664 | - | 246,664 | |||||||||||||||
| Transportation | - | - | - | 298 | 298 | |||||||||||||||
| Travel | - | 5,133 | 51,962 | 1,423 | 58,518 | |||||||||||||||
| Total expenditures for the period | $ | 5,524 | $ | 34,018 | $ | 1,420,539 | $ | 29,007 | $ | 1,489,088 | ||||||||||
| a) | Chisna Property, Alaska |
The Chisna property is located in the eastern Alaska Range, Alaska, and is comprised of unpatented mineral claims owned 100% by the Company and fee simple lands leased from Ahtna Incorporated (“Ahtna”).
On November 2, 2009, ITH and Talon Gold Alaska, Inc. (ITH’s wholly-owned Alaskan subsidiary) entered into an agreement (as amended) with Ocean Park Ventures Corp. (“OPV”). Pursuant to the agreement, an Alaskan subsidiary of OPV and Raven Gold formed a joint venture for the purpose of exploring and developing the Chisna property.
On November 7, 2012, OPV withdrew from the joint venture and thereby returned 100% of the Chisna Project to the Company.
10
| CORVUS GOLD INC. |
| NOTES TO THE CONDENSED INTERIM CONSOLIDATED FINANCIAL STATEMENTS |
| (Unaudited) |
| (Expressed in Canadian dollars) |
| THREE MONTHS ENDED AUGUST 31, 2015 AND 2014 |
On March 24, 2010, Raven Gold entered into a Mineral Exploration Agreement with Option to Lease with Ahtna, an Alaska Native Regional Corporation, concerning approximately 26,516 hectares of fee simple lands in the Athell Area of Alaska surrounding or adjacent to some of the blocks of mineral claims owned by Raven Gold.
During the year ended May 31, 2015, the Company gave notification and terminated the Ahtna lease.
| b) | West Pogo Property, Alaska |
The West Pogo property is located approximately 50 kilometres north of Delta Junction, Alaska, and consists of unpatented mineral claims owned 100% by the Company.
During the year ended May 31, 2014, the Company wrote off the West Pogo property, as there had been a delay in exploration work on the property for an extended period of time.
On July 29, 2015, Raven Gold completed a transaction with Millrock Resources Inc. (“Millrock”) on the West Pogo and Goodpaster database projects in Alaska. The ownership position was sold for $25,728 (USD 20,000) and the Goodpaster database project was sold for $136,058 (USD 100,000) and reflected as cost recovery for the West Pogo and LMS project. For the West Pogo project, the Company retained net smelter return (“NSR”) royalties of 3% on precious metals and 1% on base metals with 1% of the precious metal royalty buy down for USD 2 million and a further 1% for an additional USD 5 million. For the Goodpaster database, the Company retained NSR royalty of 1% on all new claims acquired within the defined Area of Interest which totals some 1,500 square kilometres covering the largest gold producing District in Alaska. One half of the royalty can be purchased for USD 2 million.
| c) | LMS Property, Alaska |
The LMS property consists of unpatented mineral claims owned 100% by the Company.
| d) | North Bullfrog Project, Nevada |
The Company’s North Bullfrog project consists of certain leased patented lode mining claims and federal unpatented mining claims owned 100% by the Company.
11
| CORVUS GOLD INC. |
| NOTES TO THE CONDENSED INTERIM CONSOLIDATED FINANCIAL STATEMENTS |
| (Unaudited) |
| (Expressed in Canadian dollars) |
| THREE MONTHS ENDED AUGUST 31, 2015 AND 2014 |
| (i) | Interests acquired from Redstar Gold Corp. |
On October 9, 2009, a US subsidiary of ITH at the time (Corvus Nevada) completed the acquisition of all of the interests of Redstar Gold Corp. (“Redstar”) and Redstar Gold U.S.A. Inc. (“Redstar US”) in the North Bullfrog project, which consisted of the following leases:
| (1) | Pursuant to a mining lease and option to purchase agreement made effective October 27, 2008 between Redstar and an arm’s length limited liability company, Redstar has leased (and has the option to purchase) 12 patented mining claims referred to as the “Connection” property. The ten-year, renewable mining lease requires advance minimum royalty payments (recoupable from production royalties, but not applicable to the purchase price if the option to purchase is exercised) of USD 10,800 (paid) on signing and annual payments for the first three anniversaries of USD 10,800 (paid) and USD 16,200 for every year thereafter (paid to October 27, 2015). Redstar has an option to purchase the property (subject to the NSR royalty below) for USD 1,000,000 at any time during the life of the lease. Production is subject to a 4% NSR royalty, which may be purchased by the lessee for USD 1,250,000 per 1% (USD 5,000,000 for the entire royalty). |
| (2) | Pursuant to a mining lease made and entered into as of May 8, 2006 between Redstar and two arm’s length individuals, Redstar has leased 3 patented mining claims which form part of the North Bullfrog project holdings. The lease is for an initial term of 10 years, and for so long thereafter as mining activities continue on the claims or contiguous claims held by the lessee. The lessee is required to pay advance minimum royalty payments (recoupable from production royalties) of USD 4,000 on execution, USD 3,500 on each of May 8, 2007, 2008 and 2009 (paid), USD 4,500 on May 8, 2010 and each anniversary thereafter, adjusted for inflation (paid to May 8, 2015). The lessor is entitled to receive a 2% NSR royalty on all production, which may be purchased by the lessee for USD 1,000,000 per 1% (USD 2,000,000 for the entire royalty). |
| (3) | Pursuant to a mining lease made and entered into as of May 8, 2006 between Redstar and an arm’s length private Nevada corporation, Redstar has leased 2 patented mining claims which form part of the North Bullfrog project holdings. The lease is for an initial term of 10 years, and for so long thereafter as mining activities continue on the claims or contiguous claims held by the lessee. The lessee is required to pay advance minimum royalty payments (recoupable from production royalties) of USD 2,000 on execution, USD 2,000 on each of May 8, 2007, 2008 and 2009 (paid), USD 3,000 on May 8, 2010 and each anniversary thereafter, adjusted for inflation (paid to May 8, 2015). The lessor is entitled to receive a 3% NSR royalty on all production, which may be purchased by the lessee for USD 850,000 per 1% (USD 2,550,000 for the entire royalty). On May 29, 2014, the parties signed a First Amendment Agreement whereby the Lease is amended to provide that in addition to the Advance Minimum Royalty payments payable in respect of the Original Claims, the lessee will now pay to the lessor Advance Minimum Royalty payments in respect of the Yellow Rose Claims of USD 2,400 on execution, USD 2,400 on each of May 29, 2015, 2016 and 2017 (paid to May 29, 2015), USD 3,600 on May 29, 2018 and each anniversary thereafter. |
| (4) | Pursuant to a mining lease made and entered into as of May 16, 2006 between Redstar and an arm’s length individual, Redstar has leased 12 patented mineral claims which form part of the North Bullfrog project holdings. The lease is for an initial term of 10 years, and for so long thereafter as mining activities continue on the claims or contiguous claims held by the lessee. The lessee is required to pay advance minimum royalty payments (recoupable from production royalties) of USD 20,500 on execution and USD 20,000 on each anniversary thereafter (paid to May 16, 2015). The lessor is entitled to receive a 4% NSR royalty on all production, which may be purchased by the lessee for USD 1,000,000 per 1% (USD 4,000,000 for the entire royalty). |
12
| CORVUS GOLD INC. |
| NOTES TO THE CONDENSED INTERIM CONSOLIDATED FINANCIAL STATEMENTS |
| (Unaudited) |
| (Expressed in Canadian dollars) |
| THREE MONTHS ENDED AUGUST 31, 2015 AND 2014 |
| (5) | Pursuant to a mining lease made and entered into as of May 22, 2006 between Redstar and two arm’s length individuals, Redstar has leased 3 patented mineral claims which form part of the North Bullfrog project holdings. The lease is for an initial term of 10 years, and for so long thereafter as mining activities continue on the claims or contiguous claims held by the lessee. The lessee is required to pay advance minimum royalty payments (recoupable from production royalties) of USD 8,000 on execution, USD 4,800 on each of May 22, 2007, 2008 and 2009 (paid), USD 7,200 on May 22, 2010 and each anniversary thereafter, adjusted for inflation (paid to May 22, 2015). The lessor is entitled to receive a 2% NSR royalty on all production, which may be purchased by the lessee for USD 1,000,000 per 1% (USD 2,000,000 for the entire royalty). |
| (6) | Pursuant to a mining lease made and entered into as of June 16, 2006 between Redstar and an arm’s length individual, Redstar has leased one patented mineral claims which form part of the North Bullfrog project holdings. The lease is for an initial term of 10 years, and for so long thereafter as mining activities continue on the claims or contiguous claims held by the lessee. The lessee is required to pay advance minimum royalty payments (recoupable from production royalties) of USD 2,000 on execution, USD 2,000 on each of June 16, 2007, 2008 and 2009 (paid), USD 3,000 on June 16, 2010 and each anniversary thereafter, adjusted for inflation (paid to June 16, 2015). The lessor is entitled to receive a 2% NSR royalty on all production, which may be purchased by the lessee for USD 1,000,000 per 1% (USD 2,000,000 for the entire royalty). |
As a consequence of the acquisition of Redstar and Redstar US’s interest in the foregoing leases, Corvus Nevada is now the lessee under all of such leases. The Company acquired all of the shares of Corvus Nevada on August 26, 2010 upon the completion of the Arrangement.
| (ii) | Interests acquired directly by Corvus Nevada |
| (1) | Pursuant to a mining lease and option to purchase agreement made effective December 1, 2007 between Corvus Nevada and a group of arm’s length limited partnerships, Corvus Nevada has leased (and has the option to purchase) patented mining claims referred to as the “Mayflower” claims which form part of the North Bullfrog project. The terms of the lease/option are as follows: |
| ¤ | Terms: Initial term of five years, commencing December 1, 2007, with the option to extend the lease for an additional five years. The lease will continue for as long thereafter as the property is in commercial production or, alternatively, for an additional three years if Corvus Nevada makes advance minimum royalty payments of USD 100,000 per year (which are recoupable against actual production royalties). |
| ¤ | Lease Payments: USD 5,000 (paid) and 25,000 common shares of ITH (delivered) following regulatory acceptance of the transaction; and an additional USD 5,000 and 20,000 common shares on each of the first through fourth lease anniversaries (paid and issued). Pursuant to an agreement with the lessors, in lieu of the 20,000 ITH shares due December 1, 2010, Corvus Nevada paid USD 108,750 on November 10, 2010 and delivered 46,250 common shares of the Company on December 2, 2010. If Corvus Nevada elects to extend the lease for a second five-year term, it will pay USD 10,000 and deliver 50,000 common shares of ITH upon election being made, and an additional 50,000 common shares of ITH on each of the fifth through ninth anniversaries (USD 10,000 paid on October 31, 2012 and 50,000 common shares of ITH delivered on October 25, 2012 paid with cash of $126,924; and USD 10,000 paid on November 13, 2013 and 50,000 common shares of ITH delivered on November 25, 2013 paid with cash of $35,871, and USD 10,000 paid on November 17, 2014 and 50,000 common shares of ITH, purchased for $21,200 in the market by the Company, were delivered on November 7, 2014). |
| ¤ | Anti-Dilution: Pursuant to an amended agreement agreed to by the lessors in March 2015, the Company shall deliver a total of 85,000 common shares (issued) of the Company for the years 2011 to 2014 (2011: 10,000 common shares; 2012 to 2014: 25,000 common shares each year). All future payments will be satisfied by the delivery of an additional ½ common shares of the Company for each of the ITH shares due per the original agreement. |
13
| CORVUS GOLD INC. |
| NOTES TO THE CONDENSED INTERIM CONSOLIDATED FINANCIAL STATEMENTS |
| (Unaudited) |
| (Expressed in Canadian dollars) |
| THREE MONTHS ENDED AUGUST 31, 2015 AND 2014 |
| ¤ | Work Commitments: USD 100,000 per year for the first three years (incurred), USD 200,000 per year for the years 4 – 6 (incurred) and USD 300,000 for the years 7 – 10. Excess expenditures in any year may be carried forward. If Corvus Nevada does not incur the required expenditures in year one, the deficiency is required to be paid to the lessors. |
| ¤ | Retained Royalty: Corvus Nevada will pay the lessors a NSR royalty of 2% if the average gold price is USD 400 per ounce or less, 3% if the average gold price is between USD 401 and USD 500 per ounce and 4% if the average gold price is greater than USD 500 per ounce. |
| (2) | Pursuant to a mining lease and option to purchase made effective March 1, 2011 between Corvus Nevada and an arm’s length individual, Corvus Nevada has leased, and has the option to purchase, 2 patented mineral claims which form part of the North Bullfrog project holdings. The lease is for an initial term of 10 years, subject to extension for an additional 10 years (provided advance minimum royalties are timely paid), and for so long thereafter as mining activities continue on the claims. The lessee is required to pay advance minimum royalty payments (recoupable from production royalties, but not applicable to the purchase price if the option to purchase is exercised) of USD 20,000 on execution (paid), USD 25,000 on each of March 1, 2012 (paid), 2013 (paid) and 2014 (paid), USD 30,000 on March 1, 2015 (paid) and each anniversary thereafter, adjusted for inflation. The lessor is entitled to receive a 2% NSR royalty on all production. The lessee may purchase the royalty for USD 1,000,000 per 1%. If the lessee purchases the entire royalty (USD 2,000,000) the lessee will also acquire all interest of the lessor in the subject property. |
| (3) | Pursuant to a purchase agreement made effective March 28, 2013, Corvus Nevada has agreed to purchase the surface rights of five patented mining claims owned by two arm’s length individuals for USD 160,000 payable on closing (March 28, 2013). The terms include payment by Corvus Nevada of a fee of USD 0.02 per ton of overburden to be stored on the property, subject to payment for a minimum of 12 million short tons. The minimum tonnage fee (USD 240,000) bears interest at 4.77% per annum from closing and is evidenced by a promissory note due on the sooner of the commencing of use of the property for waste materials storage or December 31, 2015. As a result, the Company recorded $406,240 (USD 400,000) in acquisition costs with $157,408 paid in cash and the remaining $248,832 (USD 240,000) in promissory note payable (note 6) during the year ended May 31, 2013. |
| (4) | In December 2013, SoN completed the purchase of a parcel of land approximately 30 km north of the North Bullfrog project which carries with it 1,600 acre feet of irrigation water rights. The cost of the land and associated water rights was cash payment of $1,100,118 (USD 1,034,626). |
| (5) | On March 30, 2015, Lunar Landing, LLC signed a lease agreement with Corvus Nevada to lease private property containing the three patented Sunflower claims to Corvus Nevada, which are adjacent to the Yellowrose claims leased in 2014. The term of the lease is 3 years with provision to extend the lease for an additional 7 years, and an advance minimum royalty payment of USD 5,000 per year with USD 5,000 paid upon signing. The lease includes a 4% NSR royalty on production, with an option to purchase the royalty for USD 500,000 per 1% or USD 2,000,000 for the entire 4% royalty. The lease also includes the option to purchase the property for USD 300,000. |
Acquisitions
The acquisition of title to mineral properties is a detailed and time-consuming process. The Company has taken steps, in accordance with industry norms, to verify title to mineral properties in which it has an interest. Although the Company has taken every reasonable precaution to ensure that legal title to its properties is properly recorded in the name of the Company (or, in the case of an option, in the name of the relevant optionor), there can be no assurance that such title will ultimately be secured.
14
| CORVUS GOLD INC. |
| NOTES TO THE CONDENSED INTERIM CONSOLIDATED FINANCIAL STATEMENTS |
| (Unaudited) |
| (Expressed in Canadian dollars) |
| THREE MONTHS ENDED AUGUST 31, 2015 AND 2014 |
Environmental Expenditures
The operations of the Company may in the future be affected from time to time in varying degrees by changes in environmental regulations, including those for future removal and site restoration costs. Both the likelihood of new regulations and their overall effect upon the Company vary greatly and are not predictable. The Company’s policy is to meet or, if possible, surpass standards set by relevant legislation by application of technically proven and economically feasible measures.
Environmental expenditures that relate to ongoing environmental and reclamation programs are charged against earnings as incurred or capitalized and amortized depending on their future economic benefits. Estimated future removal and site restoration costs, when the ultimate liability is reasonably determinable, are charged against earnings over the estimated remaining life of the related business operation, net of expected recoveries.
The Company has estimated the fair value of the liability for asset retirement that arose as a result of exploration activities to be $140,254 (USD 107,000) (May 31, 2015 - $132,579 (USD 107,000)). The fair value of the liability was determined to be equal to the estimated remediation costs. Due to the early stages of the project, and that extractive activities have not yet begun, the Company is unable to predict with any precision the timing of the cash flow related to the reclamation activities.
| 6. | PROMISSORY NOTE PAYABLE |
On March 28, 2013, the Company issued a promissory note payable of USD 240,000 bearing interest at 4.77% per annum due on the sooner of the commencing of use of the property for waste materials storage as stated in note 5(d)(ii)(3) or December 31, 2015. At August 31, 2015, the promissory note payable was translated to $315,768 (May 31, 2015 - $298,488).
| 7. | SHARE CAPITAL |
Authorized
Unlimited common shares without par value.
Share issuances
There were no share issuances during the period ended August 31, 2015.
Stock options
Stock options awarded to employees and non-employees by the Company are measured and recognized in the Condensed Interim Consolidated Statement of Operations and Comprehensive Loss over the vesting period.
The Company has adopted an incentive stock option plan (the “2010 Plan”). The essential elements of the 2010 Plan provide that the aggregate number of common shares of the Company’s share capital that may be made issuable pursuant to options granted under the 2010 Plan (together with any other shares which may be issued under other share compensation plans of the Company) may not exceed 10% of the number of issued shares of the Company at the time of the granting of the options. Options granted under the 2010 Plan will have a maximum term of ten years. The exercise price of options granted under the 2010 Plan will not be less than the greater of the market price of the common shares (as defined by TSX, currently defined as the 5 day volume weighted average price for the 5 trading days immediately preceding the date of grant) or the closing market price of the Company’s common shares for the trading day immediately preceding the date of grant), or such other price as may be agreed to by the Company and accepted by the TSX. Options granted under the 2010 Plan vest immediately, unless otherwise determined by the directors at the date of grant.
15
| CORVUS GOLD INC. |
| NOTES TO THE CONDENSED INTERIM CONSOLIDATED FINANCIAL STATEMENTS |
| (Unaudited) |
| (Expressed in Canadian dollars) |
| THREE MONTHS ENDED AUGUST 31, 2015 AND 2014 |
A summary of the status of the stock option plan as of August 31 and May 31, 2015, and changes during the periods are presented below:
| Three months ended August 31, 2015 | Year ended May 31, 2015 | |||||||||||||||
| Number of Options | Weighted Average Exercise Price | Number of Options | Weighted Average Exercise Price | |||||||||||||
| Balance, beginning of the period | 7,396,334 | $ | 0.94 | 6,175,234 | $ | 0.84 | ||||||||||
| Granted | - | - | 1,575,000 | 1.34 | ||||||||||||
| Exercised | - | - | (18,900 | ) | (0.50 | ) | ||||||||||
| Forfeited | (20,000 | ) | (0.96 | ) | - | - | ||||||||||
| Expired | - | - | (335,000 | ) | (1.00 | ) | ||||||||||
| Balance, end of the period | 7,376,334 | $ | 0.94 | 7,396,334 | $ | 0.94 | ||||||||||
The weighted average remaining contractual life of options outstanding at August 31, 2015 was 2.60 years (May 31, 2015 – 2.85 years).
Stock options outstanding are as follows:
| August 31, 2015 | May 31, 2015 | |||||||||||||||||||||||
| Expiry Date | Exercise Price | Number of Options | Exercisable at Period- End | Exercise Price | Number of Options | Exercisable at Year- End | ||||||||||||||||||
| July 29, 2016 | $ | 0.50 | 464,434 | 464,434 | $ | 0.50 | 464,434 | 464,434 | ||||||||||||||||
| November 17, 2016 | $ | 0.67 | 210,000 | 210,000 | $ | 0.67 | 210,000 | 210,000 | ||||||||||||||||
| January 23, 2017 | $ | 1.10 | 50,000 | 37,500 | $ | 1.10 | 50,000 | 25,000 | ||||||||||||||||
| May 1, 2017 | $ | 0.73 | 50,000 | 25,000 | $ | 0.73 | 50,000 | 25,000 | ||||||||||||||||
| May 29, 2017 | $ | 0.92 | 300,000 | 300,000 | $ | 0.92 | 300,000 | 300,000 | ||||||||||||||||
| September 19, 2017 | $ | 0.96 | 2,416,900 | 2,416,900 | $ | 0.96 | 2,436,900 | 2,436,900 | ||||||||||||||||
| October 29, 2017 | $ | 0.96 | 100,000 | 100,000 | $ | 0.96 | 100,000 | 100,000 | ||||||||||||||||
| August 16, 2018 | $ | 0.76 | 2,420,000 | 2,420,000 | $ | 0.76 | 2,420,000 | 1,611,720 | ||||||||||||||||
| September 8, 2019 | $ | 1.40 | 1,365,000 | 454,545 | $ | 1.40 | 1,365,000 | 454,545 | ||||||||||||||||
| 7,376,334 | 6,428,379 | 7,396,334 | 5,627,599 | |||||||||||||||||||||
The Company uses the fair value method for determining stock-based compensation for all options granted during the periods. No options were granted (2014 - $nil) during the period ended August 31, 2015.
Stock-based compensation has been allocated as follows:
| For the period ended August 31, | 2015 | 2014 | ||||||
| Consulting | $ | 131,643 | $ | 123,826 | ||||
| Exploration expenditures – Geological/geophysical | 5,455 | 16,431 | ||||||
| Investor relations | 38,901 | 71,219 | ||||||
| Professional fees | 8,237 | 18,777 | ||||||
| Wages and benefits | 110,645 | 226,228 | ||||||
| $ | 294,881 | $ | 456,481 | |||||
16
| CORVUS GOLD INC. |
| NOTES TO THE CONDENSED INTERIM CONSOLIDATED FINANCIAL STATEMENTS |
| (Unaudited) |
| (Expressed in Canadian dollars) |
| THREE MONTHS ENDED AUGUST 31, 2015 AND 2014 |
| 8. | RELATED PARTY TRANSACTIONS |
During the period ended August 31, 2015, the Company entered into the following transactions with related parties:
| For the period ended August 31, | 2015 | 2014 | ||||||
| Consulting fees to CFO | $ | 18,000 | $ | 18,000 | ||||
| Wages and benefits to CEO and COO | 143,869 | 102,879 | ||||||
| Wages and benefits to former President | 234,997 | 48,732 | ||||||
| Directors fees (included in consulting fees) | 33,750 | 22,500 | ||||||
| Fees to Vice President of Corporate Communications (included in investor relations) | 37,500 | 37,500 | ||||||
| Professional fees to Vice President | - | 19,260 | ||||||
| Stock-based compensation to related parties | 227,668 | 397,822 | ||||||
| $ | 695,784 | $ | 646,693 | |||||
As at August 31, 2015, included in accounts payable and accrued liabilities was $7,687 (May 31, 2015 – $9,880) in expenses owing to companies related to officers and officers of the Company.
These amounts were unsecured, non-interest bearing and had no fixed terms or terms of repayment. Accordingly, fair value could not be readily determined.
The Company has also entered into change of control agreements with officers of the Company. In the case of termination, the officers are entitled to an amount equal to a multiple (ranging from two times to three times) of the sum of the annual base salary then payable to the officer, the aggregate amount of bonus(es) (if any) paid to the officer within the calendar year immediately preceding the Effective Date of Termination, and an amount equal to the vacation pay which would otherwise be payable for the one year period next following the Effective Date of Termination.
| 9. | GEOGRAPHIC SEGMENTED INFORMATION |
The Company operates in one industry segment, the mineral resources industry, and in two geographical segments, Canada and the United States. All current exploration activities are conducted in the United States and Canada. The significant asset categories identifiable with these geographical areas are as follows:
| Canada | United States | Total | ||||||||||
| August 31, 2015 | ||||||||||||
| Capitalized acquisition costs | $ | - | $ | 5,142,115 | $ | 5,142,115 | ||||||
| Property and equipment | $ | 2,627 | $ | 93,036 | $ | 95,663 | ||||||
| May 31, 2015 | ||||||||||||
| Capitalized acquisition costs | $ | - | $ | 4,866,634 | $ | 4,866,634 | ||||||
| Property and equipment | $ | 2,840 | $ | 93,863 | $ | 96,703 | ||||||
17
| CORVUS GOLD INC. |
| NOTES TO THE CONDENSED INTERIM CONSOLIDATED FINANCIAL STATEMENTS |
| (Unaudited) |
| (Expressed in Canadian dollars) |
| THREE MONTHS ENDED AUGUST 31, 2015 AND 2014 |
| For the period ended August 31, | 2015 | 2014 | ||||||
| Net loss for the period – Canada | $ | (493,500 | ) | $ | (821,989 | ) | ||
| Net loss for the period – United States | (1,327,792 | ) | (1,805,029 | ) | ||||
| Net loss for the period | $ | (1,821,292 | ) | $ | (2,627,018 | ) | ||
| 10. | SUBSIDIARIES |
Significant subsidiaries for the three months ended August 31, 2015 and 2014 are:
| Country of Incorporation | Principal Activity | The Company’s effective interest for 2015 | The Company’s effective interest for 2014 | |||||||
| Corvus Gold (USA) Inc. | USA | Holding company | 100% | 100% | ||||||
| Raven Gold Alaska Inc. | USA | Exploration company | 100% | 100% | ||||||
| Corvus Gold Nevada Inc. | USA | Exploration company | 100% | 100% | ||||||
| SoN Land & Water LLC | USA | Exploration company | 100% | 100% | ||||||
| 11. | SUPPLEMENTAL CASH FLOW INFORMATION |
| For the three months ended August 31, | 2015 | 2014 | ||||||
| Supplemental cash flow information | ||||||||
| Interest paid (received) | $ | - | $ | - | ||||
| Income taxes paid (received) | $ | - | $ | - |
| 12. | SUBSEQUENT EVENTS |
The following are the subsequent events since August 31, 2015.
| a) | On September 1, 2015, the Company closed a non-brokered private placement equity financing and issued 4,255,320 common shares at a price of $0.47 per share for gross proceeds of $2,000,000. |
| b) | On September 9, 2015, the Company granted incentive stock options to consultants and employees of the Company to purchase 640,000 common shares in the share capital of the Company. The options are exercisable on or before September 9, 2020 at a price of $0.46 per share. The options will vest as to 33.3% on September 9, 2015, 33.3% on September 9, 2016, and 33.4% on September 9, 2017. |
18
ITEM 2. MANAGEMENT’S DISCUSSION AND ANALYSIS OF FINANCIAL CONDITION AND RESULTS OF OPERATIONS
The following discussion and analysis should be read in conjunction with our unaudited consolidated financial statements for the three months ended August 31, 2015, and the related notes thereto, which have been prepared in accordance with generally accepted accounting principles in the United States (“U.S. GAAP”). This discussion and analysis contains forward-looking statements and forward-looking information that involve risks, uncertainties and assumptions. Our actual results may differ materially from those anticipated in these forward-looking statements and information as a result of many factors. See section heading “Note Regarding Forward-Looking Statements” below. All currency amounts are stated in Canadian dollars unless noted otherwise.
CAUTIONARY NOTE TO U.S. INVESTORS REGARDING ESTIMATES OF MEASURED, INDICATED AND INFERRED RESOURCES AND PROVEN AND PROBABLE RESERVES
Corvus Gold Inc. (“we”, “us”, “our,” “Corvus” or the “Company”) is a mineral exploration company engaged in the acquisition and exploration of mineral properties. The mineral estimates in this Quarterly Report on Form 10-Q have been prepared in accordance with the requirements of the securities laws in effect in Canada, which differ from the requirements of United States securities laws. As used in this Quarterly Report on Form 10-Q, the terms “mineral reserve”, “proven mineral reserve” and “probable mineral reserve” are Canadian mining terms as defined in accordance with Canadian National Instrument 43-101 “Standards of Disclosure for Mineral Projects” (“NI 43-101”) and the Canadian Institute of Mining, Metallurgy and Petroleum (the “CIM”) CIM Definition Standards on Mineral Resources and Mineral Reserves, adopted by the CIM Council, as amended. These definitions differ from the definitions in the United States Securities and Exchange Commission (“SEC”) Industry Guide 7 (“SEC Industry Guide 7”). Under SEC Industry Guide 7 standards, a “final” or “bankable” feasibility study is required to report reserves, the three-year historical average price is used in any reserve or cash flow analysis to designate reserves, and the primary environmental analysis or report must be filed with the appropriate governmental authority.
In addition, the terms “mineral resource”, “measured mineral resource”, “indicated mineral resource” and “inferred mineral resource” are defined in and required to be disclosed by NI 43-101; however, these terms are not defined terms under SEC Industry Guide 7 and are normally not permitted to be used in reports and registration statements filed with the SEC. Investors are cautioned not to assume that all or any part of a mineral deposit in these categories will ever be converted into reserves. “Inferred mineral resources” have a great amount of uncertainty as to their existence, and great uncertainty as to their economic and legal feasibility. It cannot be assumed that all, or any part, of an inferred mineral resource will ever be upgraded to a higher category. Under Canadian rules, estimates of inferred mineral resources may not form the basis of feasibility or pre-feasibility studies, except in rare cases. Investors are cautioned not to assume that all or any part of an inferred mineral resource exists or is economically or legally mineable. Disclosure of “contained ounces” in a resource is permitted disclosure under Canadian regulations; however, the SEC normally only permits issuers to report mineralization that does not constitute “reserves” by SEC standards as in place tonnage and grade without reference to unit measures.
Accordingly, information contained in this report and the documents incorporated by reference herein contain descriptions of our mineral deposits that may not be comparable to similar information made public by U.S. companies subject to the reporting and disclosure requirements under the United States federal securities laws and the rules and regulations thereunder.
The term “mineralized material” as used in this Quarterly Report on Form 10-Q, although permissible under SEC Industry Guide 7, does not indicate “reserves” by SEC Industry Guide 7 standards. We cannot be certain that any part of the mineralized material will ever be confirmed or converted into SEC Industry Guide 7 compliant “reserves”. Investors are cautioned not to assume that all or any part of the mineralized material will ever be confirmed or converted into reserves or that mineralized material can be economically or legally extracted.
CAUTIONARY NOTE TO ALL INVESTORS CONCERNING ECONOMIC ASSESSMENTS THAT INCLUDE INFERRED RESOURCES
The Company currently holds or has the right to acquire interests in an advanced stage exploration project in Nye County, Nevada referred to as the North Bullfrog Project (the “NBP”). Mineral resources that are not mineral reserves have no demonstrated economic viability. The preliminary economic assessments on the NBP and the Company’s LMS Project are preliminary in nature and include “inferred mineral resources” that have a great amount of uncertainty as to their existence, and are considered too speculative geologically to have economic considerations applied to them that would enable them to be categorized as mineral reserves. It cannot be assumed that all, or any part, of an inferred mineral resource will ever be upgraded to a higher category. Under Canadian rules, estimates of inferred mineral resources may not form the basis of feasibility or pre-feasibility studies. There is no certainty that such inferred mineral resources at the NBP or the LMS Project will ever be realized. Investors are cautioned not to assume that all or any part of an inferred mineral resource exists or is economically or legally mineable.
19
NOTE REGARDING FORWARD-LOOKING STATEMENTS
This Quarterly Report on Form 10-Q and the exhibits attached hereto contain “forward-looking statements” within the meaning of the United States Private Securities Litigation Reform Act of 1995, as amended, and “forward-looking information” within the meaning of applicable Canadian securities legislation, collectively “forward-looking statements”. Such forward-looking statements concern our anticipated results and developments in the operations of the Company in future periods, planned exploration activities, the adequacy of the Company’s financial resources and other events or conditions that may occur in the future. Forward-looking statements are frequently, but not always, identified by words such as “expects,” “anticipates,” “believes,” “intends,” “estimates,” “potential,” “possible” and similar expressions, or statements that events, conditions or results “will,” “may,” “could” or “should” (or the negative and grammatical variations of any of these terms) occur or be achieved. These forward looking statements may include, but are not limited to, statements concerning:
| · | the Company’s strategies and objectives, both generally and in respect of its specific mineral properties; |
| · | the timing of decisions regarding the timing and costs of exploration programs with respect to, and the issuance of the necessary permits and authorizations required for, the Company’s exploration programs, including for the NBP; |
| · | the Company’s estimates of the quality and quantity of the mineral resources at its mineral properties; |
| · | the timing and cost of planned exploration programs of the Company and its joint venture partners (as applicable), and the timing of the receipt of results therefrom; |
| · | the Company’s future cash requirements; |
| · | general business and economic conditions; |
| · | the Company’s ability to meet its financial obligations as they come due, and to be able to raise the necessary funds to continue operations; |
| · | the Company’s expectation that its joint venture partners will contribute the required expenditures, and make the required payments and share issuances (if applicable) as necessary to earn an interest in certain of the Company’s mineral properties in accordance with existing option/joint venture agreements; |
| · | the Company’s expectation that it will be able to add additional mineral projects of merit to its assets; |
| · | the potential for the existence or location of additional high-grade veins at the NBP; |
| · | the potential to expand the high grade gold and silver at the Yellowjacket target, and the potential to expand the higher grade bulk tonnage at the Sierra Blanca target, at the NBP; |
| · | the potential for any delineation of higher grade mineralization at the NBP; |
| · | the potential for there to be one or more additional vein zone(s) to the west and northeast of the current Yellowjacket high grade zone; |
| · | the potential discovery and delineation of mineral deposits/resources/reserves and any expansion thereof beyond the current estimate; |
| · | the potential for the NBP mineralization system to continue to grow and/or to develop into a major new higher-grade, bulk tonnage, Nevada gold discovery; and |
| · | the Company’s expectation that it will be able to build itself into a non-operator gold producer with significant carried interests and royalty exposure. |
Such forward-looking statements reflect the Company’s current views with respect to future events and are subject to certain known and unknown risks, uncertainties and assumptions. Many factors could cause actual results, performance or achievements to be materially different from any future results, performance or achievements that may be expressed or implied by such forward-looking statements, including, among others, risks related to:
| · | to our requirement of significant additional capital; |
| · | to our limited operating history; |
| · | to our history of losses; |
| · | to cost increases for our exploration and, if warranted, development projects; |
| · | to our properties being in the exploration stage; |
| · | to mineral exploration and production activities; |
| · | to our lack of mineral production from our properties; |
| · | to estimates of mineral resources; |
| · | to changes in mineral resource estimates; |
| · | to differences in United States and Canadian mineral reserve and mineral resource reporting; |
| · | to our exploration activities being unsuccessful; |
| · | to fluctuations in gold, silver and other metal prices; |
| · | to our ability to obtain permits and licenses for production; |
| · | government and environmental regulations that may increase our costs of doing business or restrict our operations; |
| · | proposed legislation that may significantly affect the mining industry; |
| · | land reclamation requirements; |
20
| · | competition in the mining industry; |
| · | equipment and supply shortages; |
| · | current and future joint ventures and partnerships; |
| · | our ability to attract qualified management; |
| · | the ability to enforce judgment against certain of our Directors; |
| · | currency fluctuations; |
| · | claims on the title to our properties; |
| · | surface access on our properties; |
| · | potential future litigation; |
| · | our lack of insurance covering all our operations; |
| · | our status as a “passive foreign investment company” under US federal tax code; and |
| · | the Common Shares. |
Should one or more of these risks or uncertainties materialize, or should underlying assumptions prove incorrect, actual results may vary materially from those described herein. This list is not exhaustive of the factors that may affect any of the Company’s forward-looking statements. Forward-looking statements are statements about the future and are inherently uncertain, and actual achievements of the Company or other future events or conditions may differ materially from those reflected in the forward-looking statements due to a variety of risks, uncertainties and other factors, including without limitation those discussed in Part I, Item 1A, Risk Factors, of our Annual Report on Form 10-K, as filed with the SEC on August 26, 2015, which are incorporated herein by reference, as well as other factors described elsewhere in this report and the Company’s other reports filed with the SEC.
The Company’s forward-looking statements contained in this Quarterly Report on Form 10-Q are based on the beliefs, expectations and opinions of management as of the date of this report. The Company does not assume any obligation to update forward-looking statements if circumstances or management’s beliefs, expectations or opinions should change, except as required by law. For the reasons set forth above, investors should not attribute undue certainty to or place undue reliance on forward-looking statements.
Current Business Activities
General
The Company’s material mineral property is the NBP, an advanced exploration stage project in Nevada which has a number of high-priority, bulk tonnage and high-grade vein targets (held through Corvus Gold Nevada Inc. (“Corvus Nevada”), a Nevada subsidiary). In addition, the Company holds a 100% interest in two early stage projects in Alaska (Chisna and LMS) through its Alaskan subsidiary, Raven Gold Alaska Inc. (“Raven Gold”).
The primary focus of the Company will be to leverage its exploration expertise to expand its existing deposits and discover major new gold deposits. Other than with respect to the ongoing exploration of the NBP, the Company’s strategy is to leverage its other non-core assets by monetizing them for cash payments and maintaining a retained royalty and or carried interest for future value streams. To meet this objective, the Company has completed the sale of its West Pogo property and its surrounding regional database for cash payments to the Company and a retained royalty. In addition, the Company is looking to sell its LMS and Chisna projects under similar terms.
Highlights of activities during the period and to the date of this MD&A include:
| · | NBP Exploration: The 2015 drilling campaign started in April and will continue until December of 2015. The 2015 drilling program is focused on assessing the expansion potential of the high-grade Yellowjacket deposit and surrounding vein systems as well as assessing the potential for discovery of new high-grade systems throughout the North Bullfrog District. |
| · | Initial drilling in the new East Bullfrog area has discovered low-grade gold and silver mineralization in the Alunite Hill target area and a number of new targets have been developed from the recent large soil survey of the area. These targets as well at others will be drill tested this year. |
| · | On July 29, 2015, the West Pogo property in Alaska and the surrounding Goodpaster database has been sold to Millrock Resources Inc. for a cash payment of USD $120,000 and an overriding royalty interest in the West Pogo property and on new claims staked within a large surrounding Area Of Interest. |
| · | On September 1, 2015, the Company closed a non-brokered private placement equity financing with Resource Capital Fund and issued 4,255,320 common shares at a price of $0.47 per share for gross proceeds of $2,000,000. The funding will be used to continue exploration on the NBP and for general corporate costs. |
| · | On September 9, 2015, the Company granted incentive stock options to consultants and employees of the Company to purchase 640,000 common shares in the share capital of the Company. The options are exercisable on or before September 9, 2020 at a price of $0.46 per share. The options will vest as to 33.3% on September 9, 2015, 33.3% on September 9, 2016, and 33.4% on September 9, 2017. |
21
| · | Chisna Project in Alaska has been reduced to the core claims’ covering the Grubstake copper-gold porphyry system. The remaining Chisna claims and the surrounding regions geologic database are being offered for sale. |
Corporate Financing Activities
On September 1, 2015, Corvus Gold Inc. closed a $2,000,000 non-brokered private placement at $0.47. Under the terms of the agreement, the Company issued 4,255,320 common shares with no warrant and a 6 month hold period on the stock. With the completion of this financing, Resource Capital Fund joins the growing list of other major long-company, long-gold Corvus Gold shareholders.
Nevada Property
North Bullfrog Project
Our principal mineral property is the NBP, a gold exploration project located in northwestern Nye County, Nevada, in the Northern Bullfrog Hills about 15 km north of the town of Beatty. The NBP does not have any known proven or probable reserves under SEC Industry Guide 7 and the project is exploratory in nature. The below information is in part summarized or extracted from our NI 43-101 technical report entitled “Technical Report and Preliminary Economic Assessment for Combined Mill and Heap Leach Processing at the North Bullfrog Project Bullfrog Mining District, Nye County, Nevada” with an effective date of June 16, 2015 (the “Technical Report”), which was prepared for us by Scott W. Wilson, CPG, SME-RM, of Metal Mining Consultants, Inc., Stephen Batman, SME-RM of SBB Mining Solutions, LLC, Herbert Osborne, Metallurgical Eng., SME-RM, of H. C. Osborne and Associates., and William J. Pennstrom, Jr., SME-RM of Pennstrom Consulting Inc.
The NBP is located in the Bullfrog Hills of northwestern Nye County, Nevada (Figure 1). The NBP covers about 7,223 hectares of patented and unpatented mining claims in Sections 20, 21, 25, 26, 27, 28, 29, 32, 33, 34, 35, and 36 of T10S, R46E; sections 1, 2, 11, 12, 13, and 14 of T11S, R46E; section 31 of T10S, R47E; and sections 6, 9, 15, 16, and 17 T11S, R47E, MDBM. We have a total of nine option/lease agreements in place that give us control of an aggregate of 51 patented lode mining claims (Figure 2).

Figure 1. Property Map showing the Location of the North Bullfrog Project.
22
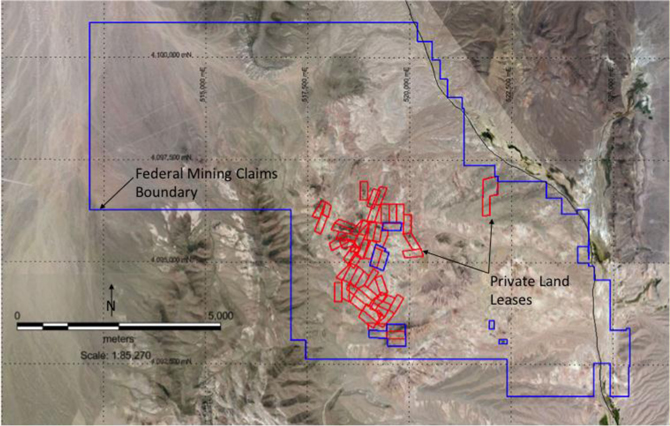
Figure
2. Property Map of the North Bullfrog Project, Blue outline shows the NBP boundary
and red areas are the Leased Private Land (UTm NAD 27 Zone 11).
YellowJacket Exploration Work
2014 YellowJacket Drilling Program
In 2014, Corvus drilled 48 oriented core holes totaling 12,636 metres (41,456 feet). These included 36 HQ3 holes, and 12 PQ3 holes for metallurgical samples. The 2014 program was focused on resource definition and metallurgical sampling of the YellowJacket Vein and Stockwork system. Two additional channel sample profiles were completed along new roadcuts totaling 181 metres (595 feet). The 2014 drill results have been incorporated into the revised estimates of mineralized volumes in the Sierra Blanca Disseminated and the YellowJacket Vein-Stockwork zones reported in the NI 43-101 Technical Report with an effective date of June 16, 2015. Figure 3 shows a geologic map of the Josh Vein structure and location of drill holes.
The YellowJacket vein mineralization, illustrated by the cross section in Figure 4, is structurally-controlled and occurs in distinct quartz veins and stockwork zones, as opposed to the more typical disseminated mineralization at the NBP. Significant intercepts from YellowJacket drilling between June and the end of November, 2014 are listed in Table 1 to illustrate the distribution of veins and vein stockworks encountered in this structurally controlled mineralization.
23

Figure 3. Geologic Map of the YellowJacket Zone Showing Major Structures and Drill Holes.
24
Table 1: Significant 2014 Drill Intercepts from the YellowJacket Structural Zone Showing the Distribution of Higher Grade Mineralization in Structurally Related Quartz Vein and Stockwork Intervals.
| Hole ID and Orientation | From (m) | To (m) | Interval (m) | Gold (g/t) | Silver (g/t) | Comments | ||||||
| 98.0 | 116.4 | 18.4 | 0.14 | 0.93 | Disseminated | |||||||
| NB-14-377 | 116.4 | 122.5 | 6.1 | 0.81 | 1.86 | HW Peripheral | ||||||
| 122.5 | 130.0 | 7.5 | 3.16 | 7.99 | HW Stockwork | |||||||
| 130.0 | 133.7 | 3.7 | 1.80 | 19.2 | Josh Vein | |||||||
| 17.3 | 2.04 | 8.23 | Vein + HW Stockwork | |||||||||
| Az. 90 | 133.7 | 143.9 | 10.1 | 0.41 | 5.20 | FW Stockwork | ||||||
| Incl. -80 | 143.9 | 152.4 | 8.5 | 0.32 | 5.50 | FW Peripheral | ||||||
| 73.2 | 74.2 | 1.0 | 1.23 | 9.60 | Isolated Vein | |||||||
| 82.2 | 83.4 | 1.2 | 0.57 | 11.0 | JV HW Stockwork | |||||||
| NB-14-378 | 83.4 | 92.6 | 9.2 | 18.0 | 260 | Josh Vein | ||||||
| 92.6 | 97.9 | 5.3 | 0.15 | 2.74 | JV FW Stockwork | |||||||
| 97.9 | 105.6 | 7.7 | 0.31 | 1.92 | JV FW Peripheral | |||||||
| 107.1 | 124.7 | 17.5 | 0.23 | 0.89 | JV HW Peripheral | |||||||
| 25.2 | 29.3 | 4.1 | 0.16 | 0.94 | JV HW Peripheral | |||||||
| NB-14-379 | 29.3 | 32.3 | 3.1 | 0.34 | 2.32 | JV HW Stockwork | ||||||
| 32.3 | 33.5 | 1.1 | 2.35 | 7.77 | Josh Vein | |||||||
| 33.5 | 38.0 | 4.6 | 0.21 | 5.71 | JV FW Stockwork | |||||||
| Az. 90 | 80.9 | 81.1 | 0.2 | 0.05 | 57.5 | Isolated Vein | ||||||
| Incl. -45 | 126.6 | 129.1 | 2.5 | 0.53 | 1.09 | Isolated Vein | ||||||
| 46.3 | 51.4 | 5.1 | 0.43 | 4.9 | NE50 HW Stockwork | |||||||
| 51.4 | 54.9 | 3.6 | 4.19 | 149.8 | NE50 | |||||||
| 54.9 | 63.0 | 8.0 | 0.31 | 10.0 | NE50 FW Stockwork | |||||||
| 16.7 | 1.18 | 38.4 | NE50 + Stockwork | |||||||||
| 80.0 | 85.3 | 5.3 | 0.41 | 2.8 | JV HW Stockwork | |||||||
| NB-14-380 | 85.3 | 90.0 | 4.8 | 13.81 | 243.3 | Josh Vein | ||||||
| Az 90; Incl -70 | 90.0 | 92.7 | 2.7 | 1.04 | 4.8 | JV FWStockwork | ||||||
| 12.7 | 5.57 | 93.5 | Josh Vein + Stockwork | |||||||||
| 113.2 | 114.9 | 1.7 | 0.88 | 1.9 | ||||||||
| 120.2 | 157.4 | 37.2 | 0.34 | 1.0 | Disseminated | |||||||
| 157.4 | 165.6 | 8.2 | 0.70 | 1.1 | Disseminated | |||||||
| NB-14-381 | 108.1 | 113.9 | 5.9 | 0.29 | 4.4 | Disseminated | ||||||
| Az 90; Incl -45 | 119.1 | 122.8 | 3.7 | 0.51 | 10.0 | Disseminated | ||||||
| 97.5 | 104.0 | 6.5 | 0.25 | 1.4 | JV HW Stockwork | |||||||
| 104.0 | 108.7 | 4.7 | 4.62 | 33.9 | Josh Vein | |||||||
| 108.7 | 116.1 | 7.4 | 1.05 | 1.5 | JV FWStockwork | |||||||
| NB-14-382 | 18.6 | 1.67 | 9.6 | JoshVein + Stockwork | ||||||||
| Az 90; Incl -80 | 116.1 | 159.1 | 43.0 | 2.56 | 2.3 | WV FWPeriph | ||||||
| Including | 127.2 | 127.7 | 0.5 | 181.50 | 94.0 | Single vein | ||||||
| 167.7 | 170.5 | 2.7 | 0.11 | 141.6 | High Silver Fault Gouge | |||||||
| 172.5 | 199.1 | 26.6 | 0.50 | 1.1 | Disseminated | |||||||
| 124.4 | 129.1 | 4.7 | 0.55 | 2.2 | Disseminated | |||||||
| 138.1 | 150.3 | 12.2 | 0.52 | 1.6 | JV HW Periph | |||||||
| 150.3 | 160.1 | 9.9 | 0.86 | 8.0 | JV HW Stockwork | |||||||
| NB-14-383 | 160.1 | 164.9 | 4.7 | 0.40 | 4.0 | Josh Vein | ||||||
| 164.9 | 192.5 | 27.6 | 0.43 | 1.6 | JV FW Stockwork | |||||||
| Az 90; Incl -80 | 42.2 | 0.52 | 3.4 | JoshVein + Stockwork | ||||||||
| 103.5 | 114.4 | 10.9 | 0.58 | 5.6 | JV HW Stockwork | |||||||
| NB-14-384 | 114.4 | 128.0 | 13.6 | 6.13 | 83 | Josh Vein | ||||||
| Including | 114.4 | 118.9 | 4.5 | 16.7 | 150 | |||||||
| 128.0 | 134.8 | 6.8 | 0.37 | 1.3 | JV FW Stockwork | |||||||
| 31.3 | 2.95 | 0.8 | Josh Vein + Stockwork | |||||||||
| Az 90 Incl -55 | 152.3 | 165.5 | 13.2 | 0.58 | 1.1 | FW Veining | ||||||
| 224.8 | 234.1 | 9.3 | 0.46 | 0.8 | Ended in Min |
25
| Hole ID and Orientation | From (m) | To (m) | Interval (m) | Gold (g/t) | Silver (g/t) | Comments | ||||||
| 133.5 | 162.3 | 28.8 | 0.59 | 2.6 | JV HWPeriph | |||||||
| Including | 138.1 | 151.8 | 13.7 | 0.77 | 2.9 | |||||||
| 175.7 | 177.7 | 2.0 | 0.61 | 2.3 | JV HW Stockwork | |||||||
| NB-14-385 | 177.7 | 183.4 | 5.7 | 2.10 | 3.9 | Josh Vein | ||||||
| 183.4 | 195.6 | 12.2 | 0.35 | 4.3 | JV FW Stockwork | |||||||
| Az 90 Incl -78 | 19.9 | 0.88 | 4.0 | Josh Vein + Stockwork | ||||||||
| 61.0 | 64.2 | 3.2 | 9.43 | 87 | A Fault Vein | |||||||
| NB-14-386 | 89.5 | 103.9 | 14.4 | 1.53 | 10 | Josh Vein | ||||||
| Including | 92.2 | 95.7 | 3.5 | 2.86 | 28 | |||||||
| 103.9 | 123.3 | 19.4 | 1.49 | 4.0 | JV FW Stockwork | |||||||
| 33.8 | 1.51 | 6.6 | Josh Vein + Stockwork | |||||||||
| Az 90 Incl -45 | 130.9 | 173.1 | 42.3 | 0.65 | 3.0 | EZ Stockwork02 | ||||||
| 176.7 | 220.6 | 44.0 | 0.48 | 1.5 | EZ Stockwork01b | |||||||
| 153.3 | 170.2 | 17.0 | 0.82 | 4.4 | JV HW Stockwork | |||||||
| NB-14-387 | 170.2 | 173.6 | 3.3 | 1.85 | 13.8 | Josh Vein | ||||||
| 173.6 | 181.1 | 7.5 | 0.98 | 6.4 | JV FW Stockwork | |||||||
| Az 90 incl -63 | 27.8 | 1.0 | 6.1 | Josh Vein + Stockwork | ||||||||
| 142.0 | 153.2 | 11.2 | 1.1 | 4.8 | JV HW Stockwork | |||||||
| NB-14-389 | 153.2 | 161.7 | 8.5 | 6.1 | 33.6 | Josh Vein | ||||||
| 161.7 | 166.6 | 4.9 | 1.0 | 1.8 | JV FW Stockwork | |||||||
| Az 58 incl -57 | 24.6 | 2.8 | 14.1 | Josh Vein + Stockwork | ||||||||
| 130.8 | 147.0 | 16.2 | 0.58 | 1.72 | Disseminated | |||||||
| 173.4 | 194.4 | 21.0 | 0.3 | 8.6 | NE30 | |||||||
| NB-14-390 | 194.4 | 198.4 | 4.0 | 0.2 | 7.8 | JV HW Stockwork | ||||||
| 198.4 | 216.5 | 18.1 | 0.2 | 12.9 | JV FW Stockwork | |||||||
| 22.1 | 0.2 | 12.0 | Josh Vein Stockwork | |||||||||
| Az 90 incl -80 | 223.6 | 229.6 | 6.0 | 0.69 | 2.00 | Disseminated | ||||||
| NB-14-391 | 117.4 | 129.2 | 11.8 | 0.7 | 1.7 | NE30 | ||||||
| Including | 129.2 | 142.6 | 13.4 | 6.5 | 40.7 | JV HWStkwk | ||||||
| 142.6 | 151.0 | 8.4 | 17.3 | 66.3 | Josh Vein | |||||||
| 151.0 | 156.3 | 5.3 | 0.7 | 5.8 | JV FW Stockwork | |||||||
| 27.1 | 8.7 | 41.8 | Josh Vein + Stockwork | |||||||||
| Az 90 incl -67 | 204.5 | 228.0 | 23.5 | 0.67 | 0.85 | Disseminated | ||||||
| 211.8 | 218.1 | 6.2 | 0.8 | 7.9 | JV HW Stockwork | |||||||
| NB-14-392 | 218.1 | 219.0 | 0.9 | 12.7 | 58.3 | Josh Vein | ||||||
| 219.0 | 221.1 | 2.1 | 0.4 | 1.3 | JV FW Stockwork | |||||||
| 9.3 | 1.9 | 11.5 | Josh Vein + Stockwork | |||||||||
| Az 90 incl -45 | 251.1 | 262.4 | 11.3 | 3.32 | 4.14 | Rhyolite Stockwork | ||||||
| 139.6 | 146.8 | 7.2 | 0.89 | 1.0 | Disseminated | |||||||
| 181.6 | 187.2 | 5.6 | 0.82 | 1.1 | Disseminated | |||||||
| 207.6 | 225.3 | 17.8 | 0.45 | 4.0 | JV HW Stockwork | |||||||
| NB-14-393 | 225.3 | 228.3 | 3.0 | 0.66 | 40.5 | Josh Vein | ||||||
| 228.3 | 231.6 | 3.3 | 0.25 | 11.2 | JV FW Stockwork | |||||||
| Az 90 incl -51 | 293.5 | 360.1 | 66.7 | 0.46 | 0.9 | Disseminated | ||||||
| 114.9 | 177.3 | 62.4 | 0.67 | 1.3 | Disseminated | |||||||
| 242.2 | 253.8 | 11.6 | 0.25 | 5.9 | NE30 | |||||||
| NB-14-394 | 253.8 | 255.7 | 1.9 | 0.29 | 8.1 | JV HWStkwk | ||||||
| 255.7 | 258.4 | 2.7 | 0.18 | 4.6 | JV FWStkwk | |||||||
| Az 90 incl -62 | 286.8 | 322.4 | 35.6 | 0.41 | 1.3 | Qtz Stockwork | ||||||
| 229.2 | 240.5 | 11.3 | 0.77 | 16.4 | NE30 HWStkwk | |||||||
| NB-14-395 | 240.5 | 254.7 | 14.2 | 0.81 | 4.7 | NE30 | ||||||
| Az 69 incl -50 | 254.7 | 287.7 | 33.0 | 0.81 | 3.2 | NW10 Fault | ||||||
| NB-14-396 | 147.6 | 160.9 | 13.4 | 0.41 | 1.2 | Disseminated | ||||||
| 328.6 | 333.4 | 4.8 | 1.03 | 2.9 | NW10 Fault | |||||||
| Az 66 incl -62 | 333.4 | 340.8 | 7.4 | 0.43 | 1.0 | NW10 HW Stockwork | ||||||
| 40.5 | 44.2 | 3.7 | 0.44 | 5.0 | Silicified Fault in Debris Flow | |||||||
| NB-14-397 | 141.5 | 218.7 | 77.2 | 0.35 | 1.5 | Disseminated | ||||||
| 316.3 | 324.8 | 8.5 | 0.70 | 1.6 | Py Veining | |||||||
| Az 90 incl -65 | 372.8 | 374.1 | 1.3 | 0.24 | 2.1 | NW10 Fault |
26
| Hole ID and Orientation | From (m) | To (m) | Interval (m) | Gold (g/t) | Silver (g/t) | Comments | ||||||
| 147.4 | 166.8 | 19.4 | 0.37 | 0.9 | Disseminated | |||||||
| NB-14-398 | 170.8 | 191.8 | 21.0 | 0.42 | 0.7 | Disseminated | ||||||
| 231.5 | 243.0 | 11.5 | 0.73 | 1.0 | Qtz Stockwork | |||||||
| Az 65 incl -68 | 334.7 | 340.0 | 5.3 | 0.41 | 1.0 | Qtz Stockwork | ||||||
| 112.2 | 115.4 | 3.2 | 0.67 | 4.9 | JV HW Stockwork | |||||||
| NB-14-399 | 115.4 | 116.9 | 1.6 | 10.59 | 59.1 | Josh Vein | ||||||
| 116.9 | 121.6 | 4.7 | 0.99 | 4.3 | JV FW Stockwork | |||||||
| 9.4 | 2.5 | 13.7 | Josh Vein + Stockwork | |||||||||
| Az 90 incl -45 | 147.1 | 154.2 | 7.1 | 0.66 | 1.0 | Qtz Stockwork | ||||||
| 119.7 | 133.7 | 14.0 | 0.4 | 2.2 | JV HWStkwk | |||||||
| NB-14-400 | 133.7 | 139.3 | 5.6 | 13.9 | 60.1 | Josh Vein | ||||||
| 139.3 | 155.6 | 16.3 | 32.6 | 20.3 | Footwall Stockwork | |||||||
| including | 145.0 | 151.7 | 6.7 | 73.5 | 38.4 | |||||||
| Az 90 incl -60 | 35.9 | 17.1 | 19.5 | Josh Vein + Stockwork | ||||||||
| 145.7 | 166.8 | 21.1 | 6.9 | 8.0 | Hangingwall Stockwork | |||||||
| NB-14-401 | 166.8 | 167.7 | 0.9 | 0.7 | 5.5 | Josh Vein | ||||||
| 167.7 | 177.7 | 10.0 | 1.0 | 2.4 | JV FWStkwk | |||||||
| Az 90 incl -73 | 32.0 | 4.9 | 6.2 | Vein + Stockwork | ||||||||
| 152.6 | 179.3 | 26.7 | 1.7 | 7.6 | JV HWStkwk | |||||||
| NB-14-402 | 179.3 | 183.7 | 4.5 | 14.6 | 79.0 | JV | ||||||
| 183.7 | 195.5 | 11.8 | 0.5 | 10.1 | JV FWStkwk | |||||||
| Az 112 incl -46 | 63.2 | 4.2 | 11.9 | Josh Vein + Stockwork | ||||||||
| 129.0 | 130.7 | 1.7 | 145 | 22 | Upper Stockwork | |||||||
| 148.6 | 172.6 | 24.0 | 0.4 | 1.8 | Hangingwall Stockwork | |||||||
| NB-14-403 | 172.6 | 173.6 | 1.0 | 0.5 | 4.5 | Josh Vein | ||||||
| 173.6 | 180.8 | 7.1 | 0.4 | 3.9 | Footwall Stockwork | |||||||
| Az 136 incl -72 | 32.1 | 0.4 | 2.3 | Josh Vein + Stockwork | ||||||||
| 116.1 | 119.7 | 3.5 | 2.1 | 1.8 | Upper Stockwork | |||||||
| 129.2 | 131.4 | 2.2 | 1.1 | 5.7 | Hangingwall Stockwork | |||||||
| NB-14-404 | 131.4 | 134.0 | 2.7 | 0.5 | 19.7 | Josh Vein | ||||||
| 134.0 | 137.1 | 3.1 | 8.6 | 14.2 | Footwall Stockwork | |||||||
| Az 90 incl -54 | 7.9 | 3.8 | 13.7 | Josh Vein + Stockwork | ||||||||
| 135.8 | 144.5 | 8.7 | 2.4 | 12.3 | NE30 Fault | |||||||
| 144.5 | 153.3 | 8.8 | 0.3 | 6.8 | NE30 Footwall Stockwork | |||||||
| 170.2 | 174.7 | 4.4 | 0.4 | 17.3 | JV HWPeriph | |||||||
| 174.7 | 179.6 | 5.0 | 2.8 | 26.6 | Hangingwall Stockwork | |||||||
| NB-14-405 | 179.6 | 186.0 | 6.4 | 2.0 | 41.1 | Josh Vein | ||||||
| 186.0 | 192.6 | 6.5 | 2.2 | 6.7 | Footwall Stockwork | |||||||
| Az 90 incl -68 | 17.9 | 2.3 | 24.6 | Josh Vein + Stockwork | ||||||||
| 173.1 | 198.7 | 25.6 | 0.8 | 2.8 | Peripheral Stockwork | |||||||
| 198.7 | 207.6 | 8.9 | 1.0 | 2.3 | Hangingwall Stockwork | |||||||
| NB-14-406 | 207.6 | 217.3 | 9.7 | 1.8 | 4.9 | Josh Vein | ||||||
| 217.3 | 224.6 | 7.2 | 0.6 | 2.3 | Footwall Stockwork | |||||||
| Az 132 incl -71 | 25.8 | 1.2 | 3.3 | Josh Vein + Stockwork | ||||||||
| NB-14-407 | 69.6 | 95.4 | 25.8 | 0.36 | 1.47 | Disseminated Oxide | ||||||
| Including | 73.3 | 78.7 | 5.4 | 0.82 | 2.49 | NE60 Fault | ||||||
| azi 90 incl -50 | ||||||||||||
| 141.9 | 147.4 | 5.5 | 0.65 | 2.4 | NE30 HW Stockwork | |||||||
| 147.4 | 151.4 | 4.0 | 1.87 | 12.1 | NE30 Fault | |||||||
| 151.4 | 155.0 | 3.6 | 0.42 | 4.3 | NE30 FW Stockwork | |||||||
| 13.1 | 0.96 | 5.9 | Fault + Stockwork | |||||||||
| NB-14-408 | 186.8 | 204.4 | 17.6 | 0.89 | 2.95 | JV HW Stockwork | ||||||
| 189.7 | 193.9 | 4.1 | 2.11 | 6.51 | Including | |||||||
| 204.4 | 208.4 | 4.0 | 0.39 | 2.51 | JV | |||||||
| 208.4 | 216.2 | 7.8 | 0.41 | 1.48 | JV FW Stockwork | |||||||
| 15.9 | 1.3 | 4.6 | Vein + Stockwork | |||||||||
| azi 90 incl -74 | 216.2 | 237.1 | 20.9 | 0.81 | 2.3 | Sulphide Stockwork |
27
| Hole ID and Orientation | From (m) | To (m) | Interval (m) | Gold (g/t) | Silver (g/t) | Comments | ||||||
| 102.1 | 106.1 | 4.0 | 0.37 | 6.0 | NE30 HW Stockwork | |||||||
| 106.1 | 114.0 | 7.8 | 1.39 | 6.7 | NE30 Fault | |||||||
| 114.0 | 126.0 | 12.0 | 0.77 | 5.2 | NE30 FW Stockwork | |||||||
| 23.9 | 0.91 | 5.8 | Fault + Stockwork | |||||||||
| NB-14-409 | 210.3 | 227.0 | 16.7 | 1.74 | 3.17 | JV HW Stockwork | ||||||
| 227.0 | 228.0 | 1.0 | 4.22 | 8.05 | JV | |||||||
| 228.0 | 239.9 | 11.8 | 0.69 | 1.70 | JV FW Stockwork | |||||||
| azi 118 incl -57 | 29.6 | 1.4 | 2.7 | Vein + Stockwork | ||||||||
| 128.3 | 132.2 | 4.0 | 1.15 | 53.90 | JV HW Stockwork | |||||||
| NB-14-410 | 132.2 | 134.4 | 2.2 | 8.87 | 450.09 | JV | ||||||
| 134.4 | 138.2 | 3.8 | 2.00 | 8.60 | JV FW Stockwork | |||||||
| 9.9 | 3.18 | 124.34 | Vein + Stockwork | |||||||||
| azi 90 incl -64 | 149.2 | 150.8 | 1.6 | 13.57 | 3.92 | FW Zone | ||||||
| NB-14-411 | 96.9 | 100.6 | 3.7 | 5.7 | 19.2 | JV Fault | ||||||
| azi 125 incl -79 | ||||||||||||
| 131.5 | 141.7 | 10.2 | 0.50 | 7.83 | JV HW Stockwork | |||||||
| NB-14-412 | 141.7 | 146.3 | 4.5 | 0.95 | 19.74 | JV | ||||||
| 146.3 | 159.9 | 13.7 | 1.32 | 6.11 | JV FW Stockwork | |||||||
| 28.4 | 0.97 | 8.90 | Vein + Stockwork | |||||||||
| 159.9 | 169.5 | 9.6 | 0.76 | 4.07 | JV FW Peripheral | |||||||
| azi 90 incl -71 | 193.6 | 203.6 | 10.0 | 0.52 | 1.48 | FW Min | ||||||
| 0.0 | 11.6 | 11.6 | 0.21 | 2.5 | Disseminated Oxide | |||||||
| 11.6 | 21.4 | 9.8 | 0.50 | 2.9 | NE30 HW Stockwork | |||||||
| NB-14-413 | 21.4 | 26.4 | 5.0 | 0.21 | 5.9 | NE30 Fault | ||||||
| 14.8 | 0.40 | 3.9 | Fault + Stockwork | |||||||||
| 29.2 | 77.6 | 48.4 | 0.31 | 1.1 | Disseminated Oxide | |||||||
| 77.6 | 78.4 | 0.8 | 0.54 | 2.42 | JV Fault | |||||||
| 78.4 | 82.7 | 4.2 | 6.99 | 4.23 | JV FW Stockwork | |||||||
| azi 163 incl -61 | 5.0 | 5.9 | 3.9 | Vein + Stockwork | ||||||||
| 153.3 | 154.1 | 0.8 | 0.53 | 7.27 | JV HW Stockwork | |||||||
| NB-14-414 | 154.1 | 165.0 | 11.0 | 8.13 | 30.53 | JV | ||||||
| 165.0 | 175.9 | 10.8 | 0.54 | 2.40 | JV FW Stockwork | |||||||
| 22.6 | 4.22 | 16.20 | Vein + Stockwork | |||||||||
| azi 90 incl -63 | 175.9 | 191.1 | 15.2 | 0.49 | 1.27 | JV FW Peripheral | ||||||
| 142.6 | 194.1 | 51.6 | 2.09 | 5.50 | JV HW Stockwork | |||||||
| 191.4 | 192.3 | 0.9 | 78.90 | 32.00 | Including | |||||||
| NB-14-415 | 194.1 | 195.9 | 1.8 | 1.18 | 24.80 | JV | ||||||
| 195.9 | 197.2 | 1.3 | 0.22 | 6.73 | JV FW Stockwork | |||||||
| azi 90 incl -53 | 54.6 | 2.0 | 6.2 | Vein + Stockwork | ||||||||
| 144.6 | 154.5 | 10.0 | 0.48 | 2.92 | JV HW Stockwork | |||||||
| NB-14-416 | 154.5 | 161.1 | 6.6 | 0.88 | 17.01 | JV | ||||||
| 161.1 | 170.8 | 9.7 | 0.52 | 6.33 | JV FW Stockwork | |||||||
| 26.3 | 0.59 | 7.71 | Vein + Stockwork | |||||||||
| azi 79 incl -70 | 170.8 | 188.1 | 17.2 | 0.52 | 1.68 | JV FW Peripheral | ||||||
| NB-14-417 | 66.4 | 84.6 | 18.1 | 0.21 | 0.13 | Disseminated Oxide | ||||||
| 103.3 | 153.3 | 50.1 | 0.35 | 0.98 | Disseminated Oxide | |||||||
| azi 90 incl -55 | 110.5 | 118.3 | 7.8 | 1.12 | 1.01 | NE70 Fault | ||||||
| 64.2 | 65.1 | 0.9 | 30.50 | 255.0 | HW Vein | |||||||
| 95.4 | 113.6 | 18.2 | 0.95 | 4.30 | JV HW Stockwork | |||||||
| NB-14-418 | 113.6 | 128.4 | 14.8 | 9.21 | 179.89 | JV | ||||||
| 113.6 | 118.4 | 4.8 | 21.18 | 197.06 | Including | |||||||
| 128.4 | 133.1 | 4.8 | 0.34 | 23.18 | JV FW Stockwork | |||||||
| azi 17 incl -68 | 37.7 | 4.1 | 75.4 | Vein + Stockwork | ||||||||
| 64.9 | 75.2 | 10.3 | 0.25 | 0.90 | Disseminated Oxide | |||||||
| NB-14-419 | 75.2 | 81.5 | 6.3 | 0.37 | 1.19 | NE60 Fault | ||||||
| 81.5 | 90.8 | 9.3 | 0.43 | 2.54 | NE60 FWStkwk | |||||||
| azi 110 incl -50 | 90.8 | 107.6 | 16.8 | 0.25 | 1.99 | NE60 FWPeriph |
28
| Hole ID and Orientation | From (m) | To (m) | Interval (m) | Gold (g/t) | Silver (g/t) | Comments | ||||||
| 104.2 | 143.5 | 39.3 | 0.28 | 1.53 | Disseminated Oxide | |||||||
| 174.4 | 181.3 | 6.9 | 0.86 | 5.05 | JV HW Stockwork | |||||||
| NB-14-420 | 181.3 | 182.9 | 1.6 | 0.32 | 7.06 | JV | ||||||
| 182.9 | 185.8 | 2.9 | 0.83 | 6.46 | JV FW Stockwork | |||||||
| azi 90 incl -61 | 11.5 | 0.78 | 5.69 | Vein + Stockwork | ||||||||
| NB-14-421 | 90.8 | 136.2 | 45.3 | 0.26 | 0.87 | Disseminated Oxide | ||||||
| Including | 111.3 | 124.9 | 13.6 | 0.33 | 0.70 | Including | ||||||
| azi 257incl -67 | ||||||||||||
| NB-14-422 | 77.5 | 118.6 | 41.2 | 0.40 | 1.59 | Disseminated Oxide | ||||||
| 180.8 | 212.8 | 32.0 | 0.61 | 1.19 | NE70 Zone | |||||||
| Including | 183.8 | 187.3 | 3.5 | 2.61 | 3.28 | |||||||
| azi 70 incl -60 | ||||||||||||
| 100.0 | 101.5 | 1.5 | 0.34 | 1.63 | NE60 HWStkwk | |||||||
| NB-14-423 | 101.5 | 104.6 | 3.1 | 0.87 | 1.72 | NE60 | ||||||
| azi 103 incl -61 | 104.6 | 107.6 | 3.0 | 0.37 | 1.87 | NE60 FWStkwk | ||||||
| NB-14-424 | 114.6 | 161.6 | 47.0 | 0.24 | 1.63 | Disseminated Oxide | ||||||
| azi 101 incl -45 | 192.8 | 200.2 | 7.3 | 0.56 | 3.99 | Unnamed Quartz Vein | ||||||
| SBRC-15 | 0.0 | 74.7 | 74.7 | 0.36 | 0.68 | Veined Oxide | ||||||
| Including | 6.1 | 13.7 | 7.6 | 0.53 | 0.54 | Quartz Stockwork | ||||||
| Including | 35.0 | 41.2 | 6.1 | 0.79 | 1.42 | Quartz Stockwork |
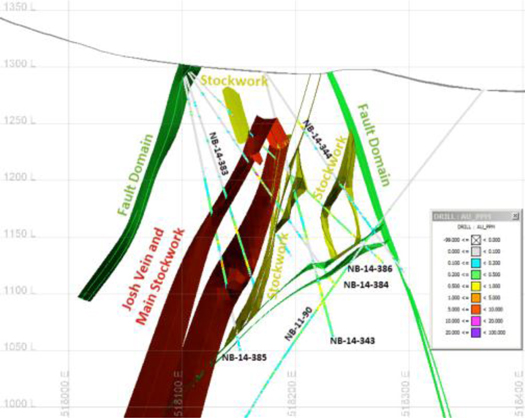
Figure 4. Geologic Cross Section Through YellowJacket.
Mineral Resources
North Bullfrog Project Resource Estimate
A mineral resource estimate for the NBP, effective as at June 16, 2015, has been prepared as part of the updated Technical Report. The basis for the mineral resource estimates at the NBP is geologic models developed by Corvus’ geologists. Geologic logs, alteration and geochemical data were used to define the mineralized zones, and were the limiting factor for gold distribution for the resource estimations. Both Ordinary Kriging and Inverse Distance calculations were used to develop block models of gold and silver mineralization at several cut-off grades (“COG”). The mineral resource is subdivided according to the specific processing requirements of the different types of mineralization, and consists of higher grade mineralization within the Yellowjacket Zone, which would require a mill circuit with gravity concentration and cyanide leaching of the concentrate and gravity tail, and lower grade, oxidized disseminated mineralization from the Sierra Blanca, Jolly Jane and Mayflower areas, which would be suitable for run-of-mine heap leach processing. The estimated mineral resource is summarized in Table 2, where it has been estimated as the portion of mineralization with reasonable prospects for extraction defined by Whittle® analysis of the resource block models. The Whittle® software defined an open pit mining shell at a gold price of US $1,200/oz, economic parameters typical of Nevada open pit mines and metallurgical recoveries indicated by NBP testing data received to date. The estimated mineral resource is defined by mineralization falling within the open pit mining shell which would be processed and is listed in Table 2.
29
Table 2: Measured, Indicated, and Inferred Mineral Resource Estimate for the North Bullfrog Project Defined by
Whittle® pit volumes, including both the YellowJacket Vein/Stockwork and Disseminated Oxide Mineralization at $1,200 Gold Price
| Yellowjacket (milling) | Disseminated (heap leach) | Total | ||||||||||||||||||||||||||||||
| WhittleTM
Pit Gold Price* | Resources Category | Cutoff** (Gold g/t) | Tonnes (Mt) | Gold (g/t) | Silver (g/t) | Cutoff** (Gold g/t) | Tonnes (Mt) | Gold (g/t) | Silver (g/t) | Strip Ratio | Contained Au kozs | Contained Ag kozs | ||||||||||||||||||||
| $ | 1,200 | Measured | 0.52 | 3.86 | 2.55 | 19.70 | 0.15 | 0.30 | 0.25 | 2.76 | 0.70 | 318.9 | 2,471.5 | |||||||||||||||||||
| Indicated | 1.81 | 1.53 | 10.20 | 22.86 | 0.30 | 0.43 | 308.9 | 911.1 | ||||||||||||||||||||||||
| Total M & I | 5.67 | 2.22 | 16.67 | 23.15 | 0.30 | 0.46 | 627.7 | 3,382.6 | ||||||||||||||||||||||||
| Inferred | 1.48 | 0.83 | 4.26 | 176.35 | 0.19 | 0.67 | 1,132.2 | 4,005.0 | ||||||||||||||||||||||||
* - Analysis assumes a fixed ratio of the gold to silver prices of 73.7
**-Breakeven grade derived from Whittle input parameters at US$1,200/oz gold price and Gold:Silver price ratio of 73.7
***- See Cautionary Note to US Investors below
****-The Mineral Resources above are effective as of June 16, 2015.
*****-Mineral Resources that are not Mineral Reserves do not have demonstrated economic viability.
****** - Mr. Scott E. Wilson is the QP responsible for reviewing and approving the Mineral Resource Estimate contained herein.
Cautionary Note to US Investors: The terms Measured Resource, Indicated Resource and Inferred Resource as described in Table 2 above are as defined in Canadian National Instrument 43-101. These terms are not defined under SEC Industry Guide 7 and are not recognized by the SEC. These estimated mineral resources are not SEC Industry Guide 7 proven and probable reserves. See “Cautionary Note to US Investors Regarding Mineral Reserve and Resource Estimates” above.
Metallurgical Testing of Gravity Concentration with Cyanide Leaching of the Gravity Tail – YellowJacket Samples
Metallurgical testing of combined gravity concentration with cyanide leaching of the gravity tail was performed for two different sets of composite samples representing Josh vein and vein stockwork materials for the YellowJacket zone. The YJ PQ composites represented vein and stockwork materials from above the oxidation horizon, and a second set, YJ JV samples, were used to create composites representing Josh vein and stockwork materials from below oxidation. The testing included E-GRG tests to provide a basis to predict the optimum grind size for gravity recovery and to simulate performance of a gravity concentrator at mill scale. The feed samples were ground to 80% passing -212μm (-65 mesh) then processed through a Knelson® concentrator. For the YJ PQ composites, the gravity recoverable gold from the concentrate was determined, and the gravity tail material was processed in a 96-hour Bottle Roll Test (BRT) to measure tail recoverable gold. Table 3 lists the combined gravity and tail CN recovery in the YJ PQ composites for gold and silver.
Table 3: Summary of Gravity Concentration with CN Leaching of Tail Materials Tests for the YJ PQ Composites from YellowJacket
| Composite | Material | Feed Size (P80) | Au rec. (%) | Ag rec. (%) | CN cons. (kg/tonne) | Lime Added (kg/tonne) | ||||||
| YJPQ 01 | Vein | -150μm | 93.7 | 75.0 | 0.26 | 2.1 | ||||||
| -75μm | 95.6 | 78.2 | 0.15 | 1.4 | ||||||||
| YJPQ02 | Stockwork | -150μm | 94.8 | 76.9 | 0.14 | 1.7 | ||||||
| -75μm | 95.6 | 80.8 | 0.17 | 1.6 | ||||||||
| YJPQ03 | Stockwork | -150μm | 88.2 | 71.1 | 0.10 | 1.4 | ||||||
| -75μm | 93.3 | 77.1 | 0.13 | 1.5 | ||||||||
| YJPQ04 | Stockwork | -150μm | 72.8 | 64.2 | 0.15 | 1.4 | ||||||
| -75μm | 74.1 | 68.2 | 0.12 | 2.0 |
The YJ JV samples were batch processed through the gravity concentrator with a nominal 0.3 % mass pull to the concentrate. The concentrate was then re-ground to 80% -45μm (-325 mesh) and intensively CN leached. The leached concentrate was combined with the gravity tail product which was ground to 80% -150μm and -75μm and then leached. The combined gravity recovery and tail recovery are listed in Table 4.
30
Table 4: Summary of Gravity Concentration with intense CN Leaching of Concentrate and CN Leaching of Tail Materials for the YJ JV Composites from YellowJacket
| Composite | Material | Feed Size (P80) | Au rec. (%) | Ag rec. (%) | CN cons. (kg/tonne) | Lime Added (kg/tonne) | ||||||
| YJ JV | JV + Stockwork | -150μm | 86.1 | 66.4 | 0.22 | 0.7 | ||||||
| -75μm | 88.6 | 69.7 | 0.23 | 1.1 | ||||||||
| YJ JV | Stockwork | -150μm | 77.3 | 64.2 | 0.15 | 1.0 | ||||||
| -75μm | 77.6 | 64.7 | 0.11 | 1.2 |
Samples of the gravity concentrate from the seven YJ JV samples, used to create the two master composites, were submitted for QUEMSCAN analysis to better characterize the gold occurrence. The analysis indicated that approximately half of the concentrate was sulphide, which was expected because the samples were selected below the oxidation horizon. In general, 95% of the gold occurred as liberated particles or gold adhesion binaries with exposed surfaces, suitable for relatively high metal recovery. These mineralogical characterizations were consistent with the high gold and silver recoveries observed in the metallurgical testing of the YellowJacket mineralization.
Preliminary Economic Assessment
The Preliminary Economic Assessment (“PEA”) performed for the Technical Report, assumes development of a conventional drill and blast, surface mine using haul trucks and front end loaders, milling of higher grade mineralization with gravity-cyanide leaching of the YellowJacket mineral resource, and heap leach processing of low grade mineralized material from the Sierra Blanca, Jolly Jane, and Mayflower mineral resources. Mineralized material from the YellowJacket vein and stockwork mineral resource would be delivered to a processing plant incorporating a gravity concentration circuit with intense cyanide leaching of the gravity concentrate followed by cyanide leaching of the gravity tail product. Tail materials would be stored in a conventional, lined tailing storage facility (TSF). Lower grade disseminated mineralization would be processed by heap leaching of run of mine (ROM) material. Ultra-high intensity blasting would be performed to minimize particle size for enhanced heap leach recoveries and would allow transport and stacking on a heap leach pad using a feeder/conveyor/stacker system. Gold and Silver in leachate solutions would be recovered from carbon from both processes and a doré would be produced in a refinery located in the Mill. Summary results for the PEA are listed in Table 5. Sensitivity of the projected financial performance of the North Bullfrog project to gold price is listed around the Base Case assumption of a constant gold price of US $1,200 per ounce in Table 6.
The PEA uses gold and silver recoveries for a gravity-cyanide leach mill that are estimated from two sets of metallurgical composite samples developed from PQ core materials generated in YellowJacket drilling programs during 2013 and 2014. Gravity concentrate samples were developed using a Knelson® concentrator. The Knelson® feed was ground to P80 -0.21mm (-65 mesh). The produced gravity concentrate was then re-ground to P80 -0.044mm (325 mesh), and subjected to intense cyanide leaching. The leached concentrate was then re-combined with the gravity tail product and ground to P80 -0.074mm (-200 mesh) before the final cyanide leach to maximize gold and silver recovery. Average recoveries of 86.8% for gold and 71.4% for silver were assumed for the mill process plant.
Heap leach metallurgical recovery estimates are based on column leach testing data for composite samples constructed from Mayflower, Jolly Jane, and Sierra Blanca 2012 PQ core drilling. A total of 23 column leach tests have been run at McClelland Laboratories at a particle size of 80% passing -19 mm (-3/4 inch) for the four resource areas. The process recovery assumptions reflect consideration of particle size resulting from ultra-high intensity blasting with a particle size of P80 -84mm (-3.3 inch), similar to a primary crushing product, scaling for the effects of vertical lift heights of > 10m (30 ft) and a leach time of 1000 days. The leach pad production model predicts an average gold recovery of 74%, and an average silver recovery of 6% of the fire assay grade.
A summary of the PEA results for the base case gold price assumption of US $1,200 is listed in Table 6. Table 7 lists Key Physical data from the project concept and production plan. Working capital and initial fills, which are recovered at the end of year 1 and at the end of the project respectively, were estimated to be US $16.4 M. Operating costs included in the PEA were based on mining, processing, administration and reclamation, and are listed in Table 8, where they are normalized to process tonnage and recovered gold ounces. Total LOM cash operating costs are projected to be US $635 / produced Au oz and LOM capital cost (adjusted for recovery of pre-strip mining, working capital recovery and initial fills recovery) was estimated to be an additional US $206 / produced Au oz.
The Company cautions that the PEA is preliminary in nature, and is based on technical and economic assumptions which will be further evaluated in more advanced studies. The PEA is based on the North Bullfrog resource model (as at June 16, 2015) which consists of material in the measured, indicated and inferred classifications. Inferred mineral resources are considered too speculative geologically to have the economic considerations applied to them that would enable them to be categorized as mineral reserves. The current basis of project information is not sufficient to convert the mineral resources to mineral reserves, and mineral resources that are not mineral reserves do not have demonstrated economic viability. Accordingly, there can be no certainty that the results estimated in this PEA will be realized. The PEA results are only intended as an initial, first-pass review of the potential project economics based on preliminary information. The PEA is not an SEC Industry Guide 7 compliant feasibility study and is not sufficient to support proven or probable reserves under SEC Industry Guide 7.
31
Table 5: North Bullfrog Project - PEA Summary Results
(values in 2015 US$ based on $1,200 gold price, mining recoverable resources defined by pit shells and 0.52 g/t gold mill breakeven grade and 0.15 g/t gold heap leach breakeven grade)
| Parameter | Summary Data | |
| Mineral resource - Measured Au and Ag | 4.04 M t at 2.43 g/t Au for 316.2 kozs and at 18.89 g/t Ag for 2.46 Mozs | |
| Mineral resource - Indicated Au and Ag | 22.14 M t at 0.41 g/t Au for 289.6 kozs and at 1.18 g/t Ag for 0.84 Mozs | |
| Mineral resource - Inferred Au and Ag | 137.09 M t at 0.21 g/t Au for 926.2 kozs and at 0.75 g/t Ag for 3.32 Mozs | |
| Pre-Tax Total Cash Flow; IRR at US$1,200* per Au oz | US$479 M; 53% | |
| Post-Tax NPV(5%) ; IRR at US$1,200* per Au oz | US$246 M; 38% | |
| Overall Strip Ratio | 0.6 to 1 (overburden to mined mineral resource) | |
| Average Annual Gold Production Years 1-6* | 154 k Au Eq oz/year | |
| Average Annual Gold Production Years 7-10* | 69 k Au Eq oz/year | |
| Average Gold Recovery - Mill | 86.8% | |
| Average Gold Recovery – Heap Leach | 73.9% | |
| Average Cash Cost | US$635/Au oz | |
| Average Silver Recovery - Mill | 71.4% | |
| Average Silver Recovery – Heap Leach | 6% | |
| Average Total Mining Rate | 69.7 k tonne/day | |
| Average Mineralized Material Mining Rate | 44.4 k tonne/day |
* - Silver:Gold price ratio = 73.7
Table 6: Base Case Gold Price Sensitivity Analysis – North Bullfrog Project
(cash basis, all values in constant 2015 US$)
| Gold Price ($/Oz) | Pre-Tax Total Cash Flow ($M) | NPV5% ($M) Post- Tax* | IRR (%) | Payback (yrs) | ||||||||||||||
| $ | 1,000 | 234.7 | $ | 102.9 | 20.5 | 3.0 | ||||||||||||
| $ | 1,100 | 356.7 | $ | 174.9 | 29.6 | 2.5 | ||||||||||||
| $ | 1,200 | 478.7 | $ | 245.9 | 37.9 | 2.2 | ||||||||||||
| $ | 1,300 | 600.8 | $ | 317.4 | 45.8 | 1.9 | ||||||||||||
| $ | 1,400 | 722.8 | $ | 387.6 | 53.2 | 1.8 | ||||||||||||
* - considers production royalties, Nevada mineral net proceeds and US Federal Income Tax
32
Table 7: PEA Key Physical Data - North Bullfrog Mill & Heap Leach Project
| Key Physical Data | Units | Value | ||||
| Heap Leach Feed Mined | M tonnes | 156.8 | ||||
| Mill Feed Mined | M tonnes | 7.1 | ||||
| Overburden Mined | M tonnes | 95.8 | ||||
| Total Material Mined | M tonnes | 259.7 | ||||
| Mine Life* | Years | 10 | ||||
| Contained Gold | Mozs | 1.53 | ||||
| Recovered Gold | Mozs | 1.19 | ||||
| Contained Silver | Mozs | 6.61 | ||||
| Recovered Silver | Mozs | 2.49 | ||||
| Average Strip Ratio | Overburden/Process Feed | 0.60 | ||||
| Average Diluted Gold Grade Heap Leach | g/t | 0.22 | ||||
| Average Diluted Gold Grade Mill | g/t | 1.92 | ||||
| Average Gold Recovery | % | 78 | % | |||
| Annual Process Feed Mined | M tonnes/yr | 16.2 | ||||
| Average Annual Gold Produced | Au kozs/yr | 117.0 | ||||
*-excludes leach pad rinse period at end of mine
Table 8: Operating Costs - North Bullfrog Mill & Heap Leach Project
(Constant 2015 US$)
| Cost | Cost per Process tonne ($/tonne) | Cost/Recovered Gold Oz ($/Oz) | ||||||
| Mining | $ | 2.41 | $ | 332 | ||||
| Processing | $ | 1.65 | $ | 227 | ||||
| Administration | $ | 0.43 | $ | 60 | ||||
| Reclamation | $ | 0.12 | $ | 17 | ||||
| Total Operating Cost | $ | 4.61 | $ | 636 | ||||
Estimated capital costs are listed in Table 9, where they are divided between initial and sustaining capital. The initial capital is estimated to be US $175.4M which includes equipment and construction, EPCM and Contingency. Sustaining capital includes leach pad expansions, mobile equipment purchases and rebuilds. Life of mine sustaining capital is estimated to be US $83.3 M.
Table 9: PEA Initial Capital Estimate - North Bullfrog Project
| Capital Area | Estimated Capital Cost (US $M) | |||
| Initial Capital | $ | 129.8M | ||
| EPCM | $ | 19.1M | ||
| Contingency | $ | 26.5 M | ||
| Total Initial Capital Cost | $ | 175.4M | ||
| Sustaining Capital | 83.3 M | |||
| Total LOM Capital Cost | 258.7M | |||
Scheduled resource and mining geometries for the PEA were defined by Lerch Grossman optimization using a US $900 gold price, current prevailing mining costs, and the latest metallurgical data for the project.
Proposed Activities
The PEA results, for the combined mill and heap leach configuration, indicate the substantial impact on the potential project performance of the higher grade vein and vein stockwork mineralization. Therefore it is recommended that future exploration should focus on the identification of other structural related mineralization. These recommended activities for an initial phase are:
| · | Drill structures identified in the Eastern Steam-heated Alteration Zone |
| · | Explore Structural Targets around Sierra Blanca |
| · | Continue Baseline Data Collection |
33
The projected costs for the next phase of this program are outlined in Table 10.
Table 10: Proposed Budget to Support Recommended Program at NBP
| Activity | Amount | |||
| Exploration Drilling and Data Management | US$ | 0.9 M | ||
| Baseline Data Collection | US$ | 0.1 M | ||
| Total | US$ | 1.0M |
We presently estimate that the foregoing programs will have an approximate cost of US$1.0 million to the end of the current calendar year at December 31, 2015, and we presently have the funds to carry out this work.
Through the end of our current fiscal year at May 31, 2016, we anticipate that we will have aggregate annual expenditures on the NBP of approximately US$5.9M.
As noted above, we began Phase I of our 2015 drilling program on April 23, 2015, with initial results announced on July 9, 2015. Phase II of our 2015 drilling program began on August 11, 2015. The 8,000 metre reverse circulation (RC) drill program will focus on two main areas 1) testing new high-grade discovery targets in the large unexplored Eastern Steam-heated Zone; 2) defining new high-grade systems similar to the recent YellowJacket discovery in and around the large resource areas in the NW part of the property. The program follows up on new geologic, structural and mineralization results from the initial spring 2015 Phase I drilling program.
The Phase II drill program will test a number of priority new discovery and resource expansion targets in and around the existing North Bullfrog deposits. Two of these targets were tested in the early 2015 Phase I, “proof of concept” drilling program, the results of which have confirmed the key structural and mineralization controls. In addition, a number of other structural/high-grade targets will be tested in the greater Sierra Blanca and Jolly Jane areas including the Air Track/366 target and North YellowJacket.
North Bullfrog District Wide Exploration Program
The Company is engaged in a District wide exploration program to assess the potential for further high-grade vein systems similar to the recent YellowJacket discovery as well as assessing the potential for expanding the YellowJacket system itself. The initial drilling phase of this new discovery exploration program was started in the spring of 2014 with surface mapping, sampling and geophysics in the new East Bullfrog area as well as further assessment of the greater Sierra Blanca area. Drilling of newly defined targets in the main Sierra Blanca/YellowJacket resource area and the new East Bullfrog exploration area began in April of this year and will involve the completion of approximately 10,000 metres of core and reverse circulation drilling by December of this year. The program will conduct the first modern exploration drilling ever done in the new and very large East Bullfrog target, a massive area of intense alteration covering some 142 kilometres. In addition the program will test a number of targets in and around the large Sierra Blanca/YellowJacket deposit which could host other YellowJacket or Bullfrog type systems.
Initial results from the first target drill tested in 2015 were announced on July 9, 2015 and returned encouraging stockwork veining intercepts from the NE Sierra Blanca target, a new NE trending structural zone with similarities to the YellowJacket deposit which is approximately 400 metres to the east (Table 11).
Table 11: Stockwork Vein Intercepts* from North Sierra Blanca Target
(Reported drill intercepts are not true widths. At this time, there is insufficient data with respect to the shape of the mineralization to calculate its true orientation in space.)
| Hole ID | From (m) | To (m) | Length (m) | Au (g/t) | Ag (g/t) | Comment | ||||||
| NB-15-425 | 47.54 | 51.65 | 4.11 | 1.30 | 2.74 | NE30 Target | ||||||
| NB-15-426 | 154.84 | 158.53 | 3.69 | 1.31 | 1.52 | NE30 Target |
* stockwork veining is defined as the intervals vein density of >5% and a cutoff grade of 1.0 g/t gold
34
NB-15-425 was targeted on a series of NE-trending, moderate to steeply west-dipping structures that control alteration and quartz stockwork veining on the northwest side of the Sierra Blanca deposit and possibly the western counterpart for the YellowJacket Vein system. The Sierra Blanca deposit was originally drilled out with vertical holes. Identifying steeply dipping feeder veins similar to the YellowJacket discovered on the east side or others that could be internal or west of the deposit indicates potential for another YellowJacket deposit. The upper part of hole NB-15-425 encountered 4.1 metres at 1.3 g/t Au oxide mineralization in the Savage Valley dacite on a splay of the NE30 fault zone. These grades in upper level stockwork veining hosted in dacite are consistent with those returned from the upper parts for a YellowJacket type system and follow up drilling will target this structural zone along strike and deeper.
NB-15-426 also targeted the same NE-trending, moderate to steeply west-dipping structural zone as hole NB-15-425 approximately 400 metres to the NE. This area of the structural zone returned a number of vertical RC drill intercepts of higher gold and silver values as well as anomalous copper indicative of the more productive parts of the YellowJacket system. Hole NB-15-426 intersected 3.7 metres at 1.31 g/t Au, within a broader interval of 63.53 metres at 0.52 g/t, all within the Sierra Blanca Tuff. This mineralized stockwork interval exhibits a similar vein paragenesis to the Yellowjacket Vein, suggesting the interval is in close proximity to a productive high-grade vein. NB-15-426 was lost in a mineralized fault zone before reaching completion depth and will be followed up.
In September positive results were returned from the initial two scout drill holes in the new Alunite Hill target within the previously untested East Bullfrog area. Results from these holes intersected multiple zones of low-grade gold and silver mineralization representing the first confirmation that gold-silver systems are present in this large untested target area (Table 12). Mineralization appears directly related to the large outcropping alteration system along a District scale NNW trending structural zone (Figure 5).
In addition final results from an initial soil survey of the East Bullfrog structural belt returned a number of surface gold and silver anomalies which correlate with the large NNW structural zones, enhancing targeting for follow-up drilling (Figure 6).
Table 12: Initial Results from Alunite Hill Target
(Reported drill intercepts are not true widths. At this time, there is insufficient data with respect to the shape of the mineralization to calculate its true orientation in space.)
| From (m) | To (m) | Length (m) | Gold (g/t) | Silver (g/t) | ||||||||||||||||
| NB-15-260 | 128.02 | 134.11 | 6.09 | 0.19 | 1.705 | |||||||||||||||
| 192.02 | 193.55 | 1.52 | 0.105 | 8.790 | ||||||||||||||||
| 121.92 | 134.11 | 12.19 | 1.989 | |||||||||||||||||
| Notable Silver Zones | 140.21 | 147.83 | 7.62 | 3.088 | ||||||||||||||||
| 164.59 | 175.26 | 10.67 | 1.386 | |||||||||||||||||
| NB-15-261 | 111.25 | 115.82 | 4.57 | 0.153 | 0.290 | |||||||||||||||
| 121.92 | 124.97 | 3.04 | 0.171 | 0.475 | ||||||||||||||||
| 129.54 | 131.06 | 1.52 | 0.103 | 0.590 | ||||||||||||||||
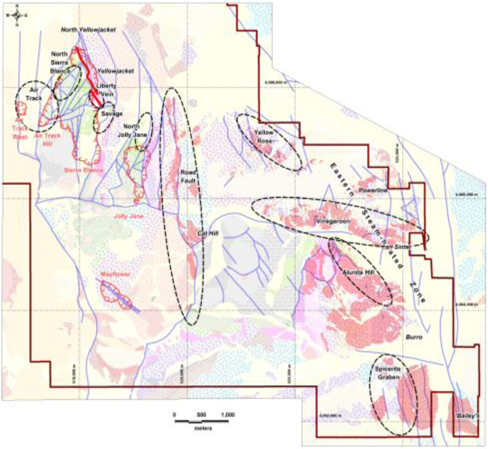
Figure 5. North Bullfrog District scale target map.
35
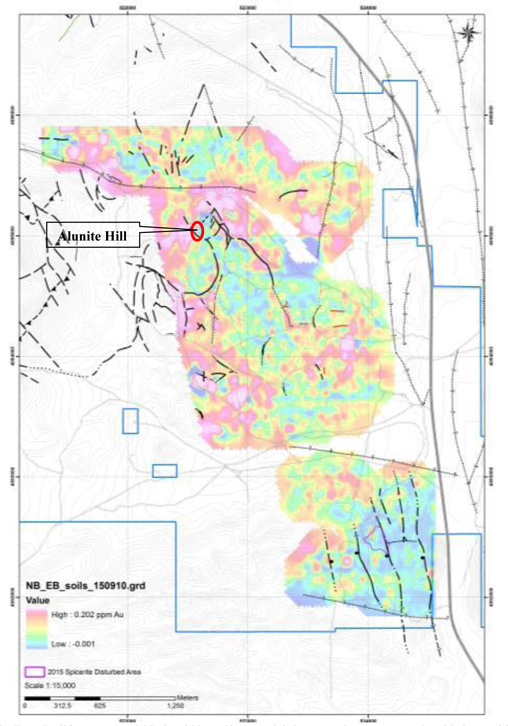
Figure 6. East Bullfrog area gridded gold in soil map with hotter colors representing higher gold values.
Qualified Person and Quality Control/Quality Assurance
Jeffrey A. Pontius (CPG 11044), a qualified person as defined by National Instrument 43-101, has supervised the preparation of the scientific and technical information that forms the basis for the NBP disclosure in this Quarterly Report on Form 10-Q (other than the NBP resource estimate) and has approved the disclosure in this Quarterly Report on Form 10-Q related thereto. Mr. Pontius is not independent of the Company, as he is the CEO and holds common shares and incentive stock options.
The exploration program at the NBP was designed and supervised by Mark Reischman, Nevada Exploration Manager, who are responsible for all aspects of the work, including the quality control/quality assurance program. On-site personnel at the project log and track all samples prior to sealing and shipping. All sample shipments are sealed and shipped to ALS Minerals in Reno, Nevada, for preparation and then on to ALS Minerals in Reno, Nevada, or Vancouver, B.C., for assay. McClelland Laboratories Inc. prepared composites from duplicated RC sample splits collected during drilling. Bulk samples were sealed on site and delivered to McClelland Laboratories Inc. by ALS Minerals or Corvus personnel. All metallurgical testing reported here was conducted or managed by McClelland Laboratories Inc.
36
Carl Brechtel (Colorado PE 23212 and Nevada PE 8744), a qualified person as defined by National Instrument 43-101, has supervised the NBP metallurgical testing program and has approved the disclosure in this Quarterly Report on Form 10-Q related thereto. Mr. Brechtel is not independent of the Company, as he is the Chief Operating Officer and holds common shares and incentive stock options.
Mr. Scott E. Wilson, SME, President of Metal Mining Consultants Inc., is an independent consulting geologist specializing in mineral reserve and resource calculation reporting, mining project analysis and due diligence evaluations. He is acting as the Qualified Person, as defined in NI 43-101, for the Technical Report (other than the potions for which other QP’s are responsible, as noted below), and specifically for the Mineral Resource Estimate (other than the estimate of the NBP mineralization inventory) and has approved the disclosure in this Quarterly Report on Form 10-Q related thereto. Mr. Wilson has over 23 years’ experience in surface mining and is a Registered Member of the Society of Mining, Metallurgy and Exploration. Mr. Wilson and Metal Mining Consultants, Inc. are independent of the Company under NI 43-101.
Mr. Stephen Batman, Principal Engineer at SBB Mining Solution LLC, is an independent consulting mining engineer specializing in mine design, production scheduling, pit optimization and equipment specification. He acted as the Qualified Person, as defined in NI 43-101, for the mining methods section of the Technical Report and has approved the disclosure in this Quarterly Report on Form 10-Q related thereto. Mr. Batman has over 29 years of experience in the mining industry and is a Registered Member (#181580RM) of the Society for Mining, Metallurgy and Exploration, Inc. Mr. Batman and SBB Mining Solution LLC are independent of the Company under NI 43-101.
Mr. Herbert Osborne, SME, a consulting metallurgist, has acted as the Qualified Person, as defined by NI 43-101, for evaluation of the metallurgical testing data contained in the Technical Report and has approved the disclosure in this Quarterly Report on Form 10-Q related thereto. He has over 50 years of experience in mineral process design and operations. He is a registered Member of the Society of Mining, Metallurgy and Exploration (SME Member No. 2430050 RM). Mr. Osborne is independent of the Company under NI 43-101.
Mr. William J. Pennstrom, Jr., a consulting process engineer and President of Pennstrom Consulting Inc., has acted as the Qualified Person, as defined by NI 43-101, for process operating cost estimation, project capital cost estimation and evaluation of the financial performance for the PEA and has approved the disclosure in this Quarterly Report on From 10-Q related thereto. He has over 30 years of experience in mineral process design and operation, and has been an independent process and metallurgical consultant for the mining industry for the last thirteen years. He is a Registered Member of the Society of Mining, Metallurgy and Exploration (#2503900RM). Mr. Pennstrom and Pennstrom Consulting Inc. are both independent of the Company under NI 43-101.
ALS Minerals’ quality system complies with the requirements for the International Standards ISO 9001:2000 and ISO 17025:1999. Analytical accuracy and precision are monitored by the analysis of reagent blanks, reference material and replicate samples. Quality control is further assured by the use of international and in-house standards. Finally, representative blind duplicate samples are forwarded to ALS Minerals and an ISO compliant third party laboratory for additional quality control.
Results of Operations
Three months ended August 31, 2015 Compared to Three months ended August 31, 2014
For the three months ended August 31, 2015, the Company had a net loss of $1,821,292 compared to a net loss of $2,627,018 in the comparative period of the prior year. Included in net loss was $294,881 (2014 - $456,481) in stock-based compensation charges which is a result of previously granted stock options which vested during the period. The decrease in loss of $805,726 in the three month period of the current year was due to a combination of factors discussed below.
The primary factor for the decrease in the net loss was the exploration expenditures of $790,059 incurred in the current period compared to $1,489,088 in the comparative period of the prior year. The exploration activities of the Company decreased mainly due to less funding being available in the current period compared with the comparative period of the prior year and a decrease in stock-based compensation charges of $5,455 in the current period compared to $16,431 in the prior period.
Consulting fees increased to $192,393 (2014 - $168,826) mainly due to increased stock-based compensation charges of $131,643 during the current period compared to $123,826 in the comparative period of the prior year with an increase in consulting fees of $15,750 mainly due to increase in directors’ fees.
37
Insurance expenses increased to $31,060 (2014 - $11,462) mainly due to increased insurance coverage incurred during the current period as a result of the increase in Company’s directors and officers liability insurance premium due to the Company’s registration of its securities in the United States.
Investor relations expenses decreased to $164,774 (2014- $184,524) due to decreased stock-based compensation charges of $38,901 during the current period compared to $71,219 in the comparative period of the prior year. This decrease was offset by an increase of $12,568 in investor relations-related travel, and advertising and marketing during the current period as part of the Company’s efforts to secure additional financing.
Professional fees decreased to $70,482 (2014 - $114,489) due to decreased stock-based compensation charges of $8,237 during the current prior compared to $18,777 in the comparative period of the prior year and a decrease of $33,467 in legal and accounting fees in the current period compared to the comparative period of the prior year. Regulatory expenses decreased to $26,981 (2014 - $55,157) due to more filing and listing fees incurred in the comparative period of the prior year. These expenses decreased as a result of the Company’s registration of its securities in the United States in the comparative period of the prior year.
Wages and benefits increased to $579,010 (2014 - $447,970). While stock-based compensation charges of $110,645 during the prior year was less than the $226,228 in the comparative period of the prior year. This decrease was offset by an increase of $246,623 in wages and benefits in the current period mainly as a result of adjustment in wages of several senior executive officers and the severance pay to the former President.
Other expense categories that reflected only moderate change period over period were administration expenses of $2,775 (2014 - $3,015), depreciation expenses of $6,300 (2014 - $6,115), office expenses of $38,622 (2014 - $35,343), rent expenses of $26,300 (2014 – $23,121) and travel expenses of $17,675 (2014 - $12,244).
Other items amounted to a gain of $125,139 compared to a loss of $75,664 in the prior period. There was a gain on sale of the Company’s interest in the West Pogo property of $25,728 in the current period compared to $nil in the comparative period of the prior year, and an unrealized loss on marketable securities of $nil in the current period compared to $38,977 in the comparative period of the prior period. There was an increase in foreign exchange to a gain of $93,846 (2014 – loss of $38,457), which is the result of factors outside of the Company’s control and an increase in interest income of $5,565 (2014 - $1,770) as a result of more investment in cashable GIC’s during the current period.
Liquidity and Capital Resources
The Company has no revenue generating operations from which it can internally generate funds. To date, the Company’s ongoing operations have been financed by the sale of its equity securities by way of public offerings, private placements and the exercise of incentive stock options and share purchase warrants. The Company believes that it will be able to secure additional private placements and public financings in the future, although it cannot predict the size or pricing of any such financings. In addition, the Company can raise funds through the sale of interests in its mineral properties, although current market conditions have substantially reduced the number of potential buyers/acquirers of any such interest(s). This situation is unlikely to change until such time as the Company can develop a bankable feasibility study on one of its projects. When acquiring an interest in mineral properties through purchase or option, the Company will sometimes issue common shares to the vendor or optionee of the property as partial or full consideration for the property interest in order to conserve its cash.
The Company reported cash and cash equivalents of $3,637,665 as at August 31, 2015 compared to $5,159,962 as at May 31, 2015. The change in cash position was the net result of $25,728 received from sale of exploration and evaluation costs and $1,708,175 used for operating activities during the three months ended August 31, 2015.
As at August 31, 2015, the Company had working capital of $3,245,853 compared to working capital of $4,716,940 as at May 31, 2015. The Company expects that it will operate at a loss for the foreseeable future and believes the current cash and cash equivalents will be sufficient for it to maintain its currently held properties, and fund its currently anticipated general and administrative costs until December 31, 2015. Following December 31, 2015, the Company will need to scale back anticipated activities and costs or raise additional financing to fund operations through the year ending May 31, 2016. The Company’s current anticipated operating expenses are $2,978,930 until December 31, 2015 and $4,787,850 until August 31, 2016. The Company’s anticipated monthly burn rate averages approximately $745,000 for September to December 2015, where approximately $313,000 is for administrative purposes and approximately $432,000 is for planned exploration expenditures related to the completion of the ongoing Phase II exploration program at the NBP. From September 2015 to August 2016, the Company’s anticipated monthly burn rate averages approximately $399,000, of which $230,000 is for administrative purposes and approximately $169,000 is for planned exploration expenditures related to the ongoing Phase II exploration program at the NBP. The Company anticipates that it will pursue additional public or private equity financings at the beginning of 2016 to raise additional funds for additional exploration at the NBP for the 2016 calendar year. In any event, the Company will be required to raise additional funds, again through public or private equity financings, prior to the end of October 2016 in order to continue in business. Should such financing not be available in that time-frame, the Company will be required to reduce its activities and will not be able to carry out all of its presently planned exploration and development activities at the NBP on its currently anticipated scheduling.
38
The Company currently has no further funding commitments or arrangements for additional financing at this time (other than the potential exercise of incentive stock options) and there is no assurance that the Company will be able to obtain additional financing on acceptable terms, if at all. There is significant uncertainty that the Company will be able to secure any additional financing in the current equity markets. The quantity of funds to be raised and the terms of any proposed equity financing that may be undertaken will be negotiated by management as opportunities to raise funds arise.
The Company has no exposure to any asset-backed commercial paper. Other than cash held by its subsidiaries for their immediate operating needs in Alaska and Nevada, all of the Company’s cash reserves are on deposit with a major Canadian chartered bank. The Company does not believe that the credit, liquidity or market risks with respect thereto have increased as a result of the current market conditions. However, in order to achieve greater security for the preservation of its capital, the Company has, of necessity, been required to accept lower rates of interest, which has also lowered its potential interest income.
Off-Balance Sheet Arrangements
The Company has no off-balance sheet arrangements.
Environmental Regulations
The operations of the Company may in the future be affected from time to time in varying degrees by changes in environmental regulations, including those for future removal and site restoration costs. Both the likelihood of new regulations and their overall effect upon the Company vary greatly and are not predictable. The Company’s policy is to meet or, if possible, surpass standards set by relevant legislation by application of technically proven and economically feasible measures.
Certain U.S. Federal Income Tax Considerations for U.S. Holders
The Company has been a “passive foreign investment company” (“PFIC”) for U.S. federal income tax purposes in recent years and expects to continue to be a PFIC in the future. Current and prospective U.S. shareholders should consult their tax advisors as to the tax consequences of PFIC classification and the U.S. federal tax treatment of PFICs. Additional information on this matter is included in the Company’s Annual Report on Form 10-K as filed with the SEC on August 25, 2015, under “Certain United States Federal Income Tax Considerations”.
39
ITEM 3. QUANTITATIVE AND QUALITATIVE DISCLOSURES ABOUT MARKET RISK
Not applicable.
ITEM 4. CONTROLS AND PROCEDURES
Disclosure Controls and Procedures
As of August 31, 2015, an evaluation was carried out under the supervision of and with the participation of the Company’s management, including the Chief Executive Officer (the principal executive officer) and Chief Financial Officer (the principal financial officer and accounting officer), of the effectiveness of the design and operation of the Company’s disclosure controls and procedures (as defined in Rules 13a-15I and 15d-15(e) of the Exchange Act). Based on the evaluation, the Chief Executive Officer and the Chief Financial Officer have concluded that, as of August 31, 2015, the Company’s disclosure controls and procedures were effective in ensuring that: (i) information required to be disclosed in reports filed or submitted to the SEC under the Exchange Act is recorded, processed, summarized and reported within the time periods specified in applicable rules and forms and (ii) material information required to be disclosed in our reports filed under the Exchange Act is accumulated and communicated to management, including the Chief Executive Officer and Chief Financial Officer, in a manner that allows for accurate and timely decisions regarding required disclosures.
The effectiveness of our or any system of disclosure controls and procedures, however well designed and operated, can provide only reasonable assurance that the objectives of the system will be met and is subject to certain limitations, including the exercise of judgement in designing, implementing and evaluating controls and procedures and the assumptions used in identifying the likelihood of future events.
Changes in Internal Control over Financial Reporting
There were no changes in internal control over financial reporting during the period ended August 31, 2015 that have materially, or are reasonably likely to materially affect, the Company’s internal control over financial reporting.
40
None.
There have been no material changes from the risk factors set forth in our Annual Report on Form 10-K as filed with the SEC on August 25, 2015.
ITEM 2. UNREGISTERED SALES OF EQUITY SECURITIES AND USE OF PROCEEDS
Unregistered Sales of Equity Securities
None
Repurchase of Securities
None
41
ITEM 3. DEFAULTS UPON SENIOR SECURITIES
None.
ITEM 4. MINE SAFETY DISCLOSURES
Pursuant to Section 1503(a) of the Dodd-Frank Act, issuers that are operators, or that have a subsidiary that is an operator, of a coal or other mine in the United States are required to disclose specified information about mine health and safety in their periodic reports. These reporting requirements are based on the safety and health requirements applicable to mines under the Federal Mine Safety and Health Act of 1977 (the “Mine Act”) which is administered by the U.S. Department of Labor’s Mine Safety and Health Administration (“MSHA”). During the three month period ended August 31, 2015, the Company and its subsidiaries and their properties or operations were not subject to regulation by MSHA under the Mine Act and thus no disclosure is required under Section 1503(a) of the Dodd-Frank Act.
None.
42
| 2.1 | Arrangement Agreement and Plan of Arrangement with International Tower Hill Mines Ltd., incorporated by reference to Exhibit 2.1 to the Company’s DRS filing as filed with the SEC on May 12, 2014 |
| 3.1 | Notice of Articles, dated April 13, 2010, incorporated by reference to Exhibit 3.1 to the Company’s DRS filing as filed with the SEC on May 12, 2014 |
| 3.2 | Articles, dated April 12, 2010, incorporated by reference to Exhibit 3.2 to the Company’s DRS filing as filed with the SEC on May 12, 2014 |
| 10.1* | Separation Agreement with Mr. Russell Myers incorporated by reference to Exhibit 10.5 to the Company’s 10K filing as filed with the SEC on August 25, 2015. |
| 23.1 | Consent of Scott W. Wilson, SME, of Metal Mining Consultants, Inc. |
| 23.2 | Consent of Stephen Batman, SME-RM of SBB Mining Solutions LLC |
| 23.3 | Consent of Herbert Osborne, Metallurgical Eng., SME, of H. C. Osborne and Associates |
| 23.4 | Consent of William J. Pennstrom, Jr., SME-RM of Pennstrom Consulting Inc. |
| 31.1 | Certification of Chief Executive Officer pursuant to Exchange Act Rules 13a-14(a) and 15d-14(a), as adopted pursuant to Section 302 of the Sarbanes-Oxley Act of 2002. |
| 31.2 | Certification of Chief Financial Officer pursuant to Exchange Act Rules 13a-14(a) and 15d-14(a), as adopted pursuant to Section 302 of the Sarbanes-Oxley Act of 2002. |
| 32.1 | Certification of the Chief Executive Officer pursuant to 18 U.S.C. Section 1350, as adopted pursuant to Section 906 of the Sarbanes-Oxley Act of 2002. |
| 32.2 | Certification of the Chief Financial Officer pursuant to 18 U.S.C. Section 1350, as adopted pursuant to Section 906 of the Sarbanes-Oxley Act of 2002. |
| 101.INS*(1) | XBRL Instance Document |
| 101.SCH*(1) | XBRL Taxonomy Extension – Schema |
| 101.CAL*(1) | XBRL Taxonomy Extension – Calculations |
| 101.DEF*(1) | XBRL Taxonomy Extension – Definitions |
| 101.LAB*(1) | XBRL Taxonomy Extension – Labels |
| 101.PRE*(1) | XBRL Taxonomy Extension – Presentations |
* - Management compensatory agreement.
| (1) | Submitted Electronically Herewith. Attached as Exhibit 101 to this report are the following formatted in XBRL (Extensible Business Reporting Language): (i) the Condensed Interim Consolidated Balance Sheets at August 31, 2015 and May 31, 2015, (ii) the Condensed Interim Consolidated Statements of Operations and Comprehensive Loss for the Three Months ended August 31, 2015 and 2014, (iii) the Condensed Interim Consolidated Statements of Cash Flows for the Three Months Ended August 31, 2015 and 2014, (iv) the Condensed Interim Consolidated Statement of Changes in Equity for the Three Months Ended August 31, 2015, (v) the Notes to the Condensed Interim Consolidated Financial Statements. |
43
Pursuant to the requirements of Section 13 or 15(d) of the Securities Exchange Act of 1934, the registrant has duly caused this report to be signed on its behalf by the undersigned, thereunto duly authorized.
CORVUS GOLD INC.
(the Registrant)
| By: | /s/ Jeffrey Pontius | |
| Jeffrey Pontius | ||
| Chief Executive Officer | ||
| (Principal Executive Officer) | ||
| Date: October 8, 2015 | ||
| By: | /s/ Peggy Wu | |
| Peggy Wu | ||
| Chief Financial Officer | ||
| (Principal Financial and Accounting Officer) | ||
| Date: October 8, 2015 | ||
44