Attached files
| file | filename |
|---|---|
| EX-4.13 - EX-4.13 - LAYNE CHRISTENSEN CO | layn-ex413_1190.htm |
| EX-95 - EX-95 - LAYNE CHRISTENSEN CO | layn-ex95_7.htm |
| EX-32.2 - EX-32.2 - LAYNE CHRISTENSEN CO | layn-ex322_1201.htm |
| EX-32.1 - EX-32.1 - LAYNE CHRISTENSEN CO | layn-ex321_1200.htm |
| EX-31.2 - EX-31.2 - LAYNE CHRISTENSEN CO | layn-ex312_1199.htm |
| EX-31.1 - EX-31.1 - LAYNE CHRISTENSEN CO | layn-ex311_1198.htm |
| EX-23.1 - EX-23.1 - LAYNE CHRISTENSEN CO | layn-ex231_1195.htm |
| EX-21.1 - EX-21.1 - LAYNE CHRISTENSEN CO | layn-ex211_10.htm |
| EX-10.25 - EX-10.25 - LAYNE CHRISTENSEN CO | layn-ex1025_1192.htm |
| EX-10.24 - EX-10.24 - LAYNE CHRISTENSEN CO | layn-ex1024_1193.htm |
| EX-10.22 - EX-10.22 - LAYNE CHRISTENSEN CO | layn-ex1022_1188.htm |
| EX-10.20 - EX-10.20 - LAYNE CHRISTENSEN CO | layn-ex1020_1187.htm |
| EX-10.19 - EX-10.19 - LAYNE CHRISTENSEN CO | layn-ex1019_1194.htm |
| EX-10.9 - EX-10.9 - LAYNE CHRISTENSEN CO | layn-ex109_1186.htm |
| EX-4.12 - EX-4.12 - LAYNE CHRISTENSEN CO | layn-ex412_1191.htm |
| EX-4.11 - EX-4.11 - LAYNE CHRISTENSEN CO | layn-ex411_1493.htm |
33+
United States
Securities and Exchange Commission
Washington, D.C. 20549
Form 10-K
(Mark One)
|
☒ |
Annual Report Pursuant to Section 13 or 15(d) of the Securities Exchange Act of 1934 |
For the Fiscal Year Ended January 31, 2018
or
|
☐ |
Transition Report Pursuant to Section 13 or 15(d) of the Securities Exchange Act of 1934 |
For the transition period from to .
Commission file number: 001-34195
Layne Christensen Company
(Exact name of registrant as specified in its charter)
|
Delaware |
|
48-0920712 |
|
(State or other jurisdiction |
|
(I.R.S. Employer |
|
of incorporation or organization) |
|
Identification No.) |
1800 Hughes Landing Boulevard Ste 800 The Woodlands, TX 77380
(Address of principal executive offices) (Zip Code)
Registrant’s telephone number, including area code: (281) 475-2600
Securities Registered Pursuant to Section 12(b) of the Act:
|
Title of each class |
|
Name of each exchange on which registered |
|
Common stock, $.01 par value |
|
NASDAQ Global Select Market |
Securities Registered Pursuant to Section 12(g) of the Act: None
Indicate by check mark if the registrant is a well-known seasoned issuer, as defined in Rule 405 of the Securities Act. Yes ☐ No ☒
Indicate by check mark if the registrant is not required to file reports pursuant to Section 13 or Section 15(d) of the Act. Yes ☐ No ☒
Indicate by check mark whether the registrant (1) has filed all reports required to be filed by Section 13 or 15(d) of the Securities Exchange Act of 1934 during the preceding 12 months (or for such shorter period that the registrant was required to file such reports) and (2) has been subject to such filing requirements for the past 90 days. Yes ☒ No ☐
Indicate by check mark whether the registrant has submitted electronically and posted on its corporate Web site, if any, every Interactive Data File required to be submitted and posted pursuant to Rule 405 of Regulation S-T (§ 232.405 of this chapter) during the preceding 12 months (or for such shorter period that the registrant was required to submit and post such files). Yes ☒ No ☐
Indicate by check mark if disclosure of delinquent filers pursuant to Item 405 of Regulation S-K (§29.405 of this chapter) is not contained herein and will not be contained, to the best of registrant’s knowledge, in definitive proxy or information statements incorporated by reference in Part III of this Form 10-K or any amendment to this Form 10-K. ☐
Indicate by check mark whether the registrant is a large accelerated filer, an accelerated filer, a non-accelerated filer, or a smaller reporting company, or an emerging growth company. See definition of “large accelerated filer,” “accelerated filer”, “smaller reporting company” and “emerging growth company” in Rule 12b-2 of the Exchange Act.
(Check one):
|
Large accelerated filer |
|
☐ |
|
Accelerated filer |
|
☒ |
||||||||
|
|
|
|
|
|||||||||||
|
Non-accelerated filer |
|
☐ (Do not check if a smaller reporting company) |
|
Smaller reporting company |
|
☐ |
||||||||
|
|
|
|
|
|
|
Emerging growth company |
|
☐ |
||||||
If an emerging growth company, indicate by check mark if the registrant has elected not to use the extended transition period for complying with any new or revised financial accounting standards provided pursuant to Section 13(a) of the Exchange Act. ☐
Indicate by check mark whether the registrant is a shell company (as defined in Rule 12b-2 of the Exchange Act). Yes ☐ No ☒
The aggregate market value of the 18,000,115,shares of Common Stock of the registrant held by non-affiliates of the registrant on July 31, 2017, the last business day of the registrant’s second fiscal quarter, computed by reference to the closing sale price of such stock on the NASDAQ Global Select Market on that date was $190,621,218.
At March 31, 2018, there were 19,917,043 shares of the Registrant’s Common Stock outstanding.
Documents Incorporated by Reference
Portions of the following document are incorporated by reference into the indicated parts of this report: Definitive Proxy Statement for the 2018 Annual Meeting of Stockholders to be filed with the Commission pursuant to Regulation 14A.
Form 10-K
General
Layne Christensen Company (“Layne”, “our”, “we” or “us”) is a leading global water management and services and drilling company, with more than 130 years of industry experience. We provide responsible, sustainable, integrated solutions to address the world’s water, minerals and infrastructure challenges. Protecting essential natural resources is a continuing focus within Layne. Our customers include government agencies, investor-owned utilities, industrial companies, multi-national mining companies, consulting engineering firms, oil and gas companies, power companies and agribusiness.
We operate approximately 52 sales and operations offices located throughout North America, Brazil and through our affiliates in Latin America. We maintain executive offices at 1800 Hughes Landing Boulevard, Suite 800, The Woodlands, Texas 77380. The telephone number is (281) 475-2600 and the website address is www.layne.com which is where you can find periodic and current reports, free of charge, as such material is filed with the Securities and Exchange Commission (“SEC”).
We manage for our customers, water and related infrastructure throughout its lifecycle, including supply, treatment, delivery, maintenance and rehabilitation. Throughout each phase, we work to ensure compliance with complex state and federal regulations and to meet increasingly high demand for quality, reliability and efficiency. Our mineral services teams extract representative samples that accurately reflect the underlying mineral deposits for our global mining customers and also offer mine water management services consisting of vertical, large diameter wells for sourcing and dewatering, and horizontal drains for slope de-pressurization.
Current Event
On February 13, 2018, we entered into a definitive agreement (the “Merger Agreement”) whereby Granite Construction Incorporated will acquire all of the outstanding shares of Layne in a stock-for-stock transaction with each share of Layne common stock exchanged for 0.27 shares of Granite common stock. The transaction is subject to the approval by Layne’s shareholders and other customary closing conditions.
Business Segments
During the first quarter of fiscal year ended January 31, 2018, we completed the sale of substantially all of the assets of our Heavy Civil business. The results of operations related to the Heavy Civil business have been classified as discontinued operations for all periods presented. Unless noted otherwise, discussion in this Form 10-K pertain to continuing operations. See Note 16 to the Consolidated Financial Statements for a discussion of discontinued operations.
As of fiscal year ended January 31, 2018, we operate our business in three segments: Water Resources, Inliner and Mineral Services. Each of our segments has major customers; however, no single customer accounted for 10% or more of revenues in any of the past three fiscal years. See Note 17 to the Consolidated Financial Statements for financial information pertaining to the operations and geographic spread of the segments and foreign operations.
Water Resources
Operations
We provide a full suite of water-related products and services throughout the United States (“U.S.”), including hydrologic design, source of supply exploration, well and intake construction, including radial collector wells (Ranney® Collector Wells) and well and pump maintenance and rehabilitation. The radial collector well group specializes in the design and turnkey infrastructure of high capacity water supply systems including radial collector wells, surface water intakes, infiltration galleries, riverbank filtration and sea water systems. Collector wells which are less intrusive on the environment, typically combine high yields with cost-effective operating and maintaining costs. We also offer water treatment equipment and engineering services, providing systems for the treatment of regulated and nuisance contaminants, specifically iron, manganese, hydrogen sulfide, arsenic, radium, nitrate, perchlorate and volatile organic compounds.
1
Water supply solutions for government agencies, industry and agriculture require the integration of hydrogeology and engineering with proven knowledge and application of drilling techniques. The drilling methods, size and type of equipment required depend upon the depth of the wells and the geological formations encountered at the project site. We have extensive well archives in addition to technical personnel who determine geological conditions and aquifer characteristics. We provide feasibility studies, analyze the results and define the source, depth and magnitude of an aquifer. We can estimate recharge rates, recommend well design features, plan well field design and develop water management plans. To conduct these services, we maintain a staff of professional employees including engineers, geologists and hydrogeologists.
Our involvement in the initial drilling of wells positions us to win follow-up maintenance and rehabilitation business. Such rehabilitation is periodically required during the life of a well, as groundwater may contain bacteria, iron, high mineral content, or other contaminants and screen openings may become blocked, reducing the capacity and productivity of the well. We offer complete diagnostic and rehabilitation services for existing wells, pumps and related equipment through our network of regional offices. In addition to our well service rigs, we have equipment capable of conducting downhole closed circuit televideo inspections, one of the most effective methods for investigating water well problems, enabling us to effectively diagnose and respond quickly to well and pump performance problems. Our personnel can perform a variety of well rehabilitation techniques, using both chemical and mechanical methods. We also have the capability and inventory to repair, in our own machine shops, most water well pumps, regardless of manufacturer, as well as to repair well screens, casings and related equipment such as chlorinators, aerators and filtration systems. Water Resources also offers investigative services to assist in assessing, monitoring and characterizing water quality and aquifer parameters.
Water Resources provides water management solutions to the oil and natural gas industry’s exploration and production water related challenges. Our water management services specialize in hydrogeological assessments and sourcing, transfer, storage and treatment. Our Water Midstream business provides responsible water lifecycle solutions to energy producers in the Delaware Basin in West Texas through the creation of sustainable high-capacity water delivery infrastructure. Operations include our Hermosa Pipeline system, a 26 mile pipeline near Pecos, Texas, delivering up to 175,000 barrels of non-potable water per day for use in energy drilling and completion activities, water storage facilities and the exclusive right to develop non-potable water resources for use in energy drilling and completion activities on approximately 88,000 acres owned by the State of Texas General Land Office in Reeves and Culberson counties.
Customers & Markets
In Water Resources, our customers are typically government agencies, national and regional consulting firms engaged by federal and state agencies and local operations of agricultural, industrial and energy businesses. The term “government agencies” includes federal, state and local entities.
Demand for water solutions are expected to grow as government agencies, industrial, agricultural and energy companies compete for increasingly limited water resources. The combination of tightening regulations and water scarcity has resulted in increasingly sophisticated water consumers and this in turn has created opportunities for the introduction of long-term sustainable methods and technologies such as aquifer recharge, water re-use, injection wells and zero-liquid discharge treatment systems. Injection wells place fluid deep underground into porous rock formations, and we have seen increasing market demand driven by new regulations and the need to economically dispose of waste associated with municipal and industrial water treatment.
Main drivers for water supply and treatment include shifting demographics, new residential and commercial development, deteriorating water quality and infrastructure that supplies our water, increasing water demand from industrial expansion, increasing amounts of water used in oil and gas production, stricter regulation and new technology that allows us to achieve new standards of quality. Well and pump rehabilitation demand depends on the age and application of the equipment, the quality of material and workmanship applied in the original well infrastructure and changes in depth and quality of the groundwater. The demand for well and pump rehabilitation in the public market is highly influenced by municipal budgets.
Competition
The U.S. water well drilling and rehabilitation markets are highly fragmented, consisting of several thousand regional and local contractors. Water well drilling work is usually obtained on a competitive bid basis for government agencies, while work for industrial customers is obtained both on a competitive bid and negotiated basis. The majority of these water well drilling contractors are primarily involved in drilling low-volume water wells for agricultural and residential customers, markets in which we do not generally participate. Competition in the energy market is primarily from local or regional small and mid-sized contractors.
2
There are no proprietary technologies or other significant factors that prevent other firms from entering these local or regional markets or from consolidating into larger companies more comparable in size to us.
Well and pump rehabilitation work is typically negotiated on an emergency basis or within a relatively short period of time. Those companies with available rigs and the requisite expertise have a competitive advantage by being able to respond quickly to repair requests.
Inliner
Operations
Inliner is an infrastructure solutions provider offering a wide range of rehabilitation techniques and services for wastewater, storm water and process sewer pipeline networks. The foundation of our services remains our proprietary Inliner® and Inliner STX® cured-in-place pipe (“CIPP”) products. These products allow us to rehabilitate aging and deteriorated infrastructure to provide structural rebuilding as well as infiltration and inflow reduction. The trenchless nature of the products reduces rehabilitation costs, minimizes environmental impact and reduces or eliminates surface and social disruption.
Since Inliner’s start as the first U.S. licensee of the Inliner® technology in 1991, we have expanded and have come to own and operate Inliner Technologies and Liner Products, the technology company and lining tube manufacturer, respectively. This vertical integration gives us control of the Inliner® product from raw material purchases to product installation. In our 27 year history, we have successfully installed more than 25 million feet of 4 to 96-inch CIPP throughout the U.S. in traditional round as well as non-circular pipe geometries. Inliner’s lining tube manufacturing, design, saturation (both felt and ultra violet (“UV”)), and installation techniques are all ISO 9001:2015 certified, bringing an added level of quality control to our products and offered services.
Inliner has the ability to supply both traditional felt-based or composite CIPP lining tubes cured with water or steam, and fiberglass-based lining tubes cured with ultraviolet light. We continue to offer outside sales of dry as well as install-ready, resin-saturated felt liners and install-ready, resin-saturated fiberglass/UV liners to other marketplace installers.
While Inliner focuses on CIPP, we also provide full system renewal and infrastructure management services. Renewal methods include Janssen structural renovation of service lateral connections, traditional excavation and replacement and manhole renewal. Inliner’s expertise, experience and customer-oriented contracting combined with an ability to provide a diverse line of products and services differentiates us from other rehabilitation contractors and allows Inliner to provide clients with single source accountability for rehabilitative and large construction type projects.
Customers & Markets
Inliner’s primary customer base is comprised of municipalities, operating groups of municipal systems and local operations of industrial businesses. Customers for both felt and fiberglass based tube supplied through Liner Products remain predominantly U.S. based. Inliner’s current geographic reach stretches from the east coast westward to the Rocky Mountains.
Many of the drivers for wastewater, storm water and process sewer rehabilitation demand are largely a function of deteriorating urban infrastructure compounded by population growth and deteriorating water quality. U.S. Environmental Protection Agency (EPA) mandated consent decrees continue to drive the larger rehabilitation programs and force those entities to address infiltration and inflow of groundwater into damaged or leaking sewer lines, within defined timelines. These factors and enforcement of stricter regulation drive the rehabilitation market to continue to deploy technologies like CIPP and combine them with new technologies all while continuing to focus on the achievement of lasting solutions and high quality standards.
Competition
The U.S. competitive landscape remains fragmented with a limited number of CIPP providers able to provide nationwide coverage. Numerous, smaller scale, regionalized competitors in both the felt and UV arenas exist. Municipal work is most often obtained on a competitive bid basis with some exceptions of qualification-based or design build proposals used predominantly in larger, longer-term and more complex projects. Multi-year contracts, although typically obtained at least initially through a structure that involves a competitive pricing element, continue to exist and remain a focal point for Inliner. Industrial or private work is only a small percentage of revenue and is a mix of competitive bid and negotiated.
3
Larger competitors share the same vertical integration-tube manufacturing/assembly, resin-saturation (wetout) and installation- as Inliner, while most of our smaller competitors rely on third party tube supply and wetout. This readily-available, saturated tube supply for both traditional, heat cured, felt based products and UV cured fiberglass products combined with the ability to not have to construct and permit saturation facilities, allows smaller competitors to continue to enter and remain in the CIPP market. The smaller installers often perform CIPP as a side product to complement other work they perform.
Despite widespread competition, Inliner remains one of the most diversified providers in the industry by supplying a good quality, competitively priced group of core products and then complementing that product group with ancillary product offerings, subcontracting partnerships and construction management services all designed to provide broader solutions that go beyond just CIPP installation.
Mineral Services
Operations
Before investing heavily in development to extract minerals, global mining and junior mining companies hire companies such as Mineral Services to extract rock and soil samples for analyses of mineral content and grade. Mineral Services conducts drilling activities, including all phases of core drilling, reverse circulation, dual tube, hammer and rotary air-blast methods. Samples extracted must be free of contamination and accurately reflect the location and orientation of underlying mineral deposits. We also drill to support the definition of ore bodies to maximize the efficiency of mining operations. Mines often face water problems; with either too little water to supply processing needs or too much water, causing concerns with flooding and/or mine stabilization. Layne’s mine water management services utilize our expertise at completing high yield wells to find new sources of water or to construct wells that efficiently de-water areas for depressurization to increase slope stability.
Mineral Services also has ownership interests in foreign affiliates operating in Latin America that form our primary presence in Chile and Peru. Mineral Services manages interests in our foreign affiliates, where we do not have majority ownership or operating control, through regular management meetings and analysis of key operating and financial information. The foreign affiliates are engaged in similar operations to Mineral Services and also the manufacture and supply of drilling equipment, parts and supplies.
The mining industry has experienced improvement with the increase in demand for mineral exploration over the past year. This improvement has been driven by strengthening commodity prices of base and precious metals. Mineral Services has continually adjusted our operations to respond to the industry’s market conditions, which are cyclical in nature. Our safety record and ability to re-deploy assets quickly positions Mineral Services well to respond to such opportunities.
Customers and Markets
Mineral Services customers are major gold and copper producers and to a lesser extent, other base metal producers including iron ore. Mineral Services’ largest customers are multi-national corporations headquartered in the U.S., Brazil, Europe and Canada. The success of Mineral Services is closely tied to global commodity prices and demand for the products of our global mining customers. Our primary markets are in North America, Brazil and through our affiliates in Latin America. See Item 1A, Risk Factors for a discussion of the risks associated with operating in these foreign countries.
Demand for mineral exploration drilling is driven by the need to identify, define and develop underground base and precious mineral deposits. Factors influencing the demand for mineral-related drilling services include the absolute price level and volatility in commodity prices, international economic and political conditions, inflation, foreign exchange levels, the economic feasibility of mineral exploration and production, the discovery rate of new mineral reserves and the ability of mining companies to access capital for their activities.
The mineral exploration market is dependent on financial and credit markets being readily available to fund drilling and mining programs. In addition, mining companies’ ability to raise capital for their operations through other avenues, which traditionally have been available to them, is dependent on market pricing trends for base and precious metals.
Competition
Mineral Services competes with a number of drilling companies, as well as vertically integrated mining companies that conduct their own exploration drilling activities. In the mineral exploration drilling market, Mineral Services competes based on price, technical expertise and reputation. Mineral Services work is typically performed on a private bid basis.
4
Contracts
We identify potential projects from a variety of sources. After determining which projects are available, we make a decision on which projects to pursue based on factors such as client history, project size, duration, availability of personnel, current backlog, profitability expectations, risk profile, type of contract, prior experience, source of project funding and geographic location.
We execute our contracts through a variety of methods, including cost-plus, fixed-price, time and material, day rate, unit price or some combination of these methods. Customers may consider price, technical capabilities of equipment and personnel, safety record and reputation, among other factors.
Fixed-price contracts have historically been used in competitively bid public water well and specialty contracts. These contracts commit us to provide all of the resources required to complete a project for a fixed sum. Usually, fixed-price contracts transfer more risk to us.
Most of our contract revenues and costs are recognized using the percentage of completion method. For each contract, we regularly review contract price and cost estimates as the work progresses and reflect adjustments in profit proportionate to the percentage of completion of the related project in the period when we revise those estimates. To the extent that these adjustments result in a reduction or elimination of previously reported profits with respect to a project, we recognize a charge against current earnings which could be material.
Backlog Analysis
Backlog represents the dollar amount of revenues we expect to recognize in the future from contracts that have been awarded. We include a project in backlog at such time as contracts are executed or notices to proceed are obtained, depending on terms of the contract. Backlog amounts include anticipated revenues associated with the original contract amounts, executed change orders and any claims that may be outstanding with customers for which recovery is considered probable. The backlog figures are subject to modifications, alterations or cancellation provisions contained in the various contracts. Historically, those provisions have not had a material effect on the consolidated financial statements.
Backlog may not be indicative of future operating results. There have been no changes in the methodology used to determine backlog during the fiscal years ended January 31, 2018 and 2017. Backlog is not a measure defined by generally accepted accounting principles in the United States (“GAAP”) and is not a measure of profitability. Our method for calculating backlog may not be comparable to methodologies used by other companies.
Layne’s backlog of uncompleted contracts at January 31, 2018, was approximately $178.6 million compared to $166.6 million at January 31, 2017. The following table provides an analysis of backlog by segment for the fiscal year ended January 31, 2018.
|
|
|
Backlog at |
|
|
New Business |
|
|
Revenues Recognized |
|
|
Backlog at |
|
||||
|
(in millions) |
|
January 31, 2017 |
|
|
Awarded (1) |
|
|
FY 2018 |
|
|
January 31, 2018 (2) |
|
||||
|
Water Resources |
|
$ |
49.2 |
|
|
$ |
171.1 |
|
|
$ |
172.4 |
|
|
$ |
47.9 |
|
|
Inliner |
|
|
117.4 |
|
|
|
219.2 |
|
|
|
205.9 |
|
|
|
130.7 |
|
|
Total |
|
$ |
166.6 |
|
|
$ |
390.3 |
|
|
$ |
378.3 |
|
|
$ |
178.6 |
|
|
|
|
|
|
|
|
|
|
|
|
|
|
|
|
|
|
|
|
|
(1) |
New business awarded consists of the original contract price of projects added to our backlog plus or minus subsequent changes to the estimated total contract price of existing contracts. |
|
|
(2) |
As of January 31, 2018, approximately 11% of total backlog is not reasonably expected to be completed during the next twelve months. |
Of Layne’s total backlog of $178.6 million as of January 31, 2018, approximately $6.3 million relates to active contracts that are in a loss position. The remaining contracts in backlog have future revenues which are expected to equal or exceed costs when recognized. We can provide no assurance as to the profitability of the contracts reflected in backlog. It is possible that the estimates of profitability could increase or decrease based on changes in productivity, actual downtime and the resolution of change orders and any claims with customers. As of January 31, 2018, there were no significant contracts in backlog not moving forward as originally scheduled.
During the fiscal years ended January 31, 2018 and 2017, there were no significant cancellations of contracts previously included in backlog and no significant changes in anticipated gross margin trends based on current backlog.
5
Seasonality
The domestic drilling and infrastructure services activities and related revenues and earnings tend to decrease in the winter months when adverse weather conditions interfere with access to project sites. Additionally, drilling activities and services typically slow down during Thanksgiving, Christmas and New Year holidays. As a result, revenues and earnings in our first and fourth fiscal quarters tend to be less than revenues and earnings in the second and third fiscal quarters.
Regulation
General
Each of our segments is subject to various laws and regulations relating to the protection of the environment and worker health and safety. In addition, each segment is subject to its own unique set of laws and regulations imposed by federal, state, local and foreign laws relating to licensing, permitting, approval, reporting, bonding and insurance requirements.
Management believes that our operations comply in all material respects with applicable laws and regulations and that the existence and enforcement of such laws and regulations have no more restrictive effect on the method of operations than on other similar companies in the industries in which we operate. Layne has internal procedures and policies that management believes help to ensure that our operations are conducted in compliance with current regulations.
We are subject to the reporting requirements of the Securities and Exchange Act of 1934, as amended (“the Exchange Act”), the Sarbanes-Oxley Act of 2002 (the “Sarbanes-Oxley Act”), the Dodd-Frank Wall Street Reform and Consumer Protection Act (the “Dodd-Frank Act”), the listing requirements of NASDAQ and other applicable securities rules and regulations.
Environmental
Our operations are subject to stringent and complex federal, state, local and foreign environmental laws and regulations. These include, for example, (1) the federal Clean Air Act and comparable state and foreign laws and regulations that impose obligations related to air emissions, (2) the federal Resource Conservation and Recovery Act and comparable state and foreign laws that regulate the management of waste from our facilities, (3) the Comprehensive Environmental Response, Compensation and Liability Act of 1980 (“CERCLA”) and comparable state and foreign laws that regulate the cleanup of hazardous substances that may have been released at properties owned or operated by us, our predecessors or locations where we or our predecessors sent waste for disposal and (4) the federal Clean Water Act and the Safe Drinking Water Act and analogous state and foreign laws and regulations that impose detailed permit requirements and strict controls regarding water quality and the discharge of pollutants into waters of the U.S. and state and foreign waters.
Such regulations impose permit requirements, effluent standards, waste handling and disposal restrictions and other design and operational requirements, as well as record keeping and reporting requirements, upon various aspects of Layne’s businesses. Some environmental laws impose liability and cleanup responsibility for the release of hazardous substances regardless of fault, legality of original disposal or ownership of a disposal site. Any changes in the laws and regulations governing environmental protection, land use and species protection may subject us to more stringent environmental control and mitigation standards. In addition, these and other laws and regulations may affect many of our customers and influence their determination whether to engage in projects which utilize our products and services.
As part of Layne’s adherence to environmental laws and regulation, we focus on sustainability. Our employees contribute to the economic and environmental sustainability of the communities in which we operate.
We have made and will continue to make expenditures in our efforts to comply with these environmental requirements. Management does not believe that, to date, we have expended material amounts in connection with such activities or that compliance with these requirements will have a material adverse effect on our capital expenditures, earnings or competitive position.
Safety and Health
Our operations are also subject to various federal, state, local and foreign laws and regulations relating to worker health and safety. In many cases, a solid safety record is a requirement of doing business with our customers.
6
The Occupational Safety and Health Administration ("OSHA”) establishes certain employer responsibilities, including maintenance of a workplace free of recognized hazards likely to cause death or serious injury, compliance with standards promulgated by OSHA and various recordkeeping, disclosure and procedural requirements. Various standards, including standards for notices of hazards and safety in excavation and demolition work may apply to our operations.
The operations of Mineral Services are also subject to the Federal Mine Safety and Health Act of 1977 (the “Mine Act”). In addition to federal regulatory programs, all of the states and foreign governments in which Mineral Services operates have programs for mine safety and health regulation and enforcement. The Mine Act requires mandatory inspections of surface and underground mines and requires the issuance of citations or orders, as well as the imposition of civil penalties or criminal liability for violations of mandatory health and safety standards and record keeping requirements.
The operation and registration of our motor vehicles are subject to various regulations, including those promulgated by the U.S. Department of Transportation (“DOT”), including rules on commercial driver licensing, controlled substance testing, medical and other qualifications for drivers, equipment maintenance and drivers’ hours of service.
Permits and Licenses
Many states require regulatory mandated construction permits which typically specify that wells, water and sewer pipelines and other infrastructure projects be constructed in accordance with applicable statutes. Our water treatment business is also subject to legislation and municipal requirements that set forth discharge parameters, constrain water source availability and set quality and treatment standards. Various state, local and foreign laws require that water wells and monitoring wells be installed by licensed well drillers. Many of the jurisdictions in which we operate require construction contractors to be licensed. We maintain well drilling and contractor’s licenses in those jurisdictions in which we operate and in which such licenses are required. In addition, we employ licensed engineers, geologists and other professionals necessary to the conduct of our business. In those circumstances in which we do not have a required professional license, we subcontract that portion of the work to a firm employing the necessary licensed professionals. Our operations are also subject to various permitting and inspection requirements and building and electrical codes. In Mineral Services, drilling also frequently requires environmental permits, which are usually obtained by our customers.
Anti-corruption and Bribery
We are subject to the Foreign Corrupt Practices Act (“FCPA”), which prohibits U.S. and other business entities from making improper payments to foreign government officials, political parties or political party officials. We are also subject to the applicable anti-corruption laws in the jurisdictions in which we operate, thus potentially exposing us to liability and potential penalties in multiple jurisdictions. The anti-corruption provisions of the FCPA are enforced by the Department of Justice (“DOJ”). In addition, the SEC requires strict compliance with certain accounting and internal control standards set forth under the FCPA. Failure to comply with the FCPA and other laws can expose us and/or individual employees to potentially severe criminal and civil penalties. Such penalties may have a material adverse effect on our business, financial condition and results of operations.
We devote resources to the development, maintenance, communication and enforcement of our Business Code of Conduct, our anti-bribery compliance policies, our internal control processes and compliance related policies. We strive to conduct timely internal investigations of potential violations and take appropriate action depending upon the outcome of the investigation.
Insurance and Bonding
Our property and equipment is covered in part by insurance and we believe the amount and scope of such insurance is adequate for the risks we face. In addition, we maintain general liability, excess liability and worker’s compensation insurance in amounts that we believe are consistent with industry practice.
As is common practice in drilling and infrastructure services business, we are required at times to provide surety bonds as an additional level of security of our performance. We have surety arrangements with more than one surety.
Employees
At January 31, 2018, we had approximately 2,178 employees, approximately 67 of whom were members of collective bargaining units represented by locals affiliated with major labor unions in the U.S. Management believes that its relationship with employees is satisfactory. In all of Layne’s operations, an important competitive factor is technical expertise; accordingly, Layne emphasizes the growth and development of its personnel.
7
In addition, Layne emphasizes strict adherence to all health and safety policies and procedures. This emphasis encompasses developing site-specific safety plans, ensuring regulatory compliance and training employees in regulatory compliance and sound safety practices. Training consists of OSHA and/or Mine Safety and Health Administration (“MSHA”) training as required and as applicable. Layne provides this training through certified and/or qualified trainers. In addition to the training, the safety team is also responsible for preparing health and safety site specific plans and provides guidance and site analysis for the health and safety plans prepared by others.
Many of our employees have extensive experience with Layne and our industries and have advanced academic backgrounds in agricultural, chemical, civil, industrial, geological and mechanical engineering, geology and metallurgy. Management believes that our size and reputation allows us to compete effectively for highly qualified professionals.
Investing in our common stock is subject to risks and uncertainties. You should carefully consider the risks described below with all of the other information contained or incorporated by reference in this annual report on Form 10-K before deciding to invest in our common stock. Many of these risks are beyond our control and are driven by factors that often cannot be predicted. If any of the following risks actually occur, they may materially harm our business and our financial condition and results of operations. In this event, the market price of our common stock could decline and you could lose part or all of your investment.
Risks Relating to Our Business and Industry
Demand for our services is subject to economic conditions and volatility in private industry and municipal and other governmental spending. This could materially and adversely affect our revenues, profits and our financial condition.
During times of uncertain economic conditions, our customers may face budget shortfalls and may reduce or defer capital spending that could decrease the overall demand for our services. In addition, our customers may find it difficult to raise capital in the future. Levels of municipal spending particularly impact Water Resources and Inliner. Reduced tax revenue or user fee in certain regions, or inability to access traditional sources of credit, may limit spending and new development by municipalities or local governmental agencies, which in turn may adversely affect the demand for our services and reduce our revenue.
Many of our customers, especially federal, state and local governmental agencies competitively bid their contracts. In addition, projects with negotiated contracts are also highly competitive. Our customers may also demand lower pricing as a condition of continuing our services. In addition, certain of our customers may be unable to pay us if they are unable to raise capital to fund their business operations, which would have an adverse effect on our revenue and cash flows.
Volatility within the global commodity markets may negatively impact Mineral Services. Mineral exploration is highly speculative and is influenced by a variety of factors, including the prevailing prices for various metals (particularly gold and copper), which often fluctuate widely in response to global supply and demand, international economic trends, currency exchange fluctuations, expectations for inflation, speculative activities and political events.
Volatility in the price of crude oil and natural gas may negatively impact our Water Midstream business. Crude oil and natural gas exploration, development and production is influenced by a variety of factors, including the prevailing prices for crude oil and natural gas, which often fluctuate widely in response to global supply and demand, international economic trends, currency exchange fluctuations and political events. Demand for our Water Midstream services is highly dependent on the level of exploration, development and production of crude oil and natural gas in the geographic areas in which we operate.
Because our operations are impacted by certain seasonality, our results can fluctuate significantly, which could make it difficult to evaluate our business and could cause instability in the market price of our common stock.
Adverse weather conditions, natural disasters, disease, force majeure and other similar events can curtail our operations in various regions in which we operate, resulting in performance delays and increased costs.
8
Moreover, our domestic activities and related revenue and earnings tend to decrease in the winter months when adverse weather conditions interfere with access to drilling or other infrastructure services sites. Additionally, activities related to our domestic and international operations can decrease due to year end holidays as certain customers stop operations during this time. As a result, our revenue and earnings in the second and third quarters tend to be higher than revenue and earnings in the first and fourth quarters. Accordingly, as a result of the foregoing as well as other factors, our quarterly results should not be considered indicative of results to be expected for any other quarter or for any full fiscal year.
Our failure to meet the schedule or performance requirements of our contracts could harm our reputation, reduce our client base and harm our future operations.
In certain circumstances, we guarantee contract completion by a scheduled acceptance date. Failure to meet any such schedule could result in additional costs and the amount of such additional costs could exceed projected profit margins. These additional costs could include liquidated damages paid under contractual penalty provisions, which can be substantial and can accrue on a daily basis. In addition, our actual costs could exceed our projections. Performance problems for existing and future contracts could increase the anticipated costs of performing those contracts and cause us to suffer damage to our reputation within our industry and our client base, which would harm our future business.
The timing of new contract awards and the performance of those new contracts could result in fluctuations in our operating results and cash flows.
New projects often entail a lengthy and complex design and bidding process. This process can be affected by governmental approvals, budget negotiations, funding approvals, permitting, weather, as well as changing market conditions. The uncertainty of the timing of contract awards as well as the timing of the commencement date of the contract can have an adverse effect on our results of operations and cash flows causing fluctuations from quarter to quarter or year to year. These fluctuations can be significant.
We may not fully realize the anticipated benefits from our restructuring plans.
We continue to implement certain restructuring initiatives that seek to reduce our cost structure and streamline our operations. These restructuring plans have, among other things, resulted in a reduction in workforce, cost containment measures and working capital management initiatives.
Our restructuring plans may not reduce expenses or produce the cost savings we anticipate or in the time frame we expect. Further restructuring activities may also be required in the future beyond what is currently planned, which could enhance the risks associated with these activities.
In addition, our management periodically reviews our businesses and portfolio of assets to identify those businesses and assets that may be underperforming and for which we may consider a sale or other disposition. However, we may not correctly identify businesses or assets that are, or will be, underperforming, and we may not be able to dispose of those businesses and assets on favorable terms in a timely manner, if at all. Our inability to identify and favorably dispose of underperforming businesses and assets may significantly harm our business.
If we are unable to retain skilled workers, or if a work stoppage occurs as a result of disputes relating to collective bargaining agreements, our ability to operate our business could be limited and our revenue could be reduced.
Our ability to remain productive, profitable and competitive depends substantially on our ability to retain and attract skilled workers with expert geological and other engineering knowledge and capabilities. The demand for these workers is high and the supply is limited. An inability to attract and retain trained drillers and other skilled employees could limit our ability to operate our business and reduce our revenue.
As of January 31, 2018, approximately 3% of our workforce was unionized and 3 of our 8 active collective bargaining agreements are scheduled to expire within the next 12 months. To the extent that disputes relating to existing or future collective bargaining agreements arise, a work stoppage could occur. If protracted, a work stoppage could reduce or suspend our operations and reduce our revenue.
9
Fluctuations in the prices of raw materials could increase our operating costs.
We purchase steel, resin, concrete and fuel for use in connection with our businesses. We also purchase a significant volume of fuel to operate our trucks and equipment. The manufacture of materials used in our sewer rehabilitation business is dependent upon the availability of resin, a petroleum-based product. At present, we do not engage in any type of hedging activities to mitigate the risks of fluctuating market prices for oil, steel, resin, concrete or fuel and increases in the price of these materials may increase our operating costs.
International trade tariffs and restrictions in the steel market may adversely affect our business.
Portions of our business either use significant quantities of imported steel or are dependent on providing products and services to customers that import steel into the United States from the international markets. To the extent that trade tariffs and other restrictions imposed by the United States increase the price of, or limit the amount of, steel imported into the United States, the costs of our raw materials may be adversely affected and/or the demand from our customers for products and services may be diminished, which could adversely affect our revenues and profitability.
If we are not able to demonstrate our technical competence, competitive pricing and reliable performance to potential customers we will lose business to competitors, which would reduce our profit.
We face significant competition and a large part of our business is dependent upon obtaining work through a competitive bidding process. In Water Resources and Inliner, we compete with many smaller firms on a local or regional level, many of whom may have a lower corporate overhead cost than us. We also compete with larger competitors that may be better capitalized than us and may have a lower cost of capital. There are few proprietary technologies or other significant factors which prevent other firms from entering these local or regional markets or from consolidating together into larger companies more comparable in size to our company. Competition also places downward pressure on our contract prices and profit margins. Competition in all of our markets has intensified in the last few years and such heightened competition may continue for the foreseeable future. If we are unable to meet these competitive challenges, we could lose market share to our competitors and experience an overall reduction in our profit. Additional competition could reduce our profit.
If we cannot obtain third-party subcontractors, or if their performance is unsatisfactory, our profit could be reduced.
We rely on third-party subcontractors to provide services on some of our projects. To the extent that we cannot engage subcontractors as planned, our ability to complete a project in a timely fashion or at a profit may be impaired. If the amount we are required to pay for subcontracted services exceeds the amount we have estimated in bidding for fixed-price work, we could experience reduced profits or losses in the performance of these contracts. In addition, if a subcontractor is unable to deliver its services according to the negotiated terms for any reason, including the deterioration of its financial condition, we may be required to purchase the services from another source at a higher price, which could reduce the profit to be realized or result in a loss on a project for which the services were needed. Also, if our subcontractors perform unsatisfactory work, we may become subject to increased warranty costs or product liability or other claims against us.
We may pay our suppliers and subcontractors before receiving payment from our customers for the related services.
We use suppliers to obtain the necessary materials and subcontractors to perform portions of our services and to manage work flow. In some cases, we pay our suppliers and subcontractors before our customers pay us for the related services. We may pay our suppliers and subcontractors for materials purchased and work performed for customers who fail to pay, or delay paying, us for the related work, which could harm our liquidity and results of operations.
We extend trade credit to customers for purchases of our services and in the past we have had and in the future we may have, difficulty collecting receivables from customers that experience financial difficulties.
We grant trade credit, generally without collateral, to our customers, which include mining companies, general contractors, commercial and industrial facility owners, government agencies and industrial companies. Consequently, we are subject to potential credit risk related to changes in business and economic factors in the geographic areas in which our customers are located. If any of our major customers experience financial difficulties, we could experience reduced cash flows and losses in excess of current allowances provided. In addition, material changes in any of our customers’ revenues or cash flows could affect our ability to collect amounts due from them.
10
If we are unable to obtain performance bonds or letters of credit on acceptable terms, our ability to obtain future projects could be negatively impacted.
A portion of our projects require us to procure a bond to secure performance. Our continued ability to obtain surety bonds primarily will depend upon our capitalization, working capital, past performance, management expertise and reputation and certain external factors, including the overall capacity of the surety market. Surety companies consider such factors in relationship to the amount of our backlog and their underwriting standards, which may change from time to time. With a decreasing number of insurance providers in that market, it may be difficult to find sureties who will continue to provide contract-required bonding on acceptable terms and conditions.
We have granted our sureties a security interest in certain assets. The surety companies may in the future request us to provide further collateral or other security. Our ability to satisfy any future requests may require the consent of the lenders under the asset-based credit facility. If the lenders are unwilling to agree to any future requests on terms acceptable to the surety companies, we may be unable to continue to obtain performance bonds on acceptable terms.
On certain projects we may enter into a joint venture agreement with others. Our ability to obtain a bond may also depend on the credit and performance risks of our joint venture partners.
In addition, events that generally affect the insurance and bonding markets may result in bonding becoming more difficult to obtain in the future, being available only at a significantly greater cost or not being available at all. If we are unable to obtain performance bonds on future projects, our results of operations would be materially and adversely affected. The amount of our surety bonds as of January 31, 2018, based on the expected amount of revenues remaining to be recognized on the projects, was $148.3 million; $48.4 million relates to surety bonds on contracts which were assumed by the purchaser of our former Heavy Civil business which we do not expect to be released until the jobs are completed.
We also occasionally utilize a letter of credit instead of a performance bond. Almost all of the letters of credit are issued under the asset-based credit facility. Our ability to continue to obtain new letters of credit under the asset-based credit facility is limited to the lesser of (a) $75.0 million and (b) the amount of Excess Availability (as defined in the asset-based credit facility agreement) under the asset-based credit facility and is subject to limitations on the issuance of letters of credit if the expiry date of the proposed letter of credit extends beyond the five business days prior to the maturity date of the asset-based credit facility. Our inability to obtain bonding or letters of credit on favorable terms and at reasonable prices or at all would increase operating costs and inhibit the ability to execute or pursue new projects, which could have a material adverse effect on our business, financial condition and results of operations.
We may experience cost overruns on our fixed-price contracts, which could reduce our profitability and we may suffer additional losses.
A significant number of our contracts contain fixed prices and generally assign responsibility for cost overruns to us. Under such contracts, prices are established in part on cost and scheduling estimates, which are based on a number of assumptions, many of which are beyond our control. These assumptions include job-site conditions (both surface and sub-surface), future economic conditions, prices and availability of materials, labor and other requirements. Estimates are revised based upon changing conditions and new developments that are continuous and characteristic of the drilling and infrastructure services. In addition, the time required to complete a drilling or infrastructure project may be greater than originally anticipated. We may not be able to obtain compensation for additional work performed or expenses incurred as a result of changes or inaccuracies in these estimates and underlying assumptions.
We have experienced inaccurate estimates, or changes in other circumstances, such as unanticipated technical problems, difficulties obtaining permits or approvals, changes in local laws or labor conditions, ambiguities in specifications, supply shortages, weather delays, unanticipated sub-surface site conditions, accidents, equipment failures, inefficiencies, cost of raw materials, or our suppliers’ or subcontractors’ inability to perform, which could result in substantial losses. As a result, cost and gross margin may vary from those originally estimated making the project less profitable than originally estimated, or possibly not profitable at all and, depending upon the size of the project, variations from estimated contract performance could significantly affect our operating results.
11
Our use of the percentage of completion method of accounting involves significant estimates and management judgment, changes of which could result in volatility in our results of operations.
Our Inliner segment primarily uses the percentage of completion method for its contracts, while our Water Resources segment uses the percentage of completion method for its larger, more complex contracts. Under the percentage of completion method, revenue is recognized based upon the ratio of actual costs incurred to total estimated costs at completion. Contract price and cost estimates are reviewed periodically as work progresses and adjustments proportionate to the percentage of completion are reflected in contract revenue, costs and profits in the reporting period when such estimates are revised. Total estimates may be affected by:
|
|
• |
changes in expected costs of materials, labor, productivity or scheduling; |
|
|
• |
changes in external factors outside of our control, such as weather, sub-surface site conditions or customer requirements; and |
|
|
• |
change orders, which are a normal and recurring part of our business and can increase or decrease the scope of work and therefore the revenue and the cost of a job. |
The above items can change the estimates on a contract, including those arising from contract penalty provisions and final contract settlements and can result in revisions to costs and income. Revisions in estimates are recognized in the period in which they are determined. This could result in the reduction or reversal of previously recorded revenues and profits. Change orders often change the scope and cost of a contract. Change orders can also have the short-term effect of reducing the percentage of completion on a contract and the revenues and profits that otherwise would be recognized. We also factor in all other information that we possess with respect to the change order to determine whether the change order should be recognized at all and, if recognition is appropriate, what dollar amount of the change order should be recognized. Due to factors that we may not anticipate at the time of recognition, however, revenues ultimately received on these change orders could be less than revenues that we recognized in a prior reporting period or periods, which could require us in subsequent reporting periods to reduce revenues and profit previously recognized.
Our contracts may require us to perform extra, or change order work, which can result in disputes or claims and adversely affect our working capital, profits and cash flows.
Our contracts generally require us to perform extra, or change order, work as directed by the customer even if the customer has not agreed in advance on the scope or price of the work to be performed. This process may result in disputes or claims over whether the work performed is beyond the scope of work directed by the customer and/or exceeds the price the customer is willing to pay for the work performed. To the extent we do not recover our costs for this work or there are delays in the recovery of these costs, our cash flows and working capital could be adversely impacted.
We may not fully realize the revenue value reported in our backlog due to cancellations or reductions in scope.
As of January 31, 2018, our backlog of uncompleted drilling and infrastructure services was approximately $178.6 million. The revenue projected in our backlog may not be realized or, if realized, may not result in profits. Projects reflected in our contract backlog may be affected by project cancellations, scope adjustments, time extensions or other changes. Such changes may adversely affect the revenue and profit we ultimately realize on these projects.
Our actual results could differ if the estimates and assumptions that we use to prepare our financial statements are inaccurate.
To prepare financial statements in conformity with GAAP, we are required to make estimates and assumptions, as of the date of the financial statements, which affect the reported values of assets, liabilities, revenue, expenses and disclosures of contingent assets and liabilities. Areas in which we must make significant estimates include:
|
|
• |
contract costs and profit and application of percentage of completion accounting and revenue recognition of contract claims; |
|
|
• |
provisions for income taxes and related valuation allowances; |
|
|
• |
recoverability of other tangible and intangible assets and their related estimated lives; and |
|
|
• |
assumptions for litigation, claims and other reserves. |
If these estimates or assumptions are inaccurate, our actual results could differ materially from currently recorded amounts.
12
If we do not attract and retain qualified managers and executives, our business could be materially and adversely affected.
We are very dependent on the skills and motivation of our employees, managers and executives to define and implement our corporate strategies and operational plans. We maintain and rely on a small executive team to manage our business. We may not be successful in retaining or attracting qualified replacements should any personnel leave. The loss of members of our executive team and inability to retain and attract suitable replacements could materially and adversely affect our business.
Because we are a multinational company conducting a complex business in several markets in North America and South America, we are subject to legal and operational risks related to staffing and management, as well as a broad array of local legal and regulatory requirements.
Operating outside of the U.S. creates difficulties associated with staffing and managing our international operations, as well as complying with local legal and regulatory requirements. The laws and regulations in the markets in which we operate are subject to rapid change. Although we have local staff in countries in which we deem it appropriate, we cannot ensure that we will be operating in full compliance with all applicable laws or regulations to which we may be subject, including customs and clearing, tax, immigration, employment, worker health and safety and environmental. We also cannot ensure that these laws will not be modified in ways that may adversely affect our business.
A portion of our earnings is generated from our foreign operations and those of our affiliates. Political and economic risks in those countries could reduce or eliminate the earnings and cash flow due to dividends we derive from those operations.
Our earnings are significantly impacted by the results of our operations in foreign countries. Our foreign operations are subject to certain risks beyond our control, including the following:
|
|
• |
political, social and economic instability; |
|
|
• |
war and civil disturbances; |
|
|
• |
bribery and corruption; |
|
|
• |
the taking of property through nationalization or expropriation without fair compensation; |
|
|
• |
changes in government laws, regulations and policies; |
|
|
• |
tariffs, taxes and other trade barriers; |
|
|
• |
barriers to timely movement or transfer of equipment between countries; and |
|
|
• |
exchange controls and limitations on remittance of dividends or other payments to us by our foreign subsidiaries and affiliates. |
In particular, changes in laws or regulations or in the interpretation of existing laws or regulations, whether caused by a change in government or otherwise, could materially adversely affect our business, growth, financial condition or results of operations. For example, while there are currently no limitations on the repatriation of profits from the countries in which we have subsidiaries, several countries do impose withholding taxes on dividends or fund transfers. Foreign funds transfer restrictions, taxes or limitations may be imposed or increased in the future with regard to repatriation of earnings and investments from countries in which we operate. If foreign funds transfer restrictions, taxes or limitations are imposed, our ability to receive dividends or other payments from affected subsidiaries could be reduced, resulting in an adverse material effect.
In addition, corporate, contract, property, insolvency, competition, securities and other laws and regulations in Mexico and South America have been and continue to be, substantially revised. Therefore, the interpretation and procedural safeguards of the new legal and regulatory systems are in the process of being developed and defined and existing laws and regulations may be applied inconsistently. Also, in some circumstances, it may not be possible to obtain the legal remedies provided for under these laws and regulations in a reasonably timely manner, if at all.
13
We perform work at mining operations in countries which have experienced political and economic instability in the past, or may experience similar instability in the future. The mining industry is subject to regulation by the countries in which we have operations relating to matters such as environmental protection, controls and restrictions on production and, potentially, nationalization, expropriation or cancellation of contract rights, as well as restrictions on conducting business in such countries. In addition, in our foreign operations we face operating difficulties, including political instability, workforce instability, harsh environmental conditions and remote locations. We do not maintain political risk insurance. Adverse events beyond our control in the areas of our foreign operations could reduce the earnings derived from our foreign operations to the extent that contractual provisions and bilateral agreements between countries may not be sufficient to guard our interests.
Our operations in foreign countries expose us to devaluations and fluctuations in currency exchange rates.
We operate a portion of our business in countries outside the U.S. The majority of our costs in those locations are transacted in local currencies. Although we generally contract with our customers in U.S. dollars, some of our contracts are in other currencies. We do not currently engage in foreign currency hedging transactions. As exchange rates among the U.S. dollar and other currencies fluctuate, the translation effect of these fluctuations may have a material adverse effect on our results of operations or financial condition as reported in U.S. dollars. Exchange rate policies have not always allowed for the free conversion of currencies at the market rate. Future fluctuations in the value of the U.S. dollar could have an adverse effect on our results. In addition, some of the countries in which we operate have foreign currency restrictions that may prohibit or limit our ability to convert local currencies into U.S. dollars and/or transfer U.S. dollars from such countries to the U.S., which restrictions could affect our liquidity or our ability to use such funds in other countries.
We conduct business in international markets with complex and evolving tax rules, including value-added tax rules, which subject us to international tax compliance risks.
While we obtain advice from legal and tax advisors as necessary to help assure compliance with tax and regulatory matters, most tax jurisdictions that we operate in have complex and subjective rules regarding the valuation of intercompany services, cross-border payments between affiliated companies and the related effects on income tax, value-added tax (“VAT”), transfer tax and share registration tax. Our foreign subsidiaries frequently undergo VAT reviews and from time to time undergo comprehensive tax reviews and may be required to make additional tax payments should the review result in different interpretations, allocations or valuations of our products or services. Certain countries may, from time to time, make changes to their existing tax structure which might affect our operations. These countries may, with little or no notice, implement additional taxes in the form of severance taxes, windfall profits taxes, production taxes and tariffs, which could negatively impact our results in our segments that perform services in those countries. We earn a portion of our operating income from outside of the U.S. and any repatriation of funds currently held in foreign jurisdictions may result in additional tax expense.
Uncertainties in the interpretation and application of the Tax Cuts and Jobs Act of 2017 could materially affect our tax disclosures and our effective tax rate in the future when we return to profitability.
The Tax Cuts and Jobs Act of 2017 ("The Act") was enacted on December 22, 2017, and it significantly affected U.S. tax law by, among other things, changing how the U.S. imposes income tax on multinational corporations. The Act contains several key tax provisions that affect us, including a one-time mandatory transition tax on accumulated foreign earnings and a reduction of the corporate income tax rate to 21% effective January 1, 2018, among others.
We are required to recognize the effect of the tax law changes in the period of enactment, including determining the transition tax, re-measuring our U.S. deferred tax assets and liabilities and reassessing the net realizability of our deferred tax assets and liabilities. Staff Accounting Bulletin No. 118, Income Tax Accounting Implications of the Tax Cuts and Jobs Act (“SAB 118”) allows us to record provisional amounts during a measurement period not to extend beyond one year of the enactment date. We have recorded provisional estimates in our financial statements with respect to certain income tax effects of The Act for which the accounting is incomplete, but a reasonable estimate was able to be determined. We will continue to perform additional analysis on the application of The Act, taking into account any additional regulatory guidance that is issued by the applicable taxing authorities, which may result in adjustments to our previously reported provisional estimates. In accordance with the SEC's guidance, we will recognize any adjustments to our previously reported provisional estimates in the relevant future periods, which could materially affect our tax obligations and our effective tax rate. See Note 10 to the Consolidated Financial Statements.
14
In addition, The Act requires complex computations not previously provided in U.S. tax law, and the application of accounting guidance for such items is currently uncertain in some respects. Further, compliance with The Act and the accounting for such provisions require accumulation of information not previously required or regularly produced. The U.S. Department of Treasury has broad authority to issue regulations and interpretative guidance that may significantly impact how the law is applied and thus impact our results of operations in the period issued.
Professional liability, product liability, warranty and other claims against us could reduce our revenue.
Any accidents, design defect or system failures in excess of insurance limits at locations that we engineer or construct or where our products are installed or where we perform services could result in significant professional liability, product liability, warranty and other claims against us. Further, the drilling and infrastructure services projects we perform expose us to additional risks, including cost overruns, equipment failures, personal injuries, property damage, shortages of materials and labor, work stoppages, labor disputes, weather problems and unforeseen engineering, architectural, environmental and geological problems. In addition, once our drilling and infrastructure services are complete, we may face claims with respect to the work performed. If we incur these claims, we could incur substantial losses of revenue or additional costs. See Note 15, “Contingencies” to our Consolidated Financial Statements for a further discussion.
Our business is subject to numerous operating hazards, logistical limitations and force majeure events that could significantly reduce our liquidity, suspend our operations and reduce our revenue and future business.
Our drilling and infrastructure services activities involve operating hazards that can result in personal injury or loss of life, damage or destruction of property and equipment, damage to the surrounding areas, release of hazardous substances or wastes and other harm to the environment. To the extent that the insurance protection we maintain is insufficient or ineffective against claims resulting from the operating hazards to which our business is subject, our liquidity could be significantly reduced.
In addition, our operations are subject to delays in obtaining equipment and supplies and the availability of transportation for the purpose of mobilizing rigs and other equipment, particularly where rigs or mines are located in remote areas with limited infrastructure support. Our business operations are also subject to force majeure events such as adverse weather conditions, natural disasters and mine accidents or closings. If our drill site or infrastructure services operations were interrupted or suspended as a result of any such events, we could incur substantial losses of revenue and future business.
Our failure to comply with the regulations of the U.S. Occupational Safety and Health Administration, the U.S. Mine Safety and Health Administration, the U.S. Department of Transportation and other state and local agencies that oversee transportation and safety compliance could reduce our revenue, profitability and liquidity.
OSHA, MSHA and other comparable state and foreign laws establish certain employer responsibilities, including maintenance of a workplace free of recognized hazards likely to cause death or serious injury, compliance with standards promulgated by the applicable regulatory authorities and various recordkeeping, disclosure and procedural requirements. Various standards, including standards for notices of hazards and safety in excavation and demolition work may apply to our operations. We have incurred and will continue to incur, capital and operating expenditures and other costs in the ordinary course of business in complying with OSHA, MSHA and other state, local and foreign laws and regulations and could incur penalties and fines in the future, including in extreme cases, criminal sanctions.
While we have invested, and will continue to invest, substantial resources in worker health and safety programs, the industries in which we operate involve a high degree of operational risk and there can be no assurance that we will avoid significant liability exposure. Although we have taken what are believed to be appropriate precautions, we have suffered employee injuries and fatalities in the past and may suffer additional injuries or fatalities in the future. Serious accidents of this nature may subject us to substantial penalties, civil litigation or criminal prosecution. Personal injury claims for damages, including for bodily injury or loss of life, could result in substantial costs and liabilities, which could materially and adversely affect our financial condition, results of operations or cash flows. In addition, if our safety record were to substantially deteriorate, or if we suffered substantial penalties or criminal prosecution for violation of health and safety regulations, customers could cancel existing contracts and not award future business to us, which could materially adversely affect our liquidity, cash flows and results of operations.
We have, from time to time, received notice from the DOT that our motor carrier operations may be monitored and that the failure to improve our safety performance could result in suspension or revocation of vehicle registration privileges. If we were not able to successfully resolve these issues, our ability to service our customers could be damaged, which could lead to a material adverse effect on our results of operations, cash flows and liquidity.
15
The cost of complying with complex governmental regulations applicable to our business, sanctions resulting from non-compliance or reduced demand resulting from increased regulations could increase our operating costs and reduce our profit.
Our drilling and infrastructure services are subject to various licensing, permitting, approval and reporting requirements imposed by federal, state, local and foreign laws. Our operations are subject to inspection and regulation by various governmental agencies, including the DOT, OSHA and MSHA of the Department of Labor in the U.S., as well as their counterparts in foreign countries. A major risk inherent in drilling and infrastructure services is the need to obtain permits from local authorities. Delays in obtaining permits, the failure to obtain a permit for a project or a permit with unreasonable conditions or costs could limit our ability to effectively provide our services.
In addition, these regulations also affect our mining customers and may influence their determination to conduct mineral exploration and development. Future changes in these laws and regulations, domestically or in foreign countries, could cause our customers to incur additional expenses or result in significant restrictions to their operations and possible expansion plans, which could reduce our profit.
Our water treatment business is impacted by legislation and municipal requirements that set forth discharge parameters, constrain water source availability and set quality and treatment standards. The success of our groundwater treatment services depends on our ability to comply with the stringent standards set forth by the regulations governing the industry and our ability to provide adequate design and infrastructure services solutions cost-effectively.
In most states, one of our employees is required to be a licensed contractor in order for us to bid for, or perform, certain types of infrastructure services related projects. From time to time, we are temporarily unable to bid for, or perform work with respect to, those types of infrastructure services projects in a particular state, because our licensed employee resigns, is terminated, or dies. Depending upon the length of time to qualify another employee as a licensed contractor in the state and the number and size of the affected projects in that state, the loss of the services of an employee that is a licensed contractor could have a material adverse effect on our results of operations.
The SEC rules require disclosure of the use of tin, tantalum, tungsten and gold, known as conflict minerals, in products manufactured by public companies. The SEC rules require that public companies conduct due diligence to determine whether such minerals originated from the Democratic Republic of Congo (DRC) or an adjoining country. We have incurred additional costs associated with complying with these disclosure requirements, including costs to determine the origin of conflict minerals used in our products. In addition, the implementation of these rules could adversely affect the sourcing, supply and pricing of materials used in our products. Also, we may face reputational challenges if the due diligence procedures we implement do not enable us to verify the origins for all conflict minerals. We may also encounter challenges to satisfy customers that may require all of the components of products purchased to be certified as DRC conflict-free because our supply chain is complex. If we are not able to meet customer requirements, customers may choose to disqualify us as a supplier.
Our activities are subject to environmental regulation that could increase our operating costs or suspend our ability to operate our business.
We are required to comply with foreign, federal, state and local laws and regulations regarding health and safety and the protection of the environment, including those governing the generation, storage, use, handling, transportation, discharge, disposal and clean-up of hazardous substances in the ordinary course of our operations. We are also required to obtain and comply with various permits under current environmental laws and regulations and new laws and regulations, or changed interpretations of existing requirements, which may require us to obtain and comply with additional permits and/or subject us to enforcement or penalty proceedings. We may be unable to obtain or comply with, and could be subject to revocation of, permits necessary to conduct our business. The costs of complying with environmental laws, regulations and permits may be substantial and any failure to comply could result in fines, penalties or other sanctions.
Our operations are sometimes conducted in or near ecologically sensitive areas, such as wetlands, which are subject to special protective measures and which may expose us to additional operating costs and liabilities related to restricted operations, for unpermitted or accidental discharges of oil, natural gas, drilling fluids, contaminated water or other substances or for noncompliance with other aspects of applicable laws and regulations. Our operations are subject to various environmental laws and regulations, including those dealing with the handling and disposal of waste products, PCBs, fuel storage and air quality. Certain of our current and historical operations have used hazardous materials and, to the extent that such materials are not properly stored, contained, recycled or disposed of, they could become hazardous waste.
16
Many of our operations involve the production or disposal of significant quantities of water. We may be subject to regulation that restricts our ability to discharge water in the course of these operations. The costs to dispose of this water may increase if any of the following occur:
|
|
• |
we cannot obtain future permits from applicable regulatory agencies; |
|
|
• |
water of lesser quality or requiring additional treatment is produced; or |
|
|
• |
new laws and regulations require water to be disposed in a different manner. |
The cost to dispose of, or treat that water or otherwise comply with these regulations concerning water disposal may reduce our profitability.
Various foreign, federal, state and local environmental laws and regulations may impose liability on us with respect to conditions at our current or former facilities, sites at which we conduct or have conducted operations or activities or any third-party waste disposal site to which we send hazardous wastes. We may be subject to claims under various environmental laws and regulations, federal and state statutes and/or common law doctrines for toxic torts and other damages, as well as for natural resource damages and the investigation and clean-up of soil, surface water, groundwater and other media under laws such as CERCLA. Such claims may arise, for example, out of current or former conditions at project sites, current or former properties owned or leased by us and contaminated sites that have always been owned or operated by third parties. Liability may be imposed without regard to fault and may be strict, joint and several, such that we may be held responsible for more than our share of any contamination or other damages, or even for the entire share, and may be unable to obtain reimbursement from the parties causing the contamination. The costs of investigation or remediation at these sites may be substantial. Environmental laws are complex, change frequently and have tended to become more stringent over time. Compliance with, and liability under, current and future environmental laws, as well as more vigorous enforcement policies or discovery of previously unknown conditions requiring remediation, could increase our operating costs and reduce our revenue. See Part I, Item 1—Business—Regulation in this Form 10-K for additional information.
If our health insurance, liability insurance or workers’ compensation insurance is insufficient to cover losses resulting from claims or hazards, if we are unable to cover our deductible obligations or if we are unable to obtain insurance at reasonable rates, our operating costs could increase and our profit could decline.
Although we maintain insurance protection that we consider economically prudent for major losses, we have high deductible amounts for each claim under our health insurance, workers’ compensation insurance and liability insurance. Our current individual claim deductible amount is $200,000 for health insurance, and on a per occurrence basis it is $750,000 for auto liability insurance and $500,000 for workers’ compensation insurance. Our general liability insurance is subject to a per claim self-insured retention of $750,000. We cannot assure that we will have adequate funds to cover our deductible obligations or that our insurance will be sufficient or effective under all circumstances or against all claims or hazards to which we may be subject or that we will be able to continue to obtain such insurance protection. In addition, we may not be able to maintain insurance of the types or at levels we deem necessary or adequate or at rates we consider reasonable. A claim or damage resulting from a hazard for which we are not fully insured could increase our operating costs and reduce our profit.
The cost of defending litigation or successful claims against us could reduce our profit or significantly limit our liquidity and impair our operations.
We have been and from time to time may be named as a defendant in legal actions claiming damages in connection with drilling or other infrastructure services projects and other matters. These are typically actions that arise in the normal course of business, including employment-related claims and contractual disputes or claims for personal injury or property damage that occur in connection with drilling or infrastructure site services. To the extent that the cost of defending litigation or successful claims against us is not covered by insurance, our profit could decline, our liquidity could be significantly reduced and our operations could be impaired.
17
Geoconstruction, one of our discontinued segments, was a subcontractor on the foundation for the Salesforce Tower office building in San Francisco, California in 2013 and 2014. Certain anomalies were discovered in March 2014 in the foundation’s structural concrete, which were remediated by the general contractor during 2015. We have participated in discussions with the project owner and the general contractor regarding potential causes of the anomalies. We have assigned our claims under the project's builder's risk insurance policy to the general contractor. During the fiscal year ended January 31, 2016, the owner and the general contractor submitted a claim to the project’s builder’s risk insurers to cover the cost of remedial work and related damages. The claim was denied by the builder’s risk insurers and the owner and the general contractor subsequently filed a legal proceeding against the insurers seeking coverage under the builder’s risk insurance policy. Although we are not a party to this legal proceeding, management believes, based on court filings in the legal proceeding, that the owner and the general contractor are asserting a claim for damages against the project’s builder’s risk insurers of approximately $100 million. Accordingly, no provision has been made in these Consolidated Financial Statements. See Note 15 to our Consolidated Financial Statements for a further discussion of this contingency.
Our ability to use U.S. federal net operating loss carryforwards, foreign tax credit carryforwards, capital loss carryforwards and net unrealized built-in losses could be severely limited in the event of certain share transfers of our common stock.
We currently have a significant U.S. deferred tax asset, before considering valuation allowances, which results from federal net operating loss carryforwards, foreign tax credit carryforwards, capital loss carryforwards and net unrealized built-in losses. While we have recorded a full valuation allowance against the net deferred tax asset, the carryforwards and the future use of these attributes could provide significant future tax savings to us if we are able to use such losses and credits. However, our ability to use these tax benefits may be restricted due to a future ownership change within the meaning of Section 382 of the Internal Revenue Code. An ownership change could occur that would severely limit our ability to use the tax benefits associated with the net operating loss carryforwards, foreign tax credit carryforwards, capital loss carryforwards and net unrealized built-in losses, which may result in a significantly higher tax cost compared to the situation where these tax benefits are preserved.
If we are unable to protect our intellectual property adequately, the value of our patents and trademarks and our ability to operate our business could be harmed.
We rely on a combination of patents, trademarks, trade secrets and similar intellectual property rights to protect the proprietary technology and other intellectual property that are instrumental to our operations. We may not be able to protect our intellectual property adequately and our use of this intellectual property could result in liability for patent or trademark infringement or unfair competition. Further, through acquisitions of third parties, we may acquire intellectual property that is subject to the same risks as the intellectual property we currently own.
We may be required to institute litigation to enforce our patents, trademarks or other intellectual property rights, or to protect our trade secrets from time to time. Such litigation could result in substantial costs and diversion of resources and could reduce our profit or disrupt our business, regardless of whether we are able to successfully enforce our rights.
We may be exposed to liabilities under the Foreign Corrupt Practices Act and any determination that Layne or any of its subsidiaries has violated the Foreign Corrupt Practices Act could have a material adverse effect on our business.
We operate in some countries known to experience corruption. We are committed to doing business in accordance with applicable anti-corruption laws and our code of business conduct and ethics. We are subject, however, to the risk that we, our affiliated entities or their respective officers, directors, employees and agents may take action determined to be in violation of such anti-corruption laws, including the FCPA.
The FCPA and related statutes and regulations provide for potential fines, civil and criminal penalties and equitable remedies, including disgorgement of profits or monetary benefits from such payments, related interest and injunctive relief. These fines and penalties can be significant.
18
Further, detecting, investigating and resolving these types of matters is expensive and could consume significant time and attention of our senior management. We could also face fines, sanctions and other penalties from authorities in the relevant foreign jurisdictions, including prohibition of our participating in or curtailment of business operations in those jurisdictions and the seizure of rigs or other assets. Our customers in those jurisdictions could seek to impose penalties or take other actions adverse to our interest. We could also face other third-party claims by our directors, officers, employees, affiliates, advisors, attorneys, agents, stockholders, debt holders or other interest holders or constituents. In addition, disclosure of the subject matter of the investigation could adversely affect our reputation and our ability to obtain new business or retain existing business from our current clients and potential clients, to attract and retain employees and to access the capital markets. Future violations of the FCPA may also give rise to an event of default under the agreements governing our debt instruments if such violation were to have a material adverse effect on our business, assets, property, financial condition or prospects or if the amount of any settlement resulted in our failing to satisfy any financial covenants.
Future climate change could adversely affect us.
The prospective impact of potential climate change on our operations and those of our customers remains uncertain. Some scientists have hypothesized that the impacts of climate change could include changes in rainfall patterns, water shortages, snowpack levels, changing sea levels, changing storm patterns and intensities and changing temperature levels and that these changes could be severe. These impacts could vary by geographic location. At the present time, we cannot predict the prospective impact of potential climate change on our results of operations, liquidity or capital resources, or whether any such effects could be material to us.
Deliberate, malicious acts, including terrorism and sabotage, could damage our facilities, disrupt our operations or injure employees, contractors, customers or the public and result in liability to us.
Intentional acts of destruction could hinder our sales or production and disrupt our supply chain. Our facilities could be damaged or destroyed, reducing our operational production capacity and requiring us to repair or replace our facilities at substantial cost. Employees, contractors and the public could suffer substantial physical injury for which we could be liable. Governmental authorities may impose security or other requirements that could make our operations more difficult or costly. The consequences of any such actions could adversely affect our operating results and financial condition.
We are dependent on our information systems.
Information technology systems are an integral part of the efficient functioning of our business as well as the security of our information. Problems with the implementation of new or upgraded systems as our business grows or with maintenance or discontinuance of existing systems could disrupt or reduce the efficiency of our operations.
Security breaches and other disruptions could compromise our information and expose us to liability, which would cause our business and reputation to suffer.
In the ordinary course of our business, we collect and store sensitive data, including intellectual property, our proprietary business information and that of our customers and suppliers and personally identifiable information of our employees, in our facilities and on our networks. The secure processing, maintenance and transmission of this information is critical to our operations. Despite our security measures, our information technology and infrastructure may be vulnerable to attacks by hackers or breached due to employee error, malfeasance or other disruptions. Any such breach could compromise our networks and the information stored there could be accessed, publicly disclosed, lost or stolen. Any such access, disclosure or other loss of information could result in legal claims or proceedings, disrupt our operations, damage our reputation and cause a loss of confidence, which could adversely affect our business.
19
Claims for indemnification related to the sale of business units and assets may be substantial and have a negative impact on our financial condition.
From time to time, we dispose of business units or assets, including the recent dispositions of our Heavy Civil and Geoconstruction businesses. As part of a sale, we have agreed and may in the future agree to indemnify the purchaser for certain pre-closing liabilities associated with the business unit or assets that are sold and for any breach of the representations and warranties contained in the asset purchase agreement for the transaction. There can be no guarantee that material claims will not arise during the relevant indemnification periods and that we will not have to provide the requisite indemnification. In addition, legal challenges to any potential claim for indemnification could result in increased legal expenses. Also, as is typical in divestiture transactions, some third parties have been, and in the future may be, unwilling to release us from guarantees, performance bonds or other credit support provided prior to the sale of the business unit or assets. As a result, after a divestiture, we may remain secondarily liable for some of the obligations guaranteed, bonded or supported to the extent that the buyer of the business unit or assets fails to perform these obligations.
Risks Related To Our Indebtedness
Our substantial indebtedness could adversely affect our financial health and prevent us from fulfilling our obligations.
We have a significant amount of indebtedness. As of January 31, 2018, we had total indebtedness of approximately $166.0 million. Our substantial indebtedness could have important consequences. For example, it could:
|
|
• |
make it more difficult for us to satisfy our obligations; |
|
|
• |
increase our vulnerability to general adverse economic and industry conditions; |
|
|
• |
require us to dedicate a substantial portion of our cash flow from operations to payments on our indebtedness, which reduces the availability of our cash flow to fund working capital, capital expenditures, development efforts and other general corporate purposes; |
|
|
• |
place us at a competitive disadvantage compared to our competitors that have less debt; and |
|
|
• |
limit our ability to borrow additional funds if needed. |
In addition, the agreements governing our indebtedness and any future indebtedness we incur may contain restrictive covenants that will limit our ability to engage in activities that may be in our long-term best interests. Our failure to comply with those covenants could result in an event of default that, if not cured or waived, could result in the acceleration of all of our debt. Our growth plans and our ability to make payments of principal or interest on, or to refinance our indebtedness will depend on our future operational performance and our ability to enter into additional debt or equity financings. If we are unable to generate sufficient cash flows in the future to service our debt, we may be required to refinance all or a portion of our existing debt, to sell assets or to obtain additional financing, which we may be unable to do on favorable terms, if at all.
Servicing our debt requires a significant amount of cash and we may not have sufficient cash flow from our business to service our substantial debt.
Our ability to make scheduled payments of the principal of, to pay interest on, or to refinance our indebtedness depends on our future performance which is subject to economic, financial, competitive and other factors beyond our control. Our business may not generate cash flow from operations in the future sufficient to service our debt because of factors beyond our control. If we are unable to generate such cash flow, we may be required to adopt one or more alternatives such as selling assets, restructuring debt or obtaining additional equity capital on terms that may be onerous or highly dilutive. Our ability to refinance our indebtedness will depend on the capital markets and our financial conditions at such time. We may not be able to engage in any of these activities or engage in these activities on desirable terms which could result in a default on our debt obligations.
We may not have sufficient borrowing capacity under our asset-based credit facility to meet our liquidity requirements and a reduction in our borrowing base could result in a portion of our borrowings becoming immediately due.
We may need to borrow on our asset-based credit facility in the future for our liquidity needs. If we are unable to borrow under our asset-based credit facility or otherwise obtain capital as needed to operate our business, our financial performance and position could materially suffer.
20
Our ability to borrow under our asset-based credit facility depends on, among other things, the amount of the borrowing base as defined in the asset-based credit facility and our available capacity under the asset-based credit facility. Continued operating losses or negative cash flows from our operations may cause Layne to borrow under our asset-based credit facility and reduce the available capacity under the asset-based credit facility. Our borrowing base is primarily comprised of a percentage of the net orderly liquidation value of eligible equipment and the value of certain customer and contract receivables. Our borrowing base is reduced by any reserves that the co-collateral agents under our asset-based credit facility determine to be necessary in good faith and their reasonable business judgment. As of January 31, 2018, total availability under the asset-based credit facility was $100.0 million, with $24.6 million of letters of credit and no borrowings outstanding, resulting in Excess Availability of $75.4 million. The amount of our borrowing base could be materially and adversely affected by decreases in the value of our eligible equipment and/or receivables, a portion of our equipment and/or receivables being deemed ineligible under the terms of our asset-based credit facility or the co-collateral agents imposing additional reserve requirements.
In addition, if our borrowing base is reduced below the amount of letters of credit and borrowings outstanding under our asset-based credit facility, then the excess indebtedness would, absent a waiver or amendment, become immediately due and payable and any outstanding letters of credit could require replacement or cash collateralization. We may not have the resources to make any required repayment or cash collateralization and such repayment obligation or cash collateralization could have a material adverse impact on our liquidity and financial condition.
We may not have sufficient capital resources to repay all of our indebtedness as it matures.
Our debt facilities currently consist of:
|
|
• |
$69.5 million of 4.25% Convertible Notes that are due on November 15, 2018, |
|
|
• |
a $100 million senior secured asset-based credit facility that is due on April 14, 2019 (of which $24.6 million of letters of credits have been issued under the facility) and |
|
|
• |
$99.9 million of 8.0% Convertible Notes that are due on May 1, 2019. |
However, if the 4.25% Convertible Notes have not been redeemed, repurchased, otherwise retired, discharged in accordance with their terms or converted into our common stock, or effectively discharged, in each case on or prior to August 15, 2018 or the scheduled maturity date of the 4.25% Convertible Notes has not been extended to a date that is after October 15, 2019, then the 8.0% Convertible Notes will mature on August 15, 2018.
In addition, the maturity date of the asset-based credit facility will be (a) July 16, 2018 if we have not delivered to the administrative agent for the asset-based credit facility evidence by July 15, 2018 that the 4.25% Convertible Notes have been effectively discharged with the proceeds from the issuance of the 11.0% Unsecured Notes or (b) May 15, 2018 if (i) the issuance of the 11.0% Unsecured Notes is cancelled for any reason or (ii) the proceeds of the 11.0% Unsecured Notes are used for a purpose other than to effectively discharge the 4.25% Convertible Notes in full; provided, that if an event described in clause (i) or (ii) above occurs after May 15, 2018, then the maturity date of the asset-based credit facility will be the date the event occurred.
On March 19, 2018, we entered into a note purchase agreement with two investment funds advised by Corre Partners Management, LLC to purchase $71.0 million of our 11% Unsecured Notes. Corre Partners Management and its affiliated funds, including the purchasers of the 11.0% Unsecured Notes, own a portion of our 4.25% Convertible Notes and 8.00% Convertible Notes. Prior to August 15, 2018, we may elect to issue the 11.0% Unsecured Notes and use the proceeds from the issuance of the 11.0% Unsecured Notes to effectively discharge the 4.25% Convertible Notes, in which case the maturity date of the 8.0% Convertible Notes would remain May 1, 2019. As a result, if the proceeds of the 11.0% Unsecured Notes were to be used to effectively discharge the 4.25% Convertible Notes prior to July 16, 2018, we would need to refinance (1) the asset-based credit facility on or prior to April 14, 2019, (2) to the extent they are not converted into our common stock, the 8.0% Convertible Notes on May 1, 2019 and (3) the 11.0% Unsecured Notes on or prior to October 16, 2019.
Alternatively, if the market price of our common stock prior to August 15, 2018 is above $11.70 per share, we could elect to take no action with respect to the 4.25% Convertible Notes, in which case the maturity date of the 8.0% Convertible Notes would become August 15, 2018. We believe that under those circumstances most, if not all, of the holders of our 8.0% Convertible Notes would convert their notes into our common stock (and any remaining unconverted amounts could be refinanced with available cash or drawings under our asset-based credit facility) and we could issue the 11.0% Unsecured Notes by October 1, 2018 in order to repay the 4.25% Convertible Notes at maturity. In this case, we would seek to extend or refinance our asset-based credit facility.
We may not have sufficient capital resources to repay all of our indebtedness as it becomes due, which could result in a default under all of our indebtedness.
21
Our indebtedness agreements contain and the terms of any future indebtedness may contain significant operating and financial restrictions. These restrictions may limit our and certain of our subsidiaries’ operating flexibility and, in turn, hinder our ability to make payments on our obligations, impair our ability to make capital expenditures and/or increase the cost of obtaining additional financing.
Our asset-based credit facility includes customary conditions to funding, representations and warranties, covenants and events of default. The terms of the indebtedness could have important consequences to shareholders, including the following:
|
|
• |
the ability to obtain necessary financing in the future for working capital, acquisitions, capital expenditures, debt service requirements or other purposes may be limited or financing may be unavailable; |
|
|
• |
a portion of cash flow must be dedicated to the payment of interest on the indebtedness and other obligations and will not be available for use in our business; |
|
|
• |
the asset-based credit facility contains various operating and financial restrictions which could limit our ability to incur additional indebtedness and liens, fund our foreign operations, make investments and acquisitions, transfer or sell assets, transact with affiliates and require us to cash collateralize some or all of the outstanding letters of credit; |
|
|
• |
an event of default under the asset-based credit facility, including a subjective event of default if we have experienced a material adverse change, could result in an acceleration of the obligations under the asset-based credit facility, in the foreclosure on assets subject to liens in favor of the asset-based credit facility lenders and the inability to borrow additional amounts under the asset-based credit facility; and |
|
|
• |
acceleration of the indebtedness or payment default under the asset-based credit facility would also be an event of default under the indenture governing our convertible notes (and our 11% Unsecured Notes, if issued). |
In addition, under our asset-based credit facility, if Excess Availability is less than the greater of $17.5 million or 17.5% of total availability, in each case for more than one business day, then a “Covenant Compliance Period” will exist until we have Excess Availability for a period of 30 consecutive days equal to or greater than the greater of (a) 17.5 % of the total availability and (b) $17.5 million. During each Covenant Compliance Period, we must maintain a minimum fixed charge coverage ratio of not less than 1.0 to 1.0 and a first lien leverage ratio of not greater than 5.0 to 1.0 for the four fiscal quarter period ended immediately prior to commencement of a Covenant Compliance Period and for every four fiscal quarter period ending during a Covenant Compliance Period. During the fiscal years ended January 31, 2018 and 2017, we were not subject to Covenant Compliance Period(s) under our asset-backed credit facility. If we had been in a Covenant Compliance Period during the three year period ended January 31, 2018, we would not have been in compliance with the minimum fixed charge coverage ratio.
Furthermore, during a covenant Compliance Period or if an Event of Default has occurred and is continuing all of our funds received on a daily basis will be applied to reduce amounts owing under the asset-based credit facility. Although we do not anticipate being in a Covenant Compliance Period during the next twelve months, a Covenant Compliance Period could occur if the borrowing base is decreased for any of the reasons discussed above or if we are required to borrow more funds than is currently anticipated at a time when we do not meet the minimum fixed charge coverage ratio and the first lien leverage ratio.
We cannot assure that waivers will be granted or amendments made to any of the agreements governing our indebtedness if for any reason we are unable to comply with the obligations thereunder or that we will be able to refinance our debt on acceptable terms, or at all, should we seek to do so. See Note 8 to the Consolidated Financial Statements for a more detailed description of our indebtedness.
The conversion of our 4.25% Convertible Notes may adversely affect our financial condition.
After May 15, 2018, holders of the 4.25% Convertible Notes will be entitled to convert such notes at any time at their option. If one or more holders elect to convert their 4.25% Convertible Notes, unless we elect to satisfy our conversion obligation by delivering solely shares of our common stock (other than paying solely cash in lieu of any fractional share), including if we have irrevocably elected full physical settlement upon conversion, we would be required to make cash payments to satisfy all or a portion of our conversion obligations based on the applicable conversion rate, which could adversely affect our liquidity.
22
We may in certain circumstances elect to settle conversions of our 4.25% Convertible Notes in cash and the accounting method for convertible debt securities that may be settled in cash could have a material effect on our reported financial results.
Pursuant to the terms of our 4.25% Convertible Notes, at our election, we will satisfy our conversion obligation by paying or delivering, as the case may be, cash, shares of our common stock or a combination of cash and shares of our common stock. We refer to these settlement methods as cash settlement, physical settlement and combination settlement, respectively. In May 2008, the Financial Accounting Standards Board, or FASB, issued FASB Staff Position No. APB 14-1, Accounting for Convertible Debt Instruments That May Be Settled in Cash Upon Conversion (Including Partial Cash Settlement), which has subsequently been codified as ASC Topic 470-20, “Debt with Conversion and Other Options”. ASC Topic 470-20 requires an entity to separately account for the liability and equity components of convertible debt instruments whose conversion may be settled entirely or partially in cash in a manner that reflects the issuer’s economic interest cost for non-convertible debt. During the first quarter of the fiscal year ended January 31, 2015, the liability component of the convertible debt instrument was valued at the fair value of a similar debt instrument that did not have an associated equity component and was reflected as a liability on the balance sheet. The equity component of the convertible debt instrument was included in the additional paid-in capital section of stockholders’ equity on the balance sheet and the value of the equity component was treated as original issue discount for purposes of accounting for the debt component. This original issue discount is being amortized to non-cash interest expense over the term of the convertible debt instrument. Accordingly, we record a greater amount of non-cash interest expense in current periods as a result of this amortization. We report lower net income in our financial results because ASC Topic 470-20 requires the interest expense associated with our 4.25% Convertible Notes to include both the current period’s amortization of the debt discount and our 4.25% Convertible Notes’ coupon interest, which could adversely affect our reported or future financial results, the trading price of our common stock and the trading price of our 4.25% Convertible Notes.
If we elect to settle conversions using physical settlement, then we must include the full number of shares underlying our 4.25% Convertible Notes in the calculation of our diluted earnings per share, regardless of whether the contingent conversion feature of our 4.25% Convertible Notes is triggered. In addition, under certain circumstances, convertible debt instruments whose conversion may be settled entirely or partly in cash (such as our 4.25% Convertible Notes) are currently accounted for using the treasury stock method. Under this method, the shares issuable upon conversion of convertible notes are not included in the calculation of diluted earnings per share unless the conversion value of the convertible notes exceeds their principal amount at the end of the relevant reporting period. If the conversion value exceeds their principal amount, then, for diluted earnings per share purposes, convertible notes are accounted for as if the number of shares of common stock that would be necessary to settle the excess, if we elected to settle the excess in shares, are issued. Accordingly, the treasury stock method could result in more favorable reported diluted earnings per share. If we do not satisfy the criteria required to utilize the treasury stock method, we will be required to determine diluted earnings per share utilizing the “if converted” method, the effect of which is that the shares issuable upon conversion of the notes are included in the calculation of diluted earnings per share assuming the conversion of the notes at the beginning of the reporting period if the impact is dilutive. We cannot be sure that the accounting standards in the future will continue to permit the use of the treasury stock method. Additionally, we cannot be sure that we will satisfy the relevant criteria to utilize the treasury stock method. If we are unable to use the treasury stock method in accounting for the shares, if any, issuable upon conversion of our convertible notes, then our diluted earnings per share could be adversely affected.
Conversion of our 8.0% Convertible Notes could dilute the ownership interests of our shareholders.
Our 8.0% Convertible Notes are convertible, at the option of the holders, into consideration consisting of shares of our common stock (and cash in lieu of fractional shares) until the close of business on the scheduled trading day immediately preceding the maturity date. As of January 31, 2018, the conversion price of the 8.0% Convertible Notes ($11.70 per share) was significantly below the closing price of our common stock on that date ($13.49 per share). To the extent we issue common stock upon conversion of our 8.0% Convertible Notes, that conversion would dilute the ownership interests of our shareholders. If all the 8.0% Convertible Notes were to convert into shares of our common stock, we would issue approximately 8.5 million additional shares representing approximately 30.0% of the outstanding shares of our common stock on that date.
23
We may not have the ability to raise the funds necessary to repurchase our convertible notes upon a fundamental change, asset sale or casualty or condemnation event, and our debt instruments may prohibit some of these payments.
As discussed in Note 8 to the Consolidated Financial Statements, if a “fundamental change” (as defined in the indentures governing our convertible notes) occurs, holders of our convertible notes may require us to repurchase all or a portion of such notes in cash. Any such cash payment could be significant, and we may not have enough available cash or be able to obtain financing so that we can make payments on our convertible notes when due.
In addition, except in very limited circumstances involving a refinancing of the 8.0% Convertible Notes in a manner permitted by our asset-based credit facility, our asset-based credit facility prohibits us from making or offering to make certain voluntary repurchases of the convertible notes, except that we may repurchase the 8.0% Convertible Notes if certain “payment conditions” are satisfied. This provision may prohibit us from repurchasing the convertible notes at the holders’ election following a fundamental change or, with respect to the 8.0% Convertible Notes, certain asset sales and casualty and condemnation events.
If we fail to repurchase our convertible notes when required, we will be in default under the indentures for the convertible notes. In addition, such a failure could also be a default under our asset-based credit facility, which may allow the lenders under that agreement to cause all outstanding amounts under the facility to become immediately due and payable.
Certain provisions in the indentures governing our convertible notes could delay or prevent an otherwise beneficial takeover or takeover attempt of us.
Certain provisions in the indentures governing our convertible notes could make it more difficult or more expensive for a third party to acquire us. For example, if a takeover would constitute a fundamental change (as defined in the indentures governing our convertible notes), holders of our convertible notes will have the right to require us to repurchase their convertible notes in cash. In addition, if a takeover constitutes a make-whole fundamental change, we may be required to increase the conversion rate for holders who convert their convertible notes in connection with such takeover. In either case and in other cases, our obligations under our convertible notes and the indentures could increase the cost of acquiring us or otherwise discourage a third party from acquiring us.
Risks Related To Ownership of Our Common Stock
Provisions in our organizational documents, Delaware law and the indentures governing our convertible notes could prevent or frustrate attempts by stockholders to replace our current management or effect a change of control of Layne.
Our certificate of incorporation, bylaws and the Delaware General Corporation Law contain provisions that could make it more difficult for a third party to acquire us without consent of our board of directors. In addition, under our certificate of incorporation, our board of directors may issue shares of preferred stock and determine the terms of those shares of stock without any further action by our stockholders. Our issuance of preferred stock could make it more difficult for a third party to acquire a majority of our outstanding voting stock and thereby effect a change in the composition of our board of directors. Our certificate of incorporation also provides that our stockholders may not take action by written consent. Our bylaws require advance notice of stockholder proposals and nominations and permit only our board of directors, or authorized committee designated by our board of directors, to call a special stockholder meeting. These provisions may have the effect of preventing or hindering attempts by our stockholders to replace our current management. In addition, Delaware law prohibits us from engaging in a business combination with any holder of 15% or more of our capital stock until the holder has held the stock for three years unless, among other possibilities, our board of directors approves the transaction. Our board may use this provision to prevent changes in our management. Also, under applicable Delaware law, our board of directors may adopt additional anti-takeover measures in the future.
In addition, provisions of Delaware law may also discourage, delay or prevent a third party from acquiring or merging with us or obtaining control of Layne.
If a “fundamental change” (as such terms are defined in the indentures governing our convertible notes) occurs, holders of the convertible notes will have the right, at their option, to require us to repurchase all or a portion of their convertible notes. A “fundamental change” generally occurs when there is a change in control of Layne (acquisition of 50% or more of our voting stock, liquidation or sale of Layne not for stock) or trading of our stock is terminated. In the event of a “make-whole fundamental change” (as is defined in the indentures for the convertible notes), we may also be required to increase the conversion rate applicable to the convertible notes surrendered for conversion in connection with such make-whole fundamental change. A “make-whole fundamental change” is generally a sale of Layne not for stock in another publicly traded company. In addition, the indentures for the convertible notes prohibit us from engaging in certain mergers or acquisitions unless, among other things, the surviving entity assumes our obligations under the convertible notes.
24
The market price of our common stock could be reduced by future issuances or sales of our common stock.
Sales by us or our shareholders of a substantial number of shares of our common stock in the public market, or the perception that these sales might occur, could cause the market price of our common stock to decline or could impair our ability to raise capital through a future sale of, or pay for acquisitions using, our equity securities.
In addition to outstanding shares eligible for future sale, as of January 31, 2018, 2.0 million shares of our common stock were issuable, subject to vesting requirement, under currently outstanding stock options and restricted stock units granted to officers, directors and employees and an additional 0.7 million shares are available to be granted under our stock option and employee incentive plans.
We are restricted from paying dividends.
We have not paid any cash dividends on our common stock since our initial public offering in 1992 and we do not anticipate paying any cash dividends in the foreseeable future. In addition, our current credit arrangements restrict our ability to pay cash dividends.
Our share price has been volatile and could decline, resulting in a substantial or complete loss of your investment. Because the trading of our common stock is characterized by low trading volume, it could be difficult for you to sell the shares of our common stock that you hold.
The stock markets, including the NASDAQ Global Select Market, on which we list our common stock, have experienced significant price and volume fluctuations. As a result, the market price of our common stock could be similarly volatile and you may experience a decrease in the value of the shares of our common stock that you may hold, including a decrease unrelated to our operating performance or prospects. In addition, the trading of our common stock has historically been characterized by relatively low trading volume and the volatility of our stock price could be exacerbated by such low trading volumes. The market price of our common stock could be subject to significant fluctuations in response to various factors or events, including among other things:
|
|
• |
our operating performance and the performance of other similar companies; |
|
|
• |
actual or anticipated differences in our operating results; |
|
|
• |
changes in our revenue or earnings estimates or recommendations by securities analysts; |
|
|
• |
publication of research reports about us or our industry by securities analysts; |
|
|
• |
additions and departures of key personnel; |
|
|
• |
strategic decisions by us or our competitors, such as acquisitions, divestments, spin-offs, joint ventures, strategic investments or changes in business strategy; |
|
|
• |
the passage of legislation or other regulatory developments that adversely affect us or our industry; |
|
|
• |
speculation in the press or investment community; |
|
|
• |
actions by institutional stockholders; |
|
|
• |
changes in accounting principles; |
|
|
• |
terrorist acts; and |
|
|
• |
general market conditions, including factors unrelated to our performance. |
These factors may lower the trading price of our common stock, regardless of our actual operating performance and could prevent you from selling your common stock at or above the price that you paid for the common stock. In addition, the stock markets, from time to time, experience extreme price and volume fluctuations that may be unrelated or disproportionate to the operating performance of companies. These broad fluctuations may lower the market price of our common stock.
Risks Relating to Pending Merger with Granite Construction (see Item 7, Overview - Subsequent Event)
Information concerning additional risk factors related to the pending merger with Granite Construction Incorporated (“Granite”) is available in the preliminary proxy statement/prospectus included in the Registration Statement on Form S-4 that Granite filed with the SEC on March 13, 2018, in connection with the pending stock merger.
25
Layne’s business relationships may be subject to disruption due to uncertainty associated with the merger.
Parties with which Layne does business may experience uncertainty associated with the proposed merger, including with respect to current or future business relationships with Layne or the combined company. Layne’s business relationships may be subject to disruption as customers, distributors, suppliers, vendors and others may attempt to negotiate changes in existing business relationships or consider entering into business relationships with parties other than Layne or the combined company. These disruptions could have an adverse effect on the businesses, financial condition, or results of operations of Layne and/or the combined company. The risk, and adverse effect, of such disruptions could be exacerbated by a delay in consummating the merger or termination of the merger agreement.
The merger may be consummated on different terms from those contained in the merger agreement.
Prior to the consummation of the merger, the parties may, by their mutual agreement, amend or alter the terms of the merger agreement, including with respect to, among other things, the consideration to be received by Layne stockholders, or any covenants or agreements with respect to the parties’ respective operations during the pendency thereof, provided, however, that after approval by Layne stockholders, no amendment may be made without further stockholder approval which, by law or in accordance with the rules of Nasdaq, requires further approval by such stockholders. Any such amendments or alterations may have negative consequences to Layne stockholders including, among other things, reducing the cash available for Granite’s or Layne’s operations or to meet respective obligations or restricting or limiting assets or operations of either of Granite or Layne. Under certain circumstances, Layne stockholders may be permitted or required to adopt any such amendments, which could delay consummation of the Merger and subject Layne and Granite to additional expense.
Layne must obtain approval of its stockholders to consummate the Merger, which, if delayed or not obtained, may jeopardize or delay the consummation of the Merger.
The Merger is conditioned on the adoption of the merger agreement by the affirmative vote of the holders of a majority of the issued and outstanding shares of Layne Common Stock entitled to vote thereon. If Layne stockholders do not adopt the merger agreement, then Layne and Granite cannot consummate the Merger.
The merger agreement contains provisions that limit Layne’s ability to pursue alternatives to the merger, which could discourage a potential acquirer of Layne from making an alternative transaction proposal or could result in a competing proposal being at a lower price than it might otherwise be and, in certain circumstances, could require Layne to pay Granite a significant termination fee.
The merger agreement contains “no shop” provisions that, subject to limited exceptions, require that Layne may not (a) solicit, initiate, cause or knowingly facilitate or encourage the submission of any inquiries, proposals or offers or any other efforts or attempts that constitute or may reasonably be expected to lead to any acquisition proposal (generally, a proposal to acquire 20% or more of the common stock or assets of Layne), or engage in any discussions or negotiations with respect thereto or otherwise cooperate with or assist or participate in, or knowingly facilitate or encourage, any such inquiries, proposals, discussions or negotiations, or resolve to or publicly propose to take any of the foregoing actions, (b) approve or recommend, or resolve to or publicly propose to approve or recommend, any acquisition proposal or enter into any merger agreement, agreement-in-principle, letter of intent, share purchase agreement, asset purchase agreement, share exchange agreement, option agreement or other similar agreement relating to an acquisition proposal or enter into any letter of intent, agreement or agreement-in-principle requiring Layne to abandon, terminate or fail to consummate the Merger or (c) (1) withdraw, modify or qualify in a manner adverse to Granite the recommendation of the Layne Board or the approval or declaration of advisability by the Layne Board of the merger agreement and the transactions contemplated thereby (including the Merger) or (2) approve or recommend, or resolve to or publicly propose to approve or recommend, any acquisition proposal.
The merger agreement also provides that Layne will be required to pay a termination fee of $16.0 million to Granite upon termination of the merger agreement under certain circumstances. These provisions might discourage a potential competing acquiror that might have an interest in acquiring all or a significant part of Layne from considering or proposing an acquisition even if it were prepared to pay consideration with a higher per share market price than that proposed in the Merger, or might result in a potential competing acquiror proposing to pay a lower per share price to acquire Layne than it might otherwise have proposed to pay.
We have no unresolved comments from the Securities and Exchange Commission staff.
26
Our primary facilities are summarized in the table below:
|
Location |
|
Segment |
|
Owned/Leased |
|
Square Footage |
|
|
Purpose |
|
|
The Woodlands, Texas |
|
Corporate |
|
Leased(1) |
|
|
51,152 |
|
|
Corporate headquarters |
|
Redlands, California |
|
Water Resources |
|
Owned |
|
|
74,645 |
|
|
Field office |
|
Stuttgart, Arkansas |
|
Water Resources |
|
Owned |
|
|
35,696 |
|
|
Field office |
|
Aurora, Illinois |
|
Water Resources |
|
Owned |
|
|
24,500 |
|
|
Field office |
|
Chandler, Arizona |
|
Water Resources and Mineral Services |
|
Owned |
|
|
83,610 |
|
|
Field office |
|
Orleans, Indiana |
|
Inliner |
|
Owned(2) |
|
|
111,880 |
|
|
Field office |
|
Paoli, Indiana |
|
Inliner |
|
Owned |
|
|
115,000 |
|
|
Manufacturing facility |
|
Baytown, Texas |
|
Inliner |
|
Owned |
|
|
50,000 |
|
|
Field office |
|
Sanford, Florida |
|
Inliner |
|
Owned |
|
|
46,481 |
|
|
Manufacturing facility |
|
Hermosillo, Mexico |
|
Mineral Services |
|
Owned |
|
|
66,392 |
|
|
Field office |
|
|
|
|
|
|
|
|
|
|
|
|
|
|
(1) |
The term of the lease expires in 2025 and has two, five-year extensions. We have subleased approximately 19,000 square feet of our corporate facilities under a sublease agreement that expires in 2025. |
|
|
(2) |
We have leased approximately 50% of our Orleans office building to the purchaser of our Heavy Civil business under a lease agreement that expires in 2022. |
We are, from time to time, a party to legal or regulatory proceedings arising in the ordinary course of our business. The discussion in Note 15 to the Consolidated Financial Statements included elsewhere in this Form 10-K is incorporated herein by reference. Currently, there are no other legal or regulatory proceedings that management believes, either individually or in the aggregate, would have a material adverse effect upon our consolidated financial statements. In accordance with GAAP, we record a liability when it is both probable that a liability has been incurred and the amount of the loss can be reasonably estimated. These liabilities are reviewed at least quarterly and adjusted to reflect the impacts of negotiations, settlements, rulings, advice of legal counsel and other information and events pertaining to a particular case or proceeding.
The operations Layne performs on mine sites are subject to regulation by the Federal Mine Safety and Health Administration under the Federal Mine Safety and Health Act of 1977. Information concerning mine safety violations or other regulatory matters required by Section 1503(a) of the Dodd-Frank Act and Item 104 of Regulation S-K is included in Exhibit 95 to this Form 10-K.
27
|
Market for Registrant’s Common Equity, Related Stockholder Matters and Issuer Purchases of Equity Securities |
Our common stock is traded on the NASDAQ Global Select Market under the symbol LAYN. The following table sets forth the range of high and low sales prices of our stock by quarter for the fiscal years ended January 31, 2018 and 2017, as reported by the NASDAQ Global Select Market.
|
|
|
|
|
|
|
|
|
|
|
Fiscal Year 2018 |
|
High |
|
|
Low |
|
||
|
First Quarter |
|
$ |
10.79 |
|
|
$ |
7.53 |
|
|
Second Quarter |
|
|
10.70 |
|
|
|
6.98 |
|
|
Third Quarter |
|
|
13.64 |
|
|
|
9.52 |
|
|
Fourth Quarter |
|
|
13.83 |
|
|
|
10.39 |
|
|
|
|
|
|
|
|
|
|
|
|
Fiscal Year 2017 |
|
High |
|
|
Low |
|
||
|
First Quarter |
|
$ |
9.22 |
|
|
$ |
4.90 |
|
|
Second Quarter |
|
|
9.32 |
|
|
|
6.50 |
|
|
Third Quarter |
|
|
9.56 |
|
|
|
7.15 |
|
|
Fourth Quarter |
|
|
11.42 |
|
|
|
8.17 |
|
|
|
|
|
|
|
|
|
|
|
At March 26, 2018, there were 162 owners of record of our common stock.
We have not paid any cash dividends on our common stock. Moreover, our Board of Directors does not anticipate paying any cash dividends in the foreseeable future. Future dividend policy will depend on a number of factors including our future earnings, capital requirements, financial condition and prospects and such other factors as the Board of Directors may deem relevant, as well as restrictions under our indebtedness agreements. Our indebtedness agreements currently contain restrictions on our ability to pay cash dividends.
28
The following graph provides a comparison of our five-year, cumulative total shareholder return from January 31, 2013 through January 31, 2018 to the return of the Russell 3000 and a custom peer group selected by Layne. The peer group includes Aegion Corp, Boart Longyear Ltd, Foraco International Sa, Forage Orbit Garant Inc, Major Drilling Group International Inc, Matrix Service Co, Primoris Services Corp and Tutor Perini Corp. The comparisons shown in the graph are based on historical data. The stock price performance shown in the graph is not necessarily indicative of, nor is it intended to forecast, the potential future performance of Layne’s common stock. Information used in the graph was obtained from Russell Investment Group, a source believed to be reliable, but we are not responsible for any errors or omission in such information. Nuverra Environmental Solutions, Inc., which was included in the peer group in the Form 10-K for the fiscal year ended January 31, 2017, is not included in the peer group for purposes of this performance graph. We elected to remove Nuverra Environmental Solutions, Inc. from the peer group as a result of its filing for bankruptcy in 2017.
The following performance graph and related text are being furnished to and not filed with the SEC and will not be deemed to be “soliciting material” or subject to Regulation 14A or 14C under the Exchange Act or to the liabilities of Section 18 of the Exchange Act and will not be deemed to be incorporated by reference into any filing under the Securities Act of 1933 or the Exchange Act, except to the extent we specifically incorporate such information by reference into such filing.
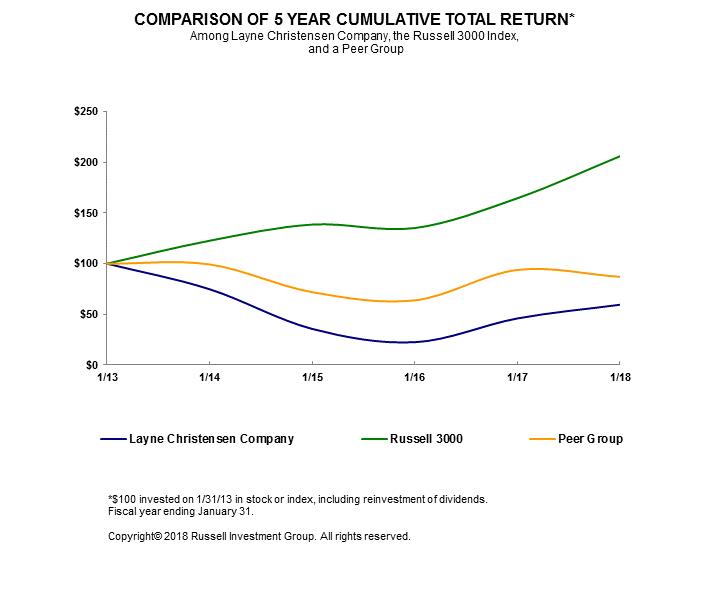
29
The following selected historical financial information as of and for each of the five fiscal years ended January 31, 2018, has been derived from our audited Consolidated Financial Statements. All periods presented below reflect the effects of operations discontinued during each of the years in the table below.
The information below should be read in conjunction with “Management’s Discussion and Analysis of Financial Condition and Results of Operations” under Item 7 and the Consolidated Financial Statements and notes thereto under Item 8 included elsewhere in this Form 10-K.
|
|
|
|
|
|
|
|
|
|
|
|
|
|
|
|
|
|
|
|
|
|
|
As of and Years Ended January 31, |
|
2018(1) |
|
|
2017 |
|
|
2016(5) |
|
|
2015(6) |
|
|
2014(7) |
|
|||||
|
Income Statement Data (in thousands, except per share data): |
|
|
|
|
|
|
|
|
|
|
|
|
|
|
|
|
|
|
|
|
|
Revenues |
|
$ |
475,517 |
|
|
$ |
464,783 |
|
|
$ |
518,105 |
|
|
$ |
522,057 |
|
|
$ |
513,551 |
|
|
Cost of revenues (exclusive of depreciation, amortization and impairment charges shown below) |
|
|
(374,761 |
) |
|
|
(382,101 |
) |
|
|
(419,867 |
) |
|
|
(411,077 |
) |
|
|
(403,343 |
) |
|
Selling, general and administrative expenses (exclusive of depreciation, amortization and impairment charges shown below) |
|
|
(74,428 |
) |
|
|
(76,586 |
) |
|
|
(89,176 |
) |
|
|
(97,339 |
) |
|
|
(103,462 |
) |
|
Depreciation and amortization |
|
|
(26,701 |
) |
|
|
(25,302 |
) |
|
|
(30,092 |
) |
|
|
(37,619 |
) |
|
|
(41,738 |
) |
|
Gain on sale of fixed assets |
|
|
3,741 |
|
|
|
3,886 |
|
|
|
507 |
|
|
|
659 |
|
|
|
3,946 |
|
|
Impairment charges(2) |
|
|
— |
|
|
|
— |
|
|
|
(4,598 |
) |
|
|
— |
|
|
|
— |
|
|
Equity in earnings (losses) of affiliates |
|
|
3,431 |
|
|
|
2,655 |
|
|
|
(612 |
) |
|
|
(2,002 |
) |
|
|
(2,974 |
) |
|
Restructuring costs |
|
|
(4,903 |
) |
|
|
(16,924 |
) |
|
|
(9,189 |
) |
|
|
(2,644 |
) |
|
|
— |
|
|
Gain on extinguishment of debt (3) |
|
|
— |
|
|
|
— |
|
|
|
4,236 |
|
|
|
— |
|
|
|
— |
|
|
Interest expense |
|
|
(17,120 |
) |
|
|
(16,883 |
) |
|
|
(18,011 |
) |
|
|
(13,707 |
) |
|
|
(7,132 |
) |
|
Other (expense) income , net |
|
|
(15 |
) |
|
|
843 |
|
|
|
1,082 |
|
|
|
(1,266 |
) |
|
|
631 |
|
|
Loss from continuing operations before income taxes |
|
|
(15,239 |
) |
|
|
(45,629 |
) |
|
|
(47,615 |
) |
|
|
(42,938 |
) |
|
|
(40,521 |
) |
|
Income tax (expense) benefit (4) |
|
|
10,375 |
|
|
|
(1,420 |
) |
|
|
(737 |
) |
|
|
3,945 |
|
|
|
(56,884 |
) |
|
Net loss from continuing operations |
|
|
(4,864 |
) |
|
|
(47,049 |
) |
|
|
(48,352 |
) |
|
|
(38,993 |
) |
|
|
(97,405 |
) |
|
Net (loss) income from discontinued operations |
|
|
(22,447 |
) |
|
|
(5,187 |
) |
|
|
3,547 |
|
|
|
(70,334 |
) |
|
|
(30,646 |
) |
|
Net loss |
|
|
(27,311 |
) |
|
|
(52,236 |
) |
|
|
(44,805 |
) |
|
|
(109,327 |
) |
|
|
(128,051 |
) |
|
Net loss (income) attributable to noncontrolling interest |
|
|
— |
|
|
|
— |
|
|
|
28 |
|
|
|
(824 |
) |
|
|
(588 |
) |
|
Net loss attributable to Layne Christensen Company |
|
$ |
(27,311 |
) |
|
$ |
(52,236 |
) |
|
$ |
(44,777 |
) |
|
$ |
(110,151 |
) |
|
$ |
(128,639 |
) |
|
(Loss) income per share information attributable to |
|
|
|
|
|
|
|
|
|
|
|
|
|
|
|
|
|
|
|
|
|
Layne Christensen Company shareholders: |
|
|
|
|
|
|
|
|
|
|
|
|
|
|
|
|
|
|
|
|
|
Loss per share from continuing operations - basic and diluted |
|
$ |
(0.24 |
) |
|
$ |
(2.38 |
) |
|
$ |
(2.45 |
) |
|
$ |
(2.03 |
) |
|
$ |
(5.00 |
) |
|
(Loss) income per share from discontinued operations - basic and diluted |
|
|
(1.13 |
) |
|
|
(0.26 |
) |
|
|
0.18 |
|
|
|
(3.58 |
) |
|
|
(1.56 |
) |
|
Loss per share - basic and diluted |
|
$ |
(1.37 |
) |
|
$ |
(2.64 |
) |
|
$ |
(2.27 |
) |
|
$ |
(5.61 |
) |
|
$ |
(6.56 |
) |
|
Balance Sheet Data (in thousands): |
|
|
|
|
|
|
|
|
|
|
|
|
|
|
|
|
|
|
|
|
|
Working capital, excluding current maturities of debt |
|
$ |
62,584 |
|
|
$ |
105,554 |
|
|
$ |
131,368 |
|
|
$ |
104,974 |
|
|
$ |
121,458 |
|
|
Total assets |
|
|
370,189 |
|
|
|
436,151 |
|
|
|
488,657 |
|
|
|
541,942 |
|
|
|
642,499 |
|
|
Current maturities of long-term debt(8) |
|
|
67,293 |
|
|
|
9 |
|
|
|
88 |
|
|
|
142 |
|
|
|
128 |
|
|
Total long-term debt, excluding current maturities |
|
|
98,769 |
|
|
|
162,346 |
|
|
|
158,986 |
|
|
|
128,566 |
|
|
|
102,999 |
|
|
Total Layne Christensen Company shareholders' equity |
|
|
57,505 |
|
|
|
82,220 |
|
|
|
128,658 |
|
|
|
181,215 |
|
|
|
289,464 |
|
|
|
|
|
|
|
|
|
|
|
|
|
|
|
|
|
|
|
|
|
|
|
|
(1) |
During the fiscal year ended January 31, 2018, we sold our Heavy Civil business. We have accounted for it as a discontinued operation for all periods presented. |
|
(2) |
See Note 4 to the Consolidated Financial Statements for a discussion of impairment charges recorded during the fiscal year ended January 31, 2016. |
|
(3) |
During the fiscal year ended January 31, 2016, we recognized a gain on extinguishment of debt of $4.2 million in connection with the partial redemption of the 4.25% Convertible Notes in exchange for 8.0% Convertible Notes. |
|
(4) |
Our income tax benefit for the fiscal year ended January 31, 2018 included an $8.8 million reversal of accrued foreign taxes recorded in prior years. A $73.4 million valuation allowance on deferred tax assets was recorded during the fiscal year ended January 31, 2014. Of the $73.4 million valuation allowance, $54.4 million related to deferred tax assets established in a prior year and $19.0 million related to deferred tax assets established in the current year. |
30
|
(5) |
During the fiscal year ended January 31, 2016, we sold our Geoconstruction business. We have accounted for it as a discontinued operation for all periods presented. |
|
(6) |
During the fiscal year ended January 31, 2015, we sold Costa Fortuna and Tecniwell, both previously reported in the Geoconstruction operating segment. We have accounted for these businesses as discontinued operations for all periods presented. |
|
(7) |
During the fiscal year ended January 31, 2014, we accounted for our SolmeteX operation, which was sold on July 31, 2013, as a discontinued operation. |
|
(8) |
Primarily represents the 4.25% Convertible Notes with a maturity date of November 15, 2018. |
The following discussion and analysis of financial condition and results of operations should be read in conjunction with our consolidated financial statements and notes thereto under Item 8.
Cautionary Language Regarding Forward-Looking Statements
This Form 10-K may contain forward-looking statements within the meaning of Section 27A of the Securities Act of 1933 and Section 21E of the Exchange Act of 1934. Such statements may include, but are not limited to, statements of plans and objectives, statements of future economic performance and statements of assumptions underlying such statements and statements of management’s intentions, hopes, beliefs, expectations or predictions of the future. Forward-looking statements can often be identified by the use of forward-looking terminology, such as “should,” “intended,” “continue,” “believe,” “may,” “hope,” “anticipate,” “goal,” “forecast,” “plan,” “estimate” and similar words or phrases that convey the uncertainty of future events or outcomes. Such statements are based on current expectations and are subject to certain risks, uncertainties and assumptions, including but not limited to: estimates and assumptions regarding our strategic direction and business strategy, the timely and effective execution of turnaround strategy for Water Resources, the continuing recovery in the mining industry, prevailing prices for various commodities, the timing and extent of future oil and gas drilling and production in the Delaware Basin, longer term weather patterns, unanticipated slowdowns in our major markets, the availability of credit, the risks and uncertainties normally incident to our drilling and infrastructure services industries, the impact of competition, the availability of equity or debt capital needed for our business, including the refinancing of our existing indebtedness as it matures, worldwide economic and political conditions and foreign currency fluctuations that may affect our results of operations. Should one or more of these risks or uncertainties materialize, or should underlying assumptions prove incorrect, actual results may vary materially and adversely from those anticipated, estimated or projected. Many of the factors that will impact our risk factors are beyond our ability to control or predict. Should one or more of these risks or uncertainties materialize, or should underlying assumptions prove incorrect, actual results may vary materially and adversely from those anticipated, estimated or projected. These forward-looking statements are made as of the date of this filing and we assume no obligation to update such forward-looking statements or to update the reasons why actual results could differ materially from those anticipated in such forward-looking statements.
Overview
We are a global water management, infrastructure services and drilling company, providing responsible solutions to the world of essential natural resources – water minerals and energy. We offer innovative, sustainable products and services with an enduring commitment to safety, excellence and integrity. We primarily operate in North America and Brazil. Our customers include government agencies, investor-owned utilities, industrial companies, global mining companies, consulting engineering firms, oil and gas companies, power companies and agribusinesses. We have ownership interest in certain foreign affiliates operating in Latin America.
We manage and report our operations through three segments: Water Resources, Inliner and Mineral Services. Our operations are cyclical and subject to seasonality. Drilling and infrastructure services activities and revenues tend to decrease during the months of November through January.
Key Fiscal Year 2018 Events
During the first quarter of the fiscal year ended January 31, 2018, we sold our Heavy Civil business. The operating results of the Heavy Civil business are presented as discontinued operations and, as such, have been excluded from continuing operations and segment results for all periods presented. See Note 16 to the Consolidated Financial Statements for further discussion. The sale of Heavy Civil business closed on April 30, 2017.
31
During the fiscal year ended January 31, 2018, we made significant progress in developing and expanding our new Water Midstream business reported in our Water Resources segment. During the year, we completed our initial water pipeline infrastructure system serving energy producers in the Delaware Basin in West Texas, which we refer to as the Hermosa Pipeline. Our new Water Midstream business is anchored by nearly 1,000 acres of Company-owned, water-producing land near Pecos, TX and consists of a high capacity 22-inch diameter pipeline of more than 26 miles in length, 750,000 barrels of storage through two lined, in-ground storage ponds near the water wells and associated pump stations. We have the ability to deliver water at multiple points along the pipeline route. The system has production and delivery capacity of 175,000 barrels per day of non-potable water, with capacity to support further anticipated expansion from both additional water sources and delivery points. The capital investment for the Hermosa Pipeline system and the extension, including land and right of way costs, is approximately $22.0 million.
Additionally, during the fiscal year ended January 31, 2018, we entered into a long-term agreement with the Texas General Land Office (“GLO”) that provides Layne with the exclusive right to develop GLO non-potable water resources for oil and gas drilling and completion activities on approximately 88,000 acres interspersed across Reeves and Culberson counties in the Delaware Basin oil and gas producing region of Texas.
Consolidated Results of Operations Comparison of Fiscal Year 2018 to Fiscal Year 2017
Consolidated Results
Revenues increased $10.7 million, or 2.3%, to $475.5 million, for the fiscal year ended January 31, 2018 compared to $464.8 million for the fiscal year ended January 31, 2017. The increase in revenues was primarily due to increased drilling activity in Mineral Services in the western U.S. and Mexico and increased activity levels in Inliner. This increase was partially offset by Water Resources’ reduced drilling primarily in the western and mid-western U.S. stemming from increased precipitation in the region and lower levels of collector well activity.
Cost of revenues (exclusive of depreciation, amortization) decreased $7.3 million, to $374.8 million (78.8% of revenues) for the fiscal year ended January 31, 2018 compared to $382.1 million (82.2% of revenues) for the fiscal year ended January 31, 2017. Cost of revenues as a percentage of revenues for the fiscal year ended January 31, 2018 decreased from the prior year primarily as a result of Water Resources’ completion of certain loss projects in the prior year and improved margins in Mineral Services due to an increase in market activity.
Selling, general and administrative expenses decreased $2.2 million, or 2.8%, to $74.4 million for the fiscal year ended January 31, 2018 compared to $76.6 million for the fiscal year ended January 31, 2017. The prior year included a $2.2 million value added tax recovery in Mineral Services. Excluding the tax recovery in the prior year, selling, general and administrative expenses decreased $4.4 million reflecting lower costs at Inliner and Water Resources with the primary reduction reflected in unallocated corporate overhead costs of $3.2 million, which included lower legal and professional fees and compensation related expenses partially offset by an increase in incentive compensation expense related to improved operating performance.
Depreciation and amortization increased $1.4 million, or 5.5%, to $26.7 million, for the fiscal year ended January 31, 2018 compared to $25.3 million for the fiscal year ended January 31, 2017. The increase is primarily due to higher capital expenditures over the past year.
Restructuring costs of $4.9 million for the fiscal year ended January 31, 2018 compared to $16.9 million for the fiscal year ended January 31, 2017. Restructuring costs primarily related to finalizing tax issues and exit costs in Africa and Australia and costs associated with our Water Resources Business Performance Initiative initiated in the fiscal year ended January 31, 2017.
Income tax (benefit) expense from continuing operations of ($10.4) million was recorded for the fiscal year ended January 31, 2018 compared to $1.4 million for the fiscal year ended January 31, 2017. We currently record no tax benefit on domestic deferred tax assets and certain foreign deferred tax assets. The effective tax rate for the fiscal year ended January 31, 2018 was 68.1% compared to (3.1%) for the fiscal year ended January 31, 2017.
Our income tax benefit for the fiscal year ended January 31, 2018 included an $8.8 million tax benefit recorded on the reversal of accrued foreign taxes recorded in prior years. During the fourth quarter, a foreign jurisdiction issued a tax ruling confirming an exemption on certain income from taxation which resulted in a reversal of the prior tax accrual. As a result of the reduction in foreign taxes, we also reduced our domestic foreign tax credit carryforward by $5.3 million; however, the reduction in the carryforward resulted in no impact on tax expense since we had a full valuation allowance recorded on our net domestic deferred tax asset. Additionally during the fourth quarter, we recorded a $2.6 million deferred tax benefit as the net effect of the tax law changes included in the Tax Cuts and Jobs Act of 2017 enacted on December 22, 2017 after taking into account related adjustments to our valuation
32
allowance. The remaining $1.1 million in tax expense was primarily related to foreign withholding taxes on dividends and tax expense recorded by our Mexican subsidiary.
The differences between the effective tax rates and the statutory tax rate for fiscal years ended January 31, 2018 (exclusive of items noted above) and January 31, 2017 resulted primarily from valuation allowances recorded during each period on current year losses.
Net loss from discontinued operations of $22.4 million was recorded for the fiscal year ended January 31, 2018 compared to net loss from discontinued operations of $5.2 million for the fiscal year ended January 31, 2017. Discontinued operations in the current year included the loss on sale of our Heavy Civil business of $19.0 million.
Segment Operating Results
Water Resources
|
|
|
Fiscal Years Ended January 31, |
|
|
|||||
|
(in thousands) |
|
2018 |
|
|
2017 |
|
|
||
|
Revenues |
|
$ |
172,406 |
|
|
$ |
204,577 |
|
|
|
|
|
|
|
|
|
|
|
|
|
|
Adjusted EBITDA |
|
|
5,284 |
|
|
|
(2,410 |
) |
|
|
Adjusted EBITDA as a percentage of revenues |
|
|
3.1 |
% |
|
|
(1.2 |
) |
% |
Revenues for Water Resources decreased $32.2 million, or 15.7%, to $172.4 million, for the fiscal year ended January 31, 2018 compared to $204.6 million for the fiscal year ended January 31, 2017. The decline in revenues was primarily due to decrease in agricultural drilling projects related to increased precipitation in the western and mid-western U.S. over the course of the past two years.
Adjusted EBITDA increased $7.7 million, or 319.3%, to $5.3 million, for the fiscal year ended January 31, 2018 compared to ($2.4) million for the fiscal year ended January 31, 2017. The increase in Adjusted EBITDA primarily reflects better performance on projects and less project execution issues.
Inliner
|
|
|
Fiscal Years Ended January 31, |
|
|||||
|
(in thousands) |
|
2018 |
|
|
2017 |
|
||
|
Revenues |
|
$ |
205,873 |
|
|
$ |
196,845 |
|
|
|
|
|
|
|
|
|
|
|
|
Adjusted EBITDA |
|
|
32,688 |
|
|
|
32,036 |
|
|
Adjusted EBITDA as a percentage of revenues |
|
|
15.9 |
% |
|
|
16.3 |
% |
Revenues for Inliner increased $9.0 million, or 4.6%, to $205.9 million, for the fiscal year ended January 31, 2018 compared to $196.8 million for the fiscal year ended January 31, 2017. Revenues were higher compared to the prior year period due overall increased in business primarily in the Midwest and an increase in large diameter pipe installation.
Adjusted EBITDA increased $0.7 million, or 2.0%, to $32.7 million, for the fiscal year ended January 31, 2018 compared to $32.0 million for the fiscal year ended January 31, 2017. The increase in Adjusted EBITDA was driven primarily by the revenue increase compared to the prior year.
Mineral Services
|
|
|
Fiscal Years Ended January 31, |
|
|||||
|
(in thousands) |
|
2018 |
|
|
2017 |
|
||
|
Revenues |
|
$ |
97,238 |
|
|
$ |
63,777 |
|
|
|
|
|
|
|
|
|
|
|
|
Adjusted EBITDA |
|
|
17,358 |
|
|
|
8,635 |
|
|
Adjusted EBITDA as a percentage of revenues |
|
|
17.9 |
% |
|
|
13.5 |
% |
33
Revenues for Mineral Services increased $33.5 million, or 52.5%, to $97.2 million, for the fiscal year ended January 31, 2018 compared to $63.8 million for the fiscal year ended January 31, 2017. Revenues increased from the prior year period due to increased market activity in the western U.S. and Mexico.
Adjusted EBITDA increased $8.7 million, or 101.0%, to $17.4 million for the fiscal year ended January 31, 2018 compared to $8.6 million for the fiscal year ended January 31, 2017. The increase in Adjusted EBITDA was primarily due to increased activity and profitability in the western U.S. and Mexico compared to the prior year period.
Unallocated Corporate Expenses
Unallocated corporate expenses primarily consist of general and administrative functions performed on a company-wide basis and benefiting all operating segments. These costs include expenses related to accounting, financial reporting, internal audit, treasury, legal, tax compliance, executive management and board of directors.
Unallocated corporate expenses reflected in our Adjusted EBITDA were $20.3 million for the fiscal year ended January 31, 2018 compared to $23.8 million for the fiscal year ended January 31, 2017. The improvement was primarily due to reductions in legal, professional and consulting fees partially offset by an increase in incentive compensation expense due to our improved performance.
Comparison of Fiscal Year 2017 to Fiscal Year 2016
Consolidated Results
Revenues decreased $53.3 million, or 10.3%, to $464.8 million, for the fiscal year ended January 31, 2017 compared to $518.1 million for the fiscal year ended January 31, 2016. The decrease in revenues was primarily due to declines in Mineral Services reflecting the exit from operations in Africa and Australia and weak market conditions during the first half of the year, and decreased drilling activity levels in the western U.S. in Water Resources due to significant precipitation levels in the region.
Cost of revenues (exclusive of depreciation, amortization and impairment charges) decreased $37.8 million, to $382.1 million (82.2% of revenues) for the fiscal year ended January 31, 2017 compared to $419.9 million (81.0% of revenues) for the fiscal year ended January 31, 2016. Cost of revenues as a percentage of revenues for the fiscal year ended January 31, 2017 increased from the prior year, primarily due to a $7.9 million write down of inventory in the prior year combined with improved margins in Inliner. Inliner’s margins increased primarily due to the product mix of contracts combined with increased crew efficiency during the fiscal year ended January 31, 2017.
Selling, general and administrative expenses decreased $12.6 million, or 14.1%, to $76.6 million for the fiscal year ended January 31, 2017 compared to $89.2 million for the fiscal year ended January 31, 2016. The decrease was primarily due to reduced Corporate overhead costs, including reductions in legal and professional fees and compensation expenses.
Depreciation and amortization decreased $4.8 million, or 15.9%, to $25.3 million, for the fiscal year ended January 31, 2017 compared to $30.1 million for the fiscal year ended January 31, 2016. The decrease represents reductions in capital expenditures and the disposal or write down of assets. These decreases were partially offset by increased depreciation related to additional capital expenditures in Inliner to expand crews and manufacturing capabilities.
Equity in earnings (losses) of affiliates improved to earnings of $2.7 million for the fiscal year ended January 31, 2017 compared to a loss of $0.6 million for the fiscal year ended January 31, 2016, primarily due to increased margins from our affiliates in Chile.
Restructuring costs of $16.9 million were recorded for the fiscal year ended January 31, 2017 compared to $9.2 million for the fiscal year ended January 31, 2016. Restructuring costs for the fiscal year ended January 31, 2017 primarily related to the closure of our Australian and African entities resulting in the impairment of our assets held for sale. In calculating the impairment, the carrying amount of the assets included the cumulative currency translation adjustment related to our Australian and African entities. Also included, are the restructuring costs associated with our Water Resources Business Performance Initiative, as discussed in Note 18 to the Consolidated Financial Statements. For the fiscal year ended January 31, 2016, restructuring costs related to $3.9 million in asset write-downs, combined with $5.3 million of severance and other costs, as part of our exit from Africa and Australia.
Interest expense decreased $1.1 million, or 6.3%, to $16.9 million for the fiscal year ended January 31, 2017 compared to $18.0 million for the fiscal year ended January 31, 2016. The decrease in interest expense was mainly due to a $1.0 million write-off of
34
unamortized deferred financing fees as a result of the reduction in the borrowing base available under the asset-based credit facility during the third quarter of the fiscal year ended January 31, 2016.
Income tax expense from continuing operations of $1.4 million was recorded for the fiscal year ended January 31, 2017 compared to $0.7 million for the fiscal year ended January 31, 2016. We recorded no tax benefit on domestic deferred tax assets and certain foreign deferred tax assets. The effective tax rate for the fiscal year ended January 31, 2017 was (3.1%) compared to (1.5%) for the fiscal year ended January 31, 2016. The differences between the effective tax rates and the statutory tax rate resulted primarily from valuation allowances recorded during each period on current year losses.
Net loss from discontinued operations of $5.2 million for the fiscal year ended January 31, 2017, primarily related to a loss from operations of our Heavy Civil operations. Net income from discontinued operations of $3.5 million for the fiscal year ended January 31, 2016, primarily related to the gain on the sale of our Geoconstruction business.
Segment Operating Results
Water Resources
|
|
|
Fiscal Years Ended January 31, |
|
|||||
|
(in thousands) |
|
2017 |
|
|
2016 |
|
||
|
Revenues |
|
$ |
204,577 |
|
|
$ |
239,897 |
|
|
|
|
|
|
|
|
|
|
|
|
Adjusted EBITDA |
|
|
(2,410 |
) |
|
|
23,870 |
|
|
Adjusted EBITDA as a percentage of revenues |
|
|
(1.2 |
) |
% |
|
10.0 |
% |
Revenues for Water Resources decreased $35.3 million, or 14.7%, to $204.6 million, for the fiscal year ended January 31, 2017 compared to $239.9 million for the fiscal year ended January 31, 2016. The decline in revenues was primarily due to reduced activity in agricultural drilling projects in the western U.S. stemming largely from increased precipitation during the fiscal year ended January 31, 2017 and lower pump and well-related equipment sales.
Adjusted EBITDA decreased $26.3 million to ($2.4) million, for the fiscal year ended January 31, 2017 compared to $23.9 million for the fiscal year ended January 31, 2016. The decrease in Adjusted EBITDA was primarily due to reduced drilling activity described above, higher maintenance costs on equipment and higher costs and margin degradation on several large water well and injection well drilling projects.
Inliner
|
|
|
Fiscal Years Ended January 31, |
|
|||||
|
(in thousands) |
|
2017 |
|
|
2016 |
|
||
|
Revenues |
|
$ |
196,845 |
|
|
$ |
193,704 |
|
|
|
|
|
|
|
|
|
|
|
|
Adjusted EBITDA |
|
|
32,036 |
|
|
|
27,949 |
|
|
Adjusted EBITDA as a percentage of revenues |
|
|
16.3 |
% |
|
|
14.4 |
% |
Revenues for Inliner increased $3.1 million, or 1.6%, to $196.8 million, for the fiscal year ended January 31, 2017 compared to $193.7 million for the fiscal year ended January 31, 2016. Revenues increased due in part to the increase in the number of crews, from 34 at the start of fiscal year ended January 31, 2016 to 38 crews at the end of fiscal year ended January 31, 2017. Increased activity and a favorable product mix of a higher volume of larger diameter pipe projects also contributed to the increase in revenues.
Adjusted EBITDA increased $4.1 million, or 14.6%, to $32.0 million, for the fiscal year ended January 31, 2017 compared to $27.9 million for the fiscal year ended January 31, 2016. The increase in Adjusted EBITDA represents improved results across most operating regions as compared to the prior year. The increase in Adjusted EBITDA as a percentage of revenues was attributable to a higher volume of large diameter pipe installations combined with increased crew efficiency.
35
Mineral Services
|
|
|
Fiscal Years Ended January 31, |
|
|||||
|
(in thousands) |
|
2017 |
|
|
2016 |
|
||
|
Revenues |
|
$ |
63,777 |
|
|
$ |
86,390 |
|
|
|
|
|
|
|
|
|
|
|
|
Adjusted EBITDA |
|
|
8,635 |
|
|
|
1,878 |
|
|
Adjusted EBITDA as a percentage of revenues |
|
|
13.5 |
% |
|
|
2.2 |
% |
Revenues for Mineral Services decreased $22.6 million, or 26.2%, to $63.8 million, for the fiscal year ended January 31, 2017 compared to $86.4 million for the fiscal year ended January 31, 2016. Revenues declined primarily due to our exit from our operations in Africa and Australia during the fiscal year ended January 31, 2016, which contributed to approximately $12.4 million in revenue decline for the fiscal year ended January 31, 2017, compared to the prior year. Lower activity levels in the United States and Mexico during the first half of the fiscal year ended January 31, 2017, also contributed to the decline in revenues.
Adjusted EBITDA increased $6.7 million, or 359.8%, to $8.6 million for the fiscal year ended January 31, 2017 compared to $1.9 million for the fiscal year ended January 31, 2016. The increase in Adjusted EBITDA was due to a $2.2 million value added tax recovery during the current year, $1.1 million increased dividends received from our Latin American affiliates and increased margins in Brazil and Mexico.
Unallocated Corporate Expenses
Unallocated corporate expenses reflected in our Adjusted EBITDA were $23.8 million for the fiscal year ended January 31, 2017 compared to $29.3 million for the fiscal year ended January 31, 2016. The improvement was primarily due to reductions in legal and professional fees and compensation expenses related to reduced headcount.
Inflation
Management does not believe the operations for the periods discussed have been significantly adversely affected by inflation or changing prices from its suppliers.
Liquidity and Capital Resources
Our primary source of liquidity is cash flow generated from operations, with the ability to supplement cash flow with borrowings under our credit facilities or issuances of debt. Our cash flow is affected by prices of raw materials, demand for our services, weather and seasonal conditions, operational risks, volatility in commodity prices, industry and economic conditions and conditions in the global markets.
As of January 31, 2018, our total liquidity was $107.5 million, consisting of Excess Availability under our asset-based credit facility and total cash and cash equivalents. Our cash and cash equivalents as of January 31, 2018, were $32.0 million compared to $69.0 million as of January 31, 2017. The decrease in cash primarily reflects investments in our operations through capital expenditures during the year, primarily in our Water Midstream business. Cash and cash equivalents held by foreign subsidiaries as of January 31, 2018 were $5.8 million compared to $8.2 million as of January 31, 2017. No amounts held by foreign subsidiaries at January 31, 2018 were subject to repatriation restrictions. If cash held at our foreign subsidiaries is repatriated to the U.S., it may be subject to withholding taxes in the jurisdiction where the subsidiary is incorporated. The remittance will not be subject to additional U.S. taxation. As we continue to wind down our subsidiaries in Africa and Australia, we expect that any remaining residual cash will be treated as repayment of intercompany loans.
Our working capital was ($4.7) million as of January 31, 2018 and $105.5 million as of January 31, 2017. Adjusted Working Capital (working capital excluding cash and cash equivalents of $32.0 million and $69.0 million at January 31, 2018 and 2017, respectively, and working capital from discontinued operations at January 31, 2017 of $19.6 million), decreased $53.6 million to ($36.7) million as of January 31, 2018 from $16.9 million as of January 31, 2017, primarily due to our 4.25% Convertible Notes becoming current and cash used in investing activities for capital expenditures during the fiscal year ended January 31, 2018. See Key Fiscal Year 2018 Events above for more discussion.
36
Cash Flows
For the fiscal year ended January 31, 2018, the cash provided by operating activities primarily reflected our net loss, adjusted for non-cash items and changes in components of our working capital. Fluctuations in working capital are normal in our business. Working capital is impacted by the size of our projects, timing of project start dates and completion dates and the achievement of billing milestones on backlog as we complete certain phases of the project.
Cash provided by operating activities was $7.0 million for the fiscal year ended January 31, 2018 compared to $13.8 million for the fiscal year ended January 31, 2017. The primary impact is the change in working capital items with cash provided of $18.2 million in the prior year compared to a use of cash of $13.6 million in the current year. This change was driven by accounts receivable and costs and estimated earnings in excess of billings on uncompleted contracts activity levels. The change in accounts receivable compared to the prior year was heavily weighted in Mineral Services. Partially offsetting our use of cash for working capital was a lower net loss, excluding non-cash items of $27.7 million, due to lower unallocated corporate expenses combined with improved earnings in Inliner and Mineral Services.
Cash provided by (used in) operating activities was $13.8 million for the fiscal year ended January 31, 2017 compared ($1.8) million to the prior year. This increase was primarily due to higher cash inflows from changes in customer receivables and costs and estimated earnings in excess of billings on uncompleted contracts of $35.8 million due to improved working capital management combined with lower activity levels and the completion of projects. These increases were partially offset by a higher use of cash on accounts payable and accrued expenses of ($6.2) million primarily from timing with our vendors combined with a higher net loss, excluding non-cash items, of ($15.2) million compared to the prior year.
Cash (used in) provided by investing activities was ($42.4) million, ($11.9) million and $23.2 million for the fiscal years ended January 31, 2018, 2017 and 2016, respectively. Cash used in investing activities for the fiscal years ended January 31, 2018, 2017 and 2016 consisted primarily of capital expenditures partially offset by the sale of fixed assets. We are selectively investing capital, while continuing to dispose of underutilized assets. As discussed in Key Fiscal Year 2018 Events above, during the fiscal year ended January 31, 2018 we completed our initial water pipeline infrastructure system in our Water Midstream business. We had additional capital expenditures implementing an accounting system upgrade. These uses were partially offset by the proceeds from the sale of our Heavy Civil business of $3.5 million, also discussed in Key Fiscal Year 2018 Events above. Cash used in investing activities for the fiscal year ended January 31, 2016 also includes proceeds from the sale of our Geoconstruction business of $42.3 million.
Cash flows (used in) provided by financing activities were ($0.2) million, ($0.1) million and $21.9 million for the fiscal years ended January 31, 2018, 2017 and 2016, respectively. Cash provided by financing activities for the fiscal year ended January 31, 2016 primarily relates to proceeds from the issuance of 8.0% Convertible Notes, partially offset by net payments on our asset-based credit facility.
Financing Agreements
Below is a summary of certain provisions of our credit facility and debt instruments. For more information about our indebtedness, see Note 8 to the Consolidated Financial Statements in this Form 10-K.
4.25% Convertible Senior Notes due 2018. We have outstanding $69.5 million in aggregate principal amount of our 4.25% Convertible Notes as of January 31, 2018. The 4.25% Convertible Notes bear interest payable semi-annually in arrears in cash on May 15 and November 15 of each year. See “11.0% Unsecured Notes” below. The 4.25% Convertible Notes mature on November 15, 2018, unless earlier repurchased, redeemed or converted. The 4.25% Convertible Notes are contingently convertible, at the option of the holders, into consideration consisting of, at our election, cash, shares of our common stock or a combination of cash and shares of our common stock (and cash in lieu of fractional shares) until the close of business on the scheduled trading day immediately preceding May 15, 2018.
The initial conversion rate was 43.6072 shares of our common stock per $1,000 principal amount of 4.25% Convertible Notes (which is equivalent to an initial conversion price of approximately $22.93 per share of our common stock). The conversion rate will be subject to adjustment upon the occurrence of certain events. In addition, we may be obligated to increase the conversion rate for any conversion that occurs in connection with a “fundamental change” (as defined in our 4.25% Convertible Notes Indenture).
On and after November 15, 2016 and prior to the maturity date, we may redeem all, but not less than all, of the 4.25% Convertible Notes for cash if the sale price of our common stock equals or exceeds 130% of the applicable calculated conversion price for a specified time period ending on the trading day immediately prior to the date we deliver notice of the redemption. The redemption price will equal 100% of the principal amount of the 4.25% Convertible Notes to be redeemed, plus any accrued and unpaid interest to, but excluding, the redemption date. In addition, upon the occurrence of a fundamental change, holders of the 4.25%
37
Convertible Notes will have the right, at their option, to require us to repurchase their 4.25% Convertible Notes in cash at a price equal to 100% of the principal amount of the 4.25% Convertible Notes to be repurchased, plus accrued and unpaid interest to, but excluding, the fundamental change repurchase date.
The pending merger with Granite is not a fundamental change under the indenture governing the 4.25% Convertible Notes. In the merger agreement, Granite agreed that any conversions of the 4.25% Convertible Notes after the closing of the merger would be settled solely in cash.
8.0% Senior Secured Second Lien Convertible Notes. We have outstanding $99.9 million in aggregate principal amount of our 8.0% Convertible Notes as of January 31, 2018. The 8.0% Convertible Notes bear interest at a rate of 8.0% per annum, payable semi-annually in arrears on May 1 and November 1 of each year. The 8.0% Convertible Notes will mature on May 1, 2019; provided, however, that, unless all of the 4.25% Convertible Notes (or any permitted refinancing indebtedness in respect thereof) have been redeemed, repurchased, otherwise retired, discharged in accordance with their terms or converted into our common stock, or have been effectively discharged, in each case on or prior to August 15, 2018 or the scheduled maturity date of the 4.25% Convertible Notes (or any permitted refinancing indebtedness incurred in respect thereof) is extended to a date that is after October 15, 2019, the 8.0% Convertible Notes will mature on August 15, 2018. See "11.0% Unsecured Notes" below.
The 8.0% Convertible Notes are convertible, at the option of the holders, into consideration consisting of shares of our common stock (and cash in lieu of fractional shares) until the close of business on the scheduled trading day immediately preceding the maturity date. No holder will have the right to convert any 8.0% Convertible Notes into shares of common stock to the extent that the conversion would cause that holder to beneficially own more than 9.9% of the shares of our common stock then outstanding after giving effect to the proposed conversion.
The initial conversion rate was 85.4701 shares of our common stock per $1,000 principal amount of 8.0% Convertible Notes (equivalent to an initial conversion price of approximately $11.70 per share of our common stock). The conversion rate is subject to adjustment upon the occurrence of certain events. In addition, we may be obligated to increase the conversion rate for any conversion that occurs in connection with a “fundamental change” (as defined in our 8.0% Convertible Notes Indenture) or our call of the 8.0% Convertible Notes for redemption.
At any time prior to the maturity date, we may redeem for cash all, but not less than all, of the 8.0% Convertible Notes; provided, however, that we may not redeem the 8.0% Convertible Notes on a redemption date that is outside an Open Redemption Period (as defined in the 8.0% Convertible Notes Indenture) unless the last reported sale price of our common stock equals or exceeds 140% of the conversion price of the 8.0% Convertible Notes in effect on each of at least 20 trading days during the 30 consecutive trading day period ending on and including, the trading day immediately preceding the date on which we deliver the redemption notice.
In addition, upon the occurrence of a “fundamental change”, holders of the 8.0% Convertible Notes will have the right, at their option, to require us to repurchase their 8.0% Convertible Notes in cash at a price equal to 100% of the principal amount of the 8.0% Convertible Notes to be repurchased, plus accrued and unpaid interest to, but excluding, the fundamental change repurchase date.
The pending merger with Granite is not a fundamental change under the indenture governing the 8.00% Convertible Notes. If the merger with Granite is consummated, any future conversions of the 8.0% Convertible Notes would be settled solely in shares of common stock of Granite (other than cash in lieu of any fractional shares).
Asset-based revolving credit facility. As of January 31, 2018, availability under our asset-based credit facility was $100.0 million, with outstanding letters of credit amounting to $24.6 million and no borrowing outstanding, leaving Excess Availability of approximately $75.4 million.
The asset-based credit facility is guaranteed by our direct and indirectly wholly-owned domestic subsidiaries, subject to certain exceptions described in the asset-based credit facility. The obligations under the asset-based credit facility are secured by a lien on substantially all of our assets and the assets of the guarantor subsidiaries, subject to certain exceptions described in the asset-based credit facility, including a pledge of up to 65.0% of the equity interest of our first tier foreign subsidiaries.
If Excess Availability is less than the greater of 17.5% of Total Availability or $17.5 million for more than one business day, then a “Covenant Compliance Period” (as defined in the asset-based credit facility agreement) will exist until Excess Availability has been equal to or greater than the greater of 17.5% of the Total Availability or $17.5 million for a period of 30 consecutive days. We must maintain a minimum fixed charge coverage ratio of not less than 1.0 to 1.0 and a maximum first lien leverage ratio of not greater than 5.0 to 1.0 for the four fiscal quarters ended immediately preceding any Covenant Compliance Period and for any four fiscal quarter period ending during a Covenant Compliance Period. We were not subject to a Covenant Compliance Period during the three
38
fiscal years ended January 31, 2018. If we had been in a Covenant Compliance Period during the three year period ended January 31, 2018, we would not have been in compliance with the minimum fixed charge coverage ratio
On March 30, 2018, our asset-based credit facility agreement was amended to revise the acceleration provision included in the definition of Maturity Date to be July 16, 2018 if we have not delivered to the administrative agent for the asset-based credit facility evidence by July 15, 2018 that the 4.25% Convertible Notes have been effectively discharged with the proceeds from the issuance of the 11.0% Unsecured Notes or (b) May 15, 2018 if (i) the issuance of the 11.0% Unsecured Notes is cancelled for any reason or (ii) the proceeds of the 11.0% Unsecured Notes are used for a purpose other than to effectively discharge the 4.25% Convertible Notes in full; provided, that if an event described in clause (i) or (ii) above occurs after May 15, 2018, then the maturity date of the asset-based credit facility will be the date the event occurred
The asset-based credit facility also contains a subjective acceleration clause that can be triggered if the lenders determine that we have experienced a material adverse change. If triggered by the lenders, this clause would create an Event of Default which in turn would permit the lenders to accelerate repayment of outstanding obligations.
In general, during a Covenant Compliance or if an Event of Default has occurred and is continuing, all of our funds received on a daily basis will be applied to reduce amounts owing under the asset-based credit facility. Based on current projections, we do not anticipate being in a Covenant Compliance Period during the next twelve months.
11% Unsecured Notes. On March 19, 2018, we entered into a note purchase agreement with two investments funds advised by Corre Partners Management, LLC to purchase $ 71.0 million of our 11% Unsecured Notes. Corre Partners Management and its affiliated funds, including the purchasers of the 11.0% Unsecured Notes, own a portion of our 4.25% Convertible Notes and 8.00% Convertible Notes. Under the note purchase agreement, the purchasers have committed to purchase $71.0 million of our 11% Unsecured Notes due October 16, 2019 (the "11.0% Unsecured Notes") at a purchase price equal to 100% of the principal amount of the 11.0% Unsecured Notes. The closing of the purchase and sale of the 11.0% Unsecured Notes will be the earlier to occur of (i) October 1, 2018 and (ii) the fifth business day after delivery of a funding notice by us to the purchasers. As a result, if the proceeds of the 11.0% Unsecured Notes were to be used to effectively discharge the 4.25% Convertible Notes prior to July 16, 2018, we would need to refinance (1) the asset-based credit facility on or prior to April 14, 2019, (2) to the extent they are not converted into our common stock, the 8.0% Convertible Notes on May 1, 2019 and (3) the 11.0% Unsecured Notes on or prior to October 16, 2019. The commitment of the purchasers to purchase the 11.0% Unsecured Notes terminates upon the earliest to occur of: (i) a change of control (including the closing of the pending merger with Granite) and (ii) delivery to the purchasers of a notice of termination by us.
We may at our option prepay the 11.0% Unsecured Notes in whole or in part at any time. The 11.0% Unsecured Notes are subject to a mandatory prepayment upon the closing of a change of control. The 11.0% Unsecured Notes are subject to an Early Payment Event Fee if the 11.0% Unsecured Notes are repaid less than 90 days after the 11.0% Unsecured Notes are issued. The amount of the Early Payment Event Fee will be equal to the excess, if any, of (x) 90 days of accrued interest on the principal amount repaid, over (y) the amount of interest accrued and paid or payable with respect to the principal amount repaid from the date of issuance to and including the date of the repayment.
There are no covenants applicable to us under the note purchase agreement so long as: (i) the 11.0% Unsecured Notes have not been issued, (ii) any of the 8.00% Convertible Notes are outstanding and (iii) none of the provisions of the indenture governing the 8.00% Convertible Notes have been amended or waived. After the 11.0% Unsecured Notes have been issued, we will be subject to certain covenants, including, delivery of financial statements and other reports, compliance with material contracts and applicable laws, and maintenance of corporate existence, insurance and properties. In addition, after the earliest date that (i) none of the 8.00% Convertible Notes are outstanding or (ii) all or any of the provisions of the indenture governing the 8.00% Convertible Notes are no longer in effect or have been amended or waived, we will be subject to negative covenants related to indebtedness, liens, sale and leaseback transactions, asset sales, dividends and restricted payments, transactions with affiliates, and maximum ratio of funded indebtedness to EBITDA.
Potential Refinancing of Convertible Notes. Prior to August 15, 2018, we may elect to issue the 11.0% Unsecured Notes and use the proceeds from the issuance of the 11.0% Unsecured Notes to effectively discharge the 4.25% Convertible Notes, in which case the maturity date of the 8.0% Convertible Notes would remain May 1, 2019. As a result, if the proceeds of the 11.0% Unsecured Notes were to be used to effectively discharge the 4.25% Convertible Notes prior to July 16, 2018, we would need to refinance (1) the asset-based credit facility on or prior to April 14, 2019, (2) to the extent they are not converted into our common stock, the 8.0% Convertible Notes on May 1, 2019 and (3) the 11.0% Unsecured Notes on or prior to October 16, 2019.
Alternatively, if the market price of our common stock prior to August 15, 2018 is above $11.70 per share, we could elect to take no action with respect to the 4.25% Convertible Notes, in which case the maturity date of the 8.0% Convertible Notes would become August 15, 2018. We believe that under those circumstances most, if not all, of the holders of our 8.0% Convertible Notes would convert their notes into our common stock (and any remaining unconverted amounts could be refinanced with available cash or drawings under our asset-based credit facility) and we could issue the 11.0% Unsecured Notes by October 1, 2018 in order to repay
39
the 4.25% Convertible Notes at maturity. In this case, we would seek to extend or refinance our asset-based credit facility prior to July 16, 2018.
Contractual Obligations and Commercial Commitments
Contractual obligations and commercial commitments as of January 31, 2018, are summarized as follows:
|
|
|
Payments/Expiration by Period |
|
|||||||||||||||||
|
(in thousands) |
|
Total |
|
|
Less than 1 Year |
|
|
1-3 Years |
|
|
3-5 Years |
|
|
More than 5 Years |
|
|||||
|
Contractual obligations and other commercial commitments: |
|
|
|
|
|
|
|
|
|
|
|
|
|
|
|
|
|
|
|
|
|
4.25% Convertible Notes (including interest) |
|
$ |
67,247 |
|
|
$ |
67,247 |
|
|
$ |
— |
|
|
$ |
— |
|
|
$ |
— |
|
|
8.0% Convertible Notes (including interest) |
|
|
98,769 |
|
|
|
|
|
|
|
98,769 |
|
|
|
— |
|
|
|
— |
|
|
Operating leases |
|
|
9,131 |
|
|
|
2,649 |
|
|
|
3,694 |
|
|
|
2,788 |
|
|
|
— |
|
|
Capitalized leases (including interest) |
|
|
45 |
|
|
|
45 |
|
|
|
— |
|
|
|
— |
|
|
|
— |
|
|
Supplemental retirement benefits |
|
|
5,395 |
|
|
|
339 |
|
|
|
678 |
|
|
|
677 |
|
|
|
3,701 |
|
|
Income tax uncertainties, current |
|
|
2,710 |
|
|
|
2,710 |
|
|
|
— |
|
|
|
— |
|
|
|
— |
|
|
Total contractual obligations |
|
$ |
183,297 |
|
|
$ |
72,990 |
|
|
$ |
103,141 |
|
|
$ |
3,465 |
|
|
$ |
3,701 |
|
|
Letters of credit |
|
|
24,587 |
|
|
|
24,587 |
|
|
|
— |
|
|
|
— |
|
|
|
— |
|
|
Total contractual obligations and commercial commitments |
|
$ |
207,884 |
|
|
$ |
97,577 |
|
|
$ |
103,141 |
|
|
$ |
3,465 |
|
|
$ |
3,701 |
|
|
|
|
|
|
|
|
|
|
|
|
|
|
|
|
|
|
|
|
|
|
|
|
|
|
|
|
|
|
|
|
|
|
|
|
|
|
|
|
|
|
|
|
|
We expect to meet our cash contractual obligations in the ordinary course of operations and that the letters of credit will be renewed in connection with our annual insurance renewal process.
The 4.25% Convertible Notes bear interest at a rate of 4.25% per year, payable semi-annually in arrears in cash on May 15 and November 15 of each year. The 4.25% Convertible Notes will mature on November 15, 2018 unless earlier repurchased, redeemed or converted (under the terms of the 4.25% Convertible Notes Indenture).
The 8.0% Convertible Notes bear interest at a rate of 8.0% per annum, payable semi-annually in arrears on May 1 and November 1 of each year. The 8.0% Convertible Notes will mature on May 1, 2019, subject to certain provisions in the 8.0% Convertible Notes Indenture.
See "—Financing Agreements—Potential Refinancing of Convertible Notes" above
Capitalized leases are obligations for certain equipment.
We have income tax uncertainties in the amount of $15.5 million at January 31, 2018, that are classified as non-current on the balance sheet as resolution of these matters is expected to take more than a year. The ultimate timing of resolution of these items is uncertain and accordingly the amounts have not been included in the table above.
We have surety bonds to secure performance of our projects, amounting to $148.3 million as of January 31, 2018, $48.4 million related to surety bonds on contracts which were assumed by the purchasers of our Heavy Civil business. The amount is not included in the table above as information on the timing of the resolution of the amounts is not available. See Note 8 to Consolidated Financial Statements for further discussion.
Additional obligations in the ordinary course of operations are also incurred. These obligations, including but not limited to income tax payments, are expected to be met in the normal course of operations.
Off-Balance Sheet Arrangements
We have no off-balance sheet arrangements that have or are reasonably likely to have a current or future effect on our financial condition, changes in financial condition, revenues or expenses, results of operations, liquidity, capital expenditures or capital resources that is material to investors.
40
Critical Accounting Policies and Estimates
Management’s Discussion and Analysis of Financial Condition and Results of Operations discuss the consolidated financial statements, which have been prepared in accordance with GAAP. The preparation of these financial statements requires management to make estimates and assumptions that affect the reported amounts of assets and liabilities and the disclosure of contingent assets and liabilities at the date of the financial statements and the reported amounts of revenues and expenses during the reporting period.
Our accounting policies are more fully described in Note 1 to the Consolidated Financial Statements, located in Item 8 of this Form 10-K. We believe that the following accounting policies represent management’s more critical policies. Critical accounting policies, practices and estimates are a subset of significant accounting policies that are considered most important to the description of our financial condition and results and that require management’s most difficult, subjective, or complex judgments, often as a result of the need to make estimates about the effects of matters that are inherently uncertain.
Revenue Recognition – The significant estimates with regard to these consolidated financial statements relate to the estimation of total forecasted drilling and infrastructure services contract revenues, costs and profits in accordance with the criteria established in ASC Topic 605-35 “Construction-type and Production-type Contracts”.
Based on experience and our current processes we produce materially reliable estimates of total contract revenue and cost during any accounting period. However, many factors can and do change during a contract performance period which can result in a change to contract profitability from one financial reporting period to another. Some of the factors that can change the estimate of total contract revenue and cost include differing site conditions (to the extent that contract remedies are unavailable), the availability of skilled contract labor, the performance of major material suppliers, the performance of major subcontractors, unusual weather conditions and unexpected changes in material costs. These factors may result in revisions to costs and income and are recognized in the period in which the revisions to costs and revenues become known. Provisions for estimated losses on uncompleted drilling and infrastructure services contracts are made in the period in which they become known. Large changes in cost estimates on larger, more complex drilling and infrastructure services projects can have a material impact on the consolidated financial statements and are reflected in the results of operations when they become known; smaller contracts or smaller changes in estimates usually do not have a material impact on the consolidated financial statements.
The nature of accounting for contracts is such that refinements of the estimating process for changing conditions and new developments are continuous and characteristic of the process. Prior to the execution of a contract, any related costs are expensed during the period incurred. Generally during the early stages of a contract, cost estimates relating to purchases of materials and subcontractors can be subject to revisions. As a contract moves into the most productive phase of execution, change orders, project cost estimate revisions and claims are frequently the sources for changes in estimates. During the contract’s final phase, remaining estimated costs to complete or provisions for claims will be closed out and adjusted based on actual costs incurred. The impact on operating margin in a reporting period and future periods from a change in estimate will depend on the stage of contract completion. Generally, if the contract is at an early stage of completion, the current period impact is smaller than if the same change in estimate is made to the contract at a later stage of completion.
Revenues are recognized on large, long-term drilling and infrastructure services contracts meeting the criteria of ASC Topic 605-35 using the percentage of completion method based upon the ratio of costs incurred to total estimated costs at completion. Most of our contracts which utilize the percentage of completion method of revenue recognition have terms of six months to four years. Contract price and cost estimates are reviewed periodically as work progresses and adjustments proportionate to the percentage of completion are reflected in contract revenues in the reporting period when such estimate revisions become known. When the estimate on a contract indicates a loss, the entire loss is recorded during the accounting period in which it becomes known. In the ordinary course of business, management prepares updated estimates of the total forecasted revenue, cost and profit or loss for each contract. The cumulative effects of these updated estimates are reflected in the period in which they become known. The financial impact of any revisions to an individual contract is a function of the amount of the revision and the percentage of completion of the contract itself. An amount up to the costs that have been incurred involving unapproved change orders and claims is included in the total estimated revenue when the realization is probable. The amount of unapproved change orders and claim revenues is included in our Consolidated Balance Sheets as part of costs and estimated earnings in excess of billings. Any profit as a result of change orders or claims is recorded in the period in which the change order or claim is resolved.
41
Management focuses on evaluating the performance of contracts individually. In the ordinary course of business and at a minimum on a quarterly basis, based on changes in facts, such as an approved scope change or a change in estimate, projected total contract revenue, cost and profit or loss for each of our contracts is updated. Normal recurring changes in estimates include, but are not limited to:
|
|
• |
changes in estimated scope as a result of unapproved or unpriced customer change orders; |
|
|
• |
changes in estimated productivity assumptions based on experience to date; |
|
|
• |
changes in estimated materials costs based on experience to date; |
|
|
• |
changes in estimated subcontractor costs based on subcontractor experience; and |
|
|
• |
changes in the timing of scheduled work that may impact future costs. |
When determining the likelihood of recovering unapproved change orders and claims, we consider the history and experience of similar projects and apply judgment to estimate the amount of eventual recovery. Settlement of events such as these can take several years depending on how easily the claim is able to be resolved with the customer or whether arbitration or litigation is necessary to reach settlement. As new facts become known, an adjustment to the estimated recovery is made and reflected in the period in which it becomes known.
The cumulative effect of revisions in estimates of the total revenues and costs, including unapproved change orders and claims, during the course of the work is reflected in the accounting period in which the facts that caused the revisions become known. The financial impact of these revisions to any one contract is a function of both the amount of the revision and the percentage of completion of the contract.
There were no material change orders during the fiscal years ended January 31, 2018, 2017 and 2016. There were no material contract penalties, claims, settlements or changes in contract estimates during the fiscal years ended January 31, 2018, 2017 and 2016. No amounts were netted in revenue during the fiscal years ended January 31, 2018, 2017 and 2016.
We have provided for all estimated costs to complete on all of the ongoing contracts. However, it is possible that current estimates could change due to unforeseen events, which could result in adjustments to overall contract costs. Variances from estimated contract performance could result in material adjustments to operating results for any fiscal quarter or year. For all contracts, if a current estimate of total contract cost indicates a loss, the projected loss is recognized in full when such losses become known. During the fiscal years ended January 31, 2018, 2017 and 2016, approximately $6.3 million, $9.8 million and $2.9 million in losses on open contracts were recorded, respectively. The current provision for loss contracts was $0.7 million and $1.9 million as of January 31, 2018 and 2017, respectively. Further, as of January 31, 2018, there were no contracts, individually, that could be reasonably estimated to be in a material loss position in the future.
Costs and estimated earnings in excess of billings represents the excess of contract costs and contract revenue recognized to date on the percentage of completion accounting method over contract billings to date. Costs and estimated earnings in excess of billings occur when:
|
|
• |
costs related to unapproved change orders or claims are incurred, or |
|
|
• |
a portion of the revenue recorded cannot be billed currently due to the billing terms in the contract. |
As allowed by ASC Topic 605-35, revenue is recognized on smaller, short-term drilling and infrastructure services contracts using the completed contract method. Our contracts which utilize the completed contract method of revenue recognition have contract terms of twelve months or less. We consider contracts such as these completed upon acceptance by the customer.
Contracts for mineral drilling services within Mineral Services are billable based on the quantity of drilling performed. Revenues are recognized in terms of the value of total work performed to date on the basis of actual footage or meterage drilled.
42
The percentage of our revenues recognized by percentage of completion, mineral drilling services and completed contract to total revenues for each of the fiscal years as presented in the Consolidated Statements of Operations are:
|
|
|
January 31, |
|
|
January 31, |
|
|
January 31, |
|
|
Approximate Percentage of Total Revenue |
|
2018 |
|
|
2017 |
|
|
2016 |
|
|
Percentage of Completion |
|
62 |
% |
|
67 |
% |
|
72 |
% |
|
Mineral Drilling Services |
|
21 |
|
|
14 |
|
|
11 |
|
|
Completed Contract |
|
17 |
|
|
19 |
|
|
17 |
|
|
Total Revenue |
|
100 |
% |
|
100 |
% |
|
100 |
% |
|
|
|
|
|
|
|
|
|
|
|
Impairment of Other Long-lived Assets and Equity Method Investments – We review the carrying value of other long-lived assets and equity method investments whenever events or changes in circumstances indicate that such carrying values may not be recoverable.
Other Long-Lived Assets
Long-lived assets, including amortizable intangible assets are reviewed for recoverability whenever events or changes in circumstances indicate that the carrying amount of an asset may not be recoverable. Factors management considers important which could trigger an impairment review include but are not limited to the following:
|
|
• |
significant underperformance of our assets; |
|
|
• |
significant changes in the use of the assets; and |
|
|
• |
significant negative industry or economic trends. |
An impairment loss is recognized when the carrying amount of a long-lived asset is not recoverable and exceeds its fair value. The carrying amount of a long-lived asset is not recoverable if it exceeds the sum of the undiscounted cash flows expected to result from the use and eventual disposition of the asset. An impairment loss shall be measured as the amount by which the carrying amount of a long-lived asset exceeds its fair value, which is generally calculated using a combination of market, comparable transaction, third party quoted prices or asset appraisals and discounted cash flow approaches.
During the fiscal year ended January 31, 2016, as a result of our decision to exit our operations in Africa and Australia, we performed an assessment of property and equipment located in these locations. Based on our assessment, property and equipment in Africa and Australia with carrying value of $10.4 million was adjusted to reflect its estimated fair value of $6.5 million, resulting in a charge of approximately $3.9 million recorded as part of restructuring costs in the Consolidated Statement of Operations during the fiscal year ended January 31, 2016. Additionally, during the fiscal year ended January 31, 2017, we reviewed the recoverability of those assets held for sale in Australia and recorded an additional charge of $12.9 million as part of restructuring costs in the Consolidated Statement of Operations to adjust the carrying values of the assets held for sale to estimated fair values less costs to sell. In calculating the impairment, the carrying amount of the assets included the cumulative currency translation adjustment related to our Australian and African entities. The fair value of the assets was determined based on available third-party quoted prices and appraisals of assets.
During the fiscal year ended January 31, 2018, we reviewed the recoverability of the asset values of our long-lived assets in our Water Resources segment. Based on our analysis, the sum of the undiscounted cash flows expected from the use and eventual disposal of the assets at the end of their useful life exceeded the carrying value of the assets in the respective segments and no indication of impairment was identified.
Prior to the segment realignment in the third quarter of the fiscal year ended January 31, 2016, we reviewed the recoverability of the asset values of our long-lived assets in the Energy Services segment as of July 31, 2015. Using the undiscounted cash flow model, we concluded that the carrying value of the assets in the Energy Services was not fully recoverable as of July 31, 2015. We performed an assessment of the fair value of the assets of Energy Services based on orderly liquidation value of the property and equipment. This assessment resulted in the recording of an impairment charge of approximately $4.6 million, which is shown as impairment charges in the Consolidated Statements of Operations for the fiscal year ended January 31, 2016.
43
Equity Method Investments
We evaluate our equity method investments for impairment at least annually or when events or changes in circumstances indicate there is a loss in value of the investment that is other than a temporary decline. We performed a qualitative assessment to determine the existence of events and circumstances that would lead to a determination that a triggering event occurred that would indicate a loss in value of the investment. If such a conclusion is reached, then we would be required to perform a quantitative impairment assessment over the value of our investments. However if the assessment leads to a determination that the fair value of the investments is greater than the carrying amount, no further assessments are required. With the improving market condition for the minerals market, strong earnings and continued payment of dividends by our equity affiliates, we determined no triggering event had occurred that would indicate a loss in the value of our equity method investments as of January 31, 2018. The investment in affiliates balance as of January 31, 2018 was $53.3 million.
The principal market risks to which Layne is exposed are interest rate risk on variable rate debt and foreign exchange rate risk that could give rise to translation and transaction gains and losses.
Interest Rate Risk
We centrally manage our debt portfolio considering overall financing strategies and tax consequences. A description of the debt is included in Note 8 to the Consolidated Financial Statements in this Form 10-K. As of January 31, 2018 an instantaneous change in interest rates of one percentage point would impact the annual interest expense by approximately $1.7 million.
Foreign Currency Risk
Operating in international markets involves exposure to possible volatile movements in currency exchange rates. Our primary international operations are in Mexico, Canada and Brazil. The operations are described in Notes 1 and 5 to the Consolidated Financial Statements. Our affiliates also operate in Latin America (see Note 5 to the Consolidated Financial Statements). The majority of the contracts in Mexico are U.S. dollar-based, providing a natural reduction in exposure to currency fluctuations. As a result, we have historically not hedged our foreign currency exchange risk. As of January 31, 2018, we do not have any outstanding foreign currency option contracts.
As foreign currency exchange rates change, translation of the income statements of the international operations into U.S. dollars may affect year-to-year comparability of operating results. We estimate that a ten percent change in foreign exchange rates would impact income (loss) before income taxes by approximately $0.1 million, $0.3 million and $0.9 million for the fiscal years ended January 31, 2018, 2017 and 2016, respectively. This quantitative measure has inherent limitations, as it does not take into account any governmental actions, changes in customer purchasing patterns or changes in our financing and operating strategies.
44
Index to Consolidated Financial Statements and Financial Statement Schedule
All other schedules have been omitted because they are not applicable or not required as the required information is included in the Consolidated Financial Statements or the notes thereto.
45
Report of Independent Registered Public Accounting Firm
To the Board of Directors and Stockholders of
Layne Christensen Company
Opinion on the Financial Statements
We have audited the accompanying consolidated balance sheets of Layne Christensen Company and subsidiaries (the “Company”) as of January 31, 2018 and 2017, and the related consolidated statements of operations, comprehensive loss, equity, and cash flows for each of the three years in the period ended January 31, 2018 and the related notes and financial statement schedule listed in the Index at Item 8 (collectively referred to as the "financial statements"). In our opinion, such financial statements present fairly, in all material respects, the financial position of Layne Christensen Company and subsidiaries as of January 31, 2018 and 2017, and the results of their operations and their cash flows for each of the three years in the period ended January 31, 2018, in conformity with accounting principles generally accepted in the United States of America.
We have also audited, in accordance with the standards of the Public Company Accounting Oversight Board (United States) (PCAOB), the Company's internal control over financial reporting as of January 31, 2018 based on the criteria established in Internal Control — Integrated Framework (2013) issued by the Committee of Sponsoring Organizations of the Treadway Commission and our report dated April 10, 2018 expressed an unqualified opinion on the Company's internal control over financial reporting.
Basis for Opinion
These financial statements are the responsibility of the Company's management. Our responsibility is to express an opinion on the financial statements based on our audits. We are a public accounting firm registered with the PCAOB and are required to be independent with respect to the Company in accordance with the U.S. federal securities laws and the applicable rules and regulations of the Securities and Exchange Commission and the PCAOB.
We conducted our audits in accordance with the standards of the PCAOB. Those standards require that we plan and perform the audit to obtain reasonable assurance about whether the financial statements are free of material misstatement, whether due to error or fraud. Our audits included performing procedures to assess the risks of material misstatement of the financial statements, whether due to error or fraud, and performing procedures that respond to those risks. Such procedures included examining, on a test basis, evidence regarding the amounts and disclosures in the financial statements. Our audits also included evaluating the accounting principles used and significant estimates made by management, as well as evaluating the overall presentation of the financial statements. We believe that our audits provide a reasonable basis for our opinion.
/s/ DELOITTE & TOUCHE LLP
Houston, Texas
April 10, 2018
We have served as the Company's auditor since at least 1990; however, the specific date has not been determined.
46
LAYNE CHRISTENSEN COMPANY AND SUBSIDIARIES
|
|
|
January 31, |
|
|
January 31, |
|
||
|
(in thousands) |
|
2018 |
|
|
2017 |
|
||
|
ASSETS |
|
|
|
|
|
|
|
|
|
Current assets: |
|
|
|
|
|
|
|
|
|
Cash and cash equivalents |
|
$ |
32,041 |
|
|
$ |
69,000 |
|
|
Customer receivables, less allowance of $2,084 and $3,198, respectively |
|
|
59,558 |
|
|
|
57,252 |
|
|
Costs and estimated earnings in excess of billings on uncompleted contracts |
|
|
44,987 |
|
|
|
48,623 |
|
|
Inventories |
|
|
20,020 |
|
|
|
18,697 |
|
|
Other |
|
|
11,915 |
|
|
|
16,751 |
|
|
Current assets of discontinued operations |
|
|
— |
|
|
|
40,160 |
|
|
Total current assets |
|
|
168,521 |
|
|
|
250,483 |
|
|
Property and equipment, net |
|
|
120,604 |
|
|
|
96,985 |
|
|
Other assets: |
|
|
|
|
|
|
|
|
|
Investment in affiliates |
|
|
53,325 |
|
|
|
55,290 |
|
|
Goodwill |
|
|
8,915 |
|
|
|
8,915 |
|
|
Other intangible assets, net |
|
|
3,844 |
|
|
|
1,779 |
|
|
Restricted deposits - long-term |
|
|
6,572 |
|
|
|
5,055 |
|
|
Other |
|
|
8,408 |
|
|
|
11,514 |
|
|
Other assets of discontinued operations |
|
|
— |
|
|
|
6,130 |
|
|
Total other assets |
|
|
81,064 |
|
|
|
88,683 |
|
|
Total assets |
|
$ |
370,189 |
|
|
$ |
436,151 |
|
|
|
|
|
|
|
|
|
|
|
|
LIABILITIES AND EQUITY |
|
|
|
|
|
|
|
|
|
Current liabilities: |
|
|
|
|
|
|
|
|
|
Current maturities of long-term debt |
|
$ |
67,293 |
|
|
$ |
9 |
|
|
Accounts payable |
|
|
42,330 |
|
|
|
41,146 |
|
|
Billings in excess of costs and estimated earnings on uncompleted contracts |
|
|
10,563 |
|
|
|
19,160 |
|
|
Other current liabilities |
|
|
53,044 |
|
|
|
64,043 |
|
|
Current liabilities of discontinued operations |
|
|
— |
|
|
|
20,580 |
|
|
Total current liabilities |
|
|
173,230 |
|
|
|
144,938 |
|
|
Noncurrent liabilities: |
|
|
|
|
|
|
|
|
|
Long-term debt |
|
|
98,769 |
|
|
|
162,346 |
|
|
Self-insurance reserve |
|
|
11,464 |
|
|
|
15,647 |
|
|
Deferred income taxes |
|
|
769 |
|
|
|
4,199 |
|
|
Other |
|
|
28,404 |
|
|
|
26,753 |
|
|
Total noncurrent liabilities |
|
|
139,406 |
|
|
|
208,945 |
|
|
Commitments and contingencies |
|
|
|
|
|
|
|
|
|
Equity: |
|
|
|
|
|
|
|
|
|
Common stock, par value $.01 per share, 60,000 shares authorized, 19,917 and 19,805 shares issued and outstanding, respectively |
|
|
199 |
|
|
|
198 |
|
|
Capital in excess of par value |
|
|
372,049 |
|
|
|
369,160 |
|
|
Accumulated deficit |
|
|
(296,131 |
) |
|
|
(268,820 |
) |
|
Accumulated other comprehensive loss |
|
|
(18,612 |
) |
|
|
(18,318 |
) |
|
Total Layne Christensen equity |
|
|
57,505 |
|
|
|
82,220 |
|
|
Noncontrolling interests |
|
|
48 |
|
|
|
48 |
|
|
Total equity |
|
|
57,553 |
|
|
|
82,268 |
|
|
Total liabilities and equity |
|
$ |
370,189 |
|
|
$ |
436,151 |
|
See Notes to Consolidated Financial Statements.
47
LAYNE CHRISTENSEN COMPANY AND SUBSIDIARIES
CONSOLIDATED STATEMENTS OF OPERATIONS
|
|
|
Years Ended January 31, |
|
|||||||||
|
(in thousands, except per share data) |
|
2018 |
|
|
2017 |
|
|
2016 |
|
|||
|
Revenues |
|
$ |
475,517 |
|
|
$ |
464,783 |
|
|
$ |
518,105 |
|
|
Cost of revenues (exclusive of depreciation, amortization and impairment charges shown below) |
|
|
(374,761 |
) |
|
|
(382,101 |
) |
|
|
(419,867 |
) |
|
Selling, general and administrative expenses (exclusive of depreciation, amortization and impairment charges shown below) |
|
|
(74,428 |
) |
|
|
(76,586 |
) |
|
|
(89,176 |
) |
|
Depreciation and amortization |
|
|
(26,701 |
) |
|
|
(25,302 |
) |
|
|
(30,092 |
) |
|
Gain on sale of fixed assets |
|
|
3,741 |
|
|
|
3,886 |
|
|
|
507 |
|
|
Impairment charges |
|
|
— |
|
|
|
— |
|
|
|
(4,598 |
) |
|
Equity in earnings (losses) of affiliates |
|
|
3,431 |
|
|
|
2,655 |
|
|
|
(612 |
) |
|
Restructuring costs |
|
|
(4,903 |
) |
|
|
(16,924 |
) |
|
|
(9,189 |
) |
|
Gain on extinguishment of debt |
|
|
— |
|
|
|
— |
|
|
|
4,236 |
|
|
Interest expense |
|
|
(17,120 |
) |
|
|
(16,883 |
) |
|
|
(18,011 |
) |
|
Other (expense) income, net |
|
|
(15 |
) |
|
|
843 |
|
|
|
1,082 |
|
|
Loss from continuing operations before income taxes |
|
|
(15,239 |
) |
|
|
(45,629 |
) |
|
|
(47,615 |
) |
|
Income tax benefit (expense) |
|
|
10,375 |
|
|
|
(1,420 |
) |
|
|
(737 |
) |
|
Net loss from continuing operations |
|
|
(4,864 |
) |
|
|
(47,049 |
) |
|
|
(48,352 |
) |
|
Net (loss) income from discontinued operations |
|
|
(22,447 |
) |
|
|
(5,187 |
) |
|
|
3,547 |
|
|
Net loss |
|
|
(27,311 |
) |
|
|
(52,236 |
) |
|
|
(44,805 |
) |
|
Net loss attributable to noncontrolling interests |
|
|
— |
|
|
|
— |
|
|
|
28 |
|
|
Net loss attributable to Layne Christensen Company |
|
$ |
(27,311 |
) |
|
$ |
(52,236 |
) |
|
$ |
(44,777 |
) |
|
|
|
|
|
|
|
|
|
|
|
|
|
|
|
Loss per share information attributable to |
|
|
|
|
|
|
|
|
|
|
|
|
|
Layne Christensen Company shareholders: |
|
|
|
|
|
|
|
|
|
|
|
|
|
Loss per share from continuing operations - basic and diluted |
|
$ |
(0.24 |
) |
|
$ |
(2.38 |
) |
|
$ |
(2.45 |
) |
|
(Loss) income per share from discontinued operations - basic and diluted |
|
|
(1.13 |
) |
|
|
(0.26 |
) |
|
|
0.18 |
|
|
Loss per share - basic and diluted |
|
$ |
(1.37 |
) |
|
$ |
(2.64 |
) |
|
$ |
(2.27 |
) |
|
|
|
|
|
|
|
|
|
|
|
|
|
|
|
Weighted average shares outstanding - basic and dilutive |
|
|
19,858 |
|
|
|
19,786 |
|
|
|
19,730 |
|
|
|
|
|
|
|
|
|
|
|
|
|
|
|
See Notes to Consolidated Financial Statements.
48
LAYNE CHRISTENSEN COMPANY AND SUBSIDIARIES
CONSOLIDATED STATEMENTS OF COMPREHENSIVE LOSS
|
|
|
Years Ended January 31, |
|
|||||||||
|
(in thousands) |
|
2018 |
|
|
2017 |
|
|
2016 |
|
|||
|
Net loss |
|
$ |
(27,311 |
) |
|
$ |
(52,236 |
) |
|
$ |
(44,805 |
) |
|
Other comprehensive (loss) income: |
|
|
|
|
|
|
|
|
|
|
|
|
|
Change in cumulative foreign currency translation adjustment (net of taxes of $0 for all years presented) |
|
|
(294 |
) |
|
|
2,257 |
|
|
|
(3,348 |
) |
|
Other comprehensive (loss) income: |
|
|
(294 |
) |
|
|
2,257 |
|
|
|
(3,348 |
) |
|
Comprehensive loss |
|
|
(27,605 |
) |
|
|
(49,979 |
) |
|
|
(48,153 |
) |
|
Comprehensive income attributable to noncontrolling interests (all attributable to net income) |
|
|
— |
|
|
|
— |
|
|
|
28 |
|
|
Comprehensive loss attributable to Layne Christensen Company |
|
$ |
(27,605 |
) |
|
$ |
(49,979 |
) |
|
$ |
(48,125 |
) |
|
|
|
|
|
|
|
|
|
|
|
|
|
|
See Notes to Consolidated Financial Statements.
49
LAYNE CHRISTENSEN COMPANY AND SUBSIDIARIES
CONSOLIDATED STATEMENTS OF EQUITY
|
|
|
|
|
|
|
|
|
|
|
|
|
|
|
|
|
|
|
|
|
|
|
|
|
|
|
|
|
|
|
|
|
|
|
|
|
|
|
|
|
|
|
|
|
Capital In |
|
|
|
|
|
|
Accumulated Other |
|
|
Total Layne |
|
|
|
|
|
|
|
|
|
|||
|
|
|
Common Stock |
|
|
Excess of |
|
|
Accumulated |
|
|
Comprehensive |
|
|
Christensen |
|
|
Noncontrolling |
|
|
|
|
|
||||||||||
|
(in thousands, except share data) |
|
Shares |
|
|
Amount |
|
|
Par Value |
|
|
Deficit |
|
|
Income (Loss) |
|
|
Equity |
|
|
Interests |
|
|
Total |
|
||||||||
|
Balance February 1, 2015 |
|
|
19,633,315 |
|
|
$ |
196 |
|
|
$ |
370,053 |
|
|
$ |
(171,807 |
) |
|
$ |
(17,227 |
) |
|
$ |
181,215 |
|
|
$ |
444 |
|
|
$ |
181,659 |
|
|
Net loss |
|
|
— |
|
|
|
— |
|
|
|
— |
|
|
|
(44,777 |
) |
|
|
— |
|
|
|
(44,777 |
) |
|
|
(28 |
) |
|
|
(44,805 |
) |
|
Other comprehensive loss |
|
|
— |
|
|
|
— |
|
|
|
— |
|
|
|
— |
|
|
|
(3,348 |
) |
|
|
(3,348 |
) |
|
|
— |
|
|
|
(3,348 |
) |
|
Issuance of nonvested restricted shares |
|
|
24,085 |
|
|
|
1 |
|
|
|
(1 |
) |
|
|
— |
|
|
|
— |
|
|
|
— |
|
|
|
— |
|
|
|
— |
|
|
Issuance of stock for vested restricted stock units |
|
|
182,563 |
|
|
|
2 |
|
|
|
(2 |
) |
|
|
— |
|
|
|
— |
|
|
|
— |
|
|
|
— |
|
|
|
— |
|
|
Shares purchased and subsequently cancelled |
|
|
(50,862 |
) |
|
|
(1 |
) |
|
|
(344 |
) |
|
|
— |
|
|
|
— |
|
|
|
(345 |
) |
|
|
— |
|
|
|
(345 |
) |
|
Extinguishment of convertible notes |
|
|
— |
|
|
|
— |
|
|
|
(8,006 |
) |
|
|
— |
|
|
|
— |
|
|
|
(8,006 |
) |
|
|
— |
|
|
|
(8,006 |
) |
|
Sale of noncontrolling interest |
|
|
— |
|
|
|
— |
|
|
|
— |
|
|
|
— |
|
|
|
— |
|
|
|
— |
|
|
|
(368 |
) |
|
|
(368 |
) |
|
Equity-based compensation |
|
|
— |
|
|
|
— |
|
|
|
3,919 |
|
|
|
— |
|
|
|
— |
|
|
|
3,919 |
|
|
|
— |
|
|
|
3,919 |
|
|
Balance, January 31, 2016 |
|
|
19,789,101 |
|
|
|
198 |
|
|
|
365,619 |
|
|
|
(216,584 |
) |
|
|
(20,575 |
) |
|
|
128,658 |
|
|
|
48 |
|
|
|
128,706 |
|
|
|
|
|
|
|
|
|
|
|
|
|
|
|
|
|
|
|
|
|
|
|
|
|
|
|
|
|
|
|
|
|
|
|
|
Net loss |
|
|
— |
|
|
|
— |
|
|
|
— |
|
|
|
(52,236 |
) |
|
|
— |
|
|
|
(52,236 |
) |
|
|
— |
|
|
|
(52,236 |
) |
|
Other comprehensive income |
|
|
— |
|
|
|
— |
|
|
|
— |
|
|
|
— |
|
|
|
2,257 |
|
|
|
2,257 |
|
|
|
— |
|
|
|
2,257 |
|
|
Issuance of nonvested restricted shares |
|
|
13,495 |
|
|
|
— |
|
|
|
— |
|
|
|
— |
|
|
|
— |
|
|
|
— |
|
|
|
— |
|
|
|
— |
|
|
Issuance of stock for vested restricted stock units |
|
|
2,264 |
|
|
|
— |
|
|
|
— |
|
|
|
— |
|
|
|
— |
|
|
|
— |
|
|
|
— |
|
|
|
— |
|
|
Shares purchased and subsequently cancelled |
|
|
(334 |
) |
|
|
— |
|
|
|
(3 |
) |
|
|
— |
|
|
|
— |
|
|
|
(3 |
) |
|
|
— |
|
|
|
(3 |
) |
|
Equity-based compensation |
|
|
— |
|
|
|
— |
|
|
|
3,544 |
|
|
|
— |
|
|
|
— |
|
|
|
3,544 |
|
|
|
— |
|
|
|
3,544 |
|
|
Balance January 31, 2017 |
|
|
19,804,526 |
|
|
|
198 |
|
|
|
369,160 |
|
|
|
(268,820 |
) |
|
|
(18,318 |
) |
|
|
82,220 |
|
|
|
48 |
|
|
|
82,268 |
|
|
|
|
|
|
|
|
|
|
|
|
|
|
|
|
|
|
|
|
|
|
|
|
|
|
|
|
|
|
|
|
|
|
|
|
Net loss |
|
|
— |
|
|
|
— |
|
|
|
— |
|
|
|
(27,311 |
) |
|
|
— |
|
|
|
(27,311 |
) |
|
|
— |
|
|
|
(27,311 |
) |
|
Other comprehensive loss |
|
|
— |
|
|
|
— |
|
|
|
— |
|
|
|
— |
|
|
|
(294 |
) |
|
|
(294 |
) |
|
|
— |
|
|
|
(294 |
) |
|
Issuance of stock for vested restricted stock units |
|
|
128,042 |
|
|
|
1 |
|
|
|
(1 |
) |
|
|
— |
|
|
|
— |
|
|
|
— |
|
|
|
— |
|
|
|
— |
|
|
Shares purchased and subsequently cancelled |
|
|
(40,525 |
) |
|
|
— |
|
|
|
(406 |
) |
|
|
— |
|
|
|
— |
|
|
|
(406 |
) |
|
|
— |
|
|
|
(406 |
) |
|
Issuance of stock upon exercise of options |
|
|
25,000 |
|
|
|
— |
|
|
|
206 |
|
|
|
— |
|
|
|
— |
|
|
|
206 |
|
|
|
— |
|
|
|
206 |
|
|
Equity-based compensation |
|
|
— |
|
|
|
— |
|
|
|
3,090 |
|
|
|
— |
|
|
|
— |
|
|
|
3,090 |
|
|
|
— |
|
|
|
3,090 |
|
|
Balance January 31, 2018 |
|
|
19,917,043 |
|
|
$ |
199 |
|
|
$ |
372,049 |
|
|
$ |
(296,131 |
) |
|
$ |
(18,612 |
) |
|
$ |
57,505 |
|
|
$ |
48 |
|
|
$ |
57,553 |
|
|
|
|
|
|
|
|
|
|
|
|
|
|
|
|
|
|
|
|
|
|
|
|
|
|
|
|
|
|
|
|
|
|
|
See Notes to Consolidated Financial Statements.
50
LAYNE CHRISTENSEN COMPANY AND SUBSIDIARIES
CONSOLIDATED STATEMENTS OF CASH FLOWS
|
|
|
Years Ended January 31, |
|
|||||||||
|
(in thousands) |
|
2018 |
|
|
2017 |
|
|
2016 |
|
|||
|
Cash flows from operating activities: |
|
|
|
|
|
|
|
|
|
|
|
|
|
Net loss |
|
$ |
(27,311 |
) |
|
$ |
(52,236 |
) |
|
$ |
(44,805 |
) |
|
Adjustments to reconcile net loss to cash flows from operations: |
|
|
|
|
|
|
|
|
|
|
|
|
|
Depreciation and amortization |
|
|
26,988 |
|
|
|
26,911 |
|
|
|
35,925 |
|
|
Impairment charges |
|
|
— |
|
|
|
— |
|
|
|
4,598 |
|
|
Bad debt expense |
|
|
1,716 |
|
|
|
1,900 |
|
|
|
5,090 |
|
|
Loss (gain) on sale of discontinued operations |
|
|
19,025 |
|
|
|
— |
|
|
|
(7,803 |
) |
|
Write-off of note receivable relating to discontinued operations |
|
|
— |
|
|
|
— |
|
|
|
3,180 |
|
|
Deferred income taxes |
|
|
(3,405 |
) |
|
|
(646 |
) |
|
|
(7,237 |
) |
|
Equity-based compensation |
|
|
3,090 |
|
|
|
3,544 |
|
|
|
3,919 |
|
|
Amortization of discount and deferred financing costs |
|
|
4,524 |
|
|
|
4,217 |
|
|
|
5,143 |
|
|
Gain on extinguishment of debt |
|
|
— |
|
|
|
— |
|
|
|
(4,236 |
) |
|
Equity in earnings of affiliates |
|
|
(3,431 |
) |
|
|
(2,655 |
) |
|
|
(492 |
) |
|
Dividends received from affiliates |
|
|
5,304 |
|
|
|
4,941 |
|
|
|
4,568 |
|
|
Restructuring activities |
|
|
— |
|
|
|
12,878 |
|
|
|
5,115 |
|
|
Write-down of inventory |
|
|
— |
|
|
|
— |
|
|
|
7,905 |
|
|
Gain on sale of fixed assets |
|
|
(3,740 |
) |
|
|
(4,151 |
) |
|
|
(996 |
) |
|
Changes in assets and liabilities: |
|
|
|
|
|
|
|
|
|
|
|
|
|
Customer receivables |
|
|
(372 |
) |
|
|
19,113 |
|
|
|
2,071 |
|
|
Costs and estimated earnings in excess |
|
|
|
|
|
|
|
|
|
|
|
|
|
of billings on uncompleted contracts |
|
|
2,606 |
|
|
|
17,382 |
|
|
|
(1,348 |
) |
|
Inventories |
|
|
(1,338 |
) |
|
|
1,306 |
|
|
|
382 |
|
|
Other current assets |
|
|
5,859 |
|
|
|
(1,585 |
) |
|
|
8,879 |
|
|
Accounts payable and accrued expenses |
|
|
(13,563 |
) |
|
|
(16,507 |
) |
|
|
(10,305 |
) |
|
Billings in excess of costs and |
|
|
|
|
|
|
|
|
|
|
|
|
|
estimated earnings on uncompleted contracts |
|
|
(6,785 |
) |
|
|
(1,468 |
) |
|
|
(9,952 |
) |
|
Other, net |
|
|
(2,157 |
) |
|
|
831 |
|
|
|
(1,387 |
) |
|
Cash provided by (used in) operating activities |
|
|
7,010 |
|
|
|
13,775 |
|
|
|
(1,786 |
) |
|
Cash flows from investing activities: |
|
|
|
|
|
|
|
|
|
|
|
|
|
Capital expenditures |
|
|
(49,876 |
) |
|
|
(21,818 |
) |
|
|
(25,668 |
) |
|
Proceeds from sale of fixed assets |
|
|
3,988 |
|
|
|
9,962 |
|
|
|
6,505 |
|
|
Proceeds from sale of business, net of cash divested |
|
|
3,468 |
|
|
|
— |
|
|
|
42,348 |
|
|
Investment in foreign affiliate |
|
|
(25 |
) |
|
|
— |
|
|
|
— |
|
|
Cash (used in) provided by investing activities |
|
|
(42,445 |
) |
|
|
(11,856 |
) |
|
|
23,185 |
|
|
Cash flows from financing activities: |
|
|
|
|
|
|
|
|
|
|
|
|
|
Repayments under revolving loan facilities |
|
|
— |
|
|
|
— |
|
|
|
(22,039 |
) |
|
Proceeds from issuance of long term convertible notes |
|
|
— |
|
|
|
— |
|
|
|
49,950 |
|
|
Payment of debt issuance costs |
|
|
— |
|
|
|
(9 |
) |
|
|
(5,486 |
) |
|
Principal payments under capital lease obligation |
|
|
(30 |
) |
|
|
(65 |
) |
|
|
(154 |
) |
|
Issuance of stock upon exercise of options |
|
|
206 |
|
|
|
— |
|
|
|
— |
|
|
Purchases and retirement of Company shares |
|
|
(406 |
) |
|
|
(3 |
) |
|
|
(345 |
) |
|
Cash (used in) provided by financing activities |
|
|
(230 |
) |
|
|
(77 |
) |
|
|
21,926 |
|
|
Effects of exchange rate changes on cash |
|
|
223 |
|
|
|
(1,074 |
) |
|
|
(75 |
) |
|
Net (decrease) increase in cash, cash equivalents and restricted deposits |
|
|
(35,442 |
) |
|
|
768 |
|
|
|
43,250 |
|
|
Cash, cash equivalents and restricted deposits at beginning of year |
|
|
74,055 |
|
|
|
73,287 |
|
|
|
30,037 |
|
|
Cash, cash equivalents and restricted deposits at end of year |
|
$ |
38,613 |
|
|
$ |
74,055 |
|
|
$ |
73,287 |
|
|
|
|
|
|
|
|
|
|
|
|
|
|
|
See Notes to Consolidated Financial Statements.
51
Notes to Consolidated Financial Statements
(1) Summary of Significant Accounting Policies
Description of Business – Layne Christensen Company and its subsidiaries (together, “Layne,” the “Company,” “we,” “our,” or “us”) is a global water management, drilling and infrastructure services and drilling company, providing responsible solutions to the world of essential natural resources – water, minerals and energy. We offer innovative, sustainable products and services with an enduring commitment to safety, excellence and integrity. We primarily operate in North America, Brazil and through our affiliates in Latin America. Our customers include government agencies, investor-owned utilities, industrial companies, global mining companies, consulting engineering firms, oil and gas companies, power companies and agribusinesses. We have an ownership interest in certain foreign affiliates operating in Latin America (see Note 5 to the Consolidated Financial Statements).
Fiscal Year – Our fiscal year end is January 31. References to fiscal years, or “FY,” are to the twelve months then ended January 31 of that year.
Principles of Consolidation – The Consolidated Financial Statements include our accounts and the accounts of all of our subsidiaries where we exercise control. For investments in subsidiaries that are not wholly-owned, but where we exercise control, the equity held by the minority owners and their portions of net income (loss) are reflected as noncontrolling interests. All intercompany accounts and transactions have been eliminated in consolidation. In the Notes to Consolidated Financial Statements, all dollar and share amounts in tabulations are in thousands of dollars and shares, respectively, unless otherwise indicated.
Investment in Affiliated Companies – Investments in affiliates (20% to 50% owned) in which we have the ability to exercise significant influence, but do not hold a controlling interest over operating and financial policies, are accounted for by the equity method. We performed a qualitative assessment to determine the existence of events and circumstances that would lead to a determination that a triggering event occurred that would indicate a loss in value of the investment. If such a conclusion is reached, then we would be required to perform a quantitative impairment assessment over the value of our investments. However if the assessment leads to a determination that the fair value of the investments is greater than the carrying amount, no further assessments are required. During the fiscal year ended January 31, 2017, we performed a quantitative assessment. As of January 31, 2018, we performed a qualitative assessment and concluded no triggering events had occurred that would indicate a loss in value. Accordingly, no impairment charge was recorded in either year. Distributions from our equity method investees are accounted for using the cumulative earnings approach on our Consolidated Statement of Cash Flows. Distributions received are considered returns on investment and classified as cash inflows from operating activities, unless the investor’s cumulative distribution received less distributions received in prior periods that were determined to be returns of investment exceed cumulative equity in earnings recognized by the investor. When such an excess occurs, the current-period distribution up to this excess is considered a return on investment and classified as cash inflows from operating activities.
Presentation – As discussed further in Note 16 to the Consolidated Financial Statements, during the first quarter of FY2018, we completed the sale of substantially all of the assets of our Heavy Civil businesses and during the third quarter of fiscal year ended January 31, 2016, we completed the sale of our Geoconstruction business segment. The results of operations related to the Heavy Civil and Geoconstruction business, have been classified as discontinued operations for all periods presented. Unless noted otherwise, discussion in these Notes to Consolidated Financial Statements pertain to continuing operations.
Business Segments – We report our financial results under three reporting segments consisting of Water Resources, Inliner and Mineral Services. We report corporate expenses under the title “Unallocated Corporate.” Unallocated corporate expenses primarily consist of general and administrative functions performed on a company-wide basis and benefiting all segments. These costs include expenses related to accounting, financial reporting, internal audit, treasury, legal, tax compliance, executive management and board of directors.
Use of and Changes in Estimates – The preparation of Consolidated Financial Statements in conformity with GAAP requires management to make estimates and assumptions that affect the reported amounts of assets and liabilities, disclosure of assets and liabilities at the date of the financial statements and the reported amounts of revenues and expenses during the reporting period. Estimates and assumptions about future events and their effects cannot be perceived with certainty and accordingly, these estimates may change as new events occur, as more experience is acquired, as additional information is obtained and as our operating environment changes. While we believe that the estimates and assumptions used in the preparation of the Consolidated Financial Statements are appropriate, actual results could differ from those estimates.
52
Foreign Currency Transactions and Translation – In accordance with ASC Topic 830, “Foreign Currency Matters,” gains and losses resulting from foreign currency transactions are included in the Consolidated Statements of Operations. Assets and liabilities of non-U.S. subsidiaries whose functional currency is the local currency are translated into U.S. dollars at exchange rates prevailing at the balance sheet date. The net foreign currency exchange differences resulting from these translations are reported in accumulated other comprehensive loss. Revenues and expenses are translated at average foreign currency exchange rates during the year.
The cash flows and financing activities of our operations in Mexico are primarily denominated in U.S. dollars. Accordingly, these operations use the U.S. dollar as their functional currency. Monetary assets and liabilities are remeasured at period end. Foreign currency transactions are measured at the current exchange rate and nonmonetary items are measured at historical foreign currency exchange rates with exchange rate differences reported in the Consolidated Statement of Operations.
Net foreign currency transaction losses were $0.2 million, $0.2 million and $0.1 million for the fiscal years ended January 31, 2018, 2017 and 2016, respectively, and are recorded in other (expense) income, net in the accompanying Consolidated Statements of Operations.
Revenue Recognition – Revenues are recognized on large, long-term drilling and infrastructure services contracts meeting the criteria of ASC Topic 605-35 using the percentage of completion method based upon the ratio of costs incurred to total estimated costs at completion. Contract price and cost estimates are reviewed periodically as work progresses and adjustments proportionate to the percentage of completion are reflected in contract revenues in the reporting period when such estimates are revised. The nature of accounting for these contracts using the percentage of completion method is such that refinements of the estimating process for changing conditions and new developments may occur and are characteristic of the process. Many factors can and do change during a contract performance period which can result in a change to contract profitability including differing site conditions (to the extent that contract remedies are unavailable), the availability of skilled contract labor, the performance of major material suppliers, the performance of major subcontractors, unusual weather conditions and unexpected changes in material costs. These factors may result in revisions to costs and income and are recognized in the period in which the revisions become known. Provisions for estimated losses on uncompleted drilling and infrastructure services contracts are made in the period in which such losses become known. When the estimate on a contract indicates a loss, the entire loss is recorded during the accounting period in which the facts that caused the revision become known. Management evaluates the performance of contracts on an individual basis. In the ordinary course of business, but at least quarterly, we prepare updated estimates of cost and profit or loss for each contract. The cumulative effect of revisions in estimates of the total forecasted revenue and costs, including unapproved change orders and claims, during the course of the contract is reflected in the accounting period in which the facts that caused the revision become known. Large changes in cost estimates on larger, more complex drilling and infrastructure services projects can have a material impact on our financial statements and are reflected in results of operations when they become known. During the fiscal years ended January 31, 2018, 2017 and 2016, approximately $6.3 million, $9.8 million and $2.9 million in losses on open contracts were recorded, respectively.
We record revenue on contracts relating to unapproved change orders and claims by including in revenue an amount less than or equal to the amount of the costs incurred by us to date for contract price adjustments that we seek to collect from customers for delays, errors in specifications or designs, change orders in dispute or unapproved as to scope or price, or other unanticipated additional costs, in each case when recovery of the costs is considered probable. The amount of unapproved change orders and claims revenues are included in our Consolidated Balance Sheets as part of costs and estimated earnings in excess of billings on uncompleted contracts. See Note 2 to the Consolidated Financial Statements. When determining the likelihood of eventual recovery, we consider such factors as our experience on similar projects and our experience with the customer. As new facts become known, an adjustment to the estimated recovery is made and reflected in the current period.
As allowed by ASC Topic 605-35, revenue is recognized on smaller, short-term drilling and infrastructure services contracts using the completed contract method. Provisions for estimated losses on uncompleted drilling and infrastructure services contracts are made in the period in which such losses become known and reported in cost of revenues in the Consolidated Statements of Operations. We determine when short-term contracts are completed based on acceptance by the customer.
Revenues for drilling contracts within Mineral Services are primarily recognized in terms of the value of total work performed to date on the basis of actual footage drilled, meterage drilled or services performed.
Revenues for direct sales of equipment and other ancillary products not provided in conjunction with the performance of drilling and infrastructure services contracts are recognized at the date of delivery to and acceptance by, the customer. Provisions for estimated warranty obligations are made in the period in which the sales occur.
53
Our revenues are presented net of taxes imposed on revenue-producing transactions with our customers, such as, but not limited to, sales, use, value-added and some excise taxes.
Inventories – In February 2017, we adopted Accounting Standards Update (“ASU”) 2015-11 “Inventory – Simplifying the Measurement of Inventory” issued by the Financial Accounting Standards Board (the “FASB”) on July 22, 2015, on a prospective basis. As such, our January 31, 2017 inventories are valued at the lower of cost or net realizable value and our inventories at January 31, 2017 are valued at the lower of cost or market. Implementation did not result in a material difference in our reported inventory values. Cost of U.S. inventories and the majority of foreign operations are determined using the average cost method. Inventories consist primarily of supplies and raw materials. Supplies of $17.7 million and $16.4 million and raw materials of $2.3 million and $2.3 million were included in inventories, net of reserves of $0.8 million and $0.9 million, in the Consolidated Balance Sheets as of January 31, 2018 and 2017, respectively.
As discussed in Note 18 to the Consolidated Financial Statements, as part of our restructuring activities in Africa and Australia, we recorded a write-down of inventory during fiscal year ended January 31, 2016 amounting to $7.9 million, which is included as part of cost of revenues in the Consolidated Statement of Operations.
Property and Equipment – Property and equipment (including major renewals and improvements) are recorded at cost less accumulated depreciation. Depreciation is provided using the straight-line method. The useful lives used for the items within each property classification are as follows:
|
Classification |
|
Years |
|
Buildings |
|
15 - 35 |
|
Machinery, equipment and pipeline |
|
3 - 25 |
Property and equipment are reviewed for impairment whenever events or changes in circumstances indicate that the carrying value may not be recoverable. Recoverability is evaluated by comparing the carrying value of the assets to the undiscounted associated cash flows. When this comparison indicates that the carrying value of the asset is greater than the undiscounted cash flows, a loss is recognized for the difference between the carrying value and estimated fair value. Fair value is determined based either on market quotes or appropriate valuation techniques.
See Note 4 to the Consolidated Financial Statements for a discussion of fixed asset impairments recognized during the fiscal year ended January 31, 2016.
As discussed in Note 18 to the Consolidated Financial Statements, during the fiscal year ended January 31, 2016, we implemented a plan to exit our operations in Africa and Australia. As a result of the decision, we determined that it was more likely than not that certain fixed assets will be sold or otherwise disposed of before the end of their estimated useful lives. We recorded charges of approximately $12.9 million and $3.9 million during the fiscal years ended January 31, 2017 and 2016, respectively, to adjust the carrying values of property and equipment in Africa and Australia to estimated fair values, based upon valuation information that includes available third-party quoted prices and appraisals of assets. In calculating the impairment for fiscal year ended January 31, 2017, the carrying amount of the assets included the cumulative currency translation adjustment related to our African and Australian entities. The charges are shown as part of restructuring costs in the Consolidated Statement of Operations.
We reflect property as assets held for sale when management, having the authority to approve the action, commits to a plan to sell the asset, the sale is probable within one year and the asset is available for immediate sale in its present condition. We also consider whether an active program to locate a buyer has been initiated, whether the asset is marketed actively for sale at a price that is reasonable in relation to its current fair value and whether actions required to complete the plan indicate that it is unlikely that significant changes to the plan will be made or that the plan will be withdrawn. Upon designation as asset held for sale, we record the carrying value of each asset at the lower of its carrying value or its estimated fair value, less estimated costs to sell and cease recording depreciation.
Discontinued Operations –We adopted Accounting Standards Update 2014-08, "Reporting Discontinued Operations and Disclosures of Disposals of Components of an Entity," on February 1, 2015. Under the guidance, a discontinued operation is defined as a disposal of a component or group of components that is disposed of or is classified as held for sale and represents a strategic shift that has or will have a major effect on an entity’s operations and financial results. See Note 16 to the Consolidated Financial Statements for a discussion of our discontinued operations.
54
Goodwill –In accordance with ASC Topic 350-20, “Intangibles-Goodwill and Other”, we are required to test for the impairment of goodwill on at least an annual basis. We conduct this evaluation annually as of December 31 or more frequently if events or changes in circumstances indicate that goodwill might be impaired. Our reporting units are based on our organizational and reporting structure and are the same as our three reportable segments. Corporate and other assets and liabilities are allocated to the reporting units to the extent that they relate to the operations of those reporting units in determining their carrying amount. We have the option of first performing a qualitative assessment to determine the existence of events and circumstances that would lead to a determination that it is more likely than not that the fair value of a reporting unit is less than its carrying amount. If such a conclusion is reached, then we would be required to perform a quantitative impairment assessment of goodwill. However, if the assessment leads to a determination that it is more likely than not that the fair value of a reporting unit is greater than its carrying amount, no further assessments are required. As of December 31, 2017 and 2016, we performed a qualitative assessment for our annual goodwill impairment test and determined that it was more likely than not that the fair value of Inliner, the only reporting unit with goodwill, would exceed its carrying value.
As of January 31, 2018 and 2017, we had $8.9 million of goodwill on the Consolidated Balance Sheets. The goodwill is all attributable to the Inliner reporting segment. Goodwill expected to be tax deductible was $0.9 million as of January 31, 2018 and 2017.
Intangible Assets – Other intangible assets with finite lives primarily consist of tradenames, patents and right-of-ways. Intangible assets are being amortized using the straight-line method over their estimated useful lives, which range from ten to thirty-five years.
Finite-lived intangible assets are reviewed for recoverability whenever events or changes in circumstances indicate that the carrying amount of an asset may not be recoverable.
Cash, Cash Equivalents and Restricted Deposits – We consider investments with an original maturity of three months or less when purchased to be cash equivalents. Our cash equivalents are subject to potential credit risk. Our cash management and investment policies restrict investments to investment grade, highly liquid securities. The carrying value of cash and cash equivalents approximates fair value. Restricted deposits consist of escrow funds related to a certain disposition and judicial deposits associated with tax related legal proceedings in Brazil.
Our statement of cash flows explains the change in the total of cash, cash equivalents and restricted deposits. The following table provides a reconciliation of cash, cash equivalents, and restricted deposits reported within the Consolidated Balance Sheet that sum to the total of the same such amounts in the Consolidated Statements of Cash Flows at January 31, 2018, 2017 and 2016.
|
|
|
Years Ended January 31, |
|
|||||||||
|
(in thousands) |
|
2018 |
|
|
2017 |
|
|
2016 |
|
|||
|
Beginning of the period |
|
|
|
|
|
|
|
|
|
|
|
|
|
Cash and cash equivalents |
|
$ |
69,000 |
|
|
$ |
65,569 |
|
|
$ |
21,661 |
|
|
Restricted deposits |
|
|
5,055 |
|
|
|
7,718 |
|
|
|
8,376 |
|
|
Total cash, cash equivalents and restricted deposits, beginning of period |
|
|
74,055 |
|
|
|
73,287 |
|
|
|
30,037 |
|
|
End of the period |
|
|
|
|
|
|
|
|
|
|
|
|
|
Cash and cash equivalents |
|
|
32,041 |
|
|
|
69,000 |
|
|
|
65,569 |
|
|
Restricted deposits |
|
|
6,572 |
|
|
|
5,055 |
|
|
|
7,718 |
|
|
Total cash, cash equivalents and restricted deposits, end of period |
|
|
38,613 |
|
|
|
74,055 |
|
|
|
73,287 |
|
|
Net (decrease) increase in cash, cash equivalents and restricted deposits |
|
$ |
(35,442 |
) |
|
$ |
768 |
|
|
$ |
43,250 |
|
Allowance for Uncollectible Accounts Receivable – We make ongoing estimates relating to the collectability of our accounts receivable and maintain an allowance for estimated losses resulting from the inability of our customers to make required payments. In determining the amount of the allowance, we make judgments about the creditworthiness of customers based on ongoing credit evaluations and also consider a review of accounts receivable aging, industry trends, customer financial strength, credit standing and payment history to assess the probability of collection. Bad debt expense, which is recorded as part of Selling, General and Administrative Expenses in the Consolidated Statement of Operations, amounted to $(0.2) million, $0.7 million and ($0.4) million for the fiscal years ended January 31, 2018, 2017 and 2016, respectively.
55
We do not establish an allowance for credit losses on long-term contract unbilled receivables. Adjustments to unbilled receivables related to credit quality, if they occur, are accounted for as a reduction of revenue.
Concentration of Credit Risk – We grant credit to our customers, which may include concentrations in state and local governments. Although this concentration could affect our overall exposure to credit risk, we believe that our portfolio of accounts receivable is sufficiently diversified, thus spreading the credit risk. To manage this risk, we perform periodic credit evaluations of our customers’ financial condition, including monitoring our customers’ payment history and current credit worthiness. We do not generally require collateral in support of our trade receivables, but may require payment in advance or security in the form of a letter of credit or bank guarantee. During the fiscal years ended January 31, 2018, 2017 and 2016, no individual customer accounted for more than 10% of our consolidated revenues.
Accrued Insurance – We maintain insurance programs where we are responsible for the amount of each claim up to a self-insured limit. Estimates are recorded for health and welfare, workers’ compensation, property and casualty insurance costs that are associated with these programs. These costs are estimated based in part on actuarially determined projections of future payments under these programs and include amounts incurred but not reported. Should a greater amount of claims occur compared to what was estimated or costs of the medical profession increase beyond what was anticipated, accruals recorded may not be sufficient and additional costs to the Consolidated Financial Statements could be required.
Costs estimated to be incurred in the future for employee health and welfare benefits, workers’ compensation, property and casualty insurance programs resulting from claims which have been incurred are accrued currently. Under the terms of the agreement with the various insurance carriers administering these claims, we are not required to remit the total retained risk amounts until the claims are actually paid by the insurance companies.
Fair Value of Financial Instruments – The carrying amounts of financial instruments, including cash and cash equivalents, customer receivables and accounts payable, approximated fair value at January 31, 2018 and 2017, because of the relatively short maturity of those instruments. See Note 14 to the Consolidated Financial Statements for fair value disclosures.
Litigation and Other Contingencies – We are involved in litigation incidental to our business, the disposition of which is not expected to have a material effect on our business, financial position, results of operations or cash flows. In addition, some of our contracts contain provisions that require payment of liquidated damages if we are responsible for the failure to meet specified contractual milestone dates and the applicable customer asserts a claim under these provisions. These contracts define the conditions under which our customers may make claims against Layne for liquidated damages. In many cases in which we have historically had potential exposure for liquidated damages, such damages ultimately were not asserted by our customers. It is possible, however, that future results of operations for any particular quarterly or annual period could be materially affected by changes in our assumptions related to these proceedings. If the assessment of a contingency indicates that it is probable that a material loss has been incurred and the amount of the liability can be estimated, then the estimated liability is accrued in our Consolidated Financial Statements. If the assessment indicates that a potentially material loss contingency is not probable but is reasonably possible, or is probable but cannot be estimated, then the nature of the contingent liability and an estimate of the range of possible losses, if determinable and material, is disclosed. These provisions are reviewed at least quarterly and adjusted to reflect the impacts of negotiations, settlements, rulings, advice of legal counsel and other information and events pertaining to a particular case.
Supplemental Cash Flow Information –The amounts paid or refunded for income taxes, interest and non-cash investing and financing activities were as follows:
|
|
|
Years Ended January 31, |
|
|||||||||
|
(in thousands) |
|
2018 |
|
|
2017 |
|
|
2016 |
|
|||
|
Income taxes paid |
|
$ |
1,312 |
|
|
$ |
1,555 |
|
|
$ |
1,947 |
|
|
Income tax refunds |
|
|
(4,627 |
) |
|
|
(596 |
) |
|
|
(4,251 |
) |
|
Interest paid |
|
|
12,442 |
|
|
|
12,331 |
|
|
|
11,065 |
|
|
Noncash investing and financing activities: |
|
|
|
|
|
|
|
|
|
|
|
|
|
Exchange of 4.25% Convertible Notes for 8.0% Convertible Notes |
|
|
— |
|
|
|
— |
|
|
|
55,500 |
|
|
Contingent consideration on sale of discontinued operations |
|
|
— |
|
|
|
— |
|
|
|
4,244 |
|
|
Accrued capital additions |
|
|
1,466 |
|
|
|
1,427 |
|
|
|
1,186 |
|
56
Income Taxes – Income taxes are provided using the asset and liability method, in which deferred taxes are recognized on the difference between the financial statement carrying amounts and tax bases of existing assets and liabilities. Deferred tax assets are reviewed for recoverability and valuation allowances are provided as necessary. Provision for U.S. income taxes on undistributed earnings of foreign subsidiaries and affiliates is made only on those amounts in excess of funds considered to be invested indefinitely. In general, we record income tax expense during interim periods based on our best estimate of the full year’s effective tax rate. However, income tax expense relating to adjustments to Layne’s liabilities for uncertainty in income tax positions for prior reporting periods are accounted for discretely in the interim period in which it occurs. Income tax expense relating to adjustments for current year uncertain tax positions is accounted for as a component of the adjusted annualized effective tax rate.
In assessing the need for a valuation allowance, we consider both positive and negative evidence related to the likelihood of realization of the deferred tax assets. The weight given to the positive and negative evidence is commensurate with the extent to which the evidence may be objectively verified. Accounting guidance states that a cumulative loss in recent years is a significant piece of negative evidence that is difficult to overcome in determining that a valuation allowance is not needed against deferred tax assets. As such, it is generally difficult for positive evidence regarding projected future taxable income exclusive of reversing taxable temporary differences to outweigh objective negative evidence of recent financial reporting losses. In preparing future taxable income projections, we consider the periods in which future reversals of existing taxable and deductible temporary differences are likely to occur, future taxable income, taxable income available in prior carryback years and the availability of tax-planning strategies when determining the ability to realize recorded deferred tax assets.
Our estimate of uncertainty in income taxes is based on the framework established in the accounting for income taxes guidance. We recognize the tax benefit from an uncertain tax position only if it is more likely than not that the tax position will be sustained on examination by the taxing authorities, based on the technical merits of the position. For tax positions that meet this recognition threshold, we apply judgment, taking into account applicable tax laws and experience in managing tax audits, to determine the amount of tax benefits to recognize in the financial statements. For each position, the difference between the benefit realized on our tax return and the benefit reflected in the financial statements is recorded as a liability in the Consolidated Balance Sheets. This liability is updated at each financial statement date to reflect the impacts of audit settlements and other resolution of audit issues, expiration of statutes of limitation, developments in tax law and ongoing discussions with taxing authorities.
Income (Loss) Per Share – Income (loss) per share is computed by dividing net earnings available to common shareholders by the weighted average number of common shares outstanding during the period. For periods in which we recognize losses, the calculation of diluted loss per share is the same as the calculation of basic loss per share. For periods in which we recognize net income, diluted earnings per common share is computed in the same way as basic earnings per common share except that the denominator is increased to include the number of additional common shares that would be outstanding if all potential common shares had been issued that were dilutive. Options to purchase common stock and nonvested shares are included based on the treasury stock method for dilutive earnings per share except when their effect is antidilutive. The 4.25% Convertible Notes and the 8.0% Convertible Notes (as defined in Note 8 to the Consolidated Financial Statements) are included in the calculation of diluted loss per share if their inclusion is dilutive under the if-converted method. Options to purchase 659,086, 750,044 and 839,175 shares have been excluded from weighted average shares for the fiscal years ended January 31, 2018, 2017 and 2016, respectively, as their effect was antidilutive. A total of 1,957,803, 1,871,640 and 1,407,170 non-vested shares have been excluded from weighted average shares for the fiscal years ended January 31, 2018, 2017 and 2016, respectively, as their effect was antidilutive.
Equity-Based Compensation – We recognize the cost of all equity-based instruments in the Consolidated Financial Statements based on the calculated fair value of the award. The fair value of equity-based compensation granted in the form of stock options is determined using a lattice valuation model. In addition, we granted certain market-based awards during the years ended January 31, 2018, 2017 and 2016, which were valued using the Monte Carlo simulation model. See Note 13 to the Consolidated Financial Statements.
Unearned compensation expense associated with the issuance of awards is amortized on a straight-line basis as the restrictions on the stock expire, subject to achievement of certain contingencies.
New Accounting Pronouncements -
The FASB issued ASU 2014-09, “Revenue from Contracts with Customers” on May 28, 2014 and issued the related Update 2016-20 “Technical Corrections and Improvements to Topic 606, Revenue from Contracts with Customers” in December, 2016 with the same effective dates as ASU 2014-09. On August 12, 2015, the FASB issued ASU 2015-14, which defers the adoption of ASU 2014-09 to annual reporting periods beginning after December 15, 2017, including interim reporting periods within that reporting period. The collective guidance in these ASUs defines the steps to recognize revenue for entities that have contracts with customers as well as requiring significantly expanded disclosures regarding the qualitative and quantitative information of the nature, amount,
57
timing, and uncertainty of revenue and cash flows arising from such contracts. We will adopt the new guidance beginning on February 1, 2018 using the full retrospective method that will result in retrospective application. During the first quarter of the fiscal year ended 2019, we will record a cumulative adjustment to retained earnings for the retrospective application as provided for in the guidance. Expanded disclosures as required under the new guidance will be included in the notes to the consolidated financial statements in each of the quarterly reports on Form 10-Q and in our annual report on Form 10-K for the year ending January 31, 2019. The primary impact of the guidance on our financial statements is the elimination of the completed contract method of recognizing revenues, mostly prevalent in our Water Resources segment, and the elimination of segmentation treatment related to certain customer contracts in our Inliner segment. We have updated our accounting policies and internal controls, and implemented changes to our business processes and information systems to support the new revenue recognition and disclosure requirements. Based on our assessment of the impact of adoption, we estimate a net cumulative reduction of our retained earnings of less than $1.0 million.
In February 2016, the FASB issued ASU No. 2016-02, “Leases,” which establishes a right-of-use (“ROU”) model that requires a lessee to record a ROU asset and a lease liability on the balance sheet for all leases with terms longer than twelve months. In January 2018, the FASB issued ASU No. 2018-01 Leases (Topic 842): Land Easement Practical Expedient for Transition to Topic 842. Leases will be classified as either finance or operating, with classification affecting the pattern of expense recognition in the income statement. This ASU is effective for fiscal years beginning after December 15, 2018, including interim periods within those fiscal years. Early adoption is permitted. ASU 2016-02 requires modified retrospective adoption for all leases existing at, or entered into after, the date of initial application, with an option to use certain transition relief. We are preparing to implement changes to our accounting policies and controls, business processes and information systems to support the new accounting and disclosure requirements, which is effective for us beginning on February 1, 2019. We are currently evaluating the significance of adoption of this ASU and currently, based on our limited number of leases, we do not believe the effect will be material on our financial statements.
In January 2017, the FASB issued ASU 2017-04, “Intangibles—Goodwill and Other (Topic 350): Simplifying the Test for Goodwill Impairment”, under the amendments in this update, an entity should perform its annual, or interim, goodwill impairment test by comparing the fair value of a reporting unit with its carrying amount. An entity should recognize an impairment charge for the amount by which the carrying amount exceeds the reporting unit’s fair value; however, the loss recognized should not exceed the total amount of goodwill allocated to that reporting unit. Additionally, an entity should consider income tax effects from any tax deductible goodwill on the carrying amount of the reporting unit when measuring the goodwill impairment loss, if applicable. As a public business, adoption of the amendments in this update are required, prospectively, for the annual or any interim goodwill impairment tests in fiscal years beginning after December 15, 2019 with early adoption permitted for testing dates after January 1, 2017. We anticipate adopting this ASU beginning on February 1, 2020 and do not believe the adoption will have a material impact on our financial statements.
In November 2016, the FASB issued ASU 2016-18, “Statement of Cash Flows: Restricted Cash,” which provides guidance about the presentation of changes in restricted cash and restricted cash equivalents on the statement of cash flows. We early adopted the ASU on January 31, 2018 by applying a retrospective transition method to each period presented. The adoption of this ASU involved removing restricted deposits from cash provided by operating investments to reconcile net income to cash, cash equivalents and restricted deposits for each year presented in the Consolidated Statement of Cash Flows. It did not have a material impact on our financial statements.
In August 2016, the FASB issued ASU 2016-15, “Statement of Cash Flows: Classification of Certain Cash Receipts and Cash Payments.” This ASU provides guidance and clarification in regards to the classification of eight types of receipts and payments in the statement of cash flows, including debt repayment or extinguishment costs, settlement of zero-coupon bonds, proceeds from the settlement of insurance claims, distributions received from equity method investees and cash receipts from beneficial interest in securitization transactions. We formally adopted the ASU on January 31, 2018. Our Latin American affiliates issue dividends which we account for using the cumulative earnings approach, so no accounting transition was necessary. See “Investment in Affiliated Companies” above.
58
(2) Costs and Estimated Earnings on Uncompleted Contracts
Costs and estimated earnings on uncompleted contracts consisted of the following:
|
|
|
As of January 31, |
|
|||||
|
(in thousands) |
|
2018 |
|
|
2017 |
|
||
|
Cost incurred on uncompleted contracts |
|
$ |
496,324 |
|
|
$ |
658,553 |
|
|
Estimated earnings |
|
|
204,124 |
|
|
|
213,142 |
|
|
|
|
|
700,448 |
|
|
|
871,695 |
|
|
Less: Billing to date |
|
|
666,024 |
|
|
|
842,232 |
|
|
Total |
|
$ |
34,424 |
|
|
$ |
29,463 |
|
|
Included in accompanying balance sheets under the following captions: |
|
|
|
|
|
|
|
|
|
Costs and estimated earnings in excess of billing on uncompleted contracts |
|
$ |
44,987 |
|
|
$ |
48,623 |
|
|
Billings in excess of costs and estimated earnings on uncompleted contracts |
|
|
(10,563 |
) |
|
|
(19,160 |
) |
|
Total |
|
$ |
34,424 |
|
|
$ |
29,463 |
|
|
|
|
|
|
|
|
|
|
|
We bill our customers based on specific contract terms. Substantially all billed amounts are collectible within one year. As of January 31, 2018 and 2017, our costs and estimated earnings in excess of billings on uncompleted contracts included unbilled contract retainage amounts of $16.0 million and $19.1 million, respectively.
(3) Property and Equipment
Property and equipment consisted of the following:
|
|
|
January 31, |
|
|
January 31, |
|
||
|
(in thousands) |
|
2018 |
|
|
2017 |
|
||
|
Land |
|
$ |
11,156 |
|
|
$ |
10,037 |
|
|
Buildings and improvements |
|
|
31,530 |
|
|
|
30,835 |
|
|
Machinery, equipment and pipeline |
|
|
356,132 |
|
|
|
323,280 |
|
|
Property and equipment, at cost |
|
|
398,818 |
|
|
|
364,152 |
|
|
Less - Accumulated depreciation |
|
|
(278,214 |
) |
|
|
(267,167 |
) |
|
Property and equipment, net |
|
$ |
120,604 |
|
|
$ |
96,985 |
|
Depreciation expense was $26.1 million, $24.9 million and $29.6 million for the fiscal years ended January 31, 2018, 2017 and 2016, respectively.
(4) Impairment Charges
Prior to the segment realignment in the third quarter of the fiscal year ended January 31, 2016, we reviewed the recoverability of the asset values of our long-lived assets in the Energy Services segment during the second quarter of the fiscal year ended January 31, 2016. Using the undiscounted cash flow model, we concluded that the carrying value of the assets in Energy Services was not fully recoverable as of July 31, 2015. We performed an assessment of the fair value of the assets of Energy Services based on orderly liquidation value of the property and equipment, which was considered as Level 2 fair value measurement. This assessment resulted in the recording of an impairment charge of approximately $4.6 million during the second quarter of the fiscal year ended January 31, 2016.
(5) Investments in Affiliates
We have investments in affiliates that are engaged in mineral drilling services and the manufacture and supply of drilling equipment, parts and supplies. Investment in affiliates may include other drilling and infrastructure services related joint ventures from time to time. Our equity method investments are part of our Mineral Services segment.
59
A summary of material, jointly-owned affiliates, as well as their primary operating subsidiaries if applicable and the percentages directly or indirectly owned by Layne are as follows as of January 31, 2018:
|
|
|
Percentage Owned Directly |
|
|
Percentage Owned Indirectly |
|
||
|
Boyles Bros Servicios Tecnicos Geologicos S.A. (Panama) |
|
50.00% |
|
|
|
|
|
|
|
Boytec, S.A. (Panama) |
|
|
|
|
|
50.00% |
|
|
|
Boytec Sondajes de Mexico, S.A. de C.V. (Mexico) |
|
|
|
|
|
|
50.00 |
|
|
Sondajes Colombia, S.A. (Columbia) |
|
|
|
|
|
|
50.00 |
|
|
Mining Drilling Fluids (Panama) |
|
|
|
|
|
|
25.00 |
|
|
Plantel Industrial S.A. (Chile) |
|
|
|
|
|
|
50.00 |
|
|
Christensen Chile, S.A. (Chile) |
|
|
50.00 |
|
|
|
|
|
|
Christensen Commercial, S.A. (Chile) |
|
|
50.00 |
|
|
|
|
|
|
Geotec Boyles Bros., S.A. (Chile) |
|
|
50.00 |
|
|
|
|
|
|
Centro Internacional de Formacion S.A. (Chile) |
|
|
|
|
|
|
50.00 |
|
|
Geoestrella S.A. (Chile) |
|
|
|
|
|
|
25.00 |
|
|
Diamantina Christensen Trading (Panama) |
|
|
42.69 |
|
|
|
|
|
|
Christensen Commercial, S.A. (Peru) |
|
|
35.38 |
|
|
|
|
|
|
Geotec, S.A. (Peru) |
|
|
35.38 |
|
|
|
|
|
|
Boyles Bros. Diamantina, S.A. (Peru) |
|
|
29.49 |
|
|
|
|
|
|
Mining Drilling Fluids S.A. (Chile) |
|
|
25.00 |
|
|
|
|
|
Financial information for the affiliates is reported with a one-month lag in the reporting period. The impact of the lag on our investment and results of operations are not significant. Summarized financial information of the affiliates is as follows:
|
|
|
As of and Years Ended January 31, |
|
|||||||||
|
(in thousands) |
|
2018 |
|
|
2017 |
|
|
2016 |
|
|||
|
Balance sheet data: |
|
|
|
|
|
|
|
|
|
|
|
|
|
Current assets |
|
$ |
92,882 |
|
|
$ |
87,116 |
|
|
$ |
89,943 |
|
|
Noncurrent assets |
|
|
79,761 |
|
|
|
77,624 |
|
|
|
83,132 |
|
|
Current liabilities |
|
|
35,201 |
|
|
|
27,270 |
|
|
|
27,538 |
|
|
Noncurrent liabilities |
|
|
12,815 |
|
|
|
11,288 |
|
|
|
13,393 |
|
|
Income statement data: |
|
|
|
|
|
|
|
|
|
|
|
|
|
Revenues |
|
|
143,698 |
|
|
|
123,846 |
|
|
|
135,602 |
|
|
Gross profit |
|
|
25,710 |
|
|
|
21,259 |
|
|
|
17,944 |
|
|
Operating income (loss) |
|
|
9,778 |
|
|
|
6,621 |
|
|
|
3,424 |
|
|
Net income (loss) |
|
|
8,083 |
|
|
|
5,697 |
|
|
|
(989 |
) |
We had no significant transactions or balances with our affiliates as of January 31, 2018, 2017 and 2016 and for the fiscal years then ended.
Our equity in undistributed earnings of the affiliates totaled $48.7 million, $50.7 million and $52.8 million as of January 31, 2018, 2017 and 2016, respectively and an additional $4.6 million of investment in affiliates was recorded as equity method goodwill for certain of the investments at the time of acquisition.
60
(6) Other Intangible Assets
Other intangible assets consisted of the following as of January 31:
|
|
|
2018 |
|
2017 |
||||||||||||||||
|
(in thousands) |
|
Gross Carrying Amount |
|
|
Accumulated Amortization |
|
|
Weighted Average Amortization Period in Years |
|
Gross Carrying Amount |
|
|
Accumulated Amortization |
|
|
Weighted Average Amortization Period in Years |
||||
|
Amortizable intangible assets: |
|
|
|
|
|
|
|
|
|
|
|
|
|
|
|
|
|
|
|
|
|
Tradenames |
|
$ |
5,120 |
|
|
$ |
(4,210 |
) |
|
15 |
|
$ |
5,120 |
|
|
$ |
(3,869 |
) |
|
15 |
|
Patents |
|
|
905 |
|
|
|
(680 |
) |
|
12 |
|
|
905 |
|
|
|
(635 |
) |
|
12 |
|
Right-of-ways |
|
|
2,663 |
|
|
|
(162 |
) |
|
13 |
|
|
— |
|
|
|
— |
|
|
|
|
Other |
|
|
500 |
|
|
|
(292 |
) |
|
10 |
|
|
500 |
|
|
|
(242 |
) |
|
10 |
|
Total intangible assets |
|
$ |
9,188 |
|
|
$ |
(5,344 |
) |
|
|
|
$ |
6,525 |
|
|
$ |
(4,746 |
) |
|
|
|
|
|
|
|
|
|
|
|
|
|
|
|
|
|
|
|
|
|
|
|
|
Total amortization expense for other intangible assets was $0.6 million, $0.4 million and $0.5 million for the fiscal years ended January 31, 2018, 2017 and 2016, respectively. Amortization expense for the subsequent five fiscal years is estimated as follows:
|
Estimated amortization for the next 5 years |
|
|
|
|
|
(in thousands) |
|
Amount |
|
|
|
Fiscal Year 2019 |
|
$ |
636 |
|
|
Fiscal Year 2020 |
|
|
636 |
|
|
Fiscal Year 2021 |
|
|
522 |
|
|
Fiscal Year 2022 |
|
|
293 |
|
|
Fiscal Year 2023 |
|
|
221 |
|
|
Thereafter |
|
|
1,536 |
|
|
Total |
|
$ |
3,844 |
|
|
|
|
|
|
|
(7) Other Balance Sheet Information
The table below presents comparative detailed information about other current assets:
|
|
|
January 31, |
|
|
January 31, |
|
||
|
(in thousands) |
|
2018 |
|
|
2017 |
|
||
|
Other current assets: |
|
|
|
|
|
|
|
|
|
Income taxes receivable |
|
$ |
430 |
|
|
$ |
5,524 |
|
|
Assets held for sale |
|
|
6,038 |
|
|
|
4,735 |
|
|
Prepaid insurance |
|
|
1,214 |
|
|
|
1,801 |
|
|
Other |
|
|
4,233 |
|
|
|
4,691 |
|
|
Total |
|
$ |
11,915 |
|
|
$ |
16,751 |
|
The table below presents comparative detailed information about other non-current assets:
|
|
|
January 31, |
|
|
January 31, |
|
||
|
(in thousands) |
|
2018 |
|
|
2017 |
|
||
|
Other non-current assets: |
|
|
|
|
|
|
|
|
|
Contingent consideration receivable |
|
|
4,244 |
|
|
|
4,244 |
|
|
Deferred income taxes |
|
|
220 |
|
|
|
242 |
|
|
Deferred financing fees, net |
|
|
987 |
|
|
|
1,833 |
|
|
Other |
|
|
2,957 |
|
|
|
5,195 |
|
|
Total |
|
$ |
8,408 |
|
|
$ |
11,514 |
|
The table below presents comparative detailed information about other current liabilities:
61
|
|
|
January 31, |
|
|
January 31, |
|
||
|
(in thousands) |
|
2018 |
|
|
2017 |
|
||
|
Other current liabilities: |
|
|
|
|
|
|
|
|
|
Reserve for assets held for sale(1) |
|
|
12,431 |
|
|
|
12,431 |
|
|
Accrued compensation |
|
|
16,242 |
|
|
|
13,364 |
|
|
Accrued insurance |
|
|
9,616 |
|
|
|
12,206 |
|
|
Income taxes payable |
|
|
324 |
|
|
|
9,088 |
|
|
Other accrued expenses |
|
|
14,431 |
|
|
|
16,954 |
|
|
Total |
|
$ |
53,044 |
|
|
$ |
64,043 |
|
|
|
(1) |
Reserve for assets held for sale represents the impairment of assets held for sale in Australia and Africa. In calculating the impairment, the carrying amount of the assets included the cumulative currency translation adjustment related to our Australian and African entities. |
(8) Indebtedness
Debt outstanding as of January 31, 2018 and 2017 was as follows:
|
|
|
January 31, |
|
|
January 31, |
|
||
|
(in thousands) |
|
2018 |
|
|
2017 |
|
||
|
4.25% Convertible Notes |
|
$ |
67,248 |
|
|
$ |
64,387 |
|
|
8.0% Convertible Notes |
|
|
98,769 |
|
|
|
97,952 |
|
|
Capitalized lease obligations |
|
|
45 |
|
|
|
17 |
|
|
Less amounts representing interest |
|
|
— |
|
|
|
(1 |
) |
|
Total debt |
|
|
166,062 |
|
|
|
162,355 |
|
|
Less current maturities of long-term debt(1) |
|
|
(67,293 |
) |
|
|
(9 |
) |
|
Total long-term debt |
|
$ |
98,769 |
|
|
$ |
162,346 |
|
|
|
|
|
|
|
|
|
|
|
|
|
(1) |
Primarily represents the 4.25% Convertible Notes with a maturity date of November 15, 2018. |
As of January 31, 2018, debt outstanding will mature as follows:
|
(in thousands) |
|
4.25% Convertible Notes |
|
|
8.0% Convertible Notes |
|
|
Asset-based credit facility |
|
|
Capitalized lease obligations |
|
|
Total |
|
|||||
|
Fiscal Year 2019 |
|
$ |
67,248 |
|
|
$ |
— |
|
|
$ |
— |
|
|
$ |
45 |
|
|
$ |
67,293 |
|
|
Fiscal Year 2020 |
|
|
— |
|
|
|
98,769 |
|
|
|
— |
|
|
|
— |
|
|
|
98,769 |
|
|
Total |
|
$ |
67,248 |
|
|
$ |
98,769 |
|
|
$ |
— |
|
|
$ |
45 |
|
|
$ |
166,062 |
|
|
|
|
|
|
|
|
|
|
|
|
|
|
|
|
|
|
|
|
|
|
|
Asset-based Revolving Credit Facility
We have a $100.0 million senior secured asset-based credit facility, that expires on April 14, 2019, of which up to an aggregate principal amount of $75.0 million is available in the form of letters of credit and up to an aggregate principal amount of $15.0 million is available for short-term swingline borrowings.
The maturity date for the asset-based credit facility is April 15, 2019. However, the maturity date will accelerate to May 15, 2018 if each of the following has not yet occurred on or before such date: (i) either (a) all of the 8.0% Convertible Notes (or Permitted Refinancing Indebtedness (as defined in the asset-based credit facility agreement) in respect thereof) are converted or (b) the maturity date of the 8.0% Convertible Notes (or Permitted Refinancing Indebtedness in respect thereof) is extended to a date which is after October 15, 2019 and (ii) either (a) all of the 4.25% Convertible Notes (or Permitted Refinancing Indebtedness in respect thereof) are converted, (b) the maturity date for the 4.25% Convertible Notes (or Permitted Refinancing Indebtedness in respect thereof) is extended to a date which is after October 15, 2019, or (c) the 4.25% Convertible Notes are effectively discharged. The 4.25% Convertible Notes will be effectively discharged after, among other things, we have irrevocably deposited with the trustee of the 4.25% Convertible Notes cash in an amount sufficient to pay any remaining interest and principal payments due on any then remaining unconverted 4.25% Convertible Notes, with irrevocable instructions to the trustee to make such payments to the holders of the 4.25% Convertible Notes as they become due.
62
The asset-based credit facility is guaranteed by assets of our direct and indirect wholly owned domestic subsidiaries, subject to certain exceptions described in the asset-based credit facility. The obligations under the asset-based credit facility are secured by a lien on substantially all of our assets and the assets of the subsidiary guarantors, subject to certain exceptions described in the asset-based credit facility, including a pledge of up to 65% of the equity interests of our first tier foreign subsidiaries.
Availability under the asset-based credit facility is currently the lesser of (i) $100.0 million or (ii) the borrowing base (as defined in the asset-based credit facility agreement).
Availability under the asset-based credit facility as of January 31, 2018, was approximately $100.0 million, as the borrowing base exceeded total commitments. Approximately $24.6 million of letters of credit were issued under the asset-based credit facility and no borrowings were outstanding as of January 31, 2018, resulting in Excess Availability (described below) of $75.4 million.
Advances under the asset-based credit facility are subject to certain conditions precedent, including the accuracy of certain representations and warranties and the absence of any default or event of default. Future advances may be used for general corporate and working capital purposes and to pay fees and expenses associated with the asset-based credit facility.
Pursuant to the asset-based credit facility agreement, the revolving loans will bear interest at either:
|
|
• |
the alternate base rate plus the applicable margin. The alternate base rate is equal to the highest of (a) the base rate, (b) the sum of the Federal Funds Open rate plus 0.5% and (c) the sum of the Daily LIBOR rate plus 1%, or |
|
|
• |
the LIBOR rate (as defined in the asset-based credit facility agreement) for the interest period in effect for such borrowing plus the applicable margin. |
The asset-based credit facility contains various restrictions and covenants, including restrictions on dispositions of certain assets, incurrence of indebtedness, investments, distributions, capital expenditures, acquisitions and prepayment of certain indebtedness. In general, provided that we maintain a certain level of Excess Availability, we will not be restricted from incurring additional unsecured indebtedness or making investments, distributions, capital expenditures or acquisitions.
In compliance with the terms of our asset-based credit facility, we obtained an asset sale consent from our lenders on January 25, 2017 in connection with the sale of our Heavy Civil business segment.
If Excess Availability is less than the greater of 17.5% of Total Availability or $17.5 million for more than one business day, then a “Covenant Compliance Period” (as defined in the asset-based credit facility agreement) will exist until Excess Availability has been equal to or greater than the greater of 17.5% of the Total Availability or $17.5 million for a period of 30 consecutive days. We must maintain a minimum fixed charge coverage ratio of not less than 1.0 to 1.0 and a maximum first lien leverage ratio of not greater than 5.0 to 1.0 for the four fiscal quarters ended immediately preceding any Covenant Compliance Period and for any four fiscal quarter period ending during a Covenant Compliance Period. We would not have been in compliance with the fixed charge coverage ratio had we been in a Covenant Compliance Period as of the fiscal years ended January 31, 2018 and 2017.
During the fiscal year ended January 31, 2016, we had two consecutive four-quarter periods with a fixed charge coverage ratio of not less than 1.0 to 1.0 and therefore, we are no longer required to maintain a cumulative minimum cash flow (as defined in the asset-based credit facility agreement) of not less than negative $45.0 million and a minimum cash flow of not less than negative $25.0 million during any twelve consecutive month period.
The asset-based credit facility also contains a subjective acceleration clause that can be triggered if the lenders determine that we have experienced a material adverse change. If triggered by the lenders, this clause would create an Event of Default (as defined in the asset-based credit facility agreement), which in turn would permit the lenders to accelerate repayment of outstanding obligations.
The balance sheet classification of borrowings under the asset-based credit facility has been determined in accordance with ASC Topic 470-10-45, “Balance Sheet Classification of Borrowings Outstanding under Revolving Credit Agreements that Include both a Subjective Acceleration Clause and a Lock-Box Arrangement.” Accordingly, borrowings will be classified as a long-term liability in the accompanying Consolidated Balance Sheet.
63
In general, during a Covenant Compliance Period or if an Event of Default has occurred and is continuing, all of Layne’s funds received on a daily basis will be applied to reduce amounts owing under the asset-based credit facility. Based on current projections Layne does not anticipate being in a Covenant Compliance Period during the next twelve months. Also, because Excess Availability currently is and is expected to be for the next twelve months, sufficient not to trigger a Covenant Compliance Period, we are and anticipate being in compliance with the applicable debt covenants associated with the asset-based credit facility for the next twelve months.
Defaults under the asset-based credit facility include (but are not limited to) the following:
|
|
• |
non-payment of principal, interest, fees and other amounts under the asset-based credit facility |
|
|
• |
failure to comply with any of the negative covenants, certain of the specified affirmative covenants or other covenants under the asset-based credit facility |
|
|
• |
failure to pay certain indebtedness when due |
|
|
• |
specified events of bankruptcy and insolvency |
|
|
• |
one or more judgments of $5.0 million not covered by insurance and not paid within a specified period. |
|
|
• |
a change in control as defined in the asset-based credit facility. |
On March 30, 2018, our asset-based credit facility agreement was amended to revise the acceleration provision included in the definition of Maturity Date to be July 16, 2018 if we have not delivered to the administrative agent for the asset-based credit facility evidence by July 15, 2018 that the 4.25% Convertible Notes have been effectively discharged with the proceeds from the issuance of the 11.0% Unsecured Notes or (b) May 15, 2018 if (i) the issuance of the 11.0% Unsecured Notes is cancelled for any reason or (ii) the proceeds of the 11.0% Unsecured Notes are used for a purpose other than to effectively discharge the 4.25% Convertible Notes in full; provided, that if an event described in clause (i) or (ii) above occurs after May 15, 2018, then the maturity date of the asset-based credit facility will be the date the event occurred.
4.25% Convertible Senior Notes
On November 12, 2013, we completed the issuance and sale of $110.0 million aggregate principal amount of 4.25% Convertible Notes due 2018 (the “4.25% Convertible Notes”), in accordance with the terms of the purchase agreement (the “Purchase Agreement”) entered into with Jefferies LLC (the “Initial Purchaser”). On December 5, 2013, the Initial Purchaser exercised its option to purchase an additional $15.0 million aggregate principal amount of 4.25% Convertible Notes as part of the Purchase Agreement. The 4.25% Convertible Notes were issued pursuant to an Indenture, dated November 12, 2013 (the “4.25% Convertible Notes Indenture”), between Layne and U.S. Bank National Association, as trustee. The 4.25% Convertible Notes are senior, unsecured obligations of Layne. The 4.25% Convertible Notes are convertible, at the option of the holders, into consideration consisting of, at our election, cash, shares of our common stock, or a combination of cash and shares of our common stock (and cash in lieu of fractional shares) until the close of business on the scheduled trading day immediately preceding May 15, 2018. However, before May 15, 2018, the 4.25% Convertible Notes will not be convertible except in certain circumstances provided in the 4.25% Convertible Notes Indenture.
The 4.25% Convertible Notes bear interest at a rate of 4.25% per year, payable semi-annually in arrears in cash on May 15 and November 15 of each year, beginning on May 15, 2014. The 4.25% Convertible Notes will mature on November 15, 2018, unless earlier repurchased, redeemed or converted. See “Potential Refinancing of Convertible Notes” below.
The initial conversion rate was 43.6072 shares of our common stock per $1,000 principal amount of 4.25% Convertible Notes (which is equivalent to an initial conversion price of approximately $22.93 per share of our common stock). The conversion rate will be subject to adjustment upon the occurrence of certain events. In addition, we may be obligated to increase the conversion rate for any conversion that occurs in connection with certain corporate events, including our call of the 4.25% Convertible Notes for redemption.
64
On and after November 15, 2016 and prior to the maturity date, pursuant to the 4.25% Convertible Note Indenture, we may redeem all, but not less than all, of the 4.25% Convertible Notes for cash if the sale price of our common stock equals or exceeds 130% of the applicable conversion price for a specified time period ending on the trading day immediately prior to the date we deliver notice of the redemption. The redemption price will equal 100% of the principal amount of the 4.25% Convertible Notes to be redeemed, plus any accrued and unpaid interest to, but excluding, the redemption date. In addition, upon the occurrence of a fundamental change (as defined in the 4.25% Convertible Notes Indenture), holders of the 4.25% Convertible Notes will have the right, at their option, to require us to repurchase their 4.25% Convertible Notes in cash at a price equal to 100% of the principal amount of the 4.25% Convertible Notes to be repurchased, plus accrued and unpaid interest to, but excluding, the fundamental change repurchase date.
If any amount payable on a 4.25% Convertible Note (including principal, interest, a fundamental change repurchase or a redemption) is not paid by us when it is due and payable, such amount will accrue interest at a rate equal to 5.25% per annum from such payment date until paid.
The pending merger with Granite is not a fundamental change under the indenture governing the 4.25% Convertible Notes. In the merger agreement, Granite agreed that any conversions of the 4.25% Convertible Notes after the closing of the merger would be settled solely in cash.
In accordance with ASC Topic 470-20, “Debt with Conversion and Other Options,” we separately account for the liability and equity conversion components of the 4.25% Convertible Notes. The principal amount of the liability component of the 4.25% Convertible Notes was $106.0 million as of the date of issuance based on the present value of our cash flows using a discount rate of 8.0%, our approximate borrowing rate at the date of the issuance for a similar debt instrument without the conversion feature. The carrying value of the equity conversion component was $19.0 million. A portion of the Initial Purchaser’s discount and commission and the offering costs totaling $0.8 million and deferred taxes totaling $7.1 million were allocated to the equity conversion component. The liability component will be accreted to the principal amount of the 4.25% Convertible Notes using the effective interest method over five years.
In accordance with guidance in ASC Topic 470-20 and ASC Topic 815-15, “Embedded Derivatives,” we determined that the embedded conversion components and other embedded derivatives of the 4.25% Convertible Notes do not require bifurcation and separate accounting.
On March 2, 2015, we exchanged approximately $55.5 million aggregate principal amount of our 4.25% Convertible Notes for approximately $49.9 million aggregate principal amount of our 8.0% Convertible Notes (described further below). In accordance with the derecognition guidance for convertible instruments in an exchange transaction under ASC Topic 470-20, the fair value of the 8.0% Convertible Notes (“the exchange consideration”) and the transaction costs incurred were allocated between the liability and equity components of the 4.25% Convertible Notes. Of the $49.9 million exchange consideration, $42.1 million, which represents the fair value of the 4.25% Convertible Notes immediately prior to its derecognition, was allocated to the extinguishment of the liability component. Transaction costs of $0.9 million were also allocated to the liability component. As a result, we recognized a gain on extinguishment of debt of $4.2 million during the first quarter of the fiscal year ended January 31, 2016. The remaining $7.8 million of the exchange consideration and $0.2 million of transaction costs were allocated to the reacquisition of the equity component and recognized as a reduction of stockholders’ equity.
The following table presents the carrying value of the 4.25% Convertible Notes:
|
|
|
January 31, |
|
|
January 31, |
|
||
|
(in thousands) |
|
2018 |
|
|
2017 |
|
||
|
Carrying amount of the equity conversion component |
|
$ |
(3,106 |
) |
|
$ |
3,106 |
|
|
Principal amount of the 4.25% Convertible Notes |
|
$ |
69,500 |
|
|
$ |
69,500 |
|
|
Unamortized deferred financing fees |
|
|
(476 |
) |
|
|
(1,033 |
) |
|
Unamortized debt discount (1) |
|
|
(1,776 |
) |
|
|
(4,080 |
) |
|
Net carrying amount |
|
$ |
67,248 |
|
|
$ |
64,387 |
|
|
|
|
|
|
|
|
|
|
|
|
(1) |
As of January 31, 2018, the remaining period over which the unamortized debt discount will be amortized is nine months using an effective interest rate of 9%. |
65
8.0 % Senior Secured Second Lien Convertible Notes
On March 2, 2015, we completed the offering of approximately $100.0 million aggregate principal amount of 8.0% Senior Secured Second Lien Convertible Notes (“8.0% Convertible Notes”). The 8.0% Convertible Notes were offered at par to certain investors that held approximately $55.5 million of our 4.25% Convertible Notes due 2018 pursuant to terms in which the investors agreed to (i) exchange the 4.25% Convertible Notes owned by them for approximately $49.9 million of the 8.0% Convertible Notes and (ii) purchase approximately $49.9 million aggregate principal amount of 8.0% Convertible Notes at a cash price equal to the principal amount thereof. The amount of accrued interest on the 4.25% Convertible Notes delivered by the investors in the exchange was credited to the cash purchase price payable by the investors in the purchase.
The sale of the 8.0% Convertible Notes generated net cash proceeds of approximately $45.0 million after deducting discounts and commissions, estimated offering expenses and accrued interest on the 4.25% Convertible Notes being exchanged. We used the net cash proceeds to repay the then outstanding balance on the asset-based credit facility of $18.2 million with the remainder of the proceeds held for general working capital purposes.
The 8.0% Convertible Notes were issued pursuant to an Indenture, dated as of March 2, 2015 (the “8.0% Convertible Notes Indenture”), among Layne, the guarantor parties thereto and U.S. Bank National Association, as trustee and collateral agent. The 8.0% Convertible Notes are senior, secured obligations of Layne, with interest payable on May 1 and November 1 of each year, beginning May 1, 2015, at a rate of 8.0% per annum. The 8.0% Convertible Notes will mature on May 1, 2019; provided, however, that, unless all of the 4.25% Convertible Notes (or any permitted refinancing indebtedness in respect thereof) have been redeemed, repurchased, otherwise retired, discharged in accordance with their terms or converted into our common stock, or have been effectively discharged, in each case on or prior to August 15, 2018 or the scheduled maturity date of the 4.25% Convertible Notes (or any permitted refinancing indebtedness incurred in respect thereof) is extended to a date that is after October 15, 2019, the 8.0% Convertible Notes will mature on August 15, 2018. See "-Potential Refinancing of Convertible Notes" below.
The 8.0% Convertible Notes are senior, secured obligations and are guaranteed by our subsidiaries that currently are co-borrowers or guarantors under our asset-based credit facility, as well as all of our future wholly-owned U.S. restricted subsidiaries and, in certain cases, certain of our other subsidiaries.
The 8.0% Convertible Notes are secured by a lien on substantially all of our assets and the assets of the subsidiary guarantors, subject to certain exceptions. The liens on the assets securing the 8.0% Convertible Notes are junior in priority to the liens (the “First Priority Liens”) on such assets securing our debt (the “First Priority Debt”) or that of the subsidiary guarantors under our asset-based credit facility and certain other specified existing or future obligations.
At any time prior to the maturity date, we may redeem for cash all, but not less than all, of the 8.0% Convertible Notes; provided, however, that we may not redeem the 8.0% Convertible Notes on a redemption date that is outside an Open Redemption Period (as defined in the 8.0% Convertible Notes Indenture) unless the last reported sale price of our common stock equals or exceeds 140% of the conversion price of the 8.0% Convertible Notes in effect on each of at least 20 trading days during the 30 consecutive trading day period ending on and including, the trading day immediately preceding the date on which we deliver the redemption notice.
In addition, upon the occurrence of a “fundamental change” (as defined in the 8.0% Convertible Notes Indenture), holders of the 8.0% Convertible Notes will have the right, at their option, to require us to repurchase their 8.0% Convertible Notes in cash at a price equal to 100% of the principal amount of the 8.0% Convertible Notes to be repurchased, plus accrued and unpaid interest to, but excluding, the fundamental change repurchase date.
The 8.0% Convertible Notes Indenture permits us to reinvest the net proceeds from certain “asset sales” (as defined in the 8.0% Convertible Notes Indenture). Any such reinvestments are subject to the criteria and time periods in the 8.0% Convertible Notes Indenture. Any net proceeds from “asset sales” that are not reinvested within the applicable time period constitute “excess proceeds” (as defined in the 8.0% Convertible Notes Indenture). When the aggregate amount of “excess proceeds” exceeds $10.0 million, we must, within 30 days, make an offer to all holders of the 8.0% Convertible Notes and holders of certain other pari passu debt obligations of the Company (together, the “Qualifying Indebtedness”) to repurchase the Qualifying Indebtedness up to the maximum amount of the available “excess proceeds.” The Qualifying Indebtedness repurchase price will equal 100% of the principal amount plus any accrued and unpaid interest to, but excluding the repurchase date. The holders of the Qualifying Indebtedness may, at their option, elect to accept the repurchase offer. If the aggregate amount of Qualifying Indebtedness tendered for repurchase exceeds the amount of “excess proceeds”, the Qualifying Indebtedness tendered will be repurchased on a pro rata basis. We may use any “excess proceeds” remaining as a result of an insufficient amount of Qualifying Indebtedness being tendered for repurchase for any purpose not otherwise prohibited by the 8.0% Convertible Notes Indenture.
66
The 8.0% Convertible Notes are convertible, at the option of the holders, into consideration consisting of shares of our common stock (and cash in lieu of fractional shares) until the close of business on the scheduled trading day immediately preceding the maturity date. No holder will have the right to convert any 8.0% Convertible Notes into shares of common stock to the extent that the conversion would cause that holder to beneficially own more than 9.9% of the shares of our common stock then outstanding after giving effect to the proposed conversion.
The initial conversion rate was 85.4701 shares of our common stock per $1,000 principal amount of 8.0% Convertible Notes (equivalent to an initial conversion price of approximately $11.70 per share of our common stock). The conversion rate is subject to adjustment upon the occurrence of certain events. In addition, we may be obligated to increase the conversion rate for any conversion that occurs in connection with certain corporate events, including our call of the 8.0% Convertible Notes for redemption.
The 8.0% Convertible Notes Indenture contains covenants that, among other things, restrict our ability and that of our restricted subsidiaries, subject to certain exceptions, to: (1) incur additional indebtedness; (2) create liens; (3) declare or pay dividends on, make distributions with respect to, or purchase or redeem, our equity interests or the equity interests of our restricted subsidiaries, or make certain payments on subordinated or unsecured indebtedness or make certain investments; (4) enter into certain transactions with affiliates; (5) engage in certain asset sales unless specified conditions are satisfied; and (6) designate certain subsidiaries as unrestricted subsidiaries. The 8.0% Convertible Notes Indenture also contains events of default after the occurrence of which the 8.0% Convertible Notes may be accelerated and become immediately due and payable.
If any amount payable on a 8.0% Convertible Note (including principal, interest, a fundamental change repurchase or a redemption) is not paid by us when it is due and payable, such amount will accrue interest at a rate equal to 9.0% per annum from such payment date until paid.
The pending merger with Granite is not a fundamental change under the indenture governing the 8.00% Convertible Notes. If the merger with Granite is consummated, any future conversions of the 8.0% Convertible Notes would be settled solely in shares of common stock of Granite (other than cash in lieu of any fractional shares).
In accordance with guidance in ASC Topic 815-15, we determined that the embedded conversion components and other embedded derivatives of the 8.0% Convertible Notes do not require bifurcation and separate accounting. We accounted for the 8.0% Convertible Notes as debt with conversion features that are not beneficial under ASC Topic 470-20. Accordingly, all the proceeds from the issuance of the 8.0% Convertible Notes are recorded as a liability in our Consolidated Balance Sheets.
The following table presents the carrying value of the 8.0% Convertible Notes:
|
|
|
January 31, |
|
|
January 31, |
|
||
|
(in thousands) |
|
2018 |
|
|
2017 |
|
||
|
Principal amount of the 8.0% Convertible Notes |
|
$ |
99,898 |
|
|
$ |
99,898 |
|
|
Unamortized deferred financing fees |
|
|
(1,129 |
) |
|
|
(1,946 |
) |
|
Net carrying amount |
|
$ |
98,769 |
|
|
$ |
97,952 |
|
11% Unsecured Notes
On March 19, 2018, we entered into a note purchase agreement with two investments funds advised by Corre Partners Management, LLC to purchase $ 71.0 million of our 11% Unsecured Notes. Corre Partners Management and its affiliated funds, including the purchasers of the 11.0% Unsecured Notes, own a portion of our 4.25% Convertible Notes and 8.00% Convertible Notes. Under the note purchase agreement, the purchasers have committed to purchase $71.0 million of our 11% Unsecured Notes due October 16, 2019 (the "11.0% Unsecured Notes") at a purchase price equal to 100% of the principal amount of the 11.0% Unsecured Notes. The closing of the purchase and sale of the 11.0% Unsecured Notes will be the earlier to occur of (i) October 1, 2018 and (ii) the fifth business day after delivery of a funding notice by us to the purchasers. As a result, if the proceeds of the 11.0% Unsecured Notes were to be used to effectively discharge the 4.25% Convertible Notes prior to July 16, 2018, we would need to refinance (1) the asset-based credit facility on or prior to April 14, 2019, (2) to the extent they are not converted into our common stock, the 8.0% Convertible Notes on May 1, 2019 and (3) the 11.0% Unsecured Notes on or prior to October 16, 2019. The commitment of the purchasers to purchase the 11.0% Unsecured Notes terminates upon the earliest to occur of: (i) a change of control (including the closing of the pending merger with Granite) and (ii) delivery to the purchasers of a notice of termination by us.
We may at our option prepay the 11.0% Unsecured Notes in whole or in part at any time. The 11.0% Unsecured Notes are subject to a mandatory prepayment upon the closing of a change of control. The 11.0% Unsecured Notes are subject to an Early Payment Event Fee if the 11.0% Unsecured Notes are repaid less than 90 days after the 11.0% Unsecured Notes are issued. The amount of the Early Payment Event Fee will be equal to the excess, if any, of (x) 90 days of accrued interest on the principal amount
67
repaid, over (y) the amount of interest accrued and paid or payable with respect to the principal amount repaid from the date of issuance to and including the date of the repayment.
There are no covenants applicable to us under the Note Purchase Agreement so long as: (i) the 11.0% Unsecured Notes have not been issued, (ii) any of the 8.00% Convertible Notes are outstanding and (iii) none of the provisions of the indenture governing the 8.00% Convertible Notes have been amended or waived. After the 11.0% Unsecured Notes have been issued, we will be subject to certain covenants, including, delivery of financial statements and other reports, compliance with material contracts and applicable laws, and maintenance of corporate existence, insurance and properties. In addition, after the earliest date that (i) none of the 8.00% Convertible Notes are outstanding or (ii) all or any of the provisions of the indenture governing the 8.00% Convertible Notes are no longer in effect or have been amended or waived, we will be subject to negative covenants related to indebtedness, liens, sale and leaseback transactions, asset sales, dividends and restricted payments, transactions with affiliates, and maximum ratio of funded indebtedness to EBITDA.
Potential Refinancing of Convertible Notes
Prior to August 15, 2018, we may elect to issue the 11.0% Unsecured Notes and use the proceeds from the issuance of the 11.0% Unsecured Notes to effectively discharge the 4.25% Convertible Notes, in which case the maturity date of the 8.0% Convertible Notes would remain May 1, 2019. As a result, if the proceeds of the 11.0% Unsecured Notes were to be used to effectively discharge the 4.25% Convertible Notes prior to July 16, 2018, we would need to refinance (1) the asset-based credit facility on or prior to April 14, 2019, (2) to the extent they are not converted into our common stock, the 8.0% Convertible Notes on May 1, 2019 and (3) the 11.0% Unsecured Notes on or prior to October 16, 2019.
Alternatively, if the market price of our common stock prior to August 15, 2018 is above $11.70 per share, we could elect to take no action with respect to the 4.25% Convertible Notes, in which case the maturity date of the 8.0% Convertible Notes would become August 15, 2018. We believe that under those circumstances most, if not all, of the holders of our 8.0% Convertible Notes would convert their notes into our common stock (and any remaining unconverted amounts could be refinanced with available cash or drawings under our asset-based credit facility) and we could issue the 11.0% Unsecured Notes by October 1, 2018 in order to repay the 4.25% Convertible Notes at maturity. In this case, we would seek to extend or refinance our asset-based credit facility prior to July 16, 2018.
Surety Bonds
As of January 31, 2018 and 2017, surety bonds issued to secure performance of our contracted projects amounted to $148.3 million and $223.8 million, respectively. The amount of our surety bonds is based on the expected amount of revenues remaining to be recognized on the projects. Of the amount outstanding at January 31, 2018, $48.4 million related to surety bonds on contracts which were assumed by the purchasers of our Heavy Civil business. We were successful in negotiating an early release of Layne on bonds for 4 of 36 jobs but do not expect to obtain releases on the remaining jobs until those jobs are completed.
(9) Other (Expense) Income, net
Other (expense) income, net consisted of the following:
|
|
|
Years Ended January 31, |
|
|||||||||
|
(in thousands) |
|
2018 |
|
|
2017 |
|
|
2016 |
|
|||
|
Interest income |
|
$ |
33 |
|
|
$ |
87 |
|
|
$ |
732 |
|
|
Currency exchange loss |
|
|
(204 |
) |
|
|
(205 |
) |
|
|
(73 |
) |
|
Other |
|
|
156 |
|
|
|
961 |
|
|
|
423 |
|
|
Total |
|
$ |
(15 |
) |
|
$ |
843 |
|
|
$ |
1,082 |
|
|
|
|
|
|
|
|
|
|
|
|
|
|
|
(10) Income Taxes
On December 22, 2017, the United States enacted tax reform legislation commonly known as the Tax Cuts and Jobs Act (the “The Act”), resulting in significant modifications to existing U.S. tax law, including but not limited to, (1) lowering the corporate federal income tax rate from 35% to 21% effective January 1, 2018; (2) implementing a territorial tax system; and (3) imposing a one-time repatriation tax on deemed repatriated earnings of foreign subsidiaries. Based on our fiscal year, the blended federal tax rate of 32.8% applies to fiscal year ended January 31, 2018.
68
Deferred tax assets and liabilities are determined based on the differences between the financial statement carrying amounts and tax bases of assets and liabilities as measured by the enacted tax rates that are expected to be in effect when these differences reverse. Deferred tax expense (benefit) is generally the result of changes in the assets or liabilities for deferred taxes. As a result of the reduction in the U.S. corporate income tax rate from 35% to 21% under The Act, we remeasured our ending net domestic deferred tax asset at January 31, 2018 and recognized a provisional tax expense of $31.1 million. Following the remeasurement of our net deferred tax asset, we recorded an offsetting tax benefit as a reduction to our valuation allowance. There was no income expense or benefit recorded as a result in the change in the tax rate.
The Act provides for a one-time deemed repatriation of post-1986 undistributed foreign subsidiary earnings and profits through the year ended January 31, 2018 (“Deemed Dividend”). We estimated a provisional Deemed Dividend of $17.3 million resulting in $5.7 million of tax expense. We recognized a $3.7 million tax benefit upon reversal of a previously recorded deferred tax liability relating to unremitted earnings of our less than 50% owned Affiliates. We also adjusted our valuation allowance as a result of the Deemed Dividend resulting in a $4.6 million tax benefit. The net tax benefit resulting from these adjustments to deferred taxes was $2.6 million during the fiscal year ended January 31, 2018.
The Act provides for a new requirement, beginning in 2018, that certain income earned by controlled foreign corporations in excess of an allowable return on foreign subsidiary’s tangible assets is subject to U.S. income tax (the global intangible low-taxed income or “GILTI” provision). Also beginning in 2018, The Act provides for a new base erosion and anti-abuse tax provision (“BEAT”) which eliminates the deduction of certain base-erosion payments made to related foreign corporations and imposes a minimum tax if greater than regular tax. We do not expect the GILTI or BEAT provisions to have a material impact to our financial statements.
The SEC staff issued Staff Accounting Bulletin 118 (“SAB 118”) which provides additional clarification regarding situations where the Company does not have the necessary information available, prepared, or analyzed in reasonable detail to complete the accounting for certain income tax effects of The Act for the reporting period in which The Act was enacted. We have recognized the provisional tax impacts, based on reasonable estimates, related to the Deemed Dividend and the revaluation of deferred tax assets and liabilities and have included these amounts in our consolidated financial statements for the year ended January 31, 2018. The ultimate impact may differ from these provisional amounts, possibly materially, due to among other things, additional analysis, changes in interpretations and assumptions we have made, additional regulatory guidance that may be issued, and actions we may take as a result of The Act. We intend to complete our accounting under The Act within the measurement period set forth in SAB 118.
Loss from continuing operations before income taxes consisted of the following:
|
|
|
Years Ended January 31, |
|
|||||||||
|
(in thousands) |
|
2018 |
|
|
2017 |
|
|
2016 |
|
|||
|
Domestic |
|
$ |
(16,076 |
) |
|
$ |
(37,084 |
) |
|
$ |
(17,778 |
) |
|
Foreign |
|
|
837 |
|
|
|
(8,545 |
) |
|
|
(29,837 |
) |
|
Total |
|
$ |
(15,239 |
) |
|
$ |
(45,629 |
) |
|
$ |
(47,615 |
) |
|
|
|
|
|
|
|
|
|
|
|
|
|
|
Components of income tax (benefit) expense from continuing operations were as follows:
|
|
|
Years Ended January 31, |
|
|||||||||
|
(in thousands) |
|
2018 |
|
|
2017 |
|
|
2016 |
|
|||
|
Currently due: |
|
|
|
|
|
|
|
|
|
|
|
|
|
U.S. federal |
|
$ |
(659 |
) |
|
$ |
63 |
|
|
$ |
(374 |
) |
|
State and local |
|
|
452 |
|
|
|
583 |
|
|
|
(685 |
) |
|
Foreign |
|
|
(6,848 |
) |
|
|
1,480 |
|
|
|
2,182 |
|
|
|
|
|
(7,055 |
) |
|
|
2,126 |
|
|
|
1,123 |
|
|
Deferred: |
|
|
|
|
|
|
|
|
|
|
|
|
|
U.S. federal |
|
|
(2,561 |
) |
|
|
274 |
|
|
|
(895 |
) |
|
State and local |
|
|
(74 |
) |
|
|
(197 |
) |
|
|
638 |
|
|
Foreign |
|
|
(685 |
) |
|
|
(783 |
) |
|
|
(129 |
) |
|
|
|
|
(3,320 |
) |
|
|
(706 |
) |
|
|
(386 |
) |
|
Total |
|
$ |
(10,375 |
) |
|
$ |
1,420 |
|
|
$ |
737 |
|
|
|
|
|
|
|
|
|
|
|
|
|
|
|
69
A reconciliation of the total income tax (benefit) expense from continuing operations to the statutory federal rate is as follows for the fiscal years ended January 31:
|
|
|
|
|
|
|
|
|
|
|
|
|
|
|
|
|
|
|
|
|
|
|
|
|
|
|
|
|
|
|
|
|
2018 |
|
|
|
2017 |
|
|
|
2016 |
|
|
|
|||||||||||||||
|
(in thousands) |
|
Amount |
|
|
Effective Rate |
|
|
|
Amount |
|
|
Effective Rate |
|
|
|
Amount |
|
|
Effective Rate |
|
|
|
||||||
|
Income tax at statutory rate |
|
$ |
(4,999 |
) |
|
|
32.8 |
|
% |
|
$ |
(15,972 |
) |
|
|
35.0 |
|
% |
|
$ |
(16,665 |
) |
|
|
35.0 |
|
% |
|
|
State income tax, net |
|
|
1,282 |
|
|
|
(8.4 |
) |
|
|
|
(3,655 |
) |
|
|
8.0 |
|
|
|
|
579 |
|
|
|
(1.2 |
) |
|
|
|
Difference in tax expense resulting from: |
|
|
|
|
|
|
|
|
|
|
|
|
|
|
|
|
|
|
|
|
|
|
|
|
|
|
|
|
|
Nondeductible expenses |
|
|
1,677 |
|
|
|
(11.0 |
) |
|
|
|
1,123 |
|
|
|
(2.5 |
) |
|
|
|
708 |
|
|
|
(1.5 |
) |
|
|
|
Taxes on foreign affiliates |
|
|
(683 |
) |
|
|
4.5 |
|
|
|
|
558 |
|
|
|
(1.2 |
) |
|
|
|
2,213 |
|
|
|
(4.6 |
) |
|
|
|
Taxes on foreign operations |
|
|
1,819 |
|
|
|
(11.9 |
) |
|
|
|
478 |
|
|
|
(1.0 |
) |
|
|
|
(13,594 |
) |
|
|
28.6 |
|
|
|
|
Foreign tax exemption |
|
|
(3,493 |
) |
|
|
22.9 |
|
|
|
|
— |
|
|
|
— |
|
|
|
|
— |
|
|
|
— |
|
|
|
|
Impact of the Tax Cuts and Jobs Act |
|
|
31,100 |
|
|
|
(204.1 |
) |
|
|
|
— |
|
|
|
— |
|
|
|
|
— |
|
|
|
— |
|
|
|
|
Impact of deemed dividend from Tax Cuts and Jobs Act |
|
|
1,983 |
|
|
|
(13.0 |
) |
|
|
|
— |
|
|
|
— |
|
|
|
|
— |
|
|
|
— |
|
|
|
|
Tax benefit related to tax expenses recorded on discontinued operations and equity |
|
|
— |
|
|
|
— |
|
|
|
|
— |
|
|
|
— |
|
|
|
|
(1,225 |
) |
|
|
2.6 |
|
|
|
|
Valuation allowance |
|
|
(37,884 |
) |
|
|
248.6 |
|
|
|
|
17,513 |
|
|
|
(38.4 |
) |
|
|
|
32,742 |
|
|
|
(68.8 |
) |
|
|
|
Changes in uncertain tax provisions |
|
|
(959 |
) |
|
|
6.3 |
|
|
|
|
(471 |
) |
|
|
1.0 |
|
|
|
|
(1,200 |
) |
|
|
2.5 |
|
|
|
|
Other |
|
|
(218 |
) |
|
|
1.4 |
|
|
|
|
1,846 |
|
|
|
(4.0 |
) |
|
|
|
(2,821 |
) |
|
|
5.9 |
|
|
|
|
Total |
|
$ |
(10,375 |
) |
|
|
68.1 |
|
% |
|
$ |
1,420 |
|
|
|
(3.1 |
) |
% |
|
$ |
737 |
|
|
|
(1.5 |
) |
% |
|
|
|
|
|
|
|
|
|
|
|
|
|
|
|
|
|
|
|
|
|
|
|
|
|
|
|
|
|
|
|
Our effective tax rate reconciliation includes a $3.5 million income tax benefit resulting from a foreign jurisdiction issuing a tax ruling exempting certain income from taxation during the fourth quarter of the fiscal year ended January 31, 2018. We recorded $8.8 million tax benefit by reducing previously accrued foreign taxes and interest which was partially offset by tax expense of $5.3 million recorded on the related reduction in our U.S. foreign tax credit carryforward which was included in our deferred tax asset. The reduction in our deferred tax asset resulted in an offsetting reduction in our valuation allowance of $5.3 million, which is included in the $37.9 million adjustment to the valuation allowance included in our tax rate reconciliation. The net impact is an income tax benefit of $8.8 million.
The tax effect on pretax loss from continuing operations generally is determined by a computation that does not consider the tax effect on other categories of income or loss (for example, other comprehensive loss, discontinued operations, additional paid in capital, etc.). An exception to that general rule is provided when there is a pretax loss from continuing operations and pretax income from other categories of income. Pursuant to this exception, we recorded a tax benefit on continuing operations during the fiscal year ended January 31, 2016. During the fiscal year ended January 31, 2016, a tax benefit of $1.2 million was recorded on continuing operations which offset tax expense recorded on discontinued operations.
We recorded ($37.9) million, $17.5 million and $32.7 million of valuation allowances from continuing operations on our net domestic and certain foreign deferred tax assets during the fiscal years ended January 31, 2018, 2017 and 2016, respectively. The valuation allowance recorded for the fiscal year ended January 31, 2018 was recorded on deferred tax assets generated during the year and was primarily related to the impact on deferred taxes resulting from the passage of The Act. The total valuation allowance at January 31, 2018 of $130.6 million was comprised of a domestic valuation allowance of $113.7 million and a foreign valuation allowance of $16.9 million.
In assessing the need for a valuation allowance, we concluded that we had a cumulative loss on domestic operations after adjusting for significant non-recurring charges beginning in the fiscal year ended January 31, 2016 and continuing through the fiscal year ended January 31, 2018. Based on this assessment, we concluded that it was not more likely than not that realization of our domestic deferred tax assets would occur in future periods and accordingly a valuation allowance was provided. Similar consideration was given to foreign deferred tax assets and we concluded that certain foreign deferred tax assets were also not more likely than not to be realized and a valuation allowance was recorded. The establishment of a valuation allowance does not have any impact on cash, nor does such an allowance preclude us from using our loss carryforwards or utilizing other deferred tax assets in the future.
70
The net income (loss) from discontinued operations for the fiscal years ended January 31, 2018, 2017 and 2016 was $22.4 million, ($5.2) million and $3.5 million, respectively. These amounts are net of income tax (expense) benefit of $0.0 million, $0.0 million and ($1.3) million, respectively. The effective tax rates for discontinued operations were 0.0%, 0.0% and 26.4% for the fiscal years ended January 31, 2018, 2016 and 2015, respectively.
Deferred income taxes result from temporary differences between the financial statement and tax bases of our assets and liabilities. The sources of these differences and their cumulative tax effects were as follows:
|
|
|
Years Ended January 31, |
|
|||||
|
(in thousands) |
|
2018 |
|
|
2017 |
|
||
|
Accruals |
|
$ |
14,310 |
|
|
$ |
24,719 |
|
|
Equity-based compensation |
|
|
1,725 |
|
|
|
2,525 |
|
|
Intangibles |
|
|
1,656 |
|
|
|
3,429 |
|
|
Foreign tax credit carryforwards |
|
|
41,539 |
|
|
|
47,827 |
|
|
Tax loss carryforwards |
|
|
58,671 |
|
|
|
70,966 |
|
|
Cumulative currency translation adjustment |
|
|
5,068 |
|
|
|
5,068 |
|
|
Capital loss carryforwards |
|
|
8,677 |
|
|
|
12,861 |
|
|
Other assets |
|
|
3,883 |
|
|
|
1,418 |
|
|
Total deferred tax asset |
|
|
135,529 |
|
|
|
168,813 |
|
|
Valuation allowance |
|
|
(130,613 |
) |
|
|
(157,664 |
) |
|
Buildings, machinery and equipment |
|
|
(3,721 |
) |
|
|
(6,687 |
) |
|
Convertible Notes |
|
|
(419 |
) |
|
|
(1,530 |
) |
|
Unremitted foreign earnings |
|
|
(608 |
) |
|
|
(4,782 |
) |
|
Other liabilities |
|
|
(717 |
) |
|
|
(2,107 |
) |
|
Total deferred tax liability |
|
|
(5,465 |
) |
|
|
(15,106 |
) |
|
Net deferred tax liability |
|
$ |
(549 |
) |
|
$ |
(3,957 |
) |
|
|
|
|
|
|
|
|
|
|
We had the following tax losses and tax credit carryforwards at January 31, 2018:
|
|
|
|
|
Gross |
|
|
Expected Tax |
|
|
|
|
|
||
|
|
|
|
|
Carryforward |
|
|
Benefit |
|
|
Valuation |
|
|||
|
(dollars in millions) |
|
Expiration |
|
Amount |
|
|
Amount |
|
|
Allowance |
|
|||
|
Federal net operating loss carryforwards |
|
2034-2038 |
|
$ |
150.2 |
|
|
$ |
31.5 |
|
|
$ |
(31.5 |
) |
|
State net operating loss carryforwards |
|
2019-2038 |
|
|
222.8 |
|
|
|
12.4 |
|
|
|
(12.4 |
) |
|
Federal capital loss carryforwards |
|
2020 |
|
|
33.5 |
|
|
|
7.1 |
|
|
|
(7.1 |
) |
|
State capital loss carryforwards |
|
2020 |
|
|
33.5 |
|
|
|
1.6 |
|
|
|
(1.6 |
) |
|
Foreign tax loss carryforwards |
|
2019-2033 |
|
|
48.8 |
|
|
|
14.7 |
|
|
|
(14.7 |
) |
|
Federal foreign tax credit carryforwards |
|
2019-2022 |
|
n/a |
|
|
|
13.2 |
|
|
|
(13.2 |
) |
|
|
Federal foreign tax credit carryforwards |
|
2023-2027 |
|
n/a |
|
|
|
28.3 |
|
|
|
(28.3 |
) |
|
|
Total |
|
|
|
|
|
|
|
$ |
108.8 |
|
|
$ |
(108.8 |
) |
We intend to indefinitely reinvest certain earnings of our foreign subsidiaries and affiliates. As of January 31, 2018, accumulated undistributed earnings that were considered indefinitely reinvested totaled $40.3 million. The Act generally eliminates U.S. federal income taxes on dividends from foreign subsidiaries after January 31, 2018. As a result, the accumulated undistributed earnings would only be subject to other taxes, such as withholding taxes and local taxes, on distribution of such earnings. It is not practicable to determine the amount of income or withholding tax that would be payable upon remittance of these earnings.
Deferred foreign withholding taxes have been provided on undistributed earnings of certain foreign subsidiaries and foreign Affiliates where the earnings are not considered to be invested indefinitely.
71
A reconciliation of the beginning and ending amount of gross unrecognized tax benefits, excluding penalties and interest is as follows:
|
|
|
Years Ended January 31, |
|
|||||||||
|
(in thousands) |
|
2018 |
|
|
2017 |
|
|
2016 |
|
|||
|
Balance, beginning of year |
|
$ |
18,449 |
|
|
$ |
10,809 |
|
|
$ |
13,018 |
|
|
Additions based on tax positions related to current year |
|
|
70 |
|
|
|
7,354 |
|
|
|
81 |
|
|
Additions for tax positions of prior years |
|
|
94 |
|
|
|
1,669 |
|
|
|
1,326 |
|
|
Settlement with tax authorities |
|
|
— |
|
|
|
(1,168 |
) |
|
|
— |
|
|
Reductions for tax positions of prior years |
|
|
(146 |
) |
|
|
(55 |
) |
|
|
(3,392 |
) |
|
Reductions due to the lapse of statutes of limitation |
|
|
(1,138 |
) |
|
|
(160 |
) |
|
|
(224 |
) |
|
Balance, end of year |
|
$ |
17,329 |
|
|
$ |
18,449 |
|
|
$ |
10,809 |
|
|
|
|
|
|
|
|
|
|
|
|
|
|
|
Substantially all of the unrecognized tax benefits recorded at January 31, 2018, 2017 and 2016 would affect the effective rate if recognized. It is reasonably possible that the amount of unrecognized tax benefits will decrease during the next year by approximately $4.5 million due to settlements of audit issues and expiration of statutes of limitation.
We classify interest and penalties related to income taxes as a component of income tax expense. As of January 31, 2018, 2017 and 2016, we had $9.0 million, $8.7 million and $7.8 million, respectively, of interest and penalties accrued associated with unrecognized tax benefits. The liability for interest and penalties increased (decreased) $0.3 million, $0.9 million and ($.07) million during the fiscal years ended January 31, 2018, 2017 and 2016, respectively.
We file income tax returns in the U.S., various state jurisdictions and certain foreign jurisdictions. The statute of limitations remains open for tax years ended January 31, 2011, 2013 and 2015 through 2018. We recently completed our IRS exam for the tax year ended January 31, 2013 with no significant change to income tax expense. We have several state examinations currently in progress.
We file income tax returns in the foreign jurisdictions where we operate. The returns are subject to examination which may be ongoing at any point in time. Tax liabilities are recorded based on estimates of additional taxes which will be due upon settlement of those examinations. The tax years subject to examination by foreign tax authorities vary by jurisdiction, but generally the tax years 2015 through 2018 remain open to examination.
(11) Operating Lease Obligations
Our operating leases are primarily for buildings, light and medium duty trucks and other equipment. We sublease certain portions of our facilities under non-cancelable sublease agreements.
Rent expense under operating leases (including insignificant amounts of contingent rental payments and sublease rental income) was $3.3 million, $4.3 million and $7.0 million for the fiscal years ended January 31, 2018, 2017 and 2016, respectively.
Future minimum lease payments required under operating leases that have initial or remaining non-cancelable lease terms and related subleases in excess of one year from January 31, 2018, are as follows:
|
|
|
Minimum Rental |
|
|
|
(in thousands) |
|
Commitments |
|
|
|
Fiscal Year 2019 |
|
$ |
2,649 |
|
|
Fiscal Year 2020 |
|
|
1,919 |
|
|
Fiscal Year 2021 |
|
|
1,775 |
|
|
Fiscal Year 2022 |
|
|
1,415 |
|
|
Fiscal Year 2023 |
|
|
1,373 |
|
|
Minimum lease payments |
|
$ |
9,131 |
|
|
|
|
|
|
|
72
(12) Employee Benefit Plans
Our salaried and certain hourly employees are eligible to participate in our sponsored, defined contribution plans. Total expense recorded in selling, general and administrative costs for our portion of these plans was $2.7 million, $3.1 million and $3.0 million for the fiscal years ended January 31, 2018, 2017 and 2016, respectively.
We have a deferred compensation plan for certain management employees, however the plan was suspended during the fiscal year ended January 31, 2015. Participants could elect to defer up to 25% of their salaries and up to 50% of their bonuses to the plan. Matching contributions and the vesting period of those contributions, were established at our discretion. Employee deferrals are vested at all times. The total liability for deferred compensation was $4.1 million and $5.1 million as of January 31, 2018 and 2017, respectively. These liabilities are primarily included in other non-current liabilities, except for those amounts due in the next twelve months, which are recorded in accrued compensation in the Consolidated Balance Sheet.
We contribute to a number of multiemployer defined benefit pension plans under the terms of collective-bargaining agreements that cover our union-represented employees. The risks of participating in these multiemployer plans are different from single-employer plans in the following aspects:
|
|
• |
assets contributed to the multiemployer plan by one employer may be used to provide benefits to employees of other participating employers; |
|
|
• |
if a participating employer stops contributing to the plan, the unfunded obligations of the plan may be borne by the remaining participating employers; and |
|
|
• |
if we choose to stop participating in some of our multiemployer plans, we may be required to pay those plans an amount based on the underfunded status of the plan, referred to as a withdrawal liability. |
In accordance with accounting guidance, we evaluated each of our multiemployer plans to determine if any were individually significant. The evaluation was based on the following criteria:
|
|
• |
the total employees participating in the multiemployer plan compared to the total employees covered by the plan; |
|
|
• |
the total contributions to the multiemployer plan as a percentage of the total contributions to the plan by all participating employers; and |
|
|
• |
the amount of potential liability that could be incurred due to our withdrawal from the multiemployer plan, underfunded status of the plan or other participating employers’ withdrawal from the plan. |
As of January 31, 2018 and 2017, we did not participate in multiemployer plans that would be considered individually significant.
We make contributions to these multiemployer plans equal to the amounts accrued for pension expense. Total contributions and union pension expense for these plans was $1.1 million, $1.9 million and $2.1 million for the fiscal years ended January 31, 2018, 2017 and 2016, respectively. Information regarding assets and accumulated benefits of these plans has not been made available to us.
We also provide supplemental retirement benefits to a former chief executive officer. Benefits are computed based on the compensation earned during the highest five consecutive years of employment reduced for a portion of Social Security benefits and an annuity equivalent of his defined contribution plan balance. We do not contribute to the plan or maintain any investment assets related to the expected benefit obligation. We have recognized the full amount of our actuarially determined pension liability. The current portion recognized in our Consolidated Balance Sheets as other accrued expenses was $0.3 million as of January 31, 2018 and 2017. The long-term portion recognized in our Consolidated Balance Sheets as of January 31, 2018 and 2017 was $5.1 million, as other non-current liabilities. Net periodic pension cost (benefit) of the supplemental retirement benefits for the fiscal years ended January 31, 2018, 2017 and 2016 was $ 0.3 million, $0.2 million and ($0.4) million, respectively.
(13) Equity-Based Compensation
Layne has an equity-based compensation plan that provides for the granting of options to purchase or the issuance of shares of common stock at a price fixed by the Board of Directors or a committee. As of January 31, 2018, there were 787,247 shares which remain available to be granted under the plan as stock options or restricted stock awards. We have the ability to issue shares under the plan either from new issuances or from treasury, although we have previously always issued new shares and expect to continue to issue new shares in the future.
73
We granted 263,946 restricted stock units and 277,799 performance vesting restricted stock units under the Layne Christensen Company 2006 Equity Incentive Plan during the fiscal year ended January 31, 2018. The grants consist of both service-based awards and market-based awards. All of the awards granted during the twelve month period ended January 31, 2018, may be settled in cash or shares at the Compensation Committee’s discretion except for 36,725 restricted stock units granted to the Board of Directors that are required to be settled in shares. It is the intention to settle all awards in shares.
We recognized $3.1 million, $3.5 million and $3.9 million of compensation cost for equity-based plans for the fiscal years ended January 31, 2018, 2017 and 2016, respectively. Of these amounts, $2.9 million, $3.0 million and $3.0 million, respectively, related to non-vested stock. There was no income tax benefit recognized on our equity-based compensation as a full valuation allowance has been provided on our deferred tax asset.
As of January 31, 2018, total unrecognized compensation cost related to unvested stock options was approximately $0.1 million, which is expected to be recognized over a weighted-average period of 0.4 years. As of January 31, 2018, there was approximately $3.9 million of total unrecognized compensation cost related to nonvested restricted stock awards and restricted stock units that is expected to be recognized over a weighted-average period of 1.8 years.
The fair value of equity-based compensation granted in the form of stock options is determined using a lattice valuation model. The valuations in each respective year were made using the assumptions noted in the following table. Expected volatilities are based on historical volatility of the stock price. We use historical data to estimate early exercise and post-vesting forfeiture rates to be applied within the valuation model. The risk-free interest rate for the periods within the expected term of the option is based on the U.S. Treasury yield curve in effect at the time of grant. The weighted-average fair value per share at the date of grant for options granted during the fiscal years ended January 31, 2017 and 2016 was $1.59 and $1.60, respectively.
|
|
|
|
|
Years Ended January 31, |
|
|||||
|
Assumptions: |
|
|
|
2017 |
|
|
2016 |
|
||
|
Weighted-average expected volatility |
|
|
|
56.1% |
|
|
52.6% |
|
||
|
Expected dividend yield |
|
|
|
0% |
|
|
0% |
|
||
|
Risk-free interest rate |
|
|
|
0.60% |
|
|
0.70% |
|
||
|
Expected term (in years) |
|
|
|
|
1.9 |
|
|
|
3.3 |
|
|
Exercise multiple factor |
|
|
|
|
1.39 |
|
|
|
1.65 |
|
|
Post-vesting forfeiture |
|
|
|
20.3% |
|
|
12.5% |
|
||
74
Stock option transactions for the fiscal years ended January 31, 2018, 2017 and 2016 were as follows:
|
|
|
|
|
|
|
|
|
|
|
|
|
|
|
|
|
|
|
|
|
|
|
|
|
|
|
|
|
|
|
|
|
|
|
|
|
|
|
Number of Shares |
|
|
Weighted Average Exercise Price |
|
|
Weighted Average Remaining Contractual Term (Years) |
|
|
Intrinsic Value (in thousands) |
|
||||
|
Outstanding at January 31, 2015 |
|
|
1,015,514 |
|
|
$ |
21.15 |
|
|
|
|
|
|
|
|
|
|
Granted |
|
|
106,168 |
|
|
|
5.51 |
|
|
|
|
|
|
|
|
|
|
Exercised |
|
|
— |
|
|
|
— |
|
|
|
|
|
|
$ |
— |
|
|
Expired |
|
|
(77,707 |
) |
|
|
24.73 |
|
|
|
|
|
|
|
|
|
|
Forfeited |
|
|
(204,260 |
) |
|
|
26.20 |
|
|
|
|
|
|
|
|
|
|
Outstanding at January 31, 2016 |
|
|
839,715 |
|
|
|
17.61 |
|
|
|
|
|
|
|
|
|
|
Granted |
|
|
134,433 |
|
|
|
7.04 |
|
|
|
|
|
|
|
|
|
|
Exercised |
|
|
— |
|
|
|
— |
|
|
|
|
|
|
|
— |
|
|
Expired |
|
|
(10,000 |
) |
|
|
29.29 |
|
|
|
|
|
|
|
|
|
|
Forfeited |
|
|
(214,104 |
) |
|
|
21.19 |
|
|
|
|
|
|
|
|
|
|
Outstanding at January 31, 2017 |
|
|
750,044 |
|
|
|
14.54 |
|
|
|
|
|
|
|
|
|
|
Exercised |
|
|
(25,000 |
) |
|
|
8.22 |
|
|
|
|
|
|
|
|
|
|
Expired |
|
|
(19,125 |
) |
|
|
42.42 |
|
|
|
|
|
|
|
— |
|
|
Forfeited |
|
|
(46,833 |
) |
|
|
24.98 |
|
|
|
|
|
|
|
|
|
|
Outstanding at January 31, 2018 |
|
|
659,086 |
|
|
|
13.23 |
|
|
|
6.1 |
|
|
|
2,195 |
|
|
|
|
|
|
|
|
|
|
|
|
|
|
|
|
|
|
|
|
Exercisable at January 31, 2016 |
|
|
576,871 |
|
|
|
19.00 |
|
|
|
|
|
|
|
|
|
|
Exercisable at January 31, 2017 |
|
|
611,453 |
|
|
|
15.43 |
|
|
|
|
|
|
|
|
|
|
Exercisable at January 31, 2018 |
|
|
649,086 |
|
|
|
13.30 |
|
|
|
6.0 |
|
|
|
2,146 |
|
|
Options expected to vest at January 31, 2018 |
|
|
10,000 |
|
|
|
8.60 |
|
|
|
7.5 |
|
|
|
49 |
|
The aggregate intrinsic value was calculated using the difference between the current market price and the exercise price for only those options that have an exercise price less than the current market price.
Nonvested stock awards having service requirements only, are valued as of the grant date closing stock price and generally vest ratably over service periods of one to five years. Other nonvested stock awards vest based upon Layne meeting various performance goals. Certain nonvested stock awards provide for accelerated vesting if there is a change of control (as defined in the plans), termination of employment without cause, retirement or the disability or the death of the executive and for equitable adjustment in the event of changes in our equity structure. We granted certain performance based nonvested stock awards during the years ended January 31, 2018, 2017 and 2016, which were valued using the Monte Carlo simulation model.
Assumptions used in the Monte Carlo simulation model for the fiscal years ended January 31, 2018, 2017 and 2016 were as follows:
|
|
|
Years Ended January 31, |
|
|||||||||
|
Assumptions: |
|
2018 |
|
|
2017 |
|
|
2016 |
|
|||
|
Weighted-average expected volatility |
|
|
59.6 |
% |
|
|
58.3 |
% |
|
|
44.2 |
% |
|
Expected dividend yield |
|
|
0.0 |
% |
|
|
0.0 |
% |
|
|
0.0 |
% |
|
Weighted-average risk free rate |
|
|
1.5 |
% |
|
|
0.9 |
% |
|
|
0.9 |
% |
|
Weighted-average fair value |
|
$ |
6.92 |
|
|
$ |
4.70 |
|
|
$ |
3.04 |
|
75
Non-vested share transactions for the fiscal years ended January 31, 2018, 2017 and 2016 were as follows:
|
|
|
Number of Shares |
|
|
Average Grant Date Fair Value |
|
|
Intrinsic Value (in thousands) |
|
|||
|
Nonvested stock at January 31, 2015 |
|
|
487,292 |
|
|
|
14.86 |
|
|
|
|
|
|
Granted - Directors |
|
|
24,085 |
|
|
|
5.19 |
|
|
|
|
|
|
Granted - Restricted stock units |
|
|
130,287 |
|
|
|
5.25 |
|
|
|
|
|
|
Granted - Performance vesting shares |
|
|
1,035,409 |
|
|
|
3.03 |
|
|
|
|
|
|
Vested |
|
|
(182,563 |
) |
|
|
17.07 |
|
|
|
|
|
|
Forfeited |
|
|
(87,340 |
) |
|
|
8.57 |
|
|
|
|
|
|
Nonvested stock at January 31, 2016 |
|
|
1,407,170 |
|
|
|
5.20 |
|
|
|
|
|
|
Granted - Directors |
|
|
13,495 |
|
|
|
7.04 |
|
|
|
|
|
|
Granted - Restricted stock units |
|
|
199,352 |
|
|
|
7.04 |
|
|
|
|
|
|
Granted - Performance vesting shares |
|
|
447,903 |
|
|
|
4.70 |
|
|
|
|
|
|
Vested |
|
|
(26,349 |
) |
|
|
6.22 |
|
|
|
|
|
|
Forfeited |
|
|
(169,931 |
) |
|
|
8.29 |
|
|
|
|
|
|
Nonvested stock at January 31, 2017 |
|
|
1,871,640 |
|
|
|
5.00 |
|
|
|
|
|
|
Granted - Directors |
|
|
36,725 |
|
|
|
8.85 |
|
|
|
|
|
|
Granted - Restricted stock units |
|
|
227,221 |
|
|
|
8.95 |
|
|
|
|
|
|
Granted - Performance vesting shares |
|
|
277,799 |
|
|
|
6.92 |
|
|
|
|
|
|
Vested |
|
|
(141,537 |
) |
|
|
12.52 |
|
|
|
|
|
|
Forfeited |
|
|
(314,045 |
) |
|
|
5.55 |
|
|
|
|
|
|
Nonvested stock at January 31, 2018 |
|
|
1,957,803 |
|
|
|
5.17 |
|
|
$ |
26,411 |
|
|
|
|
|
|
|
|
|
|
|
|
|
|
|
(14) Fair Value Measurements
Our estimates of fair value for financial assets and financial liabilities are based on the framework established in the fair value accounting guidance. The framework is based on the inputs used in the valuation, gives the highest priority to quoted prices in active markets and requires that observable inputs be used in the valuations when available. The three levels of the hierarchy are as follows:
|
|
• |
Level 1 – Unadjusted quoted prices in active markets for identical assets or liabilities. |
|
|
• |
Level 2 – Observable inputs other than those included in Level 1, such as quoted market prices for similar assets and liabilities in active markets or quoted prices for identical assets in inactive markets. |
|
|
• |
Level 3 – Unobservable inputs reflecting our own assumptions and best estimate of what inputs market participants would use in pricing an asset or liability. |
Our assessment of the significance of a particular input to the fair value in its entirety requires judgment and considers factors specific to the asset or liability. Our financial instruments held at fair value, are presented below as of January 31, 2018 and 2017:
|
|
|
|
|
|
|
Fair Value Measurements |
|
|||||||||
|
(in thousands) |
|
Carrying Value |
|
|
Level 1 |
|
|
Level 2 |
|
|
Level 3 |
|
||||
|
January 31, 2018 |
|
|
|
|
|
|
|
|
|
|
|
|
|
|
|
|
|
Financial Assets: |
|
|
|
|
|
|
|
|
|
|
|
|
|
|
|
|
|
Long-term restricted deposits held at fair value |
|
$ |
6,572 |
|
|
$ |
6,572 |
|
|
$ |
— |
|
|
$ |
— |
|
|
Contingent consideration receivable(1) |
|
|
4,244 |
|
|
|
— |
|
|
|
— |
|
|
|
4,244 |
|
|
|
|
|
|
|
|
|
|
|
|
|
|
|
|
|
|
|
|
January 31, 2017 |
|
|
|
|
|
|
|
|
|
|
|
|
|
|
|
|
|
Financial Assets: |
|
|
|
|
|
|
|
|
|
|
|
|
|
|
|
|
|
Long-term restricted deposits held at fair value |
|
$ |
5,055 |
|
|
$ |
5,055 |
|
|
$ |
— |
|
|
$ |
— |
|
|
Contingent consideration receivable(1) |
|
|
4,244 |
|
|
|
— |
|
|
|
— |
|
|
|
4,244 |
|
76
|
|
(1) |
The contingent consideration receivable represents our share in the profits of one of the contracts assumed by the purchaser, as part of the sale of the Geoconstruction business on August 17, 2015. The amount was estimated based on the projected profits of the contract. There have been no changes in the estimated fair value since the closing date of the sale agreement. |
Other Financial Instruments
We use the following methods and assumptions in estimating the fair value disclosures for our other financial instruments:
Cash equivalents – The carrying amounts reported in the accompanying Consolidated Balance Sheets approximates their fair values and are classified as Level 1 within the fair value hierarchy.
Short-term and long-term debt, other than the convertible notes – The fair value of debt instruments is classified as Level 2 within the fair value hierarchy and is valued using a market approach based on quoted prices for similar instruments traded in active markets. Where quoted prices are not available, the income approach is used to value these instruments based on the present value of future cash flows discounted at estimated borrowing rates for similar debt instruments or on estimated prices based on current yields for debt issues of similar quality and terms.
Convertible notes – The convertible notes are measured on a non-recurring basis using Level 1 inputs based upon observable quoted prices of the 4.25% Convertible Notes and the 8.0% Convertible Notes.
The following table summarizes the carrying values and estimated fair values of our debt:
|
|
|
January 31, 2018 |
|
|
January 31, 2017 |
|
||||||||||
|
|
|
Carrying |
|
|
Fair |
|
|
Carrying |
|
|
Fair |
|
||||
|
(in thousands) |
|
Value |
|
|
Value |
|
|
Value |
|
|
Value |
|
||||
|
4.25% Convertible Notes |
|
$ |
67,248 |
|
|
$ |
68,631 |
|
|
$ |
64,387 |
|
|
$ |
64,705 |
|
|
8.0% Convertible Notes |
|
|
98,769 |
|
|
|
122,150 |
|
|
|
97,952 |
|
|
|
92,156 |
|
(15) Contingencies
Our drilling activities involve certain operating hazards that can result in personal injury or loss of life, damage and destruction of property and equipment, damage to the surrounding areas, release of hazardous substances or wastes and other damage to the environment, interruption or suspension of drill site operations and loss of revenues and future business. The magnitude of these operating risks is amplified when we, as is frequently the case, conduct a project on a fixed-price, turn-key basis where we delegate certain functions to subcontractors but remain responsible to the customer for the subcontracted work. In addition, we are exposed to potential liability under foreign, federal, state and local laws and regulations, contractual indemnification agreements or otherwise in connection with our services and products. Litigation arising from any such occurrences may result in Layne being named as a defendant in lawsuits asserting large claims. Although we maintain insurance protection that we consider economically prudent, there can be no assurance that any such insurance will be sufficient or effective under all circumstances or against all claims or hazards to which we may be subject or that we will be able to continue to obtain such insurance protection. A successful claim or damage resulting from a hazard for which we are not fully insured could have a material adverse effect on us. In addition, we do not maintain political risk insurance with respect to our foreign operations.
Through one of our discontinued segments, Geoconstruction, we were a subcontractor on the foundation for the Salesforce Tower office building in San Francisco, California in 2013 and 2014. Certain anomalies were discovered in March 2014 in the foundation’s structural concrete, which were remediated by the general contractor during 2015. We have participated in discussions with the project owner and the general contractor regarding potential causes of the anomalies. We have assigned our claims under the project's builder's risk insurance policy to the general contractor. During the fiscal year ended January 31, 2016, the project owner and the general contractor submitted a claim to the project’s builder’s risk insurers to cover the cost of remedial work and related damages. The claim was denied by the builder’s risk insurers and the project owner and the general contractor subsequently filed a legal proceeding against the insurers seeking coverage under the builder’s risk insurance policy. Although we were not a party to this legal proceeding, we believe, based on court filings in the legal proceeding, that the project owner and the general contractor are asserting a claim for damages against the project’s builder’s risk insurers of approximately $100 million. Management does not believe that we are liable for any of the remediation costs or other claims related to this project. As of the date of this report, no action has been filed against us. Accordingly, no provision has been made in these Consolidated Financial Statements.
77
We are involved in various other matters of litigation, claims and disputes which have arisen in the ordinary course of business. We believe that the ultimate disposition of these matters will not, individually and in the aggregate, have a material adverse effect upon our business or consolidated financial position, results of operations or cash flows. However, it is possible, that future results of operations for any particular quarterly or annual period could be materially affected by changes in the assumptions related to these proceedings. In accordance with GAAP, we record a liability when it is both probable that a liability has been incurred and the amount of the loss can be reasonably estimated. These provisions are reviewed at least quarterly and adjusted to reflect the impacts of negotiations, settlements, rulings, advice of legal counsel and other information and events pertaining to a particular case. To the extent additional information arises or the strategies change, it is possible that our estimate of the probable liability in these matters may change
Litigation Relating to the Merger
On April 3, 2018, two putative class actions captioned Malka Raul v. Layne Christensen Company, et al., and Colleen Witmer v. Layne Christensen Company, et al., were filed in the U.S. District Court for the Southern District of Texas against Layne, Layne’s directors, Granite and Merger Sub. The complaints generally allege that Layne, the Layne directors and Granite disseminated a false or misleading registration statement regarding the proposed merger in violation of Section 14(a) of the Exchange Act and SEC Rule 14a-9. Specifically, the complaints allege that the registration statement misstated or omitted material information regarding the parties’ financial projections, the valuation analysis performed by Greentech in support of its fairness opinion, and potential conflicts of interest of Greentech. The complaints further allege that the Layne directors and/or Granite are liable for these violations as “controlling persons” of Layne under Section 20(a) of the Exchange Act. The complaints seek injunctive relief, including to enjoin and/or rescind the merger, rescission or rescissory damages in the event the merger is consummated, and an award of attorneys’ fees, in addition to other relief.
Additional lawsuits arising out of the merger may be filed in the future. There can be no assurance that any of the defendants will be successful in the outcome of the pending or any potential future lawsuits. A preliminary injunction could delay or jeopardize the completion of the merger, and an adverse judgment granting permanent injunctive relief could indefinitely enjoin the completion of the merger. Layne and Granite believe that the lawsuits are without merit and intend to defend vigorously against the lawsuits and any other future lawsuits challenging the transaction.
(16) Discontinued Operations
Heavy Civil
On April 30, 2017, we completed the sale of substantially all of the assets of the Heavy Civil business to Reycon Partners LLC (the "Buyer"), which is owned by a group of private investors, including members of the former Heavy Civil senior management team. The purchase price was $10.1 million, less an estimate of the amount by which the business’s working capital was less than an agreed upon target amount. After final working capital adjustments, the purchase price was $3.5 million.
At January 31, 2017, we performed an asset impairment test of the Heavy Civil reporting segment and no impairment was indicated.
Geoconstruction
On August 17, 2015, we sold our Geoconstruction business segment to a subsidiary of Keller Foundations, LLC, a member of Keller Group plc (“Keller”), for a total of $42.3 million, including the preliminary estimate of the business segment’s working capital. After post-closing adjustments, the total purchase price increased to $47.7 million, to adjust for our estimated share in the profits of one of the contracts being assumed by Keller and final working capital adjustments. In addition, as of January 31, 2018 and 2017, we have a $4.2 million contingent consideration receivable, included in Other Assets in the Consolidated Balance Sheet. The contingent consideration represents our best estimate of our share in the profits of one of the contracts assumed by Keller.
The components of assets and liabilities of discontinued operations in the Condensed Consolidated Balance Sheets are as follows:
78
|
|
|
|
|
As of January 31, |
|
|
|
(in thousands) |
|
|
|
2017 |
|
|
|
Major classes of assets |
|
|
|
|
|
|
|
Customer receivables |
|
|
|
$ |
13,731 |
|
|
Costs and estimated earnings in excess of billings on uncompleted contracts |
|
|
|
|
22,970 |
|
|
Inventories |
|
|
|
|
2,426 |
|
|
Other current assets |
|
|
|
|
1,033 |
|
|
Total current assets of discontinued operations |
|
|
|
|
40,160 |
|
|
Property and equipment, net |
|
|
|
|
5,235 |
|
|
Other assets of discontinued operations |
|
|
|
|
895 |
|
|
Total major classes of assets of discontinued operations |
|
|
|
$ |
46,290 |
|
|
Major classes of liabilities |
|
|
|
|
|
|
|
Accounts payable |
|
|
|
$ |
16,963 |
|
|
Billings in excess of costs and estimated earnings on uncompleted contracts |
|
|
|
|
3,530 |
|
|
Other current liabilities |
|
|
|
|
87 |
|
|
Total current liabilities of discontinued operations |
|
|
|
|
20,580 |
|
|
Total major classes of liabilities of discontinued operations |
|
|
|
$ |
20,580 |
|
The financial results of discontinued operations are as follows:
|
|
|
Year Ended January 31, |
|
|||||||||
|
(in thousands) |
|
2018 |
|
|
2017 |
|
|
2016 |
|
|||
|
Revenue |
|
$ |
30,359 |
|
|
$ |
137,189 |
|
|
$ |
210,780 |
|
|
Cost of revenues (exclusive of depreciation and amortization, shown below) |
|
|
(28,864 |
) |
|
|
(128,910 |
) |
|
|
(193,440 |
) |
|
Selling, general and administrative expenses (exclusive of depreciation and amortization, shown below) |
|
|
(4,577 |
) |
|
|
(11,655 |
) |
|
|
(19,878 |
) |
|
Depreciation and amortization |
|
|
(287 |
) |
|
|
(1,609 |
) |
|
|
(5,833 |
) |
|
Gain on sale of fixed assets |
|
|
4 |
|
|
|
265 |
|
|
|
558 |
|
|
Equity in earnings of affiliates |
|
|
— |
|
|
|
— |
|
|
|
1,104 |
|
|
Restructuring costs |
|
|
(27 |
) |
|
|
(424 |
) |
|
|
(765 |
) |
|
Other income items |
|
|
(30 |
) |
|
|
(43 |
) |
|
|
(614 |
) |
|
Total operating loss on discontinued operations before income taxes |
|
|
(3,422 |
) |
|
|
(5,187 |
) |
|
|
(8,088 |
) |
|
Income tax expense |
|
|
— |
|
|
|
— |
|
|
|
3,832 |
|
|
Total operating loss on discontinued operations |
|
$ |
(3,422 |
) |
|
$ |
(5,187 |
) |
|
$ |
(4,256 |
) |
|
Total consideration |
|
$ |
3,468 |
|
|
|
|
|
|
$ |
47,717 |
|
|
Net book value of assets sold |
|
|
(21,188 |
) |
|
|
|
|
|
|
(31,776 |
) |
|
Transaction costs associated with sale |
|
|
(1,305 |
) |
|
|
|
|
|
|
(3,036 |
) |
|
(Loss) gain on sale of discontinued operations before income taxes |
|
|
(19,025 |
) |
|
|
|
|
|
|
12,905 |
|
|
Income tax expense |
|
|
- |
|
|
|
|
|
|
|
(5,102 |
) |
|
Total (loss) income on discontinued operations |
|
$ |
(22,447 |
) |
|
|
|
|
|
$ |
3,547 |
|
Prior to the completion of the sale of the Geoconstruction business segment, we owned 65% and 50% of Case-Bencor Joint Venture (Washington) and Case-Bencor Joint Venture (Iowa), respectively, which were both included as part of the Geoconstruction business segment as investments in affiliates and were discontinued as a result of the sale. Summarized financial information of the entities, which were accounted for as equity method investments, through the date of the sale was as follows:
79
|
|
|
Year Ended January 31, |
|
|
|
(in thousands) |
|
2016 |
|
|
|
Revenues |
|
$ |
10,720 |
|
|
Gross profit |
|
|
2,466 |
|
|
Net income |
|
|
2,466 |
|
Cash flow data relating to discontinued operations are presented below:
|
|
|
Year Ended January 31, |
|
|||||||||
|
(in thousands) |
|
2018 |
|
|
2017 |
|
|
2016 |
|
|||
|
Cash flow data: |
|
|
|
|
|
|
|
|
|
|
|
|
|
Depreciation and amortization |
|
$ |
287 |
|
|
$ |
1,609 |
|
|
$ |
5,833 |
|
|
Capital expenditures |
|
|
226 |
|
|
|
1,699 |
|
|
|
1,536 |
|
|
Bad debt expense (recovery) |
|
|
1,551 |
|
|
|
1,165 |
|
|
|
(124 |
) |
(17) Segments and Foreign Operations
We are a global solutions provider to the world of essential natural resources – water, minerals and energy. The Chief Operating Decision Maker (CODM) reviews operating results to determine the appropriate allocation of resources within the organization. The CODM defines the operational and organizational structure into discrete segments based on our primary product lines.
During the first quarter of the fiscal year ended January 31, 2018, we completed the sale of substantially all of the assets of our Heavy Civil business. The operating results related to the Heavy Civil business are presented as discontinued operations and, as such, have been excluded from continuing operations and segment results for all periods presented. See Note 16 to Consolidated Financial Statements for further discussion.
In the first quarter of the fiscal year ended January 31, 2017, changes were made to simplify our business and streamline our operating and reporting structure. Our Collector Wells group was shifted from our former Heavy Civil business to Water Resources to better align their operational expertise. We also shifted certain other smaller operations out of our “Other” segment and into our remaining reporting segments and no longer report an “Other” segment. Information for prior periods has been recast to conform to our new presentation.
During the third quarter of the fiscal year ended January 31, 2016, as a result of our strategic review of all aspects of our operations, we realigned our operating structure to combine the Energy Services segment with Water Resources segment. We determined that given the similar nature of the equipment and services for Energy Services and Water Resources, we could more effectively manage our cost structure and serve our customer base in a combined segment. Historical segment numbers have been recast to conform to this new operating structure.
During the second quarter of the fiscal year ended January 31, 2016, we entered into a definitive agreement to sell our Geoconstruction business segment. The operating results of the Geoconstruction business are presented as discontinued operations and, as such, have been excluded from continuing operations and segment results for all periods presented. See Note 16 to Consolidated Financial Statements for further discussion.
80
Our segments are defined as follows:
Water Resources
Water Resources provides its customers with an array of water management solutions, including discovery and defining of water sources through hydrologic studies, water supply development through water well drilling and intake construction. Through our new Water Midstream business we provide water delivery through pipeline and pumping infrastructure with the ability to deliver non-potable water at multiple points along the pipeline route. Water Resources also brings technologies to the water and wastewater markets and offers water treatment equipment engineering services, providing systems for the treatment of regulated and nuisance contaminants, specifically, iron, manganese, hydrogen sulfide, arsenic, radium, nitrate, perchlorate and volatile organic compounds. Water Resources drills deep injection wells for industrial and municipal clients that need to dispose of wastewater associated with their processes. Water Resources also performs complete diagnostic and rehabilitation services for existing wells, pumps and related equipment, including conducting downhole closed circuit televideo inspections to investigate and resolve water well and pump performance problems. In addition, Water Resources constructs radial collector wells through its Ranney® Collector Wells technology, which is an alternative to conventional vertical wells and can be utilized to develop moderate to very high capacities of groundwater. Water Resources provides water systems and services in most regions of the U.S.
Inliner
Inliner provides a wide range of process, sanitary and storm water rehabilitation techniques and services to municipalities and industrial customers dealing with aging infrastructure needs. Inliner focuses on its proprietary Inliner ® cured-in-place pipe (“CIPP”) which allows it to rehabilitate aging sanitary sewer, storm water and process water infrastructure to provide structural rebuilding as well as infiltration and inflow reduction. Inliner’s trenchless technology minimizes environmental impact and reduces or eliminates surface and social disruption. Inliner has the ability to supply both traditional felt-based CIPP lining tubes cured with water or steam as well as a fiberglass-based lining tubes cured with ultraviolet light. Inliner owns the North American rights to the Inliner CIPP technology, owns and operates the liner manufacturer and also provides installation of Inliner CIPP product. While Inliner focuses on our proprietary Inliner CIPP, it provides full system renewal, including Janssen structural renewal for service lateral connections and mainlines, slip lining, traditional excavation and replacement and form and manhole renewal with cementitious and epoxy products. Inliner provides services in most regions of the U.S.
Mineral Services
Mineral Services conducts primarily above ground drilling activities, including all phases of core drilling, reverse circulation, dual tube, hammer and rotary air-blast methods. Our service offerings include both exploratory and definitional drilling. Global mining companies engage companies such as Mineral Services to extract samples from sites that the mining companies analyze for mineral content before investing heavily in development to extract the minerals. Mineral Services helps its clients determine if minable mineral deposit is on the site, the economic viability of the mining site and the geological properties of the ground, which helps in the determination of mine planning. Mineral Services also offers its customers water management and soil stabilization expertise. Mine water management consists of vertical, large diameter wells for sourcing and dewatering; and horizontal drains for slope de-pressurization. The primary markets are in the western U.S., Mexico and Brazil. As discussed in Note 18 to the Consolidated Financial Statements, during the fiscal year ended January 31, 2016, we implemented a plan to exit our operations in Africa and Australia. Mineral Services also has ownership interests in foreign affiliates operating in Latin America that form our primary presence in Chile and Peru. See Note 5 to Consolidated Financial Statements for discussion of Mineral Services’ equity method investments.
Financial information for our segments is presented below. Unallocated corporate expenses primarily consist of interest expense, tax expense and the expenses of general and administrative functions performed on a company-wide basis and benefiting all segments. These costs include expenses related to accounting, financial reporting, internal audit, treasury, legal, tax compliance, executive management and board of directors. Corporate assets consist of assets not directly associated with a segment and consist primarily of cash and deferred income taxes.
Our measure of Total Adjusted EBITDA, which may not be comparable to other companies’ measure of Total Adjusted EBITDA, represents net loss before discontinued operations, taxes, interest, depreciation and amortization, gain or loss on sale of fixed assets, non-cash equity-based compensation, equity in earnings or losses from affiliates, certain non-recurring items such as restructuring costs and certain other gains or losses, plus dividends received from affiliates. Our chief operating decision maker evaluates segment performance based on the segment’s revenues and Adjusted EBITDA, among other factors. In addition, we use Total Adjusted EBITDA as a factor in incentive compensation decisions and our credit facility agreement uses measures similar to Total Adjusted EBITDA to measure compliance with certain covenants.
81
|
|
|
Years Ended January 31, |
|
|||||||||
|
(in thousands) |
|
2018 |
|
|
2017 |
|
|
2016 |
|
|||
|
Water Resources |
|
$ |
172,406 |
|
|
$ |
204,577 |
|
|
$ |
239,897 |
|
|
Inliner |
|
|
205,873 |
|
|
|
196,845 |
|
|
|
193,704 |
|
|
Mineral Services |
|
|
97,238 |
|
|
|
63,777 |
|
|
|
86,390 |
|
|
Other items/eliminations |
|
|
— |
|
|
|
(416 |
) |
|
|
(1,886 |
) |
|
Total revenues |
|
$ |
475,517 |
|
|
$ |
464,783 |
|
|
$ |
518,105 |
|
|
|
|
|
|
|
|
|
|
|
|
|
|
|
|
|
|
Years Ended January 31, |
|
|||||||||
|
(in thousands) |
|
2018 |
|
|
2017 |
|
|
2016 |
|
|||
|
Total Adjusted EBITDA |
|
|
|
|
|
|
|
|
|
|
|
|
|
Water Resources |
|
$ |
5,284 |
|
|
$ |
(2,410 |
) |
|
$ |
23,870 |
|
|
Inliner |
|
|
32,688 |
|
|
|
32,036 |
|
|
|
27,949 |
|
|
Mineral Services |
|
|
17,358 |
|
|
|
8,635 |
|
|
|
1,878 |
|
|
Unallocated corporate expenses |
|
|
(20,319 |
) |
|
|
(23,830 |
) |
|
|
(29,319 |
) |
|
Total Adjusted EBITDA |
|
$ |
35,011 |
|
|
$ |
14,431 |
|
|
$ |
24,378 |
|
|
|
|
|
|
|
|
|
|
|
|
|
|
|
|
|
|
Years Ended January 31, |
|
|||||||||
|
(in thousands) |
|
2018 |
|
|
2017 |
|
|
2016 |
|
|||
|
Net loss attributable to Layne Christensen Company |
|
$ |
(27,311 |
) |
|
$ |
(52,236 |
) |
|
$ |
(44,777 |
) |
|
Items not included in Total Adjusted EBITDA |
|
|
|
|
|
|
|
|
|
|
|
|
|
Net income attributable to noncontrolling interests |
|
|
— |
|
|
|
— |
|
|
|
(28 |
) |
|
Net loss (income) from discontinued operations |
|
|
22,447 |
|
|
|
5,187 |
|
|
|
(3,547 |
) |
|
Income tax (benefit) expense |
|
|
(10,375 |
) |
|
|
1,420 |
|
|
|
737 |
|
|
Interest expense |
|
|
17,120 |
|
|
|
16,883 |
|
|
|
18,011 |
|
|
Depreciation expense and amortization |
|
|
26,701 |
|
|
|
25,302 |
|
|
|
30,092 |
|
|
Gain on sale of fixed assets |
|
|
(3,741 |
) |
|
|
(3,886 |
) |
|
|
(507 |
) |
|
Non-cash equity-based compensation |
|
|
3,379 |
|
|
|
3,394 |
|
|
|
3,559 |
|
|
Equity in (earnings) loss of affiliates |
|
|
(3,431 |
) |
|
|
(2,655 |
) |
|
|
612 |
|
|
Impairment charges |
|
|
— |
|
|
|
— |
|
|
|
4,598 |
|
|
Restructuring costs |
|
|
4,903 |
|
|
|
16,924 |
|
|
|
17,094 |
|
|
Gain on extinguishment of debt |
|
|
— |
|
|
|
— |
|
|
|
(4,236 |
) |
|
Other expense (income), net |
|
|
15 |
|
|
|
(843 |
) |
|
|
(1,082 |
) |
|
Dividends received from affiliates |
|
|
5,304 |
|
|
|
4,941 |
|
|
|
3,852 |
|
|
Total Adjusted EBITDA |
|
$ |
35,011 |
|
|
$ |
14,431 |
|
|
$ |
24,378 |
|
|
|
(1) |
Restructuring costs for the fiscal year ended January 31, 2016 include $7.9 million relating to the write-down of the carrying value of inventory in our African and Australian operations, which are reflected as part of cost of revenues in the Consolidated Statement of Operations. |
82
The following table presents various financial information for each segment.
|
|
|
Years Ended January 31, |
|
|||||||||
|
(in thousands) |
|
2018 |
|
|
2017 |
|
|
2016 |
|
|||
|
Revenues by product line |
|
|
|
|
|
|
|
|
|
|
|
|
|
Water systems |
|
$ |
152,757 |
|
|
$ |
181,382 |
|
|
$ |
217,001 |
|
|
Water treatment technologies |
|
|
11,798 |
|
|
|
12,558 |
|
|
|
11,601 |
|
|
Sewer rehabilitation |
|
|
205,873 |
|
|
|
196,845 |
|
|
|
193,704 |
|
|
Environmental and specialty drilling |
|
|
5,690 |
|
|
|
8,858 |
|
|
|
7,056 |
|
|
Exploration drilling |
|
|
94,258 |
|
|
|
60,975 |
|
|
|
79,723 |
|
|
Other |
|
|
5,141 |
|
|
|
4,165 |
|
|
|
9,020 |
|
|
Total revenues by product line |
|
$ |
475,517 |
|
|
$ |
464,783 |
|
|
$ |
518,105 |
|
|
|
|
|
|
|
|
|
|
|
|
|
|
|
|
Revenues by geographic location |
|
|
|
|
|
|
|
|
|
|
|
|
|
United States/Canada |
|
$ |
429,588 |
|
|
$ |
433,237 |
|
|
$ |
471,773 |
|
|
Africa/Australia |
|
|
— |
|
|
|
151 |
|
|
|
12,521 |
|
|
Brazil |
|
|
10,719 |
|
|
|
7,989 |
|
|
|
6,363 |
|
|
Mexico |
|
|
35,210 |
|
|
|
23,406 |
|
|
|
27,448 |
|
|
Total revenues |
|
$ |
475,517 |
|
|
$ |
464,783 |
|
|
$ |
518,105 |
|
|
|
|
|
|
|
|
|
|
|
|
|
|
|
|
|
|
|
|
|
|
|
|
|
|
|
|
|
|
Depreciation and amortization |
|
|
|
|
|
|
|
|
|
|
|
|
|
Water Resources |
|
$ |
12,316 |
|
|
$ |
12,056 |
|
|
$ |
13,486 |
|
|
Inliner |
|
|
6,440 |
|
|
|
5,551 |
|
|
|
4,455 |
|
|
Mineral Services |
|
|
7,188 |
|
|
|
6,343 |
|
|
|
10,317 |
|
|
Corporate |
|
|
757 |
|
|
|
1,352 |
|
|
|
1,834 |
|
|
Total depreciation and amortization |
|
$ |
26,701 |
|
|
$ |
25,302 |
|
|
$ |
30,092 |
|
|
|
|
|
|
|
|
|
|
|
|
|
|
|
|
|
|
|
|
|
|
|
|
|
|
|
|
|
83
|
|
|
As of and Years Ended January 31, |
|
|||||||||
|
(in thousands) |
|
2018 |
|
|
2017 |
|
|
2016 |
|
|||
|
Assets |
|
|
|
|
|
|
|
|
|
|
|
|
|
Water Resources |
|
$ |
115,145 |
|
|
$ |
98,795 |
|
|
$ |
124,821 |
|
|
Inliner |
|
|
98,670 |
|
|
|
93,055 |
|
|
|
93,768 |
|
|
Mineral Services |
|
|
120,434 |
|
|
|
116,148 |
|
|
|
128,196 |
|
|
Discontinued Operations |
|
|
— |
|
|
|
46,290 |
|
|
|
56,207 |
|
|
Corporate |
|
|
35,940 |
|
|
|
81,863 |
|
|
|
85,665 |
|
|
Total assets |
|
$ |
370,189 |
|
|
$ |
436,151 |
|
|
$ |
488,657 |
|
|
|
|
|
|
|
|
|
|
|
|
|
|
|
|
Property and equipment, net |
|
|
|
|
|
|
|
|
|
|
|
|
|
United States |
|
$ |
111,860 |
|
|
$ |
89,920 |
|
|
$ |
95,213 |
|
|
Africa/Australia |
|
|
— |
|
|
|
124 |
|
|
|
7,302 |
|
|
Brazil |
|
|
3,263 |
|
|
|
3,818 |
|
|
|
3,269 |
|
|
Mexico |
|
|
5,331 |
|
|
|
3,123 |
|
|
|
3,193 |
|
|
Other foreign |
|
|
150 |
|
|
|
— |
|
|
|
15 |
|
|
Total property and equipment, net |
|
$ |
120,604 |
|
|
$ |
96,985 |
|
|
$ |
108,992 |
|
|
|
|
|
|
|
|
|
|
|
|
|
|
|
|
Capital Expenditures |
|
|
|
|
|
|
|
|
|
|
|
|
|
Water Resources |
|
$ |
31,260 |
|
|
$ |
7,305 |
|
|
$ |
11,812 |
|
|
Inliner |
|
|
8,432 |
|
|
|
10,268 |
|
|
|
9,015 |
|
|
Mineral Services |
|
|
9,886 |
|
|
|
3,066 |
|
|
|
3,309 |
|
|
Discontinued operations |
|
|
218 |
|
|
|
1,783 |
|
|
|
1,802 |
|
|
Corporate |
|
|
2,428 |
|
|
|
392 |
|
|
|
490 |
|
|
Total capital expenditures |
|
$ |
52,224 |
|
|
$ |
22,814 |
|
|
$ |
26,428 |
|
|
|
|
|
|
|
|
|
|
|
|
|
|
|
(18) Restructuring Costs
During the second quarter of the fiscal year ended January 31, 2017, we initiated a plan to reduce costs and improve profitability in our Water Resources segment (“Water Resources Business Performance Initiative”). The Water Resources Business Performance Initiative involves cost rationalization, increased standardization of functions such as sales, pricing and estimation, disposal of underutilized assets and process improvements to drive efficiencies. We recorded approximately $2.7 million in restructuring costs related to the Water Resources Business Performance Initiative for the fiscal year ended January 31, 2018, which includes costs related to office closures and severance costs. We estimate remaining amounts to be incurred for the Water Resources Business Performance Initiative of approximately $1.6 million.
During the fiscal year ended January 31, 2018, we continued the implementation of our FY2016 Restructuring Plan, which involves the exit of our operations in Africa and Australia and other actions to support our strategic focus in simplifying the business and build upon our capabilities in water (“FY2016 Restructuring Plan”). For the fiscal year ended January 31, 2018, we recognized approximately $2.2 million of restructuring expenses for the FY2016 Restructuring Plan, primarily related to wind down costs for the closure of our Australian and African entities. For the fiscal year ended January 31, 2018, the FY2016 Restructuring Plan related to the segments as follows: $1.1 million in Mineral Services, $1.0 million in Corporate and $0.1 million in Inliner. The FY2016 Restructuring Plan was substantially completed as of January 31, 2018. We estimate remaining amounts to be incurred for the FY2016 Restructuring Plan of approximately $0.1 million.
We previously implemented a restructuring plan during the second quarter of the fiscal year ended January 31, 2015 (“FY2015 Restructuring Plan”). The FY2015 Restructuring Plan involved, among other things, reductions in the global workforce, asset relocation or disposal and process improvements. The FY2015 Restructuring Plan was designed to achieve short and long-term cost reductions and was completed during the first quarter of the fiscal year ended January 31, 2016.
84
The following table summarizes the carrying amount of the accrual for the restructuring plans discussed above:
|
|
|
Severance |
|
|
|
|
|
|
|
|
|
|
|
|
|
|
|
|
|
|
|
|
|
and other |
|
|
|
|
|
|
|
|
|
|
|
|
|
|
|
|
|
|
|
|
|
personnel- |
|
|
Write-down |
|
|
|
|
|
|
|
|
|
|
|
|
|
||
|
|
|
related |
|
|
of |
|
|
Asset |
|
|
|
|
|
|
|
|
|
|||
|
(in thousands) |
|
costs |
|
|
inventory |
|
|
write-down |
|
|
Other |
|
|
Total |
|
|||||
|
|
|
|
|
|
|
|
|
|
|
|
|
|
|
|
|
|
|
|
|
|
|
Balance at January 31, 2015 |
|
$ |
497 |
|
|
$ |
— |
|
|
$ |
— |
|
|
$ |
482 |
|
|
$ |
979 |
|
|
|
|
|
|
|
|
|
|
|
|
|
|
|
|
|
|
|
|
|
|
|
|
Restructuring Costs |
|
|
|
|
|
|
|
|
|
|
|
|
|
|
|
|
|
|
|
|
|
FY2016 Restructuring Plan |
|
$ |
3,657 |
|
|
$ |
— |
|
|
$ |
3,870 |
|
|
$ |
113 |
|
|
$ |
7,640 |
|
|
FY2015 Restructuring Plan |
|
|
(30 |
) |
|
|
— |
|
|
|
— |
|
|
|
1,579 |
|
|
|
1,549 |
|
|
Total Restructuring Costs |
|
$ |
3,627 |
|
|
$ |
— |
|
|
$ |
3,870 |
|
|
$ |
1,692 |
|
|
$ |
9,189 |
|
|
Write-down of inventory |
|
|
— |
|
|
|
7,905 |
|
|
|
— |
|
|
|
— |
|
|
|
7,905 |
|
|
Cash expenditures |
|
|
(3,057 |
) |
|
|
— |
|
|
|
— |
|
|
|
(496 |
) |
|
|
(3,553 |
) |
|
Non-cash expense |
|
|
— |
|
|
|
(7,905 |
) |
|
|
(3,870 |
) |
|
|
(1,245 |
) |
|
|
(13,020 |
) |
|
Adjustment to liability |
|
|
87 |
|
|
|
— |
|
|
|
— |
|
|
|
(377 |
) |
|
|
(290 |
) |
|
Balance at January 31, 2016 |
|
$ |
1,154 |
|
|
$ |
— |
|
|
$ |
— |
|
|
$ |
56 |
|
|
$ |
1,210 |
|
|
|
|
|
|
|
|
|
|
|
|
|
|
|
|
|
|
|
|
|
|
|
|
Restructuring Costs |
|
|
|
|
|
|
|
|
|
|
|
|
|
|
|
|
|
|
|
|
|
Water Resources Business Performance Initiative |
|
$ |
459 |
|
|
$ |
— |
|
|
$ |
— |
|
|
$ |
2,745 |
|
|
$ |
3,204 |
|
|
FY2016 Restructuring Plan |
|
|
400 |
|
|
|
— |
|
|
|
12,878 |
|
|
|
442 |
|
|
|
13,720 |
|
|
Total Restructuring Costs |
|
$ |
859 |
|
|
$ |
— |
|
|
$ |
12,878 |
|
|
$ |
3,187 |
|
|
$ |
16,924 |
|
|
Cash expenditures |
|
|
(1,354 |
) |
|
|
— |
|
|
|
— |
|
|
|
(3,105 |
) |
|
|
(4,459 |
) |
|
Non-cash expense(1) |
|
|
— |
|
|
|
— |
|
|
|
(12,878 |
) |
|
|
— |
|
|
|
(12,878 |
) |
|
Adjustment to liability |
|
|
10 |
|
|
|
— |
|
|
|
— |
|
|
|
32 |
|
|
|
42 |
|
|
Balance at January 31, 2017 |
|
$ |
669 |
|
|
$ |
— |
|
|
$ |
— |
|
|
$ |
170 |
|
|
$ |
839 |
|
|
|
|
|
|
|
|
|
|
|
|
|
|
|
|
|
|
|
|
|
|
|
|
Restructuring Costs |
|
|
|
|
|
|
|
|
|
|
|
|
|
|
|
|
|
|
|
|
|
Water Resources Business Performance Initiative |
|
$ |
1,012 |
|
|
$ |
— |
|
|
$ |
— |
|
|
$ |
1,698 |
|
|
$ |
2,710 |
|
|
FY2016 Restructuring Plan |
|
|
201 |
|
|
|
— |
|
|
|
— |
|
|
|
1,992 |
|
|
|
2,193 |
|
|
Total Restructuring Costs |
|
$ |
1,213 |
|
|
$ |
— |
|
|
$ |
— |
|
|
$ |
3,690 |
|
|
$ |
4,903 |
|
|
Cash expenditures |
|
|
(1,241 |
) |
|
|
— |
|
|
|
— |
|
|
|
(2,790 |
) |
|
|
(4,031 |
) |
|
Non-cash expense |
|
|
— |
|
|
|
— |
|
|
|
— |
|
|
|
— |
|
|
|
— |
|
|
Adjustment to liability |
|
|
— |
|
|
|
— |
|
|
|
— |
|
|
|
— |
|
|
|
— |
|
|
Balance at January 31, 2018 |
|
$ |
641 |
|
|
$ |
— |
|
|
$ |
— |
|
|
$ |
1,070 |
|
|
$ |
1,711 |
|
|
|
(1) |
For the fiscal year ended January 31, 2017, we recognized an impairment of assets held for sale in Australia and Africa. In calculating the impairment, the carrying amount of the assets included the cumulative currency translation adjustment of $12.4 million associated with the closure of our Australian and African entities. |
85
(19) Quarterly Results (Unaudited)
Unaudited quarterly results were as follows:
|
|
|
Years Ended January 31, 2018 (1) |
|
|||||||||||||
|
(in thousands, except per share data) |
|
First |
|
|
Second |
|
|
Third |
|
|
Fourth |
|
||||
|
Revenues |
|
$ |
111,507 |
|
|
$ |
126,160 |
|
|
$ |
127,423 |
|
|
$ |
110,427 |
|
|
Cost of revenues (exclusive of depreciation and amortization shown below)(2) |
|
|
(86,283 |
) |
|
|
(98,869 |
) |
|
|
(100,140 |
) |
|
|
(89,469 |
) |
|
Depreciation and amortization |
|
|
(6,484 |
) |
|
|
(6,373 |
) |
|
|
(6,821 |
) |
|
|
(7,023 |
) |
|
Net (loss) income from continuing operations |
|
|
(3,418 |
) |
|
|
(2,135 |
) |
|
|
(2,004 |
) |
|
|
2,693 |
|
|
Net (loss) income |
|
|
(22,900 |
) |
|
|
(4,906 |
) |
|
|
(2,080 |
) |
|
|
2,575 |
|
|
(Loss) Income per share from continuing operations - basic(3) |
|
|
(0.17 |
) |
|
|
(0.11 |
) |
|
|
(0.10 |
) |
|
|
0.14 |
|
|
(Loss) Income per share from continuing operations - diluted(3) |
|
|
(0.17 |
) |
|
|
(0.11 |
) |
|
|
(0.10 |
) |
|
|
0.13 |
|
|
(Loss) Income per share - basic(3) |
|
|
(1.15 |
) |
|
|
(0.25 |
) |
|
|
(0.11 |
) |
|
|
0.13 |
|
|
(Loss) Income per share - diluted(3) |
|
|
(1.15 |
) |
|
|
(0.25 |
) |
|
|
(0.11 |
) |
|
|
0.12 |
|
|
(1) |
All periods have been retrospectively presented to reflect the sale of our Heavy Civil business as discontinued operations. |
|
(2) |
As discussed in Note 1 to the Consolidated Financial Statements, we utilize multiple methods of revenue recognition based on the nature of work performed. As a result, it is not practical to allocate a portion of depreciation and amortization to cost of revenues for the presentation of gross profit. |
|
(3) |
Loss per share was computed independently for each of the quarters presented. The sum of the quarters may not equal the total year amount due to the impact of changes in average quarterly shares outstanding. |
|
|
|
Years Ended January 31, 2017 (1) |
|
|||||||||||||
|
(in thousands, except per share data) |
|
First |
|
|
Second |
|
|
Third |
|
|
Fourth |
|
||||
|
Revenues |
|
$ |
120,646 |
|
|
$ |
123,635 |
|
|
$ |
120,574 |
|
|
$ |
99,928 |
|
|
Cost of revenues (exclusive of depreciation and amortization shown below)(2) |
|
|
(97,062 |
) |
|
|
(100,474 |
) |
|
|
(97,124 |
) |
|
|
(87,441 |
) |
|
Depreciation and amortization |
|
|
(5,958 |
) |
|
|
(6,527 |
) |
|
|
(6,517 |
) |
|
|
(6,300 |
) |
|
Net loss from continuing operations |
|
|
(8,021 |
) |
|
|
(5,413 |
) |
|
|
(4,463 |
) |
|
|
(29,152 |
) |
|
Net loss |
|
|
(8,803 |
) |
|
|
(5,310 |
) |
|
|
(5,043 |
) |
|
|
(33,080 |
) |
|
Loss per share from continuing operations - basic and diluted(3) |
|
|
(0.41 |
) |
|
|
(0.27 |
) |
|
|
(0.23 |
) |
|
|
(1.47 |
) |
|
Loss per share - basic and diluted(3) |
|
|
(0.45 |
) |
|
|
(0.26 |
) |
|
|
(0.26 |
) |
|
|
(1.67 |
) |
|
(1) |
All periods have been retrospectively presented to reflect the sale of our Heavy Civil business as discontinued operations. |
|
(2) |
As discussed in Note 1 to the Consolidated Financial Statements, we utilize multiple methods of revenue recognition based on the nature of work performed. As a result, it is not practical to allocate a portion of depreciation and amortization to cost of revenues for the presentation of gross profit. |
|
(3) |
Loss per share was computed independently for each of the quarters presented. The sum of the quarters may not equal the total year amount due to the impact of changes in average quarterly shares outstanding. |
(20) Subsequent Event
On February 13, 2018, we entered into a definitive agreement whereby Granite Construction Incorporated will acquire all of the outstanding shares of Layne in a stock-for-stock transaction with each share of Layne common stock exchanged for 0.27 shares of Granite common stock. The transaction is subject to the approval by Layne’s shareholders and other customary closing conditions.
86
Schedule II: Valuation and Qualifying Accounts
|
|
|
|
|
|
|
Additions |
|
|
|
|
|
|
|
|
|
|||||
|
(in thousands) |
|
Balance at Beginning of Period |
|
|
Charges to Costs and Expenses |
|
|
Charges to Other Accounts |
|
|
Deductions |
|
|
Balance at End of Period |
|
|||||
|
Allowance for customer receivables: |
|
|
|
|
|
|
|
|
|
|
|
|
|
|
|
|
|
|
|
|
|
Fiscal year ended January 31, 2016 |
|
$ |
3,167 |
|
|
$ |
1,392 |
|
|
$ |
— |
|
|
$ |
(1,314 |
) |
|
$ |
3,245 |
|
|
Fiscal year ended January 31, 2017 |
|
|
3,245 |
|
|
|
188 |
|
|
|
— |
|
|
|
(235 |
) |
|
|
3,198 |
|
|
Fiscal year ended January 31, 2018 |
|
|
3,198 |
|
|
|
953 |
|
|
|
304 |
|
|
|
(2,371 |
) |
|
|
2,084 |
|
|
|
|
|
|
|
|
|
|
|
|
|
|
|
|
|
|
|
|
|
|
|
|
Valuation allowance for deferred tax asset: |
|
|
|
|
|
|
|
|
|
|
|
|
|
|
|
|
|
|
|
|
|
Fiscal year ended January 31, 2016 |
|
$ |
114,990 |
|
|
$ |
26,923 |
|
|
$ |
(1,580 |
) |
|
$ |
(209 |
) |
|
$ |
140,124 |
|
|
Fiscal year ended January 31, 2017 |
|
|
140,124 |
|
|
|
20,792 |
|
|
|
(57 |
) |
|
|
(3,195 |
) |
|
|
157,664 |
|
|
Fiscal year ended January 31, 2018 |
|
|
157,664 |
|
|
|
735 |
|
|
|
(502 |
) |
|
|
(27,284 |
) |
|
|
130,613 |
|
|
|
|
|
|
|
|
|
|
|
|
|
|
|
|
|
|
|
|
|
|
|
|
|
|
|
|
|
|
|
|
|
|
|
|
|
|
|
|
|
|
|
|
|
None.
Disclosure Controls and Procedures
Based on an evaluation of disclosure controls and procedures for the period ended January 31, 2018, conducted under the supervision and with the participation of our management, including the Principal Executive Officer and the Principal Financial Officer, we concluded that our disclosure controls and procedures are effective to ensure that information required to be disclosed in reports that we file or submit under the Securities Exchange Act of 1934 is accumulated and communicated to our management (including the Principal Executive Officer and the Principal Financial Officer) to allow timely decisions regarding required disclosure and is recorded, processed, summarized and reported within the time periods specified in SEC rules and forms.
Management’s Report on Internal Control over Financial Reporting
Management of Layne Christensen Company and subsidiaries is responsible for establishing and maintaining adequate internal control over financial reporting, as such term is defined in Rule 13a-15(f) of the Exchange Act. Under the supervision and with the participation of the our management, including our Principal Executive Officer and Principal Financial Officer, we conducted an evaluation of the effectiveness of our internal control over financial reporting based upon the framework in Internal Control – Integrated Framework (2013) issued by the Committee of Sponsoring Organizations of the Treadway Commission (the “COSO Framework”).
Internal control over financial reporting cannot provide absolute assurance of achieving financial reporting objectives because of its inherent limitations. Internal control over financial reporting is a process that involves human diligence and compliance and is subject to lapses in judgment and breakdowns resulting from human failures. Internal control over financial reporting also can be circumvented by collusion or improper management override. Because of such limitations, there is a risk that material misstatements may not be prevented or detected on a timely basis by internal control over financial reporting. However, these inherent limitations are known features of the financial reporting process. Therefore it is possible to design into the process safeguards to reduce, although not eliminate, this risk. Our internal control over financial reporting includes such safeguards. Projections of an evaluation of effectiveness of internal control over financial reporting in future periods are subject to the risk that the controls may become inadequate because of conditions, or because the degree of compliance with our policies and procedures may deteriorate.
Based on the evaluation under the COSO Framework, management concluded that our internal control over financial reporting is effective as of January 31, 2018. Our independent registered public accounting firm has audited the Consolidated Financial Statements included in this Annual Report on Form 10-K and, as part of their audit, has issued their report on the effectiveness of our internal control over financial reporting as of January 31, 2018. The report is included below.
87
Changes in Internal Control over Financial Reporting
There were no changes in our internal control over financial reporting during the three months ended January 31, 2018, that have materially affected, or are reasonably likely to materially affect, our internal control over financial reporting.
Due to Layne’s entry into the Merger Agreement, Layne’s current expectation is that its 2018 Annual Meeting of Stockholders (“2018 Annual Meeting”), previously expected to have been held in early June 2018, will be called at a later date or cancelled. Layne will provide further information regarding the 2018 Annual Meeting in due course.
88
Report of Independent Registered Public Accounting Firm
To the Board of Directors and Stockholders of
Layne Christensen Company
Opinion on Internal Control over Financial Reporting
We have audited the internal control over financial reporting of Layne Christensen Company and subsidiaries (the “Company”) as of January 31, 2018, based on criteria established in Internal Control — Integrated Framework (2013) issued by the Committee of Sponsoring Organizations of the Treadway Commission (COSO). In our opinion, the Company maintained, in all material respects, effective internal control over financial reporting as of January 31, 2018, based on criteria established in Internal Control — Integrated Framework (2013) issued by COSO.
We have also audited, in accordance with the standards of the Public Company Accounting Oversight Board (United States) (PCAOB), the consolidated financial statements and financial statement schedule as of and for the year ended January 31, 2018 of the Company and our report dated April 10, 2018 expressed an unqualified opinion on those financial statements and financial statement schedule.
Basis of Opinion
The Company's management is responsible for maintaining effective internal control over financial reporting and for its assessment of the effectiveness of internal control over financial reporting, included in the accompanying Management’s Report on Internal Control over Financial Reporting. Our responsibility is to express an opinion on the Company's internal control over financial reporting based on our audit. We are a public accounting firm registered with the PCAOB and are required to be independent with respect to the Company in accordance with the U.S. federal securities laws and the applicable rules and regulations of the Securities and Exchange Commission and the PCAOB.
We conducted our audit in accordance with the standards of the PCAOB. Those standards require that we plan and perform the audit to obtain reasonable assurance about whether effective internal control over financial reporting was maintained in all material respects. Our audit included obtaining an understanding of internal control over financial reporting, assessing the risk that a material weakness exists, testing and evaluating the design and operating effectiveness of internal control based on the assessed risk, and performing such other procedures as we considered necessary in the circumstances. We believe that our audit provides a reasonable basis for our opinion.
Definition and Limitations of Internal Control over Financial Reporting
A company’s internal control over financial reporting is a process designed to provide reasonable assurance regarding the reliability of financial reporting and the preparation of financial statements for external purposes in accordance with generally accepted accounting principles. A company’s internal control over financial reporting includes those policies and procedures that (1) pertain to the maintenance of records that, in reasonable detail, accurately and fairly reflect the transactions and dispositions of the assets of the company; (2) provide reasonable assurance that transactions are recorded as necessary to permit preparation of financial statements in accordance with generally accepted accounting principles, and that receipts and expenditures of the company are being made only in accordance with authorizations of management and directors of the company; and (3) provide reasonable assurance regarding prevention or timely detection of unauthorized acquisition, use, or disposition of the company’s assets that could have a material effect on the financial statements.
Because of its inherent limitations, internal control over financial reporting may not prevent or detect misstatements. Also, projections of any evaluation of effectiveness to future periods are subject to the risk that controls may become inadequate because of changes in conditions, or that the degree of compliance with the policies or procedures may deteriorate.
/s/DELOITTE & TOUCHE LLP
Houston, Texas
April 10, 2018
89
Our Proxy Statement to be used in connection with the 2018 Annual Meeting of Stockholders , will contain, (i) under the caption “Election of Directors,” certain information relating to our directors and Audit Committee financial experts required by Item 10 of Form 10-K and such information is incorporated herein by this reference (except that the information set forth under the subcaption “Compensation of Directors” is expressly excluded from such incorporation), (ii) under the caption “Transactions with Management/Related Party Transactions,” certain information relating to our Code of Ethics required by Item 10 of Form 10-K and such information is incorporated herein by this reference and (iii) under the caption “Section 16(a) Beneficial Ownership Reporting Compliance,” certain information required by Item 10 of Form 10-K and such information is incorporated herein by this reference.
Our executive officers are appointed by the Board of Directors for such terms as shall be determined from time to time by the Board and serve until their respective successors are selected and qualified or until their respective earlier death, retirement, resignation or removal. The Board of Directors may delegate its authority to appoint executive officers to the President or Chief Executive Officer.
Set forth below are the name, age and position of each executive officer of Layne.
|
Name |
Age |
Position |
|
Michael J. Caliel |
58 |
President, Chief Executive Officer and Director |
|
J. Michael Anderson |
55 |
Senior Vice President and Chief Financial Officer |
|
Steven F. Crooke |
61 |
Senior Vice President, Chief Administrative Officer and General Counsel |
|
Kevin P. Maher |
58 |
Senior Vice President - Water Resources and Mineral Services |
|
Larry D. Purlee |
70 |
Division President - Inliner |
|
|
|
|
The business experience of each of the executive officers of Layne is as follows:
Michael J. Caliel was appointed President and Chief Executive Officer effective January 2, 2015. Mr. Caliel served as President and Chief Executive Officer of the Invensys Software and Industrial Automation Division of Invensys plc, an automations, controls and process solutions company. Mr. Caliel was employed by Invensys from December 2011 until July 2014. From July 2006 until June 2011, Mr. Caliel served as President, Chief Executive Officer and a Director of Integrated Electrical Services, a publicly held, national provider of electrical and communications solutions for the commercial, industrial and residential markets. From 1993 until June 2006, Mr. Caliel was employed by Invensys, where he served in a variety of senior management positions, including his most recent position as President of Invensys Process Systems. Prior to becoming President of Invensys Process Systems, he served as President of its North America and Europe, Middle East and Africa operations from 2001 to 2003.
J. Michael Anderson was appointed Senior Vice President and Chief Financial Officer effective July 20, 2015. Prior to joining Layne, Mr. Anderson served as Chief Financial Officer at Southcross Energy Partners, L.P., a Master Limited Partnership engaged in the natural gas midstream business. Mr. Anderson previously served as Chief Financial Officer of Exterran Holdings, Inc. and Exterran Partners, L.P., a global market leader in natural gas compression and oil and gas services, from 2003 until 2012. Mr. Anderson also served as Chief Financial Officer and as Chairman and Chief Executive Officer at Azurix Corp., a global owner and operator of water and wastewater assets, during his tenure from 1999 until 2003. Mr. Anderson began his career with JPMorgan Chase & Co. as an investment banker after earning his undergraduate degree in business from Texas Tech University and his MBA from The Wharton School of the University of Pennsylvania.
Steven F. Crooke was promoted to Senior Vice President, Chief Administrative Officer and General Counsel in December 2014. Prior to that, Mr. Crooke served as Senior Vice President, Secretary and General Counsel from 2006 to 2014. Mr. Crooke served as Vice President, Secretary and General Counsel from 2001 to 2006. For the period of June 2000 through April 2001, Mr. Crooke served as Corporate Legal Affairs Manager of Huhtamaki Van Leer. Prior to that, he served as Assistant General Counsel of the Company from 1995 to May 2000.
Kevin P. Maher was promoted to Senior Vice President for Water Resources and Mineral Services in March 2016. Prior to that, Mr. Maher served as the President of Mineral Services of Layne since January 2013, when he joined Layne. Prior to joining the company, Mr. Maher ran his family business, which was acquired and successfully integrated into Boart Longyear. At Boart Longyear, Mr. Maher was the Eastern Regional Manager for Environment & Infrastructure. Most recently, he was Manager of Reverse Circulation & Mine Support Drilling Operations at Major Drilling America. Mr. Maher is an experienced executive with over 25 years of experience in the drilling industry.
90
Larry D. Purlee became the President of the Inliner division, a wholly-owned subsidiary of Layne which provides wastewater pipeline and structure rehabilitation services, on February 1, 2010. Mr. Purlee served as Executive Vice President of Reynolds Inliner, LLC from the early 1990s until February 1, 2010. Mr. Purlee has over 40 years of experience in the wastewater pipeline rehabilitation industry.
Our Proxy Statement to be used in connection with the 2018 Annual Meeting of Stockholders, will contain, under the caption “Executive Compensation and Other Information,” the information required by Item 11 of Form 10-K and such information is incorporated herein by this reference.
Our Proxy Statement to be used in connection with the 2018 Annual Meeting of Stockholders, will contain, under the captions “Ownership of Layne Christensen Common Stock” and “Equity Compensation Plan Information” the information required by Item 12 of Form 10-K and such information is incorporated herein by this reference.
Our Proxy Statement to be used in connection with the 2018 Annual Meeting of Stockholders, will contain, under the captions “Other Corporate Governance Matters,” and “Transactions with Management/Related Party Transactions” the information required by Item 13 of Form 10-K and such information is incorporated herein by this reference.
Our Proxy Statement to be used in connection with the 2018 Annual Meeting of Stockholders, will contain, under the caption “Principal Accounting Fees and Services,” the information required by Item 14 of Form 10-K and such information is incorporated herein by this reference.
91
|
Exhibit Number |
|
Description |
|
|
|
|
|
**2.1 |
|
|
|
|
|
|
|
2.2 |
|
|
|
|
|
|
|
**2.3 |
|
|
|
|
|
|
|
**2.4 |
|
|
|
|
|
|
|
3.1 |
|
|
|
|
|
|
|
3.2 |
|
|
|
|
|
|
|
4.1 |
|
Specimen Common Stock Certificate (filed with Amendment No. 3 to Layne’s Registration Statement on Form S-1 (File No. 33-48432) as Exhibit 4(1) and incorporated herein by reference) (P). |
|
|
|
|
|
4.2 |
|
|
|
|
|
|
|
4.3 |
|
|
|
|
|
|
|
4.4 |
|
|
|
|
|
|
|
4.5 |
|
|
|
|
|
|
|
4.6 |
|
|
|
|
|
|
|
4.7 |
|
|
|
|
|
|
|
4.8 |
|
|
|
|
|
|
92
|
4.9 |
|
|
|
|
|
|
|
4.10 |
|
|
|
|
|
|
|
4.11 |
|
|
|
|
|
|
|
4.12 |
|
|
|
|
|
|
|
4.13 |
|
|
|
|
|
|
|
*10.1 |
|
|
|
|
|
|
|
*10.2 |
|
|
|
|
|
|
|
*10.3 |
|
|
|
|
|
|
|
*10.4 |
|
|
|
|
|
|
|
*10.5 |
|
|
|
|
|
|
|
*10.6 |
|
|
|
|
|
|
|
*10.7 |
|
|
|
|
|
|
|
*10.8 |
|
|
|
|
|
|
|
*10.9 |
|
|
|
|
|
|
93
|
*10.10 |
|
|
|
|
|
|
|
*10.11 |
|
|
|
|
|
|
|
10.12 |
|
|
|
|
|
|
|
*10.13 |
|
|
|
|
|
|
|
*10.14 |
|
|
|
|
|
|
|
*10.15 |
|
|
|
|
|
|
|
*10.16 |
|
|
|
|
|
|
|
10.17 |
|
|
|
|
|
|
|
*10.18 |
|
|
|
|
|
|
|
*10.19 |
|
|
|
|
|
|
|
*10.20 |
|
|
|
|
|
|
|
*10.21 |
|
|
|
|
|
|
|
*10.22 |
|
Severance Agreement, dated March 29, 2016, by and between Layne Christensen Company and Kevin Maher. |
|
|
|
|
|
*10.23 |
|
|
|
|
|
|
|
*10.24 |
|
|
|
|
|
|
|
*10.25 |
|
Layne Christensen Company Long-Term Incentive Plan (amended and restated as of February 1, 2017). |
|
|
|
|
|
21.1 |
|
|
|
|
|
|
94
|
23.1 |
|
|
|
|
|
|
|
31.1 |
|
Section 302 Certification of Chief Executive Officer of the Company. |
|
|
|
|
|
31.2 |
|
Section 302 Certification of Chief Financial Officer of the Company. |
|
|
|
|
|
32.1 |
|
Section 906 Certification of Chief Executive Officer of the Company. |
|
|
|
|
|
32.2 |
|
Section 906 Certification of Chief Financial Officer of the Company. |
|
|
|
|
|
95 |
|
|
|
|
|
|
|
101.INS |
|
XBRL Instance Document |
|
|
|
|
|
101.SCH |
|
XBRL Taxonomy Extension Schema Document |
|
|
|
|
|
101.CAL |
|
XBRL Taxonomy Extension Calculation Linkbase Document |
|
|
|
|
|
101.DEF |
|
XBRL Taxonomy Extension Definition Linkbase Document |
|
|
|
|
|
101.LAB |
|
XBRL Taxonomy Extension Label Linkbase Document |
|
|
|
|
|
101.PRE |
|
XBRL Taxonomy Extension Presentation Linkbase Document |
|
|
|
|
|
* |
|
Management contracts or compensatory plans or arrangements required to be identified by Item 14(a)(3). |
|
|
|
|
|
** |
|
The schedules and exhibits have been omitted pursuant to Item 601(b)(2) of Regulation S-K. Layne Christensen Company undertakes to furnish supplemental copies of any of the omitted schedules or exhibits upon request by the Securities and Exchange Commission. |
|
|
|
|
|
(b) |
|
Exhibits The exhibits filed with this report on Form 10-K are identified above under Item 15(a)(3). |
|
|
|
|
None.
95
Pursuant to the requirements of Section 13 or 15(d) of the Securities Exchange Act of 1934, the registrant has duly caused this report to be signed on its behalf by the undersigned, thereunto duly authorized.
|
|
|
Layne Christensen Company |
|
|
|
|
|
By |
|
/s/ Michael J. Caliel |
|
|
|
Michael J. Caliel |
|
|
|
President and Chief Executive Officer |
|
|
|
Dated April 10, 2018 |
Pursuant to the requirements of the Securities Exchange Act of 1934, this report has been signed below by the following persons on behalf of the registrant and in the capacities and on the dates indicated:
|
Signature and Title |
|
Date |
|
|
|
|
|
/s/Michael J. Caliel |
|
April 10, 2018 |
|
Michael J. Caliel President, Chief Executive Officer and Director (Principal Executive Officer) |
||
|
|
|
|
|
/s/J. Michael Anderson |
|
April 10, 2018 |
|
J. Michael Anderson Senior Vice President, Chief Financial Officer (Principal Financial Officer) |
||
|
|
|
|
|
/s/Lisa Curtis |
|
April 10, 2018 |
|
Lisa Curtis Vice President and Chief Accounting Officer (Principal Accounting Officer) |
|
|
|
|
|
|
|
/s/David A. B. Brown |
|
April 10, 2018 |
|
David A. B. Brown Director |
||
|
|
|
|
|
/s/J. Samuel Butler |
|
April 10, 2018 |
|
J. Samuel Butler Director |
||
|
|
|
|
|
/s/Robert R. Gilmore |
|
April 10, 2018 |
|
Robert R. Gilmore Director |
||
|
|
|
|
|
/s/John T. Nesser III |
|
April 10, 2018 |
|
John T. Nesser III Director |
||
|
|
|
|
|
/s/Nelson Obus |
|
April 10, 2018 |
|
Nelson Obus Director |
|
|
|
|
|
|
|
/s/Alan P. Krusi |
|
|
|
Alan P. Krusi Director |
|
April 10, 2018 |
|
|
96