Attached files
| file | filename |
|---|---|
| EX-99.1 - EXHIBIT 99.1 - Reliant Bancorp, Inc. | a51392367ex99_1.htm |
| 8-K - COMMERCE UNION BANCSHARES, INC 8-K - Reliant Bancorp, Inc. | a51392367.htm |
Exhibit 99.2
KBW Community Bank Investor Conference August 3, 2016 NASDAQ: CUBN
Forward Looking Statement Statements in this presentation relating to Commerce Union Bancshares Inc.’s plans, objectives, expectations or future performance are forward-looking statements within the meaning of the Private Securities Litigation Reform Act of 1995. The words “believe,” “may,” “should,” “anticipate,” “estimate,” “expect,” “intend,” “objective,” “possible,” “seek,” “plan,” “strive” or similar words, or negatives of these words, identify forward-looking statements. These forward-looking statements are based on management’s current expectations. The Company’s actual results in future periods may differ materially from those indicated by forward-looking statements due to various risks and uncertainties. These and other risks and uncertainties are described in greater detail under “Risk Factors” in the Form 10-K and subsequent periodic reports filed with the Securities and Exchange Commission. The forward-looking statements in this presentation are made as of the date of the release and the Company does not assume any responsibility to update these statements.
CUBN Overview Launched April 1, 2015 with merger of Commerce Union Bank and Reliant Bank Focused on fast growing middle Tennessee markets$883 million in assets – June 30, 2016Superior asset quality Diversified markets and lending opportunities Experienced management team with local market knowledge Significant growth opportunities in existing markets
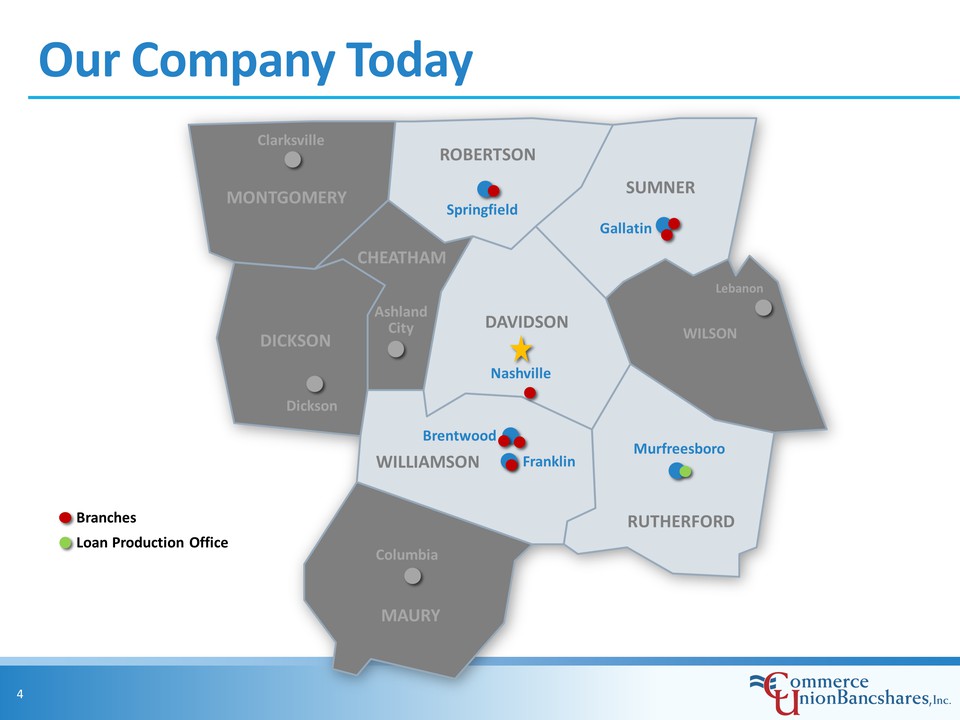
Our Company Today MONTGOMERY ROBERTSON SUMNER DICKSON DAVIDSON WILSON CHEATHAM RUTHERFORD WILLIAMSON MAURY Springfield Gallatin Lebanon Murfreesboro Franklin Columbia Dickson Clarksville Ashland City Nashville Brentwood Branches Loan Production Office
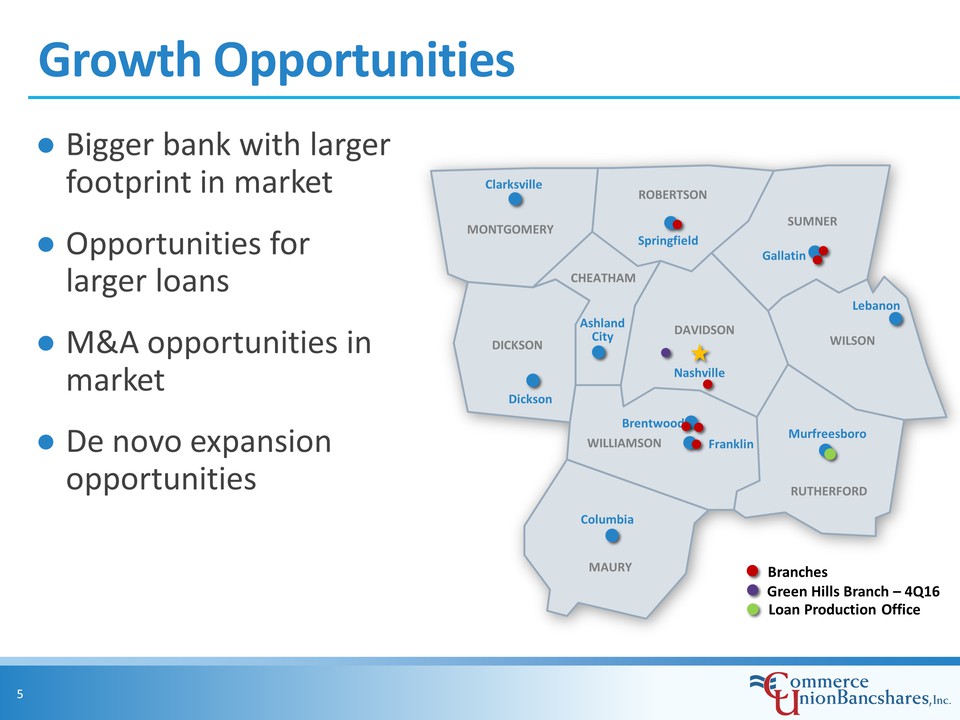
Growth Opportunities Bigger bank with larger footprint in market Opportunities for larger loans M&A opportunities in market De novo expansion opportunities Branches MONTGOMERY ROBERTSON SUMNER DICKSON DAVIDSON WILSON CHEATHAM RUTHERFORD WILLIAMSON MAURY Springfield Gallatin Lebanon Murfreesboro Franklin Columbia Dickson Clarksville Ashland City Nashville Brentwood Loan Production Office Green Hills Branch – 4Q16
Accomplishments Since Merger Continued focus on integration/cost savings Added key management in operations Completed core processor conversion Focused mortgage operations on middle Tennessee Rebranded bank to leverage marketing opportunities Improved stock liquidity after NASDAQ listing
Strategic Focus Maintain focus on strong, profitable organic growth Maintain superior asset quality Recruit revenue producing talent Expand branch and loan production offices Strengthen mortgage operations in local markets Focused on fast growing middle Tennessee markets
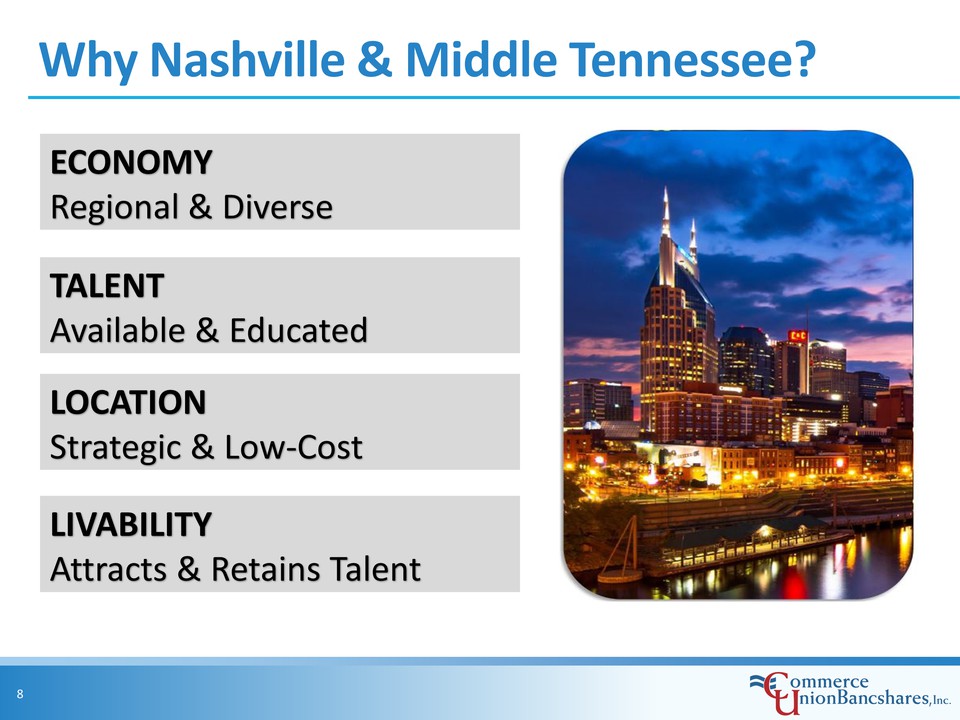
Why Nashville & Middle Tennessee? LIVABILITY Attracts & Retains Talent LOCATION Strategic & Low-Cost TALENT Available & Educated ECONOMY Regional & Diverse
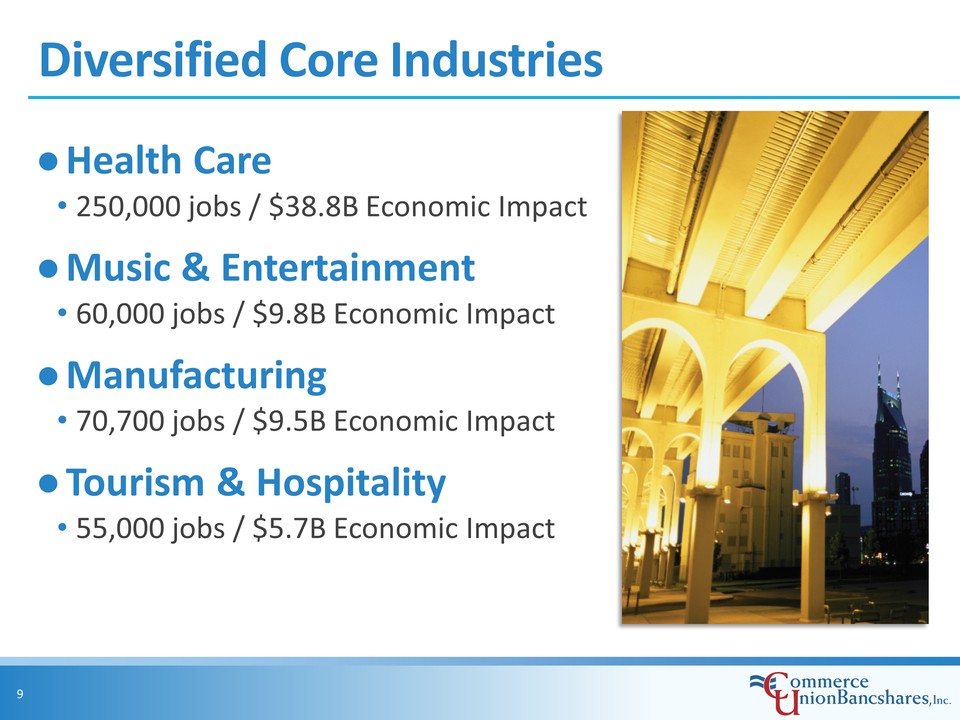
Diversified Core Industries Health Care 250,000 jobs / $38.8B Economic Impact Music & Entertainment 60,000 jobs / $9.8B Economic Impact Manufacturing 70,700 jobs / $9.5B Economic Impact Tourism & Hospitality 55,000 jobs / $5.7B Economic Impact
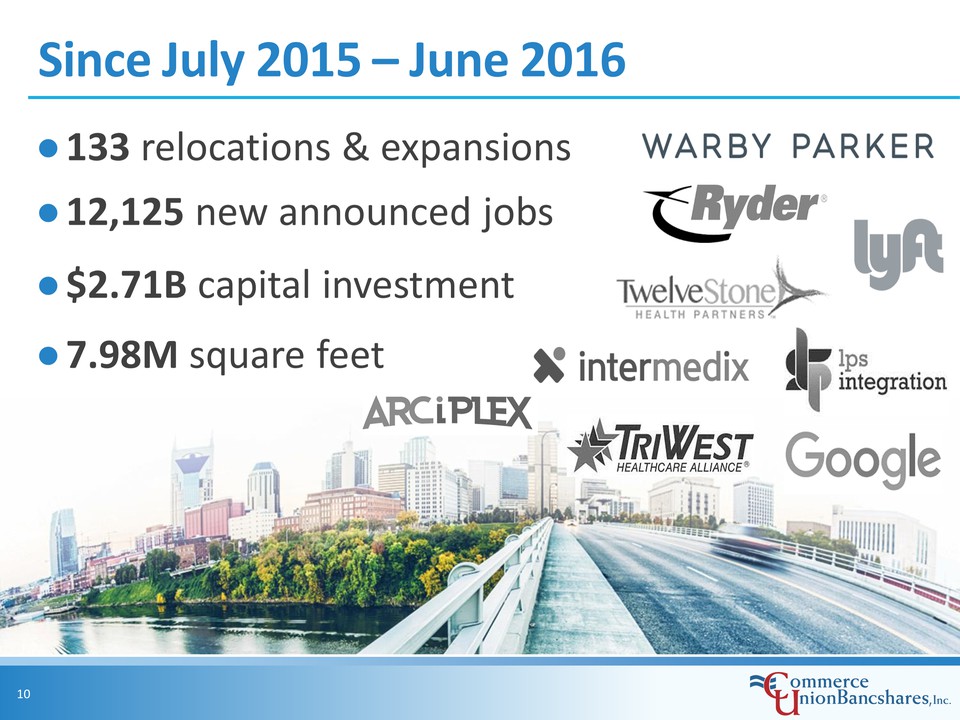
Since July 2015 – June 2016 133 relocations & expansions 12,125 new announced jobs $2.71B capital investment 7.98M square feet
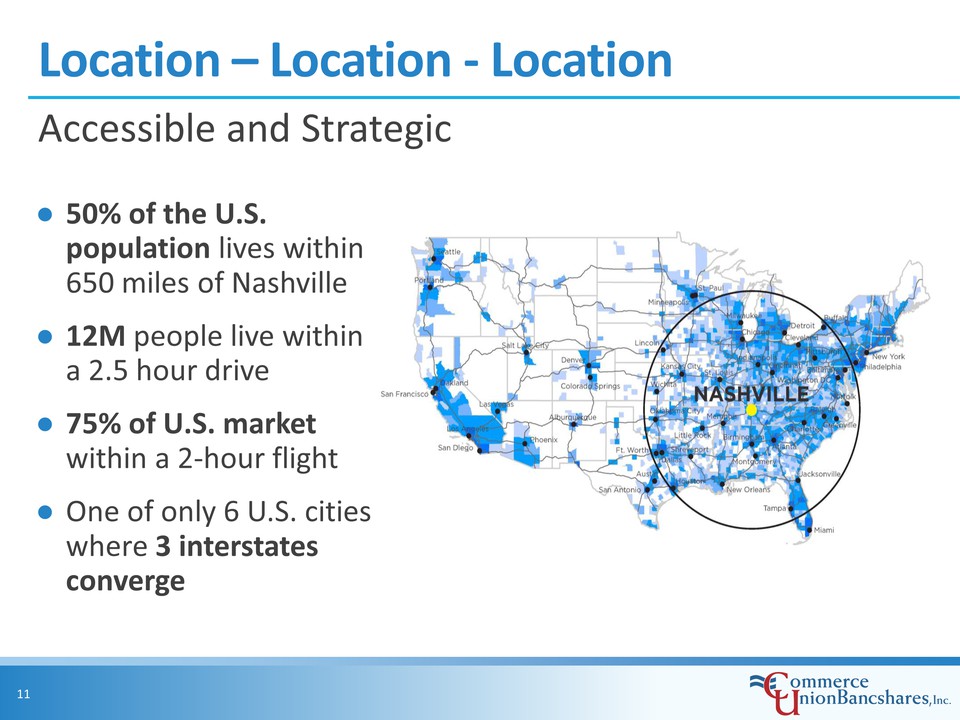
Location – Location - Location 50% of the U.S. population lives within 650 miles of Nashville 12M people live within a 2.5 hour drive75% of U.S. market within a 2-hour flight One of only 6 U.S. cities where 3 interstates converge Accessible and Strategic
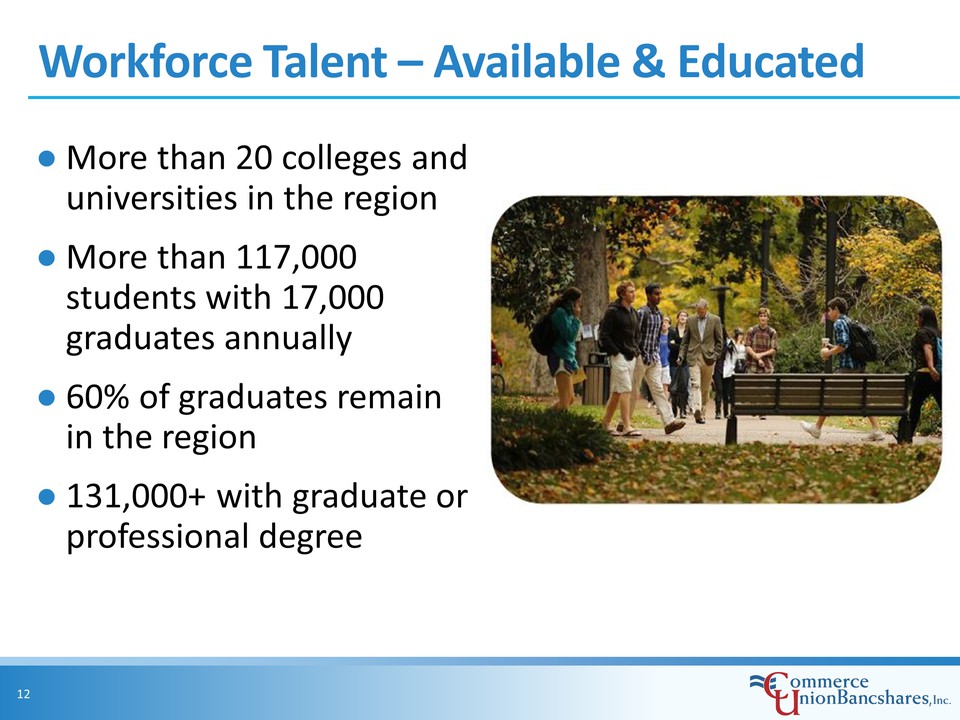
Workforce Talent – Available & Educated More than 20 colleges and universities in the region More than 117,000 students with 17,000 graduates annually 60% of graduates remain in the region131,000+ with graduate or professional degree
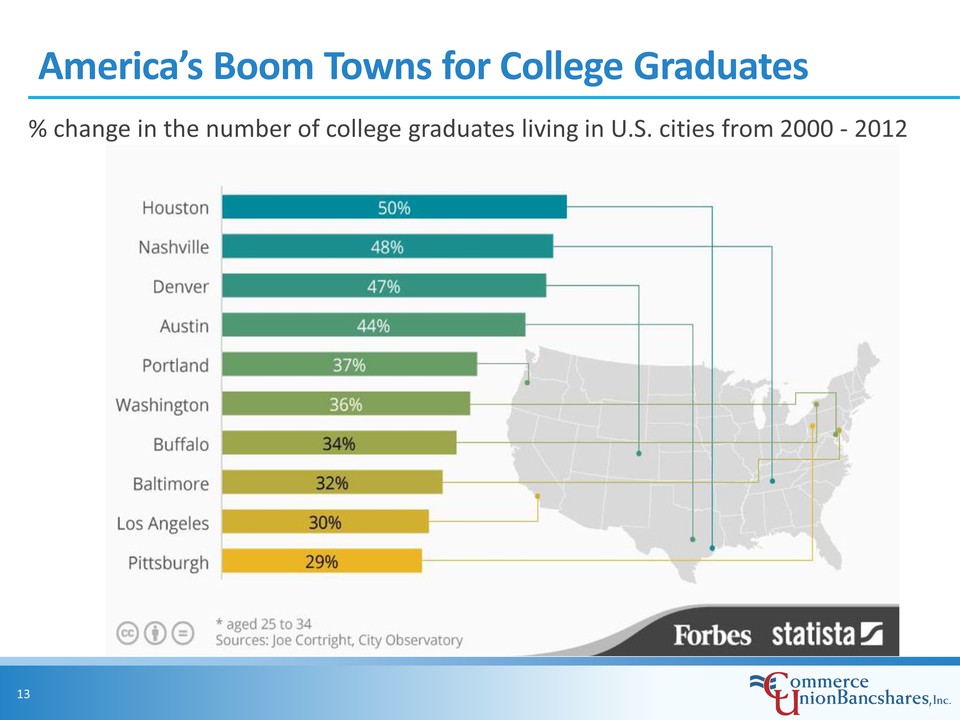
America’s Boom Towns for College Graduates % change in the number of college graduates living in U.S. cities from 2000 - 2012 Houston 50% Nashville 48% Denver 47% Austin 44% Portland 37% Washington 36% Buffalo 34% Baltimore 32% Los Angeles 30% Pittsburgh 29%
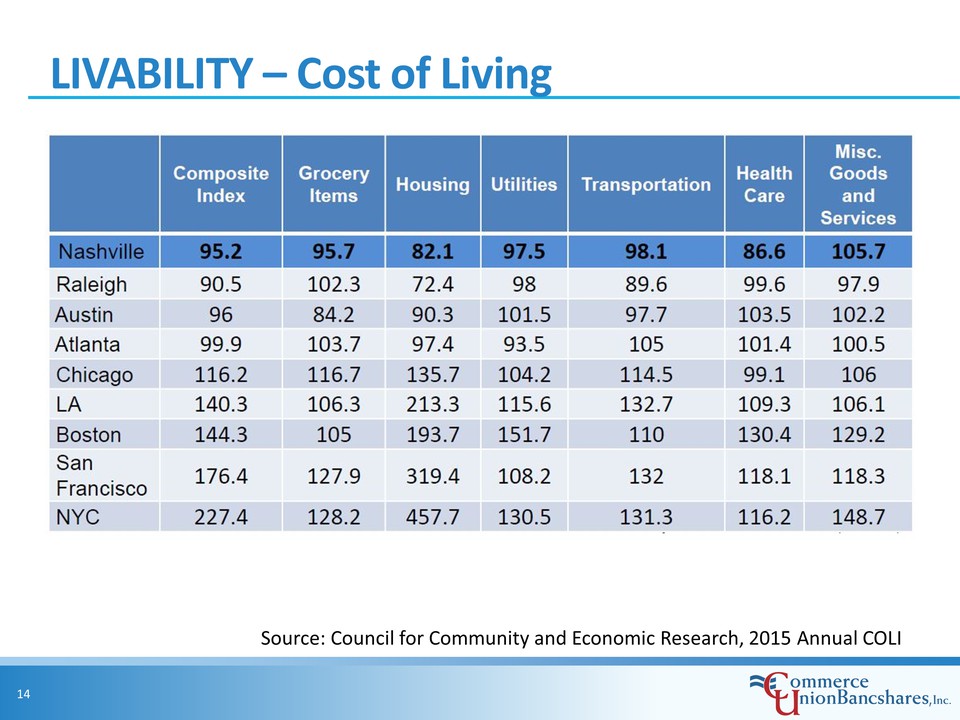
LIVABILITY – Cost of Living Source: Council for Community and Economic Research, 2015 Annual COLI Nashville Raleigh Austin Atlanta Chicago LA Boston San Francisco NYC Composite Index Grocery Items Housing Utilities Transportation Health Care Misc. Goods and Services 95.2 95.7 82.1 97.5 98.1 86.6 105.7 90.5 102.3 72.4 98 89.6 99.6 97.9 96 84.2 90.3 101.5 97.7 103.5 102.2 99.9 103.7 97.4 93.5 105 101.4 100.5 116.2 116.7 135.7 104.2 114.5 99.1 106 140.3 106.3 213.3 115.6 132.7 109.3 106.1 144.3 105 193.7 151.7 110 130.4 129.2 176.4 127.9 319.4 108.2 132 118.1 118.3 227.4 128.2 457.7 130.5 131.3 116.2 148.7
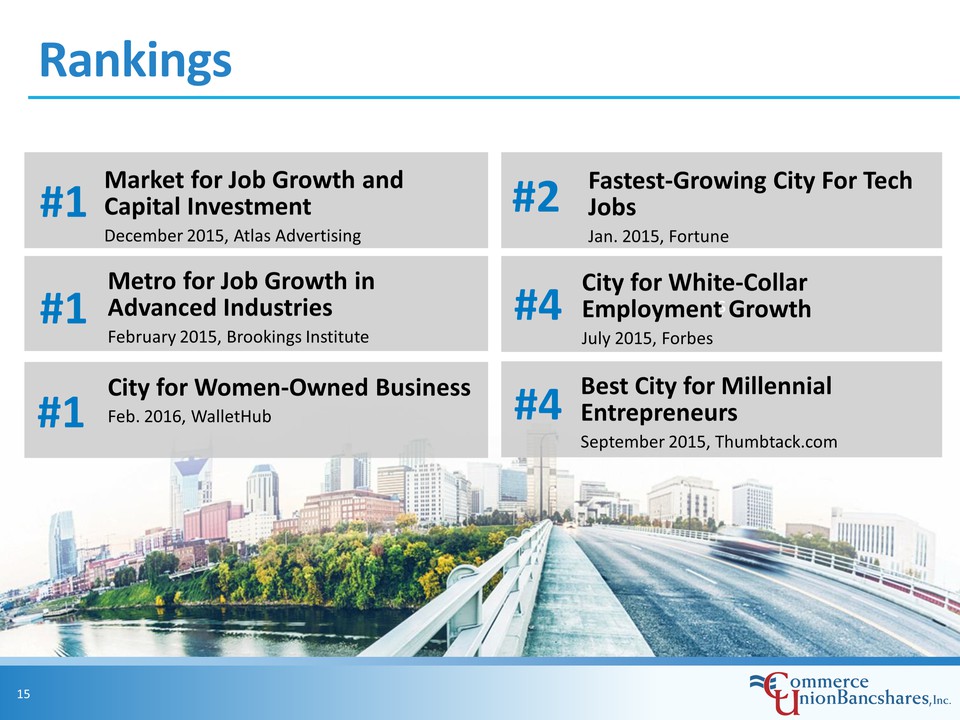
Rankings #1 Metro for Job Growth in Advanced Industries February 2015, Brookings Institute #1 #1 City for Women-Owned Business Feb. 2016, WalletHub #2 #4 City for White-Collar Employment Growth July 2015, Forbes #4 Best City for Millennial Entrepreneurs September 2015, Thumbtack.com Market for Job Growth and Capital Investment December 2015, Atlas Advertising Fastest-Growing City For Tech Jobs Jan. 2015, Fortune
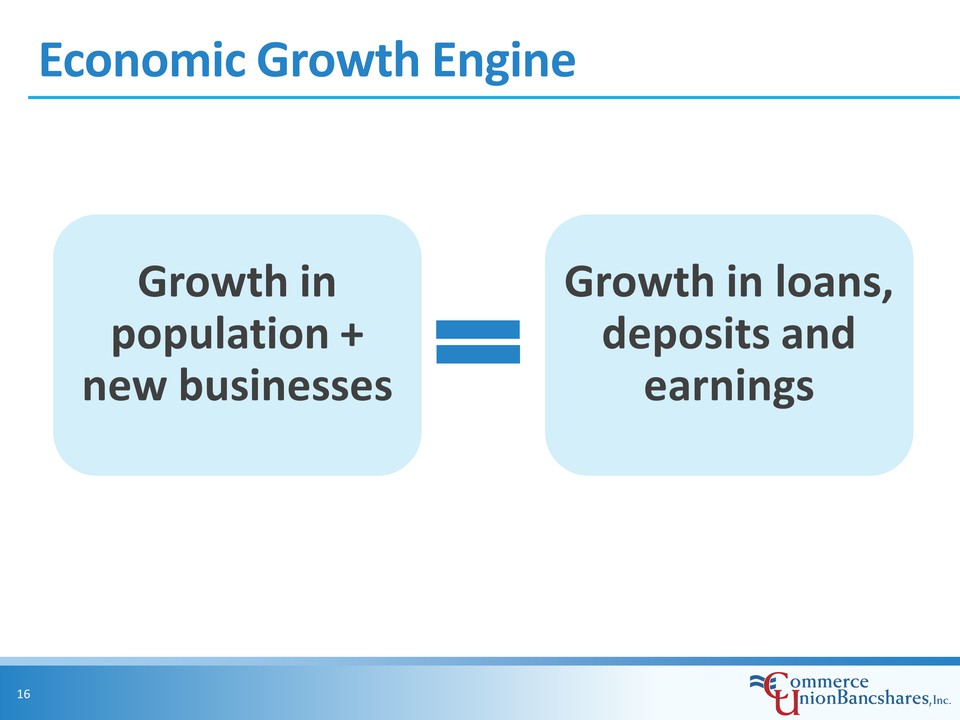
Economic Growth Engine Growth in population + new businesses Growth in loans, deposits and earnings
Dan Dellinger Chief Financial Officer
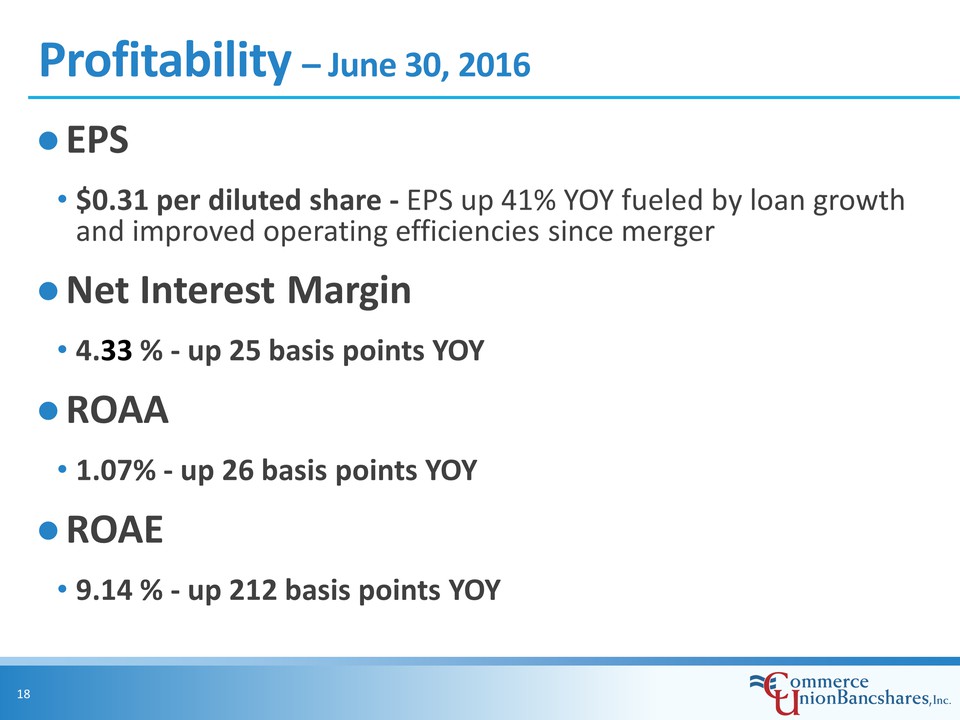
Profitability – June 30, 2016 EPS $0.31 per diluted share - EPS up 41% YOY fueled by loan growth and improved operating efficiencies since merger Net Interest Margin 4.33 % - up 25 basis points YOY ROAA 1.07% - up 26 basis points YOY ROAE 9.14 % - up 212 basis points YOY
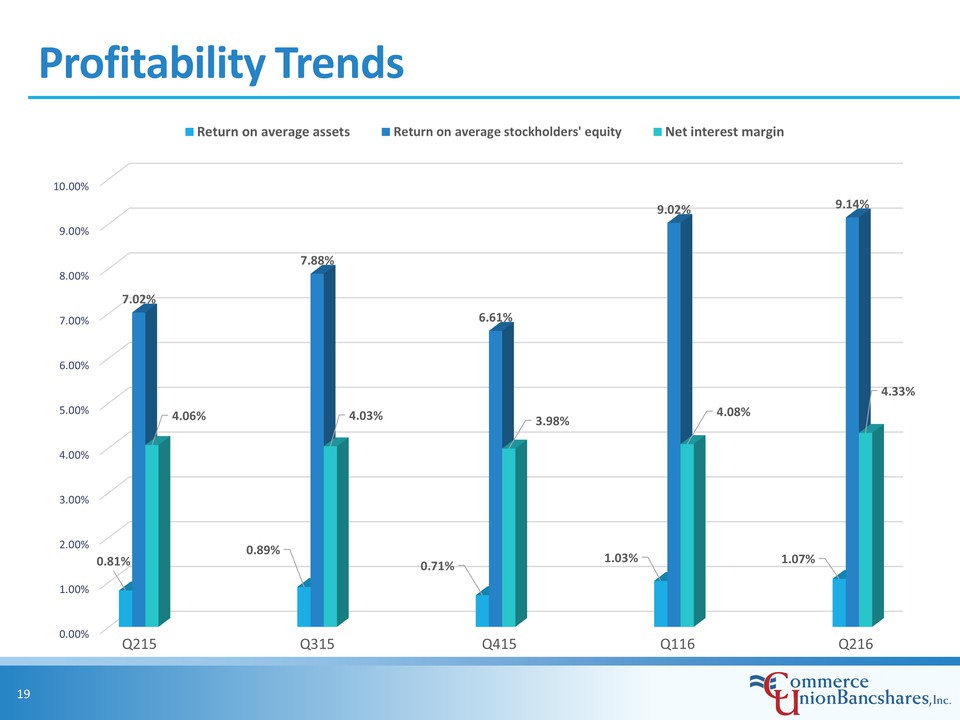
Profitability Trends Return on average assets Return on average stockholders' equity Net interest margin 10.00% 9.00% 8.00% 7.00% 6.00% 5.00% 4.00% 3.00% 2.00% 1.00% 0.00% Q215 Q315 Q415 Q116 Q216 7.02% 4.06% 0.81% 7.88% 4.03% 0.89% 6.61% 3.98% 0.71% 9.02% 4.08% 1.03% 9.14% 4.33% 1.07%
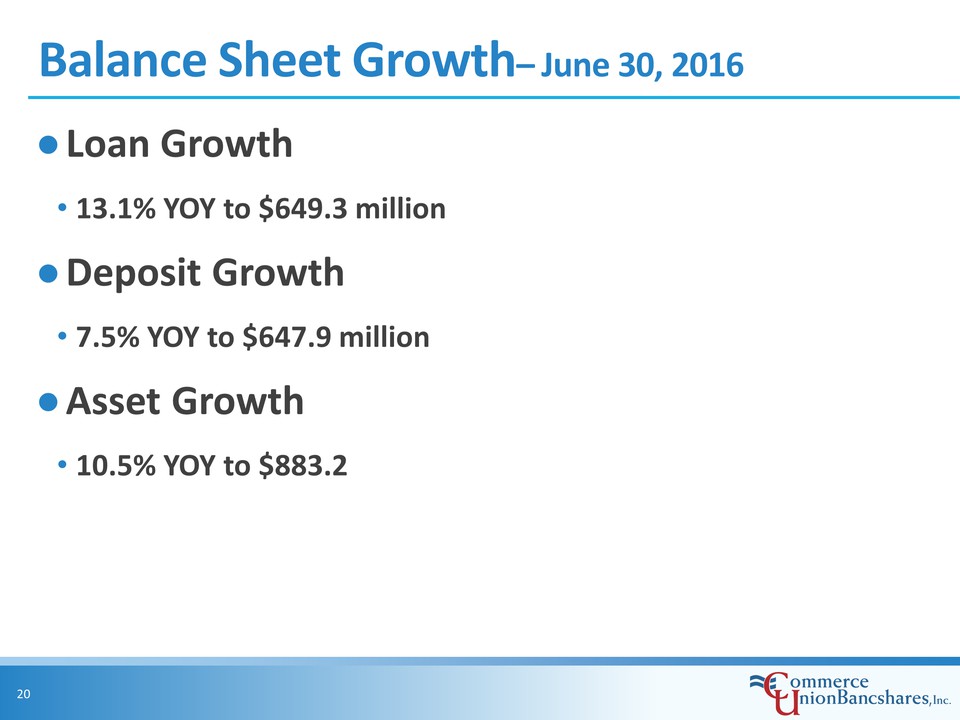
Balance Sheet Growth– June 30, 2016 Loan Growth 13.1% YOY to $649.3 million Deposit Growth7.5% YOY to $647.9 million Asset Growth 10.5% YOY to $883.2
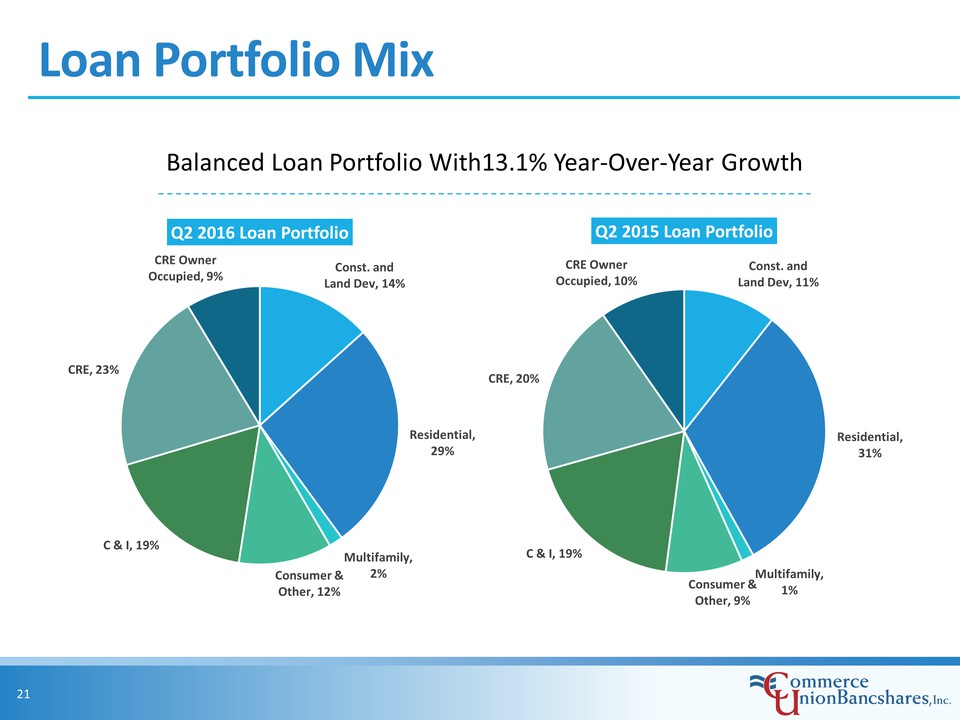
Loan Portfolio Mix Balanced Loan Portfolio With13.1% Year-Over-Year Growth Q2 2016 Loan Portfolio Q2 2015 Loan Portfolio CRE Owner Occupied, 9% Cost. and Land Dev, 14% Residential, 29% Multifamily, 2% Consumer & Other, 12% C & I, 19% CRE, 23% CRE Owner Occupied, 10% Const. and Land Dev, 11% Residential, 31% Multifamily, 1% Consumer & Other, 9% C & I, 19% CRE, 20%
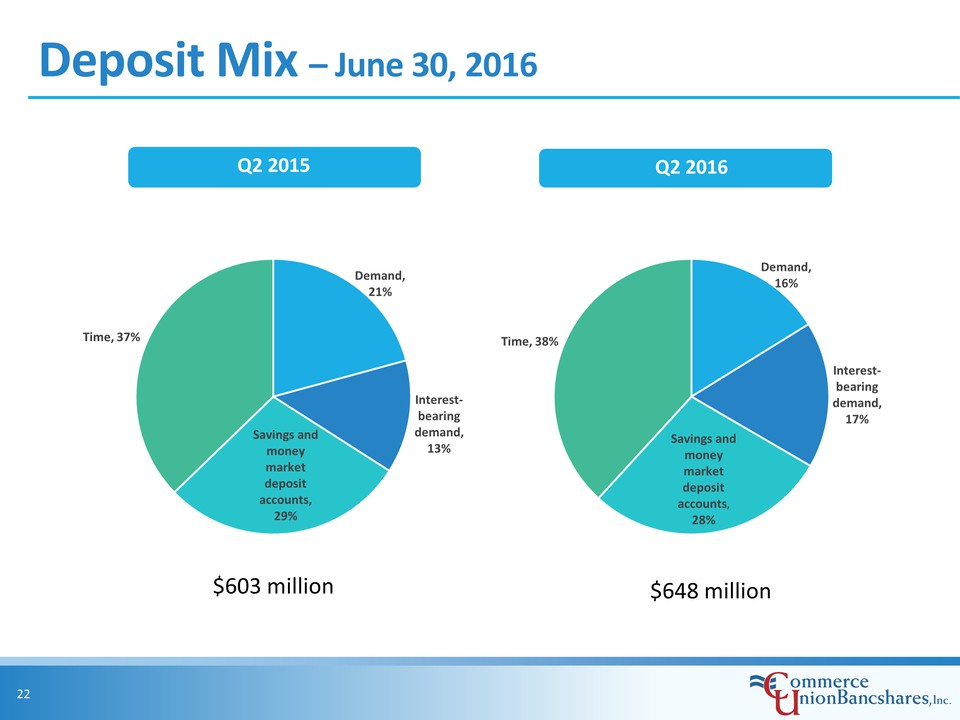
Deposit Mix – June 30, 2016 $603 million $648 million Q2 2015 Q2 2016 Time, 37% Demand, 21% Interest-bearing demand, 13% Savings and money market deposit accounts, 29% Time, 38% Demand, 16% Interest-bearing demand, 17% Savings and money market deposit accounts, 28%
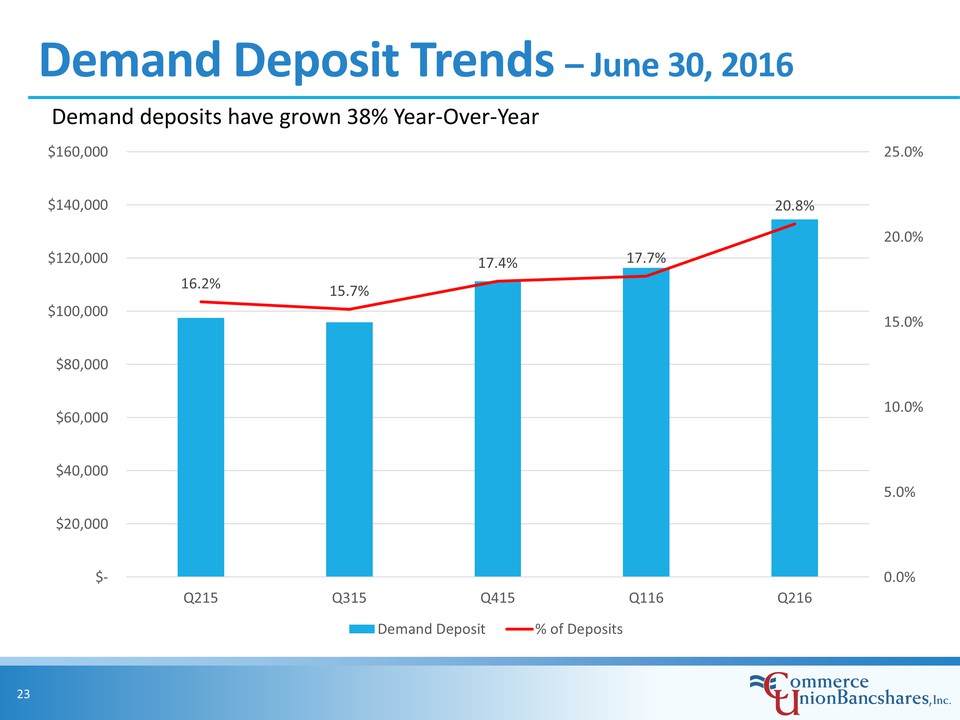
Demand Deposit Trends – June 30, 2016 Demand deposits have grown 38% Year-Over-Year $160,000 $140,000 $120,000 $100,000 $80,000 $60,000 $40,000 $20,000 $- Q215 Q315 Q415 Q116 Q216 20.0% 15.0% 10.0% 5.0% 0.0% Demand Deposit % of Deposits 16.2% 15.7% 17.4% 17.7% 20.8%
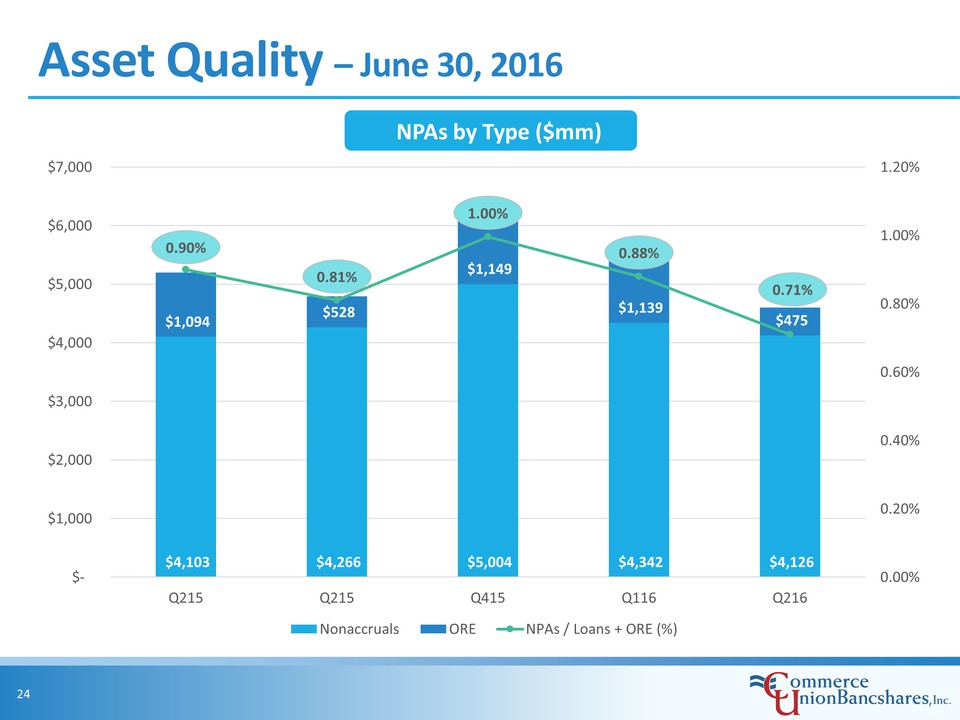
Asset Quality – June 30, 2016 NPAs by Type ($mm) $7,000 $6,000 $5,000 $4,000 $3,000 $2,000 $1,000 $- Q215 Q215 Q415 Q116 Q216 1.20% 1.00% 0.80% 0.60% 0.40% 0.20% 0.00% Nonaccruals ORE NPAs / Loans + ORE (%) 0.90% 0.81% 1.00% 0.88% 0.71% $1,094 $528 $1,149 $1,139 $475 $4,103 $4,266 $5,004 $4,342 $4,126
Strategy for 2016 Continued growth in loans Growth in non-interest bearing deposits Consistent focus on asset quality Maintain strong net interest margin Improve operating efficiency Branch expansion in Green Hills Local focus of mortgage operations Add revenue producing talent Deepen existing relationships
NASDAQ: CUBN