Attached files
| file | filename |
|---|---|
| EX-32.1 - ASPIRITY HOLDINGS LLC | ex32-1.htm |
| EX-31.2 - ASPIRITY HOLDINGS LLC | ex31-2.htm |
| EX-31.1 - ASPIRITY HOLDINGS LLC | ex31-1.htm |
UNITED STATES OF AMERICA
SECURITIES AND EXCHANGE COMMISSION
Washington, DC 20549
FORM 10-Q
| [x] | QUARTERLY REPORT PURSUANT TO SECTION 13 OR 15(d) OF THE SECURITIES EXCHANGE ACT OF 1934 |
FOR THE QUARTERLY PERIOD ENDED MARCH 31, 2016
or
| [ ] | TRANSITION REPORT PURSUANT TO SECTION 13 OR 15(d) OF THE SECURITIES EXCHANGE ACT OF 1934 |
| For the Transition Period from __ to __ |
Commission File Number: 333-179460
Aspirity Holdings, LLC
(Exact name of registrant as specified in its charter)
| Minnesota | 4931 – Electric & Other Services Combined | 27-1658449 | ||
| (State of organization) | (Primary Standard Industrial Classification Code Number) |
(IRS Employer Identification Number) |
701 Xenia Avenue South, Suite 475 Minneapolis, MN 55416 |
||
| (Address of principal executive offices, zip code) | ||
| (763) 432-1500 | ||
| (Registrant’s telephone number, including area code) |
Indicate by check mark whether the registrant (1) has filed all reports required to be filed by Section 13 or 15(d) of the Securities Exchange Act of 1934 during the preceding 12 months (or for such shorter period that the registrant was required to file such reports), and (2) has been subject to such filing requirements for the past 90 days. Yes [x] No [ ]
Indicate by check mark whether the registrant has submitted electronically and posted on its corporate web site, if any, every Interactive Data File required to be submitted and posted pursuant to Rule 405 of Regulation S T (§232.405 of this chapter) during the preceding 12 months (or for such shorter period that the registrant was required to submit and post such files). Yes [x] No [ ]
Indicate by check mark whether the registrant is a large accelerated filer, an accelerated filer, a non-accelerated filer, or smaller reporting company. See definition of “large accelerated filer”, “accelerated filer”, and “smaller reporting company” in Rule 12b-2 of the Exchange Act. (Check one): Large accelerated filer [ ] Accelerated filer [ ] Non-accelerated filer [ ] Smaller reporting company [x]
Indicate by check mark whether the registrant is a shell company (as defined in Rule 12b-2 of the Exchange Act). Yes [ ] No [x]
TABLE OF CONTENTS
| ii |
| 3 |
| Terms Specific to the Company | ||
| Abbreviation
or acronym | Definition | |
| Exelon; PSA | Exelon Generation Company, LLC, a Pennsylvania limited liability company and wholly-owned subsidiary of Exelon Corporation. Exelon is the operator of the second largest electricity generation fleet in the U.S. On March 30, 2016, Exelon and Aspirity Energy entered into a 3 year, full requirements preferred supply agreement (“PSA”). | |
| Legacy Businesses | The wholesale energy trading, real estate investments, investments in private companies, and legacy retail energy business operated by Enterprises, a former first tier subsidiary of the Company. | |
| Notes; Notes Offering | The Company’s Renewable Unsecured Subordinated Notes issued pursuant to its ongoing “Notes Offering” the direct public offering the Company’s Notes pursuant to Registration Statements on Form S-1 | |
| Operating Agreement | Aspirity’s Amended and Restated Operating Agreement dated March 30, 2016 | |
| Restructuring | The restructuring of the Company that was approved by the Board on May 27, 2015 and effected the legal separation of the Legacy Businesses from the Company | |
| S-1; Old and New | The Company’s Registration Statement on Form S-1, declared effective by the Securities and Exchange Commission on November 12, 2015 with respect to the Notes Offering is defined as the “New S-1”, while that declared effective on May 10, 2012 is defined as the “Old S-1” | |
| Term Loan | Term Loan Agreement between Aspirity Financial as lender and Enterprises as borrower dated July 1, 2015, as amended on November 1, 2015 and January 27, 2016. Pursuant to the Term Loan, Enterprises borrowed $22,206,000 from Aspirity Financial at a weighted average interest rate of 14.08% and a financial maturity date of December 30, 2019. Subject to monthly true-ups, the repayment schedule provides for the maximum possible interest and principal redemptions in a given month. | |
| Term Loan Notes | Each of the Company’s Notes outstanding as of June 30, 2015, including any renewals thereof |
| 4 |
| Industry and Accounting Terms | ||
| Abbreviation
or acronym |
Definition | |
| ASU | Accounting Standards Update | |
| Btu; therm; MMBtu | A “Btu” or British thermal unit is a measure of thermal energy or the amount of heat needed to raise the temperature of one pound of water from 39°F to 40°F. A “therm” is one hundred thousand Btu. One “MMBtu” is one million Btu. | |
| CFTC | Commodity Futures Trading Commission, an independent agency of the United States government with primary responsibility for regulating futures and options markets | |
| CME | CME Group operates options and futures exchanges including, among others, the Chicago Mercantile Exchange, the Chicago Board of Trade, and the New York Mercantile Exchange | |
| EDC; LDC | Electric distribution company or energy distribution company; may also be known as a local distribution company; see also “electric utility” | |
| EDI compliant | In order for a licensed competitive electricity supplier to sell to, bill, and collect from retail customers within a given utility’s service territory, it must establish an electronic connection or become “EDI compliant” with such utility | |
| EEI | The Edison Electric Institute is a trade association representing U.S. investor-owned electric companies. Its 160 U.S. operating utility and parent company members provide electricity for 220 million Americans, operate in all 50 states and the District of Columbia, and directly employ more than 500,000 workers. The association also has 70 international electric company members and 270 industry suppliers and related organizations as associate members | |
| EIA | Energy Information Administration, an independent agency within the U.S. Department of Energy | |
| Electric utility | A corporation, person, agency, authority, or other legal entity or instrumentality aligned with distribution facilities for delivery of electric energy for use primarily by the public such as investor-owned utilities (“IOUs”), municipally-owned utilities (“munis”), utilities owned by states or political subdivisions thereof (“POUs”), federal utilities, and rural electric cooperatives (“co-ops”). A few entities that are tariff based and corporately aligned with companies that own distribution facilities are also included. | |
| ERCOT | Electric Reliability Council of Texas, an ISO managing 85% of the electric Load of Texas and subject to oversight by the Public Utility Commission of Texas and the Texas Legislature but not FERC | |
| FASB | Financial Accounting Standards Board | |
| FERC | Federal Energy Regulatory Commission, an independent regulatory agency within the U.S. Department of Energy | |
| GAAP | Generally accepted accounting principles in the United States | |
| ICE | Intercontinental Exchange® is a leading operator of futures and stock exchanges and clearinghouses, including the New York Stock Exchange |
| 5 |
| Industry and Accounting Terms | ||
| Abbreviation
or acronym |
Definition | |
| ISO; RTO | Independent System Operator, a non-profit organization formed at the direction or recommendation of FERC that coordinates, controls, and monitors the operation of a bulk electric power system, usually within a single U.S. state, but sometimes encompassing multiple states. A Regional Transmission Organization (“RTO”) typically performs the same functions as an ISO, but covers a larger area. ISOs and RTOs may also operate centrally cleared wholesale markets for electric power quoted on both a “real-time” and “day ahead” basis. | |
| ISO-NE | ISO New England Inc., an RTO serving Connecticut, Maine, Massachusetts, New Hampshire, Rhode Island, and Vermont | |
| MISO | Midcontinent Independent System Operator, Inc., (formerly the Midwest Independent Transmission System Operator, Inc.), an RTO serving all or part of Arkansas, Illinois, Indiana, Iowa, Louisiana, Manitoba, Michigan, Minnesota, Mississippi, Missouri, Montana, North Dakota, South Dakota, Texas, and Wisconsin | |
| MCF | One thousand cubic feet, a common unit of price measure for natural gas. In 2010, one MCF of natural gas had a heat content of 1,025 Btu. | |
| NERC | North American Electric Reliability Corporation, a non-profit corporation formed on March 28, 2006 as the successor to the National Electric Reliability Council, also known as NERC, formed in 1968. NERC is the designated Electric Reliability Organization for the U.S. and operates under the auspices of FERC. | |
| NGX | Natural Gas Exchange Inc., provides electronic trading, central counterparty clearing and data services to the North American natural gas and electricity markets. NGX is wholly owned by TMX Group Limited which collectively manages all aspects of Canada’s senior and junior equity markets. | |
| NYISO | New York Independent System Operator, an ISO serving New York state | |
| PJM | PJM Interconnection, a RTO serving all or part of Delaware, Illinois, Indiana, Kentucky, Maryland, Michigan, New Jersey, North Carolina, Ohio, Pennsylvania, Tennessee, Virginia, West Virginia, and the District of Columbia. | |
| POR; non-POR | All states with restructured retail markets have implemented laws and regulations with respect to permitted billing, credit, and collections practices. Some of these states require an EDC billing customers in their service territory on behalf of suppliers operating there to purchase the receivables generated as a result of energy sales, generally at a modest discount to reflect bad debt experience. These states are known as “purchase of receivables” or “POR” jurisdictions while those without this provision are known as “non-POR” areas. | |
| PURPA | Public Utilities Regulatory Policy Act of 1978 |
| 6 |
| Industry and Accounting Terms | ||
| Abbreviation
or acronym |
Definition | |
| RECs | “Renewable energy certificates” represent the property rights to the environmental, social, and other non-power qualities of renewable electricity generation and can be sold separately from the underlying physical electricity. As renewable generators produce electricity, they create one REC per megawatt-hour. If the physical electricity and the associated RECs are sold to separate buyers, the electricity is no longer considered “renewable” or “green” as the REC is what conveys the attributes and benefits of the renewable electricity, not the electricity itself | |
| SEC | U.S. Securities and Exchange Commission, an independent agency of the United States government with primary responsibility for enforcing federal securities laws and regulating the securities industry and stock exchanges | |
| Watt (W); Watt-hour (Wh) | Value-at-Risk is a measure of the risk of loss on a specific portfolio of financial assets. For a given portfolio, probability, and time horizon, VaR is the value at which the probability that a mark-to-market loss over the given time horizon exceeds the calculated value, assuming normal markets and no trading. For example, if a portfolio has a one-day, 5% VaR of $1 million, there is a 5% probability that the portfolio will fall in value by more than $1 million over a one-day period. |
| 7 |
| Industry and Accounting Terms | ||
| Abbreviation
or acronym |
Definition | |
| Watt (W); Watt-hour (Wh) | Although in everyday usage, the terms “energy” and “power” are essentially synonyms, scientists, engineers, and the energy business distinguish between them. Technically, energy is the ability to do work, or move a mass a particular distance by the application of force while power is the rate at which energy is generated or consumed.
In the case of electricity, power is measured in watts (W) and is equal to voltage or the difference in charge between two points multiplied by amperage or the current or rate of electrical flow. The energy supplied or consumed by a circuit is measured in watt-hours (Wh). For example, when a light bulb with a power rating of 100W is turned on for one hour, the energy used is 100 watt-hours. This same amount of energy would light a 40-watt bulb for 2.5 hours or a 50-watt bulb for 2.0 hours.
Multiples of watts and watt-hours are measured using International Systems of Units (“SI”) conventions. For example: |
| Prefix | Symbol | Multiple (Number) | Value | ||||
| kilo | k | one thousand (1,000) | 103 | ||||
| mega | M | one million (1,000,000) | 106 | ||||
| giga | G | one billion (1,000,000,000) | 109 | ||||
| tera | T | one trillion (1,000,000,000,000) | 1012 |
Kilowatt (kW) or kilowatt-hour (kWh): one thousand watts or watt-hours. Kilowatt-hours are typically used to measure residential energy consumption and retail prices. One kWh is equal to 3,412 Btu, but fuel with a heat content of 7,000 to 11,500 Btu must be consumed to generate and deliver one kWh of electricity.
Megawatt (MW) or megawatt-hour (MWh): one million watts or watt-hours or one thousand kilowatts or kilowatt-hours. Megawatts are typically used to measure electrical generation capacity and megawatt-hours are the pricing units used in the wholesale electricity market. |
| 8 |
Readers are urged to carefully review and consider the various disclosures made by us in this Form 10-Q and in our other reports filed with the SEC that attempt to advise interested parties of the factors that may affect our business.
Statements in this report that are not statements of historical facts are considered “forward-looking” and, accordingly, involve risks and uncertainties that could cause actual results to differ materially from those discussed. Although such forward-looking statements have been made in good faith and are based on reasonable assumptions, there is no assurance that the expected results will be achieved. Any statements that express, or involve discussions as to, future expectations, risks, beliefs, plans, objectives, assumptions, events, uncertainties, financial performance, or growth strategies, often, but not always, through the use of words or phrases such as “anticipates”, “believes”, “estimates”, “expects”, “intends”, “plans”, “projects”, “likely”, “will continue”, “could”, “may”, “potential”, “target”, “outlook”, or words of similar meaning are not statements of historical facts and may be forward-looking.
In connection with the safe harbor provisions of the Private Securities Litigation Reform Act of 1995, we are providing this cautionary statement to identify important factors that could cause our actual results to differ materially from those indicated in forward-looking statements made by or on behalf of the Company in this Form 10-Q, in presentations, on our website, in response to questions, or otherwise. You should not place undue reliance on any forward-looking statement. Examples of forward-looking statements include, among others, statements we make regarding:
| ● | Expected operating results, such as revenue growth and earnings; |
| ● | Anticipated levels of capital expenditures and expansion of our retail electricity business segment; |
| ● | Current or future price volatility in the energy markets and future market conditions; |
| ● | Our belief that we have sufficient liquidity to fund our operations during the next 12 months; |
| ● | Expectations of the effect on our financial condition of claims, litigation, environmental costs, contingent liabilities, and governmental and regulatory investigations and proceedings; |
| ● | Our strategies for risk management; and |
| ● | Any other risk factors listed from time to time by the Company in reports filed with the Securities and Exchange Commission. |
Any forward-looking statement speaks only as of the date on which such statement is made, and we undertake no obligation to update any forward-looking statement to reflect events or circumstances after the date on which that statement is made or to reflect the occurrence of unanticipated events. New factors emerge from time to time, and it is not possible for management to predict all of these factors, nor can it assess the impact of each of these factors on the businesses of the Company or the extent to which any factor, or combination of factors, may cause actual results to differ materially from those contained in any forward-looking statement.
Additional disclosures regarding factors that could cause our results and performance to differ from results or performance anticipated by this report are discussed under the heading “Item 1A – Risk Factors” of our Form 10-K/A for 2015 (the “2015 Form 10-K/A”), the “Risk Factors” section beginning on page 10 of our Form S-1, and any assumptions and other factors referred to specifically in connection with such forward-looking statements that could cause our actual results to differ materially from those indicated in the forward-looking statements.
| 9 |
The Company’s communications may include certain non- GAAP financial measures. A non-GAAP financial measure is defined as a numerical measure of a company’s financial performance, financial position, or cash flows that excludes, or includes, amounts that are included in, or excluded from, the most directly comparable measure calculated and presented in accordance with GAAP in the company’s financial statements.
Non-GAAP financial measures utilized by the Company include total liquid assets. The most comparable GAAP measure is total current assets. The Company’s management believes that this non-GAAP financial measure provides useful information to investors and enables investors and analysts to more accurately compare the Company’s ongoing financial performance over the periods presented.
| 10 |
Part I – Financial Information
Item 1 - Financial Statements (Unaudited)
Aspirity Holdings, LLC and Subsidiaries
As of March 31, 2016 and December 31, 2015
| March 31, 2016 | December 31, 2015 | |||||||
| Assets | ||||||||
| Current assets | ||||||||
| Unrestricted cash | $ | 1,227,654 | $ | 1,371,167 | ||||
| Cash in collateral accounts | 63,549 | 246,000 | ||||||
| Accounts receivable | 143,905 | 3,558,316 | ||||||
| Term Loan - current (Related party - Note 13) | 7,704,085 | - | ||||||
| Prepaid expenses and other current assets | 164,584 | 82,253 | ||||||
| Cash in trading accounts | - | 1,800,272 | ||||||
| Assets of discontinued operations - current (Note 4) | - | 11,084,264 | ||||||
| Total current assets | 9,303,777 | 18,142,272 | ||||||
| Property, equipment and furniture, net | 87,993 | 217,625 | ||||||
| Other assets | ||||||||
| Term Loan - non-current | 10,963,523 | - | ||||||
| Accrued financial services revenue | 140,546 | - | ||||||
| Assets of discontinued operations - non-current | - | 10,325,332 | ||||||
| Total assets | $ | 20,495,839 | $ | 28,685,229 | ||||
| Liabilities and Members’ Equity (deficit) | ||||||||
| Current liabilities | ||||||||
| Current portions of debt | ||||||||
| Revolvers | $ | - | $ | 1,212,705 | ||||
| Renewable unsecured subordinated notes | 10,652,698 | 10,120,175 | ||||||
| Accounts payable | 741,811 | 2,471,355 | ||||||
| Accrued expenses | 12,035 | 2,090,227 | ||||||
| Accrued compensation | 109,353 | - | ||||||
| Accrued interest | 1,870,652 | 1,502,761 | ||||||
| Liabilities of discontinued operations – current | - | 5,046,443 | ||||||
| Total current liabilities | 13,386,549 | 22,443,666 | ||||||
| Long-term liabilities | ||||||||
| Renewable unsecured subordinated notes | 14,184,849 | 14,050,298 | ||||||
| Liabilities of discontinued operations - non-current | - | 242,232 | ||||||
| Total long term liabilities | 14,184,849 | 14,292,530 | ||||||
| Total liabilities | 27,571,398 | 36,736,196 | ||||||
| Commitments and contingencies | ||||||||
| Members’ equity (deficit) | ||||||||
| Series A preferred equity | 2,745,000 | 2,745,000 | ||||||
| Common equity | (9,820,559 | ) | (7,499,580 | ) | ||||
| Total members’ equity (deficit) | (7,075,559 | ) | (4,754,580 | ) | ||||
| Non-controlling interest | - | (3,955,159 | ) | |||||
| Accumulated other comprehensive income attributed to non-controlling interest | - | 658,772 | ||||||
| Total equity (deficit) | (7,075,559 | ) | (8,050,967 | ) | ||||
| Total liabilities and equity (deficit) | $ | 20,495,839 | $ | 28,685,229 | ||||
See notes to consolidated financial statements.
| 11 |
Aspirity Holdings, LLC and Subsidiaries
Consolidated Statements of Comprehensive (Loss) Income
Three Months ended March 31, 2016 and 2015
| Three Months Ended March 31, | ||||||||
| 2016 | 2015 | |||||||
| Revenue | ||||||||
| Wholesale trading, net | $ | (52,211 | ) | $ | 83,900 | |||
| Retail energy services | 9,650,085 | 5,377,109 | ||||||
| Financial services | 7,939 | - | ||||||
| Total sales and services revenue | 9,658,024 | 5,377,109 | ||||||
| Total revenue | 9,605,813 | 5,461,009 | ||||||
| Costs of sales and services | ||||||||
| Cost of retail energy sold | 8,255,520 | 6,223,221 | ||||||
| Total costs of sales and services | 8,255,520 | 6,223,221 | ||||||
| Gross profit (loss) on sales and services | 1,402,504 | (846,112 | ) | |||||
| Operating expenses | ||||||||
| Sales, marketing, and customer service | 1,046,801 | 245,899 | ||||||
| Other general and administrative | 2,833,306 | 2,065,114 | ||||||
| Total operating expenses | 3,880,107 | 2,311,013 | ||||||
| Operating loss | (2,529,814 | ) | (3,073,225 | ) | ||||
| Other income (expense) | ||||||||
| Interest expense | (1,030,667 | ) | (660,149 | ) | ||||
| Other income, net | 119,089 | - | ||||||
| Other expense, net | (911,578 | ) | (660,149 | ) | ||||
| Loss from continuing operations before income taxes | (3,441,392 | ) | (3,733,374 | ) | ||||
| Income tax benefit | - | - | ||||||
| Net loss from continuing operations | (3,441,392 | ) | (3,733,374 | ) | ||||
| Discontinued operations (Note 4) | ||||||||
| Income from discontinued operations | 712,364 | 4,566,002 | ||||||
| Income tax benefit | - | - | ||||||
| Net income from discontinued operations | 712,364 | 4,566,002 | ||||||
| Net (loss) income | (2,729,028 | ) | 832,628 | |||||
| Net loss from non-controlling interest | (109,637 | ) | - | |||||
| Net (loss) income attributable to Company | (2,619,391 | ) | 832,628 | |||||
| Preferred distributions | 137,268 | 137,268 | ||||||
| Net (loss) income attributable to common | $ | (2,756,659 | ) | $ | 695,360 | |||
| Other comprehensive (loss) income attributable to non-controlling interest | ||||||||
| Net loss from non-controlling interest | $ | (109,637 | ) | $ | - | |||
| Foreign currency translation adjustment | 90,840 | - | ||||||
| Attributable to non-controlling interest | (18,797 | ) | - | |||||
| Other comprehensive (loss) income attributable to common | ||||||||
| Net (loss) income attributable to Company | (2,619,391 | ) | 832,628 | |||||
| Foreign currency translation adjustment | - | (51,270 | ) | |||||
| Change in fair value of cash flow hedges | - | 440,984 | ||||||
| Unrealized gain on marketable securities | - | 12,275 | ||||||
| Attributable to the Company | (2,619,391 | ) | 1,234,617 | |||||
| Preferred distributions | 137,268 | 137,268 | ||||||
| Attributable to common | $ | (2,756,659 | ) | $ | 1,097,349 | |||
See notes to consolidated financial statements.
| 12 |
Aspirity Holdings, LLC and Subsidiaries
Consolidated Statements of Cash Flows
Three Months Ended March 31, 2016 and 2015
| Three Months | ||||||||
| Ended March 31, | ||||||||
| 2016 | 2015 | |||||||
| Cash flows from operating activities | ||||||||
| Net income (loss) | $ | (2,729,028 | ) | $ | 832,628 | |||
| Net income (loss) from discontinued operations | 712,364 | 4,566,002 | ||||||
| Net loss from continuing operations | (3,441,392 | ) | (3,733,374 | ) | ||||
| Adjustments to reconcile net (loss) income to net cash provided by operating activities: | ||||||||
| Depreciation and amortization | 25,196 | 18,125 | ||||||
| Unit based compensation | 435,679 | - | ||||||
| Change in operating assets and liabilities: | ||||||||
| Trading accounts | 291,104 | 410,796 | ||||||
| Collateral deposits | (49 | ) | - | |||||
| Accounts receivable | (1,364,539 | ) | (1,627,448 | ) | ||||
| Prepaid expenses and other current assets | (289,838 | ) | 3,039 | |||||
| Accrued revenue | (140,546 | ) | - | |||||
| Accounts payable | 725,107 | 1,004,604 | ||||||
| Accrued expenses | 97,313 | 247,115 | ||||||
| Accrued compensation | 109,353 | - | ||||||
| Accrued interest | 415,379 | 16,716 | ||||||
| Net cash used for continuing operations | (3,137,233 | ) | (3,660,427 | ) | ||||
| Net cash provided by discontinued operations | 1,747,833 | 9,441,048 | ||||||
| Net cash provided by (used for) operating activites | (1,389,400 | ) | 5,780,621 | |||||
| Cash flows from investing activities | ||||||||
| Purchases of property, equipment, and furniture | (16,196 | ) | (8,870 | ) | ||||
| Purchases of marketable securities | - | (2,256,014 | ) | |||||
| Proceeds from Term Loan | 1,580,578 | - | ||||||
| Net cash provided by (used for) continuing operations | 1,564,382 | (2,264,884 | ) | |||||
| Net cash used for discontinued operations | (162,852 | ) | (364,785 | ) | ||||
| Net cash provided by (used for) investing activities | 1,401,530 | (2,629,669 | ) | |||||
| Cash flows from financing activities | ||||||||
| Deferred financing costs | - | (50,579 | ) | |||||
| Proceeds from revolver | 4,345,420 | 4,884,000 | ||||||
| Payments on revolver | (3,496,586 | ) | (3,234,445 | ) | ||||
| Issuances of renewable unsecured subordinated notes | 1,554,155 | 2,541,679 | ||||||
| Redmptions of renewable unsecured subordinated notes | (903,604 | ) | (717,106 | ) | ||||
| Preferred distributions | (137,268 | ) | (91,512 | ) | ||||
| Net cash provided by continuing operations | 1,362,117 | 3,332,037 | ||||||
| Net cash used for discontinued operations | (1,103,898 | ) | (4,458,747 | ) | ||||
| Net cash provided by (used for) financing activities | 258,219 | (1,126,710 | ) | |||||
| Net increase in cash | 270,349 | 2,024,242 | ||||||
| Effect of exchange rate changes on cash | 87,104 | (25,537 | ) | |||||
| Unrestricted cash | ||||||||
| Beginning of period | 2,331,401 | 2,397,300 | ||||||
| Adjustment for deconsolidation of VIE | (1,461,200 | ) | - | |||||
| End of period | $ | 1,227,654 | $ | 4,396,005 | ||||
See notes to consolidated financial statements.
| 13 |
Aspirity Holdings, LLC and Subsidiaries
Consolidated Statements of Cash Flows (continued)
Three Months Ended March 31, 2016 and 2015
| Three Months | ||||||||
| Ended March 31, | ||||||||
| 2016 | 2015 | |||||||
| Non-cash financing activities: | ||||||||
| Accrued distributions – preferred | $ | - | $ | 45,756 | ||||
| Renewals of Notes and related interest capitalized | $ | 1,143,539 | $ | 1,473,122 | ||||
| Supplemental disclosures of cash flow information: | ||||||||
| Cash payments for interest | $ | 563,854 | $ | 596,595 | ||||
See notes to consolidated financial statements.
| 14 |
Aspirity Holdings, LLC and Subsidiaries
Consolidated Statements of Changes in Members’ Equity (Deficit)
Three Months Ended March 31, 2016 and 2015
| Series
A Preferred Equity | Common Equity (Deficit) | Accumulated Other Comprehensive Income | Total Members’ Equity (Deficit) | Non- Controlling Interest | Accumulated Other Comprehensive Income Attributed to Non- Controlling Interest | Total Equity (Deficit) | ||||||||||||||||||||||
| Balance - December 31, 2014 | $ | 2,745,000 | $ | (193,624 | ) | $ | 146,749 | $ | 2,698,125 | $ | - | $ | - | $ | 2,698,125 | |||||||||||||
| Net income | - | 832,628 | 832,628 | - | - | 832,628 | ||||||||||||||||||||||
| Other comprehensive income | - | - | 401,989 | 401,989 | - | - | 401,989 | |||||||||||||||||||||
| Preferred distributions | - | (137,268 | ) | - | (137,268 | ) | - | - | (137,268 | ) | ||||||||||||||||||
| Common distributions | - | (4,457,000 | ) | - | (4,457,000 | ) | - | - | (4,457,000 | ) | ||||||||||||||||||
| Balance - March 31, 2015 | $ | 2,745,000 | $ | (3,955,264 | ) | $ | 548,738 | $ | (661,526 | ) | $ | - | $ | - | $ | (661,526 | ) | |||||||||||
| Balance - December 31, 2015 | $ | 2,745,000 | $ | (7,499,580 | ) | $ | - | $ | (4,754,580 | ) | $ | (3,955,159 | ) | $ | 658,772 | $ | (8,050,967 | ) | ||||||||||
| Net loss | - | (2,619,391 | ) | - | (2,619,391 | ) | (109,637 | ) | - | (2,729,028 | ) | |||||||||||||||||
| - | ||||||||||||||||||||||||||||
| Other comprehensive income | - | - | - | - | - | 90,840 | 90,840 | |||||||||||||||||||||
| - | ||||||||||||||||||||||||||||
| Preferred distributions | - | (137,268 | ) | - | (137,268 | ) | - | - | (137,268 | ) | ||||||||||||||||||
| Issuance of Class B Common Units | - | 435,679 | - | 435,679 | - | - | 435,679 | |||||||||||||||||||||
| Adjustment due to deconsolidation of VIE | - | - | - | - | 4,064,796 | (749,612 | ) | 3,315,184 | ||||||||||||||||||||
| Balance - March 31, 2016 | $ | 2,745,000 | $ | (9,820,559 | ) | $ | - | $ | (7,075,559 | ) | $ | - | $ | - | $ | (7,075,559 | ) | |||||||||||
See notes to consolidated financial statements.
| 15 |
Aspirity Holdings, LLC and Subsidiaries
Notes to Consolidated Financial Statements
1. Basis of Presentation and Description of Business
Basis of Presentation
Aspirity Holdings, LLC (“Aspirity” or the “Company”) has prepared the foregoing unaudited consolidated financial statements in accordance with GAAP and the requirements of the SEC with respect to interim reporting. As permitted under these rules, certain footnotes and other financial information required by GAAP for complete financial statements have been condensed or omitted. The interim consolidated financial statements include all normal and recurring adjustments that are necessary for a fair presentation of our financial position and operating results and include the accounts of the Company and its subsidiaries. All significant intercompany balances and transactions have been eliminated in consolidation.
For additional information, please refer to our audited consolidated financial statements and the accompanying notes for the years ended December 31, 2015 and 2014 included in our 2015 Form 10-K.
Organization and Operations Prior to the Restructuring
Aspirity, previously known as Twin Cities Power Holdings, LLC or “TCPH”, is a Minnesota limited liability company formed on December 30, 2009, but had no assets or operations before December 31, 2011. On November 14, 2011, TCPH entered into an Agreement and Plan of Reorganization with its then current members and TCP, Cygnus, and TCE which were affiliated through common ownership.
Effective December 31, 2011, following receipt of approval from FERC, the members of TCP, Cygnus, and TCE each contributed all of their ownership interests in these entities to TCPH in exchange for ownership interests in TCPH. Consequently, the reorganization made TCPH a holding company. TCE and its wholly-owned subsidiary, TCPC, became inactive in the third quarter of 2012.
On June 29, 2012, the Company acquired certain assets and the business of a small retail energy supplier serving residential and small commercial markets in Connecticut. The business was renamed TSE and beginning on July 1, 2012, the Company began selling electricity to retail accounts. During late 2012 and early 2013, TSE applied for retail electricity supplier licenses for the states of Massachusetts, New Hampshire, and Rhode Island which were issued on various dates in 2013. On October 25, 2013, REH, a new first tier subsidiary, was formed in anticipation of the acquisition of a retail energy business licensed by the states of Maryland, New Jersey, Pennsylvania, and Ohio now known as TSEE. The equity of TSE was transferred to REH and the acquisition of TSEE closed on January 2, 2014.
On October 23, 2013, Cyclone was formed as a first tier subsidiary to take advantage of certain investment opportunities present in the residential real estate market. Apollo was formed on October 27, 2014 for the purpose of providing centralized services to the Company’s various other subsidiaries.
With respect to second-tier subsidiaries, as of March 31, 2015, TCP had three active subsidiaries - SUM, CTG, and MEF (deactivated in the second quarter of 2015); Cygnus had one - Cygnus Energy Futures, LLC; and REH had three - TSE, TSEE, and TSEC. Effective April 30, 2015, TCP distributed the ownership interests of CTG to TCPH and it became a first tier subsidiary of the Company.
| 16 |
Prior to the Restructuring, the Company’s subsidiaries had operations in three business segments – wholesale trading, retail energy services, and diversified investments. Specifically, the Company or its subsidiaries:
| ● | Traded financial contracts in wholesale electricity markets managed by ISOs, including those managed by MISO, PJM, ISO-NE, NYISO, and ERCOT and traded electricity and other energy-related derivative contracts on exchanges regulated by the CFTC and operated by ICE, NGX, and CME; |
| ● | Provided electricity supply services to retail customers in 8 states that permit retail choice and incorporate the service territories of 33 investor-owned utilities. As of December 31, 2015, REH was actively marketing its services in 29 of these. |
| ● | Was engaged in certain asset management activities, including real estate development and investments in privately held businesses. |
The Restructuring
Since mid-2014, the Board of Directors has been considering ways to better position the Company to access capital markets, in particular that for public equity. Ultimately, the Board concluded that the Company’s regulatory exposure and earnings volatility, particularly that related to the wholesale trading businesses, needed to be substantially reduced or eliminated in order for such efforts to be successful on the desired scale. Consequently, on May 27, 2015, the Board approved a plan to restructure and recast the Company as a retail energy and financial services business. Overall, the Restructuring incorporated several major steps.
New first-tier subsidiaries were created to facilitate the process, consisting of Enterprises, Aspirity Energy, and Aspirity Financial. Enterprises was formed to hold the Legacy Businesses, Aspirity Energy was formed to conduct a retail energy business, but pursue entirely different marketing and operating strategies than those used by the legacy retail business carried out by REH, and Aspirity Financial was formed to provide energy-related financial services to companies and households.
Secondly, on June 1, 2015, the Company sold the outstanding equity interests of TCP and its subsidiary, SUM, to Angell for cash and a secured promissory note.
The third major component of the Restructuring, completed effective July 1, 2015, was an internal reorganization that effected the operational separation of the Legacy Businesses from the new Aspirity subsidiaries. This was accomplished via the transfer to Enterprises of the Legacy Businesses, including the remaining wholesale energy trading operations, legacy retail energy business, real estate investments, investments in private companies, and certain other assets such as the Angell note and restricted cash pledged to a Canadian court. Enterprises also assumed certain current liabilities and obligations owed by the Company such as leases for office space and equipment and certain guarantees. Finally, Aspirity Financial lent Enterprises $22,206,000 in the form of the Term Loan. The name of the Company was changed from TCPH to Aspirity to reflect the new focus.
Finally, effective November 1, 2015, the last major step in the Restructuring occurred – the distribution of 100% of the equity interests of Enterprises to the Company’s common equity owners, thus completing the legal separation of the Legacy Businesses from Aspirity. Concurrently with the Distribution, a new Operating Agreement was adopted pursuant to which the Company issued 6,064 new Class B common units to six individuals, constituting 55.00% of the total common units outstanding. The Class B units represented profits interests only and incorporated no governance or voting rights, but were automatically convertible into Class A units, each of which has full financial and voting rights, effective upon FERC approval of the change of control of the Company.
| 17 |
After the Distribution
Effective with the Distribution, we exited all wholesale trading and diversified investment activity and have no plans to engage in such in the future, therefore these operations are reported as discontinued operations. Although we no longer own REH, its retail energy services operations remain in continuing operations in our first quarter’s financial results due to not being considered a strategic shift from future operations.
Historically, these segments constituted significant parts of our business and consequently, our future financial statements will be significantly different from those of the past.
Consistent with the goal of recasting the business preparatory to an initial public offering of equity, the Company now has start-up operations in two business segments - financial services and retail energy. Our intention is to expand our retail energy operations as we receive the necessary licenses and establish the necessary relationships with utilities and expect that we will begin to structure financial services offerings in 2017.
See also “Note 3 – Variable Interest Entities”, “Note 4 - Summary Consolidating Financial Information” and “Note 5 - Discontinued Operations”.
| 18 |
Liquidity and Financial Condition
For the quarter ended March 31, 2016, the Company on a consolidated basis reported a net loss of $2,729,000 and had unrestricted cash, negative working capital, and total members’ deficit of $1,227,654, $4,082,772, and $7,075,559, respectively, as of the same date.
Aspirity Energy and Aspirity Financial are start-up companies in the retail energy and financial services industries, respectively, and are not expected to have significant revenue-generating operations until the middle of 2016 at the earliest. Prior to that, the Company will rely on the timely payment of the Term Loan to repay Term Loan Notes as they are redeemed and on its ability to sell Notes in order to fund start-up operations. Enterprises’ ability to make timely payments on the Term Loan depends in part on the operations of its Legacy Businesses which were not profitable in 2015. In the event amounts owed to us are paid late or not paid, our ability to fund operations, sell new Notes, and repay existing Notes will be negatively impacted.
While the Company believes that payments from Enterprises on the Term Loan, anticipated cash generated from operating activities, availability of trade credit with respect to power purchases, and anticipated proceeds from our Notes Offering will be sufficient to meet operating cash requirements and obligations under the Notes and Term Loan Notes through at least December 31, 2016, there can be no assurance that this will prove to be the case. Consequently, the Company regularly evaluates other sources of debt financing and is also considering seeking additional equity capital to meet its funding needs. However, there can be no assurance that these efforts will prove to be successful.
2. Summary of Significant Accounting Policies
A description of our significant accounting policies is included in the 2015 Form 10-K and our interim consolidated financial statements should be read in conjunction with the financial statements and accompanying notes included in that report.
Results for the three-month period ended March 31, 2016 are not necessarily indicative of the results expected for the year ending December 31, 2016.
Principles of Consolidation
The Company evaluates the need to consolidate affiliates based on standards set forth in Accounting Standards Codification 810 Consolidation (“ASC 810”). In determining whether we have a controlling interest in an affiliate and the requirement to consolidate the accounts of an entity, management considers factors such as our ownership interest, our authority to make decisions, contractual and substantive participating rights of owners, as well as whether the entity is a variable interest entity or “VIE”.
A VIE is an entity that does not have sufficient equity at risk to finance their activities without additional subordinated financial support from other parties or whose equity investors lack any of the characteristics of a controlling financial interest. A variable interest is an investment or other interest that will absorb portions of a VIE’s expected losses or receive portions of the entity’s expected residual returns. Variable interests are contractual, ownership, or other pecuniary interests that change with changes in the fair value of the entity’s net assets. A party is the primary beneficiary of a VIE and must consolidate it when that party has a variable interest, or combination of variable interests, that provides it with a controlling financial interest. A party is deemed to have a controlling financial interest if it meets both of the power and losses/benefits criteria. The power criterion is the ability to direct the activities of the VIE that most significantly impact its economic performance. The losses/benefits criterion is the obligation to absorb losses from, or right to receive benefits from, the VIE that could potentially be significant to the VIE. The VIE model requires an ongoing reconsideration of whether a reporting entity is the primary beneficiary of a VIE due to changes in facts and circumstances.
| 19 |
Revenue Recognition
Revenue from the retail sale of electricity to customers is recorded in the period in which the commodity is consumed, net of any applicable sales tax. The Company follows the accrual method of accounting for revenues whereby electricity consumed by customers but not yet billed under the cycle billing method is estimated and accrued along with the related costs. Changes in estimates are reflected in operations in the period in which they are refined.
Financial Instruments
From time to time, the Company may hold various financial instruments. The nature of these instruments and the Company’s operations expose it to credit risk and fair value risk.
Financial instruments that subject the Company to concentrations of credit risk consist principally of deposits in trading or collateral accounts and accounts receivable. At any given time, there may be a concentration of receivables balances with one or more of the exchanges upon which we transact our wholesale business or, in the case of retail, one or more of the utilities operating in purchase-of-receivables states in which we do business.
Financial instruments that may expose the Company to fair value risk from time to time include asset categories such as cash equivalents and marketable securities and liabilities such as borrowings under various credit agreements.
Management believes the carrying values of the Company’s financial instruments including its Renewable Unsecured Subordinated Notes reasonably approximated their fair values at March 31, 2016 and December 31, 2015 due to the relatively new age of these particular instruments.
Cash Equivalents
Cash equivalents include highly liquid investments with an original maturity of three months or less at the time of purchase. As of March 31, 2016 and December 31, 2015, the Company had no cash equivalents.
| 20 |
Accounts Receivable
Receivables are reported at the amount management expects to collect from outstanding balances. Differences between amounts due and expected collections are reported in the results of operations for the period in which those differences are determined. Receivables are written off only after collection efforts have failed, and the Company typically does not charge interest on past due accounts. There was no allowance for doubtful accounts as of March 31, 2016 and December 31, 2015.
Income Taxes
The Company is organized as a limited liability company under the laws of Minnesota and has elected to be taxed as a partnership. As such, it is not a taxable entity and no provision for federal or state income taxes has been made on the financial statements. However, holders of preferred units report distributions received on their individual tax returns while members holding common units report their proportionate shares of taxable income or loss (which may vary substantially from the income or loss reported in our consolidated statements of comprehensive income) on theirs. The Company files income tax returns in U.S. federal and state jurisdictions. 2012 through 2015 remaining open for examination by the IRS and state agencies.
The Company recognizes the financial statement benefit of a tax position only after determining that the relevant tax authority would more likely than not sustain the position following an audit. The Company has no unrecognized tax positions.
Stock-Based Compensation
The Company expenses unit-based awards under ASC Topic 718, "Compensation—Stock Compensation", which requires compensation cost for the grant-date fair value of unit-based awards to be recognized over the requisite service period. The Company estimates the grant date fair value of the unit-based awards issued based on a discounted cash flow model as the Company’s units are not publicly traded. The discounted cash flow model requires the input of highly subjective assumptions, including projected growth and cost of capital. See “Note 12 – Ownership” for more information.
New Accounting Pronouncements
In May 2014, the FASB issued a new revenue recognition standard, ASU 2014-09 Revenue from Contracts with Customers (Topic 606), that eliminated all industry-specific provisions and replaced all current U.S. GAAP guidance on the topic. The new standard provides a unified model to determine when and how revenue is recognized based on the core principle that recognition should depict the transfer of promised goods or services to customers in an amount that reflects the consideration to which the seller expects to be entitled. The Company was originally required to adopt the standard on January 1, 2017. In April 2015, the FASB proposed a one-year deferral of the effective date for the standard and the deferral was adopted in August 2015. The Company is now required to adopt the standard on January 1, 2018. The update may be applied using one of two methods, either retrospective application to each prior reporting period presented or retrospective application with the cumulative effect of initially applying the update recognized at the date of initial application. We are currently assessing the impact of the standard on the Company’s consolidated financial statements.
In August 2014, the FASB issued ASU 2014-15 Presentation of Financial Statements – Going Concern (Subtopic 205-40) regarding disclosures of uncertainties about an entity’s ability to continue as a going concern. Under GAAP, continuation of a reporting entity as a going concern is presumed as the basis for preparing financial statements unless and until the entity’s liquidation becomes imminent. Currently, there is no guidance in GAAP about management’s responsibility to evaluate whether there is substantial doubt about an entity’s ability to continue as a going concern or to provide related footnote disclosures and the update provides such. The update applies to all entities, are effective for the annual period ending after December 15, 2016 and for annual periods and interim periods thereafter. Early application is permitted. The Company is currently evaluating the impact of ASU 2014-15 on the Company’s disclosures.
| 21 |
In February 2015, the FASB issued ASU 2015-02 Amendments to the Consolidation Analysis (“ASU 2015-02”), amending ASC 810 to improve the guidance by simplifying the requirements for consolidation and placing more emphasis on risk of loss when determining a controlling financial interest. ASU 2015-02 is effective for the annual period ending after December 15, 2015 and subsequent interim and annual periods with early adoption permitted. The adoption of ASU 2015-02 is not expected to have a material impact on the Company’s consolidated financial statements.
In April 2015, the FASB issued ASU 2015-03 Interest – Imputation of Interest (Topic 835) simplifying the presentation of debt issuance costs. The new guidance requires that debt issuance costs related to a recognized debt liability be presented in the balance sheet as a direct deduction from the carrying amount of that debt liability. The recognition and measurement guidance for debt issuance costs are not affected by the new guidance. This guidance is effective for annual and interim periods beginning after December 15, 2015, and early adoption is permitted for financial statements that have not been previously issued. The Company retrospectively adopted ASU 2015-03 in the first quarter of 2016. As a result, the Company reclassified the financing costs to long term debt of $298,000 and $314,000 at March 31, 2016 and December 31, 2015, respectively.
In February 2016, the FASB issued ASU No. 2016-02 Leases (“ASU 2016-02”) which increases transparency and comparability among organizations by recognizing all lease transactions with terms in excess of 12 months on the balance sheet as a lease liability and a right-of-use asset, as defined. ASU 2016-02 is effective for fiscal years beginning after December 15, 2018, including interim periods within those fiscal years, with early application permitted. Upon adoption, the lessee will apply the new standard retrospectively to all periods presented or retrospectively using a cumulative effect adjustment in the year of adoption. The Company is currently evaluating the impact of its pending adoption of ASU 2016-02 on its consolidated financial statements.
3. Variable Interest Entities
Effective November 1, 2015, the last major step in the Restructuring occurred - the Distribution of 100% of the equity interests of Enterprises to the Company’s common equity owners, thus completing the legal separation of the Legacy Businesses from Aspirity.
However, although the Company no longer held a voting ownership interest in Enterprises, GAAP required an assessment of the entities and their ongoing business relationship. Pursuant to such assessment, it was concluded that Enterprises is a VIE due to lack of sufficient equity investment to finance its activities without additional subordinated financial support and that Aspirity held a variable interest in the form of the Term Loan. Further, due to certain related party considerations as a result of the delay in approval of the change in control and the nature and size of the Term Loan, the Company held a controlling financial interest in Enterprises, and consequently, should consolidate it as of December 31, 2015.
GAAP also requires the Company to reexamine its VIE relationships and consolidation decisions based on changes in facts and circumstances and upon the occurrence of certain reconsideration events.
On March 18, 2016 FERC approved the change in control of the Company per Docket No.EC16-60-000 this allowed the Company to adopt an amended and re-stated Operating Agreement which converted the Class B to Class A units on March 30, 2016. This constituted a reconsideration event and as such, a reassessment of the VIE relationship between the Company and Enterprises and the consolidation decision was performed as of this date.
| 22 |
While Enterprises is still a VIE due to lack of sufficient equity investment to finance its activities without additional subordinated financial support and Aspirity continues to hold a variable interest in the form of the Term Loan, for Aspirity to consolidate, it must be either the primary beneficiary of, or hold a controlling financial interest in, Enterprises, either by contract or via related party considerations. After March 30, 2016, Aspirity meets neither of these requirements.
Specifically, Timothy Krieger as an individual is the primary beneficiary of Enterprises as he meets both the power and losses/benefits criteria. With respect to the power criterion, Mr. Krieger owns 99.50% and controls 100.00% of the outstanding common equity interests of Enterprises and directs all of Enterprises’ day-to-day activity as its CEO. As far as the losses/benefits criterion is concerned, the Term Loan under normal circumstances, though a variable interest, does not incorporate any rights to any economic benefits beyond interest earned as all such are held by Mr. Krieger. The loan has been in effect since July 1, 2015, Enterprises has never missed a payment, and management is of the opinion that Enterprises likely has sufficient liquidity and operating success to service the debt going forward. Finally, due to the conversion of the Class B units to Class A common, examination of the related party considerations between the Company, Enterprises, and Mr. Krieger indicate that Aspirity does not have a controlling financial interest in Enterprises nor does Mr. Krieger have voting control of Aspirity. Further, the Company has not provided Enterprises with any financial support that it was not contractually obligated to per the terms and conditions of the Term Loan.
See “Note 9 – Term Loan” for a discussion of the nature of the Term Loan.
As a result of the above facts and circumstances, it was concluded that Aspirity should consolidate Enterprises as a VIE through March 30, 2016 but not as of March 31, 2016. Therefore, the statements of operations and cash flows for the first quarter of 2016 include the activity of Enterprises but the balance sheet presented as of March 31, 2016 is for Aspirity only. As this was a distribution of the equity interest to the owners of the entity, the deconsolidation was recorded at book value and as such there was no gain or loss recognized on the transaction.
| 4. | Discontinued Operations |
For the first quarter ended March 31, 2016, the Company accounted for all of the Legacy Businesses operated by Enterprises with the exception of the retail energy services segment (REH) as discontinued operations pursuant to ASU No. 2014-08, which changed the reporting of discontinued operations in Presentation of Financial Statements (Topic 205), Subtopic 205-20. ASU 2014-08 changed the GAAP definition of a discontinued operation to include “only those disposals of components of an entity that represent a strategic shift that has (or will have) a major effect on an entity’s operations and financial results…”.
| 23 |
The major line items constituting discontinued operations for the Company are presented below for the dates indicated. The two segments that are included in discontinued operations are diversified investments and wholesale trading. For footnote disclosures related to amounts shown below, see the Company’s Annual Report on Form 10-K for 2015.
| Three Months Ended | ||||||||
| March 30, | March 31, | |||||||
| 2016 | 2015 | |||||||
| Revenues, expenses, and earnings of discontinued operations | ||||||||
| Revenues, net | $ | 2,778,016 | $ | 10,765,796 | ||||
| Costs of sales and services | 657,556 | - | ||||||
| Other general and administrative | 2,431,268 | 6,280,875 | ||||||
| Other income (expense), net | 1,023,172 | 81,081 | ||||||
| Total expenses | 2,065,652 | 6,199,794 | ||||||
| Income before taxes | 712,364 | 4,566,002 | ||||||
| Income tax provision | - | - | ||||||
| Net income (loss) | $ | 712,364 | $ | 4,566,002 | ||||
| As of | ||||
| December 31,2015 | ||||
| Assets | ||||
| Assets and liabilities of discontinued operations | ||||
| Unrestricted cash | $ | 960,234 | ||
| Accounts receivable, net | 2,329,868 | |||
| Cash in trading accounts | 6,247,059 | |||
| Prepaid expenses & other current assets | 1,547,103 | |||
| Total current assets | 11,084,264 | |||
| Property, equipment & furniture, net | 1,130,686 | |||
| Goodwill & intangible assets, net | 2,000,786 | |||
| Restricted cash | 1,319,371 | |||
| Real estate held for development | 2,714,297 | |||
| Notes receivable, net of deferred gain | 2,586,616 | |||
| Other assets | 573,576 | |||
| Total non-current assets | 10,325,332 | |||
| Total assets | $ | 21,409,596 | ||
| Revolver | $ | 475,700 | ||
| Senior notes | 1,214,762 | |||
| Accounts payable | 1,905,628 | |||
| Accrued expenses | 739,526 | |||
| Billings in excess of costs & earnings | 710,827 | |||
| Total current liabilities | 5,046,443 | |||
| Senior notes | 242,232 | |||
| Total non-current liabilities | 242,232 | |||
| Total liabilities | $ | 5,288,675 | ||
| 24 |
5. Summary Consolidating Financial Data
The consolidating statement of comprehensive income presented below and continued on the next page includes the results of operations for Aspirity for the 91 days ended March 31, 2016 and for the retail energy services segment of Enterprises for the 90 days ended March 30, 2016.
| For the three months ended March 31, 2016 | ||||||||||||||||
Aspirity And | Krieger Enterprises and Subsidiaries | Eliminations | Aspirity Holdings Consolidated | |||||||||||||
| Revenue | ||||||||||||||||
| Wholesale trading, net | - | (52,211 | ) | - | (52,211 | ) | ||||||||||
| Retail energy services | 14,440 | 9,635,645 | - | 9,650,085 | ||||||||||||
| Financial services | 722,472 | - | (714,533 | ) | 7,939 | |||||||||||
| Total sales and services revenue | 736,912 | 9,635,645 | (714,533 | ) | 9,658,024 | |||||||||||
| Total revenue | 736,912 | 9,583,434 | (714,533 | ) | 9,605,813 | |||||||||||
| Costs of sales and services | ||||||||||||||||
| Cost of retail energy sold | 12,059 | 8,243,461 | - | 8,255,520 | ||||||||||||
| Total costs of sales and services | 12,059 | 8,243,461 | - | 8,255,520 | ||||||||||||
| Gross profit on sales and services | 724,853 | 1,392,184 | (714,533 | ) | 1,402,504 | |||||||||||
| Operating expenses | ||||||||||||||||
| Sales, marketing, and customer service | 705,592 | 341,209 | - | 1,046,801 | ||||||||||||
| Other general and administrative | 1,675,498 | 1,157,808 | - | 2,833,306 | ||||||||||||
| Total operating expenses | 2,381,090 | 1,499,017 | - | 3,880,107 | ||||||||||||
| Operating loss | (1,656,237 | ) | (159,044 | ) | (714,533 | ) | (2,529,814 | ) | ||||||||
| Other income (expense) | ||||||||||||||||
| Interest expense | (963,296 | ) | (676,868 | ) | 609,497 | (1,030,667 | ) | |||||||||
| Other income, net | 143 | 118,946 | - | 119,089 | ||||||||||||
| Other income (expense), net | (963,153 | ) | (557,922 | ) | 609,497 | (911,578 | ) | |||||||||
| Loss from continuing operations before income taxes | (2,619,390 | ) | (716,966 | ) | (105,036 | ) | (3,441,392 | ) | ||||||||
| Income tax benefit | - | - | - | - | ||||||||||||
| Net loss from continuing operations | (2,619,390 | ) | (716,966 | ) | (105,036 | ) | (3,441,392 | ) | ||||||||
| Discontinued operations (Note 5) | ||||||||||||||||
| Income from discontinued operations | - | 607,328 | 105,036 | 712,364 | ||||||||||||
| Income tax benefit | - | - | - | - | ||||||||||||
| Net income from discontinued operations | - | 607,328 | 105,036 | 712,364 | ||||||||||||
| Net loss | (2,619,390 | ) | (109,638 | ) | - | (2,729,028 | ) | |||||||||
| Net loss from non-controlling interest | - | (109,638 | ) | - | (109,638 | ) | ||||||||||
| Net loss attributable to Company | (2,619,390 | ) | - | - | (2,619,390 | ) | ||||||||||
| Preferred distributions | 137,268 | - | - | 137,268 | ||||||||||||
| Net loss attributable to common | $ | (2,756,658 | ) | $ | - | $ | - | $ | (2,756,658 | ) | ||||||
| Other comprehensive income (loss): | ||||||||||||||||
| Net loss from non-controlling interest | $ | - | $ | (109,638 | ) | $ | - | $ | (109,638 | ) | ||||||
| Foreign currency translation adjustment | - | 90,840 | - | 90,840 | ||||||||||||
| Attributable to non-controlling interest | - | (18,798 | ) | - | (18,798 | ) | ||||||||||
| Net loss attributable to Company | (2,619,390 | ) | - | - | (2,619,390 | ) | ||||||||||
| Attributable to the Company | (2,619,390 | ) | - | - | (2,619,390 | ) | ||||||||||
| Preferred distributions | 137,268 | - | - | 137,268 | ||||||||||||
| Attributable to common | $ | (2,759,658 | ) | $ | - | $ | - | $ | (2,756,658 | ) | ||||||
| 25 |
6. Restricted Cash
The Company deposits its unrestricted cash in financial institutions. Balances, at times, may exceed federally insured limits. Cash held in trading accounts may be unavailable at times for immediate withdrawal depending upon trading activity. Cash needed to meet credit requirements for outstanding trades, that available for immediate withdrawal, and deposited in collateral accounts as of the dates indicated was as follows:
| March 31, 2016 | December 31, 2015 | |||||||
| Discontinued operations | ||||||||
| Credit requirements | $ | - | $ | 2,054,584 | ||||
| Available for withdrawal | - | 5,992,747 | ||||||
| Cash in trading accounts | $ | - | $ | 8,047,331 | ||||
| Continuing operations | ||||||||
| Cash collateral | $ | 63,549 | $ | 246,000 | ||||
7. Accounts Receivable
Accounts receivable consists of receivables from both of our retail segments resulting from sales to end-use customers.
| March 31, 2016 | December 31, 2015 | |||||||
| Retail energy services – billed | 3,725 | 2,278,316 | ||||||
| Retail energy services – unbilled | 10,699 | 1,280,000 | ||||||
| Other (Related party - Note 13) | 129,481 | - | ||||||
| Accounts receivable – trade | $ | 143,905 | $ | 3,558,316 | ||||
As of March 31, 2016 there are no accounts that represent a significant account of the receivable balance.
As of December 31, 2015, REH had one account with a balance greater than 10% of the total. Such amount was owed by a utility with an investment-grade credit rating.
| 8. | Property, Equipment, and Furniture |
Property, equipment, software, furniture, and leasehold improvements consisted of the following at the dates indicated:
| March 31, 2016 | December 31, 2015 | |||||||
| Equipment and software | $ | 20,129 | $ | 207,725 | ||||
| Furniture | 45,076 | 83,156 | ||||||
| Leasehold improvements | 32,968 | 42,115 | ||||||
| Property, equipment and furniture, gross | 98,173 | 332,996 | ||||||
| Less accumulated depreciation | (10,180 | ) | (115,371 | ) | ||||
| Property, equipment, and furniture, net | $ | 87,993 | $ | 217,625 | ||||
Depreciation expense was $23,000 and $90,000 for the three months ended March 31, 2016 and 2015, respectively.
| 26 |
9. Term Loan
Effective July 1, 2015, Aspirity Financial lent Enterprises an aggregate principal amount of $22,206,000 with a weighted average interest rate of 14.08% and a maturity date of December 30, 2019.
The loan agreement contains customary protective provisions for the lender, including certain guarantees, collateral, and covenants, and ensures that the cash flows generated by the Legacy Businesses continue to be used to pay the interest and principal on the Term Loan Notes.
On November 1, 2015, the loan agreement was amended with respect to the definition of “actual redemptions” and certain of the borrower’s financial reporting provisions. On January 27, 2016, it was amended to eliminate reimbursement of certain costs incurred by Aspirity as a publicly reporting entity.
The following table summarizes the amounts owed to the Company by Enterprises pursuant to the Term Loan as of the dates indicated.
| March 31, 2016 | December 31, 2015 | |||||||
| Current | $ | 7,704,085 | $ | 8,461,853 | ||||
| Non-current | 10,963,523 | 11,786,333 | ||||||
| Total | $ | 18,667,608 | $ | 20,248,186 | ||||
Note that so long as Enterprises and Aspirity were consolidated, the Term Loan was eliminated. Consequently, while it is presented on the March 31, 2016 balance sheet, it does not appear on the December 31, 2015 statement.
As of March 31, 2016, Enterprises was in compliance with all of the terms and conditions of the Term Loan.
| 27 |
10. Debt
Notes payable by the Company are summarized as follows:
| March 31, 2016 | December 31, 2015 | |||||||
| Aspirity | ||||||||
| Renewable unsecured subordinated notes | $ | 25,135,048 | $ | 24,484,498 | ||||
| Enterprises | ||||||||
| Revolving note payable to Maple Bank | - | 1,212,705 | ||||||
| Consolidated total, gross | 25,135,048 | 25,697,203 | ||||||
| Deferred Financing Costs | ||||||||
| 2012 registration statement | 393,990 | 393,990 | ||||||
| 2015 registration statement | 300,792 | 300,792 | ||||||
| REH revolver | - | 35,000 | ||||||
| Deferred financing costs, gross | 694,782 | 729,782 | ||||||
| Less accumulated amortization | (397,280 | ) | (415,757 | ) | ||||
| Deferred financing costs, net | 297,502 | 314,025 | ||||||
| Consolidated total, net | $ | 24,837,546 | $ | 25,383,178 | ||||
| 28 |
Renewable Unsecured Subordinated Notes
On May 10, 2012, our first Form S-1 registration statement relating to the offer and sale of our Notes was declared effective by the SEC, and the offering commenced on May 15, 2012. This Old S-1 covered up to $50,000,000 in principal amount of 3 and 6 month and 1, 2, 3, 4, 5, and 10 year notes.
On May 8, 2015, we filed a new registration statement with respect to the Notes to continue our Notes Offering under the Old S-1 until the date that the New S-1 was declared effective. The new registration replaces the original statement and covers up to $75,000,000 in principal amount of 3 and 6 month and 1, 2, 3, 4, 5, and 10 year notes. The New S-1 was declared effective by the SEC on November 12, 2015.
The Company made interest payments during the three months ended March 31, 2016 and 2015 of $564,000 and $597,000, respectively.
Total accrued interest on the Notes at March 31, 2016 and December 31, 2015 was $1,871,000 and $1,483,000, respectively.
As of March 31, 2016, the Company had $25,135,049 of Subordinated Notes outstanding as follows:
| Initial Term | Principal Amount | Weighted Average Interest Rate | ||||||
| 3 months | $ | 366,804 | 7.81 | % | ||||
| 6 months | 389,316 | 9.15 | % | |||||
| 1 year | 6,626,214 | 13.72 | % | |||||
| 2 years | 3,853,094 | 13.80 | % | |||||
| 3 years | 4,353,830 | 15.02 | % | |||||
| 4 years | 3,836,281 | 16.14 | % | |||||
| 5 years | 3,680,905 | 15.95 | % | |||||
| 10 years | 2,028,605 | 15.22 | % | |||||
| Total | $ | 25,135,049 | 14.62 | % | ||||
| Weighted average term | 39.0 mos | |||||||
11. Leases
The Company leases office space under an agreement that expires in 2017, with an option to extend the lease until 2019. For the 3 months ended March 31, 2016 and the year ended December 31, 2015 lease expense was $52,000 and $26,000, respectively.
12. Ownership
Effective November 1, 2015, concurrently with the Distribution, a new Operating Agreement was adopted pursuant to which the Company issued 6,064 new Class B common units to six individuals, constituting 55.00% of the total common units outstanding. Four of these six individuals are members of management, The Class B units represented profits interests only and incorporated no governance or voting rights, but were automatically convertible into Class A units, each of which has full financial and voting rights, effective upon FERC approval of the change of control of the Company.
On March 30, 2016, the Class B converted to Class A units pursuant to the adoption of an amended and re-stated Operating Agreement, following the March 18, 2016 approval by FERC of the change in control of the Company per Docket No. EC16-60-000.
| 29 |
The ownership of the Company’s equity as of March 31, 2016 and December 31, 2015 is as presented below:
| March 31, 2016 | December 31, 2015 | |||||||
| Non-Voting Units | ||||||||
| Series A Preferred | 496 | 496 | ||||||
| Class B Common | - | 6,064 | ||||||
| Total | 496 | 6,560 | ||||||
| Voting Units | ||||||||
| Class A Common (1) | 11,024 | 4,960 | ||||||
| Total | 11,024 | 4,960 | ||||||
1 - Units held by certain employees are subject to forfeiture should they leave the employment of the Company and upon payment by the Company of $1.00 per unit as follows: after Apr 1, 2016 but before Mar 31, 2017, 734 units and after Apr 1, 2017 but before Mar 31, 2018, 366 units.
For the three months ended March 31, 2016 and the year ended December 31, 2015, total preferred distributions paid were $137,000 and $549,000, respectively.
For the three months ended March 31, 2016 and the year ended December 31, 2015, total common distributions paid were $0 and $5,950,000, respectively.
Issuance of Class B Units
On March 18, 2016 4,410 Class B Units were granted to officers of the Company. This grant was related to the Operating Agreement put in effect on November 1, 2015, but had a clause that the Units would be issued upon FERC approval of the change of control of the Company which happened on March 18, 2016. Under the terms of the agreement, approximately 83% of the Units vested immediately, while the remaining 17% will vest over the next two years.
Unit based compensation expense for the first three months of 2016 and 2015 was $436,000 and $0, respectively. Unit based compensation is recognized on a straight-line basis over the terms of the respective awards and is included in general and administrative expense. The Company has assumed a zero percent forfeiture rate for restricted stock due to the small number of officers that have received restricted stock awards.
As of March 31, 2016 and 2015, unrecognized compensation cost related to nonvested, unit-based compensation was $87,000 and $0, respectively. As of March 31, 2016, the weighted average years outstanding for unvested awards under the Updated and Amended Operating Agreement was 2.0 years.
There were no Class B Units outstanding as of December 31, 2015, 4,410 units were granted during the first quarter of 2016 with a fair value of $119. Of the Units granted, 734 have not yet vested as of March 31, 2016.
13. Related Party Transactions
The Company and Enterprises are related parties due to ownership by Mr. Krieger. Mr. Krieger owns 100% of the Company’s Series A Preferred Units, owns 44.80% of its Class A Common Units, and controls 45.00% of its Class A Common Units. Mr. Krieger controls 100.00% of the Common Units of Enterprises.
As of March 31, 2016 there was an outstanding Term Loan between the Company and Enterprises totaling $18,667,608. See also “Note 9 - Term Loan”.
As of March 31, 2016 Enterprises owed the Company $129,481 that represents expenses paid on Enterprises’ behalf after the Distribution occurred.
| 30 |
14. Commitments and Contingencies
Guarantees
On March 30, 2016 Aspirity Energy entered into a full requirements preferred supply agreement with Exelon to provide all the power and ancillary services needed to serve retail customers for an initial term expiring on March 30, 2019. Concurrently, the Company entered into a guaranty to provide assurance to Exelon regarding the performance of Aspirity Energy’s obligations with respect to payment for electricity purchased pursuant to the agreement. Due to the correction of the classification of non-controlling interest in previously issued financial statements, we are not currently in compliance with a covenant contained in the agreement and management is currently working with Exelon to adjust such.
Legal fees, if any, related to commitments and contingencies are expensed as incurred.
15. Segment Information
As of March 31, 2016, as a result of the Restructuring and the distribution of Enterprises, the Company currently has limited operations and assets, but has established two segments used to measure business activity – retail energy services and financial services.
While the certain segments have not changed, for the first quarter ended March 31, 2016, the Company accounted for all of the Legacy Businesses operated by Enterprises with the exception of the retail energy services segment as discontinued operations.
Certain amounts reported in prior periods have been reclassified to conform to the current period’s presentation as a result of the Restructuring.
See “Note 3 – Variable Interest Entities”, “Note 4 - Discontinued Operations”, and Note 5 – Summary Consolidated Financial Information”.
| 31 |
Information on segments for and at the three months ended March 31, 2016 is as follows:
Aspirity Holdings LLC & Subsidiaries
Q1 2016 Segment Highlights
| Aspirity | Enterprises | Corporate, | ||||||||||||||||||
| Financial Services | Retail Energy | Retail Energy | Net of Eliminations | Consolidated Total | ||||||||||||||||
| Three Months Ended March 31, 2016 | ||||||||||||||||||||
| Wholesale trading | $ | - | $ | - | (52,211 | ) | $ | - | $ | (52,211 | ) | |||||||||
| Retail energy services | - | 14,440 | 9,635,645 | - | 9,650,085 | |||||||||||||||
| Financial services | 722,472 | - | - | (714,533 | ) | 7,939 | ||||||||||||||
| Revenues, net | 722,472 | 14,440 | 9,583,434 | (714,533 | ) | 9,605,813 | ||||||||||||||
| Cost of retail energy sold | - | 12,059 | 8,243,461 | - | 8,255,520 | |||||||||||||||
| Sales, marketing, and customer service | - | 634,517 | 341,209 | 71,075 | 1,046,801 | |||||||||||||||
| Other general and administrative | - | 30,907 | 1,157,808 | 1,644,591 | 2,833,306 | |||||||||||||||
| Operating costs and expenses | - | 677,483 | 9,742,478 | 1,715,666 | 12,135,627 | |||||||||||||||
| Operating income (loss) | $ | 722,472 | $ | (663,043 | ) | $ | (159,044 | ) | $ | (2,430,199 | ) | $ | (2,529,814 | ) | ||||||
| Capital expenditures | $ | - | $ | 4,628 | $ | 11,568 | $ | - | $ | 16,196 | ||||||||||
| At March 31, 2016 | ||||||||||||||||||||
| Identifiable Assets | ||||||||||||||||||||
| Unrestricted cash | $ | - | $ | 1,786 | - | $ | 1,225,868 | $ | 1,227,654 | |||||||||||
| Cash in collateral accounts | - | 63,549 | - | - | 63,549 | |||||||||||||||
| Accounts receivable | - | 14,424 | - | 129,481 | 143,905 | |||||||||||||||
| Term Loan - current | 7,704,085 | - | - | - | 7,704,085 | |||||||||||||||
| Prepaid expenses and other assets | - | 132,032 | - | 32,552 | 164,584 | |||||||||||||||
| Total current assets | 7,704,085 | 211,791 | - | 1,387,901 | 9,303,777 | |||||||||||||||
| Property, equipment and furniture, net | - | - | - | 87,993 | 87,993 | |||||||||||||||
| Term Loan - non-current | 10,963,523 | - | - | - | 10,963,523 | |||||||||||||||
| Accrued financial services revenue | 140,546 | - | - | - | 140,546 | |||||||||||||||
| Total assets | $ | 18,808,154 | $ | 211,791 | $ | - | $ | 1,475,894 | $ | 20,495,839 | ||||||||||
| Identifiable Liabilities and Equity | ||||||||||||||||||||
| Accounts payable | $ | 269,312 | $ | 269,927 | $ | - | $ | 202,572 | $ | 741,811 | ||||||||||
| Accrued expenses | - | 12,035 | - | - | 12,035 | |||||||||||||||
| Accrued compensation | - | - | - | 109,353 | 109,353 | |||||||||||||||
| Accrued interest and distributions | 1,702,468 | - | - | 168,184 | 1,870,652 | |||||||||||||||
| Renewable unsecured subordinated notes | - | - | - | 10,652,698 | 10,652,698 | |||||||||||||||
| Total current liabilities | 1,971,780 | 281,962 | - | 11,132,807 | 13,386,549 | |||||||||||||||
| Renewable unsecured subordinated notes | - | - | - | 14,184,849 | 14,184,849 | |||||||||||||||
| Total long term liabilities | - | - | - | 14,184,849 | 14,184,849 | |||||||||||||||
| Total liabilities | 1,971,780 | 281,962 | - | 25,317,656 | 27,571,398 | |||||||||||||||
| Intercompany investment | 16,836,374 | 610,364 | - | (17,446,738 | ) | - | ||||||||||||||
| Series A preferred equity | - | - | - | 2,745,000 | 2,745,000 | |||||||||||||||
| Common equity | - | (680,535 | ) | - | (9,140,024 | ) | (9,820,559 | ) | ||||||||||||
| Total members’ equity (deficit) | 16,836,374 | (70,171 | ) | - | (23,841,762 | ) | (7,075,559 | ) | ||||||||||||
| Non-controlling interest (NCI) | - | - | - | - | - | |||||||||||||||
| Total equity (deficit) | 16,836,374 | (70,171 | ) | - | (23,841,762 | ) | (7,075,559 | ) | ||||||||||||
| Total liabilities and equity | $ | 18,808,154 | $ | 211,791 | $ | - | $ | 1,475,894 | $ | 20,495,839 | ||||||||||
| 32 |
Information on segments for and at the three months ended March 31, 2015 is as follows:
| Aspirity | Enterprises | Corporate, | ||||||||||||||||||
| Financial Services | Retail Energy | Retail Energy | Net of Eliminations | Consolidated Total | ||||||||||||||||
| Three Months Ended March 31, 2015 | ||||||||||||||||||||
| Wholesale trading | $ | - | $ | - | $ | 83,900 | $ | - | $ | 83,900 | ||||||||||
| Retail energy services | - | - | 5,377,109 | - | 5,377,109 | |||||||||||||||
| Financial services | 660,149 | - | - | (660,149 | ) | - | ||||||||||||||
| Revenues, net | 660,149 | - | 5,461,009 | (660,149 | ) | 5,461,009 | ||||||||||||||
| Cost of retail energy sold | - | - | 6,223,221 | - | 6,223,221 | |||||||||||||||
| Sales, marketing, and customer service | - | - | 245,899 | - | 245,899 | |||||||||||||||
| Other general and administrative | - | - | 1,144,901 | 920,213 | 2,065,114 | |||||||||||||||
| Operating costs and expenses | - | - | 7,614,021 | 920,213 | 8,534,234 | |||||||||||||||
| Operating income (loss) | $ | 660,149 | $ | - | $ | (2,153,012 | ) | $ | (1,580,362 | ) | $ | (3,073,225 | ) | |||||||
| Capital expenditures | $ | - | $ | - | $ | 8,870 | $ | - | $ | 8,870 | ||||||||||
| At December 31, 2015 | ||||||||||||||||||||
| Identifiable Assets | ||||||||||||||||||||
| Unrestricted cash | $ | - | $ | 100,965 | $ | 652,670 | $ | 617,532 | $ | 1,371,167 | ||||||||||
| Accounts receivable | 258,569 | - | 3,558,316 | (258,569 | ) | 3,558,316 | ||||||||||||||
| Term Loan - current | 8,461,853 | - | - | (8,461,853 | ) | - | ||||||||||||||
| Cash in trading accounts | - | - | 1,800,272 | - | 1,800,272 | |||||||||||||||
| Prepaid expenses and other assets | - | 75,793 | 456,129 | (203,669 | ) | 328,253 | ||||||||||||||
| Assets of discontinued operations - current | - | - | - | 11,084,264 | 11,084,264 | |||||||||||||||
| Total current assets | 8,720,422 | 176,758 | 6,467,387 | 2,777,705 | 18,142,272 | |||||||||||||||
| Property, equipment and furniture, net | - | - | 129,453 | 88,172 | 217,625 | |||||||||||||||
| Term Loan - non-current | 11,786,333 | - | - | (11,786,333 | ) | - | ||||||||||||||
| Other assets | - | - | 13,854 | (13,854 | ) | - | ||||||||||||||
| Assets of discontinued operations - non-current | - | - | - | 10,325,332 | 10,325,332 | |||||||||||||||
| Total assets | $ | 20,506,755 | $ | 176,758 | $ | 6,610,694 | $ | 1,391,022 | $ | 28,685,229 | ||||||||||
| Identifiable Liabilities and Equity | ||||||||||||||||||||
| Accounts payable | $ | 269,312 | $ | 2,925 | $ | 2,457,144 | $ | (258,026 | ) | $ | 2,471,355 | |||||||||
| Accrued expenses | - | - | 2,090,227 | - | 2,090,227 | |||||||||||||||
| Accrued interest and distributions | - | - | 19,741 | 1,483,020 | 1,502,761 | |||||||||||||||
| Revolver | - | - | 1,212,705 | - | 1,212,705 | |||||||||||||||
| Renewable unsecured subordinated notes | - | - | - | 10,120,175 | 10,120,175 | |||||||||||||||
| Liabilities of discontinued operations - current | - | - | - | 5,046,443 | 5,046,443 | |||||||||||||||
| Total current liabilities | 269,312 | 2,925 | 5,779,817 | 16,391,612 | 22,443,666 | |||||||||||||||
| Renewable unsecured subordinated notes | - | - | - | 14,050,298 | 14,050,298 | |||||||||||||||
| Liabilities of discontinued operations - non-current | - | - | - | 242,232 | 242,232 | |||||||||||||||
| Total long term liabilities | - | - | - | 14,292,530 | 14,292,530 | |||||||||||||||
| Total liabilities | 269,312 | 2,925 | 5,779,817 | 30,684,142 | 36,736,196 | |||||||||||||||
| Intercompany investment | 20,237,443 | 191,374 | 9,944,596 | (30,373,413 | ) | - | ||||||||||||||
| Series A preferred equity | - | - | - | 2,745,000 | 2,745,000 | |||||||||||||||
| Common equity | - | (17,541 | ) | (9,050,862 | ) | (1,568,823 | ) | (7,499,580 | ) | |||||||||||
| AOCI | - | - | (62,857 | ) | 62,857 | - | ||||||||||||||
| Total members’ equity (deficit) | 20,237,443 | 173,833 | 830,877 | (25,996,733 | ) | (4,754,580 | ) | |||||||||||||
| Non-controlling interest | - | - | - | (3,955,159 | ) | (3,955,159 | ) | |||||||||||||
| AOCI | - | - | - | 658,772 | 658,772 | |||||||||||||||
| Total equity (deficit) | 20,237,443 | 173,833 | 830,877 | (29,293,120 | ) | (8,050,967 | ) | |||||||||||||
| Total liabilities and equity | $ | 20,506,755 | $ | 176,758 | $ | 6,610,694 | $ | 1,391,022 | $ | 28,685,229 | ||||||||||
| 33 |
16. Subsequent Events
From April 1 to June 5, 2016, the Company sold Notes totaling $1,229,000 with a weighted average term of 60.4 months and bearing a weighted average interest rate of 13.6%.
Effective April 16, 2016, Jeremy E. Schupp resigned from all positions he held with the Company and forfeited his Class A Common Units, which were assigned to Scott C. Lutz. The units held by Mr. Lutz are subject to forfeiture should he leave the employment of the Company and upon payment by the Company of $1.00 per unit as follows: after April 1, 2016 but before March 31, 2017, 734 units and after April 1, 2017 but before March 31, 2018, 366 units.
Effective April 16, 2016, Brandon J. Day assigned his Series A Common Units to CATBAR, LLC, a limited liability company controlled by him.
| 34 |
Item 2 - Management’s Discussion and Analysis of Financial Condition and Results of Operations
The following discussion should be read in conjunction with our consolidated financial statements, notes to those statements, Management’s Discussion and Analysis of Financial Condition and Results of Operations from our 2015 Form 10-K, and the other financial information appearing elsewhere in this report. In addition to historical information, the following discussion and other parts of this Form 10-Q contain forward-looking information that involves risks and uncertainties. Readers are cautioned that forward-looking statements should be read in conjunction with our disclosures in this Form 10-Q under the heading “Forward-Looking Statements” located on page 9, “Item 1A – Risk Factors” of our 2015 Form 10-K, and the “Risk Factors” section beginning on page 10 of our Form S-1.
The risks and uncertainties described in this Form 10-Q, our 2015 Form 10-K, and our Form S-1 are not the only risks facing our Company. Additional risks and uncertainties that we are not presently aware of, or that we currently consider immaterial, may also affect our business operations. Our business, financial condition, or results of operations could suffer if the risks set forth are realized.
The U.S. Electric Power Industry
By virtually any measure, the electric power industry in the U.S. is substantial. According to EIA data, in 2014, the most recent year for which full data is available, the industry sold 3,765 TWh (up 1.1% from 2013) for more than $393.1 billion (up 4.6%) to over 147.3 million residential, commercial, and industrial customers (up 0.7%).
Electric power in commercial quantities, unlike other energy commodities such as coal or natural gas, cannot be stored, i.e., the supply must be produced or generated exactly when used or demanded by customers. Further, the laws of physics dictate that power flows within a network along the lines of least resistance, not necessarily where we may want it to go. These facts, coupled with the essential nature of the service to modern life, have obvious implications for electricity market structures and regulations.
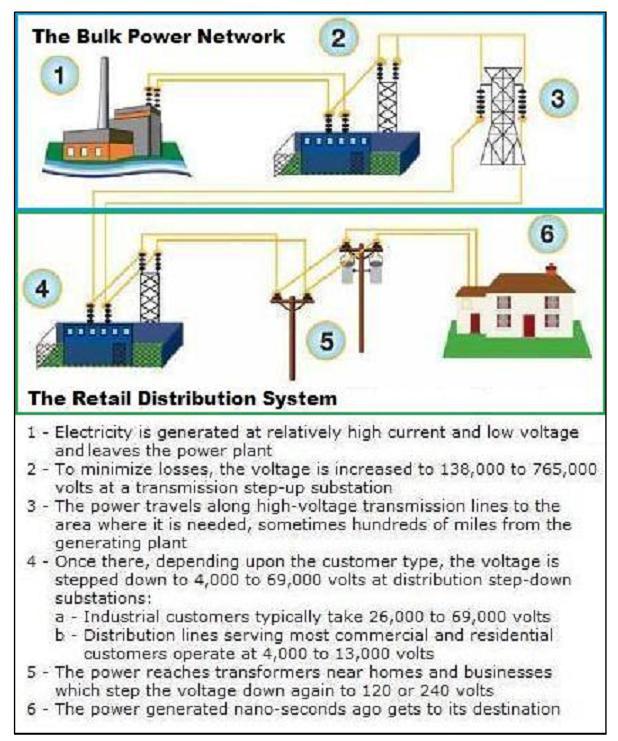
| 35 |
Today, the industry includes any entity producing, distributing, trading, or selling electricity. Physically, the nation’s power system includes generation resources, transmission lines, and retail distribution systems. As of the end of 2014, participants in the generation segment of the industry included investor-owned, publicly-owned, cooperative, and federal utilities, and non-utility power producers, including independent power producers and commercial and industrial entities that operate co-generation facilities, also known as CHP or combined-heat-and-power plants. These entities owned over 19,700 generating units with total nameplate capacity of 1,172 GW incorporated into over 7,600 power plants. In addition to generation, the nation’s bulk power system also includes about 200,000 miles of high-voltage (over 144kV) transmission lines. Our retail distribution network includes substations, wires, poles, metering, billing, and related support systems. Power marketers and retail energy providers do not own any generation, transmission, or distribution assets, but buy and sell in wholesale and retail markets. Finally, participants in wholesale power markets include banks, hedge funds, private equity firms, and trading houses.
The investor-owned portion of the industry, including utilities, retail energy providers, and non-utility generators, and constitutes over 70% of the industry’s revenues, unit sales, and customers as shown by the table above. According to the Edison Electric Institute, a trade group representing the largest investor-owned utilities, in 2014, total energy operating revenues of shareholder-owned electric companies were $377 billion1. As of December 31, 2014, consolidated holding company-level assets of these entities were $1.378 trillion, and of these assets, $833 billion were net property in service. In 2014, shareholder-owned electric utilities spent $19.5 billion on transmission investment, compared to $16.9 billion in 2013, are projected to spend $20.7 billion in 2015, and are planning to invest approximately $85 billion in transmission construction between 2015 and 2018. The total market capitalization of U.S. shareholder-owned electric companies was $632 billion on December 31, 2014.
Since the passage of the Public Utilities Regulatory Policy Act of 1978, the industry has been undergoing a massive restructuring process that has had a particular impact on investor-owned utilities. PURPA stimulated development of renewable energy sources and co-generation facilities and laid the groundwork for deregulation and competition by opening wholesale power markets to non-utility producers of electricity for the first time.
Since PURPA, the nation has moved from a system of vertically integrated monopolies providing retail service at state-determined, cost-based rates to one where the ownership of generation assets is no longer regulated and the majority of the nation’s bulk power systems are operated under the supervision of the Federal Energy Regulatory Commission, an independent agency within the U.S. Department of Energy. Furthermore, while some states have restructured their markets such that individual consumers are allowed to choose their electricity supplier, most state public utility commissions continue to regulate their utilities under the traditional cost-based framework.
Today, wholesale prices are subject to a federal regulatory framework focused on ensuring fair competition and reliability of supply. At the state level, under the traditional system which most states continue to employ, a vertically integrated utility (a “full service provider”) is responsible for serving all consumers in a defined territory and customers are obligated to pay the regulated rate for their class of service.
However, in a state with a restructured or deregulated market, that is, one with retail choice, the generation, transmission, distribution, and retail marketing functions of the business are legally separated and pricing of energy is unbundled from delivery services.
| 1 | Note that this figure also includes revenues from the sale of natural gas. |
| 36 |
Restructured Retail Electricity Markets
Historically, at the state level, electricity was a regulated market, where vertically-integrated utilities owned all or a major part of the bulk power and distribution infrastructure and were responsible for generating electricity or buying it from other producers and distributing it to homes and businesses. Regulated utilities are responsible for serving all consumers in their defined territory and customers are obligated to pay the regulated rate for their class of service. Neither provider nor consumer has a choice about who they do business with.
In the 1990s, many states, particularly those in the Northeast and California where retail prices were historically among the highest in the country, began restructuring their electric power industries in an effort to bring the benefits of competition to retail customers. This new regulatory approach centered on deregulation of generation and retail marketing while continuing the traditional cost-of-service plan for transmission and distribution. The regulated portions of formerly vertically-integrated utilities, now generally known as EDCs or LDCs, are responsible for delivering power, billing consumers, and resolving any service issues, but customers can shop around and buy power from any licensed supplier or broker doing business in the state, hence “retail choice”.
Restructuring created new business opportunities in an established industry. In general, there are two types of non-utility businesses participating in the deregulated retail energy marketing function in the U.S. today – brokers and suppliers – but each state licenses these businesses in a different way. For example, not every jurisdiction makes a broker/supplier distinction and some divide licenses based on potential customer categories such as “residential” or “non-residential” while other states divide their markets based on historical utility service territories and license an entity to only provide services in particular areas. Overall, as of January 2014, there were about 700 of these licensed retail energy businesses in the U.S.
Brokers, also known as aggregators, negotiate supply agreements between retail customers, typically large commercial or industrial entities, and wholesale suppliers. Brokers collect commissions from the supplier that wins a particular piece of business. Brokers do not bill customers directly and never take title to energy; they work for the customer. Their major expense is signing up new customers. As a result, brokers generally have relatively limited margins but high quality cash flows and comparatively small balance sheets.
Suppliers, also known as retail energy providers (each, a “REP”), energy service companies (each, an “ESCO”), competitive energy providers (each, a “CEP”), or the like depending upon the state, are also licensed to deal with retail customers. They have an up-stream supply arrangement which may include purchasing directly from an ISO like PJM or NYISO or bilaterally from large energy companies or independent power producers. In contrast to brokers, suppliers potentially have higher margins on the energy sold but require larger amounts of capital to acquire energy and carry receivables and payables for some period of time.
Today, years after Massachusetts and Rhode Island became the first states to effectively implement choice in 1998, 20 jurisdictions have some form of choice2. We define these forms of retail choice as follows:
| 2 | Generally, only customers of investor-owned utilities are eligible to choose their electric supplier while those served by a municipal, cooperative, or other type of non-investor owned utility are ineligible. However, there are certain areas where customers of specific cooperatives and public utilities may have choice but these instances are rare. |
| 37 |
| Type 1 | All residential, commercial, and industrial customers served by investor-owned utilities may choose their energy provider; |
| Type 2 | A limited number of residential customers have choice and the choice of non-residential customers is capped, usually at a specific number of megawatt-hours per year; |
| Type 3 | No residential customers have choice and the choice of non-residential customers is capped; and |
| Type 4 | No residential customers have choice and the number of non-residential with choice is limited. |
In addition, we define Type 0 jurisdictions as those in which no retail customers of any class have choice.
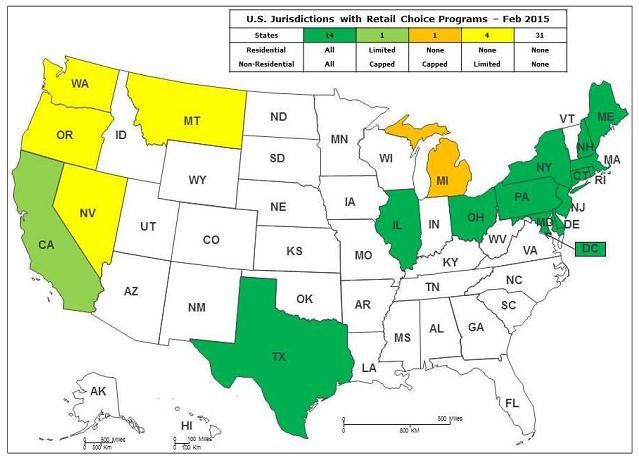
Some states require that utilities billing customers in their service territory on behalf of a retailer purchase the receivables generated as a result of energy sales. These states are known as purchase of receivables or POR jurisdictions. The purchase generally occurs at a modest discount of 0% to 2.5% to reflect bad debt experience by customer class within the service territory.
In POR areas, retailers have virtually no customer credit exposure other than the bad debt charge because the utility pays regardless of whether or not the customer does. However, if a customer fails to pay, the utility will typically disconnect service, which results in the loss of the account for the retailer. In areas without POR programs - non-POR areas - retailers are exposed to the credit risk of the customer. New Jersey is currently the only recourse POR state. Under these rules, retailers have no exposure to customer credit risk provided that the customer is billed under a utility’s consolidated billing program. However, if an electric account is in default for 90 days (about 120 days from the last invoice date), the utility has the option to convert the customer to dual billing.
| 38 |
POR laws have the effect of converting the retailer’s exposure to its customers’ credit to that of the applicable utility, which is generally investment grade under the scales of the Nationally Recognized Statistical Rating Organizations recognized by the SEC such as Standard & Poor’s. A BBB- rating by S&P is considered to be the lowest investment grade by market participants.
The table below summarizes the POR status, number and credit of investor-owned utilities, the number of eligible residential customers and switching behavior, and recent prices:
Type 1 Retail Choice Residential Markets Overview
| Utilities | Customers (000s) | Prices (¢/kWh, 1) | ||||||||||||||||||||||||||||||||||||
| Avg | Switch | 2014 | 2015 | 2015 | ||||||||||||||||||||||||||||||||||
| State | POR Status | IOUs | Credit Rating | Eligible | Un- switched | Rate (2,3) | Energy Only | Delivery Only | Avg Price | Avg Price | vs 2014 | |||||||||||||||||||||||||||
| CT | full | 2 | A- | 1,401 | 916 | 34.6 | % | 11.79 | 8.03 | 19.82 | 20.95 | 5.7 | % | |||||||||||||||||||||||||
| DE | none | 1 | BBB+ | 273 | 245 | 1.3 | % | 10.12 | 2.69 | 12.81 | 13.09 | 2.2 | % | |||||||||||||||||||||||||
| DC | in process | 1 | BBB+ | 243 | 209 | 14.0 | % | 10.06 | 3.35 | 13.41 | 13.61 | 1.5 | % | |||||||||||||||||||||||||
| IL | full | 4 | BBB+ | 4,604 | 1,780 | 61.3 | % | 6.77 | 5.23 | 12.00 | 12.58 | 4.8 | % | |||||||||||||||||||||||||
| ME | none | 2 | BBB+ | 767 | 595 | 22.4 | % | 7.41 | 10.00 | 17.41 | 19.80 | 13.7 | % | |||||||||||||||||||||||||
| MD | full | 4 | BBB | 2,028 | 1,543 | 23.9 | % | 10.15 | 3.52 | 13.67 | 14.04 | 2.7 | % | |||||||||||||||||||||||||
| MA | full | 4 | A- | 3,347 | 2,749 | 17.9 | % | 10.71 | 4.60 | 15.31 | 15.66 | 2.2 | % | |||||||||||||||||||||||||
| NH | none | 3 | BBB+ | 522 | 377 | 27.8 | % | 9.60 | 7.99 | 17.59 | 18.50 | 5.2 | % | |||||||||||||||||||||||||
| NJ | recourse | 4 | BBB+ | 3,377 | 2,913 | 13.7 | % | 13.06 | 2.67 | 15.73 | 15.89 | 1.0 | % | |||||||||||||||||||||||||
| NY | full | 6 | BBB+ | 5,811 | 4,486 | 22.8 | % | 12.02 | 8.04 | 20.06 | 18.54 | -7.6 | % | |||||||||||||||||||||||||
| OH | full | 1 | BBB- | 618 | 316 | 48.9 | % | -- | -- | -- | -- | -- | ||||||||||||||||||||||||||
| OH | in process | 1 | BBB- | 1,274 | 885 | 30.5 | % | -- | -- | -- | -- | -- | ||||||||||||||||||||||||||
| OH | none | 4 | BBB- | 2,303 | 740 | 67.9 | % | -- | -- | -- | -- | -- | ||||||||||||||||||||||||||
| OH | -- | -- | -- | -- | -- | -- | 6.51 | 6.08 | 12.59 | 12.69 | 0.8 | % | ||||||||||||||||||||||||||
| PA | full | 10 | BBB | 4,985 | 3,187 | 36.1 | % | 9.13 | 4.22 | 13.35 | 13.92 | 4.3 | % | |||||||||||||||||||||||||
| RI | none | 1 | BBB+ | 493 | 457 | 7.3 | % | 10.39 | 6.84 | 17.23 | 19.35 | 12.3 | % | |||||||||||||||||||||||||
| TX | none | 6 | BBB+ | 5,986 | 2,144 | 64.2 | % | -- | -- | 11.86 | 11.66 | -1.7 | % | |||||||||||||||||||||||||
| Sum/avg | 54 | BBB+ | 38,542 | 23,542 | 38.1 | % | 9.82 | 5.64 | 15.20 | 15.73 | 3.5 | % | ||||||||||||||||||||||||||
| full | 31 | BBB+ | 22,794 | 14,977 | 34.3 | % | ||||||||||||||||||||||||||||||||
| recourse | 4 | BBB+ | 3,377 | 2,913 | 13.7 | % | ||||||||||||||||||||||||||||||||
| in process | 2 | BBB+ | 1,517 | 1,094 | 27.9 | % | ||||||||||||||||||||||||||||||||
| none | 17 | BBB | 10,344 | 4,558 | 55.9 | % | ||||||||||||||||||||||||||||||||
| Sum/avg | 54 | BBB+ | 38,032 | 23,542 | 38.1 | % | ||||||||||||||||||||||||||||||||
Sources
ABACCUS 2015; EIA Electric Power Annual 2014; Edison Electric Institute website accessed March 4, 2015; Company analysis of company websites.
Notes
| 1 | “Energy Only” providers sell energy to customers and incumbent utilities provide “Delivery Only” services for these customers. In Texas, customers served by REPs must be provided with bundled energy and delivery services. |
| 2 | “Switch rate” refers to the percentage of customers that have migrated away from the incumbent provider’s default service product (the standard offer, basic service, generation service, etc.). |
| 3 | In Texas’ competitive markets (ERCOT), all eligible residential customers take competitive electric service and the switch rate indicates the number not served by the incumbent retail energy provider. Total eligible customers refer to those within ERCOT, or about 60% of the 9,954,000 residential accounts in the state. |
| 39 |
Unbundling of electric bills in restructured markets made many aware for the first time exactly what they were paying for. In general, the bills of retail electricity customers include numerous costs and charges that can be classified into energy costs, delivery charges, and governmental policy costs. These include the costs of federal and state polices with respect to electricity and may include transition charges or costs associated with moving from a regulated market to a restructured one, allowing EDCs to recapture stranded costs that would otherwise be unrecoverable after deregulation, societal benefits charges such as the costs of mandated programs such as universal service, lifeline service, and energy efficiency programs, and sales and use taxes collected by state and local authorities on retail electricity sales.
According to analysis of EIA data for states with restructured markets, on average between 2002 and 2014, energy and delivery costs accounted for about 67% and 33%, respectively, of the average retail electricity price. Of course, these percentages fluctuate from year to year and state to state, primarily due to wholesale energy market conditions, weather, and state rules.
Overall, we believe that choice is proving to be a boon for consumers with respect to providing them with the ability to manage their electricity costs. According to an analysis of data from the EIA, between 2002 and 2014, retail rates for all customer sectors in states with restructured retail markets increased by 47.2% compared with a 39.5% increase in states that rely on regulated utilities. However, unbundled prices in all Type 1 areas since 2011 have been consistently lower that the bundled service offered by the incumbent utilities.
Aspirity is a holding company that conducts its operations principally through wholly-owned subsidiaries. We currently have two direct operating subsidiaries, Aspirity Energy, which houses a start-up retail energy business, and Aspirity Financial, which was formed to provide energy-related financial services to businesses and households.
In 2015, we restructured. The Restructuring included the sale of two wholesale trading businesses and the spin-off of Enterprises incorporating the three legacy business segments of wholesale trading, diversified investments, and the retail business operated by REH. As a result, while we are developing our new retail energy business, we currently have limited operations and assets. Through March 30, 2016, the Company has reported the operations of the retail business as continuing operations and the operations of wholesale trading and diversified investments as discontinued operations.
In any case, it is important to note that Aspirity Energy is pursuing different strategies than those used by REH. For example, with respect to marketing, we compete on factors other than price alone, hence our slogan, Power + More, with the goal of serving the Home CEO and building a brand characterized by long term relationships. Operationally, we have chosen to procure the energy required by our customers using a full requirements arrangement rather than tie up capital in the ISO-managed markets.
The regulatory compliance processes started in 2015 are ongoing, but we began to offer electricity service in January 2016. By the end of 2016, our goal is to be able to market power to the approximately 38 million residential customers located in 50 service areas in the 14 Type 1 jurisdictions.
Until our retail energy business has gained scale, our primary sources of cash flow will be Note sales and loan repayments received by Aspirity Financial from Enterprises, our first financial services customer.
| 40 |
As of May 9, 2016, we were licensed in 3 full choice jurisdictions and were EDI compliant with 6 utilities serving a total of 8.5 million residential accounts. As of the same date, we had 3,508 confirmed customers. Our market rollout plan is summarized in the table below:
Market Rollout Plan
Last updated May 19, 2016
| ISOs | States | EDI Ready IOU | Accessable | |||||||||||||||||||||||||||||
| Month | Added during month | Available at end of month | Added during month | Available at end of month | Added during month | Available at end of month | Added during month | Available at end of month | ||||||||||||||||||||||||
| Dec 2015 | 1 | 1 | - | - | - | - | - | - | ||||||||||||||||||||||||
| Jan 2016 | 0 | 1 | 1 | 1 | 2 | 2 | 4,080 | 4,080 | ||||||||||||||||||||||||
| Feb 2016 | 0 | 1 | 1 | 2 | 0 | 2 | 0 | 4,080 | ||||||||||||||||||||||||
| Mar 2016 | 0 | 1 | 1 | 3 | 1 | 3 | 455 | 4,535 | ||||||||||||||||||||||||
| Apr 2016 | 1 | 2 | 0 | 3 | 2 | 5 | 2,649 | 7,184 | ||||||||||||||||||||||||
| May 2016 | 0 | 2 | 0 | 3 | 1 | 6 | 1,274 | 8,458 | ||||||||||||||||||||||||
| Jun 2016 | 1 | 3 | 2 | 5 | 7 | 13 | 2,794 | 11,252 | ||||||||||||||||||||||||
| Jul 2016 | 1 | 4 | 1 | 6 | 7 | 20 | 4,343 | 15,595 | ||||||||||||||||||||||||
| Aug 2016 | 1 | 5 | 3 | 9 | 10 | 30 | 2,689 | 18,284 | ||||||||||||||||||||||||
| Sep 2016 | 0 | 5 | 3 | 12 | 9 | 39 | 6,487 | 24,771 | ||||||||||||||||||||||||
| Oct 2016 | 0 | 5 | 1 | 13 | 2 | 41 | 7,011 | 31,782 | ||||||||||||||||||||||||
| Nov 2016 | 0 | 5 | 1 | 14 | 5 | 46 | 5,958 | 37,740 | ||||||||||||||||||||||||
| Dec 2016 | 0 | 5 | 0 | 14 | 0 | 46 | 0 | 37,740 | ||||||||||||||||||||||||
| Totals | 5 | -- | 14 | -- | 46 | -- | 37,740 | -- | ||||||||||||||||||||||||
Our services are made available to customers under fixed price contracts as well as some that may provide for renewable energy percentages in excess of state requirements. All contracts regardless of price, term, and renewable energy percentage are subject to standard terms and conditions as filed from time to time with state regulatory authorities. Retail customers make purchase decisions based on a variety of factors, including price, customer service, brand, product choices, bundles, or value-added features.
The prices we offer customers are determined by us and are not subject to regulation. The terms we offer are also determined by us, and we develop such to align with regulatory requirements within each state where we do business. The electricity we sell is generally metered and delivered to our customers by local utilities. As such, we do not have a maintenance or service staff for customer locations. These utilities also provide billing and collection services for the majority of our customers on our behalf, generally under the utility consolidated billing structure.
Although our marketing efforts just began in the first quarter of 2016, we plan to reach residential prospects utilizing offline and online marketing channels. The offline channel includes vehicles such as outbound telemarketing, door-to-door, direct mail, events, brokers, out-of-home, etc. The online channel includes paid search, display ads, retargeting ads, affiliate, email, state-run comparison-shopping engines, etc. Our goal is to invest an optimal amount in new customer acquisition, and focus on customer retention and the lifetime value inherent in satisfied customer relationships.
| 41 |
The table below summarizes certain of our marketing and brand-building strategies,
| Target Consumer | The Home CEO Each household has someone in charge of managing all of the activities related to their home. While the role may be shared, it is largely a thankless task but still an important job that needs to be handled. Ideally we will reach “un-switched” Home CEO’s. | ||
| Relevant Insights | Fear of making a decision they’ll regret The Home CEO is bombarded with life-related events that have resulted in an overall stress level that makes them so “fear making a bad decision” that they avoid making any decision. We believe this has contributed significantly to many potential customers NOT making an energy choice. | ||
| Key Selling Point | Aspirity simplifies choice This statement to what makes Aspirity better than the competition. We will use this simple, single-minded benefit to motivate customers to choose us over their current provider or other potential options. | ||
| Value Proposition | Aspirity turns the chaos of data into actionable information The ability to turn chaotic data into useful information will take customers from a place of stress to one of calm. As a result, the fear of making a decision they will regret will diminish. | ||
| Point of Differentiation | Aspirity organizes complex issues simply Our 4-step approach turns information into knowledge: | ||
| • | Un-confuse – People cannot begin to learn something new if they are confused. | ||
| • | Organize – Eliminate irrelevant information, then organize the remainder. | ||
| • | Compare – Provide opportunities to test the impact of different factors; our goal is to help customers make their choice. | ||
| • | Choose – Making knowledgeable choices make one feel confident and minimizes fear. | ||
| Reason to Believe | Aspirity is significantly different than the competition Until our brand is known, we will need to do two things to support the decision to choose Aspirity: | ||
| • | The user experience must be simple and intuitive – Our brand promises of Advocacy, Clarity, Information, Anticipation, Customization, and Transparency must be clear. | ||
| • | We will not be confusing or misleading – In contrast to the competition, we will avoid any behaviors that don’t put customers first. | ||
| Brand Character | We serve our customers and always put them first Our customers must always feel that we put them first and are fully empathetic to their needs. We will use humility, enthusiasm, and intelligence to consistently anticipate customer needs. | ||
| Desired Consumer Response | Aspirity helps me make great decisions We will earn our customers respect and they will reward us with their loyalty and sincere testimonials like: | ||
| • | “Prior to Aspirity, decisions about my home were confusing, time-consuming, and very stressful to work through”. | ||
| • | “Aspirity simplifies complex problems into relevant learnings, clear trade-offs, and personalized plans to fit my needs”. | ||
The retail energy business involves the purchase of electricity in wholesale markets and the virtually simultaneous resale of such to retail customers. In general, ISOs require payment for energy purchased on a weekly or twice-weekly basis. In some markets, retailers are also required to buy capacity and certain ancillary services on a monthly basis. In all cases, retailers are required to provide market operators with financial assurance or collateral, typically in the form of cash or a letter of credit in an amount equal to 60 to 75 days’ worth of such purchases. However, retailers typically only receive payment from customers on a monthly basis. Consequently, a substantial amount of liquidity and capital may be required to both satisfy payables and carry receivables. We do not own any generation, transmission, or distribution facilities and utilize wholesale suppliers for our supply requirements and utilities for our transmission and distribution needs.
| 42 |
On March 30, 2016 we entered into a full requirements preferred supply agreement with Exelon to provide us with all the power and ancillary services we need to serve our customers for an initial term expiring on March 30, 2019. As of December 31, 2015, Exelon was the operator of the second largest generation fleet in the U.S. and its long-term S&P credit rating was BBB.
Under the terms of the PSA, on a daily or weekly basis as we request, Exelon will provide firm, fixed quotes for power for terms of 1, 3, 6, 9, 12, 15, 18, 24, 27, 30, and 36 months out for each of the service areas in which we operate. Such quotes will include all costs of energy, capacity, and ancillary services necessary to serve residential and small commercial customers. We may also meet state minimum “green” energy supply criteria by acquiring renewable energy certificates or RECs from Exelon via the PSA. If necessary, we may also buy additional RECs to satisfy the requirements of customers selecting a product with a percentage of green power higher than state minimums. We then mark up these costs to obtain selling prices. In addition, under the PSA, Exelon absorbs all volumetric risk or deviations between forecasted and actual customer usage. Finally, the PSA provides that Exelon will post any collateral required of us by an ISO or EDC.
Exelon will invoice us for all purchases under the agreement every month. The PSA also incorporates the ability for us to defer payment of all or a portion of these invoices based on certain financial criteria as defined in the agreement. We are exposed to the risk that Exelon may fail to deliver. If this were to occur, we would then be forced to pledge collateral and buy the required power from either an ISO or another wholesale supplier and the costs of such may be higher or lower than those embodied in the PSA.
| 43 |
Three Months Ended March 31, 2016 and 2015
The following table sets forth selected financial data for the periods indicated, which has been derived from the consolidated financial statements included in this report:
| For the Three Months Ended March 31, | ||||||||||||||||||||||||
| Dollars in thousands; may not | 2016 | 2015 | Increase (decrease) | |||||||||||||||||||||
| add due to rounding | Dollars | Percent | Dollars | Percent | Dollars | Percent | ||||||||||||||||||
| Revenue | ||||||||||||||||||||||||
| Wholesale trading revenue, net | $ | (52 | ) | -0.5 | % | $ | 84 | 1.5 | % | $ | (136 | ) | -162.2 | % | ||||||||||
| Retail energy services | 9,650 | 100.5 | % | 5,377 | 98.5 | % | 4,273 | 79.5 | % | |||||||||||||||
| Financial services | 8 | 0.1 | % | - | 0.0 | % | 8 | na | ||||||||||||||||
| Total sales & services revenue | 9,658 | 100.5 | % | 5,377 | 98.5 | % | 4,281 | 79.6 | % | |||||||||||||||
| Net revenue | 9,606 | 100.0 | % | 5,461 | 100.0 | % | 4,145 | 75.9 | % | |||||||||||||||
| Costs of sales & services | ||||||||||||||||||||||||
| Cost of retail electricity sold | 8,256 | 85.9 | % | 6,223 | 114.0 | % | 2,032 | 32.7 | % | |||||||||||||||
| Total | 8,256 | 85.9 | % | 6,223 | 114.0 | % | 2,032 | 32.7 | % | |||||||||||||||
| Gross profit (loss) | 1,403 | 14.6 | % | (846 | ) | -15.5 | % | 2,249 | 165.8 | % | ||||||||||||||
| Operating expenses | ||||||||||||||||||||||||
| Sales, marketing, and customer service | 1,047 | 10.9 | % | 246 | 4.5 | % | 801 | 325.7 | % | |||||||||||||||
| Other general & administrative | 2,833 | 29.5 | % | 2,065 | 37.8 | % | 768 | 37.2 | % | |||||||||||||||
| Total operating expenses | 3,880 | 40.4 | % | 2,311 | 42.3 | % | 1,569 | 67.9 | % | |||||||||||||||
| Operating income (loss) | (2,530 | ) | -26.3 | % | (3,073 | ) | -56.3 | % | 543 | -17.7 | % | |||||||||||||
| Other income (expense) | ||||||||||||||||||||||||
| Interest expense | (1,031 | ) | -10.7 | % | (660 | ) | -12.1 | % | (371 | ) | 56.1 | % | ||||||||||||
| Other income | 119 | 1.2 | % | - | 0.0 | % | 119 | na | ||||||||||||||||
| Other income (expense), net | (912 | ) | -9.5 | % | (660 | ) | -12.1 | % | (251 | ) | 38.1 | % | ||||||||||||
| Income (loss) from continuing operations before income taxes | (3,441 | ) | -35.8 | % | (3,733 | ) | -68.4 | % | 292 | -7.8 | % | |||||||||||||
| Income tax provision | - | 0.0 | % | - | 0.0 | % | - | na | ||||||||||||||||
| Net income (loss) from continuing operations | (3,441 | ) | -35.8 | % | (3,733 | ) | -68.4 | % | 292 | -7.8 | % | |||||||||||||
| Net income (loss) from discontinued operations | 712 | 7.4 | % | 4,566 | 83.6 | % | (3,854 | ) | -84.4 | % | ||||||||||||||
| Net income (loss) | (2,729 | ) | -28.4 | % | 833 | 15.2 | % | (3,562 | ) | -427.8 | % | |||||||||||||
| Net income (loss) from non-controlling interest | (110 | ) | -1.1 | % | - | 0.0 | % | (110 | ) | na | ||||||||||||||
| Net income (loss) attributable to Company | (2,619 | ) | -27.3 | % | 833 | 15.2 | % | (3,452 | ) | -414.6 | % | |||||||||||||
| Preferred distributions | 137 | 1.4 | % | 137 | 2.5 | % | - | 0.0 | % | |||||||||||||||
| Net income (loss) attributable to common | $ | (2,757 | ) | -28.7 | % | $ | 695 | 12.7 | % | $ | (3,452 | ) | -496.4 | % | ||||||||||
| 44 |
Retail electricity sales: Revenue from the retail sale of electricity is recorded in the period in which customers consume the commodity, net of any applicable sales tax. Revenue applicable to electricity consumed by customers but not yet billed under the cycle billing method is estimated and accrued along with the related costs. Changes in estimates are reflected in operations in the period in which they are refined.
From time to time, in addition to the designated hedges described below in “costs of retail electricity sold” to which hedge accounting was applied, REH may use certain derivative contracts to which hedge accounting was not applied as economic hedges to reduce our exposure to higher costs. In our segment reporting, the gain on these contracts net of any losses is reported as “wholesale trading revenue, net”.
For the three months ended March 31, 2016 and 2015, we recorded total revenues in our retail segment of $9,598,000 and $5,461,000, respectively, substantially all of which was generated by REH, which will no longer be consolidated in the financial results of the Company after March 30, 2016 due to the deconsolidation of Enterprises. These totals consisted of retail energy sales of $9,650,000 and $5,377,000 in the 2016 and 2015 periods, respectively, a trading loss of $53,000 in the 2016 quarter and a trading gain of $84,000 in the 2015 period. During 2016, retail energy sales revenue increased principally as a result of increases in the number of customers served and MWh sold. The customer base consists largely of residential consumers with a few small commercial accounts. The Company will no longer consolidate retail energy revenues from Enterprises going forward.
The following table details key operating statistics for the periods indicated.
| For/At Three Months Ended March 31, | ||||||||||||||||
| Key Operating Statistics | Increase (decrease) | |||||||||||||||
| (in units unless otherwise indicated) | 2016 | 2015 | Units | Percent | ||||||||||||
| Aspirity Energy | ||||||||||||||||
| Retail electricity sales ($000s) | 14 | na | na | na | ||||||||||||
| Unit sales (MWh) | 187 | na | na | na | ||||||||||||
| Weighted average retail price (¢/kWh) | 7.74 | na | na | na | ||||||||||||
| Customers receiving service, end of period | 584 | na | na | na | ||||||||||||
| REH | ||||||||||||||||
| Retail electricity sales ($000s) | 9,743 | 5,377 | 4,366 | 81.2 | % | |||||||||||
| Wholesale trading revenue, net ($000s) | (53 | ) | 84 | (137 | ) | -163.1 | % | |||||||||
| Total segment revenues ($000s) | 9,690 | 5,461 | 4,229 | 77.4 | % | |||||||||||
| Unit sales (MWh) | 115,092 | 56,469 | 58,623 | 103.8 | % | |||||||||||
| Weighted average retail price (¢/kWh) | 8.47 | 9.52 | (1.06 | ) | -11.1 | % | ||||||||||
| Customers receiving service, end of period | 42,861 | 29,608 | 13,253 | 44.8 | % | |||||||||||
Costs of retail electricity sold: The Company’s costs of electricity sold include the cost of purchased power, EDC service fees, renewable energy certificates, bad debt expense, and gains net of losses and commissions on derivative contracts used to hedge power purchase costs, if any, but does not include the net gain or loss on the economic hedges described above. Wholesale electricity buyers are typically required to maintain cash deposits in separate accounts to meet vendors’ financial assurance requirements to purchase energy, ancillary services, and capacity which amount is included in “cash in trading accounts”.
During the first quarter of 2016, Aspirity purchased electricity for sale to retail customers in PJM and in the 2016 and 2015 periods, REH acquired power in ISO-NE, PJM, and from certain other wholesale suppliers.
| 45 |
Since REH does not use a full requirements preferred supply agreement, its retail business is exposed to volatility in the cost of energy acquired for sale to customers, and as a result, from time to time it may use derivatives to hedge or reduce this variability. REH follows GAAP guidance that permits hedge accounting. To qualify for hedge accounting, the relationship between the hedged item - say power purchases for a given delivery zone - and a derivative used as a hedging instrument - say, a swap contract for future delivery of electricity at a related hub - must meet certain economic and documentation requirements and hedge effectiveness and ineffectiveness must be measured on an on-going basis.
For these derivatives contracts designated as cash flow hedges, the effective portion of any change in the hedging instrument’s fair value is recorded as other comprehensive income and deferred until the change in value of the hedged item is recognized in earnings. REH’s risk management policies also permit the use of undesignated derivatives as economic hedges. For an undesignated economic hedge, all changes in the derivative financial instrument’s fair value are recognized currently in revenues.
REH did not hedge any power costs during the first quarter of 2016, but during the first quarter of 2015, it hedged the cost of 14,795 MWh or 26% of the 56,469 MWh of electricity sold to retail customers. For the 2015 period, these designated hedges had the effect of increasing the cost of retail electricity sold by $476,000.
Sales, marketing, and customer service costs: Retail sales and marketing costs and expenses include off-line and on-line marketing costs related to retail customer acquisition and retention. Major off-line marketing channels may include out-bound telemarketing, direct mail, door-to-door, mass media (radio, television, print, and outdoor), and affiliates. On-line marketing channels may include paid search, affiliates, comparison shopping engines, banner or display advertising, search engine optimization, and e-mail marketing. Customer service costs include all variable costs associated with serving customers such as software, mailing, and data aggregation and reporting.
During the first quarters of 2016 and 2015, we spent $744,000 and $246,000, respectively on sales and marketing, with the increase driven primarily by Aspirity’s entry into new markets. During the first quarter of 2016, we also spent $307,000 on customer service.
General and administrative expenses: Other general and administrative expenses include salaries, wages, incentive compensation, and related costs such as employee benefits and payroll taxes, legal fees and expenses, audit fees, tax compliance reporting service fees, other fees paid for outside consulting services, expenses associated with marketing our Notes such as advertising, printing, and servicing costs as well as items such as trading tools and subscriptions, rent, depreciation and amortization, insurance, travel, and all other indirect support expenses.
For the first quarter of 2016, other general and administrative expenses increased by $768,000 to $2,833,000 compared to $2,065,000 for 2015, primarily due to Aspirity beginning operations and the associated growth in headcount and continued spending Notes marketing.
| 46 |
Other income (expense): In the first quarter of 2016, we recorded net other expense of $912,000 compared to net other expense of $660,000 in 2015.
As the principal component of other expense, interest expense increased by $340,000 to $1,000,000 for the year from $660,000 during 2015, primarily due to an increase in outstanding debt.
Discontinued operations: In the first quarter of 2016, the Company moved two segments, diversified investments and wholesale trading, into discontinued operations. Both of these segments are owned and operated by Enterprises.
Discontinued operations contributed $712,000 of income to the net loss of the Company in the first quarter of 2016, compared to $4,566,000 of income for the same quarter in 2015. This is primarily due to the profitable first quarter for wholesale trading in 2015.
Preferred distributions: During the first quarters of both 2016 and 2015, we distributed $137,000 to our preferred unit holder.
Liquidity, Capital Resources, and Cash Flow
For the quarter ended March 31, 2016, the Company on a consolidated basis reported a net loss of $2,729,000 and had unrestricted cash, negative working capital, and total members’ deficit of $1,227,654, $4,082,772, and $7,075,559, respectively, as of the same date.
Aspirity Energy and Aspirity Financial are start-up companies in the retail energy and financial services industries, respectively, and are not expected to have significant revenue-generating operations until the middle of 2016 at the earliest. Prior to that, the Company will rely on the timely payment of the Term Loan to repay Term Loan Notes as they are redeemed and on its ability to sell Notes in order to fund start-up operations. Enterprises’ ability to make timely payments on the Term Loan depends in part on the operations of its Legacy Businesses which were not profitable in 2015. In the event amounts owed to us are paid late or not paid, our ability to fund operations, sell new Notes, and repay existing Notes will be negatively impacted.
While the Company believes that payments from Enterprises on the Term Loan, anticipated cash generated from operating activities, availability of trade credit with respect to power purchases, and anticipated proceeds from our Notes Offering will be sufficient to meet operating cash requirements and obligations under the Notes and Term Loan Notes through at least December 31, 2016, there can be no assurance that this will prove to be the case. Consequently, the Company regularly evaluates other sources of debt financing and is also considering seeking additional equity capital to meet its funding needs. However, there can be no assurance that these efforts will prove to be successful.
With respect to the REH retail energy business, cash collateral is posted with ISOs and futures commission merchants to provide for the acquisition and hedging of power for resale to customers. Cash is also required to fund growth in accounts receivable. ISOs generally require payment for power every 4 days or so, while the average collection period on receivables is 40 to 45 days. As such, historically, REH’s capital was largely invested in deposits in trading accounts and receivables. Capital expenditure requirements are nominal, being limited largely to computer and office equipment, software, and office furniture. Therefore, in any given reporting period, the amount of cash consumed or generated was primarily due to changes in working capital.
Historically, capital requirements have been funded by cash flow positive operations and additional financing, principally in the form of the Notes. Should sustained significant negative cash flow from operations occur or additional Note sales not materialize, such events might have a detrimental effect on the Company.
The following table is presented as a measure of our liquidity and capital resources as of the dates indicated:
| At | ||||||||||||||||||||||||
| March 31, 2016 | December 31, 2015 | Increase (decrease) | ||||||||||||||||||||||
| Dollars in thousands; may not add due to rounding | Dollars | Percent of total assets | Dollars | Percent of total assets | Dollars | Percent | ||||||||||||||||||
| Liquidity | ||||||||||||||||||||||||
| Unrestricted cash | $ | 1,228 | 6.0 | % | $ | 1,371 | 4.8 | % | $ | (143 | ) | -10.5 | % | |||||||||||
| Cash in trading accounts | - | 0.0 | % | 1,800 | 6.3 | % | (1,800 | ) | -100.0 | % | ||||||||||||||
| Cash collateral | 64 | 0.3 | % | 246 | 0.9 | % | (182 | ) | -74.2 | % | ||||||||||||||
| Accounts receivable | 144 | 0.7 | % | 3,558 | 12.4 | % | (3,414 | ) | -96.0 | % | ||||||||||||||
| Total liquid assets | 1,435 | 7.0 | % | 6,975 | 24.3 | % | (5,540 | ) | -79.4 | % | ||||||||||||||
| Total assets | $ | 20,496 | 100.0 | % | $ | 28,685 | 100.0 | % | (8,189 | ) | -28.5 | % | ||||||||||||
| Capital Resources | ||||||||||||||||||||||||
| Current debt | $ | 10,653 | 52.0 | % | $ | 11,333 | 39.5 | % | $ | (680 | ) | -6.0 | % | |||||||||||
| Long term debt | 14,185 | 69.2 | % | 14,050 | 49.0 | % | 135 | 1.0 | % | |||||||||||||||
| Total debt | 24,838 | 121.2 | % | 25,383 | 88.5 | % | (545 | ) | -2.1 | % | ||||||||||||||
| Preferred equity | 2,745 | 13.4 | % | 2,745 | 9.6 | % | - | 0.0 | % | |||||||||||||||
| Common equity | (9,821 | ) | -47.9 | % | (7,500 | ) | -26.1 | % | (2,321 | ) | 30.9 | % | ||||||||||||
| Total members’ equity | (7,076 | ) | -34.5 | % | (4,755 | ) | -16.6 | % | (2,321 | ) | -48.8 | % | ||||||||||||
| Non-controlling interest | - | 0.0 | % | (3,296 | ) | -11.5 | % | 3,296 | -100.0 | % | ||||||||||||||
| Total equity | (7,076 | ) | -34.5 | % | (8,051 | ) | -28.1 | % | 975 | -12.1 | % | |||||||||||||
| Total capitalization | $ | 17,762 | 86.7 | % | $ | 17,332 | 60.4 | % | $ | 430 | 2.5 | % | ||||||||||||
| 47 |
On July 1, 2015, as part of the Restructuring, Aspirity Financial entered into a Term Loan with Enterprises. Pursuant to the Term Loan, the Company agreed to loan Enterprises an aggregate principal amount of $22,206,000, with a weighted average interest rate of 14.08%, and maturity date of December 30, 2019. Cash flow from the Legacy Businesses supports the Term Loan Notes, that is, those that were outstanding as of June 30, 2015, including any renewals thereof. Accordingly, and subject to monthly true-ups, the repayment schedule of the Term Loan reflects the maximum possible redemptions of, and the weighted average interest rate paid on, Term Loan Notes in a given month. The equity of Enterprises has been pledged to Aspirity Financial to secure repayment of the Term Loan.
We are taxed as a partnership for income tax purposes which means that we do not pay any income taxes. Our income or loss for each year is allocated among holders of our common units who are then personally responsible for the tax liability associated with such income. Our Operating Agreement provides for distributions of cash to members based upon their respective ownership interests in the amount necessary to permit the member who is in the highest income tax bracket to pay all state and federal taxes on our net income allocated to such member.
The decision to make distributions other than tax distributions to holders of our common units and required distributions to holders of preferred units is at the discretion of our Board and depends on various factors, including our results of operations, financial condition, capital requirements, contractual restrictions, outstanding indebtedness, investment opportunities, and other factors considered by the Board to be relevant. The indenture governing our Notes prohibits us from paying distributions to our members if there is an event of default with respect to the Notes or if payment of the distribution would result in an event of default. The indenture also prohibits our Board from declaring or paying any distributions other than tax distributions if, in the reasonable determination of the Board, the Company would have insufficient cash to meet anticipated Note redemption or repayment obligations.
While we believe that payments from Enterprises on the Term Loan, anticipated cash generated from operating activities, and anticipated proceeds from our Notes Offering will be sufficient to meet our operating cash requirements and obligations under the Notes and Term Loan Notes for the next twelve months, there can be no assurance that this will prove to be the case.
Consequently, we regularly evaluate other sources of debt financing in addition to the Notes and we are currently considering seeking additional equity capital in order to provide added flexibility to support our anticipated growth and working capital needs. However, there can be no assurance that these efforts will prove to be successful.
The table below summarizes our primary sources and uses of cash for the three months ended March 31, 2016 and 2015 as derived from the statements of cash flows included in this Form 10-Q.
| For the Three Months Ended March 31, | ||||||||||||||||
| Dollars in thousands; may not add due to | Increase (decrease) | |||||||||||||||
| rounding | 2016 | 2015 | Dollars | Percent | ||||||||||||
| Net cash provided by (used in) | ||||||||||||||||
| Operating activities | $ | (1,389 | ) | $ | 5,781 | $ | (7,170 | ) | -124.0 | % | ||||||
| Investing activities | 1,402 | (2,630 | ) | 4,032 | 53.3 | % | ||||||||||
| Financing activities | 258 | (1,127 | ) | 1,385 | 22.9 | % | ||||||||||
| Net cash flow | 271 | 2,024 | (1,753 | ) | -86.6 | % | ||||||||||
| Effect of exchange rate changes on cash | 87 | (26 | ) | (112 | ) | 337.2 | % | |||||||||
| Unrestricted cash | ||||||||||||||||
| Beginning of period | 2,331 | 2,397 | (66 | ) | -2.7 | % | ||||||||||
| Adjustment for deconsolidation | (1,461 | ) | - | (1,461 | ) | na | ||||||||||
| End of period | $ | 1,228 | $ | 4,396 | $ | (3,168 | ) | -72.1 | % | |||||||
| 48 |
For the quarter ended March 31, 2016, we used $1,389,000 for operating activities. The largest use of cash was the net loss for the quarter of $2,729,000 from continuing operations, primarily driven by continuing start-up costs that precede revenue. This was partially offset by cash provided by discontinued operations. During the first quarter of 2016, we generated $1,402,000 of cash from investing activities, principally due to proceeds from the Term Loan of $1,581,000. At March 31, 2016, our debt totaled $24,838,000 compared to $23,238,000 as of as of March 31, 2015. For the period, the Company generated $258,000 from financing activities, including a net $1,499,000 increase in debt, partially offset by cash used by discontinued operations of $1,104,000. $137,000 was paid to the holder of our preferred units.
For the quarter ended March 31, 2015, we generated $5,781,000 from operating activities. The largest source of cash from operations was a decrease from our trading accounts and deposits of $5,511,000. During the first quarter of 2015, we used $2,630,000 of cash for investing activities, primarily related to the purchase of additional marketable securities of $2,256,000. At March 31, 2015, our debt totaled $23,238,000 compared to $11,788,000 as of the prior three-month period ended March 31, 2014. For the first quarter of 2015, the Company used $1,127,000 for financing activities, including a net $3,472,000 increase in debt and a payment of $4,549,000 in distributions. Of the total distribution amount, $92,000 was paid to the holder of our preferred units and $4,457,000 was paid to our common unit-holders.
Exelon
On March 30, 2016 we entered into a full requirements preferred supply agreement with Exelon to provide us with all the power and ancillary services we need to serve our customers for an initial term expiring on March 30, 2019.
Under the terms of the PSA, on a daily or weekly basis as we request, Exelon will provide firm, fixed quotes for power for terms from 1 to 36 months out for each of the service areas in which we operate. Such quotes will include all costs of energy, capacity, ancillary services, and RECs necessary to meet state minimum renewable energy requirements to serve residential and small commercial customers. In addition, Exelon absorbs all deviations between forecasted and actual customer usage. Finally, the PSA provides that Exelon will post any collateral required of us by an ISO or EDC.
In addition to eliminating commodity price and volumetric risk, the PSA also incorporates the ability for us to defer payment of all or a portion of Exelon’s invoices to us based on certain criteria as defined in the agreement, including an asset pledge and certain financial covenants. essentially providing us with a revolving line of credit.
Continuous Notes Offering
On May 10, 2012, our first Form S-1 registration statement relating to the offer and sale of our Notes (File No. 333-179460) was declared effective by the SEC, and the offering commenced on May 15, 2012. This Old S-1 covered up to $50,000,000 in principal amount of 3 and 6 month and 1, 2, 3, 4, 5, and 10 year notes.
On May 8, 2015, we filed a new registration statement with respect to the Notes (File No. 333-203994) to continue our Notes Offering under the Old S-1 until the effective date of the New S-1. The new registration replaces the original statement and covers up to $75,000,000 in principal amount of 3- and 6-month and 1, 2, 3, 4, 5, and 10 year notes. The New S-1 was declared effective by the SEC on November 12, 2015.
| 49 |
For the quarters ended March 31, 2016 and 2015, we incurred $531,000 and $597,000, respectively, of offering-related expenses, including marketing and certain printing expenses, legal and accounting fees, filing fees, and trustee fees but excluding amounts capitalized as deferred financing costs and amortized as Notes are sold. Deferred financing cost amortization totaled $3,000 and $47,000, respectively. At March 31, 2016, net deferred financing costs related to the Notes totaled $298,000.
From the effective date of May 10, 2012 through March 31, 2016, we issued a total of $47,435,000 of Notes, of which $31,752,000 were initial sales for cash and $15,683,000 were renewals for which we did not receive any additional proceeds, and we redeemed $6,617,000, for a net principal outstanding as of March 31, 2016 of $25,135,000.
The Company’s communications may include certain non-GAAP financial measures. A “non-GAAP financial measure” is defined as a numerical measure of a company’s financial performance, financial position, or cash flows that excludes, or includes, amounts that are included in, or excluded from, the most directly comparable measure calculated and presented in accordance with GAAP in the company’s financial statements.
Non-GAAP financial measures utilized by the Company include “total liquid assets”. The most comparable GAAP measure is total current assets. The Company’s management believes that these non-GAAP financial measures provide useful information to investors and enable investors and analysts to more accurately compare the Company’s ongoing financial performance over the periods presented.
Critical Accounting Policies and Estimates
Variable Interest Entities - Principles of Consolidation
Generally, we consolidate only business enterprises that we control by ownership of a majority voting interest. However, there are situations in which consolidation is required even though the usual condition of consolidation (ownership of a majority voting interest) does not apply. Generally, this occurs when an entity holds an interest in another business enterprise that was achieved through arrangements that do not involve voting interests, which results in a disproportionate relationship between such entity’s voting interests in, and its exposure to the economic risks and potential rewards of, the other business enterprise. This disproportionate relationship results in what is known as a variable interest, and the entity in which we have the variable interest is referred to as a “VIE.”
| 50 |
The Company follows ASC 810-10-15 guidance with respect to accounting for VIEs. A VIE is an entity that does not have sufficient equity at risk to finance its activities without additional subordinated financial support from other parties, or whose equity investors lack any of the characteristics of a controlling financial interest. A variable interest is an investment or other interest that will absorb portions of a VIE’s expected losses or receive portions of the entity’s expected residual returns. Variable interests are contractual, ownership, or other pecuniary interests that change with changes in the fair value of the entity’s net assets. A party is the primary beneficiary of a VIE and must consolidate it when that party has a variable interest, or combination of variable interests, that provides the party with a controlling financial interest. A party is deemed to have a controlling financial interest if it meets both of the power and losses/benefits criteria. The power criterion is the ability to direct the activities of the VIE that most significantly impact its economic performance. The losses/benefits criterion is the obligation to absorb losses from, or right to receive benefits from, the VIE that could potentially be significant to the VIE. The VIE model requires an ongoing reconsideration of whether a reporting entity is the primary beneficiary of a VIE due to changes in facts and circumstances.
Discontinued Operations
ASU 2014-08 provided an update to ASC 205 when determining if a component of a business should be accounted for as a discontinued operation, with the primary consideration being whether or not the disposal represented a strategic shift that has or will have a major effect on an entity’s operations and financial results.
For the Company, each of the three segments of Enterprises was evaluated individually. It was concluded that the results of all three segments have a major effect on the entity’s operations given their size and fact that they are separate reportable segments. However, it was determined that the disposal of wholesale trading and diversified investments would represent a strategic shift for the Company. Therefore, wholesale trading and diversified investments are reported as discontinued operations. The retail energy services business of REH is reported in continuing operations.
Revenue Recognition
Revenue from the retail sale of electricity, including estimates of unbilled revenues for power consumed by customers but not yet billed under the cycle billing method, is recorded in the period in which customers consume the commodity, net of any applicable sales tax.
Unit Based Compensation
The Company used a discounted cash flow model to value the units granted in the first quarter of 2016. This model includes highly subjective inputs including cost of capital and growth projections. The Company used the discounted cash flow model due to limited operations of the Company as well as the lack of publicly traded equity.
| 51 |
Item 3 - Quantitative and Qualitative Disclosures about Market Risk
We are exposed to market risk in our normal business activities. Market risk is the potential loss that may result from changes associated with an existing or forecasted financial or commodity transaction. The types of market risk we are exposed to are interest rate risk, liquidity risk, and credit risk.
As of March 31, 2016 and December 31, 2015, we had $0 and $3,101,000 of variable rate debt outstanding. The interest rates charged on such are based in part on changes in certain market indices plus a credit margin, but are subject to “floors”, which may have the effect of converting variable rates to fixed rates and such was the case at December 31, 2015. Consequently, at December 31, 2015, we had no variable rate debt, although in the future we may be exposed to fluctuations in interest rates. Exposures to interest rate fluctuations may be mitigated by entering into derivative instruments known as interest rate swaps, caps, collars, and put or call options. These contracts reduce exposure to interest rate volatility and result in primarily fixed rate debt obligations when taking into account the combination of the variable rate debt and the interest rate derivative instrument.
Liquidity risk arises from our general funding needs and the management of our assets and liabilities.
Credit risk relates to the risk of loss resulting from non-performance or non-payment by counterparties pursuant to the terms of their contractual obligations.
In our retail business, we may be exposed to certain customer credit risks. Although we are currently not exposed to retail customer credit risk to a large degree due to our participation in POR programs, we expect that this situation will change as we grow our retail business and expand into non-POR areas. Furthermore, economic and market conditions may affect our customers’ willingness and ability to pay their bills in a timely manner, which could lead to an increase in bad debt expense above and beyond the allowance for uncollectible accounts charged to us by utilities.
| 52 |
Item 4 - Controls and Procedures
The Company maintains a system of disclosure controls and procedures that is designed to ensure that information required to be disclosed in our Exchange Act reports is recorded, processed, summarized and reported within the time periods specified in the Securities and Exchange Commission’s rules and forms, and that such information is accumulated and communicated to our management, including our Chief Executive Officer and Chief Financial Officer, as appropriate, to allow timely decisions regarding required disclosures.
Under the supervision and with the participation of our management, including our Chief Executive Officer and Chief Financial Officer, the Company conducted an evaluation of our disclosure controls and procedures as defined in Exchange Act Rules 13a-15(e) and 15d-15(e). As a result of the material weaknesses previously disclosed in Management's Report on Internal Control Over Financial Reporting (As Revised) in Item 9A of our Form 10-K/A, for the year ended December 31, 2015, dated May 23, 2016, and the material weakness discussed below, the Company’s Chief Executive Officer and Chief Financial Officer concluded that, as of March 31, 2016, the Company’s disclosure controls and procedures were not effective.
A material weakness is a deficiency, or a combination of deficiencies, in internal control over financial reporting, such that there is a reasonable possibility that a material misstatement of the company’s annual or interim financial statements will not be prevented or detected on a timely basis. The Company’s internal control regarding the evaluation of the accounting for the issuance of units in the Company’s equity to management was not designed or operating effectively. This control failed to identify an adjustment to our interim financial statements, related to the recording of compensation expense, which was identified by our independent registered public accounting firm during their quarterly review procedures. This amount was subsequently adjusted and recorded correctly in our financial statements for the three months ended March 31, 2016. It had no impact on prior period financial statements.
Notwithstanding the identified material weaknesses, management believes the interim consolidated financial statements included in this Quarterly Report on Form 10-Q fairly represent in all material respects our financial condition, results of operations, and cash flows at and for the periods presented in accordance with accounting principles generally accepted in the United States of America.
Changes in Internal Control over Financial Reporting
There no changes in the Company’s internal control over financial reporting that occurred during the three months ended March 31, 2016 that has materially affected, or is reasonably likely to materially affect, the Company’s internal control over financial reporting, except for the material weakness discussed above.
Plan for Remediation of Material Weaknesses
With oversight from the Audit Committee, the Company’s management is in the process of developing and implementing remediation plans to address the material weaknesses. Once all remedial actions have been implemented and in operation for a sufficient period of time, these actions will be fully tested to determine whether they are operating effectively.
| 53 |
No material changes from prior disclosure.
No material changes from prior disclosure.
Item 2 - Unregistered Sales of Equity Securities and Use of Proceeds
None
Item 3 - Defaults Upon Senior Securities
None
Item 4 - Mine Safety Disclosures
None
None
| 54 |
| Exhibit Number | Description | |
| 2.1 | Agreement and Plan of Reorganization, dated November 14, 2011, as amended December 20, 2011 (incorporated by reference to Exhibit 2.1 to the Registrant's Form S-1 filed February 10, 2012) | |
| 3.1(i) | Articles of Organization (incorporated by reference to Exhibit 3.1 to the Registrant's Form S-1 filed February 10, 2012) | |
| 3.1(ii) | Form of Amended and Restated Operating Agreement (incorporated by reference to Exhibit 3.1(ii) to the Registrant's Form 10-K filed April 15, 2016) | |
| 4.1 | First Supplemental Indenture (incorporated by reference to Exhibit 4.1 to Registrant's Form S-1/A filed September 16, 2015) | |
| 4.2 | Form of Indenture (incorporated by reference to Exhibit 4.2 to the Registrant's Form S-1/A filed March 30, 2012) | |
| 4.3 | Form of Note Confirmation (incorporated by reference to Exhibit 4.3 to the Registrant's Form S-1/A filed September 16, 2015) | |
| 4.4 | Form of Subscription Agreement (incorporated by reference to Exhibit 4.4 to the Registrant's Form S-1/A filed September 16, 2015) | |
| 4.5 | Paying Agent Agreement (incorporated by reference to Exhibit 4.5 to the Registrant's Form S-1/A filed March 30, 2012) | |
| 10.1 | Form of Amended and Restated Outsourcing Agreement (incorporated by reference to Exhibit 10.1 to the Registrant's Form S-1/A filed September 16, 2015) | |
| 10.2 | Term Loan Agreement between Aspirity Financial and Enterprises (incorporated by reference to Exhibit 10.2 to the Registrant's Form S-1/A filed September 16, 2015), as amended by Amendment No. 1 to Term Loan Agreement dated November 1, 2015 and as further amended by Amendment No. 2 to Term Loan Agreement dated January 27, 2016 (incorporated by reference to Exhibit 10.2 to the Registrant's Form 10-K filed April 15, 2016). | |
| 10.3 | Employment Agreement between the Company and Mark A. Cohn (incorporated by reference to Exhibit 10.3 to the Registrant's Form 8-K filed January 6, 2016) | |
| 10.4 | Employment Agreement between the Company and Wiley H. Sharp III (incorporated by reference to Exhibit 10.4 to the Registrant's Form 8-K filed January 6, 2016) | |
| 10.5 | Employment Agreement between the Company and Scott C. Lutz (incorporated by reference to Exhibit 10.6 to the Registrant's Form 8-K filed January 6, 2016) | |
| 10.6 | Springing Equity Pledge Agreement (incorporated by reference to Exhibit 10.7 to the Registrant's Form S-1/A filed September 16, 2015) | |
| 10.7 | Secured Promissory Note given by Enterprises to Aspirity Financial (incorporated by reference to Exhibit 10.8 to the Registrant's Form S-1/A filed September 16, 2015) |
| 55 |
| 10.8 | Form of Indemnification Agreement between the Company and each of Timothy Krieger, David Johnson, Wiley H. Sharp III, Mark Cohn, Paul W. Haglund, Scott C. Lutz, and William M. Goblirsch (incorporated by reference to Exhibit 10.5 to the Registrant's Form S-1 filed February 10, 2012) | |
| 10.9 | Office Sublease Agreement, dated June 1, 2015 between the Company and Bell State Bank & Trust (incorporated by reference to Exhibit 10.10 to the Registrant's Form 8-K filed July 20, 2015) | |
| 10.10 | Guaranty Agreement dated March 30, 2016 by and between the Company and Exelon Generation Company, LLC (incorporated by reference to Exhibit 10.11 to the Registrant's Form 10-K filed April 15, 2016) | |
| 10.11 | Pledge Agreement dated March 30, 2016 by and between the Company and Exelon Generation Company, LLC (incorporated by reference to Exhibit 10.12 to the Registrant's Form 10-K filed April 15, 2016) | |
| 31.1 | Certification of Chief Executive Officer, pursuant to Rule 13a-14 and 15d-14 of the Securities Exchange Act of 1934. | |
| 31.2 | Certification of Chief Financial Officer, pursuant to Rule 13a-14 and 15d-14 of the Securities Exchange Act of 1934. | |
| 32.1 | Certification of Chief Executive Officer and Chief Financial Officer, pursuant to 18 U.S.C. Section 1350, as adopted pursuant to Section 906 of the Sarbanes-Oxley Act of 2002. | |
| 101.INS | XBRL Instance Document | |
| 101.SCH | XBRL Schema Document | |
| 101.CAL | XBRL Calculation Linkbase Document | |
| 101.DEF | XBRL Definition Linkbase Document | |
| 101.LAB | XBRL Labels Linkbase Document | |
| 101.PRE | XBRL Presentation Linkbase Document |
| 56 |
Pursuant to the requirements of the Securities Exchange Act of 1934, the registrant has duly caused this report to be signed on its behalf by the undersigned thereto duly authorized.
| ASPIRITY HOLDINGS, LLC | ||
| /s/ Mark A. Cohn | ||
| Dated: June 9, 2016 | By: | Mark A. Cohn |
| President and Chief Executive Officer (principal executive officer) | ||
| /s/ Wiley H. Sharp III | ||
| Dated: June 9, 2016 | By: | Wiley H. Sharp III |
| Vice President – Finance and Chief Financial Officer (principal accounting and financial officer) |
| 57 |