Attached files
| file | filename |
|---|---|
| EXCEL - IDEA: XBRL DOCUMENT - ASPIRITY HOLDINGS LLC | Financial_Report.xls |
| EX-10.1 - ASSIGNMENT OF MEMBERSHIP UNIT PURCHASE AGREEMENT, EFFECTIVE JULY 1, 2012 - ASPIRITY HOLDINGS LLC | twincities_10q-ex1001.htm |
| EX-3.1 - AMENDED AND RESTATED MEMBER CONTROL AGREEMENT - ASPIRITY HOLDINGS LLC | twincities_10q-ex0301.htm |
| EX-32.1 - CERTIFICATION - ASPIRITY HOLDINGS LLC | twincities_10q-ex3201.htm |
| EX-31.2 - CERTIFICATION - ASPIRITY HOLDINGS LLC | twincities_10q-ex3102.htm |
| EX-31.1 - CERTIFICATION - ASPIRITY HOLDINGS LLC | twincities_10q-ex3101.htm |
UNITED STATES OF AMERICA
SECURITIES AND EXCHANGE COMMISSION
Washington, DC 20549
FORM 10-Q
| S | QUARTERLY REPORT PURSUANT TO SECTION 13 OR 15(d) OF THE SECURITIES EXCHANGE ACT OF 1934 |
| For the Quarterly Period Ended September 30, 2012 | |
| or | |
| £ | TRANSITION REPORT PURSUANT TO SECTION 13 OR 15(d) OF THE SECURITIES EXCHANGE ACT OF 1934 |
| For the Transition Period from ________ to ________ | |
Commission File Number: None
Twin Cities Power Holdings, LLC
(Exact name of registrant as specified in its charter)
|
Minnesota (State of organization) |
27-1658449 (IRS Employer Identification Number) |
16233 Kenyon Avenue, Suite 210
Lakeville, Minnesota 55044
(Address of principal executive offices, zip code)
(952) 241-3103
(Registrant’s telephone number, including area code)
not applicable
(Former name, former address and former fiscal year, if changed since last report)
_________________________________________________________
Indicate by check mark whether the registrant (1) has filed all reports required to be filed by Section 13 or 15(d) of the Securities Exchange Act of 1934 during the preceding 12 months (or for such shorter period that the registrant was required to file such reports), and (2) has been subject to such filing requirements for the past 90 days. Yes S No £
Indicate by check mark whether the registrant has submitted electronically and posted on its corporate web site, if any, every Interactive Data File required to be submitted and posted pursuant to Rule 405 of Regulation S T (§232.405 of this chapter) during the preceding 12 months (or for such shorter period that the registrant was required to submit and post such files). Yes S No £
Indicate by check mark whether the registrant is a large accelerated filer, an accelerated filer, a non-accelerated filer, or smaller reporting company. See definition of “large accelerated filer”, “accelerated filer”, and “smaller reporting company” in Rule 12b-2 of the Exchange Act. (Check one):
| Large accelerated filer £ | Accelerated filer £ | Non-accelerated filer £ | Smaller reporting company S |
Indicate by check mark whether the registrant is a shell company (as defined in Rule 12b-2 of the Exchange Act). Yes £ No S
TABLE OF CONTENTS
| Definitions | 3 | |
| Forward Looking Statements | 6 | |
| Non-GAAP Financial Measures | 7 | |
| Part I – Financial Information | 8 | |
| Item 1 - | Financial Statements (Unaudited) | 8 |
Consolidated Balance Sheets As of September 30, 2012 and December 31, 2011 |
8 | |
Consolidated Statements of Comprehensive Income Three Months and Nine Months ended September 30, 2012 and 2011 |
9 | |
Consolidated Statements of Cash Flows Nine Months Ended September 30, 2012 and 2011 |
10 | |
Consolidated Statements of Cash Flows (Continued) Nine Months Ended September 30, 2012 and 2011 |
11 | |
| Notes to Consolidated Financial Statements | 12 | |
| Item 2 - | Management’s Discussion and Analysis of Financial Condition and Results of Operations | 28 |
| Industry Background | 28 | |
| Company Overview | 32 | |
| Results of Operations | 35 | |
| Three Months Ended September 30, 2012 and 2011 | 35 | |
| Nine Months Ended September 30, 2012 and 2011 | 38 | |
| Liquidity, Capital Resources, and Cash Flow | 40 | |
| Financing | 42 | |
| Critical Accounting Policies and Estimates | 43 | |
| Item 3 - | Quantitative and Qualitative Disclosures about Market Risk | 44 |
| Item 4 - | Controls and Procedures | 44 |
| Part II – Other Information | 45 | |
| Item 1 - | Legal Proceedings | 45 |
| Item 1A - | Risk Factors | 45 |
| Item 2 - | Unregistered Sales of Equity Securities and Use of Proceeds | 45 |
| Item 3 - | Defaults Upon Senior Securities | 45 |
| Item 4 - | Mine Safety Disclosures | 45 |
| Item 5 - | Other Information | 45 |
| Item 6 - | Exhibits | 46 |
| Signatures | 47 | |
| 2 |
Definitions
| Abbreviation or acronym | Definition | |
| ABN AMRO | ABN AMRO Clearing Chicago, LLC and ABN AMRO Clearing Bank, N.V. | |
| ASC | Accounting Standards Codification | |
| BLS | Bureau of Labor Statistics, an agency within the U.S. Department of Labor | |
| Btu; therm; MMBtu | A “Btu” or British thermal unit is a measure of thermal energy or the amount of heat needed to raise the temperature of one pound of water from 39°F to 40°F. A “therm” is one hundred thousand Btu. A “MMBtu” is one million Btu. | |
| C$ | Canadian dollars | |
| CAISO | California Independent System Operator | |
| CAN | Twin Cities Power – Canada, Ltd., a subsidiary of TCE | |
| CCL | Clearwaters Capital, LLC, an affiliate of Schachter | |
| CEF | Cygnus Energy Futures, LLC, a subsidiary of CP | |
| CFTC | Commodity Futures Trading Commission | |
| CLP | Connecticut Light & Power Company, an EDC in Connecticut | |
| CME | CME Group | |
| Company | TCPH and its subsidiaries | |
| CoV | Coefficient of variation, a simple measure of volatility useful for comparing two or more data series; equal to the standard deviation divided by the mean | |
| CP | Cygnus Partners, LLC, a first-tier subsidiary of the Company | |
| CP&U | Community Power & Utility, LLC | |
| CTG | Chesapeake Trading Group, LLC | |
| Degree-days; CDD; HDD |
A “degree-day” compares outdoor temperatures to a standard of 65°F. Hot days require energy for cooling and are measured in cooling degree-days or “CDD” while cold days require energy for heating and are measured in heating degree-days or “HDD”. For example, a day with a mean temperature of 80°F would result in 15 CDD and a day with a mean temperature of 40°F would result in 25 HDD.
If heating degree-days are less than the average for an area for a period, the weather was “warmer than normal”; if they were greater, it was “colder than normal”. The converse is true for cooling degree-days - if CDD are less than the average for an area for a period, the weather was “colder than normal”; if they were greater, it was “warmer than normal”. | |
| DOE | U.S. Department of Energy | |
| EDC | Electric distribution company | |
| EIA | Energy Information Administration, an independent agency within DOE | |
| ERCOT | Electric Reliability Council of Texas | |
| FASB | Financial Accounting Standards Board | |
| FERC | Federal Energy Regulatory Commission, an independent regulatory agency within DOE | |
| Form S-1 | The Company’s Registration Statement on Form S-1, declared effective by the Securities and Exchange Commission on May 10, 2012, with respect to the Company’s Notes Offering |
| 3 |
| Abbreviation or acronym | Definition | |
| GAAP | Generally accepted accounting principles in the United States | |
| HTS | HTS Capital, LLC, an affiliate of Schachter | |
| HTS Parties | Schachter, HTS, and CCL collectively | |
| ICE | Intercontinental Exchange® | |
| IESO | Ontario Independent Electricity System Operator | |
| ISO | Independent System Operator | |
| ISO-NE | ISO New England | |
| kW; kWh | Kilowatt or kilowatt-hour; one thousand watts or watt-hours. Kilowatt-hours are typically used to measure residential energy consumption and retail prices. One kWh is equal to 3,412 Btu, but fuel with a heat content of 7,000 to 11,500 Btu must be consumed to generate and deliver one kWh of electricity. | |
| MISO | Midwest Independent System Operator | |
| MCF | One thousand cubic feet, a common unit of price measure for natural gas. In 2010, one MCF of natural gas had a heat content of 1,025 Btu. | |
| MW; MWh | Megawatt or megawatt-hour; one million watts or watt-hours or one thousand kilowatts or kilowatt-hours. Megawatts are typically used to measure electrical generation capacity and megawatt-hours are the pricing units used in the wholesale electricity market. | |
| NGX | Natural Gas Exchange Inc. | |
| NOAA | National Oceanic and Atmospheric Administration, an agency of the U.S. Department of Commerce | |
| Notes Offering | The public offering by the Company of renewable unsecured subordinated notes, pursuant to the S-1 | |
| NYISO | New York Independent System Operator | |
| OTC | Over-the-counter | |
| PJM | PJM Interconnection | |
| RTO | Regional Transmission Organization | |
| Schachter | Robert O. Schachter, an individual | |
| SEC | Securities and Exchange Commission | |
| SUM | Summit Energy, LLC, a subsidiary of TCP | |
| TCE | Twin Cities Energy, LLC, a first-tier subsidiary of the Company | |
| TCP | Twin Cities Power, LLC, a first-tier subsidiary of the Company | |
| TCPH | Twin Cities Power Holdings, LLC | |
| TSE | Town Square Energy, an accounting division of TCP resulting from the acquisition of the business and assets of CP&U | |
| UI | The United Illuminating Company, an EDC in Connecticut |
| 4 |
| Abbreviation or acronym | Definition | |
| Watt (W); Watt-hour (Wh) |
Although in everyday usage, the terms “energy” and “power” are essentially synonyms, scientists, engineers, and the energy business distinguish between them. Technically, energy is the ability to do work, or move a mass a particular distance by the application of force while power is the rate at which energy is generated or consumed. Energy is measured in joules and power is measured in watts. A watt is equal to one joule per second.
In the case of electricity, power is also equal to voltage or the difference in charge between two points multiplied by amperage or the current or rate of electrical flow and the energy supplied or consumed by a circuit is measured in watt-hours.
For example, when a light bulb with a power rating of 100W is turned on for one hour, the energy used is 100 watt-hours. This same amount of energy would light a 40-watt bulb for 25 hours or a 50-watt bulb for 20 hours. |
| 5 |
Forward Looking Statements
Readers are urged to carefully review and consider the various disclosures made by us in this Form 10-Q and in our other reports filed with the SEC that attempt to advise interested parties of the factors that may affect our business.
Statements in this report that are not statements of historical facts are considered “forward-looking” and, accordingly, involve risks and uncertainties that could cause actual results to differ materially from those discussed. Although such forward-looking statements have been made in good faith and are based on reasonable assumptions, there is no assurance that the expected results will be achieved. Any statements that express, or involve discussions as to, future expectations, risks, beliefs, plans, objectives, assumptions, events, uncertainties, financial performance, or growth strategies, often, but not always, through the use of words or phrases such as “anticipates”, “believes”, “estimates”, “expects”, “intends”, “plans”, “projects”, “likely”, “will continue”, “could”, “may”, “potential”, “target”, “outlook”, or words of similar meaning are not statements of historical facts and may be forward-looking.
In connection with the safe harbor provisions of the Private Securities Litigation Reform Act of 1995, we are providing this cautionary statement to identify important factors that could cause our actual results to differ materially from those indicated in forward-looking statements made by or on behalf of the Company in this Form 10-Q, in presentations, on our website, in response to questions, or otherwise. You should not place undue reliance on any forward-looking statement.
These statements are qualified in their entirety by reference to, and are accompanied by, the following important factors, in addition to any assumptions and other factors referred to specifically in connection with such forward-looking statements that could cause our actual results to differ materially from those indicated in the forward-looking statements:
| · | Our ability to successfully implement our strategic objectives; |
| · | Changes in, and compliance with, the laws and policies of the governments of the United States and Canada, the states and provinces, and various localities, as they may affect energy markets and industry restructuring initiatives; |
| · | Our ability to manage expansion and integrate acquisitions; |
| · | Economic and geographic factors, including political and economic risks; |
| · | Weather conditions, natural disasters, and pandemic diseases; |
| · | War, acts of terrorism, and cyber-attacks; |
| · | Wholesale power market conditions; |
| · | Population growth rates and demographic patterns; |
| · | Effects of competition, including competition for retail and wholesale customers; |
| · | Pricing and transportation of commodities; |
| · | Changes in tax rates or policies or in rates of inflation; |
| · | Changes in operating expenses and capital expenditures; |
| · | Global and domestic economic conditions affecting us or our customers; |
| · | Our ability to access capital markets and bank financing; |
| · | Changes in interest rates and the performance of the financial markets; |
| · | Our ability to retain qualified, skilled and experienced personnel; |
| · | The outcome of legal and administrative investigations and proceedings and settlements; |
| · | Our entry into the retail energy services business will experience all the risks involved in entering into a new line of business, including the risks that we are unable to run the business profitably, that we will not be able to recognize expected synergies, and that we may not be able to achieve a liquidity event for such business; and |
| 6 |
| · | Any other risk factors listed from time to time by the Company in reports filed with the Securities and Exchange Commission |
Additional disclosures regarding factors that could cause our results and performance to differ from results or performance anticipated by this report are discussed under the heading “Risk Factors” beginning on page 10 of our Form S-1.
Any forward-looking statement speaks only as of the date on which such statement is made, and we undertake no obligation to update any forward-looking statement to reflect events or circumstances after the date on which that statement is made or to reflect the occurrence of unanticipated events. New factors emerge from time to time, and it is not possible for management to predict all of these factors, nor can it assess the impact of each of these factors on the businesses of the Company or the extent to which any factor, or combination of factors, may cause actual results to differ materially from those contained in any forward-looking statement.
Non-GAAP Financial Measures
The Company’s communications may include certain non- GAAP financial measures. A “non-GAAP financial measure” is defined as a numerical measure of a company's financial performance, financial position, or cash flows that excludes, or includes, amounts that are included in, or excluded from, the most directly comparable measure calculated and presented in accordance with GAAP in the company's financial statements.
Non-GAAP financial measures utilized by the Company include presentations of liquidity measures and debt-to-equity ratios. The Company’s management believes that these non-GAAP financial measures provide useful information to investors and enable investors and analysts to more accurately compare the Company's ongoing financial performance over the periods presented.
| 7 |
Part I – Financial Information
Item 1 - Financial Statements (Unaudited)
Twin Cities Power Holdings, LLC and Subsidiaries
Consolidated Balance Sheets
As of September 30, 2012 and December 31, 2011
| September 30, | December 31, | |||||||
| 2012 | 2011 | |||||||
| Unaudited | ||||||||
| Assets | ||||||||
| Current assets | ||||||||
| Cash | $ | 1,357,453 | $ | 971,081 | ||||
| Trading accounts and deposits | 11,940,820 | 15,833,940 | ||||||
| Accounts receivable - trade | 1,699,211 | 614,151 | ||||||
| Prepaid expenses and other assets | 110,419 | 223,981 | ||||||
| Deferred income tax benefit | – | 526,486 | ||||||
| Total current assets | 15,107,903 | 18,169,639 | ||||||
| Equipment and furniture, net | 624,306 | 669,728 | ||||||
| Other assets | ||||||||
| Intangible assets, net | 142,663 | – | ||||||
| Deferred financing costs, net | 392,122 | – | ||||||
| Total assets | $ | 16,266,994 | $ | 18,839,367 | ||||
| Liabilities and Members' Equity | ||||||||
| Current liabilities | ||||||||
| Accounts payable - trade | $ | 1,300,970 | $ | 878,275 | ||||
| Accrued expenses | 3,641 | 8,584 | ||||||
| Accrued compensation | 1,681,264 | 3,980,551 | ||||||
| Accrued interest | 186,171 | 145,169 | ||||||
| Accrued distributions | 92,004 | – | ||||||
| Income taxes payable | – | 475,852 | ||||||
| Notes payable, related parties | 1,166,666 | 2,000,000 | ||||||
| Notes payable | 1,657,253 | 4,402,253 | ||||||
| Renewable unsecured subordinated notes | 489,992 | – | ||||||
| Total current liabilities | 6,577,961 | 11,890,684 | ||||||
| Long-term debt | ||||||||
| Notes payable | 2,914,510 | 3,886,012 | ||||||
| Renewable unsecured subordinated notes | 771,946 | – | ||||||
| Total liabilities | 10,264,417 | 15,776,696 | ||||||
| Commitments and contingencies | ||||||||
| Redeemable preferred units | 2,745,000 | – | ||||||
| Members' equity | ||||||||
| Common equity | 2,682,576 | 2,439,004 | ||||||
| Accumulated other comprehensive income | 575,001 | 623,667 | ||||||
| Total members' equity | 3,257,577 | 3,062,671 | ||||||
| Total liabilities and members' equity | $ | 16,266,994 | $ | 18,839,367 | ||||
See notes to consolidated financial statements.
| 8 |
Twin Cities Power Holdings, LLC and Subsidiaries
Consolidated Statements of Comprehensive Income
Three Months and Nine Months ended September 30, 2012 and 2011
| Three Months | Nine Months | |||||||||||||||
| Ended September 30, | Ended September 30, | |||||||||||||||
| 2012 | 2011 | 2012 | 2011 | |||||||||||||
| Unaudited | Unaudited | Unaudited | Unaudited | |||||||||||||
| Revenue | ||||||||||||||||
| Wholesale trading revenue, net | $ | 4,995,691 | $ | 6,848,799 | $ | 12,420,823 | $ | 37,185,790 | ||||||||
| Retail electricity revenue | 134,650 | – | 134,650 | – | ||||||||||||
| Consulting fees | – | – | – | 283,910 | ||||||||||||
| 5,130,341 | 6,848,799 | 12,555,473 | 37,469,700 | |||||||||||||
| Operating expenses | ||||||||||||||||
| Cost of retail electricity sold | 113,273 | – | 113,273 | – | ||||||||||||
| Salaries, wages, and related taxes | 1,090,519 | 4,228,458 | 5,799,949 | 18,071,247 | ||||||||||||
| Professional fees | 783,619 | 873,667 | 2,020,833 | 1,859,055 | ||||||||||||
| Other general and administrative | 776,496 | 382,123 | 1,844,739 | 2,442,245 | ||||||||||||
| Trading tools and subscriptions | 221,964 | 333,425 | 730,704 | 1,098,216 | ||||||||||||
| 2,985,871 | 5,817,673 | 10,509,498 | 23,470,763 | |||||||||||||
| Operating income | 2,144,470 | 1,031,126 | 2,045,975 | 13,998,937 | ||||||||||||
| Other income (expense) | ||||||||||||||||
| Interest expense | (247,865 | ) | (255,925 | ) | (836,145 | ) | (2,588,765 | ) | ||||||||
| Interest income | 5,588 | 7,740 | 24,261 | 20,859 | ||||||||||||
| Gain (loss) on foreign currency exchange | (75 | ) | 278 | (16,739 | ) | (68,847 | ) | |||||||||
| (242,352 | ) | (247,907 | ) | (828,623 | ) | (2,636,753 | ) | |||||||||
| Income before income taxes | 1,902,118 | 783,219 | 1,217,352 | 11,362,184 | ||||||||||||
| Income tax provision (benefit) | (33,763 | ) | 74,000 | 54,019 | 408,000 | |||||||||||
| Net income | 1,935,881 | 709,219 | 1,163,333 | 10,954,184 | ||||||||||||
| Preferred distributions | (137,250 | ) | – | (366,000 | ) | – | ||||||||||
| Net income attributable to common | 1,798,631 | 709,219 | 797,333 | 10,954,184 | ||||||||||||
| Other comprehensive income | ||||||||||||||||
| Foreign currency translation adjustment | (9,408 | ) | (78,468 | ) | (48,666 | ) | (115,602 | ) | ||||||||
| Comprehensive income | $ | 1,789,223 | $ | 630,751 | $ | 748,667 | $ | 10,838,582 | ||||||||
See notes to consolidated financial statements.
| 9 |
Twin Cities Power Holdings, LLC and Subsidiaries
Consolidated Statements of Cash Flows
Nine Months Ended September 30, 2012 and 2011
| Nine Months | ||||||||
| Ended September 30, | ||||||||
| 2012 | 2011 | |||||||
| Unaudited | Unaudited | |||||||
| Cash flows from operating activities | ||||||||
| Net income | $ | 1,163,333 | $ | 10,954,184 | ||||
| Adjustments to reconcile net income to net cash provided by operating activities: | ||||||||
| Depreciation and amortization | 172,152 | 128,758 | ||||||
| Loss on sale of equipment and furniture | 16,931 | – | ||||||
| (Increase) decrease in: | ||||||||
| Trading accounts and deposits | 4,010,985 | 19,224,868 | ||||||
| Accounts receivable - trade | (1,086,278 | ) | 14,456,758 | |||||
| Prepaid expenses and other assets | 661,054 | 4,375,505 | ||||||
| Increase (decrease) in: | ||||||||
| Accounts payable - trade | (77,134 | ) | (14,646,438 | ) | ||||
| Accrued expenses | (4,943 | ) | 303,573 | |||||
| Accrued compensation | (2,415,136 | ) | (2,622,911 | ) | ||||
| Accrued interest | 41,002 | (1,189,129 | ) | |||||
| Net cash provided by operating activities | 2,481,966 | 30,985,168 | ||||||
| Cash flows from investing activities | ||||||||
| Notes receivable, advances to related parties | – | (100,000 | ) | |||||
| Purchase of equipment and furniture | (122,224 | ) | (73,235 | ) | ||||
| Purchase of intangible assets | (160,000 | ) | – | |||||
| Net cash used in investing activities | (282,224 | ) | (173,235 | ) | ||||
| Cash flows from financing activities | ||||||||
| Deferred financing costs | (393,990 | ) | – | |||||
| Proceeds from notes payable | – | 400,000 | ||||||
| Payments on notes payable | (1,804,836 | ) | (28,750,000 | ) | ||||
| Proceeds from issuance of renewable unsecured subordinated notes | 1,273,938 | – | ||||||
| Redemption of renewable unsecured subordinated notes | (12,000 | ) | – | |||||
| Distributions - preferred | (357,385 | ) | – | |||||
| Distributions - common | (370,372 | ) | (4,651,990 | ) | ||||
| Redemption of common units | (100,000 | ) | – | |||||
| Net cash used in financing activities | (1,764,645 | ) | (33,001,990 | ) | ||||
| Net increase (decrease) in cash | 435,097 | (2,190,057 | ) | |||||
| Effect of exchange rate changes on cash | (48,725 | ) | 46,698 | |||||
| Cash: | ||||||||
| Beginning of period | 971,081 | 3,853,588 | ||||||
| End of period | $ | 1,357,453 | $ | 1,710,229 | ||||
See notes to consolidated financial statements.
| 10 |
Twin Cities Power Holdings, LLC and Subsidiaries
Consolidated Statements of Cash Flows (Continued)
Nine Months Ended September 30, 2012 and 2011
| Nine Months | ||||||||
| Ended September 30, | ||||||||
| 2012 | 2011 | |||||||
| Non-cash financing activity: | ||||||||
| Redeemable preferred units issued in exchange for certain notes payable (see Note 9. Ownership Redeemable Preferred Units) | $ | 2,745,000 | $ | – | ||||
| Accrued distributions - preferred | $ | 8,615 | $ | – | ||||
| Accrued distributions - common | $ | 83,389 | $ | – | ||||
| Supplemental disclosures of cash flow information: | ||||||||
| Cash payments for interest | $ | 795,143 | $ | 3,754,294 | ||||
| Cash payments for income taxes, net | $ | – | $ | 1,099,116 | ||||
See notes to consolidated financial statements.
| 11 |
Twin Cities Power Holdings, LLC and Subsidiaries
Notes to Consolidated Financial Statements
| 1. | Basis of Presentation and Description of Business |
Basis of Presentation
Twin Cities Power Holdings, LLC (“TCPH” or the “Company”) has prepared the foregoing unaudited consolidated financial statements in accordance with GAAP and the requirements of the SEC with respect to interim reporting. As permitted under these rules, certain footnotes and other financial information required by GAAP for complete financial statements have been condensed or omitted. The interim consolidated financial statements include all normal and recurring adjustments that are necessary for a fair presentation of our financial position and operating results and include the accounts of TCPH and its subsidiaries. All significant intercompany balances and transactions have been eliminated in consolidation.
For additional information, please refer to our audited consolidated financial statements and the accompanying notes for the years ended December 31, 2011 and 2010 included in our registration statement on Form S-1 filed with the SEC in conjunction with our offering of up to $50,000,000 of our 3 and 6 month and 1, 2, 3, 4, 5, and 10 year Renewable Unsecured Subordinated Notes (the “Form S-1”, the “Notes Offering”, and the “Subordinated Notes”, respectively).
Businesses
The Company has two business segments used to measure its business activity – wholesale energy trading and retail energy services, see Note 3. Segment Information.
Wholesale Energy Trading
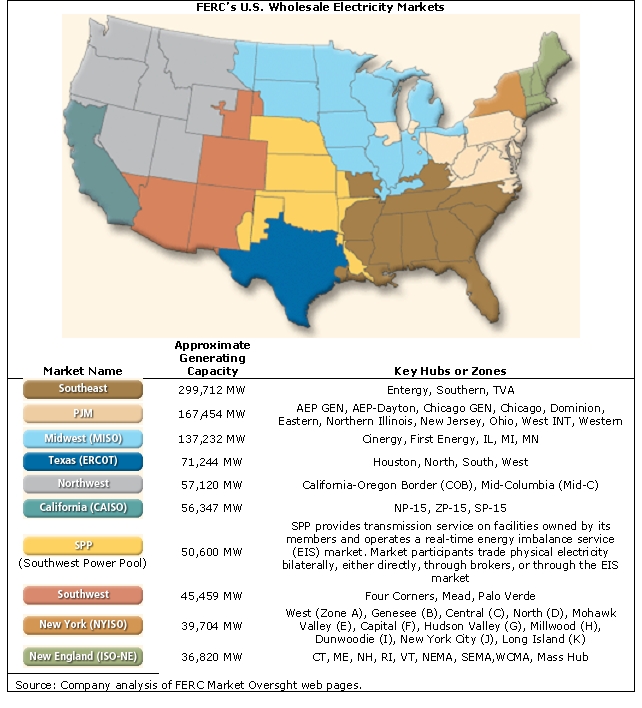
The Company trades financial and physical contracts in wholesale electricity markets managed by ISOs or RTOs (collectively, the “ISOs”) including those managed by MISO, CAISO, ERCOT, PJM, ISO-NE, NYISO, and the IESO. The Company also trades electricity and other energy-related commodities and derivatives on exchanges operated by ICE, NGX, and CME.
U.S. ISOs are regulated by the FERC, a division of DOE. The CFTC regulates ICE, NGX and CME. Regardless of the market or contract type, non-rated participants such as the Company are typically required to place cash collateral with market operators in order to trade, with the specific amounts of such depending upon the rules and requirements of the particular market. See Note 2. Summary of Significant Accounting Policies, Trading Accounts and Deposits.
In general, the Company’s trading activities are characterized by the acquisition of electricity or other energy-related commodities at a given location and its delivery to another. Financial transactions settle in cash in an amount equal to the difference between the purchase and sale prices, while physical transactions are settled by the delivery of the commodity. ISO-traded financial contracts are also known as virtual trades, are outstanding overnight, and settle the next day. The Company also trades physical electricity between certain markets, buying in one market and selling in another. On ICE, NGX, and CME, from time to time, the Company may trade electricity, natural gas, and oil derivatives and hold an open interest in these contracts overnight or longer.
| 12 |
Retail Energy Services
On June 29, 2012, TCP acquired certain assets and the business of Community Power & Utility LLC (“CP&U”), a retail energy business operating in Connecticut, for $160,000 in cash. The business of CP&U, renamed Town Square Energy (“TSE”), is an accounting division of TCP. On July 1, 2012, the Company began selling electricity to residential and small commercial customers in Connecticut at variable and fixed rates. The Company’s customer arrangements are cancellable by the customer at any time.
Cessation of Canadian Operations
On February 1, 2011, TCPH commenced a major restructuring of Twin Cities Power - Canada, Ltd., the wholly-owned subsidiary of TCE and a second-tier subsidiary of the Company.
During the third quarter of 2012, after review of the progress of the restructuring and the outlook for the subsidiary, management concluded that it was unlikely that CAN would ever be able to provide an adequate return. Consequently, on September 5, 2012, TCE resolved that CAN should cease all operations on September 14, 2012. CAN's remaining employee was terminated, its trading accounts and remaining fixed assets were transferred to CTG (a subsidiary of TCP), and he became an independent contractor to the Company; the office lease was abandoned; the process of canceling or withdrawing its permits and licenses issued by Canadian energy regulatory authorities was initiated; and all accounts, both external and intercompany, were closed except for one bank account.
During the three and nine months ended September 30, 2012, net revenue for CAN was $140,000 and $1,098,000, respectively, and operating income was $1,899,055 and $2,963,664, respectively. Operating income in both the three and nine month periods was positively impacted by the reversal of compensation accruals for former employees totaling $2,361,685 ($779,762 in the second quarter and $1,581,923 in the third quarter). Without such reversals, operating income in the three and nine month periods would have been $317,132 and $301,979, respectively.
For the three and nine months ended September 30, 2011, CAN's net revenues were $1,146,000 and $6,322,000, respectively and its operating income was $357,387 and $1,471,786, respectively.
See also Note 10. Commitment and Contingencies.
| 2. | Summary of Significant Accounting Policies |
A description of our significant accounting policies is included in the Form S-1 and the interim consolidated financial statements should be read in conjunction with the financial statements and accompanying notes included in our Form S-1.
Results for the nine month period ended September 30, 2012 are not necessarily indicative of the results expected for the year ending December 31, 2012.
Trading Accounts and Deposits
Cash held in trading accounts may be unavailable at times for immediate withdrawal depending upon trading activity. Cash needed to meet credit requirements and that was available for immediate withdrawal as of September 30, 2012 and December 31, 2011 was as follows:
| September 30, | December 31, | |||||||
| 2012 | 2011 | |||||||
| Credit requirement | $ | 2,511,090 | $ | 7,648,325 | ||||
| Available credit | 9,429,730 | 8,185,615 | ||||||
| Trading accounts and deposits | $ | 11,940,820 | $ | 15,833,940 | ||||
Revenue Recognition and Commodity Derivative Instruments
Wholesale Energy Trading
The Company derives revenues from trading financial and physical energy contracts. These contracts are marked to fair value each period in the accompanying consolidated balance sheets and revenues, net of costs, are recorded based on realized and unrealized gains and losses. These transactions are shown as operating activities in the consolidated statements of cash flow.
| 13 |
The Company’s wholesale trading activities also use derivatives such as swaps, forward sales contracts, futures contracts, and options to generate trading revenues and its retail activities may use such instruments to hedge the cost of energy acquired to service customers.
The Company’s agreements with the ISO’s, ICE, and NGX permit net settlement of contracts, including the right to offset cash collateral in the settlement process. Accordingly, the Company nets cash collateral against the derivative position in the accompanying consolidated balance sheets. All realized and unrealized gains and losses on derivative instruments held for trading purposes are recorded in revenues. Substantially all the Company’s revenues are generated by these trading activities.
The following table lists the gross fair values of the Company’s derivative assets and liabilities, none of which were designated as hedging instruments as of September 30, 2012 and December 31, 2011:
| September 30, | December 31, | |||||||
| 2012 | 2011 | |||||||
| Derivative Assets* | ||||||||
| Energy commodity contracts | $ | 60,656 | $ | 43,760 | ||||
| Total derivative assets | 60,656 | 43,760 | ||||||
| Derivative Liabilities* | ||||||||
| Energy commodity contracts | 37,214 | – | ||||||
| Energy commodity option contracts | 16 | 25,840 | ||||||
| Total derivative liabilities | 37,230 | 25,840 | ||||||
| Derivative assets less liabilities | 23,426 | 17,920 | ||||||
| Cash in collateral and deposit accounts | 11,917,394 | 15,816,020 | ||||||
| Trading accounts and deposits, net | $ | 11,940,820 | $ | 15,833,940 | ||||
| * Balance sheet location is trading accounts and deposits | ||||||||
Retail Energy Services
Revenue from the retail sale of electricity to retail customers is recorded in the period in which the commodity is consumed, net of any applicable sales tax. The Company follows the accrual method of accounting for revenues whereby electricity consumed by customers but not yet billed under the cycle billing method is estimated and accrued along with the related costs. Changes in estimates are reflected in operations in the period in which they are refined. Accounts receivable at September 30, 2012 include amounts billed to customers as well as approximately $50,806 of unbilled revenue.
On October 1, 2012, the Company designated certain swaps acquired on September 12, 2012 and held in its trading portfolio on September 30, 2012 as a cash flow hedge for a portion of its expected fourth quarter cash power purchases for retail.
Consulting Revenue
Revenue for consulting services is recognized when the service is performed.
| 14 |
Deferred Financing Costs
Prior to the May 10, 2012 effective date of its Notes Offering, the Company incurred certain professional fees and filing costs associated with the offering totaling $393,990. The Company has capitalized these costs and will amortize them on a monthly basis over the weighted average term of the Subordinated Notes sold, exclusive of any expected renewals. Total amortization for the three months and nine months ended September 30, 2012 was $1,714 and $1,868, respectively, and is included in other general and administrative expenses.
Foreign Currency Translation
For foreign subsidiaries whose functional currency is the local foreign currency, balance sheet accounts are translated at exchange rates in effect at the end of the month and income statement accounts are translated at average monthly exchange rates for the period. Foreign currency transactions denominated in a foreign currency result in gains and losses due to the increase or decrease in exchange rates between periods. Translation gains and losses are included as a separate component of equity. Gains and losses from foreign currency transactions are included in other income or expense.
Foreign currency transactions resulted in a loss of $75 for the three months ended September 30, 2012 and a gain of $278 for the three months ended September 30, 2011. For the nine months ended September 30, 2012 and 2011, foreign currency transaction resulted in losses of $16,739 and $68,847 respectively.
Profits Interests
Specific second-tier subsidiaries of the Company have Class B members. Under the terms of the subsidiaries’ member control agreements, Class B members have no voting rights, are not required to contribute capital, and have no rights to distributions following termination of employment, but are entitled to a defined share of profits while employed. Since Class B members have no corporate governance rights or risk of capital loss (or gain), they do not own non-controlling equity interests and profits interests payments are recorded as compensation expense during the period earned and are classified as accrued compensation on the balance sheet.
During the three and nine months ended September 30, 2012 and 2011, the Company included $669,284 and $1,848,000 and $2,168,112 and $7,944,938, respectively, in salaries, wages, and related taxes, representing the allocation of profits interests to Class B members.
Business Combinations
The Company accounts for business combinations in accordance with ASC 805, Business Combinations (“ASC 805”), which requires an acquirer to recognize and measure in its financial statements the identifiable assets acquired, the liabilities assumed, and any non-controlling interest in the acquisition at fair value at the transaction date. In addition, transaction costs are expensed as incurred. See Note 7. Intangible Assets.
Income Taxes
Except for CAN, the Company’s subsidiaries are not taxable entities for federal income tax purposes. As such, the Company does not directly pay federal income tax. Taxable income or loss, which may vary substantially from the net income or net loss reported in our consolidated statements of comprehensive income, is includable in the federal income tax returns for each member. The holder of the Company’s preferred units is taxed based on distributions received, while holders of common units are taxed on their proportionate share of the Company’s taxable income. Therefore, no provision or liability for federal or state income taxes has been made for those entities.
| 15 |
CAN files tax returns with the Canada Revenue Agency and the Tax and Revenue Administration of Alberta.
In accounting for uncertainty in income taxes, we recognize the financial statement benefit of a tax position only after determining that the relevant tax authority would more likely than not sustain the position following an audit. The Company recognizes interest and penalties on any unrecognized tax benefits as a component of income tax expense. Based on evaluation of the Company’s tax positions, management believes all positions taken would be upheld under an examination.
The Company’s federal and state tax returns are potentially open to examinations for the years 2007 through 2011 and its Canadian tax returns are potentially open to examination for the years 2008 through 2011.
Recent Accounting Pronouncements
There have been no recently issued accounting standards or pronouncements that impact the Company’s consolidated financial statements other than those disclosed in the Form S-1.
| 3. | Segment Information |
The Company has two business segments used to measure its business activity – wholesale energy trading and retail energy services:
| · | Wholesale trading activities earn revenue from trading financial and physical electricity in wholesale markets regulated by FERC. The Company also trades energy-related derivative contracts on exchanges regulated by the CFTC. |
| · | Beginning on July 1, 2012, the Company began selling electricity to residential and small commercial customers in Connecticut. |
These segments are managed separately because they operate under different regulatory structures and are dependent upon different revenue models.
The performance of each is evaluated based on the operating income or loss generated. For the third quarter of 2012, there were no internal transactions between reportable segments.
| 16 |
Information on segments for and at the three month period ended September 30, 2012 is as follows:
| Wholesale Energy Trading | Retail Energy Services | Consolidated Total | ||||||||||
| Three Months Ended September 30, 2012 | ||||||||||||
| Revenue* | $ | 4,995,691 | $ | 134,650 | $ | 5,130,341 | ||||||
| Costs of retail electricity sold | – | 113,273 | 113,273 | |||||||||
| Salaries, wages, and related taxes | 1,034,579 | 55,940 | 1,090,519 | |||||||||
| Professional fees | 655,739 | 127,880 | 783,619 | |||||||||
| Other general and administrative | 707,504 | 68,992 | 776,496 | |||||||||
| Trading tools and subscriptions | 213,094 | 8,870 | 221,964 | |||||||||
| Operating expenses | 2,610,916 | 374,955 | 2,985,871 | |||||||||
| Operating income (loss) | $ | 2,384,775 | $ | (240,305 | ) | $ | 2,144,470 | |||||
| Capital expenditures | $ | 122,224 | $ | 160,000 | $ | 282,224 | ||||||
| At September 30, 2012 | ||||||||||||
| Identifiable Assets | ||||||||||||
| Trading accounts and deposits | $ | 11,900,179 | $ | 40,641 | $ | 11,940,820 | ||||||
| Accounts receivable - trade | 1,565,063 | 134,148 | 1,699,211 | |||||||||
| Equipment and furniture, net | 617,596 | 6,710 | 624,306 | |||||||||
| Intangible assets, net | – | 142,663 | 142,663 | |||||||||
| Subtotal | $ | 14,082,838 | $ | 324,162 | 14,407,000 | |||||||
| Corporate Assets | ||||||||||||
| Cash | 1,357,453 | |||||||||||
| Prepaid expenses and other assets | 110,419 | |||||||||||
| Deferred financing costs, net | 392,122 | |||||||||||
| Total | $ | 16,266,994 | ||||||||||
*Wholesale energy revenue is net of costs.
| 4. | Financial Instruments |
The Company holds various financial instruments. The nature of these instruments and the Company’s operations expose the Company to foreign currency risk, fair value risk, and credit risk.
A portion of the Company’s assets and liabilities are denominated in Canadian dollars (“C$”) and are subject to fluctuations in exchange rates. The Company does not have any exposure to any highly inflationary foreign currencies.
The fair values of the Company’s cash, accounts receivable, and accounts payable were considered to approximate their carrying values at September 30, 2012 and December 31, 2011 due to the immediate and short-term nature of the accounts. The fair value of related party notes payable may be different from their carrying values. No assessment of the fair value of these obligations has been completed and there is no readily available market price. However, management believes that the carrying values are a reasonable approximation of fair value at September 30, 2012 and December 31, 2011.
| 17 |
Management believes the carrying values of the Company’s notes payable, renewable unsecured subordinated notes, and redeemable preferred units reasonably approximate their fair value at September 30, 2012 and December 31, 2011 due to the relatively new age of these particular instruments.
| 5. | Concentrations of Credit Risk |
Financial instruments that subject the Company to concentrations of credit risk consist principally of trading accounts and deposits and accounts receivable. The Company has a risk policy that includes value at risk calculations, position limits, stop loss limits, stress testing, system controls, position monitoring, liquidity guidelines and compliance training.
Since the Company clears all of its wholesale trading transactions through various exchanges, at any given time there may be a concentration of balances with any one of the exchanges. There was one account with a receivable balance greater than 10% that aggregated 86% of total consolidated accounts receivable as of September 30, 2012. There were three individual accounts with receivable balances greater than 10% that aggregated 100% of total consolidated accounts receivable as of December 31, 2011. The Company believes that any risk associated with these concentrations would be minimal, if any.
| 6. | Fair Value Measurements |
The Fair Value Measurement Topic of FASB’s ASC establishes a fair value hierarchy that prioritizes the inputs to valuation techniques used to measure fair value. The three levels of the fair market hierarchy are as follows:
| · | Level 1 inputs are quoted prices in active markets for identical assets or liabilities. |
| · | Level 2 inputs are inputs other than quoted prices in active markets that are observable for the asset or liability, either directly or indirectly. |
| · | Level 3 inputs are unobservable inputs for which little or no market data exists. |
Determination of fair value for electricity derivative contracts is complex and relies on judgments concerning future prices, volatility, and liquidity, among other factors. All of the derivatives traded by the Company are traded on exchanges with quoted market prices for identical instruments. There have been no changes in the methodologies used since December 31, 2011.
The methods described above may produce a fair value calculation that may not be indicative of net realizable value or reflective of future fair values. Furthermore, while the valuation methods are considered appropriate and consistent with other market participants, the use of different methodologies or assumptions to determine the fair value of certain financial instruments could result in a different fair value measurement at the reporting date.
| 18 |
The following table presents the amounts of assets measured at fair value on a recurring basis as of:
| Level 1 | Level 2 | Level 3 | Total | |||||||||||||
| September 30, 2012 | ||||||||||||||||
| Trading accounts and deposits | $ | 11,940,820 | $ | – | $ | – | $ | 11,940,820 | ||||||||
| December 31, 2011 | ||||||||||||||||
| Trading accounts and deposits | $ | 15,833,940 | $ | – | $ | – | $ | 15,833,940 | ||||||||
| 7. | Intangible Assets |
On June 29, 2012, TCP acquired certain assets and the business of Community Power & Utility LLC (“CP&U”), a retail energy supplier serving residential and small commercial markets in Connecticut, for $160,000. The business has been re-named “Town Square Energy” and is run as an accounting division of TCP. Of the purchase price, $85,000 was allocated to the acquisition of an existing service contract with an industry-specific provider of transaction management, billing, and customer information software and services, and $75,000 was allocated to customer relationships.
The fair value of these intangible assets was based on significant inputs that are not observable in the market and thus represent a Level 3 measurement as defined in ASC 820. The fair value of the service contract was based on the replacement price and will be amortized over twenty-three months, its useful life, using the straight-line method. Customer relationships were valued using a variation of the income approach. Under this approach, the present value of expected future cash flows resulting from the relationships is used to determine the fair value which will be amortized over a three year period using the straight-line method.
Total amortization for the three months and nine months ended as of September 30, 2012 was $17,337 and is included in other general and administrative expenses.
| 19 |
| 8. | Debt |
Notes payable by the Company are summarized as follows:
| September 30, 2012 | December 31, 2011 | |||||||
| Note payable to HTS (as defined below), dated October 1, 2011, quarterly payments of principal of $485,751 plus interest at 15% per annum until maturity on October 1, 2013 with a balloon principal payment of $1,943,004. | $ | 4,371,763 | $ | 5,343,265 | ||||
| Note payable to John O. Hanson, a related party, dated April 8, 2011, accruing interest at 20%. The loan is payable on demand or on December 31, 2012. | 200,000 | 200,000 | ||||||
| Note payable to Patrick C. Sunseri, an employee and related party, dated July 16, 2009, monthly payments of $166,667 plus interest at 15% per annum until April 1, 2013. This note is secured by all cash, accounts receivable, and other assets of TCP and is personally guaranteed by one member of TCPH. | 1,166,666 | 2,000,000 | ||||||
| Loan agreements, third party, accruing interest at 20%. The loans were converted to redeemable preferred units effective January 31, 2012. See Note 9. Ownership, Redeemable Preferred Units. | – | 2,745,000 | ||||||
| Renewable Unsecured Subordinated Notes, see below. | 1,261,938 | – | ||||||
| $ | 7,000,367 | $ | 10,288,265 | |||||
Notes payable by maturity are summarized as follows:
| September 30, 2012 | December 31, 2011 | |||||||
| 2012 or on demand | $ | 1,322,844 | $ | 6,402,253 | ||||
| 2013 to September 30 | 1,991,067 | – | ||||||
| Current maturities | 3,313,911 | 6,402,253 | ||||||
| 2013 after September 30 | 2,914,510 | 3,886,012 | ||||||
| 2014 | 203,000 | – | ||||||
| 2015 | 148,946 | – | ||||||
| 2016 | 225,000 | – | ||||||
| 2017 & thereafter | 195,000 | – | ||||||
| Long term debt | 3,686,456 | 3,886,012 | ||||||
| Total | $ | 7,000,367 | $ | 10,288,265 | ||||
| 20 |
The Margin Agreement
In February 2012, the Company executed a Futures Risk-Based Margin Finance Agreement (“Margin Agreement”) with ABN AMRO. The Margin Agreement provides CEF with an uncommitted $25,000,000 revolving line of credit on which it pays a commitment fee of $35,000 per month. Any loans outstanding are payable on demand and bear interest at an annual rate equal to 1.00% in excess of the Federal Funds Target Rate, or approximately 1.25%. The Margin Line is secured by all balances in CEF’s trading accounts with ABN AMRO. Under the Margin Agreement, the Company is also subject to certain reporting, affirmative, and negative covenants, including certain financial tests.
As of September 30, 2012, there were no borrowings outstanding under the Margin Agreement and the Company was in compliance with all covenants. See Borrowings from HTS for certain restrictions on the Margin Agreement not imposed by ABN AMRO, but in connection with an amendment to the HTS Note.
Borrowings from HTS
Between 2006 and 2010, TCP borrowed a total of $30,800,000 from the HTS Parties. HTS was a member of the Company and a related party until March 23, 2011 when its membership interests were re-purchased by the Company.
In May 2010, the HTS Parties called the loans, the outstanding balance of which was $28,550,000 as of December 31, 2010. On March 11, 2011 the parties reached a Settlement Agreement that defined terms of repayment, as well as provided for a binding arbitration procedure to resolve other outstanding disputes. By July 1, 2011, the Company had repaid the entire principal balance outstanding, paid accrued interest of $1,640,958, and reduced the HTS Parties capital account balance by a payment of $1,000,000. Following resolution of the dispute between the HTS Parties and the Company, all amounts owed to the HTS Parties as of September 30, 2011, including the HTS Parties’ remaining capital account balance, unpaid interest, and legal fees were converted into a new $5,829,017 note dated October 1, 2011 (the “HTS Note”).
The HTS Note contains certain affirmative and negative covenants including delivery of quarterly and annual financial statements and annual tax returns, maintenance of business, and restrictions on additional indebtedness, as well as specifying certain events of default. The HTS Note is jointly and severally guaranteed as to payment of up to $3,711,486 by Timothy Krieger and Michael Tufte. Initially, the HTS Note was payable in twelve equal quarterly installments of principal of $485,751 plus interest at 15% per annum until maturity on October 1, 2014. However, on February 20, 2012, the HTS Note was amended to accommodate the Margin Agreement as follows:
| · | CEF may not draw more than $7,000,000 until the Note is paid in full; |
| · | CEF must maintain not less than $3,000,000 in its ABN AMRO account; |
| · | The Company shall retain as capital all funds drawn under the Margin Agreement until the HTS Note is paid in full; |
| · | The Company shall not distribute to its members, directly or indirectly, any of the proceeds of the Margin Agreement; |
| · | The Company shall maintain a separate accounting with respect to the withdrawal and use of funds; and |
| · | The maturity date of the HTS Note was shortened by one year to October 1, 2013, and consequently, the Company shall make a balloon principal payment of $1,943,004 at maturity. |
As of September 30, 2012 and December 31, 2011, the Company was in compliance with all covenants with respect to the HTS Note.
| 21 |
Related Party Indebtedness
On May 21, 2012, TCP and Patrick C. Sunseri entered into a First Amendment to the Loan Agreement, Secured Promissory Note, and Security Agreement dated July 16, 2009 (the “Sunseri Loan”). The Amendment changes the annual interest rate to the lower of 15% or the highest rate permitted by law, provides for the repayment of the Loan’s principal and interest over a twelve month period beginning May 1, 2012, adds TCPH as a corporate guarantor with respect to TCP’s obligations to Mr. Sunseri, and adds certain financial covenants and events of default.
At September 30, 2012 and December 31, 2011, the Company was not in compliance with all of the covenants on the Sunseri Loan and they were not enforced by the lender. Moreover, none of the technical defaults were waived as the Company did not seek waiver.
Renewable Unsecured Subordinated Notes
On May 10, 2012, the Company’s registration statement on Form S-1 with respect to its offering of up to $50,000,000 of 3 and 6 month and 1, 2, 3, 4, 5, and 10 year Renewable Unsecured Subordinated Notes was declared effective by the SEC.
As of September 30, 2012, the Company had $1,261,938 of its Subordinated Notes outstanding as follows:
| Initial Term | Principal Amount | Weighted Average Interest Rate | ||||||
| 3 months | $ | 123,015 | 6.45 | % | ||||
| 6 months | 23,000 | 7.00 | % | |||||
| 1 year | 343,977 | 10.11 | % | |||||
| 2 years | 203,000 | 11.06 | % | |||||
| 3 years | 248,946 | 12.72 | % | |||||
| 4 years | 125,000 | 13.24 | % | |||||
| 5 years | 35,000 | 12.00 | % | |||||
| 10 years | 160,000 | 13.69 | % | |||||
| Total | $ | 1,261,938 | 11.18 | % | ||||
| Weighted average term | 36.3 mos | |||||||
Interest is paid monthly, quarterly, semi-annually, annually, or at maturity at the sole discretion of each investor. The Company made interest payments on the Subordinated Notes for the three and nine months ended September 30, 2012 of $4,381 and $4,517, respectively. Total accrued interest on the Subordinated Notes at September 30, 2012 was $21,334.
| 22 |
| 9. | Ownership |
Redeemable Preferred Units
Effective January 31, 2012, TCP, a wholly-owned subsidiary of the Company, sold certain financial rights to 496 of its new issue units to John O. Hanson for a purchase price of $2,745,000, paid by conversion of certain notes payable to him. These redeemable preferred membership units (the “preferred units”) are cumulative and incorporate a defined return, are not convertible, and have no corporate governance rights. Holders of the common units control all corporate governance rights and own the residual financial interest.
From the effective date to the redemption date, TCP shall make a guaranteed payment or distribution of $45,750 per month to Mr. Hanson or his designee. At any time prior to December 31, 2013, TCP may repurchase the preferred units for the sum of $2,745,000. If TCP does not repurchase the preferred units prior to such date, Mr. Hanson may require Timothy S. Krieger, TCP’s Chief Executive Officer, to purchase the preferred units on such date. Should TCP default on its obligations to Mr. Hanson, payment of all specified amounts has been personally guaranteed by Mr. Krieger.
Effective July 1, 2012, Mr. Hanson’s preferred units in TCP were exchanged for preferred units issued by the Company with identical financial rights and terms.
Common Equity
As of September 30, 2012, ownership of the Company’s common units was as follows:
| Common | ||||||||
| Member | Units held | Percent of class | ||||||
| Timothy S. Krieger | 4,435 | 89.42 | % | |||||
| DBJ 2001 Holdings, LLC | 525 | 10.58 | % | |||||
| Total | $ | 4,960 | 100.00 | % | ||||
| 10. | Commitments and Contingencies |
FERC Investigation
On October 12, 2011, FERC initiated a formal non-public investigation into TCE’s power scheduling and trading activity in MISO for the period from January 1, 2010 through May 31, 2011. Depending on the investigation’s outcome, the Company may be liable for legal fees, potential disgorgement of profits, and possible civil penalties. Since the investigation is still ongoing, the Company is unable to determine the likelihood of an unfavorable outcome or the amount or range of any potential loss, other than the expenditure of legal fees for defense, which are being expensed as incurred.
| 23 |
Former Employee Litigation
On February 1, 2011, the Company commenced a major restructuring of the operations of CAN and all personnel were terminated, although several were subsequently re-hired. During the course of 2011, three former employees commenced legal proceedings and brought separate summary judgment applications seeking damages aggregating C$3,367,000 for wrongful dismissal and payment of performance bonuses. One former employee sought and obtained an injunction to freeze certain hank accounts utilized by CAN containing approximately C$1,814,000. Although the initial injunction was set aside, another former employee obtained an attachment order and the funds remained in trust. The Company filed counterclaims aggregating C$3,096,000 against two of the former employees for losses suffered, inappropriate expenses, and related matters.
Two of the three summary judgment applications were dismissed on January 12, 2012. On April 2, 2012, the Company won its appeal of the attachment order and the funds in trust were released. The total returned was C$1,829,000. All three summary judgment applications were appealed and were heard on July 4, 5, and 6, 2012 by the Alberta Court of Queen's Bench.
On July 6, 2012, the court dismissed two of the three applications and allowed the third, awarding summary judgment against CAN for a portion of the claim amounting to C$1,376,726. The remainder of the allowed application was ordered to be assessed at a trial. The Company is in the process of appealing the allowed application to the Alberta Court of Appeal.
As discussed in Note 1. Business, Cessation of Canadian Operations, on September 14, 2012, TCE ceased all operations of CAN. In conjunction therewith, and since there were no material assets of CAN available as of either the date of the judgment award or September 14 to satisfy any amount of claim that might be enforceable against CAN, the Company reduced its accrual related to the litigation by C$1,548,570 during the third quarter.
Although it is management's opinion that the ultimate resolution of the litigation arising as a result of the reorganization of CAN will not have a material effect on its financial position, results of operations, or liquidity, it is possible that this assessment could change by an amount that could be material. Due to the uncertainty surrounding the outcome of the litigation, including that of its counterclaims against the former employees, the Company is presently unable to determine a range of reasonably possible outcomes.
PJM Resettlement
On May 11, 2012, the FERC issued an order denying rehearing motions in regards to PJM resettlement fees confirming its intent to reverse refunds it had granted to a number of market participants in a 2009 order. These refunds were related to transmission line loss refunds issued to the Company by PJM for prior periods. On June 15, 2012 the Company filed a motion for stay pending appeal to FERC; the stay request was denied on July 3, 2012. The Company also filed a stay pending appeal with the U.S. Court of Appeals on June 27, 2012; on July 6, 2012 this request was also denied. Consequently, pursuant to the May 11, 2012 order, the Company was required to return $782,000 to PJM. This amount was included in accounts payable as of June 30, 2012 and was paid in full in July 2012.
| 24 |
On July 9, 2012, several parties filed a petition for review of the May 11, 2012 FERC order with the District of Columbia Circuit of the U.S. Court of Appeals. The due date for intervention in this proceeding was August 8, 2012 and certain affiliates of TCPH filed motions to intervene in this proceeding as they were not named parties. The case is currently being briefed before the Court of Appeals and final briefs are due by the end of 2012. If FERC’s order is overturned on appeal, some or all of the funds paid to PJM in July 2012 could be returned to the Company. Due to the uncertainty surrounding the outcome of the appeals process, the Company is presently unable to determine a reasonable estimate of the amount that could be returned; however, if the appeal is successful, the amount due to the Company could have a material effect on the financial statements.
Guarantees
TCPH has provided guarantees of $2,800,000 for future obligations of TCP, SUM, and CEF with respect to their participation in MISO and PJM and also guarantees $5,000,000 of future obligations of TCE with respect to its participation in ERCOT. The Company has also guaranteed payment of TCP’s obligations with respect to the Sunseri loan.
| 11. | Subsequent Events |
From September 30 to November 12, 2012, the Company sold additional Subordinated Notes totaling $178,244 with a weighted average term of 34.7 months and bearing a weighted average interest rate of 12.23%.
On November 12, 2012 a letter from the Minnesota Department of Revenue was received notifying the Company that TCP’s 2009, 2010, and 2011 returns are under review by the Department.
The Company has evaluated subsequent events occurring through the date that the financial statements were issued.
| 25 |
Item 2 - Management’s Discussion and Analysis of Financial Condition and Results of Operations
The following discussion should be read in conjunction with our consolidated financial statements, notes to those statements, Management’s Discussion and Analysis of Financial Condition and Results of Operations from our Form S-1, and the other financial information appearing elsewhere in this report. In addition to historical information, the following discussion and other parts of this Form 10-Q contain forward-looking information that involves risks and uncertainties. Readers are cautioned that forward-looking statements should be read in conjunction with our disclosures in this Form 10-Q under the heading “Forward-Looking Statements” located on page 6 and the “Risk Factors” section beginning on page 10 of our Form S-1.
The risks and uncertainties described in this Form 10-Q and our Form S-1 are not the only risks facing our Company. Additional risks and uncertainties that we are not presently aware of, or that we currently consider immaterial, may also affect our business operations. Our business, financial condition, or results of operations could suffer if the risks set forth are realized.
Industry Background
By virtually any measure, the electric power industry in the U.S. is huge. According to the EIA’s Electric Sales, Revenue, and Average Price report released on September 27, 2012 and summarized below, in 2011, the industry generated and sold 3,750 GWh (up 11% from 2010) for a little more than $371 billion (up 14%) to over 144 million customers (up 4%).
| U.S. Electric Customers, Unit Sales, Revenue, and Average Retail Price By Customer and Ownership Types, 2011 | ||||||||||||||||||||||||||||||||||||
| Utilities | Customers | Unit Sales | Revenues | Avg Retail Price | ||||||||||||||||||||||||||||||||
| Count | Pct | 000s | Pct | GWh | Pct | $Ms | Pct | (¢/kWh) | ||||||||||||||||||||||||||||
| By Customer Type | ||||||||||||||||||||||||||||||||||||
| Residential | 126,143 | 87.3 | % | 1,423 | 37.9 | % | 166,714 | 44.9 | % | 11.72 | ||||||||||||||||||||||||||
| Commercial | 17,638 | 12.2 | % | 1,328 | 35.4 | % | 135,926 | 36.6 | % | 10.23 | ||||||||||||||||||||||||||
| Industrial | 728 | 0.5 | % | 991 | 26.4 | % | 67,606 | 18.2 | % | 6.82 | ||||||||||||||||||||||||||
| Transportation | 0 | 0.0 | % | 8 | 0.2 | % | 803 | 0.2 | % | 10.46 | ||||||||||||||||||||||||||
| Total | 144,509 | 100.0 | % | 3,750 | 100.0 | % | 371,049 | 100.0 | % | 9.90 | ||||||||||||||||||||||||||
| By Ownership | ||||||||||||||||||||||||||||||||||||
| Investor | 214 | 6.9 | % | 91,427 | 63.3 | % | 2,029 | 54.1 | % | 203,546 | 54.9 | % | 10.03 | |||||||||||||||||||||||
| Power Marketers (1) | na | – | 13,379 | 9.3 | % | 703 | 18.7 | % | 71,101 | 19.2 | % | 10.12 | ||||||||||||||||||||||||
| Public | 1,949 | 63.0 | % | 21,080 | 14.6 | % | 561 | 15.0 | % | 53,709 | 14.5 | % | 9.57 | |||||||||||||||||||||||
| Cooperative | 924 | 29.9 | % | 18,585 | 12.9 | % | 413 | 11.0 | % | 40,812 | 11.0 | % | 9.88 | |||||||||||||||||||||||
| Federal | 6 | 0.2 | % | 39 | 0.0 | % | 44 | 1.2 | % | 1,880 | 0.5 | % | 4.32 | |||||||||||||||||||||||
| Total | 3,093 | 100.0 | % | 144,509 | 100.0 | % | 3,750 | 100.0 | % | 371,049 | 100.0 | % | 9.90 | |||||||||||||||||||||||
Notes
1 - Includes power marketers and other energy retailers that may not be required to file reports with the EIA
Source
U.S. EIA; 2011 Electric Sales, Revenue, and Average Price; released September 27, 2012
Electric power in commercial quantities, unlike other energy commodities such as coal or natural gas, cannot be stored, i.e., the supply must be produced or generated exactly when used or demanded by customers. Further, the laws of physics dictate that power flows within a network along the lines of least resistance, not necessarily where we may want it to go. These facts have obvious implications for electricty regulations and market structures.
| 26 |
Today, the industry includes any entity producing, selling, or distributing electricity. Participants include investor-owned, publicly-owned, cooperative, and federal utilities. Additionally, non-utility power producers include both independent power producers and customer-owned generation facilities. Power marketers and energy service providers do not own any generation but buy and sell in wholesale and retail markets. Finally, participants in wholesale power markets include banks, hedge funds, private equity firms, and trading houses.
The investor-owned portion of the industry has been undergoing a massive restructuring process since the passage of the Public Utilities Regulatory Policy Act of 1978. PURPA stimulated development of renewable energy sources and co-generation and laid the groundwork for deregulation and competition by opening wholesale power markets to non-utility producers of electricity for the first time. Since PURPA, the nation has moved from a system of vertically integrated, natural monopolies providing retail service at state-determined, cost-based rates to one where prices at the wholesale level are determined by market forces, subject to a federal regulatory framework focused on ensuring fair competition and reliability of supply. In addition, some states have restructured their markets such that electricity consumers are allowed to choose their supplier, but most states continue to regulate their utilities under the traditional cost-based framework.
After PURPA, the Energy Policy Act of 1992 was the next major legislative step towards full deregulation of wholesale power markets and in 1996, FERC issued Orders 888 and 889, which led to the creation of the network of Open Access Same-Time Information System nodes, which allowed for energy to be scheduled across multiple power systems. In December 1999, FERC issued Order 2000 calling for electric utilities to form RTOs or ISOs to operate the nation’s bulk power system with the intended benefits of eliminating discriminatory access to transmission for all generators, improving operating efficiency, and increasing system reliability. ISOs are typically not-for-profit entities using governance models developed by FERC.
In addition to controlling the physical flow of power within its area of responsibility, many ISOs also operate wholesale markets for real-time and day-ahead electricity, as well as ancillary services required to ensure system reliability. To date, seven ISOs have been formed in the U.S. In the parts of the country where ISOs have not been established, active wholesale markets are still present, although they operate with different structures.
Trading activity in ISO markets is often characterized by the acquisition of electricity at a given location such as a node or hub and its delivery to another. Financial or “virtual” transactions settle in cash in an amount equal to the difference between the purchase and sale prices, while physical transactions are settled by the delivery of the electricity itself, but in either case, the ISO serves as the counter-party and central clearinghouse for all trades.
In addition to the markets operated by the ISOs, derivative financial contracts such as swaps, options, and futures keyed to a wholesale electricity price are traded over-the-counter and on regulated exchanges, including ICE, NGX, and CME. Derivative contracts are available for many terms and pricing points and always settle in cash with profit or loss determined by price movements in the underlying commodity, whether it be electricity or another energy commodity such as natural gas or crude oil.
In general, trading physical energy requires more capital than financial trades since electricity must be purchased and paid for in a week or so, while the corresponding receivable may not be collected for as long as 60 days. In any case, participants are typically required to place cash collateral with market operators or brokers in order to trade, with the specific amounts depending upon the rules of the particular market.
| 27 |
In the short term, wholesale electricity price levels and changes are driven by supply and demand. Demand is affected by the weather while supply is driven by generation and transmission outages and fuel prices, particularly for natural gas, as it is the fuel of choice for marginal generation requirements. Factors that affect electricity prices in the long term include climate, fuel prices and availability, generation and efficiency technologies deployed, population growth, economic activity, and governmental policies and regulatory actions with respect to energy and the environment.
| 28 |
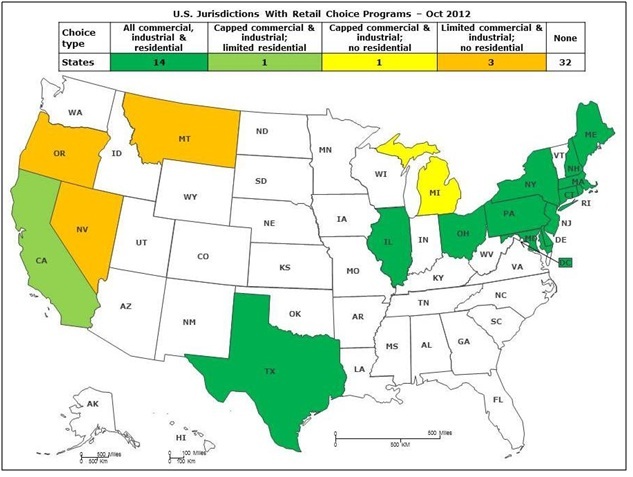
In the retail electricity markets, under the traditional system, a vertically integrated utility is responsible for serving all consumers in a defined territory and customers are obligated to pay the regulated rate for their class of service. However, in a jurisdiction with a restructured or deregulated market, that is, one with retail choice, the generation, transmission, distribution, and retail marketing functions of utilities are legally separated and pricing is unbundled.
The regulated portions of formerly integrated investor-owned utilities, now generally known as electric or local distribution companies, are still responsible for delivering power, billing consumers, and resolving service issues, but from the customer’s point of view, they are no longer captive to the local utility for generation service but rather are free to purchase their energy from any licensed supplier via competitive market mechanisms.
Today, 14 years after Massachusetts and Rhode Island became the first states to effectively implement choice in 1998, 18 states and the District of Columbia have some form of choice.
| 29 |
Company Overview
TCPH was formed as a Minnesota limited liability company on December 30, 2009. On December 31, 2011, TCPH received all of the outstanding membership interests of TCP, CP, and TCE in exchange for issuing ownership interests in TCPH. Through these subsidiaries, we trade financial and physical electricity contracts in North American wholesale markets regulated by FERC and operated by ISOs and RTOs and energy derivative contracts on exchanges regulated by the CFTC, including ICE, NGX, and CME. The Company is also authorized by DOE to export electricity to Canada and is licensed by the state of Connecticut as an electric supplier to retail customers.
Wholesale Energy Trading
Generally, our greatest opportunities for profitable trades occur during periods of market turbulence, when the forecast for supply or demand is more likely to be inaccurate. When demand for energy is relatively stable, price variations tend to be small or non-existent. During periods of market turbulence, prices tend to be volatile, which give our traders the opportunity to take advantage of such volatility. Furthermore, our revenue is limited to some extent by the amount of collateral we have posted with a market operator or exchange as well the mix between physical and financial contracts. Our primary costs in generating revenue are compensation of our energy traders as well as the interest expense of obtaining the capital necessary to post collateral.
The table below presents a breakdown of our trading volume on FERC-regulated markets between physical and financial transactions for the periods indicated:
| Three Months Ended September 30, | Nine Months Ended September 30, | |||||||||||||||
| Percentage of total trading volume | 2012 | 2011 | 2012 | 2011 | ||||||||||||
| Physical | 0.4 | % | 0.7 | % | 0.1 | % | 2.5 | % | ||||||||
| Financial | 99.6 | % | 99.3 | % | 99.9 | % | 97.5 | % | ||||||||
| Total | 100.0 | % | 100.0 | % | 100.0 | % | 100.0 | % | ||||||||
| 30 |
The following table details our open derivative contracts as of September 30, 2012:
| Open Contracts as of September 30, 2012 | ||||||||||||||||||||||||||||
| Contract | Contract | Contract Dates | Number | Fair Value | ||||||||||||||||||||||||
| Type | Commodity | Hub | Start | End | Settlement | of Lots | Asset | Liability | ||||||||||||||||||||
| OTC Swap | Electricity | MISO Indiana Hub | Daily | Daily | Daily | 4 | $ | 8,024 | $ | 1,216 | ||||||||||||||||||
| OTC Swap | Electricity | PJM West Hub | Daily | Daily | Daily | 12 | 36,680 | 13,304 | ||||||||||||||||||||
| OTC Swap | Electricity | PJM AD Hub | Daily | Daily | Daily | 52 | 112 | 2,304 | ||||||||||||||||||||
| OTC Swap | Electricity | ISO-NE Mass Hub | 10/01/12 | 10/31/12 | 11/05/12 | 115 | – | 12,494 | ||||||||||||||||||||
| OTC Swap | Electricity | ISO-NE Mass Hub | 11/01/12 | 11/30/12 | 12/05/12 | 105 | – | 7,896 | ||||||||||||||||||||
| OTC Swap | Electricity | ISO-NE Mass Hub | 12/01/12 | 12/31/12 | 01/05/13 | 100 | 15,840 | – | ||||||||||||||||||||
| Option | Electricity | PJM West Hub | Daily | Daily | Daily | 2 | – | 16 | ||||||||||||||||||||
| Totals | $ | 60,656 | $ | 37,230 | ||||||||||||||||||||||||
In its retail business, the Company is exposed to volatility in the cash cost of the energy acquired for sale to customers. On October 1, 2012, the Company designated the ISO-NE Mass Hub swaps detailed above as a cash flow hedge for a portion of its expected fourth quarter cash power purchases for retail.
The following table details our open derivative contracts held for trading purposes as of December 31, 2011:
| Open Contracts as of December 31, 2011 | ||||||||||||||||||||||||||||
| Contract | Contract | Contract Dates | Number | Fair Value | ||||||||||||||||||||||||
| Type | Commodity | Hub | Start | End | Settlement | of Lots | Asset | Liability | ||||||||||||||||||||
| OTC Swap | Electricity | MISO Indiana Hub on peak | Daily | Daily | Daily | 27 | $ | 30,712 | $ | 1,520 | ||||||||||||||||||
| OTC Swap | Electricity | PJM West Hub | Daily | Daily | Daily | 100 | 11,608 | 24,320 | ||||||||||||||||||||
| OTC Swap | Electricity | MISO Indiana Hub off peak | Daily | Daily | Daily | 16 | 1,440 | – | ||||||||||||||||||||
| Totals | $ | 43,760 | $ | 25,840 | ||||||||||||||||||||||||
Retail Energy Services
We entered the retail energy services business on June 29, 2012 via the CP&U/TSE transaction and beginning in July 2012, we started selling electricity purchased in the New England wholesale market to both residential and small commercial customers in Connecticut. We primarily use direct marketing strategies to sell our services and our customer’s may typically cancel their contracts at any time.
Cessation of Canadian Operations
On February 1, 2011, TCPH commenced a major restructuring of Twin Cities Power - Canada, Ltd., the wholly-owned subsidiary of TCE and a second-tier subsidiary of the Company ("CAN"). During the third quarter of 2012, after review of the progress of the restructuring and the outlook for the subsidiary, management concluded that it was unlikely that CAN would ever be able to provide an adequate return. Consequently, on September 5, 2012, TCE resolved that CAN should cease operations. All trading accounts and fixed assets were transferred to CTG (a subsidiary of TCP), the office lease was abandoned, the process of canceling or withdrawing its permits and licenses issued by Canadian energy regulatory authorities was initiated, and substantially all accounts, both external and intercompany, were closed.
During the three and nine months ended September 30, 2012, net revenue for CAN was $140,000 and $1,098,000, respectively, and operating income was $1,899,055 and $2,963,664, respectively. Operating income in both the three and nine month periods was positively impacted by the reversal of compensation accruals for former employees totaling $2,361,685 ($779,762 in the second quarter and $1,581,923 in the third quarter). Without such reversals, operating income in the three and nine month periods would have been $317,132 and $301,979, respectively.
For the three and nine months ended September 30, 2011, CAN's net revenues were $1,146,000 and $6,322,000, respectively and its operating income was $357,387 and $1,471,786, respectively.
| 31 |
Results of Operations
Three Months Ended September 30, 2012 and 2011
The following table sets forth selected financial data for the periods indicated, which has been derived from the consolidated financial statements included elsewhere in this report:
| For The Three Months Ended September 30, | ||||||||||||||||||||||||
| Dollars in thousands | 2012 | 2011 | Increase (decrease) | |||||||||||||||||||||
| Dollars | Percent | Dollars | Percent | Dollars | Percent | |||||||||||||||||||
| Revenue | ||||||||||||||||||||||||
| Wholesale trading revenue, net | $ | 4,996 | 97.4 | % | $ | 6,849 | 100.0 | % | $ | (1,853 | ) | -27.1 | % | |||||||||||
| Retail electricity revenue | 134 | 2.6 | % | – | 0.0 | % | 134 | na | ||||||||||||||||
| Consulting fees | – | 0.0 | % | – | 0.0 | % | – | na | ||||||||||||||||
| Net revenue | 5,130 | 100.0 | % | 6,849 | 100.0 | % | (1,719 | ) | -25.1 | % | ||||||||||||||
| Operating expenses | ||||||||||||||||||||||||
| Cost of retail electricity sold | 113 | 2.2 | % | – | 0.0 | % | 113 | na | ||||||||||||||||
| Salaries, wages & related | 1,091 | 21.3 | % | 4,229 | 61.7 | % | (3,138 | ) | -74.2 | % | ||||||||||||||
| Professional fees | 784 | 15.3 | % | 874 | 12.8 | % | (90 | ) | -10.3 | % | ||||||||||||||
| Other general & administrative | 776 | 15.1 | % | 382 | 5.5 | % | 394 | 103.1 | % | |||||||||||||||
| Trading tools & subscriptions | 222 | 4.3 | % | 333 | 4.9 | % | (111 | ) | -33.3 | % | ||||||||||||||
| Total operating expenses | 2,986 | 58.2 | % | 5,818 | 84.9 | % | (2,832 | ) | -48.7 | % | ||||||||||||||
| Operating income | 2,144 | 41.8 | % | 1,031 | 15.1 | % | 1,113 | 107.9 | % | |||||||||||||||
| Interest expense | (248 | ) | -4.8 | % | (256 | ) | -3.8 | % | 8 | -3.0 | % | |||||||||||||
| Interest income | 6 | 0.1 | % | 8 | 0.1 | % | (2 | ) | -25.0 | % | ||||||||||||||
| Loss on foreign currency exchange | – | 0.0 | % | – | 0.0 | % | – | na | ||||||||||||||||
| Other income expense, net | (242 | ) | -4.7 | % | (248 | ) | -3.8 | % | 6 | -2.3 | % | |||||||||||||
| Income before income taxes | 1,902 | 37.1 | % | 783 | 11.3 | % | 1,119 | 142.9 | % | |||||||||||||||
| Income tax provision (benefit) | (34 | ) | -0.6 | % | 74 | 1.0 | % | (108 | ) | -145.9 | % | |||||||||||||
| Net income | 1,936 | 37.7 | % | 709 | 10.3 | % | 1,227 | 173.1 | % | |||||||||||||||
| Preferred distributions | (137 | ) | -2.6 | % | – | 0.0 | % | (137 | ) | na | ||||||||||||||
| Net income attributable to common | 1,799 | 35.1 | % | 709 | 10.3 | % | 1,090 | 153.8 | % | |||||||||||||||
| Foreign currency translation adjustment | (9 | ) | -0.2 | % | (78 | ) | -1.1 | % | 69 | -88.0 | % | |||||||||||||
| Comprehensive income | $ | 1,790 | 34.9 | % | $ | 631 | 9.2 | % | 1,159 | 183.8 | % | |||||||||||||
Wholesale trading revenue, net: In our wholesale trading business, we record revenues based upon changes in the fair values of the contracts we trade, net of costs. The initial recognition of fair value and subsequent changes in fair value affect reported earnings in the period the change occurs. The fair values of instruments that remain open at a balance sheet date represent unrealized gains or losses.
On a wholesale level, electricity prices are highly correlated with natural gas, particularly in our key eastern markets, where it is the marginal fuel of choice for most generation. Energy market conditions during the third quarter of 2012 were characterized by slightly warmer than normal weather and cheap and ample natural gas supplies, which suppresses prices. While some volatility, as measured by the coefficient of variation, returned to the market during the quarter, it was still 26% lower than the same period last year. Furthermore, price levels were about 16% lower than those of the third quarter of 2011. For example, according to the NOAA and EIA:
| 32 |
| · | U.S. cooling degree-days during the period totaled 888 compared a normal (1980-2009 average) of 810, making the period about 10% warmer than normal and 3% cooler than last year’s 913 CDD; |
| · | For the quarter, weekly natural gas storage levels were 15% more than last year and 27% above the 5-year average; |
| · | For the quarter, the Henry Hub natural gas spot price averaged $2.88/MMBtu, 30% below last year’s $4.12 mark and 42% below the 5 year average price of $4.94; and |
| · | The average for the benchmark PJM West Peak price during the third quarter of 2012 was $48.16/MWh with a standard deviation of $13.14 for a CoV of 27%, compared to $57.63/MWh, $17.84, and 31% for the same period in 2011. |
As a result of these factors, for the quarter ended September 30, 2012, net trading revenue decreased by $1,853,000 or 27.1% to $4,996,000 compared to $6,849,000 for the comparable period in 2011.
Retail electricity sales: Revenue from the retail sale of electricity is recorded in the period in which customers consume the commodity, net of any applicable sales taxes. Revenue applicable to electricity consumed by customers but not yet billed under the cycle billing method is estimated and accrued along with the related costs. Changes in estimates are reflected in operations in the period in which they are refined.
Our customer base consists largely of residential consumers with a few small commercial accounts. We grew the number of customers receiving service from us from 148 at the start of the quarter to 2,067 as of September 30, 2012. As of the quarter’s end, we had signed agreements with 2,857 customers. During the third quarter of 2012, we recorded retail electricity revenues of $134,000 on unit sales of 1,987,355 kWh.
Costs of retail electricity sold: The costs of electricity sold includes the cost of purchased power, EDC service fees, and commissions and fees on derivative contracts used to hedge the cost of future power purchases, if any.
For the period, the Company purchased all of its electricity sold to retail customers in ISO-NE’s day-ahead and real-time wholesale markets. The Company is required to maintain a cash deposit in a separate account to meet ISO-NE’s financial assurance requirements to purchase energy, which amount is included in “trading accounts and deposits”.
Although we did not hedge the cost of any of this electricity during the quarter, on September 12, 2012, we purchased certain fixed-for-floating swaps to hedge part of our expected costs of power during the fourth quarter and designated them as such on October 1, 2012.
Salaries, wages, and related expenses: Salaries, wages, and related expenses such as employee benefits and payroll taxes consist primarily of base and incentive compensation paid to our administrative officers, energy traders, and other employees.
For the third quarter of 2012, salaries, wages, and related costs decreased by $3,138,000 or 74.2% to $1,091,000 compared to $4,229,000 for the third quarter of 2011. Our personnel expense is directly related to the revenue we record, since our trader’s compensation is tied to revenue production. In addition to decreased revenue, part of the decrease resulted from a C$1,549,000 adjustment to accrued compensation related to the wind down of CAN.
Professional fees: Professional fees consist of legal expenses, audit fees, tax compliance reporting service fees, and other fees paid for outside consulting services.
| 33 |
For the third quarter of 2012, professional fees decreased by $90,000 to $784,000 compared to $874,000 in the same period in 2011. The decrease was due in part to fewer independent contractor fees in the third quarter 2012 compared to 2011 as well as decreased accounting fees in the 2012 quarter.
Other general and administrative: Other general and administrative expenses consist of rent, depreciation, travel, outside retail marketing and customer service costs, and all other direct office support expenses.
For the third quarter of 2012, these costs increased by approximately $394,000 to $776,000 compared to $382,000 for the same period in 2011. The increase was primarily related to retail activity costs, fees associated with the Margin Agreement, expenses associated with being a reporting company, and marketing and servicing costs associated with the sale of our Subordinated Notes.
Trading tools and subscriptions: Trading tools and subscriptions consist primarily of amounts paid for services that provide weather reports and forecasting, electrical load forecasting, congestion analysis and other factors relative to electricity production and consumption.
For the 2012 period, trading tools and subscriptions decreased by $111,000 or 33.3% to $222,000 compared to $333,000 for the third quarter of 2011. The restructuring of our Canadian operations beginning in February 2011 was a major contributing factor to this decrease.
Other income (expense): Other expense, net of other income, decreased by $6,000 to $242,000 for the third quarter of 2012 compared to $248,000 for the same period in 2011. As the principal component of other expense, interest expense decreased by $8,000 to $248,000 for the third quarter of 2012 from $256,000 during the comparable period in 2011. The decrease was attributed primarily to a reduction of $3,288,000 in outstanding debt from $10,288,000 at December 31, 2011 compared to $7,000,000 at September 30, 2012, due principally to the conversion of $2,745,000 of debt to redeemable preferred units in the first quarter and a pay down, net of new issuances, of $543,000 during the nine months.
Provision for taxes: The tax provision is directly related to foreign income taxes associated with CAN. The decrease in taxes is attributed to a decrease in taxable income for CAN in addition to the write-off of the deferred tax asset associated with the reversal of accrued compensation expense, partially offset by current income tax liabilities.
Preferred distributions: Effective January 31, 2012, TCP sold certain financial rights to 496 of its new issue units to John O. Hanson for a purchase price of $2,745,000, paid by conversion of certain notes payable to him. These preferred units incorporate a cumulative distribution of $45,750 per month, are not convertible, have no corporate governance rights, and are redeemable at any time prior to December 31, 2013 for an amount equal to the purchase price.
Effective July 1, 2012 Mr. Hanson’s preferred units in TCP were exchanged for preferred units issued by the Company with identical financial rights and terms.
For the quarter ended September 30, 2012, preferred distributions totaled $137,000.
| 34 |
Nine Months Ended September 30, 2012 and 2011
The following table sets forth selected financial data for the periods indicated, which has been derived from the consolidated financial statements included elsewhere in this report:
| Dollars in thousands | For The Nine Months Ended September 30, | |||||||||||||||||||||||
| 2012 | 2011 | Increase (decrease) | ||||||||||||||||||||||
| Dollars | Percent | Dollars | Percent | Dollars | Percent | |||||||||||||||||||
| Revenue | ||||||||||||||||||||||||
| Wholesale trading revenue, net | $ | 12,421 | 98.9 | % | $ | 37,186 | 99.2 | % | $ | (24,765 | ) | -66.6 | % | |||||||||||
| Retail electricity revenue | 134 | 1.1 | % | – | 0.0 | % | 134 | na | ||||||||||||||||
| Consulting fees | – | 0.0 | % | 284 | 0.8 | % | (284 | ) | -100.0 | % | ||||||||||||||
| Net revenue | 12,555 | 100.0 | % | 37,470 | 100.0 | % | (24,915 | ) | -66.5 | % | ||||||||||||||
| Operating expenses | ||||||||||||||||||||||||
| Cost of retail electricity sold | 113 | 0.9 | % | – | 0.0 | % | 113 | na | ||||||||||||||||
| Salaries, wages & related | 5,800 | 46.2 | % | 18,071 | 48.2 | % | (12,271 | ) | -67.9 | % | ||||||||||||||
| Professional fees | 2,021 | 16.1 | % | 1,860 | 5.0 | % | 161 | 8.7 | % | |||||||||||||||
| Other general & administrative | 1,844 | 14.7 | % | 2,442 | 6.5 | % | (598 | ) | -24.5 | % | ||||||||||||||
| Trading tools & subscriptions | 731 | 5.7 | % | 1,098 | 2.9 | % | (367 | ) | -33.4 | % | ||||||||||||||
| Total operating expenses | 10,509 | 83.7 | % | 23,471 | 62.6 | % | (12,962 | ) | -55.2 | % | ||||||||||||||
| Operating income | 2,046 | 16.3 | % | 13,999 | 37.4 | % | (11,953 | ) | -85.4 | % | ||||||||||||||
| Interest expense | (836 | ) | -6.7 | % | (2,589 | ) | -6.9 | % | 1,753 | -67.7 | % | |||||||||||||
| Interest income | 24 | 0.1 | % | 21 | 0.1 | % | 3 | 14.3 | % | |||||||||||||||
| Loss on foreign currency exchange | (17 | ) | -0.1 | % | (69 | ) | -0.2 | % | 52 | -75.4 | % | |||||||||||||
| Other expense, net | (829 | ) | -6.7 | % | (2,637 | ) | -7.0 | % | 1,808 | -68.6 | % | |||||||||||||
| Income before income taxes | 1,217 | 9.6 | % | 11,362 | 30.4 | % | (10,145 | ) | -89.3 | % | ||||||||||||||
| Income tax provision | 54 | 0.4 | % | 408 | 1.1 | % | (354 | ) | -86.8 | % | ||||||||||||||
| Net income | 1,163 | 9.2 | % | 10,954 | 29.3 | % | (9,791 | ) | -89.4 | % | ||||||||||||||
| Preferred distributions | (366 | ) | -2.9 | % | – | 0.0 | % | (366 | ) | na | ||||||||||||||
| Net income attributable to common | 797 | 6.3 | % | 10,954 | 29.3 | % | (10,157 | ) | -92.7 | % | ||||||||||||||
| Foreign currency translation adjustment | (48 | ) | -0.4 | % | (116 | ) | -0.3 | % | 68 | -58.4 | % | |||||||||||||
| Comprehensive income | $ | 749 | 5.9 | % | $ | 10,838 | 29.0 | % | $ | (10,089 | ) | -93.1 | % | |||||||||||
Wholesale trading revenue, net: Energy market conditions during the first nine months of 2012 were characterized by exceptionally mild weather, ample natural gas supplies, and prices near 10 year lows, a combination that reduced the level and volatility of wholesale electricity prices. Consequently, our revenues were reduced. Also, beginning February 1, 2011, we initiated a significant downsizing of CAN, cutting trader headcount from twelve to two. Consequently, we also cut our revenue base and financial risk. As a result of these factors, for the nine months ended September 30, 2012, net trading revenue decreased by $24,765,000 or 66.6% to $12,421,000 compared to $37,186,000 for the comparable period in 2011.
Salaries, wages, and related expenses: For the first nine months of 2012, salaries, wages, and related costs decreased by $12,271,000 or 67.9% to $5,800,000 compared to $18,071,000 for the period ending September 30, 2011. Our personnel expense is directly related to the revenue we earn, since trader compensation is tied to trading revenue. In addition to decreased revenue, part of the overall dollar decrease resulted from a $2,362,000 adjustment to accrued compensation related to the wind down of CAN.
| 35 |
Professional fees: For the nine months ended September 30, 2012, professional fees increased by $161,000 to $2,021,000 compared to $1,860,000 in the same period in 2011. The increase was due in part to $218,000 of fees incurred in 2012 related to our retail energy initiatives. Legal and accounting fees in the 2012 period were also higher in connection with the preparation of our public debt offering and SEC filings. The Company also continues to incur legal fees in connection with the Canadian former employee litigation.
Other general and administrative: For the first nine months of 2012, these costs decreased by $598,000 to $1,844,000 compared to $2,442,000 for the same period in 2011. On February 17, 2011, the Company was notified that FERC had commenced an investigation into certain of its trading practices, thus we reserved $500,000 for expected expenses. This investigation was subsequently withdrawn on November 23, 2011, and the reserve provision was reversed in the fourth quarter of 2011. The decrease is also related to the discontinued operation of Vision Consulting, LLC and the reorganization of CAN.
Trading tools and subscriptions: For the 2012 period, trading tools and subscriptions decreased by $367,000 or 33.4% to $731,000 compared to $1,098,000 for the first nine months of 2011. The Canadian restructuring in February 2011 was a major contributing factor to this decrease.
Other income (expense): Other expense, net of other income, decreased by $1,808,000 to $829,000 for the first nine months of 2012 compared to $2,637,000 for the same period in 2011. As the principal component of other expense, interest expense decreased by $1,753,000 to $836,000 for the first nine months of 2012 from $2,589,000 during the comparable period in 2011. The average outstanding balances for the nine months ended September 30, 2011 and 2012 were $16,667,000 and $7,533,000, respectively. The decrease in outstanding debt was the primary factor of the reduction in interest expense. The Canadian to U.S. dollar exchange rate decreased from an average of $1.02 in 2011 to $1.00 in 2012.
Provision for taxes: The tax provision is directly related to foreign income taxes associated with CAN. The decrease in taxes is attributed to a decrease in taxable income for CAN in addition to the write-off of the deferred tax asset associated with the reversal of accrued compensation expense, partially offset by current income tax liabilities.
Preferred distributions: For the nine months ended September 30, 2012, preferred distributions totaled $366,000.
Liquidity, Capital Resources, and Cash Flow
We require a significant amount of cash to maintain collateral with the trading markets in which we operate, which in turn allows us to trade in those markets and generate revenues. As such, our capital is largely invested in trading accounts and deposits. Our capital expenditure requirements are nominal, being limited to computer and office equipment, software, and office furniture. Therefore, in any given reporting period, the amount of cash consumed or generated will primarily be due to changes in working capital.
Historically, our capital requirements have been funded by notes payable and operating profits and we are dependent on cash on hand, cash-flow positive operations, and additional financing to service our existing obligations. If we fail to make loan payments when due, certain of our lenders have the option to declare any unpaid principal balances and all accrued interest thereon to be immediately due and payable. Should we incur significant losses from operations within a short period, we would be forced to cover such payments by reducing the balances in our trading accounts. Either of such events would have a detrimental effect on the Company.
| 36 |
We are taxed as a partnership for income tax purposes which means that we do not pay any income taxes. All of our income (or loss) for each year is allocated among holders of our common units who are then personally responsible for the tax liability associated with such income. Our Member Control Agreement requires us to make quarterly distributions of cash to these members based upon their respective ownership interests in the amount necessary to permit the member who is in the highest income tax bracket to pay all state and federal taxes on our net income allocated to such member.
The decision to make distributions other than tax distributions to holders of our common units is at the discretion of our Board of Governors and depends on various factors, including our results of operations, financial condition, capital requirements, contractual restrictions, outstanding indebtedness, investment opportunities, and other factors considered by the Board to be relevant. The indenture governing our Subordinated Notes prohibits us from paying distributions to our members if there is an event of default with respect to the notes or if payment of the distribution would result in an event of default. The indenture also prohibits our Board from declaring or paying any distributions other than tax distributions if, in the reasonable determination of the Governors, the Company would have insufficient cash to meet anticipated redemption or repayment obligations.
We believe we have sufficient cash on hand, coupled with anticipated cash generated from operating activities and the anticipated proceeds from the Notes Offering to meet our cash requirements for at least the next twelve months.
The following table is presented as a measure of our liquidity and capital resources as of the dates indicated:
| Dollars in thousands | At | |||||||||||||||||||||||
| September 30, 2012 | December 31, 2011 | Increase (decrease) | ||||||||||||||||||||||
| Dollars | Percent of total assets | Dollars | Percent of total assets | Dollars | Percent | |||||||||||||||||||
| Liquidity | ||||||||||||||||||||||||
| Cash | $ | 1,357 | 8.3 | % | $ | 971 | 5.2 | % | $ | 386 | 39.8 | % | ||||||||||||
| Trading accounts and deposits | 11,941 | 73.5 | % | 15,834 | 84.0 | % | (3,893 | ) | -24.6 | % | ||||||||||||||
| Accounts receivable - trade | 1,699 | 10.4 | % | 614 | 3.3 | % | 1,085 | 176.7 | % | |||||||||||||||
| Total liquid assets | 14,997 | 92.2 | % | 17,419 | 92.5 | % | (2,422 | ) | -13.9 | % | ||||||||||||||
| Total assets | $ | 16,267 | 100.0 | % | $ | 18,839 | 100.0 | % | (2,572 | ) | -13.7 | % | ||||||||||||
| Capital Resources | ||||||||||||||||||||||||
| Notes payable | ||||||||||||||||||||||||
| Demand or current | 3,314 | 20.4 | % | 6,402 | 34.0 | % | (3,088 | ) | -48.2 | % | ||||||||||||||
| Long term | 3,686 | 22.7 | % | 3,886 | 20.6 | % | (200 | ) | -5.1 | % | ||||||||||||||
| Total notes payable | 7,000 | 43.1 | % | 10,288 | 54.6 | % | (3,288 | ) | -32.0 | % | ||||||||||||||
| Redeemable preferred units | 2,745 | 16.9 | % | – | 0.0 | % | 2,745 | na | ||||||||||||||||
| Common | 3,258 | 20.0 | % | 3,063 | 16.3 | % | 195 | 6.4 | % | |||||||||||||||
| Total capitalization | $ | 13,003 | 79.8 | % | $ | 13,351 | 70.9 | % | (348 | ) | -2.6 | % | ||||||||||||
| 37 |
The table below summarizes our primary sources and uses of cash for the first nine months ended September 30, 2012 and 2011 as derived from the statements of cash flows included elsewhere in this Form 10-Q.
| Dollars in thousands | For The Nine Months Ended September 30, | |||||||||||||||
| Increase (decrease) | ||||||||||||||||
| 2012 | 2011 | Dollars | Percent | |||||||||||||
| Net cash provided by (used in): | ||||||||||||||||
| Operating activities | $ | 2,482 | $ | 30,985 | $ | (28,503 | ) | -92.0 | % | |||||||
| Investing activities | (282 | ) | (173 | ) | (109 | ) | 63.0 | % | ||||||||
| Financing activities | (1,765 | ) | (33,002 | ) | 31,237 | -94.7 | % | |||||||||
| Net cash flow | 435 | (2,190 | ) | 2,625 | 19.9 | % | ||||||||||
| Effect of exchange rate changes on cash | (49 | ) | 46 | (95 | ) | -206.5 | % | |||||||||
| Cash: | ||||||||||||||||
| Beginning of period | 971 | 3,854 | (2,883 | ) | -74.8 | % | ||||||||||
| End of period | $ | 1,357 | $ | 1,710 | $ | (353 | ) | -20.6 | % | |||||||
At December 31, 2011, our debt totaled $10,288,000 compared to $7,000,000 as of September 30, 2012. During the nine months ended September 30, 2012, we converted $2,745,000 of debt to redeemable preferred units in a non-cash transaction. We also generated $2,482,000 in net cash flow from operating activities, primarily from a reduction in trading account deposits of $3,893,000. We used $282,000 for investments in equipment and furniture, and to acquire the business and certain assets of CP&U. We used $1,765,000 for financing activities, including a $543,000 net reduction in notes payable, a total of $727,000 in distributions, and a $100,000 payment for redemption of 1,540 of our common units. Of the total distribution amount, $357,000 was paid to the holder of our preferred units and $370,000 was paid to our common unit-holders.
During the first nine months of 2011, we generated $30,985,000 of cash from operations, made $173,000 of capital expenditures, and used $33,002,000 for financing activities. For the nine months ended September 30, 2011, cash from operations consisted of reductions in trading account deposits and trade accounts receivable totaling $33,682,000 partially offset by a $14,646,000 decrease in trade accounts payable, due largely to the reduced level of trading activity by our Canadian subsidiary. Our principal use of cash during the first nine months of 2011 was $28,750,000 in payments on the obligations owed to the HTS Parties.
Financing
Effective January 31, 2012, TCP sold certain financial rights, but not governance rights, to 496 new membership units, which we refer to as “preferred units”, to John O. Hanson for a purchase price of $2,745,000, paid by conversion of certain notes payable to him. Effective July 1, 2012, these preferred units were exchanged for preferred units with identical terms issued by TCPH. From the effective date to the redemption date, we shall pay Mr. Hanson or his designee a guaranteed payment or distribution of $45,750 per month. At any time prior to December 31, 2013, we may repurchase the units for $2,745,000. If we do not repurchase the units prior to such date, Mr. Hanson may require Timothy S. Krieger, our Chief Executive Officer, to repurchase them on such date. In addition, should we default on our obligations to Mr. Hanson, payment of all specified amounts has been personally guaranteed by Mr. Krieger.
In February 2012, we executed a $25,000,000 Futures Risk-Based Margin Finance Agreement (the “Margin Line” and the “Margin Agreement”, respectively) with ABN AMRO. The Margin Agreement provides CEF with an uncommitted $25,000,000 revolving line of credit for which it pays a commitment fee of $35,000 per month. Loans under the Margin Agreement are secured by all balances in CEF’s trading accounts with ABN AMRO, are payable on demand, and bear interest at an annual rate equal to 1.00% in excess of the Federal Funds Target Rate, or approximately 1.25%. Under the Margin Agreement, the Company is also subject to certain reporting, affirmative, and negative covenants, including maintenance of minimum account net liquidating equity as defined of $3,000,000, a maximum loan ratio as defined of 12.5:1, and minimum consolidated tangible net worth of 4% of the amount of the Margin Line or $1,000,000. As of September 30, 2012, there were no borrowings outstanding under the Margin Agreement and the Company was in compliance with all covenants.
| 38 |
On February 20, 2012, the HTS Note was amended to accommodate the Margin Agreement as follows:
| • | CEF may not draw more than $7,000,000 until the Note is paid in full; |
| • | CEF must maintain not less than $3,000,000 in its ABN AMRO account; |
| • | The Company shall retain as capital all funds drawn under the Margin Agreement until the HTS Note is paid in full; |
| • | The Company shall not distribute to its members, directly or indirectly, any of the proceeds of the Margin Agreement; |
| • | The Company shall maintain a separate accounting with respect to the withdrawal and use of funds; and |
| • | The maturity date of the HTS Note was shortened by one year to October 1, 2013 and, consequently, the Company is required to make a balloon principal payment of $1,943,004 at maturity. |
On May 10, 2012, our Form S-1 registration statement relating to our offer and sale of “Renewable Unsecured Subordinated Notes” (File No. 333-179460) was declared effective by the SEC, and our offering of notes commenced on May 15, 2012. The registration statement covers up to $50,000,000 in principal amount of 3 and 6 month and 1, 2, 3, 4, 5, and 10 year notes. Through November 12, 2012, we have sold a total of $1,452,000 in principal amount of notes and redeemed $67,000, for a net raise to date of $1,385,000. For the nine months ended September 30, 2012, the Company incurred $233,000 of offering-related expenses, including marketing and printing expense, additional legal and accounting fees, filing fees, and trustee fees. These costs and expenses are expensed as incurred.
Critical Accounting Policies and Estimates
Revenue Recognition and Commodity Derivative Instruments
Our revenues are derived from trading financial and physical energy contracts. These contracts are marked to fair value each period in the consolidated balance sheets and revenues are recorded based on realized and unrealized gains and losses on such contracts, net of costs. These transactions are shown as operating activities in the consolidated statements of cash flow.
Our trading activities also use derivatives such as financial and physical swaps, forward sales contracts, futures contracts, and options to generate revenues. The contracts with the exchanges on which we trade permit net settlement, including the right to offset cash collateral in the settlement process. Accordingly, we net cash collateral against the derivative position in the accompanying consolidated balance sheets. All realized and unrealized gains and losses on derivative instruments are recorded in revenues. Substantially all our revenues are generated by these trading activities.
Revenue from the retail sale of electricity is recorded in the period in which customers consume the commodity, net of any applicable sales tax.
| 39 |
Profits Interest Payments
Certain of our second-tier subsidiaries (SUM and CEF) have Class B members. Under the terms of such subsidiaries’ member control agreements, Class B members have no voting rights, are not required to contribute capital, and have no rights to distributions following termination of employment, but are entitled to a defined share of profits while employed. Since Class B members have no corporate governance rights or risk of capital loss (or gain), they do not own non-controlling equity interests and profits interests payments are recorded as compensation expense during the period earned and are classified as accrued compensation on the balance sheet.
For the nine months ended September 30, 2012 and 2011, we recorded $2,168,000 and $7,945,000, respectively, in salaries and wages and related taxes, representing the allocation of profits to Class B members. The amount of accrued profits interests included in accrued compensation at September 30, 2012 and December 31, 2011 was $350,708 and $412,906, respectively.
Changes in and Disagreements with Accountants on Accounting and Financial Disclosure
None
Item 3 - Quantitative and Qualitative Disclosures about Market Risk
None
Item 4 - Controls and Procedures
The Company maintains a system of disclosure controls and procedures that is designed to ensure that information required to be disclosed in our Exchange Act reports is recorded, processed, summarized and reported within the time periods specified in the SEC’s rules and forms, and that such information is accumulated and communicated to our management, including our Chief Executive Officer and Chief Financial Officer, as appropriate, to allow timely decisions regarding required disclosures.
Under the supervision and with the participation of our management, including our Chief Executive Officer and Chief Financial Officer, the Company conducted an evaluation of our disclosure controls and procedures (as defined in Exchange Act Rules 13a-15(e) and 15d-15(e)). Based on this evaluation, the Company’s Chief Executive Officer and Chief Financial Officer concluded that, as of September 30, 2012, the Company’s disclosure controls and procedures were effective.
Changes in Internal Control over Financial Reporting
There was no change in the Company’s internal control over financial reporting that occurred during the three months ended September 30, 2012 that has materially affected, or is reasonably likely to materially affect, the Company’s internal control over financial reporting.
| 40 |
Part II – Other Information
Item 1 - Legal Proceedings
See Note 10. Commitments and Contingencies on page 23 of this Form 10-Q for a discussion of certain legal proceedings.
Item 1A - Risk Factors
None
Item 2 - Unregistered Sales of Equity Securities and Use of Proceeds
None
Item 3 - Defaults Upon Senior Securities
None
Item 4 - Mine Safety Disclosures
None
Item 5 - Other Information
None
| 41 |
Item 6 - Exhibits
| Exhibit Number | Description | |
| 3.1 | Amended and Restated Member Control Agreement | |
| 10.1 | Assignment of Membership Unit Purchase Agreement, effective July 1, 2012 | |
| 31.1 | Certification of Chief Executive Officer, pursuant to Rule 13a-14 and 15d-14 of the Securities Exchange Act of 1934. | |
| 31.1 | Certification of Chief Financial Officer, pursuant to Rule 13a-14 and 15d-14 of the Securities Exchange Act of 1934. | |
| 32.1 | Certification of Chief Executive Officer and Chief Financial Officer, pursuant to 18 U.S.C. Section 1350, as adopted pursuant to Section 906 of the Sarbanes-Oxley Act of 2002. | |
| 101.INS* | XBRL Instance Document | |
| 101.SCH* | XBRL Schema Document | |
| 101.CAL* | XBRL Calculation Linkbase Document | |
| 101.DEF* | XBRL Definition Linkbase Document | |
| 101.LAB* | XBRL Labels Linkbase Document | |
| 101.PRE* | XBRL Presentation Linkbase Document | |
| * Pursuant to Rule 406T of Regulation S-T, the Interactive Data Files on Exhibit 101 hereto are deemed not filed or part of a registration statement or prospectus for purposes of Section 11 or 12 of the Securities Act of 1933, as amended, are deemed not filed for purposes of Section 18 of the Securities Exchange Act of 1934, as amended, and are otherwise not subject to liability under those sections. | ||
| 42 |
Signatures
Pursuant to the requirements of the Securities Exchange Act of 1934, the registrant has duly caused this report to be signed on its behalf by the undersigned thereto duly authorized.
| TWIN CITIES POWER HOLDINGS, LLC | ||||
|
/s/ Timothy S. Kreiger | ||||
| Dated: November 14, 2012 | By: | Timothy S. Krieger | ||
| Chief Executive Officer, President and Chairman of the Board (principal executive officer) | ||||
|
/s/ Wiley H. Sharp III | ||||
| Dated: November 14, 2012 | By: | Wiley H. Sharp III | ||
| Vice President – Finance and Chief Financial Officer (principal accounting and financial officer) |
| 43 |