Attached files
| file | filename |
|---|---|
| EX-21 - ASPIRITY HOLDINGS LLC | ex21.htm |
| EX-3.1 - ASPIRITY HOLDINGS LLC | ex3-1.htm |
| EX-4.1 - ASPIRITY HOLDINGS LLC | ex4-1.htm |
| EX-10.2 - ASPIRITY HOLDINGS LLC | ex10-2.htm |
| EX-32.1 - ASPIRITY HOLDINGS LLC | ex32-1.htm |
| EX-12.2 - ASPIRITY HOLDINGS LLC | ex12-2.htm |
| EX-12.1 - ASPIRITY HOLDINGS LLC | ex12-1.htm |
| EX-23.1 - ASPIRITY HOLDINGS LLC | ex23-1.htm |
| EX-31.1 - ASPIRITY HOLDINGS LLC | ex31-1.htm |
| EX-10.11 - ASPIRITY HOLDINGS LLC | ex10-11.htm |
| EX-10.12 - ASPIRITY HOLDINGS LLC | ex10-12.htm |
| EX-31.2 - ASPIRITY HOLDINGS LLC | ex31-2.htm |
UNITED STATES OF AMERICA
SECURITIES AND EXCHANGE COMMISSION
Washington, DC 20549
FORM 10-K
[X] ANNUAL REPORT PURSUANT TO SECTION 13 OR 15(d) OF THE SECURITIES EXCHANGE ACT OF 1934
FOR THE FISCAL YEAR ENDED DECEMBER 31, 2015
or
[ ] TRANSITION REPORT PURSUANT TO SECTION 13 OR 15(d) OF THE SECURITIES EXCHANGE ACT OF 1934
For the Transition Period from __ to __
Commission File Number: 333-203994
Aspirity Holdings, LLC
(Exact name of registrant as specified in its charter)
| Minnesota | 27-1658449 | |
| (State of organization) | (IRS Employer Identification Number) |
701 Xenia Avenue, Suite 475
Minneapolis, Minnesota 55416
(Address of principal executive offices, zip code)
(763) 432-1500
(Registrant’s telephone number, including area code)
| Securities registered under Sections 12(b) or 12(g) of the Act | Name of each exchange on which registered | |
| None | None |
Securities for which there is a reporting obligation pursuant to Section 15(d) of the Act
$75,000,000
3 and 6 Month and 1, 2, 3, 4, 5 and 10 Year Renewable Unsecured Subordinated Notes
Indicate by check mark whether the registrant (1) has filed all reports required to be filed by Section 13 or 15(d) of the Securities Exchange Act of 1934 during the preceding 12 months (or for such shorter period that the registrant was required to file such reports), and (2) has been subject to such filing requirements for the past 90 days. Yes [X] No [ ]
Indicate by check mark whether the registrant has submitted electronically and posted on its corporate web site, if any, every Interactive Data File required to be submitted and posted pursuant to Rule 405 of Regulation ST (§232.405 of this chapter) during the preceding 12 months (or for such shorter period that the registrant was required to submit and post such files). Yes [X] No [ ]
Indicate by check mark whether the registrant is a large accelerated filer, an accelerated filer, a non-accelerated filer, or smaller reporting company. See definition of “large accelerated filer”, “accelerated filer”, and “smaller reporting company” in Rule 12b-2 of the Exchange Act. (Check one): Large accelerated filer [] Accelerated filer [] Non-accelerated filer [ ] Smaller reporting company [X]
Indicate by check mark whether the registrant is a shell company (as defined in Rule 12b-2 of the Exchange Act). Yes [ ] No [X]
TABLE OF CONTENTS
| i |
| Abbreviation
or acronym |
Definition | |
| ABACCUS | The Annual Baseline Assessment of Choice in Canada and the United States is a study of U.S. states and Canadian provinces with respect to their efforts and achievements in the promotion of a competitive retail electric sector. The annual studies are prepared by DEFG, LLC, a management consulting firm specializing in energy | |
| AEMS | Aspirity Energy Mid States, LLC, a wholly owned subsidiary of Aspirity Energy | |
| AENE | Aspirity Energy Northeast, LLC, a wholly owned subsidiary of Aspirity Energy | |
| AES | Aspirity Energy South, LLC, a wholly owned subsidiary of Aspirity Energy | |
| AESO | Alberta Electric System Operator, a statutory corporation of the Province of Alberta, is an ISO serving the Alberta Interconnected Electric System | |
| AOCI | Accumulated other comprehensive income | |
| Angell | Angell Energy, LLC, a Texas limited liability company that purchased TCP and SUM on June 1, 2015. | |
| Apollo | Apollo Energy Services, LLC, a wholly-owned, first-tier subsidiary of Krieger Enterprises, LLC | |
| ASC | Accounting Standards Codification | |
| Aspirity or the Company | Aspirity Holdings LLC, formerly known as Twin Cities Power Holdings, LLC, and its subsidiaries | |
| Aspirity Energy | Aspirity Energy LLC, a wholly owned subsidiary of Aspirity | |
| Aspirity Financial | Aspirity Financial LLC, a wholly owned subsidiary of Aspirity | |
| ASU | Accounting Standards Update | |
| BLS | Bureau of Labor Statistics, an agency within the U.S. Department of Labor | |
| Btu; therm; MMBtu | A “Btu” or British thermal unit is a measure of thermal energy or the amount of heat needed to raise the temperature of one pound of water from 39°F to 40°F. A “therm” is one hundred thousand Btu. One “MMBtu” is one million Btu. | |
| CEF | Cygnus Energy Futures, LLC, a wholly-owned subsidiary of CP and a second-tier subsidiary of Enterprises | |
| CFTC | Commodity Futures Trading Commission, an independent agency of the United States government that regulates futures and option markets | |
| CHP | Abbreviates “combined heat and power”, a type of generating facility | |
| CME | CME Group Inc. operates the CME (Chicago Mercantile Exchange), CBOT (Chicago Board of Trade), NYMEX (New York Mercantile Exchange), and COMEX (Commodities Exchange) derivatives exchanges and also offers certain cleared over-the-counter products and services |
| 1 |
| Abbreviation or acronym | Definition | |
| CoV | Abbreviates the coefficient of variation, a simple measure of volatility useful for comparing two or more data series; equal to the standard deviation divided by the mean | |
| CP | Cygnus Partners, LLC, a wholly-owned, first-tier subsidiary of Enterprises | |
| CSE | Comparison shopping engine, a web site that compares prices for specific products. While most comparison shopping engines do not offer the products or services themselves, some may earn commissions when users follow the links in the search results and make a purchase from an online vendor | |
| CTG | Chesapeake Trading Group, LLC, a wholly-owned subsidiary of Enterprises | |
| Cyclone | Cyclone Partners, LLC, a wholly-owned, first-tier subsidiary of Enterprises | |
Degree-days; CDD; HDD |
A “degree-day” compares outdoor temperatures to a standard of 65°F. Hot days require energy for cooling and are measured in cooling degree-days or “CDD” while cold days require energy for heating and are measured in heating degree-days or “HDD”. For example, a day with a mean temperature of 80°F would result in 15 CDD and a day with a mean temperature of 40°F would result in 25 HDD.
If heating degree-days are less than the average for an area for a period, the weather was “warmer than normal”; if they were greater, it was “colder than normal”. The converse is true for cooling degree-days - if CDD are less than the average for an area for a period, the weather was “colder than normal”; if they were greater, it was “warmer than normal”. | |
| Distribution | That certain distribution of 100% of the equity of Enterprises to the members of Aspirity as the final step of the Restructuring. | |
| Distribution Date | The date of the Distribution is the date that the registration statement was declared effective by the SEC (November 12, 2015); for tax and accounting purposes, November 1, 2015. | |
| DOE | U.S. Department of Energy | |
| EDC; LDC | Energy distribution company, may also be known as a local distribution company; see also “electric utility” | |
| EDI compliant | In order for a licensed competitive electricity supplier to sell to, bill, and collect from retail customers within a given utility’s service territory, it must establish an electronic connection or become “EDI compliant” with such utility | |
| EEI | The Edison Electric Institute is a trade association representing U.S. investor-owned electric companies. Its 160 U.S. operating utility and parent company members provide electricity for 220 million Americans, operate in all 50 states and the District of Columbia, and directly employ more than 500,000 workers. The association also has 70 international electric company members and 270 industry suppliers and related organizations as associate members |
| 2 |
| Abbreviation or acronym | Definition | |
| EIA | Energy Information Administration, an independent agency within DOE | |
| Electric utility | A corporation, person, agency, authority, or other legal entity or instrumentality aligned with distribution facilities for delivery of electric energy for use primarily by the public such as investor-owned utilities (“IOUs”), municipally-owned utilities (“munis”), utilities owned by states or political subdivisions thereof (“POUs”), federal utilities, and rural electric cooperatives (“co-ops”). A few entities that are tariff based and corporately aligned with companies that own distribution facilities are also included. | |
| Enterprises | Krieger Enterprises, LLC, a former first tier subsidiary of Aspirity, the equity interests of which were distributed to the then members of the Company on the Distribution Date | |
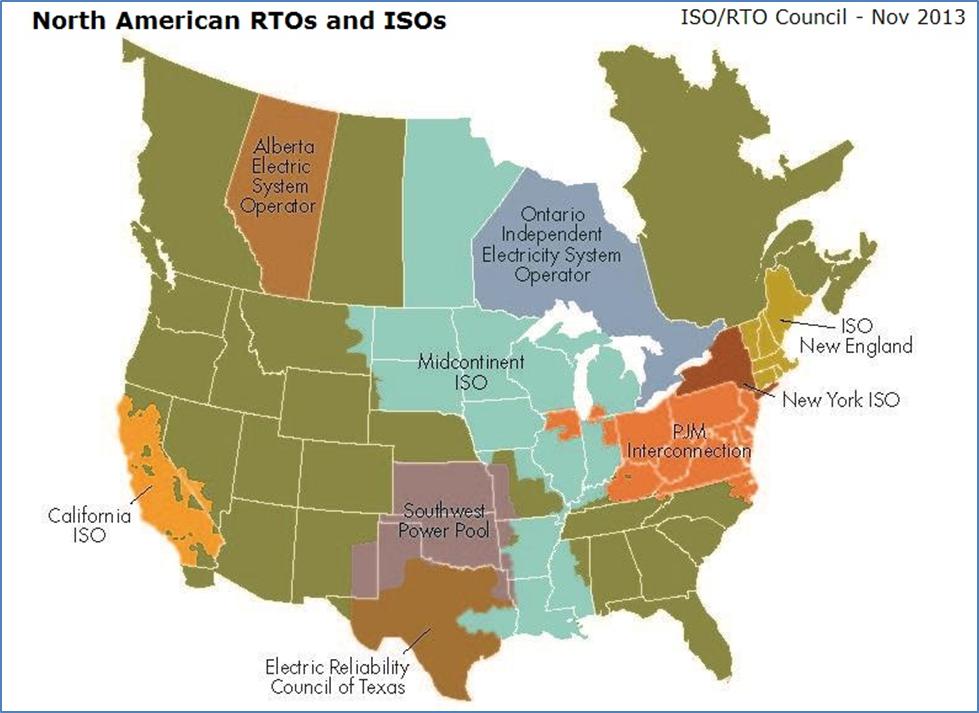
| ERCOT | Electric Reliability Council of Texas, an ISO managing about 85% of the electric Load of Texas and subject to oversight by the Public Utility Commission of Texas and the Texas Legislature but not FERC | |
| Exelon | Exelon Generation Company, LLC, a Pennsylvania limited liability company and wholly-owned subsidiary of Exelon Corporation | |
| FASB | Financial Accounting Standards Board | |
| FERC | Federal Energy Regulatory Commission, an independent regulatory agency within DOE | |
| FTR | Financial Transmission Rights are financial instruments traded in certain ISOs and RTOs that entitle their holders to receive or pay charges based on congestion price differences in the day-ahead energy market across specific transmission paths. The value of an FTR reflects the difference in congestion prices rather than the difference in locational marginal prices, which includes energy, congestion, and marginal losses. FTRs are specified between any two pricing nodes on the system, including hubs, control zones, aggregates, generator buses, load buses and interface pricing points. FTRs are generally available in increments of 0.1 MW and for periods ranging from 1 month to multiple years. The value of an FTR can be positive or negative depending on the sink minus source congestion price difference, with a negative differences resulting in liability for the holder. | |
| GAAP | Generally accepted accounting principles in the United States | |
| ICE | Intercontinental Exchange, Inc. is the leading global network of regulated exchanges and clearing houses for financial and commodity markets in the U.S., Canada, Europe, and Asia. In November 2013, ICE completed the acquisition of NYSE Euronext. | |
| INC and DEC | An increment offer or “INC” is an offer in the day-ahead market to sell energy at a specified source bus. An INC will clear if the LMP at the bus equals or exceeds the offer price. A decrement bid or “DEC” is a bid in the day-ahead market to purchase energy at a specified sink bus. A DEC will clear if the LMP at the bus does not exceed the bid price. | |
| IPP | An “independent power producer” or IPP is a corporation, person, agency, authority, or other legal entity or instrumentality that owns or operates facilities for the generation of electricity for use primarily by the public and that is not an electric utility. |
| 3 |
| Abbreviation or acronym | Definition | |
| ISO; RTO | An Independent System Operator or “ISO” is a non-profit organization formed at the direction or recommendation of FERC that coordinates, controls, and monitors the operation of a bulk electric power system. A Regional Transmission Organization or “RTO” typically performs the same functions as an ISO but covers a larger area. ISOs and RTOs may also operate centrally cleared wholesale markets for electric power quoted on both a “real-time” and “day ahead” basis. ISOs and RTOs are collectively referred to as ISOs. | |
| ISO-NE | ISO New England Inc., an RTO serving Connecticut, Maine, Massachusetts, New Hampshire, Rhode Island, and Vermont | |
| Legacy Businesses | The wholesale energy trading, real estate investments, investments in private companies, and legacy retail energy business operated by Enterprises, a former first tier subsidiary of the Company | |
| LMP | One of the unique aspects of FERC-regulated wholesale electricity markets is the availability of “locational marginal prices” or “LMPs”. The theoretical price of electricity at each node on a network is calculated based on the assumptions that one additional megawatt-hour of energy is demanded at the node in question, and the marginal cost to the system that would result from the re-dispatch of available generating units to serve such load can establish the production cost of the additional energy. LMPs are typically quoted on a “real-time” and “day-ahead” basis. In the real-time market, prices at specific nodes are updated every 5 minutes based on current and targeted supply and demand. Day-ahead prices are for power to be delivered at a specified hour and transmission point during the next day. LMPs vary by time and location due to physical system limitations, congestion, and loss factors; however, in an unconstrained system with no losses, all LMPs would be equal. This means that LMPs can be conceptually separated into three components - an energy price, a congestion component, and a loss component. | |
| MCF | One thousand cubic feet, a common unit of price measure for natural gas. In 2010, one MCF of natural gas had a heat content of 1,025 Btu. | |
| MISO | Midcontinent Independent System Operator, Inc., formerly the Midwest Independent Transmission System Operator, Inc., an RTO serving all or part of Arkansas, Illinois, Indiana, Iowa, Louisiana, Manitoba, Michigan, Minnesota, Mississippi, Missouri, Montana, North Dakota, South Dakota, Texas, and Wisconsin | |
| NERC | North American Electric Reliability Corporation, a non-profit corporation formed on March 28, 2006 as the successor to the National Electric Reliability Council, also known as NERC, formed in 1968. NERC is the designated Electric Reliability Organization (“ERO”) for the U.S. and operates under the auspices of FERC. | |
| S-1, Old and New | The Company’s Registration Statement on Form S-1, declared effective by the Securities and Exchange Commission on November 12, 2015 with respect to the Notes Offering is defined as the “New S-1”, while that declared effective on May 10, 2012 is defined as the “Old S-1” | |
| NGX | Natural Gas Exchange Inc., headquartered in Calgary, Alberta provides electronic trading, central counterparty clearing, and data services to the North American natural gas and electricity markets. NGX is wholly owned by TMX Group Inc. which collectively manages all aspects of Canada’s senior and junior equity markets. |
| 4 |
| Abbreviation or acronym | Definition | |
| NOAA | National Oceanic and Atmospheric Administration, an agency of the U.S. Department of Commerce | |
| Noble | Noble Conservation Solutions, Inc., a Minnesota corporation. On September 1, 2015, Enterprises purchased 60% of the outstanding shares of Noble. | |
| Notes | The Company’s Renewable Unsecured Subordinated Notes issued pursuant to its ongoing Notes Offering | |
| Notes Offering | The direct public offering the Company’s Notes pursuant to Registration Statements on Form S-1 | |
| NRSRO | A SEC-recognized Nationally Recognized Statistical Rating Organization; The major NRSROs that rate utilities are Standard & Poor’s Financial Services LLC (“S&P”), Moody’s Investor Services, Inc. (“Moody’s”), and Fitch Ratings Inc. (“Fitch”) | |
| NYISO | New York Independent System Operator, an ISO serving New York state | |
| Operating Agreement | Aspirity’s Amended and Restated Operating Agreement dated March 30, 2016 | |
| Prospectus | That prospectus dated November 12, 2015 as part of the New S-1, as supplemented from time to time | |
| PJM | PJM Interconnection, a RTO serving all or part of Delaware, Illinois, Indiana, Kentucky, Maryland, Michigan, New Jersey, North Carolina, Ohio, Pennsylvania, Tennessee, Virginia, West Virginia, and the District of Columbia | |
| POR; non-POR | All states with restructured retail markets have implemented laws and regulations with respect to permitted billing, credit, and collections practices. Some of these states require an EDC billing customers in their service territory on behalf of suppliers operating there to purchase the receivables generated as a result of energy sales, generally at a modest discount to reflect bad debt experience. These states are known as “purchase of receivables” or “POR” jurisdictions while those without this provision are known as “non-POR” areas | |
| PSA | A “preferred supply agreement” | |
| PURPA | Public Utilities Regulatory Policy Act of 1978 | |
| RECs | “Renewable energy certificates” represent the property rights to the environmental, social, and other non-power qualities of renewable electricity generation and can be sold separately from the underlying physical electricity. As renewable generators produce electricity, they create one REC per megawatt-hour. If the physical electricity and the associated RECs are sold to separate buyers, the electricity is no longer considered “renewable” or “green” as the REC is what conveys the attributes and benefits of the renewable electricity, not the electricity itself | |
| REH | Retail Energy Holdings, LLC, a wholly-owned, first-tier subsidiary of Enterprises |
| 5 |
| Abbreviation or acronym | Definition | |
| Restructuring | The restructuring of the Company that was approved by the Board on May 27, 2015 and was completed effective November 1, 2015 and effected the legal separation of the Legacy Businesses from the Company | |
| SEC | U.S. Securities and Exchange Commission, an independent agency of the United States government with primary responsibility for enforcing federal securities laws and regulating the securities industry and stock exchanges | |
| SUM | Summit Energy, LLC, a wholly-owned subsidiary of TCP | |
| TCE | Twin Cities Energy, LLC, an inactive, wholly-owned, first-tier subsidiary of Enterprises | |
| TCP | Twin Cities Power, LLC, formerly, a wholly-owned, first-tier subsidiary of the Company | |
| TCPC | Twin Cities Power – Canada, Ltd., an inactive, wholly-owned subsidiary of TCE and a second-tier subsidiary of Enterprises | |
| TCPH | Twin Cities Power Holdings, LLC | |
| Term Loan | Term Loan Agreement between Enterprises as borrower and Aspirity Financial as lender dated July 1, 2015, as amended on November 1, 2015 and January 27, 2016. Pursuant to the Term Loan, Enterprises borrowed an aggregate principal amount of $22,206,000 from Aspirity Financial. | |
| Term Loan Notes | Each of the Company’s Notes outstanding as of June 30, 2015 in an aggregate principal amount of $22,206,000, including any renewals of such Notes | |
| TSE | Town Square Energy, initially, an accounting division of TCP resulting from the acquisition of the business and assets of Community Power & Utility, LLC on June 29, 2012. Effective June 1, 2013, TSE became a wholly-owned first-tier subsidiary of the Company and on October 25, 2013, it became a wholly owned subsidiary of REH | |
| TSEC | Town Square Energy Canada, Ltd, a wholly-owned subsidiary of REH and a second-tier subsidiary of Enterprises | |
| TSEE | Town Square Energy East, LLC, formerly known as Discount Energy Group, LLC (“DEG”), a wholly-owned subsidiary of REH and a second-tier subsidiary of Enterprises | |
| Ultra Green | Ultra Green Packaging, Inc. develops, manufactures, and markets “ecopaper” products made from wheat straw, bamboo, or sugarcane fibers and bioplastic products made from cornstarch. Ultra Green’s ecopaper and bioplastic products are certified as biodegradable and sustainable, and are compostable in about 160 days. | |
| UTC | In an up-to-congestion or “UTC” transaction, a day-ahead market participant offers to inject energy at a specified source and simultaneously withdraw the same quantity at a specific sink at a maximum bid price difference between the two locations. The transaction will clear if the price differential between sink and source does not exceed the bid price. |
| 6 |
| Abbreviation or acronym | Definition | |
| VaR | Value-at-Risk is a measure of the risk of loss on a specific portfolio of financial assets. For a given portfolio, probability, and time horizon, VaR is the value at which the probability that a mark-to-market loss over the given time horizon exceeds the calculated value, assuming normal markets and no trading. For example, if a portfolio has a one-day, 5% VaR of $1 million, there is a 5% probability that the portfolio will fall in value by more than $1 million over a one-day period. | |
| Watt (W); Watt-hour (Wh) | Although in everyday usage, the terms “energy” and “power” are essentially synonyms, scientists, engineers, and the energy business distinguish between them. Technically, energy is the ability to do work, or move a mass a particular distance by the application of force while power is the rate at which energy is generated or consumed. | |
| In the case of electricity, power is measured in watts (W) and is equal to voltage or the difference in charge between two points multiplied by amperage also known as current or rate of electrical flow. The energy supplied or consumed by a circuit is measured in watt-hours (Wh). For example, when a light bulb with a power rating of 100W is turned on for one hour, the energy used is 100 watt-hours. This same amount of energy would light a 40-watt bulb for 2.5 hours or a 50-watt bulb for 2.0 hours. | ||
| Multiples of watts and watt-hours are measured using International Systems of Units (“SI”) conventions. For example: |
| Prefix | Symbol | Multiple (Number) | Value | |||||||
| kilo | k | one thousand (1,000) | 103 | |||||||
| mega | M | one million (1,000,000) | 106 | |||||||
| giga | G | one billion (1,000,000,000) | 109 | |||||||
| tera | T | one trillion (1,000,000,000,000) | 1012 | |||||||
| Kilowatt (kW) or kilowatt-hour (kWh): one thousand watts or watt-hours. Kilowatt-hours are typically used to measure residential energy consumption and retail prices. One kWh is equal to 3,412 Btu, but fuel with a heat content of 7,000 to 11,500 Btu must be consumed to generate and deliver one kWh of electricity. | ||
| Megawatt (MW) or megawatt-hour (MWh): one million watts or watt-hours or one thousand kilowatts or kilowatt-hours. Megawatts are typically used to measure electrical generation capacity and megawatt-hours are the pricing units used in the wholesale electricity market. |
| 7 |
Aspirity Holdings (the “Company” or “Aspirity”), formerly known as Twin Cities Power Holdings, is a holding company that conducts its operations principally through wholly-owned subsidiaries. We currently have two direct operating subsidiaries, Aspirity Energy, which houses a start-up retail energy business, and Aspirity Financial, which was formed to provide energy-related financial services to businesses and households. Both subsidiaries are Minnesota limited liability companies as is the Company.
In 2015, we restructured as more fully described below. The Restructuring included the sale of two of our wholesale trading businesses and the spin-off of Krieger Enterprises, incorporating our three legacy business segments – wholesale trading, retail energy services, and diversified investments.
As a result, we currently have limited operations and assets although we are largely isolated from the inherent earnings volatility and regulatory exposure associated with the wholesale electricity markets.
By the end of 2016, our goal is to be able to market power to approximately 38 million residential customers located in 50 service areas in the 14 jurisdictions that allow all retail customers of investor-owned utilities to choose who supplies them with electricity.
Until our retail energy business has gained scale, our primary sources of cash flow will be Note sales and loan payments received by Aspirity Financial from Enterprises, our first financial services customer.
We are headquartered at 701 Xenia Avenue South, Suite 475, Minneapolis MN 55416, telephone (763) 432-1500.
For some time, the Company had been considering ways to access the public equity markets. In order to be successful in reaching this goal, management and the Board concluded that:
| ● | Public equity markets value stability and predictability of earnings. |
| ● | There are a handful of publicly traded retail energy companies and no publicly traded wholesale energy trading businesses. |
| ● | Retail energy companies tend to be valued on a per customer basis, with recent transactions occurring at prices ranging from $200-$500 per customer. |
| ● | Combining a proprietary wholesale trading operation with a retail energy business results in a reduced overall valuation, as the market generally assigns little value to trading profits due to their extreme volatility. |
| ● | While wholesale electricity trading makes for a good private equity investment, the earnings volatility and regulatory exposure endemic to the business make it unattractive as a publicly traded equity. For example, on August 29, 2014, FERC commenced a regulatory action in PJM seeking to retroactively impose new fees - in still to be determined amounts - on trades in PJM’s up-to-congestion product. Since the announcement of the proceeding, UTC trading volume has decreased substantially and a number of companies have exited the market1. |
| ● | The cash flow of retail energy and financial services businesses are generally much more stable than those of wholesale trading, as each customer represents a reasonably predictable revenue stream, either of energy sales or interest income. |
| 8 |
Consequently, and as a result of these conclusions, to effect an initial public offering of its common equity, the Company would need to be restructured and recast. During May 2015, the Company developed plans to separate its Legacy Businesses from a proposed retail energy and financial services business. The Restructuring was designed so that Aspirity (the publicly reporting company) would hold new retail energy and financial services businesses while Enterprises would continue to operate the more volatile Legacy Businesses as a private company. At a special meeting on May 27, 2015, the Board gave management the authorization to proceed with the Restructuring.
The restructuring plan called for:
| ● | The formation of Aspirity Energy, Aspirity Financial, and Krieger Enterprises as first tier subsidiaries of the Company; |
| ● | The sale of TCP2; |
| ● | The transfer of all legacy businesses, operations, and private investment assets and directly associated liabilities to Enterprises. The Company’s Legacy Businesses included: |
| ● | A wholesale segment trading virtual electricity and energy-based derivatives contracts in North American markets regulated by FERC and the CFTC; | |
| ● | A retail energy business providing electricity supply services to residential and small business customers in 8 states that permit retail choice; and | |
| ● | Certain asset management activities, including real estate development and investments in privately held businesses; |
| ● | The creation of a Term Loan between Financial as lender and Enterprises as borrower3; |
| ● | A name change from Twin Cities Power Holdings to Aspirity Holdings to reflect the new focus |
| 1 | The Company’s former subsidiary, Twin Cities Power, and its subsidiary, Summit Energy (collectively, “TCP”) were active traders of UTCs. |
| 2 | On June 1, the Company closed on the sale of TCP to Angell. The sale price was initially $20.7 million, paid in the form of $500,000 cash and a $20.2 million, 3 year secured note bearing 6.00% interest and payable quarterly. Effective September 1, the purchase price was adjusted to $15.0 million due to the return of TCP’s Minnesota operations to Enterprises. The note amount and amortization period were amended to $15.02 million and 4 years. The gain on sale is being recognized as payments on the note are collected. In selling TCP, the Company partially accomplished its goal of reducing its regulatory exposure and earnings volatility. |
| 3 | Although initially an intercompany relationship, the loan between Enterprises and Aspirity Financial closed on July 1, is constructed on an arm’s length basis, and ensures that the cash flows generated by the Legacy Businesses are used to pay interest and principal on a substantial portion of the Notes. Accordingly, the Term Loan initially reflected the outstanding principal amount ($22.2 million) and weighted average interest rate (14.08%) of the Notes as of Jun 30, 2015, with a final maturity date of December 30, 2019. Further, subject to true-ups for actual Note redemptions and interest paid, the monthly repayment schedule provides for payment by Enterprises of maximum possible redemptions and interest. |
| 9 |
| ● | The distribution or spin-off of 100% of the common equity interests in Enterprises to Timothy Krieger (99.50% owner) and Summer Enterprises (0.50% owner), subject to: |
| ● | Determination that the transaction would be tax-free; | |
| ● | The approval of the holders of a majority of the Notes[4]. This occurred June 26, 2015; and | |
| ● | The declaration of effectiveness of the Company’s New S-1 by the SEC[5]. This occurred November 12, 2015; and |
| ● | Concurrently with the Distribution Date, certain executive management changes and a plan to add new common equity owners, ultimately decreasing Mr. Krieger’s common equity interest in the Company to 45%. |
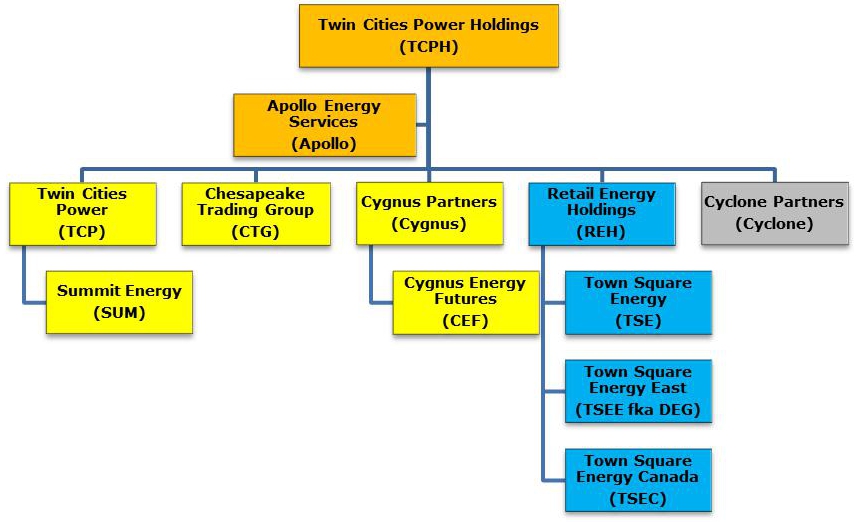
As shown by the chart below, prior to the start of the Restructuring on May 31, 2015, the Company’s active first tier subsidiaries consisted of Apollo, TCP, CTG, Cygnus, REH, and Cyclone.
| 4 | Under the terms of the Indenture governing the Notes, the disposition of all or substantially all of the Company’s assets requires the approval of the holders of a majority of Notes by principal amount. Consequently, on June 3, 2015, a proposal was submitted to the holders of the $21.9 million of Notes outstanding as of May 27, 2015 asking them to approve the transfer of the Legacy Businesses. Noteholders were asked to vote YES or NO to the proposal by June 26, 2015 with an abstention counting as a NO. The Company received YES votes from holders of $15.0 million, representing 68.6% of total Notes outstanding and 137% of the number required to pass the measure. Holders of $202,000 voted NO and $6.7 million abstained. |
| 5 | For tax and accounting purposes, November 1, 2015 is considered to be the Distribution Date. |
| 10 |
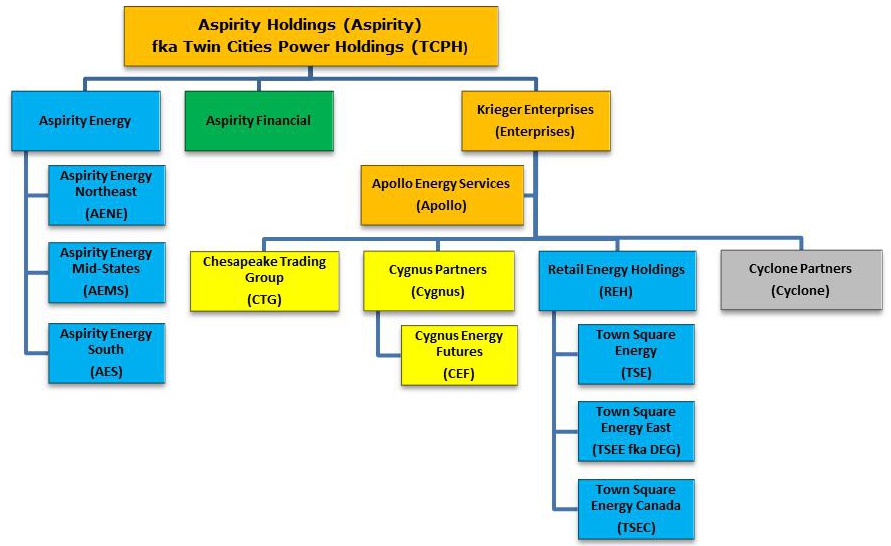
The chart below reflects the organizational structure and business lines of the Company on October 31, after the formation of the Aspirity operating companies, the sale of TCP, and the contribution of the legacy businesses to Enterprises, but before its spin-off on the Distribution Date:
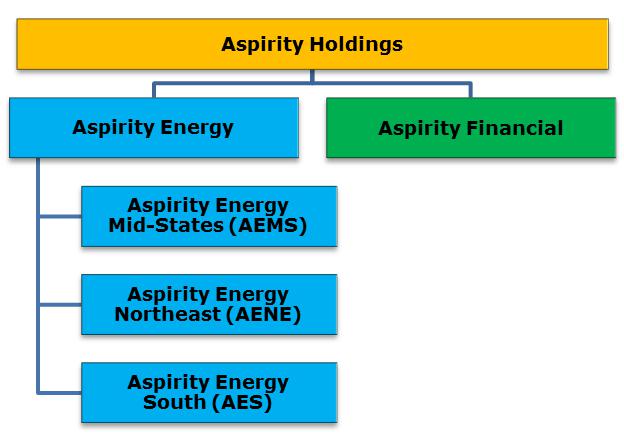
As shown below, after the Restructuring and distribution of Enterprises, the Company has operations in two business segments. Note that under the terms of the PSA with Exelon, we have agreed to merge AEMS and AENE into Aspirity Energy.

| 11 |
As a result of the Restructuring, we currently have limited operations and limited assets. We are developing our new retail energy business, and while we are in the process of applying for licenses and EDI compliance in all 14 jurisdictions and with 50 investor owned utilities serving about 38 million residential accounts, we began to offer service in late January 2016 and are essentially a start-up. Until our retail energy business is generating significant revenue, our primary sources of cash flow will be loan payments received by Aspirity Financial from Enterprises and note sales. In addition to building the Aspirity Energy business, we may also decide to lend additional funds to Enterprises, as well as other companies in the power sector, an industry in which we have significant experience.
The U.S. Electric Power Industry
By virtually any measure, the electric power industry in the U.S. is substantial. According to EIA data, in 2014, the most recent year for which full data is available, the industry sold 3,765 TWh (up 1.1% from 2013) for more than $393.1 billion (up 4.6%) to over 147.3 million residential, commercial, and industrial customers (up 0.7%).
Electric power in commercial quantities, unlike other energy commodities such as coal or natural gas, cannot be stored, i.e., the supply must be produced or generated exactly when used or demanded by customers. Further, the laws of physics dictate that power flows within a network along the lines of least resistance, not necessarily where we may want it to go. These facts, coupled with the essential nature of the service to modern life, have obvious implications for electricity market structures and regulations.
Today, the industry includes any entity producing, distributing, trading, or selling electricity.
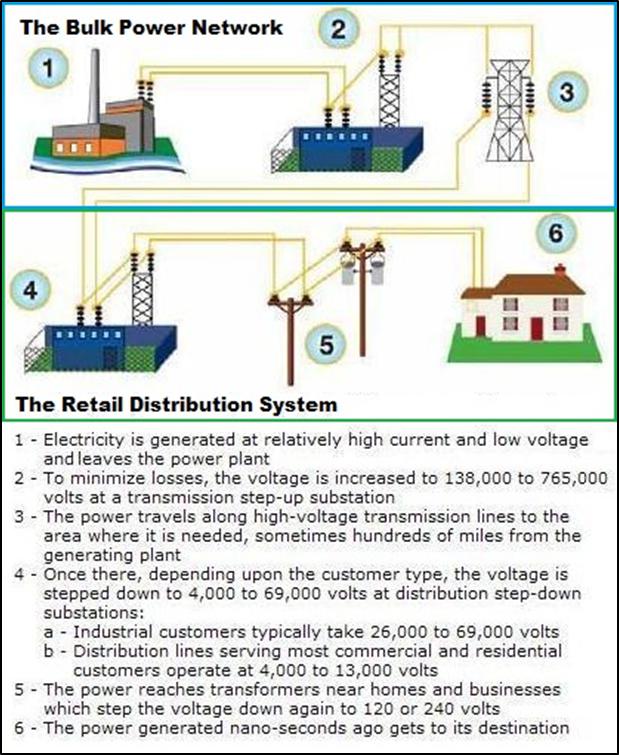
Physically, the nation’s power system includes generation resources, transmission lines, and retail distribution systems. As of the end of 2014, participants in the generation segment of the industry included investor-owned, publicly-owned, cooperative, and federal utilities, and non-utility power producers, including independent power producers and commercial and industrial entities that operate co-generation facilities, also known as CHP or combined-heat-and-power plants. These entities owned over 19,700 generating units with total nameplate capacity of 1,172 GW incorporated into over 7,600 power plants.
In addition to generation, the nation’s bulk power system also includes about 200,000 miles of high-voltage (over 144kV) transmission lines. Our retail distribution network includes substations, wires, poles, metering, billing, and related support systems.
Power marketers and retail energy providers do not own any generation, transmission, or distribution assets, but buy and sell in wholesale and retail markets. Finally, participants in wholesale power markets include banks, hedge funds, private equity firms, and trading houses. |
 |
\
| 12 |
U.S. Electric Power Capacity & Generation, 2014
| Nameplate Capacity | Generation | Capacity | ||||||||||||||||||||||||
| Plants | Generators | GW | Percent | TWh | Percent | Factor (1) | ||||||||||||||||||||
| By Energy Source | ||||||||||||||||||||||||||
| Coal | 491 | 1,145 | 325.8 | 27.8 | % | 1,582 | 38.6 | % | 55.4 | % | ||||||||||||||||
| Petroleum | 1,082 | 3,573 | 46.9 | 4.0 | % | 30 | 0.7 | % | 7.4 | % | ||||||||||||||||
| Natural gas & other gases | 1,792 | 5,820 | 497.3 | 42.4 | % | 1,139 | 27.8 | % | 26.1 | % | ||||||||||||||||
| Nuclear | 62 | 99 | 103.9 | 8.9 | % | 797 | 19.5 | % | 87.6 | % | ||||||||||||||||
| Other (2) | 94 | 131 | 3.3 | 0.3 | % | 13 | 0.3 | % | 47.0 | % | ||||||||||||||||
| Total non-renewable | 3,521 | 10,768 | 977.2 | 83.3 | % | 3,561 | 87.0 | % | 41.6 | % | ||||||||||||||||
| Hydroelectric | 1,482 | 4,185 | 100.4 | 8.6 | % | 253 | 6.2 | % | 28.8 | % | ||||||||||||||||
| Wind | 1,032 | 65.3 | 5.6 | % | 182 | 4.4 | % | 31.8 | % | |||||||||||||||||
| Biomass | 1,192 | 2,317 | 15.5 | 1.3 | % | 64 | 1.6 | % | 47.2 | % | ||||||||||||||||
| Geothermal | 194 | 3.8 | 0.3 | % | 16 | 0.4 | % | 48.2 | % | |||||||||||||||||
| Sola | 1,249 | 10.4 | 0.9 | % | 18 | 0.4 | % | 19.3 | % | |||||||||||||||||
| Total renewable | 2,674 | 8,977 | 195.4 | 16.7 | % | 532 | 13.0 | % | 31.1 | % | ||||||||||||||||
| Total, all sources | 6,195 | 19,745 | 1,172.6 | 100.0 | % | 4,094 | 100.0 | % | 39.9 | % | ||||||||||||||||
| By Producer Type | ||||||||||||||||||||||||||
| Electric utilities | 3,118 | 9,510 | 675.7 | 57.6 | % | 2,382 | 58.2 | % | 40.3 | % | ||||||||||||||||
| Non-CHP IPPs | 3,189 | 6,975 | 423.8 | 36.1 | % | 1,555 | 38.0 | % | 41.9 | % | ||||||||||||||||
| CHP IPPs | 247 | 559 | 37.9 | 3.2 | % | — | 0.0 | % | 0.0 | % | ||||||||||||||||
| Commercial (3) | 649 | 1,085 | 4.1 | 0.4 | % | 13 | 0.3 | % | 34.7 | % | ||||||||||||||||
| Industrial (3) | 474 | 1,616 | 31.1 | 2.7 | % | 144 | 3.5 | % | 52.9 | % | ||||||||||||||||
| Total, all producers (4) | 7,677 | 19,745 | 1,172.6 | 100.0 | % | 4,094 | 100.0 | % | 39.9 | % | ||||||||||||||||
| Disposition of Generation | ||||||||||||||||||||||||||
| Total, all sources | 4,094 | 108.7 | % | |||||||||||||||||||||||
| Line losses, plant, and direct use, net | (329) | -8.7 | % | |||||||||||||||||||||||
| Retail sales to ultimate consumers | 3,765 | 100.0 | % | |||||||||||||||||||||||
Source: EIA Electric Power Annual with data for 2014, released February 2016, next release February 2017.
Notes
1 - The capacity factor is a measure of how often a generator runs and compares how much electricity it actually produces with the maximum it could produce during a specific period of time. For example, if a 1 MW generator produced 5,000 MWh over a year, its capacity factor would be 57%, because 5,000 MWh is 57% of the electricity it could have produced if it operated all 8,760 hours in the year at full capacity. Generators with relatively low fuel costs are usually operated to supply base load power, and typically have average annual capacity factors of 70% or more. Generators with lower capacity factors may indicate that they are operated during peak demand periods or have high fuel costs, or their operation depends on the availability of the energy source, such as hydro, solar, and wind energy.
2 - Other non-renewable sources of energy include batteries, chemicals, hydrogen, pitch, purchased steam, sulfur, tire-derived fuels and miscellaneous technologies.
3 - The industrial sector includes only independent power producers’ CHP facilities while the commercial sector Includes a small number of electricity-only, non-combined heat and power plants.
4 - Excludes distributed and dispersed generators and net metering customers. Distributed and dispersed generators are commercial and industrial generators that are, respectively, connected and un-connected to the grid. Both types may be installed at or near a customer’s site or at other locations and may be owned by either by customers or the distribution utility. Net metering is a service under which electricity generated by a consumer from an eligible facility and delivered to the utility may be used to offset energy provided by the utility during the applicable billing period.
| 13 |
U.S. Electric Power Industry Revenue, Unit Sales, Customers, and Average Retail Prices, All Sectors, 2014
| Entities (count) | Revenues ($millions) | % of Total | Unit Sales (TWh) | % of Total | Customers (000s) | % of Total | Avg Retail Price (¢/kWh) | |||||||||||||||||||||||||
| By Energy Provider | ||||||||||||||||||||||||||||||||
| Investor-owned utilities | 208 | 228,353 | 58.1 | % | 1,935 | 51.4 | % | 86,838 | 58.9 | % | 11.80 | |||||||||||||||||||||
| Retail energy providers | 652 | 57,019 | 14.5 | % | 743 | 19.7 | % | 20,070 | 13.6 | % | 7.67 | |||||||||||||||||||||
| Non-utility power producers | 213 | 974 | 0.2 | % | 16 | 0.4 | % | 1 | 0.0 | % | 5.93 | |||||||||||||||||||||
| Behind the meter | 94 | 228 | 0.1 | % | 2 | 0.0 | % | 167 | 0.1 | % | 12.92 | |||||||||||||||||||||
| Subtotal | 1,167 | 286,574 | 72.9 | % | 2,696 | 71.6 | % | 107,076 | 72.7 | % | 10.63 | |||||||||||||||||||||
| Cooperatives | 859 | 44,624 | 11.4 | % | 429 | 11.4 | % | 18,947 | 12.9 | % | 10.39 | |||||||||||||||||||||
| Municipally-owned utilities | 827 | 39,898 | 10.1 | % | 395 | 10.5 | % | 15,008 | 10.2 | % | 10.09 | |||||||||||||||||||||
| Public power districts | 81 | 9,640 | 2.5 | % | 109 | 2.9 | % | 3,861 | 2.6 | % | 8.83 | |||||||||||||||||||||
| State-owned utilities | 11 | 5,807 | 1.5 | % | 52 | 1.4 | % | 1,340 | 0.9 | % | 11.21 | |||||||||||||||||||||
| Federally-owned utilities | 26 | 1,295 | 0.3 | % | 32 | 0.8 | % | 35 | 0.0 | % | 4.11 | |||||||||||||||||||||
| Subtotal | 945 | 56,640 | 14.4 | % | 588 | 15.6 | % | 20,245 | 13.7 | % | 9.64 | |||||||||||||||||||||
| Adjustments (1) | 69 | 5,258 | 1.3 | % | 51 | 1.4 | % | 1,106 | 0.8 | % | 10.28 | |||||||||||||||||||||
| Total U.S. | 3,040 | 393,096 | 100.0 | % | 3,765 | 100.0 | % | 147,374 | 100.0 | % | 10.44 | |||||||||||||||||||||
| By Choice Type (2) | ||||||||||||||||||||||||||||||||
| Type 0 | 2,292 | 222,213 | 56.5 | % | 2,312 | 61.4 | % | 81,657 | 55.4 | % | 9.61 | |||||||||||||||||||||
| Type 1 | 679 | 112,947 | 28.7 | % | 987 | 26.2 | % | 42,589 | 28.9 | % | 11.44 | |||||||||||||||||||||
| Type 2 | 25 | 35,457 | 9.0 | % | 249 | 6.6 | % | 13,590 | 9.2 | % | 14.26 | |||||||||||||||||||||
| Type 3 | 21 | 14,248 | 3.6 | % | 129 | 3.4 | % | 5,839 | 4.0 | % | 11.06 | |||||||||||||||||||||
| Type 4 | 23 | 8,231 | 2.1 | % | 87 | 2.3 | % | 3,699 | 2.5 | % | 9.41 | |||||||||||||||||||||
| Subtotal | 748 | 170,883 | 43.5 | % | 1,452 | 38.6 | % | 65,717 | 44.6 | % | 11.77 | |||||||||||||||||||||
| Total U.S. | 3,040 | 393,096 | 100.0 | % | 3,765 | 100.0 | % | 147,374 | 100.0 | % | 10.44 | |||||||||||||||||||||
| By Census Region (3) | ||||||||||||||||||||||||||||||||
| New England | 266 | 18,557 | 4.7 | % | 120 | 3.2 | % | 7,133 | 4.8 | % | 15.45 | |||||||||||||||||||||
| Middle Atlantic | 323 | 49,331 | 12.5 | % | 368 | 9.8 | % | 18,099 | 12.3 | % | 13.41 | |||||||||||||||||||||
| South Atlantic | 422 | 81,153 | 20.6 | % | 572 | 15.2 | % | 30,246 | 20.5 | % | 14.19 | |||||||||||||||||||||
| East North Central | 423 | 56,337 | 14.3 | % | 301 | 8.0 | % | 22,215 | 15.1 | % | 18.71 | |||||||||||||||||||||
| East South Central | 246 | 28,973 | 7.4 | % | 806 | 21.4 | % | 9,517 | 6.5 | % | 3.60 | |||||||||||||||||||||
| West North Central | 514 | 27,477 | 7.0 | % | 319 | 8.5 | % | 10,730 | 7.3 | % | 8.61 | |||||||||||||||||||||
| West South Central | 300 | 50,925 | 13.0 | % | 589 | 15.6 | % | 17,587 | 11.9 | % | 8.65 | |||||||||||||||||||||
| Mountain | 267 | 25,651 | 6.5 | % | 272 | 7.2 | % | 10,728 | 7.3 | % | 9.42 | |||||||||||||||||||||
| Pacific - contiguous | 241 | 50,445 | 12.8 | % | 402 | 10.7 | % | 20,299 | 13.8 | % | 12.55 | |||||||||||||||||||||
| Pacific - noncontiguous | 38 | 4,248 | 1.1 | % | 16 | 0.4 | % | 820 | 0.6 | % | 27.14 | |||||||||||||||||||||
| Total US | 3,040 | 393,096 | 100.0 | % | 3,765 | 100.0 | % | 147,374 | 100.0 | % | 10.44 | |||||||||||||||||||||
Source: Company analysis of U.S. EIA Form 861 data, released February 2016, next release October 2016.
Notes
1 - Adjustments are required to reconcile federal and state reporting requirements.
2 - Retail choice types defined as follows: Type 0 - no retail customers have choice of generation services provider (“GSP”); Type 1 - all residential, commercial, and industrial customers in investor-owned utility (“IOU”) service areas have choice of GSP; Type 2 - limited number of residential customers have choice, choice of commercial and industrial customers is capped; Type 3 - no residential customers have choice, choice of commercial and industrial customers is capped; and Type 4 - no residential customers have choice, choice of commercial and industrial customers is limited.
3 - Census regions defined as follows: New England - CT, ME, MA, NH, RI, VT; Middle Atlantic - NJ, NY, PA; South Atlantic - DE, DC, FL, GA, MD, NC, SC, VA, WV; East North Central - IL, IN, MI, OH, WI; East South Central - AL, KY, MS, TN; West North Central - IA, KS, MN, MO, NE, ND, SD; West South Central - AR, LA, OK, TX; Mountain - AZ, CO, ID, MT, NV, NM, UT, WY; Pacific-contiguous - CA, OR, WA; and Pacific-noncontiguous - AK, HI.
| 14 |
The investor-owned portion of the industry, including utilities, retail energy providers, and non-utility generators, and constitutes over 70% of the industry’s revenues, unit sales, and customers as shown by the table above. According to the Edison Electric Institute, a trade group representing the largest investor-owned utilities, in 2014, total energy operating revenues of shareholder-owned electric companies were $377 billion[6]. As of December 31, 2014, consolidated holding company-level assets of these entities were $1.378 trillion, and of these assets, $833 billion were net property in service. In 2014, shareholder-owned electric utilities spent $19.5 billion on transmission investment, compared to $16.9 billion in 2013, are projected to spend $20.7 billion in 2015, and are planning to invest approximately $85 billion in transmission construction between 2015 and 2018. The total market capitalization of U.S. shareholder-owned electric companies was $632 billion on December 31, 2014.
Since the passage of the Public Utilities Regulatory Policy Act of 1978, the industry has been undergoing a massive restructuring process that has had a particular impact on investor-owned utilities. PURPA stimulated development of renewable energy sources and co-generation facilities and laid the groundwork for deregulation and competition by opening wholesale power markets to non-utility producers of electricity for the first time.
Since PURPA, the nation has moved from a system of vertically integrated monopolies providing retail service at state-determined, cost-based rates to one where the ownership of generation assets is no longer regulated and the majority of the nation’s bulk power systems are operated under the supervision of the Federal Energy Regulatory Commission, an independent agency within the DOE. Furthermore, while some states have restructured their markets such that individual consumers are allowed to choose their electricity supplier, most state public utility commissions continue to regulate their utilities under the traditional cost-based framework.
Today, wholesale prices are subject to a federal regulatory framework focused on ensuring fair competition and reliability of supply. At the state level, under the traditional system which most states continue to employ, a vertically integrated utility (a “full service provider”) is responsible for serving all consumers in a defined territory and customers are obligated to pay the regulated rate for their class of service.
However, in a state with a restructured or “deregulated” market, that is, the “restructured retail” business or one with retail choice, the generation, transmission, distribution, and retail marketing functions of the business are legally separated and pricing of energy is unbundled from delivery services. In 2014, according to EIA data, all customer types eligible to choose bought over 563 GWh from competitive suppliers, up 0.8% from 559 GWh in 2013.
6 Note that this figure also includes revenues from the sale of natural gas.
| 15 |
U.S. Electric Power Industry Revenue, Unit Sales, Customers, and Average Retail Prices, 2014
| Revenues ($millions) | % of Total | Unit Sales (TWh) | % of Total | Customers (000s) | % of Total | Avg Retail Price (¢/kWh) | ||||||||||||||||||||||
| By Customer Type | ||||||||||||||||||||||||||||
| Residential | 176,178 | 44.8 | % | 1,407 | 37.4 | % | 128,680 | 87.3 | % | 12.52 | ||||||||||||||||||
| Commercial | 145,253 | 37.0 | % | 1,352 | 35.9 | % | 17,854 | 12.1 | % | 10.74 | ||||||||||||||||||
| Industrial & other | 71,665 | 18.2 | % | 1,005 | 26.7 | % | 839 | 0.6 | % | 7.13 | ||||||||||||||||||
| Total industry | 393,096 | 100.0 | % | 3,765 | 100.0 | % | 147,374 | 100.0 | % | 10.44 | ||||||||||||||||||
| Residential | 160,637 | 40.9 | % | 1,301 | 34.6 | % | 117,231 | 79.5 | % | 12.34 | ||||||||||||||||||
| Commercial | 113,880 | 29.0 | % | 1,084 | 28.8 | % | 15,942 | 10.8 | % | 10.51 | ||||||||||||||||||
| Industrial & other | 57,328 | 14.6 | % | 816 | 21.7 | % | 790 | 0.5 | % | 7.03 | ||||||||||||||||||
| Full service providers | 331,845 | 84.4 | % | 3,201 | 85.0 | % | 133,963 | 90.9 | % | 10.37 | ||||||||||||||||||
| Residential | 15,541 | 4.0 | % | 106 | 2.8 | % | 11,450 | 7.8 | % | 14.70 | ||||||||||||||||||
| Commercial | 31,373 | 8.0 | % | 268 | 7.1 | % | 1,912 | 1.3 | % | 11.69 | ||||||||||||||||||
| Industrial & other | 14,338 | 3.6 | % | 189 | 5.0 | % | 49 | 0.0 | % | 7.57 | ||||||||||||||||||
| Restructured retail | 61,251 | 15.6 | % | 563 | 15.0 | % | 13,411 | 9.1 | % | 10.87 | ||||||||||||||||||
| Residential | 9,079 | 2.3 | % | — | — | — | — | 8.59 | ||||||||||||||||||||
| Commercial | 19,948 | 5.1 | % | — | — | — | — | 7.43 | ||||||||||||||||||||
| Industrial & other | 11,250 | 2.9 | % | — | — | — | — | 5.94 | ||||||||||||||||||||
| Energy only providers | 40,277 | 10.2 | % | — | — | — | — | 7.15 | ||||||||||||||||||||
| Residential | 6,462 | 1.6 | % | — | — | — | — | 6.11 | ||||||||||||||||||||
| Commercial | 11,425 | 2.9 | % | — | — | — | — | 4.26 | ||||||||||||||||||||
| Industrial & other | 3,088 | 0.8 | % | — | — | — | — | 1.63 | ||||||||||||||||||||
| Delivery service only | 20,975 | 5.3 | % | — | — | — | — | 3.72 | ||||||||||||||||||||
Source: Company analysis of U.S. EIA Form 861 data for 2014, re-released February 19, 2016, next release October 2016.
Wholesale prices are typically quoted as “on-peak”, “off-peak”, or “flat”, and in dollars per megawatt-hour ($/MWh). Peak hours are generally the 16 hours ending 0800 (8:00 am) to 2300 (11:00 pm) on weekdays, except for the NERC holidays of New Year’s Day, Memorial Day, Independence Day, Labor Day, Thanksgiving Day, and Christmas Day. Off-peak periods are all NERC holidays and weekend hours plus the 8 weekday hours from the hour ending at 2400 (midnight) until the hour ending at 0700 (7:00 am). Each month in a calendar year has a different number of on- and off- peak hours, consequently, the flat price for a given month takes this into account. The flat price for a day is simply the average of the 24 hourly prices. Retail prices are quoted in cents per kilowatt-hour (¢/kWh).
Wholesale electricity prices are driven by supply and demand and actually change minute-by-minute. Near term demand is largely affected by the weather and consumer behavior while supply is driven by plant availability and fuel prices, particularly for natural gas as it is the fuel of choice for marginal generation requirements.
Factors that affect electricity prices in the long term include climate, fuel prices and availability, generation and efficiency technologies deployed, population growth, economic activity, and governmental policies and regulatory actions with respect to energy and the environment.
After PURPA, the Energy Policy Act of 1992 was the next major legislative step towards full deregulation of wholesale power markets and in 1996, FERC issued Orders 888 and 889, which led to the creation of the network of “OASIS” or Open Access Same-Time Information System nodes, which allowed for energy to be scheduled across multiple power systems. In December 1999, FERC issued Order 2000 calling for electric utilities to form RTOs or ISOs to operate the nation’s bulk power system with the intended benefits of eliminating discriminatory access to transmission for all generators, improving operating efficiency, and increasing system reliability. ISOs are typically not-for-profit entities, use governance models developed by FERC, and operate under its regulatory authority.
| 16 |
In addition to controlling the physical flow of power within its area of responsibility, many ISOs also operate financial markets for real-time and day-ahead electricity, as well as ancillary services required to ensure system reliability. To date, seven ISOs have been formed in the U.S., including those managed by CAISO, ERCOT, ISO-NE, MISO, NYISO, PJM, and SPP. In the parts of the country where ISOs have not been established, active wholesale markets are still present, although they operate with different structures.
In general, wholesale market activity is characterized by the acquisition of electricity at a given location such as a node or hub and its delivery to another. Short-term financial contracts offered by ISOs such as INCs, DECs, and UTCs are also known as “virtual” trades, are outstanding overnight, and settle the next day. ISOs may also offer longer term financial contracts known as FTRs. Physical transactions are settled by the delivery of the commodity. In any case, the ISO serves as the counter-party and central clearinghouse for all trades.
In addition to the markets operated by the ISOs, derivative contracts such as swaps, options, and futures keyed to a wholesale electricity price are traded over-the-counter and on exchanges regulated by the CFTC, including ICE, NGX, and CME. Derivative contracts are available for many terms and pricing points and always settle in cash with profit or loss determined by price movements in the underlying commodity.
| 17 |
One of the unique aspects of wholesale electricity markets run by ISOs is the availability of “locational marginal prices” (“LMPs”), also known as “nodal pricing”. The theoretical price of electricity at each node on the network is calculated based on the assumptions that one additional kilowatt-hour is demanded at the node in question, and that the marginal cost to the system that would result from the optimized re-dispatch of available generating units to serve the load can establish the production cost of the additional energy. LMPs are typically quoted on a “real-time” and “day-ahead” basis. In the real-time market, prices at specific nodes on the grid are updated every 5 minutes based on current and targeted supply and demand. Day-ahead prices are for power to be delivered at a specified hour and transmission point during the next day.
LMPs vary by time and location due to physical system limitations, congestion, and loss factors; however, in an unconstrained system with no losses, all LMPs would be equal. This means that LMPs can be conceptually separated into three components - an energy price, a marginal congestion component or “MCC”, and a loss component or “MLC”.
As generators are dispatched to meet load, the energy transfer capacity of transmission lines is used. Bulk power systems must be operated to allow for continuity of supply even if a contingent event, like the loss of a line, generator, or transformer were to occur. At times, transmission lines may also reach their maximum thermal capacity. These “security constraints”, also known as “congestion”, limit the ability to use the least expensive generation. In other words, when constraints exist on a transmission network, there is a need for more expensive generation to be used, and separate prices on either side of a node give rise to congestion pricing to relieve the constraint and reduce line loadings. Finally, since transmission lines act as resistors to the flow of energy, to receive a specific quantity at a particular destination, more than the expected quantity must be injected into the line at origination to compensate for losses.
Restructured Retail Electricity Markets
Historically, at the state level, electricity was a regulated market, where vertically-integrated utilities owned all or a major part of the bulk power and distribution infrastructure and were responsible for generating electricity or buying it from other producers and distributing it to homes and businesses. Regulated utilities are responsible for serving all consumers in their defined territory and customers are obligated to pay the regulated rate for their class of service. Neither provider nor consumer has a choice about who they do business with.
In the 1990s, many states, particularly those in the Northeast and California where retail prices were historically among the highest in the country, began restructuring their electric power industries in an effort to bring the benefits of competition to retail customers. This new regulatory approach centered on deregulation of generation and retail marketing while continuing the traditional cost-of-service plan for transmission and distribution. The regulated portions of formerly vertically-integrated utilities, now generally known as electric distribution companies (“EDCs”) or local distribution companies (“LDCs”) are responsible for delivering power, billing consumers, and resolving any service issues, but customers can shop around and buy power from any licensed supplier or broker doing business in the state, hence “retail choice”.
Restructuring created new business opportunities in an established industry. In general, there are two types of non-utility businesses participating in the deregulated retail energy marketing function in the U.S. today – “brokers” and “suppliers” – but each state licenses these businesses in a different way. For example, not every jurisdiction makes a broker/supplier distinction and some divide licenses based on potential customer categories such as “residential” or “non-residential” while other states divide their markets based on historical utility service territories and license an entity to only provide services in particular areas. Overall, as of January 2014, there were about 700 of these licensed retail energy businesses in the U.S.
| 18 |
Brokers, also known as “aggregators”, negotiate supply agreements between retail customers, typically large commercial or industrial entities, and wholesale suppliers. Brokers collect commissions from the supplier that wins a particular piece of business. Brokers do not bill customers directly and never take title to energy; they work for the customer. Their major expense is signing up new customers. As a result, brokers generally have relatively limited margins but high quality cash flows and comparatively small balance sheets.
Suppliers, also known as retail energy providers (each, a “REP”), energy service companies (each, an “ESCO”), competitive energy providers (each, a “CEP”), or the like depending upon the state, are also licensed to deal with retail customers. They have an up-stream supply arrangement which may include purchasing directly from a pool like PJM or NYISO or bilaterally from large integrated energy companies or independent power producers. In contrast to brokers, suppliers potentially have higher margins on the energy sold but require larger amounts of capital to acquire energy and carry receivables and payables for some period of time.
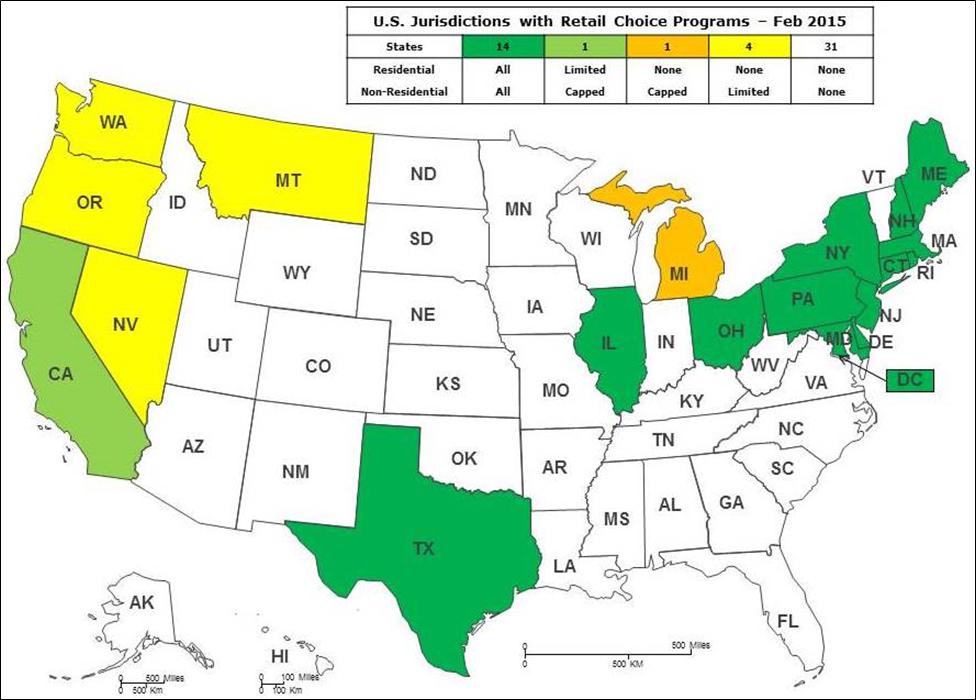
Today, years after Massachusetts and Rhode Island became the first states to effectively implement choice in 1998, 20 jurisdictions have some form of choice[7]. We define these forms of retail choice as follows:
| Type 1 | All residential, commercial, and industrial customers served by investor-owned utilities may choose their energy provider; |
| Type 2 | A limited number of residential customers have choice and the choice of non-residential customers is capped, usually at a specific number of megawatt-hours per year; |
| Type 3 | No residential customers have choice and the choice of non-residential customers is capped; and |
| Type 4 | No residential customers have choice and the number of non-residential with choice is limited. |
In addition, we define Type 0 jurisdictions as those in which no retail customers of any class have choice.
| 7 | Generally,only customers of investor-owned utilities are eligible to choose their electric supplier while those served by a municipal, cooperative, or other type of non-investor owned utility are ineligible. However, there are certain areas where customers of specific cooperatives and public utilities may have choice but these instances are rare. |
| 19 |
Some states require that utilities billing customers in their service territory on behalf of a retailer purchase the receivables generated as a result of energy sales. These states are known as “purchase of receivables” or “POR” jurisdictions. The purchase generally occurs at a modest discount of 0% to 2.5% to reflect bad debt experience by customer class within the service territory.
In POR areas, retailers have no customer credit exposure other than the bad debt charge because the utility pays regardless of whether or not the customer does. However, if a customer fails to pay, the utility will typically disconnect service, which results in the loss of the account for the retailer. In areas with without POR programs - non-POR areas - retailers are exposed to the credit risk of the customer. New Jersey is currently the only “recourse POR” state. Under these rules, retailers have no exposure to customer credit risk provided that the customer is billed under a utility’s consolidated billing program. However, if an electric account is in default for 90 days (about 120 days from the last invoice date), the utility has the option to convert the customer to dual billing.
POR laws have the effect of converting the retailer’s exposure to its customers’ credit to that of the applicable utility, which is generally “investment grade” under the scales of the Nationally Recognized Statistical Rating Organizations recognized by the SEC, such as Standard & Poor’s. A “BBB-” by S&P is considered to be the lowest investment grade by market participants.
The Type 1 retail choice jurisdictions incorporate 54 investor-owned utility service territories. In addition to obtaining licenses from appropriate state regulatory authorities, in order to supply power to customers within a given LDC service area, a retailer must become “EDI compliant” with that utility, which allows for access to their billing systems. In general, there are three billing structures available to competitive suppliers in restructured markets:
| 20 |
| ● | Under a “utility consolidated billing” system, also known as “UCB”, the utility is responsible for billing all retail customers for all electric service charges as well as the collection of outstanding accounts. Retailer charges included in the utility’s bill are calculated in one of two ways: |
| ● | For “rate ready” utilities, the retailer posts its rates with the utility and the utility calculates the charges for inclusion on the customer’s bill. | |
| ● | For “bill ready” utilities, retailers receive usage data from the utility and calculate the amount owed by the customer. This amount is then communicated back to the utility for inclusion on the customer’s bill. |
| ● | Under the “dual billing” framework, the utility sends bills to the customer for transmission and distribution charges and retailers send separate bills for generation charges. Each is responsible for the collection of its outstanding accounts and has direct credit exposure to the customer. |
| ● | Under the “retailer consolidated billing” structure or “RCB”, retailers are responsible for billing customers for all charges and, consequently, have direct credit exposure to the customer and are responsible for collection of all outstanding amounts. |
In the 14 areas where all rate classes had choice during 2014, according to the ABACCUS 2015 study supplemented by Company research, just over 38.0 million residential customers were eligible to choose their supplier. Of these totals, over 23.5 million or just under 62% had not switched away from the incumbent utility. 14.3 million or about 38% (in a range from 0.1% to 80.7%) had switched at least once.
| 21 |
For the Type 1 retail choice markets, the table below summarizes the POR status, number and credit of investor-owned utilities, the number of eligible residential customers, and recent prices:
Type 1 Retail Choice Residential Markets Overview
| Utilities | Customers | Prices (¢/ kWh, 1) | |||||||||||||||||||||||||||||||||||||||
| Avg | Switch | 2014 | 2015 | 2015 | |||||||||||||||||||||||||||||||||||||
| POR | Credit | Rate | Energy | Delivery | Avg | Avg | vs | ||||||||||||||||||||||||||||||||||
| State | Status | IO Us | Rating | Eligible | Unswitched | (2,3) | Only | Only | Price | Price | 2014 | ||||||||||||||||||||||||||||||
| CT | full | 2 | A- | 1,401,000 | 916,000 | 34.6 | % | 11.79 | 8.03 | 19.82 | 20.95 | 5.7 | % | ||||||||||||||||||||||||||||
| DE | none | 1 | BBB+ | 273,000 | 245,000 | 10.3 | % | 10.12 | 2.69 | 12.81 | 13.09 | 2.2 | % | ||||||||||||||||||||||||||||
| DC | in proces: | 1 | BBB+ | 243,000 | 209,000 | 14.0 | % | 10.06 | 3.35 | 13.41 | 13.61 | 1.5 | % | ||||||||||||||||||||||||||||
| IL | full | 4 | BBB+ | 4,604,000 | 1,780,000 | 61.3 | % | 6.77 | 5.23 | 12.00 | 12.58 | 4.8 | % | ||||||||||||||||||||||||||||
| ME | none | 2 | BBB+ | 767,000 | 595,000 | 22.4 | % | 7.41 | 10.00 | 17.41 | 19.80 | 13.7 | % | ||||||||||||||||||||||||||||
| MD | full | 4 | BBB | 2,028,000 | 1,543,000 | 23.9 | % | 10.15 | 3.52 | 13.67 | 14.04 | 2.7 | % | ||||||||||||||||||||||||||||
| MA | full | 4 | A- | 3,347,000 | 2,749,000 | 17.9 | % | 10.71 | 4.60 | 15.31 | 15.66 | 2.2 | % | ||||||||||||||||||||||||||||
| NH | none | 3 | BBB+ | 522,000 | 377,000 | 27.8 | % | 9.60 | 7.99 | 17.59 | 18.50 | 5.2 | % | ||||||||||||||||||||||||||||
| NJ | recourse | 4 | BBB+ | 3,377,000 | 2,913,000 | 13.7 | % | 13.06 | 2.67 | 15.73 | 15.89 | 1.0 | % | ||||||||||||||||||||||||||||
| NY | full | 6 | BBB+ | 5,811,000 | 4,486,000 | 22.8 | % | 12.02 | 8.04 | 20.06 | 18.54 | -7.6 | % | ||||||||||||||||||||||||||||
| full | 1 | BBB- | 618,000 | 316,000 | 48.9 | % | |||||||||||||||||||||||||||||||||||
| OH | in process: | 1 | BBB- | 1,274,000 | 885,000 | 30.5 | % | 6.51 | 6.08 | 12.59 | 12.69 | 0.8 | % | ||||||||||||||||||||||||||||
| none | 4 | BBB- | 2,303,000 | 740,000 | 67.9 | % | |||||||||||||||||||||||||||||||||||
| PA | full | 10 | BBB | 4,985,000 | 3,187,000 | 36.1 | % | 9.13 | 4.22 | 13.35 | 13.92 | 4.3 | % | ||||||||||||||||||||||||||||
| RI | none | 1 | BBB+ | 493,000 | 457,000 | 7.3 | % | 10.39 | 6.84 | 17.23 | 19.35 | 12.3 | % | ||||||||||||||||||||||||||||
| TX | none | 6 | BBB+ | 5,986,000 | 2,144,000 | 64.2 | % | — | — | 11.86 | 11.66 | -1.7 | % | ||||||||||||||||||||||||||||
| Sum/avg | 54 | BBB+ | 38,032,000 | 20,542,000 | 08.1 | % | 0.82 | 5.64 | 15.20 | 15.73 | 3.5 | % | |||||||||||||||||||||||||||||
| full | 31 | BBB+ | 22,794,000 | 14,977,000 | 34.3 | % | |||||||||||||||||||||||||||||||||||
| recourse | 4 | BBB+ | 3,377,000 | 2,913,000 | 13.7 | % | |||||||||||||||||||||||||||||||||||
| in process: | 2 | BBB+ | 1,517,000 | 1,094,000 | 27.9 | % | |||||||||||||||||||||||||||||||||||
| none | 17 | BBB | 10,344,000 | 4,558,000 | 55.9 | % | |||||||||||||||||||||||||||||||||||
| Sum/avg | 54 | BBB+ | 38,032,000 | 20,542,000 | 08.1 | % | |||||||||||||||||||||||||||||||||||
Sources
ABACCUS 2015; EIA Electric Power Annual 2014; EEI website accessed March 4, 2015; Company analysis of company websites.
Notes
| 1 | “Energy Only” providers sell energy to customers and incumbent utilities provide “Delivery Only” services for these customers. In Texas, customers served by REPs must be provided with bundled energy and delivery services. |
| 2 | “Switch rate” refers to the percentage of customers that have migrated away from the incumbent provider’s default service product (the standard offer, basic service, generation service, etc.). |
| 3 | In Texas’ competitive markets (ERCOT), all eligible residential customers take competitive electric service and the switch rate indicates the number not served by the incumbent retail energy provider. Total eligible customers refer to those within ERCOT, or about 60% of the 9,954,000 residential accounts in the state. |
| 22 |
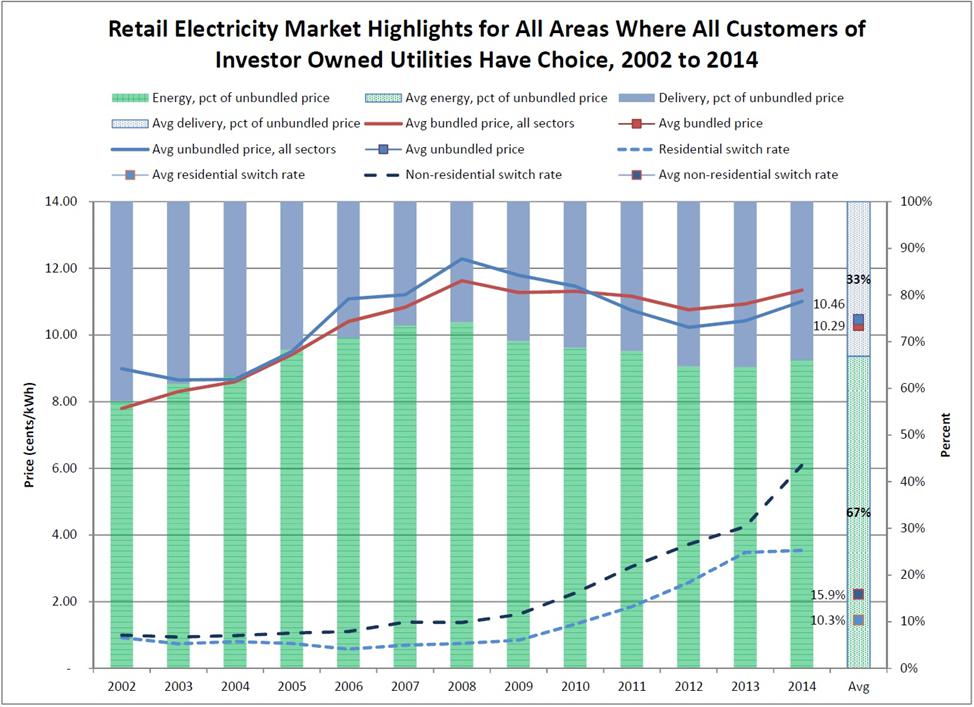
Overall, we believe that choice is proving to be a boon for consumers with respect to providing them with the ability to manage their electricity costs. According to an analysis of data from the EIA, between 2002 and 2014, retail rates for all customer sectors in states with restructured retail markets increased by 47.2% compared with a 39.5% increase in states that rely on regulated utilities. However, as shown by the chart below, unbundled prices in all Type 1 areas since 2011 have been consistently lower that the bundled service offered by the incumbent utilities.
Unbundling of electric bills in restructured markets made many aware for the first time exactly what they were paying for. In general, the bills of retail electricity customers include numerous costs and charges that can be classified into energy costs, delivery charges, and governmental policy costs. These include the costs of federal and state polices with respect to electricity and may include transition charges or costs associated with moving from a regulated market to a restructured one, allowing EDCs to recapture stranded costs that would otherwise be unrecoverable after deregulation, societal benefits charges such as the costs of mandated programs such as universal service, lifeline service, and energy efficiency programs, and sales and use taxes collected by state and local authorities on retail electricity sales.
According to analysis of EIA data for states with restructured markets, on average between 2002 and 2014 (the latest year for which information is available) energy and delivery costs accounted for about 67% and 33%, respectively, of the average retail electricity price. Of course, these percentages fluctuate from year to year and state to state, primarily due to wholesale energy market conditions, weather, and state rules.
| 23 |
As of March 30, 2016, we are licensed in five full choice jurisdictions and are EDI compliant with three utilities serving a total of 4.5 million residential accounts. As of the same date, we have 1,587 confirmed customers. By the end of 2016, we plan on being licensed in all 14 Type 1 jurisdictions and EDI compliant with 50 IOUs serving about 38 million residential customers as shown by the table below:
Aspirity Energy Expected Market Rollout Plan
Last updated March 23, 2016
| ISOs | States | EDI
Ready IOU Service Areas | Accessable Customers (000s) | ||||||||||||||||||||||||||||||
| Period | Inc | EoP | Inc | EoP | Inc | EoP | Inc | EoP | |||||||||||||||||||||||||
| 2015 | 1 | 1 | 3 | 3 | 1 | 1 | 618 | 618 | |||||||||||||||||||||||||
| Jan 2016 | - | 1 | - | 3 | 1 | 2 | 3,463 | 4,081 | |||||||||||||||||||||||||
| Feb 2016 | - | 1 | 1 | 4 | 1 | 3 | 455 | 4,536 | |||||||||||||||||||||||||
| Mar 2016 | - | 1 | 3 | 7 | - | 3 | - | 4,536 | |||||||||||||||||||||||||
| Q1 2016 | - | 4 | 2 | 3,918 | |||||||||||||||||||||||||||||
| Apr 2016 | 1 | 2 | - | 7 | 6 | 9 | 5,566 | 10,102 | |||||||||||||||||||||||||
| May 2016 | 2 | 4 | 1 | 8 | - | 9 | - | 10,102 | |||||||||||||||||||||||||
| Jun 2016 | 1 | 5 | 2 | 10 | 12 | 21 | 6,214 | 16,316 | |||||||||||||||||||||||||
| Q2 2016 | 4 | 3 | 18 | 11,780 | |||||||||||||||||||||||||||||
| Jul 2016 | - | 5 | 4 | 14 | 2 | 23 | - | 16,316 | |||||||||||||||||||||||||
| Aug 2016 | - | 5 | - | 14 | 5 | 28 | 11,770 | 28,086 | |||||||||||||||||||||||||
| Sep 2016 | - | 5 | - | 14 | 9 | 37 | 2,897 | 30,983 | |||||||||||||||||||||||||
| Q3 2016 | - | 4 | 16 | 14,667 | |||||||||||||||||||||||||||||
| Oct 2016 | - | 5 | - | 14 | 1 | 38 | 7,011 | 37,994 | |||||||||||||||||||||||||
| Nov 2016 | - | 5 | - | 14 | 12 | 50 | - | 37,994 | |||||||||||||||||||||||||
| Dec 2016 | - | 5 | - | 14 | - | 50 | - | 37,994 | |||||||||||||||||||||||||
| Q4 2016 | - | - | 13 | 7,011 | |||||||||||||||||||||||||||||
| 2016 | 5 | 14 | 50 | 37,994 | |||||||||||||||||||||||||||||
Our services are made available to customers under fixed price contracts as well as some that may provide for renewable energy percentages in excess of state requirements. All contracts regardless of price, term, and renewable energy percentage are subject to standard terms and conditions as filed from time to time with state regulatory authorities. Retail customers make purchase decisions based on a variety of factors, including price, customer service, brand, product choices, bundles, or value-added features.
The prices we offer customers are determined by us and are not subject to regulation. The terms we offer are also determined by us, and we develop such to align with regulatory requirements within each state where we do business. The electricity we sell is generally metered and delivered to our customers by local utilities. As such, we do not have a maintenance or service staff for customer locations. These utilities also provide billing and collection services for the majority of our customers on our behalf, generally under the utility consolidated billing structure.
Although our marketing efforts just began in the first quarter of 2016, we plan to reach residential prospects utilizing offline and online marketing channels. The offline channel includes vehicles such as outbound telemarketing, door-to-door, direct mail, events, brokers, out-of-home, etc. The online channel includes paid search, display ads, retargeting ads, affiliate, email, state-run comparison-shopping engines, etc. Our goal is to invest an optimal amount in new customer acquisition, and focus on customer retention and the lifetime value inherent in satisfied customer relationships.
| 24 |
The retail energy business involves the purchase of electricity in wholesale markets and the virtually simultaneous resale of such to retail customers. In general, ISOs require payment for energy purchased on a weekly or twice-weekly basis. In some markets, retailers are also required to buy capacity and certain ancillary services on a monthly basis. In all cases, retailers are required to provide market operators with “financial assurance” or “collateral”, typically in the form of cash in an amount equal to 60 to 75 days’ worth of such purchases. However, retailers typically only receive payment from customers on a monthly basis. Consequently, a substantial amount of liquidity and capital may be required to both satisfy payables and carry receivables. We do not own any generation, transmission, or distribution facilities and utilize wholesale suppliers for our supply requirements and utilities for our transmission and distribution needs.
On March 30, 2016 we entered into a full requirements preferred supply agreement with Exelon Generation Company, LLC, a Pennsylvania limited liability company and wholly-owned subsidiary of Exelon Corporation (“Exelon”), to provide us with all the power and ancillary services we need to serve our customers for an initial term expiring on March 30, 2019 (the “PSA”). As of December 31, 2015, Exelon was the operator of the second largest generation fleet in the U.S. and its long-term S&P credit rating was BBB.
Under the terms of the PSA, on a daily or weekly basis as we request, Exelon will provide firm, fixed quotes for power for terms of one, 3, 6, 9, 12, 15, 18, 24, 27, 30, and 36 months out for each of the service areas in which we operate. Such quotes will include all costs of energy, capacity, and ancillary services necessary to serve residential and small commercial customers. We may also meet state minimum “green” energy supply criteria by acquiring renewable energy certificates or RECs from Exelon via the PSA. If necessary, we may also buy additional RECs to satisfy the requirements of customers selecting a product with a percentage of green power higher than state minimums. We then mark up these costs to obtain selling prices. In addition, under the PSA, Exelon absorbs all volumetric risk or deviations between forecasted and actual customer usage. Finally, the PSA provides that Exelon will post any collateral required of us by an ISO or EDC.
Exelon will invoice us for all purchases under the agreement every month. The PSA also incorporates the ability for us to defer payment of all or a portion of these invoices based on certain financial criteria as defined in the agreement. We are exposed to the risk that Exelon may fail to deliver. If this were to occur, we would then be forced to pledge collateral and buy the required power from either an ISO or another wholesale supplier and the costs of such may be higher or lower than those embodied in the PSA.
In connection with our retail electricity business, we intend to provide trade credit to our customers. We are considering implementing the policies and underwriting strategy presented below to allow us to accept any business by taking deposits only from the riskiest accounts. If implemented, collection activity and cost will be largely eliminated since if a customer fails to pay in a timely fashion, then we will simply cease providing service and apply the deposit to the outstanding bill. This credit policy is summarized as follows:
| ● | If a prospect is located in a POR area, we will accept the account as the utility is the account obligor. |
| ● | If a prospect is located in a non-POR area and is a residential account, we will check their three-bureau FICO score: |
| ● | If the score is above a certain threshold, we will accept the account without a deposit. | |
| ● | If the score is below the threshold, we will accept the account with a deposit equal to the dollar value of 90 days of expected energy sales. |
| 25 |
| ● | If a prospect is located in a non-POR area and is a non-residential account, we will check their trade credit score: |
| ● | If the score is above the threshold level, we will accept the account without a deposit. | |
| ● | If the score is below the threshold, we will accept the account with a deposit equal to the dollar value of 90 days of expected energy sales. |
| ● | To size any deposits required, we will estimate or check the account’s last 12 months of historical energy usage and the most recent average forecast wholesale energy price for the area for the next 12 months. Our general deposit sizing formula is as follows: Deposit = annual kWh usage x average energy price/kWh ÷ 100 x deposit factor of 25%. |
| ● | After a year of prompt payments on their account, the customer may elect to either have their deposit returned to them or applied to their account. |
| ● | If no payment has been received on an account for 60 days after an invoice date, a second invoice is sent, and if within 30 days of the date thereof: |
| ● | Full payment is received, then it is applied to the balance due and the account is returned to good standing. | |
| ● | Partial payment is received, then it is applied to the balance due and 15 days later, a new invoice is sent requesting payment of the new balance. | |
| ● | If a security deposit has been taken and payment is not received, then the account is closed and the security deposit applied. | |
| ● | If a security deposit has not been taken and payment is not received, the account is sent to a collection agency: |
| ● | If the agency’s collection effort is successful, then it will notify us via email with respect to the total amount they were able to collect, followed within two weeks by a receipt and check for the amount collected, less their fee. Customer accounts are not credited until the agency’s check is received. | |
| ● | If the collection effort is unsuccessful after 30 days, then the account balance will be written off. |
We will be competing with local utility companies in the areas where we provide service. Some utilities have affiliated companies that are retail energy suppliers, and many compete in the same markets as we do. We will also compete with large energy companies as well as many independent suppliers. Many of these competitors or potential competitors may be larger and better capitalized than we are. This competition exposes us to the risk of losing customers, especially since our customers generally do not sign long term contracts.
Annual and quarterly operating results of the Company can be significantly affected by weather and energy commodity price volatility. Significant other events, such as the demand for natural gas and interruptions in fuel supply infrastructure can increase seasonal fuel and power price volatility, with summer and winter being the most volatile seasons. The sale of electric power to retail customers is also a seasonal business. As a result, net working capital requirements for the Company’s retail operations generally increase during peak months and then decline during off-peak months. Weather may impact operating results and extreme weather conditions could materially affect results of operations. The rates charged to retail customers may be impacted by fluctuations in total power prices and market dynamics like the price of natural gas, transmission constraints, competitor actions, and changes in market heat rates.
As of March 30, 2016, we employed 11 persons, including four executives, four marketing and operations professionals, two accountants, and one administrative professional. We also utilize the services of one independent contractor. We have entered into employment agreements with all of our employees, do not employ any unionized labor, and are engaged in extensive hiring efforts to build staff.
To attract and retain qualified personnel, we employ a competitive compensation system that incorporates a base salary and annual cash bonuses based on job position and corporate performance. Employee benefits available through, or paid by, us include medical and dental insurance, a 401(k) plan, and unlimited time off.
We are required to comply with the rules and regulations of FERC, the CFTC with respect to energy futures contracts, the Federal Trade Commission, the market rules and tariffs of the ISOs and RTOs of which we are a member, and the rules and regulations of the various states in which we operate. In addition to regulating our operations, FERC regulations also require us to make certain filings and applications for approval prior to certain changes in our governance and ownership.
| 26 |
If any of the following risks actually occur, our business, financial condition, and results of operations would suffer. The risks described below are not the only ones we face. Additional risks that we currently do not know about or that we currently believe to be immaterial may also impair our business, financial conditions, and results of operations.
As a result of the recent Restructuring, our only current source of cash flow is payments from Enterprises on the Term Loan and sales of Notes.
We do not expect to have significant revenue-generating operations until the middle of 2016 at the earliest. Prior to that, we will rely on the timely payment of the Term Loan and on our ability to sell Notes in order to fund our retail energy start-up operations and repay Notes as they are redeemed. We are relying on the ability of Enterprises to pay amounts owed to us under the Term Loan to provide us with the funds necessary to repay our indebtedness on the Term Loan Notes. If Enterprises fails to pay amounts owed to us when due, or if our business does not provide enough cash to cover all of our liabilities, we may be unable to pay the interest or principal payments on the Notes as they become due. Enterprises’ ability to make timely payments on the Term Loan will, at least initially, depend on the wholesale energy trading operations of Enterprises’ subsidiaries, its major debtor, Angell, and the operations of the other legacy businesses. Wholesale energy trading is volatile and unpredictable, and was generally not profitable for Enterprises in 2015. In the event amounts owed to us are paid late or not paid, our ability to fund operations and repay notes will be negatively impacted.
Even after we begin generating revenue through our new retail energy business, those operations alone may not produce a sufficient return on investment to pay the stated interest rates on the Notes and fund our capital needs. We may be substantially reliant upon the proceeds we receive from the sale of Notes in order to meet our liquidity needs. We may not be able to attract new investors or have sufficient borrowing capacity when we need additional funds to repay principal and interest on Notes.
Our consolidated financial statements reflect the financial condition and results of operation of Enterprises.
Following the Distribution and until a reconsideration event as defined under GAAP occurs, we must consolidate Enterprises as a variable interest entity or “VIE”. Consequently, our consolidated financial statements include the financial condition and results of operations of Enterprises even though we do not have access to its assets except pursuant to our contractual rights and obligations with respect to the Term Loan. Enterprises is not a guarantor of the Notes. Investors should consider our financial condition in light of these facts and look only to the assets and expected operations of Aspirity in determining whether to invest. See “Critical Accounting Policies - Variable Interest Entities - Principles of Consolidation”.
As a result of the Distribution, we are in a start-up phase and before we can begin marketing our retail energy services to customers and generating revenue, we must apply for, and receive, the necessary licenses and enter into information exchange and billing arrangements with utilities.
We intend to develop and operate retail energy businesses in all 14 jurisdictions that allow all retail customers of investor-owned utilities to choose their electricity supplier. To do so, we require licenses from public utility commissions and other regulatory organizations. These agencies impose various requirements to obtain or maintain licenses. Further, certain non-governmental organizations have been focusing on the retail energy industry and the treatment of customers by certain of our competitors. Any negative publicity regarding the industry in general and us in particular could negatively affect our relationship with various commissions and regulatory agencies and could negatively impact our ability to obtain new licenses to expand operations or maintain the licenses currently held. Furthermore, we must also establish electronic connections (“EDI compliance”) with the utilities serving particular areas in such states in which we wish to market our services in order to exchange customer usage and billing information.
| 27 |
Although we expect most of these pre-market processes and procedures to be completed by the end of 2016, there can be no assurance that we will be able to achieve all of the arrangements we seek on a timely basis or at all or at an acceptable cost. Consequently, we may not be able to offer service in all of our target markets and failure to do so will adversely affect our ability to grow our business. Loss of licenses or failure to maintain EDI compliance could cause a negative impact on our results of operations, financial condition, and cash flow.
Volatility in prices and consumption could have an adverse effect on our revenues, costs, and results of operations.
Unexpected volatility in prices and constraints in the availability of fuel supplies, particularly natural gas, may have an adverse impact on the cost of the electricity that we sell to our customers. Furthermore, consumption of energy is significantly affected by weather conditions. Typically, colder-than-normal winters and hotter-than-normal summers create higher demand and consumption for natural gas and electricity, respectively, and conversely, milder than normal weather may reduce the demand for energy. Natural gas prices also affect the cost of electricity as it is the fuel of choice for marginal generation requirements. Although we expect to manage our exposure to these movements in wholesale energy prices and customer demand by use of the Exelon PSA, there can be no assurance that this strategy will prove to be successful.
Finally, we may not always choose to pass along increases in costs in order to maintain overall customer satisfaction and this action would have an adverse impact on our margins and results of operations. Alternatively, volatility in pricing related to the cost of energy may lead to increased customer attrition. Changes in these factors, as well as others, could have an adverse effect on our revenues, profitability, and growth, or threaten the viability of our current business model.
We face risks that are beyond our control due to our reliance on third parties and on the electrical power and transmission infrastructure within the U.S.
Our ability to provide energy to our customers depends on the successful and reliable operations and facilities of third parties such as generators, wholesale suppliers, the ISOs, and energy distribution companies. The loss of use or destruction of third party facilities used to generate, transmit, and distribute electricity due to extreme weather conditions, breakdowns, war, acts of terrorism, or other occurrences could greatly reduce our potential earnings and cash flows.
The retail energy business is highly competitive.
We will compete based on value added, price, provision of services, and customer service. Increasing our market share depends in part on our ability to persuade customers to switch to our services. Our retail energy business faces substantial competition both from incumbent utilities as well as from other retail providers, including affiliates of utilities in specific territories. Utilities and other more established competitors have certain advantages such as name recognition, financial strength, and long-standing relationships with customers. Additionally, overall customer demand for electricity may decrease if the prevalence of residential solar panel systems increases. The use of solar panel systems to generate power may allow residential customers to decrease their electricity consumption from providers like us or eliminate it altogether. Persuading potential customers to switch to a new supplier of such important services is challenging. As a result, we may be forced to reduce prices or incur increased costs to gain market share, and we may not always be able pass along increases in commodity costs to customers. Existing or future competitors may have greater financial, technical, or other resources which could put us at a disadvantage. If we are not successful in convincing customers to switch, our business, results of operations, and financial condition will be adversely affected.
| 28 |
Our growth depends on our ability to enter new markets.
We evaluate new markets for our business based on many factors, including the regulatory environment and our ability to procure energy to serve customers in a cost-efficient manner. We may expend substantial effort to obtain required licenses and connections with local distribution companies. Furthermore, there are regulatory differences between the markets that we currently operate in and new markets, including, but not limited to, exposure to credit risk, additional churn caused by tariff requirements, rate-setting requirements, and incremental billing costs. We may also incur significant customer acquisition costs.
Unfair business practices or other activities of our competitors may adversely affect us.
Competitors in the retail market may engage in unfair business practices to sign up new customers, which may create an unfavorable impression about the industry on consumers or with regulators. Such unfair practices by other companies can adversely affect our ability to grow or maintain our customer base. The successes, failures, or other activities of our competitors within the markets that we serve may impact how we are perceived in the market.
Our operating strategy is based on current regulatory conditions and assumptions, which could change or prove to be incorrect.
Since the passage of PURPA in 1978, regulation of the energy markets has been in flux at both the federal and state levels. In particular, any changes adopted by FERC, or changes in state or federal laws or regulations, including environmental laws, may affect the prices at which we purchase energy for our customers. We may not always be able to pass these costs on to our customers due to competitive market forces and the risk of losing our customer base. In addition, regulatory changes may impact our ability to use different sales and marketing channels. Changes in these factors, as well as others, could have an adverse effect on our revenues, profitability, and growth or threaten the viability of our current business model.
Changes in certain programs in which we plan to participate could disrupt our operations and adversely affect our results.
Certain programs required by state regulators have been implemented by utilities in many of the service territories in which we intend to operate, one of which is purchase of receivables or POR. These programs are important to our control of bad debt. In the event that POR programs were to be revised or eliminated by state regulators or individual utilities, we would need to adjust our current strategy regarding customer acquisition and our focus on the growth of our customer base. We would also need to adjust our current business plan to reduce our exposure to customers who may pose a bad debt risk. Any failure to properly respond to changing conditions could adversely affect our results of operations and profitability. See also “Item 1 - Business – Credit Risk Management”.
| 29 |
Our business is subject to complex governmental regulations and legislation that have impacted, and may in the future impact, our businesses and results of operations.
We are subject to the jurisdiction of federal and state authorities, including FERC, the CFTC, the SEC, the Federal Trade Commission, and the public utilities commissions of the states in which we do business as well as the market rules and tariffs of the ISOs of which we are a member. These rules and regulations are subject to legislative change, judicial interpretation, and regulatory actions, any which may increase our costs and adversely impact our business.
Changes in, revisions to, or reinterpretations of existing laws and regulations, for example, with respect to prices at which we may sell electricity, or competition in its generation and sale, may have an adverse effect on our businesses. For example, many electricity markets have rate caps, and changes to these rate caps by regulators can impact future price exposure. Similarly, regulatory changes can result in new fees or charges that may not have been anticipated when existing retail contracts were drafted, which can create financial exposure. For example, mandates to purchase a certain quantity or type of electricity capacity can create unanticipated costs. Our ability to manage cost increases that result from regulatory changes will depend, in part, on how the “change in law provisions” of our contracts are interpreted and enforced, among other factors.
Operators of systems providing for the delivery of natural gas and electricity maintain detailed tariffs that are kept on file with regulators. These tariffs and market rules applicable to operators are often very long and complex, and often are subject to service provider proposals to change them. We may not be able to prevent adoption of adverse tariff changes. Users of energy delivery systems also have rules and obligations applicable to them that are established by regulators. For instance, transactions involving a shipper’s release of interstate pipeline capacity are subject to regulation at the federal level. Our failure to abide by tariffs, market rules, or other delivery system rules may result in fines, penalties, and damages.
We are also subject to regulatory scrutiny in all of our markets that can give rise to compliance fees, licensing fees, or enforcement penalties. Regulations vary widely in the markets in which we operate, and these regulations change from time to time. Failure to follow prescribed regulatory guidelines could result in customer complaints and regulatory sanctions.
In addition, regulators are continuously examining certain aspects of our industry. For example, a number of public utility commissions in the Northeast are investigating the impact of the harsh weather conditions during the 2013-2014 winter season on consumers in their territories due to the number of consumer complaints attributable to high bills for the winter season and are urging FERC to investigate circumstances during that period in wholesale energy markets. This heightened regulatory scrutiny resulted in additional obligations on retailers in various markets to provide more detailed disclosures to consumers as well as additional and more stringent requirements on notifying customers when their fixed contract converts to variable pricing. These new regulations could adversely affect our customer attrition rates and cause us to incur higher compliance costs. To the extent any of these commissions takes further regulatory action to address these complaints, such as imposing limits on products, services, rates or other business limitations, our business prospects in these regions could be materially adversely affected.
| 30 |
Finally, door-to-door marketing and outbound telemarketing may become a significant part of our marketing efforts. Each of these channels is continually under scrutiny by state and federal regulators and legislators. Additional regulation or restriction of these marketing practices could negatively impact our customer acquisition plan, and therefore our financial results and our ability to pay the notes.
We may make poor investment choices, or be subject to a conflict of interest.
Aspirity Financial will be in the business of lending money to companies and households for energy related purposes, as well as continuing to provide funds to Enterprises and financing our own liquidity needs. There may be conflicting demands for cash from multiple sources.
Because Mr. Krieger is both a significant owner of Aspirity and the owner of Enterprises, there may be a conflict of interest in determining how liquidity is used.
In addition, some or all of the parties which borrow from us may be unable to repay their obligations, which would have a material adverse effect on us.
We need substantial liquidity to operate our business.
Historically, we have funded our operations through borrowings from related and unrelated parties and internally generated cash flows. Beginning in May 2012, we began a direct public offering of our Notes. Up to February 29, 2016, we have sold $31,366,000 of Notes and paid $6,231,000 of redemptions, for a net raise to date of $25,135,000 exclusive of offering costs. As of March 30, 2016, there were $25,059,000 of Notes outstanding. The Notes Offering supplies us with liquidity to operate. However, we may not be able to obtain sufficient funding for our future operations from such source to provide us with necessary liquidity. Difficulty in obtaining adequate credit and liquidity on commercially reasonable terms may adversely affect our business, prospects, and financial condition.
We could be harmed by network disruptions, security breaches, or other significant disruptions, or failures of our information technology infrastructure and related systems.
We face the risk, as does any company, of a breach of the security of, and unauthorized access to, our information systems, whether through cyber-attack, malware, computer viruses, or sabotage. Furthermore, the secure maintenance and transmission of information between us and our third party service providers is a critical element of our operations. If our information security were to be breached, our information and that of our customers may be lost, disclosed, accessed, or taken without our consent. Although we make significant efforts to maintain the security and integrity of our information systems, there can be no assurance that our efforts and measures will be effective or that attempted breaches or disruptions would not be successful or damaging, especially in light of the growing sophistication of cyber-attacks and intrusions. We may be unable to anticipate all potential types of attacks or intrusions or to implement adequate security barriers or other preventative measures.
Network disruptions, security breaches, and other significant failures of the information systems upon which we depend could: (a) disrupt the proper functioning of our operations; (b) result in unauthorized access to, and destruction, loss, theft, misappropriation, or release of our proprietary, confidential, sensitive, or otherwise valuable information, including trade secrets, which others could use to compete against us or for disruptive, destructive, or otherwise harmful purposes and outcomes; (c) require significant management attention and financial resources to remedy the resulting damage or change to our systems; (d) result in a loss of business or damage to our reputation; or (e) expose us to litigation, any or all of which could have a negative impact on our results of operations, financial condition, and cash flows.
| 31 |
Shortcomings or failures in our internal control processes could lead to disruption of our business, financial loss, or regulatory intervention.
We rely on our internal control systems to protect our operations from, among other things, improper activities by individuals within our organization. Shortcomings or failures in our systems, internal control processes, or people could lead to disruption of our business, financial loss, or regulatory intervention.
Our business depends on the continuing efforts of our management team and personnel and our efforts may be severely disrupted if we lose their services.
Our success depends on key members of our management team, the loss of whom could disrupt our business operations. Our business also requires a capable, well-trained workforce to operate effectively. There can be no assurance that we will be able to retain our qualified personnel, the loss of which may adversely affect our business, prospects, and financial condition.
We are dependent on the services of our senior management because of their knowledge of the industry and our business. The loss of one or more of these key employees could seriously harm our business. It may be difficult to find a replacement with the same or similar level of knowledge. Competition for these types of personnel is high, and we may not be able to attract and retain qualified personnel on acceptable terms. Failure to recruit and retain such personnel could adversely affect our business, financial condition, results of operations and planned growth.
The characteristics of our Notes, including the offered maturities and interest rates, and lack of collateral security, guarantee, financial covenants, or liquidity, may not satisfy your investment objectives.
Our Notes may not be suitable for every individual, and we advise all parties considering an investment to consult their investment, tax, and other professional financial advisors prior to purchasing Notes. The characteristics of the Notes, including their maturities, interest rates, and lack of liquidity, collateral security, guarantee, and financial covenants may not satisfy your investment objectives. The Notes may not be a suitable investment based on the ability to withstand a loss of interest or principal or other aspects of an individual’s financial situation, including income, net worth, financial needs, risk profile, return objectives, experience, and other factors. Prior to purchasing any Notes, one should consider their investment allocation with respect to the amount of the contemplated investment in the Notes in relation to their other investment holdings and the diversity of those holdings. While we require that you complete a subscription agreement that asks certain questions regarding suitability, we disclaim any responsibility for determining that the Notes are a suitable investment for anyone.
Please refer to our Prospectus for additional risk factors related to the Notes.
Item 1B – Unresolved Staff Comments
Not applicable.
Our headquarters is located at 701 Xenia Avenue South, Suite 475, Minneapolis, MN 55416, telephone (463) 432-1500. Our sub-lease is for 8,003 square feet, expires on May 31, 2019, and the monthly rent is $10,671. We do not engage in any production or manufacturing activities, and we do not have any environmental issues related to our operations.
See “Item 8 - Financial Statements and Supplementary Data – Notes to Consolidated Financial Statements – Note 19 Commitments and Contingencies”.
Item 4 – Mine Safety Disclosures
Not applicable.
| 32 |
Item 5 – Market for Registrant’s Common Equity, Related Stockholder Matters and Issuer Purchases of Equity Securities
Not applicable.
Use of Proceeds of Notes Offering
We registered $75 million of Notes under our New S-1. Since renewals reduce the aggregate amount of registered securities available for sale but generate no additional cash, we have based our use of proceeds on the estimated maximum net proceeds we expect to receive from initial sales. If all $75 million of Notes are sold, and the renewal rate remains consistent with the historic levels experienced since 2012, we would expect to receive about $50 million of net proceeds after payment of estimated expenses.
The exact amount of net proceeds will vary considerably depending on the duration of the Notes Offering, the maturities of Notes purchased, actual renewal rates, actual advertising and marketing expenses, and other factors. We will not receive the net proceeds in a single closing and will use the proceeds as we sell Notes.
We expect to apply net proceeds to the following corporate purposes, listed in order of priority with the expected level of expenditure being detailed in the table that follows:
| ● | General working capital: will be used to fund our start-up operations and will likely include the payment of general and administrative expenses, such as salaries for the personnel necessary to begin operations; |
| ● | Retail energy customer list acquisitions: one way we intend to build our retail energy business through Aspirity Energy and its operating subsidiaries; |
| ● | Commercial energy financings: Aspirity Financial will make commercial loans to businesses operating in the energy industry, including making additional loans to Enterprises, probably of at least $5,000,000; |
| ● | Retail energy entity acquisitions: another way we may build our retail energy business although we have no current targets; and |
| ● | Consumer financing: Aspirity Financial may make loans to individuals and households, however this will not begin until after we have our retail energy operations established, if at all. |
The following table summarizes the above information regarding our intended use of $50 million of net proceeds, and sets forth our expected allocation of the net proceeds if we raise less than that amount:
| Use of proceeds | Dollars (000s) | Percent | Dollars (000s) | Percent | Dollars (000s) | Percent | ||||||||||||||||||
| General working capital | $ | 7,500 | 15 | % | $ | 4,000 | 16 | % | $ | 3,000 | 20 | % | ||||||||||||
| Retail energy customer list acquisitions | 10,000 | 20 | % | 5,000 | 20 | % | 4,000 | 27 | % | |||||||||||||||
| Commercial energy financings | 20,000 | 40 | % | 10,000 | 40 | % | 5,000 | 33 | % | |||||||||||||||
| Retail energy entity acquisitions | 10,000 | 20 | % | 5,000 | 20 | % | 3,000 | 20 | % | |||||||||||||||
| Consumer financing | 2,500 | 5 | % | 1,000 | 4 | % | — | 0 | % | |||||||||||||||
| Net proceeds | $ | 50,000 | 100 | % | $ | 25,000 | 100 | % | $ | 15,000 | 100 | % | ||||||||||||
| 33 |
Item 6 – Selected Consolidated Financial Data
The following table sets forth selected consolidated financial data for the last two years derived from the audited consolidated financial statements of Aspirity Holdings LLC.
The information is only a summary and you should read it in conjunction with “Management’s Discussion and Analysis of Financial Condition and Results of Operation” beginning on page 40 and our consolidated financial statements and notes thereto found in “Financial Statements and Supplementary Data” beginning on page 61.
| Dollars in thousands unless otherwise indicated | Years ended December 31 | |||||||
| 2015 | 2014 | |||||||
| Statements of Operations Data | ||||||||
| Net revenue | $ | 48,124 | $ | 49,841 | ||||
| Total operating expenses | 52,489 | 43,402 | ||||||
| Operating income (loss) | (4,365 | ) | 6,440 | |||||
| Net other income (expense) | (444 | ) | (2,661 | ) | ||||
| Income (loss) before income taxes | (4,809 | ) | 3,779 | |||||
| Income tax benefit | (47 | ) | - | |||||
| Net income (loss) | (4,762 | ) | 3,779 | |||||
| Preferred distributions | (549 | ) | (549 | ) | ||||
| Noncontrolling interests | (468 | ) | - | |||||
| Net income attributable to common | $ | (4,843 | ) | $ | 3,230 | |||
| Ratio of earnings to fixed charges (1) | -0.21 | x | 2.47 | x | ||||
| Balance Sheet Data | ||||||||
| Cash and trading deposits | $ | 10,379 | $ | 23,497 | ||||
| Total assets | 28,999 | 31,770 | ||||||
| Total debt | 27,630 | 19,288 | ||||||
| Total liabilities | 37,050 | 29,072 | ||||||
| Total members’ equity | 1,098 | 2,698 | ||||||
| 1 | Fixed charges include interest expense, one-third of operating lease rental expense as reported in the footnotes to our financial statements, and amortization of deferred financing costs. We have included one-third of the operating lease rental expense because that is the portion the Company estimates to be the interest component attributable to such rent expense, with the remaining two-thirds considered to be depreciation. |
| 34 |
Item 7 – Management’s Discussion and Analysis of Financial Condition and Results of Operation
The following discussion (the “MD&A”) should be read in conjunction with our consolidated financial statements and notes thereto and other information appearing elsewhere in this report.
Statements in this report that are not statements of historical facts are considered “forward-looking” and, accordingly, involve risks and uncertainties that could cause actual results to differ materially from those discussed. Although such forward-looking statements have been made in good faith and are based on reasonable assumptions, there is no assurance that the expected results will be achieved. Any statements that express, or involve discussions as to, future expectations, risks, beliefs, plans, objectives, assumptions, events, uncertainties, financial performance, or growth strategies, often, but not always, through the use of words or phrases such as “anticipates”, “believes”, “estimates”, “expects”, “intends”, “plans”, “projects”, “likely”, “will continue”, “could”, “may”, “potential”, “target”, “outlook”, or words of similar meaning are not statements of historical facts and may be forward-looking.
In connection with the safe harbor provisions of the Private Securities Litigation Reform Act of 1995, we are providing this cautionary statement to identify important factors that could cause our actual results to differ materially from those indicated in forward-looking statements made by or on behalf of the Company in this Form 10-K, in presentations, on our website, in response to questions, or otherwise. You should not place undue reliance on any forward-looking statement. Examples of forward-looking statements include, among others, statements we make regarding:
| ● | Expected operating results, such as revenue growth and earnings; |
| ● | Anticipated levels of capital expenditures and expansion of our retail electricity business segment; |
| ● | Current or future price volatility in the energy markets and future market conditions; |
| ● | Our belief that we have sufficient liquidity to fund our operations during the next 12 months; |
| ● | Expectations of the effect on our financial condition of claims, litigation, environmental costs, contingent liabilities, and governmental and regulatory investigations and proceedings; and |
| ● | Our strategies for risk management. |
Any forward-looking statement speaks only as of the date on which such statement is made, and we undertake no obligation to update any forward-looking statement to reflect events or circumstances after the date on which that statement is made or to reflect the occurrence of unanticipated events. New factors emerge from time to time, and it is not possible for management to predict all of these factors, nor can it assess the impact of each of these factors on the businesses of the Company or the extent to which any factor, or combination of factors, may cause actual results to differ materially from those contained in any forward-looking statement.
These statements are qualified in their entirety by reference to, and are accompanied by, the factors detailed in “Risk Factors” of this Form 10-K, in addition to any assumptions and other factors referred to specifically in connection with such forward-looking statements that could cause our actual results to differ materially from those indicated in the forward-looking statements.
| 35 |
The risk factors and forward looking statements described involve risks and uncertainties and are not the only ones facing our Company.
Additional risks and uncertainties that we are not presently aware of, or that we currently consider immaterial, may also affect our business, financial condition, or results of operations.
Important Note Regarding Recent Restructuring
On the Distribution Date, the Company completed a significant Restructuring by distributing 100% of the equity interests of Enterprises to its members. Enterprises was a first tier, wholly owned subsidiary of the Company, which held nearly all of the Company’s business operations. The details of the Restructuring are described above under “The Restructuring”.
While we no longer have an ownership interest in Enterprises and its subsidiaries, an assessment of the relationship between the Company and Enterprises following the Distribution was performed because Timothy Krieger is a related party of both Aspirity and Enterprises, and because the entities have an ongoing business relationship resulting from the Term Loan. Aspirity holds a variable interest in Enterprises in the form of the Term Loan, making Enterprises a VIE. Following the Distribution Date, Aspirity will be the primary beneficiary of the VIE and will consolidate Enterprises. While the Company will include the assets and net income of Enterprises in its consolidated financial statements, the Company does not have rights to those assets other than pursuant to its rights under the Term Loan. We will reevaluate the status of Enterprises as a VIE on a regular basis. See “Critical Accounting Policies – Variable Interest Entities”.
Much of the discussion that follows focuses on our operations prior to the Restructuring. Our financial condition and operations will be significantly different from prior periods because we have distributed all of our Legacy Businesses. Going forward, we no longer have any wholesale trading activities, which historically accounted for 29.7%, and 77.5% of our total revenues for the years ended December 31, 2015 and 2014, respectively. While we have begun new retail energy service activities within the last few months, our historical financial statements reflect the results from the operations of our former retail energy service activities through REH, which we no longer own or operate.
Prior to the start of the Restructuring, the Company’s name was Twin Cities Power Holdings and its active first tier subsidiaries consisted of Apollo, TCP, CTG, Cygnus, REH, and Cyclone. These subsidiaries operated in three major business segments – wholesale trading, retail energy services, and diversified investments. As part of the Restructuring, the Company has exited these Legacy Businesses.
The Company is now in the process of beginning operations in two business segments - retail energy, which we will operate through Aspirity Energy and financial services, which we will operate through Aspirity Financial. In connection with the Exelon PSA, we merged AENE and AEMS into Aspirity Energy. Aspirity Energy will then serve retail customers in the PJM, MISO, NYISO, and ISO-NE footprints and its wholly owned subsidiary, AES, will serve those in ERCOT.
Until we are able to generate revenue from our new Aspirity Energy operations, our cash flows will be derived almost entirely from payments we receive from Enterprises on the Term Loan and the sale of Notes.
| 36 |
Operations Prior to the Restructuring
Prior to the Restructuring, through wholly-owned subsidiaries, the Company traded financial and physical electricity contracts in North American wholesale markets regulated by FERC and operated by ISOs and RTOs, traded energy derivative contracts on exchanges regulated by the CFTC, including ICE, NGX, and CME, provided electricity supply services to retail customers in certain states that permit retail choice, and was engaged in certain asset management activities, including real estate development and investments in privately held businesses. Consequently, we used to have three major business segments used to measure our activity – wholesale trading, retail energy services, and diversified investments.
Wholesale Trading
In general, the Company’s trading activities, which were done through TCP, CTG, and Cygnus, were characterized by the acquisition of electricity or other energy-related commodities at a given location and its delivery to another. “Financial” transactions settle in cash in an amount equal to the difference between the purchase and sale prices, while “physical” transactions are settled by the delivery of the commodity. The ISO-traded financial contracts known as “virtuals”, i.e., INCs, DECs, and UTCs, are outstanding overnight, and settle the next day. FTRs are also offered by the ISOs and may be outstanding overnight or longer. The Company also traded electricity and other energy derivatives on ICE, NGX, and CME.
For the years ended December 31, 2015 and 2014, financial and virtual electricity represented 100% of our total trading volume in FERC-regulated markets, that is, we traded no physical power during these periods in our wholesale segment.
As a result of the Restructuring, the Company is no longer involved in the wholesale trading business as the sale of TCP and SUM to Angell closed on June 1, 2015 and CTG and Cygnus were transferred as of the Distribution Date. We do not intend to engage in wholesale trading in the future.
Retail Energy Services
On June 29, 2012, we acquired certain assets and the business of a small retail energy supplier serving residential and small commercial markets in Connecticut. The business was renamed TSE and beginning on July 1, 2012, the Company began selling electricity to retail accounts. During late 2012 and early 2013, we applied for retail electricity supplier licenses for the states of Massachusetts, New Hampshire, and Rhode Island which were issued on various dates in 2013. On January 2, 2014, we acquired a retail energy business now known as TSEE and licensed by the states of Maryland, New Jersey, Pennsylvania, and Ohio. The equity interests of TSE and TSEE were held by REH. The 8 states in which REH’s subsidiaries were licensed incorporated the service territories of 33 investor-owned electric utilities and as of December 31, 2015, REH was actively marketing its services in 29 of these.
Effective with the Distribution Date, we no longer own REH. However, we began to compete in the retail energy business as Aspirity Energy and we intend expand these operations as we receive the necessary licenses and establish the necessary relationships with utilities.
Diversified Investments
On October 23, 2013, we formed Cyclone as a wholly-owned subsidiary to take advantage of certain perceived investment opportunities present in the residential real estate market. Specifically, we acquired and intended to develop land for resale, either as improved sites for construction of single- and multi-family homes or as completed dwellings. Properties owned by Cyclone include Fox Meadows Townhome Project, Territory House Project, and the Texas Avenue Project. At various dates during 2014 up to and including September 1, 2015, we also acquired certain private investments, including the Series C Convertible Promissory Notes of Ultra Green Packaging, Inc. (the “Series C Notes” and “Ultra Green”, respectively), the Angell Note, and a controlling equity interest in Noble.
In connection with the Restructuring, the Company transferred Cyclone and its private investment portfolio to Enterprises and we do not intend to engage in these types of diversified investment activities in the future.
| 37 |
Derivative Instruments
In our wholesale operations, we used derivative contracts for trading purposes, seeking to profit from perceived opportunities driven by expected changes in market prices. These contracts include exchange-traded instruments such as futures contracts, which are Level 1 instruments in the fair value hierarchy as well as FTRs available through certain FERC-regulated markets, which we consider to be Level 3 instruments as they are not regularly quoted. See “Item 8 – Financial Statements and Supplementary Data, Notes to Consolidated Financial Statements, Note 8 – Fair Value Measurements” for additional information.
During 2014, we acquired the majority of our FTRs in auctions conducted by ISOs, including MISO, PJM, NYISO, ISO-NE, and ERCOT. We initially recorded these FTRs at the auction price less the obligation due to the ISO, typically zero, and subsequently adjusted the carrying value of remaining FTRs to their estimated fair value at the end of each accounting period prior to settlement. Like the other derivatives traded, changes in the fair value of FTRs were included in our wholesale trading revenues. As of May 31, 2015, we no longer had any open FTR positions.
REH’s retail business is exposed to volatility in the cost of energy acquired for sale to customers, and as a result, we used derivatives to hedge or reduce this variability. REH follows GAAP guidance that permits “hedge accounting”. To qualify for hedge accounting, the relationship between the “hedged item” - say power purchases for a given delivery zone - and a derivative used as a “hedging instrument” - say, a swap contract for future delivery of electricity at a related hub - must meet extensive documentation requirements and hedge effectiveness and ineffectiveness must be assessed and measured on an on-going basis.
For these derivatives “designated” as cash flow hedges, the effective portion of any change in the hedging instrument’s fair value is recorded as other comprehensive income and deferred until the change in value of the hedged item is recognized in earnings. REH’s risk management policies also permit the use of undesignated derivatives as “economic hedges”. For an undesignated economic hedge, all changes in the derivative financial instrument’s fair value are recognized currently in revenues.
Effective with the Distribution Date, we no longer own Enterprises and its associated derivative instruments.
| 38 |
The table below details the open derivative contracts held for trading purposes, as undesignated, economic hedges by our retail segment, and as cash flow hedges by our retail segment as of December 31, 2015 and 2014.
Open Derivative Contracts Held for Trading
As of December 31, 2015
| Date, segment and | Delivery | Final | Energy | Fair Value | ||||||||||||||||
| contract type | Hub or zone | period | settlement | (MWh) | Asset | Liability | ||||||||||||||
| Wholesale Trading | ||||||||||||||||||||
| Electricity futures | AESO | Q1 2016 | various | 8,680 | $ | 22,086 | $ | 56,639 | ||||||||||||
| Electricity futures | AESO | Q2 2016 | various | 22,200 | 29,551 | 137,623 | ||||||||||||||
| Subtotal | 30,880 | 51,636 | 194,262 | |||||||||||||||||
| Retail Energy Services Economic Hedges | ||||||||||||||||||||
| Electricity futures | PJM West Hub | Q1 2016 | various | 6,720 | 2,268 | 5,764 | ||||||||||||||
| Electricity futures | PJM West Hub | Q2 2016 | various | 5,120 | 21,188 | |||||||||||||||
| Electricity futures | PJM West Hub | Q3 2016 | various | 5,120 | 18,800 | 8,988 | ||||||||||||||
| Electricity futures | PJM West Hub | Q4 2016 | various | 5,040 | 30,156 | |||||||||||||||
| Subtotal | 22,000 | 21,068 | 66,096 | |||||||||||||||||
| Totals | 52,880 | $ | 72,704 | $ | 260,358 | |||||||||||||||
As of December 31, 2014
| Date, segment and | Delivery | Final | Energy | Fair Value | ||||||||||||||||||
| contract type | Hub or zone | period | settlement | (MWh) | Asset | Liability | ||||||||||||||||
| Wholesale Trading | ||||||||||||||||||||||
| Electricity futures | PJM West Hub | daily | daily | 6,400 | $ | 22,400 | $ | - | ||||||||||||||
| FTRs | MISO, NYISO, PJM | Q1 & Q2 2015 | various | 8,981,440 | 1,435,819 | - | ||||||||||||||||
| Electricity futures | AESO | Q1 2015 | various | 80,320 | 785,617 | 286,250 | ||||||||||||||||
| Electricity futures | AESO | Q2 2015 | various | 135,600 | 892,838 | 1,094,059 | ||||||||||||||||
| Electricity futures | AESO | Q3 2015 | various | 78,120 | 601,993 | 783,893 | ||||||||||||||||
| Subtotal | 9,281,880 | 3,738,667 | 2,164,202 | |||||||||||||||||||
| Retail Energy Services - Economic Hedges | ||||||||||||||||||||||
| Electricity futures | ISO-NE Mass Hub; PJM West Hub | Q1 2015 | various | 3,715 | - | 44,373 | ||||||||||||||||
| Electricity futures | PJM West Hub | Q2 2015 | various | 14,280 | - | 107,120 | ||||||||||||||||
| Natural gas futures | Henry Hub | Q2 2015 | various | 155,000 | 14,803 | - | ||||||||||||||||
| Electricity futures | PJM West Hub | Q3 2015 | various | 16,240 | 31,926 | 65,196 | ||||||||||||||||
| Natural gas futures | Henry Hub | Q3 2015 | various | 77,500 | 1,085 | - | ||||||||||||||||
| Electricity futures | PJM West Hub | Q4 2015 | various | 21,285 | - | 175,971 | ||||||||||||||||
| Subtotal | 288,020 | 47,814 | 392,660 | |||||||||||||||||||
| Retail Energy Services - Designated Cash Flow Hedges | ||||||||||||||||||||||
| Electricity futures | ISO-NE Mass Hub | Q1 2015 | various | 13,995 | - | 498,166 | ||||||||||||||||
| Electricity futures | ISO-NE Mass Hub | Q2 2015 | various | 16,120 | - | 184,378 | ||||||||||||||||
| Electricity futures | ISO-NE Mass Hub | Q3 2015 | various | 18,480 | 15,732 | 189,116 | ||||||||||||||||
| Electricity futures | ISO-NE Mass Hub | Q4 2015 | various | 352 | - | 7,480 | ||||||||||||||||
| Subtotal | 48,947 | 15,732 | 879,140 | |||||||||||||||||||
| Total | 9,618,847 | $ | 3,802,213 | $ | 3,436,002 | |||||||||||||||||
| 39 |
Years Ended December 31, 2015 and 2014
The following table sets forth selected financial data for the periods indicated, which has been derived from the consolidated financial statements included in this report:
| For the Years Ended December 31, | ||||||||||||||||||||||||
| Dollars in thousands; may not add | 2015 | 2014 | Increase (decrease) | |||||||||||||||||||||
| due to rounding | Dollars | Percent | Dollars | Percent | Dollars | Percent | ||||||||||||||||||
| Revenue | ||||||||||||||||||||||||
| Wholesale trading revenue, net | $ | 14,293 | 29.7 | % | $ | 38,612 | 77.5 | % | $ | (24,318 | ) | -63.0 | % | |||||||||||
| Retail energy services | 30,483 | 63.3 | % | 11,229 | 22.5 | % | 19,253 | 171.5 | % | |||||||||||||||
| Diversified investments | 3,348 | 7.0 | % | - | 0.0 | % | 3,348 | na | ||||||||||||||||
| Total sales & services revenue | 33,831 | 70.3 | % | 11,229 | 22.5 | % | 22,601 | 201.3 | % | |||||||||||||||
| Net revenue | 48,124 | 100.0 | % | 49,841 | 100.0 | % | (1,717 | ) | -3.4 | % | ||||||||||||||
| Costs of sales & services | ||||||||||||||||||||||||
| Cost of retail electricity sold | 26,663 | 55.4 | % | 11,441 | 23.0 | % | 15,222 | 133.1 | % | |||||||||||||||
| Cost of real estate sold | 319 | 0.7 | % | - | 0.0 | % | 319 | na | ||||||||||||||||
| Cost of construction services | 1,704 | 3.5 | % | - | 0.0 | % | 1,704 | na | ||||||||||||||||
| Total | 28,686 | 59.6 | % | 11,441 | 23.0 | % | 17,246 | 150.7 | % | |||||||||||||||
| Gross profit (loss) | 5,144 | 10.7 | % | (211 | ) | -0.4 | % | 5,356 | 2435.8 | % | ||||||||||||||
| Operating expenses | ||||||||||||||||||||||||
| Sales & marketing | 1,353 | 2.8 | % | 325 | 0.7 | % | 1,028 | 316.4 | % | |||||||||||||||
| Compensation & benefits | 13,468 | 28.0 | % | 21,722 | 43.6 | % | (8,254 | ) | -38.0 | % | ||||||||||||||
| Professional fees | 2,463 | 5.1 | % | 2,487 | 5.0 | % | (24 | ) | -1.0 | % | ||||||||||||||
| Other general & administrative | 5,226 | 10.9 | % | 6,094 | 12.2 | % | (868 | ) | -14.2 | % | ||||||||||||||
| Trading tools & subscriptions | 1,293 | 2.7 | % | 1,333 | 2.6 | % | (40 | ) | -3.0 | % | ||||||||||||||
| Total operating expenses | 23,803 | 49.5 | % | 31,961 | 64.1 | % | (8,158 | ) | -25.5 | % | ||||||||||||||
| Operating income (loss) | (4,365 | ) | -9.1 | % | 6,440 | 12.9 | % | (10,890 | ) | -167.8 | % | |||||||||||||
| Other income (expense) | ||||||||||||||||||||||||
| Interest expense | (3,569 | ) | -7.4 | % | (2,293 | ) | -4.6 | % | (1,275 | ) | 55.6 | % | ||||||||||||
| Interest income | 829 | 1.7 | % | 143 | 0.3 | % | 686 | 480.2 | % | |||||||||||||||
| Gain on sale of subsidiary | 1,343 | 2.8 | % | - | 0.0 | % | 1,343 | na | ||||||||||||||||
| Impairment of convertible notes | (1,250 | ) | -2.6 | % | - | 0.0 | % | (1,250 | ) | na | ||||||||||||||
| Gain (loss) on foreign currency | ||||||||||||||||||||||||
| exchange | 356 | 0.7 | % | (721 | ) | -1.4 | % | 1,077 | 49 | % | ||||||||||||||
| Gain on sale of | ||||||||||||||||||||||||
| marketable securities | (130 | ) | -0.3 | % | 66 | 0.1 | % | (195 | ) | -298 | % | |||||||||||||
| Other income | 1,976 | 4.1 | % | 145 | 0.3 | % | 1,831 | 1261 | % | |||||||||||||||
| Other income (expense), net | (444 | ) | -0.9 | % | (2,661 | ) | -5.3 | % | 2,217 | 83.3 | % | |||||||||||||
| Income before income taxes | (4,809 | ) | -10.0 | % | 3,779 | 7.6 | % | (8,588 | ) | -227.3 | % | |||||||||||||
| Income tax provision | (47 | ) | -0.1 | % | - | 0.0 | % | (47 | ) | na | ||||||||||||||
| Net income (loss) | (4,762 | ) | -9.9 | % | 3,779 | 7.6 | % | (8,541 | ) | -226.0 | % | |||||||||||||
| Net income (loss) attributable to non-controlling interest | (468 | ) | -1.0 | % | - | 0.0 | % | (468 | ) | na | ||||||||||||||
| Net income (loss) attributable to Company | (4,294 | ) | -8.9 | % | 3,779 | 7.6 | % | (8,073 | ) | -213.6 | % | |||||||||||||
| Preferred distributions | (549 | ) | -1.1 | % | (549 | ) | -1.1 | % | - | 0.0 | % | |||||||||||||
| Net income attributable to common | $ | (4,843 | ) | -10.1 | % | $ | 3,230 | 6.5 | % | $ | (8,073 | ) | -249.9 | % | ||||||||||
| 40 |
Wholesale trading revenue: In our wholesale trading business, we record revenues based upon changes in the fair values of the contracts we trade, net of costs. The initial recognition of fair value and subsequent changes in fair value affect reported earnings in the period the change occurs. The fair values of instruments that remain open at a balance sheet date represent unrealized gains or losses. Our primary costs in generating trading revenue are compensation of our energy traders as well as the interest expense of obtaining the capital necessary to post collateral.
Generally, our greatest opportunities for profitable trades occur during periods of market turbulence, when the forecast for supply or demand is more likely to be inaccurate. When demand for energy is relatively stable, price variations tend to be small or non-existent. During periods of market turbulence, prices tend to be volatile, which give our traders the opportunity to take advantage of such volatility. Furthermore, our revenue is limited to some extent by the amount of collateral we have posted with a market operator or exchange.
On a wholesale level, electricity prices are highly correlated with weather and the price of natural gas, particularly in our key eastern markets, where it is the marginal fuel of choice for most generation. The benchmark price to which much of our wholesale trading is keyed is PJM West Hub and volatility in this index drives many of our revenue opportunities. While our revenues generally track changes in price, other factors come into play as well, such as the size of trades we have in place in terms of megawatt-hours and whether or not we are buying or selling.
Market conditions during 2015 were characterized by milder than normal weather, with 207 fewer heating degree-days than normal (down 5%), 150 more cooling degree-days than normal (up 11%), modestly above-normal average temperatures (54.4°F versus 53.7°F), and cheaper natural gas, down about 32% to $2.63/MCF versus the 5-year average of $3.85/MCF.
Comparing 2015 to 2014, 2015 was warmer; HDDs for the U.S. were 4,125 or 10% below 2014’s figure of 4,608 and CDDs during 2015 totaled 1,458 or 15% more compared to 1,272 in 2014. For 2015, the Henry Hub natural gas spot price averaged $2.63/MCF, 40% below 2014’s $4.37 mark. Supplies of gas during 2015 were good. Weekly storage levels averaged 2,768 BCF or 25% more than 2014’s level of 2,222 and 2% above the 5-year average of 2,722.
| Years Ended December 31, | ||||||||||||||||||||||||||||
| Increase (decrease) | ||||||||||||||||||||||||||||
| Units | This year vs last year | This year vs LTA | ||||||||||||||||||||||||||
| 2015 | 2014 | LTA (1) | Units | Percent | Units | Percent | ||||||||||||||||||||||
| U.S. Weather | ||||||||||||||||||||||||||||
| Heating degree-days | 4,125 | 4,608 | 4,332 | (483 | ) | -10 | % | (207 | ) | -5 | % | |||||||||||||||||
| Cooling degree-days | 1,458 | 1,272 | 1,308 | 186 | 15 | % | 150 | 11 | % | |||||||||||||||||||
| Avg temperature (°F) | 54.4°F | 52.5°F | 53.7°F | 1.9°F | 4 | % | 0.7°F | 1 | % | |||||||||||||||||||
| Natural Gas | ||||||||||||||||||||||||||||
| Henry Hub spot price ($/MCF) | 2.63 | 4.37 | 3.85 | (1.74 | ) | -40 | % | (1.22 | ) | -32 | % | |||||||||||||||||
| Working gas in underground storage, Lower 48 states, storage, Lower 48 states, EIA weekly estimates (BCF) | 2,768 | 2,222 | 2,722 | 546 | 25 | % | 46 | 2 | % | |||||||||||||||||||
1 - “LTA” abbreviates long term average. For weather data, the 30 year period is 1985-2014 and for natural gas the 5 year eriois 2009-2013.
| 41 |
The average for the day-ahead PJM West Hub peak price during 2015 was $41.52/MWh with a standard deviation of $20.72 resulting in a coefficient of variation of 50%, compared to $58.65/MWh, $54.81, and 93% for 2014. The high for the year was $237.48/MWh and the low was $23.25. As shown by the table below, price levels and volatility were generally lower in 2015 as compared to 2014. Most of the high prices and volatility of 2014 and 2015 occurred in the first quarters of such years.
| PJM West Hub Peak Day Ahead | Years Ended December 31, | |||||||||||||||
| Increase (decrease) | ||||||||||||||||
| 2015 | 2014 | Units | Percent | |||||||||||||
| Price ($/MWh) | ||||||||||||||||
| Average | 41.52 | 58.65 | (17.13 | ) | -29 | % | ||||||||||
| Maximum | 237.48 | 655.75 | (418.27 | ) | -64 | % | ||||||||||
| Minimum | 23.25 | 26.49 | (3.23 | ) | -12 | % | ||||||||||
| Standard deviation | 20.72 | 54.81 | (34.08 | ) | -62 | % | ||||||||||
| Coefficient of variation (stdev ÷ avg) | 50 | % | 93 | % | 199 | % | 213 | % | ||||||||
| Daily percentage changes | ||||||||||||||||
| Average | 1.6 | % | 2.5 | % | -0.9 | % | -36 | % | ||||||||
| Maximum | 209.3 | % | 200.3 | % | 9.0 | % | 4 | % | ||||||||
| Minimum | -63.5 | % | -78.1 | % | 14.6 | % | -19 | % | ||||||||
| Standard deviation | 21.3 | % | 25.8 | % | -4.5 | % | -18 | % | ||||||||
| Number of days | ||||||||||||||||
| Up 10% or more | 64 | 62 | 2 | 3 | % | |||||||||||
| Between 10% up and 10% down | 130 | 131 | (1 | ) | -1 | % | ||||||||||
| Down 10% or more | 61 | 62 | (1 | ) | -2 | % | ||||||||||
On December 30, 2014, FERC accepted the Company’s settlement offer dated November 14, 2014 with respect to the closure of its investigation into the trading activities of certain ex-employees of TCPC in the MISO market during the 13-month period from January 1, 2010 to January 31, 2011. The final settlement agreement called for the payment $3,607,000, consisting of disgorgement of profits of $978,000 and interest thereon of $129,000 to MISO and a civil penalty of $2,500,000 to the U.S. Treasury, with payment first to MISO and then to the Treasury. The non-financial portion required certain improvements to compliance procedures. The disgorgement was recorded as a reduction of revenue and the civil penalty was expensed during the third quarter of 2014. The settlement was booked as a liability of TCP as TCE and TCPC no longer had any employees or operations. The first installment of $500,000 was paid on December 31, 2014 with the remainder due in 16 equal quarterly installments of $194,000 each, beginning April 1, 2015.
On June 1, 2015, all of the equity interests of TCP and its wholly-owned subsidiary SUM were sold to Angell. As the financial obligations under the settlement agreement were on TCP’s books, they were also assumed by Angell in connection with its purchase. For the five months ended May 31, 2015 and the year ended December 31, 2014, revenues and operating income of these entities were $12,909,000 and $13,127,000 and $5,093,000 and $2,720,000, respectively.
As a result of these factors, for the year ended December 31, 2015, net wholesale trading revenue decreased by $24,322,000 or 63% to $14,290,000 compared to $38,612,000 for 2014.
| 42 |
Retail electricity sales: Revenue from the retail sale of electricity is recorded in the period in which customers consume the commodity, net of any applicable sales tax. Revenue applicable to electricity consumed by customers but not yet billed under the cycle billing method is estimated and accrued along with the related costs. Changes in estimates are reflected in operations in the period in which they are refined.
In addition to the designated hedges described below in “costs of retail electricity sold” to which hedge accounting was applied, we also used certain derivative contracts to which hedge accounting was not applied as economic hedges in our retail business to reduce our exposure to higher costs. In our segment reporting, the gain on these contracts net of any losses is reported as “wholesale trading revenue, net”.
For the years ended December 31, 2015 and 2014, we recorded total revenues in our retail segment of $30,109,000 and $12,947,000, respectively. These totals consisted of retail energy sales of $30,483,000 in 2015 and $11,229,000 in 2014, up 171.5% and wholesale trading revenues of $(374,000) and $1,717,000, respectively, down 121.8%. During 2015, retail energy sales revenue increased principally as a result of increases in the number of customers served and MWh sold. The customer base consists largely of residential consumers with a few small commercial accounts.
The following table details key operating statistics for the periods indicated.
| Key Operating Statistics (in units unless otherwise indicated) | For and at years ended December 31, | |||||||||||||||
| Increase (decrease) | ||||||||||||||||
| 2015 | 2014 | Units | Percent | |||||||||||||
| Retail electricity sales ($000s) | 30,483 | 11,229 | 19,254 | 171.5 | % | |||||||||||
| Wholesale trading revenue, net ($000s) | (374 | ) | 1,717 | (2,091 | ) | -121.8 | % | |||||||||
| Total segment revenues ($000s) | 30,109 | 12,946 | 17,163 | 132.6 | % | |||||||||||
| Unit sales (MWh) | 346,037 | 112,378 | 233,659 | -207.9 | % | |||||||||||
| Weighted average retail price (¢/kWh) | 8.81 | 9.99 | (1.18 | ) | -11.8 | % | ||||||||||
| Customers receiving service, end of period | 32,319 | 9,501 | 22,818 | -240.2 | % | |||||||||||
Diversified investments
Real Estate Development
Revenues from real estate developments, if any, are recognized at the time of sale closing if all significant conditions are satisfied, including adequate down payment, reasonable assurance of collectability of any notes received, and completion of other contract requirements. Recognition of all or part of the revenue is deferred if any significant conditions are not satisfied.
Costs that relate directly to development projects are capitalized and allocated using the specific identification method. Land acquisition, improvements, and holding costs, including real estate taxes and interest are capitalized while a development is in progress. Interest expense, if any, is capitalized based on specific identification of notes payable issued to finance specific assets under development. Once development on a project has been completed and sales have begun, remaining inventory is recorded at the lower of cost or market. Development costs are charged to cost of sales when the related revenue is recognized or when a development is abandoned.
During 2015, the Company recorded revenue of $352,000, cost of sales of $319,000, and capitalized $1,891,800 of costs associated with its real estate development activities. During 2014, the Company recorded no revenue or cost of sales and capitalized $489,000 of costs.
| 43 |
Private Investments
Interest income on securities is recorded in other income and fair value is reported on the balance sheet. Securities are reviewed for possible impairment at least quarterly, or more frequently if circumstances arise which may indicate impairment.
Revenues from administrative services, software licenses, and consulting services are recognized on a monthly basis in accordance with the respective agreements with third parties. Revenue from construction services is accounted for using the percentage of completion method.
During 2015, the Company earned $710,000 of management services revenue and reported $2,286,000 of construction services revenue. During 2014, the Company recorded no management or construction services revenue.
Costs of retail electricity sold: REH’s costs of electricity sold include the cost of purchased power, EDC service fees, renewable energy certificates, bad debt expense, and gains net of losses and commissions on derivative contracts used to hedge power purchase costs. Cost of sales does not include the net gain or loss on the economic hedges described above. During 2015, we purchased electricity for sale to retail customers in ISO-NE’s and PJM’s wholesale markets and from certain other wholesale suppliers. We are typically required to maintain cash deposits in separate accounts to meet our wholesale energy vendors’ financial assurance requirements to purchase energy, ancillary services, and capacity which amount is included in “cash in trading accounts”.
During 2015, REH hedged the cost of 144,667 MWh or 41.8% of the 346,037 MWh of electricity sold to our retail customers. For the year, our hedges had the effect of increasing the cost of retail electricity sold by $1,713,000.
During 2014, REH hedged the cost of 76,915 MWh or 68% of the 112,378 MWh of electricity sold to our retail customers. For the year, our hedges had the effect of decreasing the cost of retail electricity sold by $92,000.
In total, during 2015 and 2014, we recorded costs of retail electricity sold of $26,663,000 and $11,441,000, respectively, resulting in gross profits of $3,820,000 and a loss of $ (211,000) in 2015 and 2014, respectively. If the economic hedges were treated in the same way as that of the designated hedges, that is, with gains decreasing costs of sales and with losses increasing such, gross margins would have been 11.3% in 2015 and 12.6% for 2014.
As shown by the Open Derivative Contracts table on page 44, as of December 31, 2015, we had no designated electricity futures contracts as hedges against the cost of expected 2016 electricity purchases. As of December 31, 2014, we had designated 48,947 MWh of electricity futures as hedges against the cost of expected 2015 electricity purchases. $863,000, representing the net loss on the effective portion of the hedges, was deferred in AOCI and this entire amount was reclassified to cost of retail electricity sold by December 31, 2015.
| 44 |
Retail sales and marketing: Retail sales and marketing costs and expenses include off-line and on-line marketing costs related to retail customer acquisition and retention. Major off-line marketing channels may include out-bound telemarketing, direct mail, door-to-door, mass media (radio, television, print, and outdoor), and affiliates. On-line marketing channels may include paid search, affiliates, comparison shopping engines, banner or display advertising, search engine optimization, and e-mail marketing.
During 2015 and 2014, we spent $1,353,000 and $325,000, respectively on retail sales and marketing, principally on outbound telemarketing in connection with the TSEE brand.
Salaries, wages and related: Salaries, wages, and related costs such as employee benefits and payroll taxes consist primarily of base and incentive compensation paid to our administrative officers, energy traders, and other employees.
For 2015, salaries, bonuses, and related costs decreased by $8,254,000 or 38.0% to $13,468,000 compared to $21,722,000 for 2014. Our personnel expense is directly related to the revenue we record, since trader compensation is tied to revenue production, and this increase in expense is in line with the decrease in revenues.
Professional fees: Professional fees consist of legal expenses, audit fees, tax compliance reporting service fees, and other fees paid for outside consulting services.
For 2015, professional fees decreased by $24,000 or 1.0% to $2,463,000 compared to $2,487,000 in 2014. In 2015, while the Company no longer incurred substantial legal fees in connection with the FERC investigation, it continued to pursue the Canadian former employee litigation. In addition, legal fees were incurred in connection with the Restructuring.
Other general and administrative: Other general and administrative expenses include expenses associated with marketing our Notes such as advertising, printing, and servicing expenses as well as items such as rent, depreciation and amortization, insurance, travel, outside retail customer service costs, and all other direct office support expenses.
For 2015, these costs decreased by $868,000 to $5,226,000 compared to $6,094,000 for 2014. The decrease was primarily related to elimination of the $2,500,000 civil penalty resulting from the FERC settlement, partially offset by increases in public company costs of $797,000, and expenses associated with the Noble acquisition $141,000.
Trading tools and subscriptions: Trading tools and subscriptions consist primarily of amounts paid for services that provide weather reports and forecasting, electrical load forecasting, congestion analysis and other factors relative to electricity production and consumption.
For the year ended December 31, 2015, trading tools and subscriptions expense decreased by $40,000 or 3.0% to $1,293,000 compared to $1,333,000 for 2014, primarily due to the sale of TCP and SUM and fewer traders.
Other income (expense): In 2015, we recorded net other expense of $444,000 compared to net other expense of $2,661,000 in 2014.
For 2015, other income included $1,343,000 of gain on sale of TCP, (recognized as cash principal payments are received on the seller note owed by Angell), $829,000 of interest income, $356,000 of gain on foreign currency exchange and $1,843,000 of other income consisting primarily of revenue associated with the sale of a DataLive software licenses of $1,600,000.
As the principal component of other expense, interest expense increased by $1,276,000 to $3,569,000 for the year from $2,293,000 during 2014, primarily due to an increase of $8,342,000 in outstanding debt from $19,288,000 at December 31, 2014 to $27,630,000 at December 31, 2015.
| 45 |
Provision for taxes: The tax provision of ($47,000) is a tax benefit associated with the acquisition of Noble.
Preferred distributions: During both 2015 and 2014, we distributed $549,000 to our preferred unit holder.
Liquidity, Capital Resources, and Cash Flow
In order to participate in the wholesale trading business, the pledge of cash collateral to market operators such as ISOs and exchanges is required to permit trading and revenue generation. With respect to REH’s retail energy business, in addition to collateral posted with ISOs that provides for the acquisition of power for resale to customers, it is also required to fund accounts receivable as well as margin requirements associated with hedges. ISOs generally require payment for power every 4 days or so, while the average collection period on receivables is 40 to 45 days. As such, historically, the Company’s capital was largely invested in trading accounts deposits and receivables. Capital expenditure requirements are nominal, being limited largely to computer and office equipment, software, and office furniture. Therefore, in any given reporting period, the amount of cash consumed or generated was primarily be due to changes in working capital.
Historically, capital requirements have been funded by cash flow positive operations and additional financing, principally in the form of the Notes. Should sustained significant negative cash flow from operations occur or additional Note sales not materialize, we may be forced to cover net cash outflows by reducing trading account balances and such events might have a detrimental effect on the Company.
The following table is presented as a measure of our liquidity and capital resources as of the dates indicated:
| At December 31, | ||||||||||||||||||||||||
| Dollars in thousands; may not add due to rounding | 2015 | 2014 | Increase (decrease) | |||||||||||||||||||||
| Dollars | Percent of total assets | Dollars | Percent of total assets | Dollars | Percent | |||||||||||||||||||
| Liquidity | ||||||||||||||||||||||||
| Unrestricted cash | $ | 2,331 | 8.0 | % | $ | 2,397 | 7.5 | % | $ | (66 | ) | -2.7 | % | |||||||||||
| Cash in trading accounts | 8,047 | 27.8 | % | 21,100 | 66.4 | % | (13,052 | ) | -61.9 | % | ||||||||||||||
| Cash collateral | 246 | 0.8 | % | - | 0.0 | % | 246 | na | ||||||||||||||||
| Marketable securities | - | 0.0 | % | 312 | 1.0 | % | (312 | ) | -100.0 | % | ||||||||||||||
| Trade accounts receivable | 5,888 | 20.3 | % | 2,394 | 7.5 | % | 3,494 | 145.9 | % | |||||||||||||||
| Total liquid assets | 16,513 | 56.9 | % | 26,203 | 82.5 | % | (9,690 | ) | -37.0 | % | ||||||||||||||
| Total assets | $ | 28,999 | 100.0 | % | $ | 31,770 | 100.0 | % | (2,771 | ) | -8.7 | % | ||||||||||||
| Capital Resources | ||||||||||||||||||||||||
| Current debt | $ | 13,023 | 44.9 | % | $ | 8,652 | 27.2 | % | $ | 4,371 | 50.5 | % | ||||||||||||
| Long term debt | 14,607 | 50.4 | % | 10,636 | 33.5 | % | 3,971 | 37.3 | % | |||||||||||||||
| Total debt | 27,630 | 95.3 | % | 19,288 | 60.7 | % | 8,342 | 43.2 | % | |||||||||||||||
| Preferred equity | 2,745 | 9.5 | % | 2,745 | 8.6 | % | - | 0.0 | % | |||||||||||||||
| Common equity | (1,647 | ) | -5.7 | % | (194 | ) | -0.6 | % | (1,453 | ) | 749.0 | % | ||||||||||||
| AOCI | - | 0.0 | % | 147 | 0.5 | % | (147 | ) | -100.0 | % | ||||||||||||||
| Total members’ equity | 1,098 | 3.8 | % | 2,698 | 8.5 | % | (1,600 | ) | -59.3 | % | ||||||||||||||
| Non-controlling interest | (9,808 | ) | -33.8 | % | - | 0.0 | % | (9,808 | ) | na | ||||||||||||||
| Total equity | (8,710 | ) | -30.0 | % | 2,698 | 8.5 | % | (11,408 | ) | -422.8 | % | |||||||||||||
| Total capitalization | $ | 18,921 | 65.2 | % | $ | 21,986 | 69.2 | % | $ | (3,065 | ) | -13.9 | % | |||||||||||
| 46 |
We are taxed as a partnership for income tax purposes which means that we do not pay any income taxes. Our income or loss for each year is allocated among holders of our common units who are then personally responsible for the tax liability associated with such income. Our Operating Agreement provides for distributions of cash to members based upon their respective ownership interests in the amount necessary to permit the member who is in the highest income tax bracket to pay all state and federal taxes on our net income allocated to such member.
The decision to make distributions other than tax distributions to holders of our common units and required distributions to holders of preferred units is at the discretion of our Board and depends on various factors, including our results of operations, financial condition, capital requirements, contractual restrictions, outstanding indebtedness, investment opportunities, and other factors considered by the Board to be relevant. The indenture governing our Notes prohibits us from paying distributions to our members if there is an event of default with respect to the Notes or if payment of the distribution would result in an event of default. The indenture also prohibits our Board from declaring or paying any distributions other than tax distributions if, in the reasonable determination of the Board, the Company would have insufficient cash to meet anticipated Note redemption or repayment obligations.
While we believe that payments from Enterprises on the Term Loan, anticipated cash generated from operating activities, and anticipated proceeds from our Notes Offering will be sufficient to meet our operating cash requirements and obligations under the Notes and Term Loan Notes for the next twelve months, there can be no assurance that this will prove to be the case.
Consequently, we regularly evaluate other sources of debt financing in addition to the Notes and we are currently considering seeking additional equity capital in order to provide added flexibility to support our anticipated growth and working capital needs. However, there can be no assurance that these efforts will prove to be successful.
The table below summarizes our primary sources and uses of cash for the years ended December 31, 2015 and 2014 as derived from the statements of cash flows included in this Form 10-K.
| Dollars in thousands; may not add due to rounding | For the Years Ended December 31, | |||||||||||||||
| Increase (decrease) | ||||||||||||||||
| 2015 | 2014 | Dollars | Percent | |||||||||||||
| Net cash provided by (used in) | ||||||||||||||||
| Operating activities | $ | 1,089 | $ | 54 | $ | 1,035 | 1922.6 | % | ||||||||
| Investing activities | (2,538 | ) | (3,515 | ) | 977 | -27.8 | % | |||||||||
| Financing activities | 1,171 | 3,009 | (1,838 | ) | -61.1 | % | ||||||||||
| Net cash flow | (278 | ) | (452 | ) | 174 | -38.5 | % | |||||||||
| Effect of exchange rate changes on cash | 212 | (341 | ) | 553 | 61.8 | % | ||||||||||
| Unrestricted cash | ||||||||||||||||
| Beginning of period | 2,397 | 3,190 | (793 | ) | -24.9 | % | ||||||||||
| End of period | $ | 2,331 | $ | 2,398 | $ | (66 | ) | -2.7 | % | |||||||
| 47 |
For the year ended December 31, 2015, we generated $1,144,000 from operating activities. The largest source of cash from operations was a $7,910,000 reduction in deposits in trading and collateral accounts, while the largest single use was the payment of accrued compensation of $3,614,000. During 2015, we used $2,538,000 of cash for investing activities, principally an increase in real estate held for investment of $1,892,000. At December 31, 2015, our debt totaled $27,630,000 compared to $19,288,000 as of the prior year end. For the year, the Company generated $1,116,000 from financing activities, including a net $7,916,000 increase in debt and payment of $6,499,000 in distributions. Of the total distribution amount, $549,000 was paid to the holder of our preferred units and $5,950,000 was paid to our common unit-holders.
For the year ended December 31, 2014, we generated $54,000 from operating activities. The largest source of cash from operations was net income of $3,779,000 which included a non-cash charge of $3,607,000 related to the FERC settlement, and the most significant use was a $10,528,000 increase in cash in trading accounts due to increased collateral requirements for both our wholesale and retail businesses. During 2014, we used $3,530,000 of cash for investing activities, the most significant of which was the purchase of Ultra Green’s convertible notes for $1,605,000. At December 31, 2014, our debt totaled $19,288,000 compared to $10,185,000 as of the prior year end. For the year, the Company generated $3,009,000 from financing activities, including a net $9,103,000 increase in debt and payment of $5,276,000 in distributions. Of the total distribution amount, $549,000 was paid to the holder of our preferred units and $4,727,000 was paid to our common unit-holders.
RBC Line of Credit
On May 12, 2014, the Company drew $700,000 under an evergreen, uncommitted line of credit from Royal Bank of Canada (the “RBC Line” and “RBC”, respectively). Advances under the RBC Line bear interest at a variable annual interest rate of 1 month LIBOR plus 2.25% set at the time of advance for a 30 day term, mature at various dates, and are collateralized by assets held in the Company’s marketable securities account. RBC is not obligated to make any extensions of credit to the Company and availability of funds may be increased or decreased by RBC in its sole and absolute discretion. Prepayment of any outstanding principal under the RBC Line may subject the Company to LIBOR break funding costs.
As of December 31, 2015, the Company had no marketable securities and no borrowings outstanding under the RBC Line. As of December 31, 2014, the Company had $311,586 of marketable securities and no borrowings outstanding under the RBC Line.
Exelon PSA
On March 29, 2016 we entered into a full requirements preferred supply agreement with Exelon to provide us with all the power and ancillary services we need to serve our customers for an initial term expiring on March 29, 2019.
Under the terms of the PSA, on a daily or weekly basis as we request, Exelon will provide firm, fixed quotes for power for terms from one to 36 months out for each of the service areas in which we operate. Such quotes will include all costs of energy, capacity, ancillary services, and RECs necessary to meet state minimum renewable energy requirements to serve residential and small commercial customers. In addition, Exelon absorbs all deviations between forecasted and actual customer usage. Finally, the PSA provides that Exelon will post any collateral required of us by an ISO or EDC.
In addition to eliminating commodity price and volumetric risk, the PSA also incorporates the ability for us to defer payment of all or a portion of Exelon’s invoices to us based on certain criteria as defined in the agreement, including an asset pledge and certain financial covenants. essentially providing us with a revolving line of credit.
| 48 |
Continuous Notes Offering and Term Loan
On May 10, 2012, our first Form S-1 registration statement relating to the offer and sale of our Notes (File No. 333-179460) was declared effective by the SEC, and the offering commenced on May 15, 2012. This Old S-1 covered up to $50,000,000 in principal amount of 3 and 6 month and 1, 2, 3, 4, 5, and 10 year notes. On May 8, 2015, we filed a new registration statement with respect to the Notes (File No. 333-203994) to continue our Notes Offering under the Old S-1 until the effective date of the New S-1. The new registration replaces the original statement and covers up to $75,000,000 in principal amount of 3 and 6 month and 1, 2, 3, 4, 5, and 10 year notes. The New S-1 was declared effective by the SEC on November 12, 2015.
For the years ended December 31, 2015 and 2014, we incurred $2,081,000 and $1,284,000, respectively, of offering-related expenses, including marketing and certain printing expenses, legal and accounting fees, filing fees, and trustee fees but excluding amounts capitalized as deferred financing costs and amortized as Notes are sold. For the years ended December 31, 2015 and 2014, deferred financing cost amortization totaled $229,000 and $131,000, respectively. At December 31, 2015, net deferred financing costs related to the Notes totaled $314,000.
From the effective date of May 10, 2012 through December 31, 2015, we issued a total of $45,302,000 of Notes, of which $30,228,000 were initial sales and $15,074,000 were renewals for which we did not receive additional proceeds. As of December 31, 2015, we had $24,485,000 in principal amount of notes outstanding.
On July 1, 2015, as part of the internal reorganization, Aspirity Financial entered into a Term Loan with Enterprises. Pursuant to the Term Loan, the Company agreed to loan Enterprises an aggregate principal amount of $22,205,613, with a weighted average interest rate of 14.08%, and maturity date of December 30, 2019. Cash flow from the Legacy Businesses supports the Term Loan Notes (only those outstanding as of June 30, 2015), including any renewals thereof. Accordingly, and subject to monthly true-ups, the repayment schedule of the Term Loan reflects the maximum possible redemptions of, and the weighted average interest rate paid on, Term Loan Notes in a given month. The equity of Enterprises has been pledged to Aspirity Financial to secure repayment of the Term Loan.
Due to the consolidation of Enterprises as a VIE, the Term Loan is eliminated. See also Notes 2 and 20 to the consolidated financial statements in Item 8.
The Company’s communications may include certain non- GAAP financial measures. A “non-GAAP financial measure” is defined as a numerical measure of a company’s financial performance, financial position, or cash flows that excludes, or includes, amounts that are included in, or excluded from, the most directly comparable measure calculated and presented in accordance with GAAP in the company’s financial statements.
Non-GAAP financial measures utilized by the Company include presentations of liquidity measures and debt-to-equity ratios. The Company’s management believes that these non-GAAP financial measures provide useful information to investors and enable investors and analysts to more accurately compare the Company’s ongoing financial performance over the periods presented.
Non-GAAP financial measures utilized by the Company include “total liquid assets”. The most comparable GAAP measure is total current assets. The Company’s management believes that these non-GAAP financial measures provide useful information to investors and enable investors and analysts to more accurately compare the Company’s ongoing financial performance over the periods presented.
| 49 |
Critical Accounting Policies and Estimates
Variable Interest Entities - Principles of Consolidation
Generally, we consolidate only business enterprises that we control by ownership of a majority voting interest. However, there are situations in which consolidation is required even though the usual condition of consolidation (ownership of a majority voting interest) does not apply. Generally, this occurs when an entity holds an interest in another business enterprise that was achieved through arrangements that do not involve voting interests, which results in a disproportionate relationship between such entity’s voting interests in, and its exposure to the economic risks and potential rewards of, the other business enterprise. This disproportionate relationship results in what is known as a variable interest, and the entity in which we have the variable interest is referred to as a “VIE.”
The Company follows ASC 810-10-15 guidance with respect to accounting for VIEs. A VIE is an entity that does not have sufficient equity at risk to finance its activities without additional subordinated financial support from other parties, or whose equity investors lack any of the characteristics of a controlling financial interest. A variable interest is an investment or other interest that will absorb portions of a VIE’s expected losses or receive portions of the entity’s expected residual returns. Variable interests are contractual, ownership, or other pecuniary interests that change with changes in the fair value of the entity’s net assets. A party is the primary beneficiary of a VIE and must consolidate it when that party has a variable interest, or combination of variable interests, that provides the party with a controlling financial interest. A party is deemed to have a controlling financial interest if it meets both of the power and losses/benefits criteria. The power criterion is the ability to direct the activities of the VIE that most significantly impact its economic performance. The losses/benefits criterion is the obligation to absorb losses from, or right to receive benefits from, the VIE that could potentially be significant to the VIE. The VIE model requires an ongoing reconsideration of whether a reporting entity is the primary beneficiary of a VIE due to changes in facts and circumstances.
An assessment of the relationship between the Company and Enterprises following the Distribution was performed because Timothy Krieger is a related party of both Aspirity and Enterprises, and because the entities have an ongoing business relationship resulting from the Term Loan. Aspirity holds a variable interest in Enterprises in the form of the Term Loan, making Enterprises a VIE. The outstanding balance of the Term Loan (and any future amounts that the Company may lend to Enterprises) represent the Company’s maximum exposure to loss from the VIE. Creditors of Enterprises do not have recourse against the general credit of the Company, regardless of whether it is accounted for as a consolidated entity. While the Company will include the assets and net income of Enterprises in its consolidated financial statements, the Company does not have rights to those assets other than pursuant to its rights under the Term Loan.
Revenue Recognition and Commodity Derivative Contracts
Revenues in our wholesale trading business are derived from trading financial electricity and derivative energy contracts while those for our retail segment result from electricity sales to end-use consumers. In our trading activities, contracts with the exchanges on which we trade permit net settlement, including the right to offset cash collateral in the settlement process. Accordingly, we net cash collateral against the derivative position in the accompanying consolidated balance sheets. All realized and unrealized gains and losses on derivative instruments are recorded in revenues. Revenue from the retail sale of electricity, including estimates of unbilled revenues for power consumed by customers but not yet billed under the cycle billing method, is recorded in the period in which customers consume the commodity, net of any applicable sales tax.
| 50 |
Hedge Accounting
In our retail business, we are exposed to volatility in the cost of energy acquired for sale to customers, and as a result, in October 2012, we began using derivatives to hedge or reduce this variability, since changes in the price of certain derivatives are expected to be highly effective at offsetting changes in this cost.
For a cash flow hedge, the effective portion of any change in the hedging instrument’s fair value is recorded as other comprehensive income until the change in value of the hedged item is recognized in earnings. To qualify for hedge accounting, the hedge relationships must meet extensive documentation requirements and hedge effectiveness and ineffectiveness must be assessed and measured on an on-going basis.
Fair Value Measurements
FASB’s Fair Value Measurement Topic establishes a hierarchy of inputs with respect to determining the fair value of assets and liabilities for financial reporting purposes. The three types of inputs are “Level 1” (quoted prices in active markets for identical assets or liabilities), “Level 2” (inputs other than quoted prices that are observable either directly or indirectly for the asset or liability), and “Level 3” (unobservable inputs for which little or no market data exists). Financial instruments that are not traded in publicly quoted markets or that are acquired based on prices and terms determined by direct negotiation with the issuer are classified as Level 3 and carried at book value, which management believes approximates fair value, until circumstances otherwise dictate.
With respect to Level 3 inputs in particular, significant increases or decreases in specific inputs in isolation could result in higher or lower fair value measurements and the methods and calculations used by the Company to estimate fair values may not be indicative of net realizable value or reflective of future fair values. Furthermore, the use of different methodologies or assumptions to determine fair values could result in different fair value measurements and such variations could be material. In addition to management’s assessments, from time to time, the Company may engage third parties such as appraisers, brokers, or investment bankers to assist management in its valuation and classification of financial instruments.
Real Estate Development
Revenues from real estate developments, if any, are recognized at the time of sale closing if all significant conditions are satisfied, including adequate down payment, reasonable assurance of collectability of any notes received, and completion of other contract requirements. Recognition of all or part of the revenue is deferred if any significant conditions are not satisfied. Costs that relate directly to development projects are capitalized and allocated using the specific identification method. Land acquisition, improvements, and holding costs, including real estate taxes and interest are capitalized while a development is in progress. Interest expense, if any, is capitalized based on specific identification of notes payable issued to finance specific assets under development. Once development on a project has been completed and sales have begun, remaining inventory is recorded at the lower of cost or market. Development costs are charged to cost of sales when the related revenue is recognized or when a development is abandoned.
Profits Interest Payments
One of Enterprises’ second-tier subsidiaries, CEF, has Class B members. Under the terms of such subsidiary’s member control agreement, Class B members have no voting rights, are not required to contribute capital, and have no rights to distributions following termination of employment, but are entitled to a defined share of profits while employed. Since Class B members have no corporate governance rights or risk of capital loss or opportunity for gain, they do not own non-controlling equity interests and profits interests payments are recorded as compensation expense during the period earned and are classified as accrued compensation on the balance sheet.
For the years ended December 31, 2015 and 2014, we recorded $2,478,000 and $6,364,000, respectively, in salaries and wages and related taxes, representing the allocation of profits to Class B members. The amount of accrued profits interests included in accrued compensation at December 31, 2015 and 2014 was $139,000 and $801,000, respectively.
| 51 |
Item 7A - Quantitative and Qualitative Disclosures about Market Risk
We are exposed to market risk in our normal business activities. Market risk is the potential loss that may result from changes associated with an existing or forecasted financial or commodity transaction. The types of market risks we are exposed to are commodity price risk, interest rate risk, liquidity risk, credit risk and currency exchange risk. In order to manage these risks, we may use various fixed-price forward purchase and sales contracts, futures and option contracts, and swaps and options traded in the over-the-counter financial markets.
Commodity price risks result from exposures to changes in spot prices, forward prices, volatilities, and correlations between various commodities, such as natural gas, electricity, coal, oil, and emissions credits.
We manage the commodity price risk of our retail load serving obligations by entering into various derivative or non-derivative instruments to hedge the variability in future cash flows from forecasted sales and purchases of electricity. These instruments include forwards, futures, swaps, and option contracts traded on various exchanges as well as in over-the-counter markets. The portion of forecasted transactions hedged may vary based upon management’s assessment of market, weather, operation and other factors.
In our wholesale trading businesses, we measure the risk of our portfolio using several analytical methods, including position limits, stop loss, stress testing, and value-at-risk (“VaR”).
Our daily long term VaR model is based upon log-normal returns calculated from the last 30 business days of prices at the 95% confidence level, or 1.645 standard deviations, with a one day liquidity assumption. Our short term VaR model measures the risk of virtual and up-to-congestion transactions and is based upon 4 years of seasonal prices at the 95% confidence level, with a one day liquidity assumption.
VaR is calculated daily, using positions and prices updated to the close of business on the previous day. The price history used is ideally that of the instrument held; however, in the cases where those prices are unavailable, benchmarking is used. Our VaR calculations always use the market value of the position, not its cost. In the case of a position where it is likely to take more than one day to close out, VaR is multiplied by the square root of the average days to liquidate the position in a stressed market.
The VaR model we apply to FTRs (“illiquid VaR”) is based upon 5 years of seasonal prices at the 95% confidence level but with no liquidity assumption, that is, we will not be able to exit the position prior to its maturity due to a lack of trading activity in the instruments. As of December 31, 2014, the longest tenor of our FTR positions was 5 months. There were no FTR positions as of December 31, 2015. As a result of this liquidity assumption, the VaR of our FTRs may not be added to that of our other positions.
| 52 |
The following table summarizes our liquid and illiquid VaR as of and for the years ended December 31, 2015, and 2014:
| Increase (decrease) | ||||||||||||||||
| 2015 | 2014 | Units | Percent | |||||||||||||
| Liquid VaR | ||||||||||||||||
| As of December 31 | $ | 35,876 | $ | 164,772 | $ | (128,896 | ) | -78.2 | % | |||||||
| For the year ended December 31: | ||||||||||||||||
| Average | $ | 270,611 | $ | 384,094 | $ | (113,483 | ) | -29.5 | % | |||||||
| Maximum | 1,041,045 | 1,470,187 | (429,142 | ) | -29.2 | % | ||||||||||
| Minimum | 15,220 | 7,453 | 7,767 | 104.2 | % | |||||||||||
| VaR, pct of cash in trading accounts | ||||||||||||||||
| As of December 31 | 0.45 | % | 2.53 | % | -2.08 | % | -82.4 | % | ||||||||
| For the year ended December 31: | ||||||||||||||||
| Average (1) | 1.86 | % | 2.07 | % | -0.21 | % | -10.3 | % | ||||||||
| Maximum (1) | 7.14 | % | 9.57 | % | -2.43 | % | -25.4 | % | ||||||||
| Minimum (1) | 0.10 | % | 5.00 | % | -4.90 | % | -97.9 | % | ||||||||
| Illiquid VaR | ||||||||||||||||
| As of December 31 | $ | - | $ | 3,951,414 | $ | (3,951,414 | ) | -100.0 | % | |||||||
| For the year ended December 31: | ||||||||||||||||
| Average | $ | - | na | na | na | |||||||||||
| Maximum | - | na | na | na | ||||||||||||
| Minimum | - | na | na | na | ||||||||||||
| VaR, pct of cash in trading accounts | ||||||||||||||||
| As of December 31 | na | 18.73 | % | -18.73 | % | -100.0 | % | |||||||||
| For the year ended December 31: | ||||||||||||||||
| Average (1) | na | na | na | na | ||||||||||||
| Maximum (1) | na | na | na | na | ||||||||||||
| Minimum (1) | na | na | na | na | ||||||||||||
1 - Dollar VaR divided by the average balance of cash in trading accounts for the period.
Due to the inherent limitations of statistical measures such as VaR, the evolving nature of the competitive markets for electricity and related derivatives, and the seasonality of changes in market prices, the VaR calculation may not capture the full extent of commodity price exposure. As a result, actual changes in the fair value of mark-to-market derivative instruments assets and liabilities could differ from the calculated VaR, and such changes could have a material impact on our financial results.
The value of the derivative financial instruments we hold for trading purposes and as cash flow hedges is significantly influenced by forward commodity prices. Periodic changes in forward prices could cause significant changes in the marked-to-market (“MTM”) valuation of these contracts. For example, assuming that all other variables remain constant:
| Percentage change in | Average percentage change
in mark-to-market valuation (1) | Dollar change in mark-to-market valuation (1) | |||||||||||||||||||
| forward price from December 31, 2015 | Derivatives held for trading | Economic hedges | Cash flow hedges | Derivatives held for trading | Economic hedges | Cash flow hedges | |||||||||||||||
| 10 | % | 47.0 | % | 202.7 | % | na | 67,080 | 91,289 | na | ||||||||||||
| 5 | % | 23.5 | % | 101.4 | % | na | 33,540 | 45,645 | na | ||||||||||||
| 1 | % | 4.7 | % | 20.3 | % | na | 6,708 | 9,129 | na | ||||||||||||
| -1 | % | -4.7 | % | -20.3 | % | na | (6,708 | ) | (9,129 | ) | na | ||||||||||
| -5 | % | -23.5 | % | -101.4 | % | na | (33,540 | ) | (45,645 | ) | na | ||||||||||
| -10 | % | -47.0 | % | -202.7 | % | na | (67,080 | ) | (91,289 | ) | na | ||||||||||
1 - Table includes only liquid positions
| 53 |
As of December 31, 2015 and 2014, we had $3,101,000 and $1,635,000 of variable rate debt outstanding. The interest rates charged on such are based in part on changes in certain market indices plus a credit margin, but are subject to “floors”, which may have the effect of converting variable rates to fixed rates and such was the case at December 31, 2015 and 2014. Consequently, at either date, we had no variable rate debt, although in the future we may be exposed to fluctuations in interest rates. Exposures to interest rate fluctuations may be mitigated by entering into derivative instruments known as interest rate swaps, caps, collars, and put or call options. These contracts reduce exposure to interest rate volatility and result in primarily fixed rate debt obligations when taking into account the combination of the variable rate debt and the interest rate derivative instrument.
Liquidity risk arises from our general funding needs and the management of our assets and liabilities. We are exposed to additional collateral posting or margin requirements with the ISOs and exchanges if price volatility or levels increase. Based on a sensitivity analysis for positions under marginable contracts, a 20% change in electricity prices would cause an increase in margin collateral posted of approximately $317,000 and $1,448,680 as of December 31, 2015 and 2014, respectively. This analysis uses simplified assumptions and is calculated based on portfolio composition and margin-related contract provisions as of the dates indicated.
Credit risk relates to the risk of loss resulting from non-performance or non-payment by counterparties pursuant to the terms of their contractual obligations.
In our wholesale trading business, we monitor and manage credit risk. Given the credit quality, diversification, and term of the exposure in the portfolio, we do not anticipate a material impact on financial position or results of operations from nonperformance by any counterparty.
In our retail business, we may be exposed to certain customer credit risks. Although we are currently not exposed to retail customer credit risk to a large degree due to our participation in POR programs, we expect that this situation will change as we grow our retail business and expand into non-POR areas. Furthermore, economic and market conditions may affect our customers’ willingness and ability to pay their bills in a timely manner, which could lead to an increase in bad debt expense above and beyond the allowance for uncollectible accounts charged to us by utilities. In general, we intend to manage retail credit risk as described in “Item 1 - Business – Retail Energy Services – Credit Risk Management”.
A portion of our assets and liabilities are denominated in Canadian dollars and are therefore subject to fluctuations in exchange rates, however, we do not have any exposure to any highly inflationary foreign currencies. We believe our foreign currency exposure is limited.
| 54 |
Item 8 – Financial Statements and Supplementary Data
| 55 |
Report of Independent Registered Public Accounting Firm
To the Board of Directors and Members
Aspirity Holdings LLC and Subsidiaries
Minneapolis, Minnesota
We have audited the accompanying consolidated balance sheets of Aspirity Holdings LLC and Subsidiaries as of December 31, 2015 and 2014, and the related consolidated statements of comprehensive income, members’ equity, and cash flows for the years then ended. These consolidated financial statements are the responsibility of the Company’s management. Our responsibility is to express an opinion on these consolidated financial statements based on our audits.
We conducted our audits in accordance with the standards of the Public Company Accounting Oversight Board (United States). Those standards require that we plan and perform the audit to obtain reasonable assurance about whether the consolidated financial statements are free of material misstatement. The Company is not required to have, nor were we engaged to perform, an audit of its internal control over financial reporting. Our audits included consideration of its internal control over financial reporting as a basis for designing audit procedures that are appropriate in the circumstances, but not for the purpose of expressing an opinion on the effectiveness of the Company’s internal control over financial reporting. Accordingly, we express no such opinion. An audit includes examining, on a test basis, evidence supporting the amounts and disclosures in the consolidated financial statements. An audit also includes assessing the accounting principles used and significant estimates made by management, as well as evaluating the overall consolidated financial statement presentation. We believe that our audits provide a reasonable basis for our opinion.
In our opinion, the consolidated financial statements referred to above present fairly, in all material respects, the financial position of Aspirity Holdings LLC and Subsidiaries as of December 31, 2015 and 2014, and the results of their operations and cash flows for the years then ended, in conformity with U.S. generally accepted accounting principles.
| /S/ BAKER TILLY VIRCHOW KRAUSE, LLP | |
| Minneapolis, Minnesota | |
| April 15, 2016 |
| 56 |
Aspirity Holdings, LLC and Subsidiaries
As of December 31, 2015 and 2014
| 2015 | 2014 | |||||||
| Assets | ||||||||
| Current assets | ||||||||
| Unrestricted cash | $ | 2,331,401 | $ | 2,397,300 | ||||
| Cash in trading accounts | 8,047,331 | 21,099,652 | ||||||
| Cash collateral | 246,000 | - | ||||||
| Marketable securities | - | 311,586 | ||||||
| Trade accounts receivable, net | 5,888,184 | 2,394,246 | ||||||
| Inventory, average cost basis | 53,917 | - | ||||||
| Costs and estimated earnings in excess of billings on uncompleted contracts | 7,503 | - | ||||||
| Notes receivable, net of deferred gain | 795,995 | - | ||||||
| Prepaid expenses and other current assets | 771,941 | 416,419 | ||||||
| Total current assets | 18,142,272 | 26,619,203 | ||||||
| Property, equipment and furniture, net | 1,348,311 | 762,529 | ||||||
| Other assets | ||||||||
| Intangible assets, net | 852,669 | 269,149 | ||||||
| Deferred financing costs, net | 314,025 | 241,744 | ||||||
| Restricted cash | 1,319,371 | 1,319,371 | ||||||
| Real estate held for development | 2,714,297 | 953,462 | ||||||
| Investment in convertible notes | 502,110 | 1,604,879 | ||||||
| Notes receivable, net of deferred gain | 2,586,616 | - | ||||||
| Goodwill | 1,148,117 | - | ||||||
| Deferred tax asset | 47,000 | - | ||||||
| Other assets | 24,466 | - | ||||||
| Total assets | $ | 28,999,254 | $ | 31,770,337 | ||||
| Liabilities and Members’ Equity (Deficit) | ||||||||
| Current liabilities | ||||||||
| Current portions of debt | ||||||||
| Revolver and line of credit | $ | 1,688,405 | $ | 1,105,259 | ||||
| Senior notes | 1,214,762 | 312,068 | ||||||
| Renewable unsecured subordinated notes | 10,120,175 | 7,234,559 | ||||||
| Accounts payable - trade | 4,376,984 | 1,544,103 | ||||||
| Accrued expenses | 2,105,339 | 681,995 | ||||||
| Accrued compensation | 723,355 | 3,601,282 | ||||||
| Accrued interest | 1,503,819 | 849,913 | ||||||
| Billings in excess of costs and estimated earnings on uncompleted contracts | 710,827 | - | ||||||
| Obligations under settlement agreement | - | 582,565 | ||||||
| Total current liabilities | 22,443,666 | 15,911,744 | ||||||
| Long-term liabilities | ||||||||
| Senior notes | 242,232 | 217,451 | ||||||
| Renewable unsecured subordinated notes | 14,364,323 | 10,418,569 | ||||||
| Obligations under settlement agreement | - | 2,524,448 | ||||||
| Total long term liabilities | 14,606,555 | 13,160,468 | ||||||
| Total liabilities | 37,050,221 | 29,072,212 | ||||||
| Commitments and contingencies | ||||||||
| Members’ equity (deficit) | ||||||||
| Series A preferred equity | 2,745,000 | 2,745,000 | ||||||
| Common equity | (1,646,963 | ) | (193,624 | ) | ||||
| Accumulated other comprehensive income | - | 146,749 | ||||||
| Total members’ equity (deficit) | 1,098,037 | 2,698,125 | ||||||
| Non-controlling interest | (9,807,776 | ) | - | |||||
| Accumulated other comprehensive income attributed to non-controlling interest | 658,772 | - | ||||||
| Total equity (deficit) | (8,050,967 | ) | 2,698,125 | |||||
| Total liabilities and equity (deficit) | $ | 28,999,254 | $ | 31,770,337 | ||||
See notes to consolidated financial statements.
| 57 |
Aspirity Holdings, LLC and Subsidiaries
Consolidated Statements of Comprehensive Income
For the Years Ended December 31, 2015 and 2014
| 2015 | 2014 | |||||||
| Revenue | ||||||||
| Wholesale trading, net | $ | 14,293,475 | $ | 38,611,944 | ||||
| Retail energy services | 30,482,812 | 11,229,476 | ||||||
| Real estate sales | 351,725 | - | ||||||
| Management services | 710,000 | - | ||||||
| Construction services | 2,285,998 | - | ||||||
| - | ||||||||
| Total sales and services revenue | 33,830,535 | 11,229,476 | ||||||
| Total revenue | 48,124,010 | 49,841,420 | ||||||
| Costs of sales and services | ||||||||
| Cost of retail electricity sold | 26,663,003 | 11,440,672 | ||||||
| Cost of real estate sold | 319,261 | - | ||||||
| Cost of construction services. | 1,703,956 | - | ||||||
| Total costs of sales and services . | 28,686,220 | 11,440,672 | ||||||
| Gross profit on sales and services | 5,144,315 | (211,196 | ) | |||||
| Operating expenses | ||||||||
| Sales and marketing . | 1,353,221 | 324,948 | ||||||
| Compensation and benefits | 13,467,931 | 21,722,319 | ||||||
| Professional fees | 2,463,360 | 2,487,056 | ||||||
| Other general and administrative | 5,226,002 | 6,093,843 | ||||||
| Trading tools and subscriptions | 1,292,662 | 1,332,804 | ||||||
| Total operating expenses . | 23,803,176 | 31,960,970 | ||||||
| Operating income (loss) | (4,365,386 | ) | 6,439,778 | |||||
| Other income (expense) | ||||||||
| Interest expense | (3,568,707 | ) | (2,293,376 | ) | ||||
| Interest income | 829,222 | 142,915 | ||||||
| Gain on sale of subsidiary | 1,343,156 | - | ||||||
| Impairment of convertible notes | (1,250,000 | ) | - | |||||
| Gain (loss) on foreign currency exchange | 356,288 | (720,952 | ) | |||||
| Gain (loss) on sale of marketable securities | (129,743 | ) | 65,655 | |||||
| Other income | 1,976,127 | 145,164 | ||||||
| Other income (expense), net . | (443,657 | ) | (2,660,594 | ) | ||||
| Income (loss) before income taxes | (4,809,043 | ) | 3,779,184 | |||||
| Income tax benefit | (47,000 | ) | - | |||||
| Net income (loss) | (4,762,043 | ) | 3,779,184 | |||||
| Net income (loss) attributable to non-controlling interest | (468,484 | ) | - | |||||
| Net income (loss) attributable to Company | (4,293,559 | ) | 3,779,184 | |||||
| Preferred distributions | 549,072 | (549,072 | ) | |||||
| Net income (loss) attributable to common | (4,842,631 | ) | 3,230,112 | |||||
| Other comprehensive income (loss) attributable to non-controlling interest | ||||||||
| Foreign currency translation adjustment | (340,269 | ) | - | |||||
| Change in fair value of cash flow hedges. | 863,408 | - | ||||||
| Unrealized gain (loss) on marketable securities. | (11,116 | ) | - | |||||
| Comprehensive income (loss) attributable to non-controlling interest | 43,539 | - | ||||||
| Other comprehensive income (loss) attributable to common | ||||||||
| Foreign currency translation adjustment | - | 661,033 | ||||||
| Change in fair value of cash flow hedges. | - | (1,220,022 | ) | |||||
| Unrealized gain (loss) on marketable securities. | - | 5,349 | ||||||
| Comprehensive income (loss) attributable to common | (4,842,631 | ) | 2,676,472 | |||||
| Comprehensive income (loss) attributable to the Company | $ | (4,799,092 | ) | $ | 2,676,472 | |||
See notes to consolidated financial statements.
| 58 |
Aspirity Holdings, LLC and Subsidiaries
Consolidated Statements of Cash Flows
For the Years Ended December 31, 2015 and 2014
| 2015 | 2014 | |||||||
| Cash flows from operating activities | ||||||||
| Net (loss) income | $ | (4,762,043 | ) | $ | 3,779,184 | |||
| Adjustments to reconcile net (loss) income to net cash provided by operating activities: | ||||||||
| Depreciation and amortization | 696,395 | 869,631 | ||||||
| Loss (gain) on sale of marketable securities | 129,743 | (65,655 | ) | |||||
| Gain on sale of subsidiary | (1,343,156 | ) | - | |||||
| Loss on settlement agreement | - | 3,607,013 | ||||||
| Obligations under settlement agreement | (194,188 | ) | (500,000 | ) | ||||
| Impairment of convertible notes | 1,250,000 | - | ||||||
| Deferred tax asset | (47,000 | ) | - | |||||
| (Increase) decrease in: | ||||||||
| Trading accounts | 7,909,586 | (10,528,239 | ) | |||||
| Collateral deposits | (246,000 | ) | - | |||||
| Accounts receivable | (1,796,986 | ) | (1,079,036 | ) | ||||
| Inventories | (53,917 | ) | - | |||||
| Costs and estimated earnings in excess | 144,148 | - | ||||||
| Prepaid expenses and other current assets | (360,188 | ) | (183,638 | ) | ||||
| Increase (decrease) in: | ||||||||
| Accounts payable - trade | 1,377,268 | 508,459 | ||||||
| Accrued expenses | 1,414,254 | (145,870 | ) | |||||
| Accrued compensation | (3,614,045 | ) | 3,301,843 | |||||
| Accrued interest | 651,828 | 490,155 | ||||||
| Billings in excess of costs and estimated earnings | (66,518 | ) | - | |||||
| Net cash provided by operating activities | 1,089,181 | 53,847 | ||||||
| Cash flows from investing activities | ||||||||
| Purchase of property, equipment, and furniture | (477,755 | ) | (202,759 | ) | ||||
| Purchases of marketable securities | (5,110,517 | ) | (1,214,004 | ) | ||||
| Proceeds from sale of marketable securities | 5,292,360 | 1,229,426 | ||||||
| Noble Conservation Solutions, Inc. net of cash acquired | 68,494 | - | ||||||
| Discount Energy Group, LLC net of cash acquired | - | (680,017 | ) | |||||
| Purchase of convertible notes | - | (1,604,879 | ) | |||||
| Investment in convertible notes | (147,231 | ) | - | |||||
| Proceeds from sale of real estate held for development | 130,965 | - | ||||||
| Capital expenditures on real estate held for development | (1,891,800 | ) | (184,529 | ) | ||||
| Repayment of note receivable | 345,105 | 140,964 | ||||||
| Advance of note receivable | (747,992 | ) | ||||||
| Advance of restricted cash | - | (999,183 | ) | |||||
| Net cash used in investing activities | (2,538,371 | ) | (3,514,981 | ) | ||||
| Cash flows from financing activities | ||||||||
| Deferred financing costs | (300,792 | ) | (35,000 | ) | ||||
| Proceeds from line of credit | - | 700,000 | ||||||
| Payments on line of credit | - | (700,000 | ) | |||||
| Proceeds (payments) on senior line of credit | 862,152 | (203,433 | ) | |||||
| Proceeds from revolver | 269,543 | 1,850,000 | ||||||
| Payments on revolver | - | (744,741 | ) | |||||
| Issuances of renewable unsecured subordinated notes | 10,213,969 | 9,308,708 | ||||||
| Redemptions of renewable unsecured subordinated notes | (3,374,420 | ) | (1,640,406 | ) | ||||
| Preferred distributions | (549,072 | ) | (549,072 | ) | ||||
| Common distributions | (5,950,000 | ) | (4,726,730 | ) | ||||
| Payment of obligations under non-competition agreement | - | (250,000 | ) | |||||
| Net cash provided by financing activities | 1,171,380 | 3,009,326 | ||||||
| Net decrease in cash | (277,810 | ) | (451,808 | ) | ||||
| Effect of exchange rate changes on cash | 211,911 | (341,387 | ) | |||||
| Unrestricted cash | ||||||||
| Beginning of year | 2,397,300 | 3,190,495 | ||||||
| End of year | $ | 2,331,401 | $ | 2,397,300 | ||||
See notes to consolidated financial statements.
| 59 |
Aspirity Holdings, LLC and Subsidiaries
Consolidated Statements of Cash Flows (Continued)
For the Years Ended December, 31 2015 and 2014
| 2015 | 2014 | |||||||
| Non-cash investing and financing activities: | ||||||||
| Effective portion of cash flow hedges | $ | - | $ | (863,408 | ) | |||
| Note receivable from sale of subsidiary, gross | $ | 12,896,876 | $ | - | ||||
| Less deferred gain on sale | (10,260,568 | ) | - | |||||
| Note receivable from sale of subsidiary, net | $ | 2,636,308 | $ | - | ||||
| Acquisition of land for development via foreclosure on mortgage loan | $ | - | $ | 353,504 | ||||
| Acquisition of land for development via assignment and assumption agreement | $ | 1,083,675 | $ | 304,952 | ||||
| Unrealized gain on marketable securities | $ | - | $ | 11,116 | ||||
| Non-controlling interest | $ | (9,339,292 | ) | $ | - | |||
| Accumulated other comprehensive income attributed to non-controlling interest | 658,772 | - | ||||||
| Non-controlling interest due to distribution and reconsolidation of VIE | $ | (8,680,520 | ) | $ | - | |||
| Supplemental disclosures of cash flow information: | ||||||||
| Cash payments for interest | $ | 2,914,801 | $ | 1,793,221 | ||||
| Capitalized interest related to real estate held for development | $ | 43,958 | $ | - | ||||
See notes to consolidated financial statements.
| 60 |
Aspirity Holdings, LLC and Subsidiaries
Consolidated Statements of Changes in Members’ Equity
For the Years ended December 31, 2015 and 2014
| Series A Preferred Equity | Common Equity | Accumulated Other Comprehensive Income | Total Members’ Equity | Non-Controlling Interest | Accumulated Other Comprehensive Income Attributed to Non-Controlling Interest | Total Equity | ||||||||||||||||||||||
| Balance - December 31, 2013 | $ | 2,745,000 | $ | 1,302,994 | $ | 700,389 | $ | 4,748,383 | $ | - | $ | - | $ | 4,748,383 | ||||||||||||||
| Net income | - | 3,779,184 | - | 3,779,184 | - | - | 3,779,184 | |||||||||||||||||||||
| Other comprehensive income | - | - | (553,640 | ) | (553,640 | ) | - | - | (553,640 | ) | ||||||||||||||||||
| Preferred distributions | - | (549,072 | ) | - | (549,072 | ) | - | - | (549,072 | ) | ||||||||||||||||||
| Common distributions | - | (4,726,730 | ) | - | (4,726,730 | ) | - | - | (4,726,730 | ) | ||||||||||||||||||
| Balance - December 31, 2014 | $ | 2,745,000 | $ | (193,624 | ) | $ | 146,749 | $ | 2,698,125 | $ | - | $ | - | $ | 2,698,125 | |||||||||||||
| Net income (loss) | - | (4,293,559 | ) | - | (4,293,559 | ) | (468,484 | ) | - | (4,762,043 | ) | |||||||||||||||||
| Other comprehensive income | - | - | 512,023 | 512,023 | - | - | 512,023 | |||||||||||||||||||||
| Preferred distributions | - | (549,072 | ) | - | (549,072 | ) | - | - | (549,072 | ) | ||||||||||||||||||
| Common distributions | - | (5,950,000 | ) | - | (5,950,000 | ) | - | - | (5,950,000 | ) | ||||||||||||||||||
| Non-controlling interest due to distribution and reconsolidation of VIE | - | 9,339,292 | (658,772 | ) | 8,680,520 | (9,339,292 | ) | 658,772 | - | |||||||||||||||||||
| Balance - December 31, 2015 | $ | 2,745,000 | $ | (1,646,963 | ) | $ | - | $ | 1,098,037 | $ | (9,807,776 | ) | $ | 658,772 | $ | (8,050,967 | ) | |||||||||||
See notes to consolidated financial statements.
| 61 |
Aspirity Holdings, LLC and Subsidiaries
Notes to Consolidated Financial Statements
| 1. | Organization and Description of Business |
Organization
Aspirity Holdings LLC (“Aspirity” or the “Company”), known as Twin Cities Power Holdings, LLC or “TCPH” prior to July 14, 2015, is a Minnesota limited liability company formed on December 30, 2009, but had no assets or operations before December 31, 2011. On November 14, 2011, TCPH entered into an Agreement and Plan of Reorganization (the “Reorganization”) with its then current members and Twin Cities Power, LLC (“TCP”), Cygnus Partners, LLC (“CP”), and Twin Cities Energy, LLC (“TCE”) which were affiliated through common ownership. Effective December 31, 2011, following receipt of approval from the Federal Energy Regulatory Commission (“FERC”), the members of TCP, CP, and TCE each contributed all of their ownership interests in these entities to TCPH in exchange for ownership interests in TCPH. Consequently, after the Reorganization, which made TCPH a holding company and the sole member of each of TCP, CP, and TCE, the financial statements are presented on a consolidated basis. The Reorganization was accounted for as a transaction among entities under common control. TCE and its wholly-owned subsidiary, Twin Cities Power – Canada, Ltd. (“TCPC”), became inactive in the third quarter of 2012.
In 2013 and 2014, the Company formed additional first- and second-tier subsidiaries. First-tier subsidiaries included Retail Energy Holdings, LLC (“REH”), formed on October 25, 2013 in anticipation of the acquisition of Discount Energy Group, LLC or “DEG”, Cyclone Partners LLC (“Cyclone”), formed on October 23, 2013 to take advantage of certain investment opportunities present in the residential real estate market, and Apollo Energy Services, LLC (“Apollo”), formed on October 27, 2014 for the purpose of providing centralized services to the Company’s various other subsidiaries. Substantially all of the management rights and certain of the direct employees of TCPH were transferred to Apollo as of January 1, 2015.
With respect to second-tier subsidiaries, as of March 31, 2015, TCP had three active subsidiaries - Summit Energy, LLC (“SUM”), Chesapeake Trading Group, LLC (“CTG”), and Minotaur Energy Futures, LLC (“MEF”, deactivated in the second quarter of 2015); Cygnus had one - Cygnus Energy Futures, LLC (“CEF”); and REH had three - Town Square Energy, LLC (“TSE”), Town Square Energy East, LLC (“TSEE”, formerly DEG), and Town Square Energy Canada, Ltd. (“TSEC”). Effective April 30, 2015, TCP distributed the ownership interests of CTG to TCPH and it became a first tier subsidiary of the Company.
Operations Prior to the Restructuring and Distribution
Prior to the Restructuring and Distribution, the Company had three business segments used to measure its activity – wholesale trading, retail energy services, and diversified investments. Specifically, it:
| ● | Traded financial contracts in wholesale electricity markets managed by Independent System Operators or Regional Transmission Organizations (collectively, “ISOs”), including those managed by the Midcontinent Independent System Operator (“MISO”), the PJM Interconnection (“PJM”), ISO New England (“ISO-NE”), the New York Independent System Operator (“NYISO”), and the Electric Reliability Council of Texas (“ERCOT”); |
| ● | Traded electricity and other energy-related derivative contracts on exchanges regulated the Commodity Futures Trading Commission (“CFTC”) and operated by the Intercontinental Exchange® (“ICE”), the Natural Gas Exchange Inc. (“NGX”), and the CME Group (“CME”); |
| 62 |
| ● | Provided electricity supply services to retail customers in 8 states that permit retail choice (Connecticut, Maryland, Massachusetts, New Hampshire, New Jersey, Ohio, Pennsylvania, and Rhode Island); and |
| ● | Was engaged in certain asset management activities, including real estate development and investments in privately held businesses. |
Effective June 1, 2015 the Company entered into a 12-month agreement with Ultra Green to provide CEO services (the “UG Services Contract”).
The Restructuring
Since mid-2014, the Board of Directors has been considering ways to better position the Company to access capital markets, in particular that for public equity. Ultimately, the Board concluded that the Company’s regulatory exposure and earnings volatility, particularly that related to the wholesale trading businesses, needed to be substantially reduced or eliminated in order for such efforts to be successful on the desired scale.
On May 27, 2015, the Board approved a plan to restructure the business via the sale of TCP, spinning out the remaining legacy businesses as defined below, and recasting the Company solely as a retail energy and financial services business (the “Restructuring”). Overall, the Restructuring incorporated several major steps.
New first- and second-tier subsidiaries were created to facilitate the process. The new first-tier subsidiaries consisted of Krieger Enterprises, LLC (“Enterprises”), Aspirity Energy LLC (“Aspirity Energy”), and Aspirity Financial LLC (“Aspirity Financial”). Enterprises was formed to accept the contribution of the Legacy Businesses as defined below. The new second-tier entities, subsidiaries of Aspirity Energy, were formed to conduct business in the various areas of the U.S. that benefit from active wholesale and restructured retail electricity markets - Aspirity Energy Northeast LLC (“AENE”), Aspirity Energy Mid-States LLC (“AEMS”), and Aspirity Energy South LLC (“AES”). Aspirity Financial was formed to provide energy-related financial services to companies and households.
On June 1, 2015, pursuant to an Equity Interest Purchase Agreement (the “Purchase Agreement”), the Company sold 100% of the outstanding equity interests of TCP and SUM to Angell Energy, LLC, a Texas limited liability company (“Angell”), for a purchase price of $20,741,729, paid with $500,000 cash and a secured promissory note of $20,240,729 bearing interest at an annual rate of 6.00% and payable in 12 quarterly installments of $1,855,670 each with a final maturity of June 1, 2018 (the “Original Angell Note”). Also at such closing, the Company and Angell entered into a sublease for the Lakeville office of TCP and Apollo and Angell entered into two agreements - a 6-month contract to provide certain management, operations, and administrative services and a 24-month software license, subject to renewal for successive one year periods (the “Angell Services Contracts”). The Company also assumed the FERC settlement of $2,912,825.
After closing, Angell decided that it no longer desired to sublease the Lakeville office of TCP nor employ the associated personnel. Angell offered the Company the opportunity to cancel the sublease and to re-employ such personnel in exchange for a reduction of the purchase price. Consequently, effective September 2, 2015, an amendment to the Purchase Agreement was executed, reducing the purchase price to $15,000,000. The Original Angell Note was also amended and restated and the principal balance was reduced to $15,024,573, the interest rate remained the same, the quarterly payment was reduced to $1,063,215, and the final maturity date was extended to June 1, 2019 (the “Amended Angell Note”). On November 5, 2015, the services agreement was terminated and on November 5, 2015, Angel purchased a perpetual software license to replace the 24 month agreement.
| 63 |
Effective July 1, 2015, the Company completed an internal reorganization that effected the separation of the Company’s wholesale energy trading, real estate investments, investments in private companies, legacy retail energy business, and certain other assets and obligations (collectively, the “Legacy Businesses”) from its new Aspirity subsidiaries. Specifically, the internal reorganization incorporated the following actions:
| ● | Enterprises received the following from the Company: |
| ● | 100% of the outstanding equity interests of all active subsidiaries, including Apollo, CTG, Cygnus, REH, and Cyclone; | |
| ● | 100% of the outstanding equity interests of all inactive subsidiaries, including: Athena Energy Futures LLC; Minotaur Energy Futures LLC; Twin Cities Energy LLC and its subsidiary Twin Cities Power-Canada, Ltd.; TC Energy Trading, LLC; Twin Cities Power Services, LLC; and Vision Consulting, LLC; | |
| ● | Certain other assets owned directly by the Company, including the Amended Angell Note, the Series C Notes of Ultra Green, investments in certain real estate projects, and the restricted cash pledged to a Canadian court in connection with the ex-employee litigation; and | |
| ● | The UG and Angell Services Contracts. |
| ● | Enterprises assumed certain current liabilities and obligations owed directly by the Company such as leases for office space and equipment; and |
| ● | Enterprises borrowed an aggregate principal amount of $22,206,113 with a weighted average interest rate of 14.08% and a maturity date of December 30, 2019 from Aspirity Financial (the “Term Loan”). Although initially an intercompany relationship and eliminated in consolidation, the loan agreement between the parties is constructed on an arm’s length basis, contains customary protective provisions for the lender, including certain guarantees, collateral, and covenants, and ensures that the cash flows generated by the Legacy Businesses continue to be used to pay the interest and principal on the Renewable Unsecured Subordinated Notes (the “Notes”) outstanding as of June 30, 2015 (the “Term Loan Notes”). |
Effective November 1, 2015, the last major step in the Restructuring occurred - the spin-off or “Distribution” of 100% of the equity interests of Enterprises to the Company’s common equity owners, thus completing the legal separation of the Legacy Businesses from the Aspirity companies. Concurrently with the Distribution, executive management changed and new common equity owners were added pending FERC approval of the change in control. Such approval was obtained as of March 18, 2016.
After the Restructuring and Distribution
After the Distribution, the Company has start-up operations in two business segments - financial services and retail energy.
Further, while the Company no longer has an ownership interest in Enterprises and its subsidiaries after the Distribution Date, an assessment of the relationship between the entities as of December 31, 2015 with respect to ASC 810 Consolidation (“ASC 810”) guidance was performed. Pursuant to such assessment, it was concluded that Aspirity should consolidate Enterprises as a VIE as of December 31, 2015. ASC 810 also requires the Company to reevaluate the status of Enterprises as a VIE on a regular basis.
| 64 |
Note that while the Company includes the assets, liabilities, equity, and results of operations of Enterprises in its consolidated financial statements, the Company does not have rights to those assets or responsibility for such claims on assets other than pursuant to its rights under the Term Loan.
Finally, in the future, the Company’s reports of its financial condition and results of operations will be significantly different from those of the past. For example, on a consolidated basis, wholesale trading activities accounted for 29.7% and 77.5% of total revenues of $48,124,000 and $49,841,420 for the years ended December 31, 2015 and 2014, respectively. The Company exited this business effective with the Distribution and has no plans to engage in such activities in the future. With respect to retail energy, while Aspirity Energy has commenced operations, it has yet to record significant results and the Company’s historical financial statements reflect the results of operations of REH and its subsidiaries which it no longer owns or operates. Finally, the Company no longer intends to pursue any diversified investment activity.
Liquidity and Financial Condition
The Company and Enterprises on a consolidated basis reported a net loss of $4,762,000 for the year ended December 31, 2015 and had unrestricted cash, other liquid assets (deposits in trading accounts, cash collateral, and trade receivables), negative working capital and deficit equity of $2,331,000, $14,182,000, $4,301,000, and $8,051,000, respectively, as of the same date. See “Note 3 – Summary Consolidating Financial Data”.
Aspirity Energy and Aspirity Financial are start-up companies in the retail energy and financial services industries, respectively, and are not expected to have significant revenue-generating operations until the middle of 2016 at the earliest. Prior to that, the Company will rely on the timely payment of the Term Loan to repay Term Loan Notes as they are redeemed and on its ability to sell Notes in order to fund start-up operations. Enterprises’ ability to make timely payments on the Term Loan depends in part on the operations of its Legacy Businesses which were not profitable in 2015. In the event amounts owed to us are paid late or not paid, our ability to fund operations, sell new Notes, and repay existing Notes will be negatively impacted. See “Note 20 - Debt” and “Note 27 - Subsequent Events”.
While the Company believes that payments from Enterprises on the Term Loan, anticipated cash generated from operating activities, availability of trade credit with respect to power purchases, and anticipated proceeds from our Notes Offering will be sufficient to meet operating cash requirements and obligations under the Notes and Term Loan Notes through at least December 31, 2016, there can be no assurance that this will prove to be the case. Consequently, the Company regularly evaluates other sources of debt financing and is also considering seeking additional equity capital to meet its funding needs. However, there can be no assurance that these efforts will prove to be successful.
| 2. | Summary of Significant Accounting Policies |
Principles of Consolidation
The Company evaluates the need to consolidate affiliates based on standards set forth in ASC 810 Consolidation (“ASC 810”).
In determining whether we have a controlling interest in an affiliate and the requirement to consolidate the accounts of an entity, management considers factors such as our ownership interest, our authority to make decisions, contractual and substantive participating rights of owners, as well as whether the entity is a variable interest entity or “VIE”.
A VIE is an entity that does not have sufficient equity at risk to finance its activities without additional subordinated financial support from other parties or whose equity investors lack any of the characteristics of a controlling financial interest. A variable interest is an investment or other interest that will absorb portions of a VIE’s expected losses or receive portions of the entity’s expected residual returns. Variable interests are contractual, ownership, or other pecuniary interests that change with changes in the fair value of the entity’s net assets. A party is the primary beneficiary of a VIE and must consolidate it when that party has a variable interest, or combination of variable interests, that provides the party with a controlling financial interest. A party is deemed to have a controlling financial interest if it meets both of power and losses/benefits criteria. The power criterion is the ability to direct the activities of the VIE that most significantly impact its economic performance. The losses/benefits criterion is the obligation to absorb losses from, or right to receive benefits from, the VIE that could potentially be significant to the VIE. The VIE model requires an ongoing reconsideration of whether a reporting entity is the primary beneficiary of a VIE due to changes in facts and circumstances.
The accompanying consolidated financial statements include the accounts of the Company and its subsidiaries as well as Enterprises and its subsidiaries. All significant consolidated transactions and balances have been eliminated in consolidation.
| 65 |
Variable Interest Entities
The Company follows ASC 810-10-15 guidance with respect to accounting for variable interest entities (each, a “VIE”). These entities do not have sufficient equity at risk to finance their activities without additional subordinated financial support from other parties or whose equity investors lack any of the characteristics of a controlling financial interest. A variable interest is an investment or other interest that will absorb portions of a VIE’s expected losses or receive portions of its expected residual returns and are contractual, ownership, or pecuniary in nature and that change with changes in the fair value of the entity’s net assets. A reporting entity is the primary beneficiary of a VIE and must consolidate it when that party has a variable interest, or combination of variable interests, that provides it with a controlling financial interest. A party is deemed to have a controlling financial interest if it meets both of the power and losses/benefits criteria. The power criterion is the ability to direct the activities of the VIE that most significantly impact its economic performance. The losses/benefits criterion is the obligation to absorb losses from, or right to receive benefits from, the VIE that could potentially be significant to the VIE. The VIE model requires an ongoing reconsideration of whether a reporting entity is the primary beneficiary of a VIE due to changes in facts and circumstances.
Krieger Enterprises
At December 31, 2015, an assessment of the relationship between the Company and Enterprises was performed as a result of the Restructuring. Due to related party considerations, delay in the transfer of governance rights, and the nature and size of the Term Loan between the two parties that could result in losses, the Company may hold a controlling financial interest in Enterprises, and consequently should consolidate it as a VIE as of December 31, 2015. The relationship is subject to ongoing reconsideration based on changes in facts and circumstances.
Ultra Green Packaging
At December 31, 2015, an assessment of the relationship between Enterprises and Ultra Green Packaging, Inc. ("UG") was performed as a result of the investment in UG's Series C Convertible Promissory Notes (the "Series C Notes"), entry into a services contract, and the purchase of certain mortgage notes receivable.
During 2014, Enterprises invested $1,500,000 in the Series C Notes and also entered into an agreement to provide executive services to UG. The term of the contract is for twelve months and either party can terminate the agreement upon thirty days' written notice. During 2015, Enterprises loaned UG $325,000 in the form of four notes, all secured by a first mortgage on a production facility in Devil's Lake, North Dakota and bearing interest at 10% per annum. The notes are due upon the closing of the sale of the property and interest payments are due beginning September 1, 2015. In connection with the issuance of the notes, Ultra Green issued the Company four warrants expiring at various dates in 2025 to purchase 325,000,000 shares of its common stock at an exercise price of $0,001 per share. Enterprises may continue to provide financial support to UG in the future under similar terms. Also during 2015, an impairment of $1,250,000 was recognized on the Series C Notes, resulting in a fair value of $502,110 on the balance sheet as of year-end.
Even though Enterprises holds what might be considered to be a variable interest (the Series C Notes and mortgage notes) in UG, it is not the primary beneficiary as it fails both the power and losses/benefits criteria for primary beneficiary determination. Thus as of December 31, 2015, Enterprises did not consolidate UG.
See also Note 6 - Fair Value Measurements, Note 13 - Notes Receivable, and Note 14 - Investment in Convertible Notes.
Angell
At December 31, 2015, an assessment of the relationship between the Company and Angell was performed as a result of the sale of TCP on June 1, 2015. See “Note 1 – Organization and Description of Business – The Restructuring”. The Company estimates that total assets of Angell immediately after closing were substantially equal to the purchase price. Angell is a VIE since the equity at risk is small compared to the sale price. Further, the Company held a variable interest in the form of the Angell note as adjusted and paid down in the amount of $12,896,875. The receivable amount carried on the Company’s books net of the deferred gain of $10,260,572 is $2,636,303. The Angell note represents the Company’s maximum loss in the VIE. However, the Company has no power to direct any of the activities of Angell, therefore it does not have a controlling financial interest, thus it is not considered a primary beneficiary, and consequently, as of December 31, 2015, the Company did not consolidate Angell. The Company does not provide, nor does it intend to provide, any other financial support to Angell.
Use of Estimates
Preparation of the consolidated financial statements in conformity with U.S. generally accepted accounting principles requires management to make estimates and assumptions that affect the reported amounts of assets and liabilities and disclosures of contingent assets and liabilities at the date of the consolidated financial statements and the reported amounts for revenue and expenses during the reported period. Actual results could differ from those estimates.
Cash Equivalents
Cash equivalents include highly liquid investments with an original maturity of three months or less at the time of purchase. As of December 31, 2015 and 2014, the Company had no cash equivalents.
Reclassifications
Certain amounts reported in prior periods have been reclassified to conform to the current period’s presentation. There was no effect on members’ equity or net income as previously reported.
Revenue Recognition
Wholesale Trading
Some of the Company’s wholesale trading activities use derivatives such as swaps, forwards, futures, and options to generate trading revenues. These contracts are marked to fair value in the accompanying consolidated balance sheets. The Company’s agreements with the ISOs and the exchanges permit net settlement of contracts, including the right to offset cash collateral in the settlement process. Accordingly, the Company nets cash collateral against the derivative position in the accompanying consolidated balance sheets. All realized and unrealized gains and losses on derivative instruments held for trading purposes are recorded in revenues.
Retail Energy Services
Revenue from the retail sale of electricity to customers is recorded in the period in which the commodity is consumed, net of any applicable sales tax. The Company follows the accrual method of accounting for revenues whereby electricity consumed by customers but not yet billed under the cycle billing method is estimated and accrued along with the related costs. Changes in estimates are reflected in operations in the period in which they are refined.
During the year ended December 31, 2014, the Company changed its estimate with respect to retail sales of electricity and recorded an adjustment of $465,000 to unbilled revenue.
Diversified Investments
Revenues from real estate developments, if any, are recognized at the time of a sale closing if all significant conditions are satisfied, including adequate down payment, reasonable assurance of collectability of any notes received, and completion of other contractual requirements. Recognition of all or part of the revenue is deferred if any significant conditions are not satisfied.
Revenues from administrative services and software licenses are recognized on a monthly basis in accordance with the respective agreements with third parties.
| 66 |
Revenue from construction services is accounted for using the percentage of completion method. Completion percentages are calculated by dividing actual costs incurred to date by the total estimated costs to complete the agreement. Costs-to-complete include all direct material and labor costs, indirect costs related to contract performance such as indirect labor, supplies, tools, and repairs, and estimated earnings. Long term contracts are any that span a period-end. This method is used because management considers total costs to be the best available measure of progress on these contracts.
Changes in job performance, job conditions, estimated profit or loss, and final contract settlements may result in revisions to costs and income. Revisions are recognized in the period in which determined and such adjustments could be significant. The asset “costs and estimated earnings in excess of billings on uncompleted contracts” represents revenues recognized in excess of amounts billed. The liability “billings in excess of costs and estimated earnings on uncompleted contracts” represents billings in excess of revenues recognized.
The financial statements include amounts based on management’s best estimates and judgments, the most significant of which relate to costs-to-complete. These estimates may be adjusted as more current information becomes available, and any adjustment could be significant.
Derivative Instruments
In our wholesale operations, we use derivative contracts for trading purposes, seeking to profit from perceived opportunities driven by expected changes in market prices. In our retail business, the Company is exposed to volatility in the cost of energy acquired for sale to customers, and as a result, we use derivatives to hedge or reduce this variability.
Our retail operations follow the guidance of ASC 815 Derivatives and Hedging (“ASC 815”) that permits “hedge accounting” under which the effective portion of gains or losses from the derivative and the hedged item are recognized in earnings in the same period.
To qualify for hedge accounting, the hedge relationships must meet extensive documentation requirements and hedge effectiveness and ineffectiveness must be assessed and measured on an on-going basis.
“Hedge effectiveness” is the extent to which changes in the fair value of the hedging instrument offset the changes in the cash flows of the hedged item. Conversely, “hedge ineffectiveness” is the measure of the extent to which the change in fair value of the hedging instrument does not offset those of the hedged item. If a transaction qualifies as a “highly effective” hedge, ASC 815 permits matching of the timing of gains and losses of the hedged item and the hedging instrument.
For a cash flow hedge, the effective portion of any change in the hedging instrument’s fair value is recorded in accumulated other comprehensive income or “AOCI” until the change in value of the hedged item is recognized in earnings.
Financial Instruments
The Company holds various financial instruments. The nature of these instruments and the Company’s operations expose the Company to foreign currency risk, credit risk, and fair value risk.
| 67 |
Foreign Currencies
A portion of the Company’s assets and liabilities are denominated in Canadian dollars and are subject to fluctuations in exchange rates. The Company does not have any exposure to any highly inflationary foreign currencies.
For foreign subsidiaries whose functional currency is the local foreign currency, balance sheet accounts are translated at exchange rates in effect at the end of the month and income statement accounts are translated at average monthly exchange rates for the period. Foreign currency transactions denominated in a foreign currency result in gains and losses due to the increase or decrease in exchange rates between periods. Translation gains and losses are included as a separate component of equity. Gains and losses from foreign currency transactions are included in other income or expense.
Foreign currency transactions resulted in a gain of $356,288 and a loss of $720,952 for the years ended December 31, 2015 and 2014, respectively.
Concentrations of Credit Risk
Financial instruments that subject the Company to concentrations of credit risk consist principally of deposits in trading accounts and accounts receivable. The Company has a risk policy that includes value-at-risk calculations, position limits, stop loss limits, stress testing, system controls, position monitoring, liquidity guidelines, and compliance training.
At any given time, there may be concentrations of receivables balances with one or more of the exchanges upon which we transact our wholesale business or, in the case of retail, one or more of the utilities operating in purchase of receivables states in which we do business.
Fair Value
The fair values of the Company’s cash, accounts receivable, note receivables, revolver, and accounts payable were considered to approximate their carrying values at December 31, 2015 and 2014 due to the short-term nature of the accounts.
Management believes the carrying values of the Company’s notes payable and Notes reasonably approximate their fair value at December 31, 2015 and 2014 due to the relatively new age of these particular instruments. No assessment of the fair value of these obligations has been completed and there is no readily available market price.
See also “Note 6 – Fair Value Measurements”.
Accounts Receivable
Receivables are reported at the amount management expects to collect from outstanding balances. Differences between amounts due and expected collections are reported in the results of operations for the period in which those differences are determined. Receivables are written off only after collection efforts have failed, and the Company typically does not charge interest on past due accounts. There was a $2,500 and $0 allowance for doubtful accounts as of December 31, 2015 and 2014, respectively.
| 68 |
Marketable Securities
The Company classifies its investments in marketable securities as “available-for-sale”. Available-for-sale securities are required to be carried at their fair value, with unrealized gains and losses that are considered temporary recorded in AOCI. The Company periodically evaluates its investments in marketable securities for impairment due to declines in market value considered to be other than temporary. Such impairment evaluations may consider, in addition to declining market prices, general economic conditions and Company-specific valuations. If the Company determines that a decline in market value is other than temporary, then a charge to operations is recorded in “other expense” and a new cost basis in the investment is established.
Inventories
Inventories consist principally of light bulbs and are recorded at the lower of cost (first-in, first-out) or market.
Property, Equipment, and Furniture
Property, equipment, and furniture are carried at cost and additions or replacements are capitalized. The cost of equipment disposed of or retired and the related accumulated depreciation are eliminated from the accounts with any gain or loss included in operations.
Equipment, computers, software, and furniture are depreciated using the straight-line method over estimated useful lives that range from 3 to 7 years. Property is depreciated using the straight-line method over an estimated useful life of 27.5 years. Leasehold improvements are depreciated using the straight-line method over the shorter of the lease term or the estimated useful life of the asset. Expenditures for repairs and maintenance are charged to expense as incurred.
Real Estate Development
Costs that relate directly to real estate development projects are capitalized and allocated using the specific identification method. Land acquisition, improvements, and holding costs, including real estate taxes and interest are capitalized while a development is in progress. Interest expense, if any, is capitalized based on specific identification of notes payable issued to finance specific assets under development. Once development on a project has been completed and sales have begun, remaining inventory is recorded at the lower of cost or market. Development costs are charged to cost of sales when the related revenue is recognized or when a development is abandoned.
Acquisitions and Business Combinations
The Company accounts for business combinations in accordance with ASC 805 Business Combinations (“ASC 805”) which requires an acquirer to recognize and measure in its financial statements the identifiable tangible and intangible assets acquired, the liabilities assumed, and any non-controlling interest at fair values at the transaction date. Transaction costs are expensed as incurred.
Acquisitions are initially recorded based on preliminary allocations of the purchase price and management’s assessment of fair values. The allocation process involves a considerable amount of subjective judgment and preliminary estimates of fair values are subject to adjustment as additional information is obtained and finalized, up to one year after the acquisition date.
See “Note 4 – Acquisitions”, “Note 16 - Intangible Assets”, and “Note 19 – Goodwill”.
| 69 |
Non-Controlling Interests
Ownership interests in a business organized as a legal entity are represented by shares or units. The income of the entity is allocated to owners based upon the ratio of their holdings to the total units or shares outstanding during the period. Capital contributions, distributions, and profits and losses are allocated to non-controlling interests in accordance with the terms of the operating agreement.
Impairment of Long-Lived Assets
The Company reviews its long-lived assets for impairment whenever events or changes in circumstances indicate that the carrying amount of an asset may not be recoverable. Recoverability of assets to be held and used is measured by a comparison of the carrying amount of an asset group to future net undiscounted cash flows expected to be generated by the asset group. If such assets are considered to be impaired, the impairment to be recognized is measured by the amount by which the carrying amount of the assets exceeds the fair value of the assets. Assets to be disposed of, if any, are reported at the lower of the carrying amount or fair value less costs to sell.
Profits Interests
Specific second-tier subsidiaries of Enterprises have Class B members. Under the terms of the subsidiaries’ member control agreements, Class B members have no voting rights, are not required to contribute capital, and have no rights to distributions following termination of employment, but are entitled to a defined share of profits while employed. Since Class B members have no corporate governance rights, risk of capital loss, or opportunity for capital gain, they do not own non-controlling equity interests. Profits interest payments are recorded as compensation expense during the period earned and are classified as accrued compensation on the consolidated balance sheet.
During the years ended December 31, 2015 and 2014, the Company included $2,478,413 and $6,363,520, respectively, in compensation and benefits representing the allocation of profits interests to Class B members.
Income Taxes
The Company is organized as a limited liability company under the laws of Minnesota and has elected to be taxed as a partnership. As such, it is not a taxable entity and no provision for federal or state income taxes has been made on the financial statements. However, holders of preferred units report distributions received on their individual tax returns while members holding common units report their proportionate shares of taxable income or loss (which may vary substantially from the income or loss reported in our consolidated statements of comprehensive income) on theirs.
Noble is a Minnesota corporation, thus the Company has elected to use the taxes payable method. Under that method, income tax expense represents the amount of income tax Noble expects to pay based on the entity’s current year taxable income. TCPC files tax returns with the Canada Revenue Agency and the Tax and Revenue Administration of Alberta.
| 70 |
In accounting for uncertainty in income taxes, we recognize the financial statement benefit of a tax position only after determining that the relevant tax authority would more likely than not sustain the position following an audit. The Company recognizes interest and penalties on any unrecognized tax benefits as a component of income tax expense. Based on evaluation of the Company’s tax positions, management believes all positions taken would be upheld under an examination.
The Company’s federal and state tax returns are potentially open to examinations for the years 2012 through 2015 and its Canadian tax returns are potentially open to examination for the years 2012 through 2015.
New Accounting Pronouncements
In May 2014, the FASB issued a new revenue recognition standard, ASU 2014-09 Revenue from Contracts with Customers (Topic 606), that eliminated all industry-specific provisions and replaced all current U.S. GAAP guidance on the topic. The new standard provides a unified model to determine when and how revenue is recognized based on the core principle that recognition should depict the transfer of promised goods or services to customers in an amount that reflects the consideration to which the seller expects to be entitled. The Company was originally required to adopt the standard on January 1, 2017. In April 2015, the FASB proposed a one-year deferral of the effective date for the standard and the deferral was adopted in August 2015. The Company is now required to adopt the standard on January 1, 2018. Early application is not permitted. The update may be applied using one of two methods, either retrospective application to each prior reporting period presented or retrospective application with the cumulative effect of initially applying the update recognized at the date of initial application. We are currently assessing the impact of the standard on the Company’s consolidated financial statements.
In August 2014, the FASB issued ASU 2014-15 Presentation of Financial Statements – Going Concern (Subtopic 205-40) regarding disclosures of uncertainties about an entity’s ability to continue as a going concern. Under GAAP, continuation of a reporting entity as a going concern is presumed as the basis for preparing financial statements unless and until the entity’s liquidation becomes imminent. Currently, there is no guidance in GAAP about management’s responsibility to evaluate whether there is substantial doubt about an entity’s ability to continue as a going concern or to provide related footnote disclosures and the update provides such. The update applies to all entities, are effective for the annual period ending after December 15, 2016 and for annual periods and interim periods thereafter. Early application is permitted. The Company is currently evaluating the impact of ASU 2014-15 on the Company’s disclosures.
In February 2015, the FASB issued ASU 2015-02 Amendments to the Consolidation Analysis (“ASU 2015-02”), amending ASC 810 to improve the guidance by simplifying the requirements for consolidation and placing more emphasis on risk of loss when determining a controlling financial interest. ASU 2015-02 is effective for the annual period ending after December 15, 2015 and subsequent interim and annual periods with early adoption permitted. The adoption of ASU 2015-02 is not expected to have a material impact on the Company’s consolidated financial statements.
In April 2015, the FASB issued ASU 2015-03 Interest – Imputation of Interest (Topic 835) simplifying the presentation of debt issuance costs. The new guidance requires that debt issuance costs related to a recognized debt liability be presented in the balance sheet as a direct deduction from the carrying amount of that debt liability. The recognition and measurement guidance for debt issuance costs are not affected by the new guidance. This guidance is effective for annual and interim periods beginning after December 15, 2015, and early adoption is permitted for financial statements that have not been previously issued. The Company expects to adopt ASU 2015-03 in the first quarter of 2016 and such adoption is not expected to have a material impact on the Company’s consolidated financial position and disclosures.
| 71 |
In July 2015, the FASB issued ASU 2015-11 Inventory (Topic 330) simplifying the measurement of inventory. The new guidance requires that an entity should measure inventory at the lower of cost or net realizable value. Net realizable value is the estimated selling price in the ordinary course of business, less reasonably predictable costs of completion, disposal, and transportation. This guidance is effective for annual and interim periods beginning after December 15, 2017, and early adoption is permitted for financial statements that have not been previously issued. The Company is currently evaluating the impact of ASU 2015-11 on the Company’s consolidated financial position and disclosures.
In September 2015, the FASB issued ASU 2015-16 Business Combinations (Topic 805) simplifying the accounting for measurement period adjustments. The amendments in the update require that the acquirer recognize adjustments to provisional amounts that are identified during the measurement period in the reporting period in which the adjustment amounts are determined. The amendments require that the acquirer record, in the same period’s financial statements, the effect on earrings of changes in depreciation, amortization, or other income effects, if any, as a result of the change to the provisional amounts, calculated as if the accounting had been completed at the acquisition date. The update requires an entity to present separately on the income statement or disclose in the notes the portion of the amount recorded in current period earnings by line item that would have been recorded in previous reporting periods if the adjustment to the provisional amounts had been recognized as of the acquisition date. This guidance is effective for annual and interim periods beginning after December 15, 2016 and should be applied prospectively to adjustments to provisional amounts that occur after the effective date with earlier application permitted for financial statements that have not yet been made available for issuance. The Company is currently evaluating the impact of ASU 2015-16 on the Company’s consolidated financial position and disclosures.
In November 2015, the FASB issued ASU 2015-17 Income Taxes (Topic 740) simplifying the balance sheet classification of deferred taxes. The new guidance requires that an entity present deferred tax liabilities and assets to be classified as noncurrent in a classified balance sheet. This guidance is effective for annual and interim periods beginning after December 15, 2016, and early adoption is permitted for financial statements that have not been previously issued. The Company has adopted ASU 2015-17 on the Company’s consolidated financial position and disclosures for this period.
| 3. | Summary Consolidating Financial Data |
While the Company no longer has an ownership interest in Enterprises and its subsidiaries after the Distribution Date, an assessment of the relationship between the entities as of December 31, 2015 with respect to ASC 810 guidance was performed because the entities have an ongoing business relationship as a result of the Term Loan. Pursuant to such assessment, Aspirity holds a variable interest in Enterprises in the form of the Term Loan, and due to certain related party considerations, delay in the issuance of FERC approval of equity grants to executives and others, and the nature and size of the Term Loan, it was concluded that Aspirity should consolidate Enterprises as a VIE as of December 31, 2015. ASC 810 also requires the Company to reevaluate the status of Enterprises as a VIE on a regular basis.
| 72 |
Presented below are consolidating balance sheets for Aspirity and Enterprises:
| As of December 31, 2015 | ||||||||||||||||
| Aspirity Holdings and Subsidiaries | Krieger Enterprises and Subsidiaries | Eliminations | Aspirity Holdings Consolidated | |||||||||||||
| Current assets | ||||||||||||||||
| Unrestricted cash | 718,497 | 1,612,904 | - | 2,331,401 | ||||||||||||
| Cash in trading accounts | - | 8,047,331 | - | 8,047,331 | ||||||||||||
| Cash collateral | 63,500 | 182,500 | - | 246,000 | ||||||||||||
| Marketable securities | - | - | - | - | ||||||||||||
| Trade accounts receivable, net | 381,977 | 5,888,184 | (381,977 | ) | 5,888,184 | |||||||||||
| Inventory | - | 53,917 | - | 53,917 | ||||||||||||
| Costs and estimated earnings in excess of billings on uncompleted contracts | - | 7,503 | - | 7,503 | ||||||||||||
| Notes receivable, net of deferred gain | - | 795,995 | - | 795,995 | ||||||||||||
| Prepaid expenses and other current assets | 77,937 | 963,317 | (269,313 | ) | 771,941 | |||||||||||
| Total current assets | 1,241,911 | 17,551,651 | (651,290 | ) | 18,142,272 | |||||||||||
| Property, equipment and furniture, net | 88,172 | 1,260,139 | - | 1,348,311 | ||||||||||||
| Other assets | ||||||||||||||||
| Intangible assets, net | - | 852,669 | - | 852,669 | ||||||||||||
| Deferred financing costs, net | 300,171 | 13,854 | - | 314,025 | ||||||||||||
| Term Loan | 20,248,186 | - | (20,248,186 | ) | - | |||||||||||
| Restricted cash | - | 1,319,371 | - | 1,319,371 | ||||||||||||
| Real estate held for development | - | 2,714,297 | - | 2,714,297 | ||||||||||||
| Notes receivable, net of deferred gain | - | 2,586,616 | - | 2,586,616 | ||||||||||||
| Investment in convertible notes | - | 502,110 | - | 502,110 | ||||||||||||
| Goodwill | - | 1,148,117 | - | 1,148,117 | ||||||||||||
| Deferred tax asset | - | 47,000 | - | 47,000 | ||||||||||||
| Other assets | - | 24,466 | - | 24,466 | ||||||||||||
| Total assets | 21,878,440 | 28,020,290 | (20,899,476 | ) | 28,999,254 | |||||||||||
| Current liabilities | ||||||||||||||||
| Current portions of debt | ||||||||||||||||
| Revolver | - | 1,688,405 | - | 1,688,405 | ||||||||||||
| Term Loan | - | 8,458,033 | (8,458,033 | ) | - | |||||||||||
| Senior notes | - | 1,214,762 | - | 1,214,762 | ||||||||||||
| Renewable unsecured subordinated notes | 10,120,175 | - | - | 10,120,175 | ||||||||||||
| Accounts payable - trade | 665,501 | 4,362,772 | (651,290 | ) | 4,376,984 | |||||||||||
| Accrued expenses | - | 2,105,339 | - | 2,105,339 | ||||||||||||
| Accrued compensation | - | 723,355 | - | 723,355 | ||||||||||||
| Accrued interest | 1,483,020 | 20,799 | - | 1,503,819 | ||||||||||||
| Billings in excess of costs and estimated earnings on uncompleted contracts | - | 710,827 | - | 710,827 | ||||||||||||
| Total current liabilities | 12,268,696 | 19,284,292 | (9,109,323 | ) | 22,443,666 | |||||||||||
| Long-term liabilities | ||||||||||||||||
| Senior notes | - | 242,232 | - | 242,232 | ||||||||||||
| Term loan | - | 11,790,153 | (11,790,153 | ) | - | |||||||||||
| Renewable unsecured subordinated notes | 14,364,323 | - | - | 14,364,323 | ||||||||||||
| Total long term liabilities | 14,364,323 | 12,032,385 | (11,790,153 | ) | 14,606,555 | |||||||||||
| Total liabilities | 26,633,020 | 31,316,677 | (20,899,476 | ) | 37,050,220 | |||||||||||
| Members’ equity (deficit) | ||||||||||||||||
| Series A preferred equity | 2,745,000 | - | - | 2,745,000 | ||||||||||||
| Common equity | (7,499,580 | ) | (3,259,563 | ) | 9,112,180 | (1,646,963 | ) | |||||||||
| Accumulated other comprehensive income (loss) | - | 658,772 | (658,772 | ) | - | |||||||||||
| Total members’ equity (deficit) | (4,754,440 | ) | (2,600,791 | ) | 5,663,841 | 1,098,037 | ||||||||||
| Non-controlling interest | - | (695,596 | ) | (9,112,180 | ) | (9,807,776 | ) | |||||||||
| Accumulated other comprehensive income (loss) attributable to non-controlling interest | - | - | 658,772 | 658,772 | ||||||||||||
| Total equity (deficit) | (4,754,580 | ) | (3,296,387 | ) | - | (8,050,967 | ) | |||||||||
| Total liabilities and equity (deficit) | 21,878,440 | 28,020,290 | (20,899,476 | ) | 28,999,254 | |||||||||||
| 73 |
Presented below are consolidating statements of comprehensive income for Aspirity and Enterprises:
| For the Year Ended December 31, 2015 | ||||||||||||||||
| Aspirity Holdings and Subsidiaries | Krieger Enterprises and Subsidiaries | Eliminations | Aspirity Holdings Consolidated | |||||||||||||
| Revenue | ||||||||||||||||
| Wholesale trading, net | - | 14,293,475 | - | 14,293,475 | ||||||||||||
| Retail energy services | - | 30,482,812 | - | 30,482,812 | ||||||||||||
| Financial services | 2,877,149 | - | (2,877,149 | ) | - | |||||||||||
| Real estate sales | - | 351,725 | - | 351,725 | ||||||||||||
| Management services | - | 710,000 | - | 710,000 | ||||||||||||
| Construction services | - | 2,285,998 | - | 2,285,998 | ||||||||||||
| Total sales and services revenue | 2,877,149 | 33,830,535 | (2,877,149 | ) | 33,830,535 | |||||||||||
| Total revenue | 2,877,149 | 48,124,010 | (2,877,149 | ) | 48,124,010 | |||||||||||
| Costs of sales and services | ||||||||||||||||
| Cost of retail electricity sold | - | 26,663,003 | - | 26,663,003 | ||||||||||||
| Cost of real estate sold | - | 319,261 | - | 319,261 | ||||||||||||
| Cost of construction services | - | 1,703,956 | - | 1,703,956 | ||||||||||||
| Total costs of sales and services | - | 28,686,220 | - | 28,686,220 | ||||||||||||
| Gross profit on sales and services | 2,877,149 | 5,144,315 | (2,877,149 | ) | 5,144,315 | |||||||||||
| Operating expenses | ||||||||||||||||
| Sales and marketing | 7,000 | 1,346,221 | - | 1,353,221 | ||||||||||||
| Compensation and benefits | 824,332 | 12,643,599 | - | 13,467,931 | ||||||||||||
| Professional fees | 531,541 | 1,931,819 | - | 2,463,360 | ||||||||||||
| Other general and administrative | 2,866,608 | 2,808,894 | (449,500 | ) | 5,226,002 | |||||||||||
| Trading tools and subscriptions | - | 1,292,662 | - | 1,292,662 | ||||||||||||
| Total operating expenses | 4,229,480 | 20,023,195 | (449,500 | ) | 23,803,176 | |||||||||||
| Operating income (loss) | (1,352,331 | ) | (585,405 | ) | (2,427,649 | ) | (4,365,386 | ) | ||||||||
| Other income (expense) | ||||||||||||||||
| Interest expense | (3,205,933 | ) | (3,239,923 | ) | 2,877,149 | (3,568,707 | ) | |||||||||
| Interest income | 20,485 | 808,737 | - | 829,222 | ||||||||||||
| Gain on sale of subsidiary | - | 1,343,156 | - | 1,343,156 | ||||||||||||
| Impairment of convertible notes | - | (1,250,000 | ) | - | (1,250,000 | ) | ||||||||||
| Gain (loss) on foreign currency exchange | - | 356,288 | - | 356,288 | ||||||||||||
| Gain (loss) on sale of marketable securities | (129,743 | ) | - | - | (129,743 | ) | ||||||||||
| Other income | - | 1,976,127 | - | 1,976,127 | ||||||||||||
| Other income (expense), net | (3,315,192 | ) | (5,615 | ) | 2,877,149 | (443,657 | ) | |||||||||
| Income (loss) before income taxes | (4,667,523 | ) | (591,020 | ) | 449,500 | (4,809,043 | ) | |||||||||
| Income tax benefit | - | (47,000 | ) | - | (47,000 | ) | ||||||||||
| Net income (loss) | (4,667,523 | ) | (544,020 | ) | 449,500 | (4,762,043 | ) | |||||||||
| Net income attributable to non-controlling interest | - | (468,484 | ) | - | (468,484 | ) | ||||||||||
| Net income (loss) attributable to Company | (4,667,523 | ) | (75,536 | ) | 449,500 | (4,293,559 | ) | |||||||||
| Preferred distributions | (549,072 | ) | - | - | (549,072 | ) | ||||||||||
| Net income (loss) attributable to common | (5,216,595 | ) | (75,536 | ) | 449,500 | (4,842,631 | ) | |||||||||
| Comprehensive income (loss) attributable to non-controlling interest | ||||||||||||||||
| Foreign currency translation adjustment | - | (340,269 | ) | - | (340,269 | ) | ||||||||||
| Change in fair value of cash flow hedges | - | 863,408 | - | 863,408 | ||||||||||||
| Unrealized gain on securities | - | (11,116 | ) | - | (11,116 | ) | ||||||||||
| Comprehensive loss attributable to non-controlling interest | - | 43,539 | - | 43,539 | ||||||||||||
| Comprehensive loss attributable to common | (5,216,595 | ) | (75,536 | ) | 449,500 | (4,842,631 | ) | |||||||||
| Comprehensive loss attributable to the Company | (5,216,595 | ) | (31,997 | ) | 449,500 | (4,799,092 | ) | |||||||||
| 74 |
| 4. | Acquisitions |
On August 7, 2015, Enterprises provided $400,000 of bridge financing to Noble Conservation Solutions, Inc., a Minnesota corporation (“Noble”) while the parties completed the negotiation of definitive agreements regarding purchase of a controlling equity interest. Noble provides construction and consulting services to businesses and homeowners to improve energy efficiency. The bridge loan bore interest at a rate of 6% per annum and matured on September 1, 2015.
Effective September 1, 2015, Enterprises purchased 60% of the issued and outstanding shares of Noble for an aggregate purchase price of $875,002, paid in cash. In conjunction with the acquisition, Enterprises also committed to lend Noble up to $1,000,000 on a revolving basis including a refinance of the bridge loan. Amounts outstanding under the revolver may be repaid at any time without penalty and Noble may borrow available funds from Enterprises upon ten business days’ notice. The revolver bears interest at a rate of 7.00% per annum, payable quarterly, and matures on August 31, 2020. The revolver is secured by a second position lien on, and security interest in, Noble’s assets. Accrued interest as of December 31, 2015 was $23,396. Amounts owed under the facility are eliminated upon consolidation.
The Company recognized approximately $2,286,000 in revenue and $82,000 of net loss before interest, depreciation, and amortization expense from Noble since the date of acquisition.
| 75 |
Consideration for the acquisition consisted of the following:
| At September 1, 2015 | ||||
| Assets acquired | ||||
| Unrestricted cash | $ | 943,496 | ||
| Accounts receivable | 1,696,953 | |||
| Costs and estimated earnings in excess of billings on uncompleted contracts | 151,651 | |||
| Property, equipment, and furniture, net | 275,180 | |||
| Other assets | 19,980 | |||
| Total tangible assets | 3,087,260 | |||
| Identifiable intangibles | 895,000 | |||
| Goodwill | 1,148,117 | |||
| Total intangible assets | 2,043,117 | |||
| Total assets acquired | $ | 5,130,377 | ||
| Liabilities and non-controlling interest assumed | ||||
| Revolver | $ | 313,603 | ||
| Accounts payable | 1,455,612 | |||
| Accrued expenses | 1,638 | |||
| Billings in excess of costs and estimated earnings on uncompleted contracts… | 777,345 | |||
| Accrued compensation | 56,441 | |||
| Accrued interest | 2,078 | |||
| Note payable | 1,065,323 | |||
| Total liabilities | 3,672,040 | |||
| Non-controlling interest | 583,335 | |||
| Total liabilities and non-controlling interest assumed | 4,255,375 | |||
| Net assets acquired | $ | 875,002 | ||
The fair value of the intangible assets noted above were based on significant inputs that are not observable in the market and thus represent Level 3 measurements as defined in ASC 820.
The following unaudited pro forma information presents a summary of consolidated results of operations of the Company as if the acquisition had occurred on January 1, 2014, the beginning of the earliest period presented. The information is presented for informational purposes only and is not necessarily indicative of what the results of operations actually would have been had the acquisition been completed on such date. In addition, the unaudited pro forma condensed consolidated financial information does not attempt to project the future financial position or operating results of the Company after the acquisition.
| Years | ||||||||
| Ended December 31, | ||||||||
| 2015 | 2014 | |||||||
| Unaudited | Unaudited | |||||||
| Revenue | $ | 51,717,698 | $ | 52,851,760 | ||||
| Net income (loss) | $ | (5,589,654 | ) | $ | 3,872,940 | |||
| Net income (loss) attributable to Enterprises | $ | (569,959 | ) | $ | 56,254 | |||
| 76 |
On January 2, 2014, after receiving regulatory approval from FERC, the Company closed on the purchase of all of the outstanding equity interests of Town Square Energy East, LLC (“TSEE”), formerly known as Discount Energy Group, LLC. TSEE is licensed to provide electricity to retail customers in Maryland, New Jersey, Ohio, and Pennsylvania.
Consideration for the acquisition consisted of the following:
| At January 2, 2014 | ||||
| Assets acquired | ||||
| Deposits - PJM | $ | 191,069 | ||
| Deposits - utilities | 90,500 | |||
| Prepaid expenses | 12,300 | |||
| Total tangible assets | 293,869 | |||
| State licenses & utility relationships | 285,800 | |||
| Brand name | 107,000 | |||
| Web site | 101,000 | |||
| Active customer list | 56,100 | |||
| Inactive customer list | 2,025 | |||
| Domain names | 2,733 | |||
| Total intangible assets | 554,658 | |||
| Total assets acquired | $ | 848,527 | ||
| Liabilities assumed | ||||
| Accounts payable | $ | 168,510 | ||
| Total liabilities assumed | 168,510 | |||
| Net assets acquired | 680,017 | |||
The fair value of the intangible assets noted above were based on significant inputs that are not observable in the market and thus represent Level 3 measurements as defined in ASC 820.
| 5. | Accounting for Derivatives and Hedging Activities |
The following table lists the fair values of the Company’s derivative assets and liabilities as of December 31, 2015 and 2014:
| Fair Value | ||||||||
| Asset Derivatives | Liability Derivatives | |||||||
| At December 31, 2015 | ||||||||
| Not designated as hedging instruments: | ||||||||
| Energy commodity contracts | $ | 72,704 | $ | (260,358 | ) | |||
| Total derivative instruments | 72,704 | (260,358 | ) | |||||
| Cash deposits in collateral accounts | 8,234,985 | -- | ||||||
| Cash in trading accounts, net | $ | 8,307,689 | $ | (260,358 | ) | |||
| At December 31, 2014 | ||||||||
| Designated as cash flow hedges: | ||||||||
| Energy commodity contracts | $ | 15,732 | $ | (879,140 | ) | |||
| Not designated as hedging instruments: | ||||||||
| Energy commodity contracts | 2,350,662 | (2,556,862 | ) | |||||
| FTRs | 1,435,819 | - | ||||||
| Total derivative instruments | 3,802,213 | (3,436,002 | ) | |||||
| Cash deposits in collateral accounts | 20,733,441 | -- | ||||||
| Cash in trading accounts, net | $ | 24,535,654 | $ | (3,436,002 | ) | |||
| 77 |
As of December 31, 2015, there were no derivative instruments designated as cash flow hedges.
As of December 31, 2014, the Company had hedged the cost of 48,947 MWh (approximately 10.5% of expected 2015 electricity purchases for the customers receiving service from us as of that date) and $863,408 of the net gain on the effective portion of the hedge was deferred and included in AOCI. This entire amount was reclassified to cost of energy sold by December 31, 2015.
The following table summarizes the amount of gain or loss recognized in AOCI or earnings for derivatives designated as cash flow hedges for the periods indicated:
| Period and Item | Gain (Loss) Recognized in AOCI | Income Statement Classification | Gain (Loss) Reclassified from AOCI | |||||||
| Year Ended December 31, 2015 | ||||||||||
| Cash flow hedges | $ | (850,047 | ) | Cost of energy sold | $ | (1,713,455 | ) | |||
| Year Ended December 31, 2014 | ||||||||||
| Cash flow hedges | $ | (1,128,514 | ) | Cost of energy sold | $ | 91,508 | ||||
The following table provides details with respect to changes in AOCI as presented in our consolidated balance sheets, including those relating to our designated cash flow hedges, for the period from January 1, 2014 to December 31, 2015:
| Foreign Currency | Cash Flow Hedges | Available for Sale Securities | Total | |||||||||||||
| Balance - December 31, 2013 | $ | 338,008 | $ | 356,614 | $ | 5,767 | $ | 700,389 | ||||||||
| Other comprehensive income (loss) before reclassifications | 661,033 | (1,128,514 | ) | 11,116 | (456,365 | ) | ||||||||||
| Amounts reclassified from AOCI | - | (91,508 | ) | (5,767 | ) | (97,275 | ) | |||||||||
| Net current period other comprehensive income (loss) | 661,033 | (1,220,022 | ) | 5,349 | (553,640 | ) | ||||||||||
| Balance - December 31, 2014 | $ | 999,041 | $ | (863,408 | ) | $ | 11,116 | $ | 146,749 | |||||||
| Other comprehensive loss before reclassifications | (340,269 | ) | (850,047 | ) | (11,116 | ) | $ | (1,201,432 | ) | |||||||
| Amounts reclassified from AOCI | - | 1,713,455 | - | 1,713,455 | ||||||||||||
| Net current period other comprehensive income (loss) | (340,269 | ) | 863,408 | (11,116 | ) | 512,023 | ||||||||||
| Balance - December 31, 2015 | $ | 658,772 | $ | - | $ | - | $ | 658,772 | ||||||||
| 6. | Fair Value Measurements |
The Fair Value Measurement Topic of FASB’s ASC establishes a fair value hierarchy that prioritizes the inputs to valuation techniques used to measure fair value. The three types of valuation inputs in the fair market hierarchy are as follows:
| ● | “Level 1 inputs” are quoted prices in active markets for identical assets or liabilities. |
| ● | “Level 2 inputs” are inputs other than quoted prices that are observable either directly or indirectly for the asset or liability. |
| ● | “Level 3 inputs” are unobservable inputs for which little or no market data exists. |
| 78 |
Financial instruments categorized as Level 1 holdings are publicly traded in liquid markets with daily quotes and include exchange-traded derivatives such as futures contracts and options, certain highly-rated debt obligations, and some equity securities. Holdings such as shares in money market mutual funds that are based on net asset values as derived from quoted prices in active markets of the underlying securities are also classified as Level 1.
The fair values of financial instruments that are not publicly traded in liquid markets, but do have characteristics similar to observable market information such as wholesale commodity prices, interest rates, credit margins, maturities, collateral, and the like upon which valuations are based are categorized in Level 2.
Financial instruments that are not traded in publicly quoted markets or that are acquired based on prices and terms determined by direct negotiation with the issuer are classified as Level 3. Level 3 securities are carried at book value which management believes approximates fair value, until circumstances otherwise dictate while Level 3 derivatives are adjusted to fair value based on appropriate mark-to-model methodologies.
Generally, with respect to valuation of Level 3 instruments, significant changes in inputs will result in higher or lower fair value measurements, any particular calculation or valuation methodology may produce estimates that may not be indicative of net realizable value or reflective of future fair values, and such variations could be material.
From time to time, the Company may engage third parties such as appraisers, brokers, or investment bankers to assist management in its valuation and classification of financial instruments.
There have been no changes in the methodologies used since December 31, 2014.
The following table presents certain assets measured at fair value on a recurring basis as of the dates indicated:
| Level 1 | Level 2 | Level 3 | Total | |||||||||||||
| December 31, 2015 | ||||||||||||||||
| Cash in trading accounts, net | $ | 8,047,331 | $ | - | $ | - | $ | 8,047,331 | ||||||||
| Marketable securities | - | - | - | - | ||||||||||||
| Notes receivable, net of deferred gain | - | - | 3,382,611 | 3,382,611 | ||||||||||||
| Convertible notes | - | - | 502,110 | 502,110 | ||||||||||||
| December 31, 2014 | ||||||||||||||||
| Cash in trading accounts, net | $ | 21,099,652 | $ | - | $ | - | $ | 21,099,652 | ||||||||
| FTR positions, net | - | - | 1,435,819 | 1,435,819 | ||||||||||||
| Marketable securities | 311,586 | - | - | 311,586 | ||||||||||||
| Convertible notes | - | - | 1,604,879 | 1,604,879 | ||||||||||||
There were no transfers during the year ended December 31, 2015 between Levels 1 and 2.
| 79 |
Level 3 Assets
The following table reconciles beginning and ending Level 3 fair value financial instrument balances for the years ended December 31, 2015 and 2014:
| Fair Value Measurement Using Significant Unobservable Inputs (Level 3) | ||||
| Balance - December 31, 2013 | $ | 353,504 | ||
| Total gains and losses: | ||||
| Included in other comprehensive income | - | |||
| Included in earnings | 1,435,819 | |||
| Purchases | 1,604,879 | |||
| Transfers into Level 3 | - | |||
| Transfers out of Level 3 (1) | (353,504 | ) | ||
| Balance - December 31, 2014 | 3,040,698 | |||
| Total gains and losses: | ||||
| Included in other comprehensive income | - | |||
| Included in earnings | (2,685,819 | ) | ||
| Purchases | 3,529,842 | |||
| Transfers into Level 3 | - | |||
| Transfers out of Level 3 (1) | - | |||
| Balance - December 31, 2015 | $ | 3,884,721 | ||
| Gains for the period included in earnings attributable to the change in unrealized gains or losses relating to assets still held as of December 31, 2015 | $ | - | ||
| 1 | Reflects foreclosure on mortgage note and transfer of land received to “land held for development”; see “Note 18 - Real Estate”. |
Notes Receivable Valuation
The fair value of the notes receivable are based on expected future cash flows discounted at market interest rates, or current interest rates for similar instruments and are classified as Level 3 within the fair value hierarchy.
Convertible Notes Valuation Techniques and Sensitivity of Level 3 Fair Values
The following table describes the valuation techniques used to measure the fair value of the Company’s Level 3 assets at December 31, 2015.
| Level
3 Asset |
Fair
value at December 31, 2015 |
Valuation Techniques |
Unobservable Inputs |
Range
of Inputs | ||||
| Convertible notes | $ 502,110 | Enterprise
value allocation A discounted cash flow model was used to estimate enterprise and common equity value, the resulting common equity value was divided by all convertible notes principal and accrued interest outstanding resulting in a valuation factor of 28.657% which was applied to the accreted cost of the Company’s position of $1,752,110 for an impairment charge of $1,250,000 and a remaining fair value amount of $502,110 |
Future cash flows | various
| ||||
| Component costs of capital | 0.00% for debt; 26.21% for equity | |||||||
| Target capital structure | 20%
debt; 80% equity | |||||||
| Marginal tax rate | 40% | |||||||
| Wtd avg cost of capital | 21.46% |
| 80 |
As no public market exists for any of the securities of Ultra Green, including its Series C Notes, management considers its investment to be a Level 3 financial instrument to be carried at book value which management believes approximates fair value, until circumstances otherwise dictate.
Changes in the unobservable valuation inputs listed above would have a direct impact on the fair values of the above instruments. For example, changes in the estimated current price of the embedded option incorporated into the Series C Notes would increase or decrease the fair value of the investment, as would changes in required yields on non-convertible debt for comparable credits.
Each quarter, management performs a valuation of the underlying common equity and the security using generally accepted methods to value the obligations of private companies to determine if impairment to its carrying value exists.
As of December 31, 2015, the Company had an investment of $1,752,110 (principal $1,500,000 and accrued interest of $252,110) in the Series C Notes of Ultra Green and the valuation of the securities as of the same date indicated that their estimated fair value had fallen substantially from historical values approximating cost, consequently, the Company has recorded an impairment charge to earnings (other expense) of $1,250,000 and reduced the carrying value of its investment in the Series C Notes to their estimated fair value of $520,110.
| 7. | Income Taxes |
When Enterprises purchased Noble on September 1, 2015, Noble became a corporation. The entity’s effective income tax rate for 2015 is 39.5%.
The deferred tax asset consists of the following components as of December 31, 2015 and 2014:
| December 31, 2015 | December 31, 2014 | |||||||
| Net operating loss carryforward | $ | 47,000 | $ | - | ||||
| Valuation allowance | - | - | ||||||
| Deferred tax asset, net | $ | 47,000 | $ | - | ||||
Income taxes are accounted for under the asset and liability method. Deferred tax assets and liabilities are measured using enacted tax rates expected to apply to taxable income in the years in which those temporary differences are expected to be recovered or settled. Noble records a tax valuation allowance when it is more likely than not that it will not be able to recover the value of its deferred tax assets. There was no valuation allowance for deferred tax assets as of December 31, 2015.
Noble calculated its estimated annualized effective tax expense (benefit) rate at (39.5%) for the year ended December 31, 2015 and had an income tax benefit of $47,000 based on its $119,000 pre-tax loss from continuing operations for the year.
The Company recognizes the financial statement benefit of a tax position only after determining that the relevant tax authority would more likely than not sustain the position following an audit.
The Company files income tax returns in U.S. federal and state jurisdictions. 2012 through 2015 remaining open for examination by the IRS and state agencies.
At December 31, 2015, the Company had net operating loss carryforwards for federal tax purposes of approximately $119,000 available to offset future taxable income that begin to expire in the year 2035.
| 8. | Cash |
The Company deposits its unrestricted cash in financial institutions. Balances, at times, may exceed federally insured limits. Cash held in trading accounts may be unavailable at times for immediate withdrawal depending upon trading activity. Cash needed to meet credit requirements for outstanding trades, that available for immediate withdrawal, and deposited in collateral accounts as of December 31, 2015 and 2014 was as follows:
| December 31, 2015 | December 31, 2014 | |||||||
| Credit requirements | $ | 2,054,584 | $ | 6,113,160 | ||||
| Available for withdrawal | 5,992,747 | 14,986,492 | ||||||
| Cash in trading accounts | $ | 8,047,331 | $ | 21,099,652 | ||||
| Cash collateral | $ | 246,000 | $ | - | ||||
Restricted cash at December 31, 2015 and 2014 was $1,319,371 posted as security in connection with certain litigation in the Canadian courts. See “Note 25 - Commitments and Contingencies”.
| 9. | Accounts Receivable |
Accounts receivable – trade consists of receivables from both our wholesale trading and retail segments. Wholesale trading receivables represent net settlement amounts due from a market operator or an exchange while those from retail include amounts resulting from sales to end-use customers.
| December 31, 2015 | December 31, 2014 | |||||||
| Wholesale trading | $ | 276,018 | $ | 515,999 | ||||
| Retail energy services - billed | 2,278,315 | 1,158,019 | ||||||
| Retail energy services - unbilled | 1,280,000 | 720,228 | ||||||
| Diversified investments | 505,763 | - | ||||||
| Construction services, net of $2,500 allowance for doubtful accounts | 1,548,088 | - | ||||||
| Accounts receivable - trade | $ | 5,888,184 | $ | 2,394,246 | ||||
As of December 31, 2015, there was one account in the retail energy service segment with a balance greater than 10% of the total and representing 30% of all receivables.
As of December 31, 2014, there were two individual accounts with receivable balances greater than 10%; one in the wholesale segment, representing 21% of the balance at year end, and one in the retail energy services segment, representing 44% of the balance at year end. The Company believes that any risk associated with these concentrations would be minimal.
| 81 |
| 10. | Marketable Securities |
The following table shows the cost and estimated fair value of available-for-sale securities at December 31, 2015 and 2014:
| Cost | Gross Unrealized Gains | Gross Unrealized Losses | Fair Value | |||||||||||||
| At December 31, 2015 | ||||||||||||||||
| U.S. equities | $ | - | $ | - | $ | - | $ | - | ||||||||
| Money market fund | - | - | - | - | ||||||||||||
| Total | $ | - | $ | - | $ | - | $ | - | ||||||||
| At December 31, 2014 | ||||||||||||||||
| U.S. equities | $ | 299,836 | $ | 11,116 | $ | - | $ | 310,952 | ||||||||
| Money market fund | 634 | - | - | 634 | ||||||||||||
| Total | $ | 300,470 | $ | 11,116 | $ | - | $ | 311,586 | ||||||||
For the years ended December 31, 2015 and 2014, the Company had sales of securities and a realized loss of $129,743 and a realized gain of $65,655, respectively, and recognized no impairment charges.
| 11. | Inventories |
During the fourth quarter of 2015, Noble began purchasing light bulbs for distribution as well as for use on backlog jobs. As of December 31, 2015, $53,917 was in inventory, which is valued at the lower of cost or market.
| 12. | Costs and Estimated Earnings on Uncompleted Contracts |
The following is a summary of contracts in progress at December 31, 2015:
| December 31, 2015 | ||||
| Costs incurred on uncompleted contracts | $ | 450,584 | ||
| Estimated earnings | 208,306 | |||
| Total costs and estimated earnings on uncompleted contracts | 658,890 | |||
| Billings | (1,362,214 | ) | ||
| Costs and estimated earnings on uncompleted contracts, net of billings | $ | (703,324 | ) | |
| Costs and estimated earnings in excess of billings on uncompleted contracts | $ | 7,503 | ||
| Billings in excess of costs and estimated earnings on uncompleted contracts | (710,827 | ) | ||
| Costs and estimated earnings on uncompleted contracts, net of billings | $ | (703,324 | ) | |
As of December 31, 2015, Noble had uncompleted contracts with bid prices of $1,758,000 and estimated costs to complete of approximately $782,000.
| 82 |
| 13. | Notes Receivable |
On June 1, 2015, the Company sold of 100% of the outstanding equity interests of TCP to Angell pursuant to an Equity Interest Purchase Agreement (the “Purchase Agreement”) for a purchase price of $20,740,704, paid with $500,000 cash and a secured promissory note of $20,240,704 bearing interest at an annual rate of 6.00% and payable in 12 quarterly installments of $1,855,668 each (the “Original Angell Note”). The Company and Angell also entered into a Security and Guarantee Agreement and a Sublease for certain space and equipment at the Company’s Lakeville office. Apollo and Angell entered into a Software License for Apollo’s proprietary DataLive™ software and an Administrative Services Agreement. Effective, July 1, 2015, the Company assigned all of its rights and obligations under these agreements to Enterprises.
On September 2, 2015, Enterprises and Angell entered into a First Amendment to the Purchase Agreement (the “Amendment”), pursuant to which Enterprises agreed to cancel the Sublease, re-employ the associated personnel, and reduce the purchase price to $15,000,000. Concurrently, Angell also executed an Amended and Restated Secured Promissory Note in favor of Enterprises which replaced the Angell Note in a principal amount of $15,024,573 (the “Amended Angell Note”). The Amended Note bears interest at rate of 6% per annum, is payable in 16 quarterly installments beginning September 1, 2015 (with the first installment being $1,142,100 and the remaining 15 installments being $1,063,215), and matures on June 1, 2019. The Amended Note is secured by a first priority security interest in the assets of Angell and TCP and is guaranteed pursuant to the Security and Guarantee Agreement by Angell, TCP, and Michael Angell as an individual.
Effective November 5, 2015, Angell terminated the 24 month license for Apollo’s DataLive™ software and entered into a perpetual license for such in return for a lump sum payment plus ongoing royalties based on TCP’s marketing of the software. Enterprises recognized a gain of $1,600,000 which is included in other income.
Effective December 1, 2015, the Administrative Services Agreement was amended to reduce the management fees for December 2015 and January 2016 to $10,000 per month and provide that after January 2016, Enterprises would be compensated for special projects.
On December 31, 2015, the Purchase Agreement was amended to document a verbal agreement between the parties regarding a non-compete. The parties had agreed that in the event Angell terminated an employee of TCP, Enterprises could not hire that employee for 60 days. Pursuant to the amendment, if Enterprises requested waiver of the 60 day non-compete, Enterprises would have to pay Angell, with the amount depending upon the book of the trader. If a trader had a positive book, the payment would be 60 days of salary; if negative, it would equal cumulative losses to the date of termination with the total amount treated as a principal note reduction. From the closing date to December 31, 2015, eight TCP traders were terminated by Angell and hired by Enterprises for a total reduction of note principal of $439,437.
| 83 |
The following table summarizes the effect of the sale on the Company’s balance sheet at closing on June 1 and as amended effective September 1, 2015 and December 31, 2015:
| At closing June 1, 2015 | As amended September 1, 2015 | As amended December 31, 2015 | ||||||||||
| Purchase price | $ | 20,000,000 | $ | 15,000,000 | $ | 14,560,563 | ||||||
| Assumption of liabilities | 2,912,825 | 2,912,825 | 2,912,825 | |||||||||
| Total consideration | 22,912,825 | 17,912,825 | $ | 17,473,388 | ||||||||
| Cash in trading accounts | 5,740,704 | 5,740,704 | 5,740,704 | |||||||||
| Property, equipment, and furniture | 128,935 | 128,935 | 128,935 | |||||||||
| Total assets sold | 5,869,639 | 5,869,639 | 5,869,639 | |||||||||
| Total gain on sale | 17,043,186 | 12,043,186 | 11,603,749 | |||||||||
| Assets sold, net of liabilities assumed | $ | 2,956,814 | $ | 2,956,814 | $ | 2,956,814 | ||||||
| Purchase price | $ | 20,000,000 | $ | 15,000,000 | $ | 14,560,563 | ||||||
| Cash down payment | (500,000 | ) | (500,000 | ) | (500,000 | ) | ||||||
| Working capital true-up | - | 524,573 | 524,573 | |||||||||
| Note principal amount | 19,500,000 | 15,024,573 | 14,585,136 | |||||||||
| Deferred gain on sale | (16,543,186 | ) | (12,067,759 | ) | (11,628,322 | ) | ||||||
| Note receivable, net of deferred gain | $ | 2,956,814 | $ | 2,956,814 | $ | 2,956,814 | ||||||
ASC 450-30-25-1 and SEC SAB Topic 13.A state, in part, that gains should not be recognized prior to their realization, consequently, the Company has deferred the gain associated with the sale and recorded such on the consolidated balance sheet as an offset to the Amended Angell Note. The deferred gain will be recognized on a pro rata basis as payments are received.
Under the terms of the Amended Angell Note, in the event of default, Angell has 45 days to cure. If the default is uncured at the end of such period, the holder may declare all or any part of the note immediately due and payable or exercise any other rights and remedies under the Uniform Commercial Code. Interest on the note is accrued monthly and is added to the principal balance. As of December 31, 2015, interest of $92,775 was accrued.
On August 20, 2015, Cyclone Partners loaned $317,728 to Copper Creek Development II, LLC on an unsecured basis. The note bears interest at 5% per annum and principal and interest are due on the earlier of demand or July 31, 2017. As of December 31, 2015, $5,614 of interest was accrued.
Enterprises loaned Ultra Green $325,000 during 2015 under four different note agreements. The notes are secured by a first mortgage on Ultra Green’s production facility in Devil’s Lake, North Dakota and bear interest at 10% per annum. Interest only payments are due beginning September 1, 2015. The notes mature when the sale of the North Dakota facility is closed. In connection with the issuance of these notes, Ultra Green issued the Company four warrants to purchase 325,000,000 shares each of its common stock for $0.001 per share. The warrants expire at various dates in 2025. Total accrued interest as of December 31, 2015 was $5,191.
| 84 |
The following table shows notes receivable balances as of the dates indicated:
| December 31, 2015 | December 31, 2014 | |||||||
| Total | ||||||||
| Notes receivable | $ | 13,539,603 | $ | - | ||||
| Plus: interest receivable | 103,580 | - | ||||||
| Less: deferred gain on sale | (10,260,572 | ) | - | |||||
| Total notes receivable, net of deferred gain | $ | 3,382,611 | $ | - | ||||
| Current | ||||||||
| Angell note receivable | $ | 3,414,794 | $ | - | ||||
| Deferred gain on sale | (2,716,765 | ) | - | |||||
| Interest receivable | 97,966 | - | ||||||
| Current notes receivable, net of deferred gain | $ | 795,995 | $ | - | ||||
| Long term | ||||||||
| Angell note receivable | $ | 9,482,081 | $ | - | ||||
| Deferred gain on sale | (7,543,807 | ) | - | |||||
| Copper Creek note receivable | 317,728 | - | ||||||
| Ultra Green mortgage notes | 325,000 | - | ||||||
| Interest receivable | 5,614 | - | ||||||
| Long term notes receivable, net of deferred gain | $ | 2,586,616 | $ | - | ||||
Total interest received during 2015 was $518,165.
| 14. | Investment in Convertible Notes |
During 2014, the Company invested $1,500,000 in privately placed Series C Convertible Promissory Notes issued by Ultra Green (the “Series C Notes”)- The Series C Notes will mature on December 31, 2019 and bear interest at a fixed rate of 10% per annum, Interest will accrue until June 30, 2016, at which time all accrued and unpaid interest will become due and payable. Thereafter, interest will be due and payable on a quarterly basis. Each dollar of Series C Note principal and accrued but unpaid interest is ultimately convertible into 100 shares of Ultra Green’s common stock.
During the Company’s valuation of the Series C Notes it was determined that there should be an Other Than Temporary Impairment (“OTTI”) recorded. Based on the valuation performed, an impairment was recorded to other expense of $1,250,000; which reduced the fair value to $502,110. This fair value includes capitalized interest.
Total capitalized interest on the Series C Notes as of December 31, 2014 was $104,879. See also “Note 6 - Fair Value Measurements”.
In addition, the Company lent the services of Mr. Keith Sperbeck, its Vice President - Operations, to Ultra Green as its Interim CEO for an indefinite period concluding when Ultra Green hires a full-time chief executive officer. In lieu of any cash compensation to either Mr. Sperbeck or the Company, on June 19, 2014, Ultra Green issued the Company a non-statutory option to purchase 50,000,000 shares of its common stock for $0.01 per share, which option was fully vested and exercisable immediately upon issuance.
| 85 |
| 15. | Property, Equipment, and Furniture |
Property, equipment, software, furniture, and leasehold improvements consisted of the following at December 31:
| 2015 | 2014 | |||||||
| Equipment and software | $ | 1,049,030 | $ | 857,952 | ||||
| Furniture | 394,072 | 304,791 | ||||||
| Vehicles | 256,542 | - | ||||||
| Land | 150,000 | 150,000 | ||||||
| Building | 137,958 | 137,958 | ||||||
| Leasehold improvements | 331,806 | 197,102 | ||||||
| Property, equipment and furniture, gross | 2,319,408 | 1,647,803 | ||||||
| Less accumulated depreciation | (971,097 | ) | (885,274 | ) | ||||
| Property, equipment, and furniture, net | $ | 1,348,311 | $ | 762,529 | ||||
With the acquisition of Noble, the Company acquired property, equipment, and furniture with a value of $275,180.
Depreciation expense was $156,404 and $169,727 for the years ended December 31, 2015 and 2014, respectively.
| 16. | Intangible Assets |
On June 29, 2012, TCP acquired certain assets and the business of Community Power & Utility LLC (“CP&U”), a retail energy supplier serving residential and small commercial markets in Connecticut, for $160,000. The business has been re-named “Town Square Energy” and is now a wholly-owned second-tier subsidiary of the Company. Of the purchase price, $85,000 was allocated to the acquisition of an existing service contract with an industry-specific provider of transaction management, billing, and customer information software and services, and $75,000 was allocated to customer relationships.
The fair value of these intangible assets was based on significant inputs that are not observable in the market and thus represent a Level 3 measurement as defined in ASC 820. The fair value of the service contract was based on the replacement price and will be amortized over twenty-three months, its useful life, using the straight-line method. Customer relationships were valued using a variation of the income approach. Under this approach, the present value of expected future cash flows resulting from the relationships is used to determine the fair value which will be amortized over three years using the straight-line method.
Effective January 1, 2013, in connection with the sale of his units to Timothy S. Krieger, the Company’s founder, Chairman, Chief Executive Officer, and controlling member, the Company entered into a non-competition agreement with David B. Johnson, a current director of the Company valued at $500,000, to be amortized and paid in equal installments over 24 months.
On January 2, 2014, the Company acquired 100% of the outstanding membership interests of TSEE, formerly known as DEG, for a total purchase price of $848,527, consisting of $680,017 in cash and $168,510 in assumption of accounts payable. Of this total consideration, $293,869 was allocated to tangible assets including deposits with PJM and certain utilities and prepaid expenses and $554,658 was allocated to intangible assets. Intangible assets acquired included state licenses and utility relationships, the DEG brand name, a fully functional website, active and inactive customer lists, and domain names. The intangible assets will be amortized over 24 months using the straight line method.
| 86 |
In connection with the purchase of Noble, $895,000 of the purchase price was allocated to intangible assets including a trade name, non-compete agreements, customer lists, and backlog. These intangible assets will be amortized on a straight line basis over their estimated useful lives of one to eleven years.
| December 31, 2015 | December 31, 2014 | |||||||
| TSE intangibles | $ | 160,000 | $ | 160,000 | ||||
| Non-compete agreement | 500,000 | 500,000 | ||||||
| TSEE intangibles | 554,658 | 554,658 | ||||||
| Noble intangibles (note 4) | 895,000 | - | ||||||
| Intangible assets, gross | 2,109,658 | 1,214,658 | ||||||
| Less accumulated amortization | (1,256,989 | ) | (945,509 | ) | ||||
| Intangible assets, net | $ | 852,669 | $ | 269,149 | ||||
Future amortization is as follows:
| Year Ended December 31, | ||||
| 2016 | $ | 120,659 | ||
| 2017 | 107,992 | |||
| 2018 | 107,992 | |||
| 2019 | 107,992 | |||
| 2020 and thereafter | 408,034 | |||
| Total | $ | 852,669 | ||
Total amortization of intangible assets for the years ended December 31, 2015 and 2014 was $311,480 and $591,487, respectively and is included in other general and administrative expenses.
| 17. | Deferred Financing Costs |
Prior to the May 10, 2012 effective date of its Notes Offering, the Company incurred certain professional fees and filing costs associated with the offering totaling $393,990. The Company has capitalized these costs and amortizes them on a monthly basis over the weighted average term of the Notes sold, exclusive of any expected renewals.
| December 31, 2015 | December 31, 2014 | |||||||
| 2012 registration statement | $ | 393,990 | $ | 393,990 | ||||
| 2015 registration statement | 300,792 | - | ||||||
| REH revolver | 35,000 | 35,000 | ||||||
| Deferred financing costs, gross | 729,782 | 428,990 | ||||||
| Less accumulated amortization | (415,757 | ) | (187,246 | ) | ||||
| Deferred financing costs, net | $ | 314,025 | $ | 241,744 | ||||
Total amortization of deferred financing costs for the year ended December 31, 2015 and 2014 was $228,511 and $130,815, respectively and is included in other general and administrative expenses.
| 18. | Real Estate |
As of December 30, 2015 and 2014 land held for development consisted of $2,714,297 and $953,462, respectively.
On January 26, 2015, Cyclone closed on the purchase of a single family home located in New Prague, Minnesota for a price of $195,080 and additional holding costs of $2,301, paid in cash. On April 13, 2015, the property was sold to Mr. Krieger, a related party, for a price of $197,382.
Krieger Construction, LLC is owned by an immediate family member of Enterprises and provides general contracting services for our real estate development projects in Cyclone Partners, LLC. A member of Krieger Construction received a salary of $120,000 and expense reimbursements related to land in development of $22,200 during 2015.
| 87 |
| 19. | Goodwill |
Goodwill represents the excess of the purchase price of Noble over the fair value of the net identifiable assets acquired. See “Note 4 - Acquisitions” for a calculation of the goodwill related to the Noble acquisition. Goodwill is reviewed for impairment annually or more frequently if impairment indicators arise.
The Company’s estimates of fair value are based on the asset approach. This approach uses the books of Noble to identify the fair value of the assets and liabilities to determine a net value of the company. Our impairment assessment begins with a qualitative assessment to determine whether it is more likely than not that the fair value of a reporting unit is less than its carrying value. The qualitative assessment includes restating assets and liabilities on the balances sheet to fair market value where necessary and identifying unrecorded assets and liabilities and what their impact will be on the balance sheet.
If it is determined under the qualitative assessment that it is more likely than not that the fair value of a reporting unit is less than its carrying value, then a two-step quantitative impairment test is performed. Under the first step, the estimated fair value of the reporting unit is compared with its carrying value (including goodwill). If the fair value of the reporting unit exceeds its carrying value, step two does not need to be performed. If the estimated fair value of the reporting unit is less than its carrying value, an indication of goodwill impairment exists for the reporting unit and the Company must perform step two of the impairment test (measurement). Under step two, an impairment loss is recognized for any excess of the carrying amount of the reporting unit’s goodwill over the implied fair value of that goodwill.
Fair value of the reporting unit under the two-step assessment is determined using a discounted cash flow analysis. The use of present value techniques requires us to make estimates and judgments about our future cash flows. These cash flow forecasts will be based on assumptions that are consistent with the plans and estimates we use to manage our business. The process of evaluating the potential impairment of goodwill is highly subjective and requires significant judgment at many points during the analysis. Application of alternative assumptions and definitions could yield significantly different results.
In connection with the qualitative review as of December 31, 2015, we do not believe the carrying value exceeds the fair value. The Company’s goodwill balance as of December 31, 2015 was $1,148,117.
| 88 |
| 20. | Debt |
Notes payable by the Company are summarized as follows:
| December 31, 2015 | December 31, 2014 | |||||||
| Aspirity | ||||||||
| Term Debt | ||||||||
| Renewable unsecured subordinated notes | 24,484,498 | 17,653,128 | ||||||
| Term Loan due from Enterprises | (20,248,186 | ) | - | |||||
| Subtotal | 4,236,312 | 17,653,128 | ||||||
| Total | $ | 4,236,312 | $ | 17,653,128 | ||||
| Enterprises | ||||||||
| Demand and Revolving Debt | ||||||||
| Revolving note payable to Citizens | 475,700 | - | ||||||
| Revolving note payable to Maple Bank | 1,212,705 | 1,105,259 | ||||||
| Subtotal | 1,688,405 | 1,105,259 | ||||||
| Term Debt | ||||||||
| Auto note payable to Ally Financial | 20,097 | - | ||||||
| Auto note payable to Ford Credit | 24,798 | - | ||||||
| Mortgage note payable to Security State Bank | 217,450 | 224,568 | ||||||
| Mortgage note payable to Lakeview Bank | 119,976 | 119,976 | ||||||
| Construction note payable to American Land & Capital | 1,074,673 | 184,975 | ||||||
| Term Loan payable to Aspirity Financial | 20,248,186 | - | ||||||
| Subtotal | 21,705,180 | 529,519 | ||||||
| Total | $ | 23,393,585 | $ | 1,634,778 | ||||
| Consolidated total | $ | 27,629,897 | $ | 19,287,906 | ||||
| 89 |
Notes payable by maturity are summarized as follows:
| December 31, 2015 | December 31, 2014 | ||||||||
| Aspirity | |||||||||
| Term Debt | |||||||||
| 2015 | - | 7,234,559 | |||||||
| 2016 | 10,120,175 | - | |||||||
| Current maturities | 10,120,175 | 7,234,559 | |||||||
| 2016 | - | 2,640,682 | |||||||
| 2017 | 4,383,980 | 2,861,547 | |||||||
| 2018 | 4,064,364 | 2,634,750 | |||||||
| 2019 | 3,993,573 | 1,204,600 | |||||||
| 2020 | 37,299 | 9,052 | |||||||
| 2021 & thereafter | 1,885,105 | 1,067,938 | |||||||
| Long term debt | 14,364,323 | 10,418,569 | |||||||
| Total | $ | 24,484,498 | $ | 17,653,128 | |||||
| Enterprises | |||||||||
| Demand and Revolving Debt | |||||||||
| Demand | $ | - | $ | - | |||||
| 2016 | 1,688,405 | 1,105,259 | |||||||
| Subtotal | 1,688,405 | 1,105,259 | |||||||
| Term Debt | |||||||||
| 2015 | - | 312,068 | |||||||
| 2016 | 1,214,762 | - | |||||||
| Current maturities | 1,214,762 | - | |||||||
| 2016 | - | 7,468 | |||||||
| 2017 | 21,248 | 7,836 | |||||||
| 2018 | 22,973 | 8,222 | |||||||
| 2019 | 12,712 | 8,627 | |||||||
| 2020 | 9,052 | 185,298 | |||||||
| 2021 & thereafter | 176,245 | - | |||||||
| Long term debt | 242,232 | 217,451 | |||||||
| Subtotal | 1,456,994 | 529,519 | |||||||
| Total | $ | 3,145,399 | $ | 1,634,778 | |||||
| Consolidated total | $ | 27,629,897 | $ | 19,287,906 | |||||
Aspirity
RBC Line of Credit
On May 12, 2014, the Company drew $700,000 under an evergreen, uncommitted line of credit from Royal Bank of Canada (the “RBC Line” and “RBC”, respectively). Advances under the RBC Line bear interest at a variable annual interest rate of 1 month LIBOR plus 2.25% set at the time of advance for a 30 day term, mature at various dates, and are collateralized by assets held in the Company’s marketable securities account. RBC is not obligated to make any extensions of credit to the Company and availability of funds may be increased or decreased by RBC in its sole and absolute discretion. Prepayment of any outstanding principal under the RBC Line may subject the Company to LIBOR break funding costs.
As of December 31, 2015 and 2014, there were no borrowings outstanding under the RBC Line and the Company was in compliance with all terms and conditions.
| 90 |
Renewable Unsecured Subordinated Notes
On May 10, 2012, our first Form S-1 registration statement relating to the offer and sale of our Notes was declared effective by the SEC, and the offering commenced on May 15, 2012. This Old S-1 covered up to $50,000,000 in principal amount of 3 and 6 month and 1, 2, 3, 4, 5, and 10 year notes. On May 8, 2015, we filed a new registration statement with respect to the Notes to continue our Notes Offering under the Old S-1 until the effective date of the New S-1. The new registration replaces the original statement and covers up to $75,000,000 in principal amount of 3 and 6 month and 1, 2, 3, 4, 5, and 10 year notes. The New S-1 was declared effective by the SEC on November 12, 2015.
The Company made interest payments during the years ended December 31, 2015 and 2014 of $2,572,826 and $1,304,701, respectively. Total accrued interest on the Subordinated Notes at December 31, 2015 and 2014 was $1,483,020 and $849,913, respectively.
As of December 31, 2015, the Company had $24,484,498 of Subordinated Notes outstanding as follows:
| Initial Term | Principal Amount | Weighted Average Interest Rate | ||||||
| 3 months | $ | 616,558 | 11.22 | % | ||||
| 6 months | 114,317 | 8.62 | % | |||||
| 1 year | 6,887,269 | 13.83 | % | |||||
| 2 years | 3,517,156 | 13.86 | % | |||||
| 3 years | 4,245,830 | 15.05 | % | |||||
| 4 years | 3,606,359 | 16.21 | % | |||||
| 5 years | 3,636,905 | 15.97 | % | |||||
| 10 years | 1,860,105 | 15.11 | % | |||||
| Total | $ | 24,484,498 | 14.72 | % | ||||
| Weighted average term | 38.3 mos | |||||||
Enterprises
Aspirity Financial Term Loan
Effective July 1, 2015, Enterprises borrowed an aggregate principal amount of $22,206,113 with a weighted average interest rate of 14.08% and a maturity date of December 30, 2019 from Aspirity Financial. Although the provision was later removed, Enterprises also agreed to reimburse the Company for certain costs incurred as a publicly reporting entity (the “Expected Expenses”). Although eliminated as long as Enterprises and the Company are consolidated, the loan agreement between the parties is constructed on an arm’s length basis, contains customary protective provisions for the lender, including certain guarantees, collateral, and covenants, and ensures that the cash flows generated by the Legacy Businesses continue to be used to pay the interest and principal on the Notes outstanding. On November 1, 2015, the Term Loan was amended with respect to the definition of “actual redemptions” and to provide the lender with monthly financial statements and on January 27, 2016, it was further amended to eliminated the reimbursement of Expected Expenses.
For the period the Term Loan was in effect, Enterprises paid the Company total interest of $1,446,000, principal of $1,985,000, and Expected Expenses of $450,000. These are eliminated in consolidation.
| 91 |
ABN-AMRO Agreements
In February 2012, CEF executed a Futures Risk-Based Margin Finance Agreement (“Margin Agreement”) with ABN AMRO. The Margin Agreement provides CEF with an uncommitted $25,000,000 revolving line of credit on which it pays a commitment fee of $35,000 per month. Any loans outstanding are payable on demand and bear interest at an annual rate equal to 1.00% in excess of the Federal Funds Target Rate, or approximately 1.25%. The Margin Line is secured by all balances in CEF’s trading accounts with ABN AMRO. Under the Margin Agreement, CEF is also subject to certain reporting, affirmative, and negative covenants, including certain financial tests. The Margin Agreement was amended on May 31, 2013 to reduce the uncommitted credit line to $15,000,000, the commitment fee to $25,000 per month, and the covenant with respect to net liquidating equity as defined to $1,500,000.
On December 21, 2015, ABN AMRO notified CEF that they were terminating the Margin Agreement and the related trading accounts, effective January 12, 2016 and February 12, 2016, respectively. See “Note 27 - Subsequent Events”.
As of December 31, 2015 and 2014, there were no borrowings outstanding under the Margin Agreement and CEF was in compliance with all covenants.
Maple Bank Revolver
On October 14, 2014, REH, TSE, and DEG entered into a Credit Agreement with the Toronto, Ontario branch of Maple Bank GmbH (the “Maple Agreement” and “Maple Bank”), expiring October 31, 2016. The Maple Agreement provides the Company’s retail energy services businesses with a revolving line of credit of up to $5,000,000 in committed amount secured by a first position security interest in all of the assets, a pledge of the equity of such companies by TCPH, and certain guarantees. Availability of loans is keyed to advance rates against certain eligible receivables as defined. Any loans outstanding bear interest at an annual rate equal to 3 month LIBOR, subject to a floor of 0.50%, plus a margin of 6.00%. In addition, the Company is obligated to pay an annual fee of 1.00% of the committed amount on a monthly basis and a monthly non-use fee of 1.00% of the difference between the committed amount and the average daily principal balance of any outstanding loans. The Company is also subject to certain reporting, affirmative, and negative covenants. On August 4, 2015 the Maple Revolver was amended to increase the committed amount to $7,500,000.
As of December 31, 2015 and 2014, there was $1,212,705 and $1,105,259, respectively outstanding under the Maple Agreement and the Company was in compliance with all covenants.
See “Note 27 - Subsequent Events”.
Citizens Independent Bank
On July 24, 2014, Noble entered into a line of credit agreement with Citizens Independent Bank (“CIB”), expiring August 1, 2015. The agreement provides Noble with a line of credit of up to $500,000 in committed amount secured by property and assets as well as guarantees. Availability of loans is keyed to advance rates against certain eligible receivables as defined. Any loans outstanding bear interest at 1%, with a floor of 5% above the base rate established by CIB. Noble is also subject to certain reporting, affirmative, negative covenants, and must pay down the line to $250,000 for a thirty consecutive day period.
| 92 |
As of December 31, 2015, there was $475,700 outstanding under the agreement and Noble was in negotiations with respect to the terms of the line.
On January 22, 2016, Noble entered into a new loan agreement maturity date of September 22, 2016. The agreement provides Noble with a line of credit of up to $1,500,000 secured by property and assets as well as guarantees. Advances on the note are calculated by certain eligible receivables and inventory as defined and bear interest at 1%, with a floor of 5%, above the base rate as established by CIB. Noble is also subject to certain reporting, affirmative, and negative covenants.
US Bank Cash Flow Manager
On October 21, 2013, Noble, entered into a line of credit agreement with US Bank Cash Flow Manager, with all advances maturing on February 19, 2020. The agreement provides Noble with a line of credit of up to $250,000 in committed amount secured by personal guarantees of the owners of Noble. Any loans outstanding bear interest at an annual rate equal to prime plus 4.5%. As of December 31, 2015, there were no borrowings under the agreement.
Ford Credit
On June 13, 2014, Noble entered into a loan agreement with Ford Credit for the purchase of a vehicle. The note calls for monthly payments of $664, bears interest at 6.74% and is secured by the vehicle. As of December 31, 2015, the balance remaining on the note was $24,798.
Ally Financial
On December 26, 2012, Noble entered in a loan agreement with Ally Financial for the purchase of a vehicle. The note calls for seventy-two monthly payments of $587.65, bears interest at 4.99%, and is secured by the vehicle. As of December 31, 2015, the balance remaining on the note was $20,097.
Security State Mortgage
On June 16, 2014, the Company purchased a single family home in Garrison, Minnesota for use as a corporate retreat (the “Garrison Property”) for a purchase price of $285,000, paid with $57,000 of cash and the proceeds of a $228,000 note (the “Security State Mortgage”) advanced by the Security State Bank of Aitkin (“Security State Bank”) and secured by a first mortgage. The loan is payable in 239 equal installments of $1,482 due on the 16th of each month beginning on July 16, 2014 and one irregular installment of $1,482 due on June 16, 2034 (the “maturity date”). The note bears interest at an annual rate equal to the prime rate as published from time to time by The Wall Street Journal plus 0.75%, subject to a floor of 4.75%. Whenever increases occur in the interest rate, Security State, at its option and with notice to the Company, may: (a) increase the Company’s payments to insure the loan will be paid off by the maturity date; (b) increase the Company’s payments to cover accruing interest; (c) increase the number of the Company’s payments; or (d) continue the payments at the same amount and increase the Company’s final payment. The loan may be prepaid in whole or in part at any time without penalty.
As of December 31, 2015 and 2014, there was $217,450 and $219,262, respectively, outstanding under the Security State Mortgage and the Company was in compliance with all terms and conditions of the loan.
Lakeview Bank Mortgage
On December 23, 2014, via an assignment and assumption agreement between Cyclone and Kenyon Holdings, LLC (“Kenyon”), a related party, Cyclone took ownership of a 10 acre parcel of undeveloped land located at 170xx Texas Avenue, Credit River Township, Minnesota and assumed a note secured by a mortgage on the property and owed to Lakeview Bank (the “Lakeview Bank Mortgage”). Kenyon is owned by Mr. Krieger and Keith W. Sperbeck, Enterprises’ Vice President of Operations. The Lakeview Bank Mortgage bears interest at the highest prime rate reported as such from time to time by The Wall Street Journal. Interest only is payable monthly on the 25th and the note matures on April 30, 2016. The loan may be prepaid in whole or in part at any time without penalty.
| 93 |
As of December 31, 2015 and 2014, there was $119,976 outstanding under the Lakeview Bank Mortgage and the Company was in compliance with all terms and conditions of the loan.
American Land and Capital Construction Loans
On November 21, 2014, American Land and Capital, LLC (“American Land”) and Cyclone entered into four construction loan agreements, each for a committed amount of $205,000 or $820,000 in total (the “Fox Meadows Construction Loans”). Each commitment is secured by a mortgage on a lot (numbers 1, 2, 3, and 4) in Block 1 of Fox Meadows 3rd Addition and is personally guaranteed by Mr. Krieger. Fox Meadows is a townhouse development located in Lakeville, Minnesota in which Cyclone owns 35 attached residential building sites. Proceeds of the Construction Loans will be used to construct the first four spec/model homes on Cyclone’s Fox Meadows property. Draws on the Construction Loans bear interest at the higher of: (a) 6.50% or (b) the prime rate as reported from time to time by The Wall Street Journal plus 3.00%. Interest only is payable monthly on the 10th, the notes mature on May 21, 2016, and will renew for an additional three months if not paid by then. The loans may be prepaid in whole or in part at any time without penalty.
On February 24, 2015, American Land and Cyclone entered into a construction loan agreement for a committed amount of $485,000 (the “Bitterbush Pass Construction Loan”). The Bitterbush Pass Construction Loan is secured by a mortgage on Lot 2, Block 1, Territory 1st Addition, also referred to as “21580 Bitterbush Pass”. The loan is also personally guaranteed by Mr. Krieger. Proceeds will be used to construct a home on the property and draws bear interest at the higher of: (a) 6.50% or (b) the prime rate as reported from time to time by The Wall Street Journal plus 3.00%. Interest only is payable monthly on the 10th and the note matures on May 24, 2016. The loan may be prepaid in whole or in part at any time without penalty.
As of December 31, 2015 and 2014, there was $1,074,672 and $184,975, respectively outstanding under the American Land Construction Loans and the Company was in compliance with all terms and conditions of the agreements.
| 21. | Leases |
The Company leases vehicles and office equipment under several agreements that expire between 2015 and 2020 as well as its office space, key terms of the leases for which are summarized below.
| Location | Expiration Date | Square Footage | Monthly Rent | |||||||
| Aspirity | ||||||||||
| Minneapolis, Minnesota | 5/31/2019 | 8,003 | $ | 10,671 | ||||||
| Enterprises | ||||||||||
| Cherry Hill, New Jersey | 12/31/2016 | 175 | $ | 400 | ||||||
| Newtown, Pennsylvania | 12/31/2017 | 1,711 | 2,250 | |||||||
| Plymouth, Minnesota | 1/31/2018 | 6,091 | 3,943 | |||||||
| Lakeville, Minnesota (1) | 12/31/2019 | 8,543 | 8,591 | |||||||
| Lakeville, Minnesota | 5/31/2020 | 2,231 | 2,975 | |||||||
| Chandler, Arizona (1) | 6/30/2020 | 6,033 | 4,982 | |||||||
| Subtotal | 24,784 | 23,141 | ||||||||
| Total | 32,787 | $ | 33,812 | |||||||
| 1 | See Note 24 - Related Party Transactions. |
| 94 |
For the years ended December 31, 2015 and 2014, total lease expense was $493,880 ($425,316 for Enterprises and $68,564 for Aspirity) and $443,193, respectively.
Future minimum lease payments under the Company’s lease agreements are as follows:
| Years Ended December 31, | Aspirity | Enterprises | Total | ||||||||||
| 2016 | $ | 128,000 | $ | 308,000 | $ | 436,000 | |||||||
| 2017 | 53,000 | 300,000 | 353,000 | ||||||||||
| 2018 | - | 223,000 | 223,000 | ||||||||||
| 2019 | - | 220,000 | 220,000 | ||||||||||
| 2020 | - | 15,000 | 15,000 | ||||||||||
| Total | $ | 181,000 | $ | 1,066,000 | $ | 1,247,000 | |||||||
| 22. | Defined Contribution 401(k) Savings Plans |
Aspirity
All eligible employees may participate in the Company’s Safe Harbor and Roth 401(k) Plans. Investments in the Safe Harbor 401(k) are 100% tax deductible and grow on a tax-deferred basis. The Company may match 100% of salary deferrals up to 3% of compensation, plus 50% of salary deferrals in excess of 3% of compensation, up to 5%. Investments in the Roth 401(k) plan are after-tax contributions and the Company does not match salary deferrals up to the contribution limits for a particular year. During 2015, the Company made no contributions to the Safe Harbor 401(k).
Enterprises
Substantially all employees are eligible to participate in the Company’s 401(k) Savings Plan (the “Savings Plan”). Employees may make pre-tax voluntary contributions to their individual accounts up to a maximum of 50% of their aggregate compensation, but not more than currently allowable Internal Revenue Service limitations. Employee participants in the Savings Plan may allocate their account balances among 14 different funds available through a third party custodian. The Savings Plan does not require the Company to match employee contributions, but does permit the Company to make discretionary contributions. No discretionary contributions have been made.
| 95 |
| 23. | Ownership |
Effective on November 1, 2015, upon the distribution of the equity interests of Enterprises and the adoption of its new Operating Agreement, the Company agreed to issue 6,064 new Class B common units, automatically convertible into Class A units, effective upon FERC approval of the change of control of the Company. Such approval was granted on March 18, 2016. See “Note 27 - Subsequent Events”.
Effective on November 1, 2015, upon the distribution of the equity interest of Enterprises and the adoption of its new Operating Agreement, the Company agreed to issue 6,064 new Class B common units. Upon FERC approval, the Class B common units are automatically converted into Class A units. Such approval was granted on March 30, 2016. See “Note 27 - Subsequent Events”.
The ownership of the Company’s equity as of December 31, 2015 and 2014; as well as March 30, 2016 is as presented below:
| Holder | Series
A Preferred Units | Percent of Class | Class
A Common Units | Percent of Voting Rights | ||||||||||||
| At March 31, 2016 (unaudited) | ||||||||||||||||
| Timothy S. Krieger | 496 | 100.00 | % | 4,935 | 44.80 | % | ||||||||||
| Summer Enterprises, LLC | - | 0.00 | % | 25 | 0.20 | % | ||||||||||
| Subtotal | 496 | 100.00 | % | 4,960 | 45.00 | % | ||||||||||
| Mark A. Cohn | - | 0.00 | % | 1,654 | 15.00 | % | ||||||||||
| Wiley H. Sharp III | - | 0.00 | % | 1,654 | 15.00 | % | ||||||||||
| Keith W. Sperbeck | - | 0.00 | % | 1,103 | 10.00 | % | ||||||||||
| Brandon J. Day | - | 0.00 | % | 551 | 5.00 | % | ||||||||||
| Scott C. Lutz (1) | - | 0.00 | % | 551 | 5.00 | % | ||||||||||
| Jeremy E. Schupp (1) | - | 0.00 | % | 551 | 5.00 | % | ||||||||||
| Subtotal | - | 0.00 | % | 6,064 | 55.00 | % | ||||||||||
| Total | 496 | 100.00 | % | 11,024 | 100.00 | % | ||||||||||
| At December 31, 2015 | ||||||||||||||||
| Timothy S. Krieger | 496 | 100.00 | % | 4,935 | 99.50 | % | ||||||||||
| Summer Enterprises, LLC | - | 0.00 | % | 25 | 0.50 | % | ||||||||||
| Total | 496 | 100.00 | % | 4,960 | 100.00 | % | ||||||||||
| At December 31, 2014 | ||||||||||||||||
| Timothy S. Krieger | 496 | 100.00 | % | 4,935 | 99.50 | % | ||||||||||
| Summer Enterprises, LLC | - | 0.00 | % | 25 | 0.50 | % | ||||||||||
| Total | 496 | 100.00 | % | 4,960 | 100.00 | % | ||||||||||
| 1 | The units held by Mr. Lutz and Mr. Schupp are subject to forfeiture should they leave the employment of the Company and upon payment by the Company of $1.00 per unit as follows: after April 1, 2016 but before March 31, 2017, 367 units and after April 1, 2017 but before March 31, 2018, 183 units. |
For the years ending December 31, 2015 and 2014, total preferred distributions paid to the owner of the units were $549,072 and $549,072, respectively.
For the years ending December 31, 2015 and 2014, total common distributions paid to the owners of the units were $5,950,000 and $4,726,730, respectively.
| 24. | Related Party Transactions |
Note that as indicated, the Company’s obligations as described below were all assumed by Enterprises, effective July 1, 2015.
On January 1, 2013, Enterprises and Kenyon entered into a five year lease expiring December 31, 2017 for 11,910 square feet at a monthly rent of $12,264. On September 25, 2014, the lease was amended to reduce the square footage to 10,730 and monthly rent to $11,113. The lease was amended again on May 19, 2015, effective June 1, 2015, to reduce the square footage to 8,543 square feet and increase the monthly rent to $8,598. For rent, real estate taxes, and operating expenses, Enterprises paid Kenyon $205,409 and $235,000 for the years ended December 31, 2015 and 2014, respectively. As of December 31, 2015, Enterprises owed Kenyon $20,000.
Tim Krieger, owner and Chief Executive Officer of Enterprises is owed $47,000 at December 31, 2015 as a reimbursement for real estate development expenses.
| 96 |
Effective January 1, 2013, in connection with the purchase of David B. Johnson’s units by Mr. Krieger, the Company entered into a non-competition agreement with Mr. Johnson, a current director and former member of the Company, pursuant to which the Company is obligated to pay Mr. Johnson $500,000 in 24 equal monthly installments of $20,833 each. The total amount paid pursuant to the agreement during the year ended December 31, 2014 $250,000. There were no payments during 2015 as the non-compete agreement was paid in full on December 31, 2014.
On March 5, 2013, CEF entered into a 36 month lease for 1,800 square feet of office space in Tulsa, Oklahoma with the Brandon J. and Heather N. Day Revocable Trust at a monthly rent of $3,750. Mr. Day is an employee of CEF, a second-tier subsidiary of Enterprises. Total rent paid for the year ended December 31, 2015 and 2014 was $45,000. The lease was terminated on December 31, 2015.
On March 20, 2014, in connection with the Company’s initial investment of $1.0 million in Ultra Green’s convertible notes, Ultra Green paid a 10% commission to Cedar Point Capital, LLC, a registered broker dealer (“Cedar Point”). Mr. Johnson, a director of the Company, is the sole owner of Cedar Point. No commissions were paid on the Company’s follow-on investments.
On June 17, 2014, the building in which Enterprises leases its Chandler, Arizona office space was purchased by Fulton Marketplace, LLC (“Fulton”), a company owned by Mr. Krieger and Mr. Sperbeck. Effective August 1, 2014, Enterprises and Fulton entered into a five year lease expiring July 31, 2019, subject to two consecutive five year extension periods, for 2,712 square feet. The rent for the first lease year is $4,068 per month and it will increase by 3% annually at the start of each lease year thereafter. On June 30, 2015 Enterprises discontinued the lease as the office was relocated to a new location. Thus, effective July 1, 2015, Enterprises entered into a new five year lease with Fulton for a 3,321 square foot office space with a monthly base rent of $4,982 that will increase by 3% annually at the start of each lease year thereafter. Enterprises paid $69,700 and $26,700 to Fulton for the years ended December 31, 2015 and 2014, respectively for rent, real estate taxes, and operating expenses.
Fulton is the owner of a single family residence located in Chandler, Arizona. Effective December 1, 2014, Fulton and REH entered into a seven month lease expiring June 30, 2015. Total rent paid to Fulton during 2015 was $17,136.
On December 23, 2014, via an assignment and assumption agreement between Cyclone and Kenyon, Cyclone took ownership of a 10-acre parcel of undeveloped land located at 170xx Texas Avenue, Credit River Township, Minnesota and assumed a note secured by a mortgage on the property and owed to Lakeview Bank. The total acquisition cost paid to Kenyon was $52,000 and represented Kenyon’s total expenditures on the property (interest, closing fees, and property taxes) since its acquisition in 2013.
The Company and Enterprises are related parties due to ownership by Mr. Krieger. Mr. Krieger owns 100% of the Company’s Series A Preferred Units, controls 100% of its Class A Common Units, and controls 100% of the Common Units of Enterprises.
Effective July 1, 2015, Enterprises borrowed an aggregate principal amount of $22,206,113 with a weighted average interest rate of 14.08% and a maturity date of December 30, 2019 from Aspirity Financial. Although the provision was later removed, Enterprises also agreed to reimburse the Company for certain costs incurred as a publicly reporting entity (the “Expected Expenses”). Although initially an intercompany relationship and eliminated in consolidation, the loan agreement between the parties is constructed on an arm’s length basis, contains customary protective provisions for the lender, including certain guarantees, collateral, and covenants, and ensures that the cash flows generated by the Legacy Businesses continue to be used to pay the interest and principal on the Notes outstanding as of June 30, 2015. On November 1, 2015, the Term Loan was amended with respect to the definition of “actual redemptions” and to provide the lender with monthly financial statements and on January 27, 2016, it was further amended to eliminated the reimbursement of Expected Expenses. For the year ended December 31, 2015, Enterprises paid the Company total interest of $1,446,00, principal of $1,985,000, and Expected Expenses of $450,000, these amounts are eliminated in consolidation.
| 97 |
On September 1, 2015, CTG entered into a five-year lease agreement with Kenyon for 2,231 square feet of office space for a monthly rent of $2,975. For the year ended December 31, 2015, $18,565 of rent was paid to Kenyon.
| 25. | Commitments and Contingencies |
FERC Settlement
On October 12, 2011, FERC initiated a formal non-public investigation into TCE’s power scheduling and trading activity in MISO for the period from January 1, 2010 through May 31, 2011 (the “Investigation”). The Investigation addressed trading activity by former employees of TCPC whose employment contracts were terminated by TCPC on February 1, 2011 in connection with the Company’s reorganization of its Canadian operations. TCE and TCPC have no employees and do not conduct any operations.
On June 12, 2014, FERC issued a Notice of Alleged Violations (“NAV”) indicating that the staff of its Office of Enforcement had preliminarily determined that during the period from January 1, 2010 through January 31, 2011, TCPC and certain affiliated companies, including TCE and TCP, and individuals Allan Cho, Jason F. Vaccaro, and Gaurav Sharma, each violated the FERC’s prohibition on electric energy market manipulation by scheduling and trading physical power in MISO to benefit related swap positions that settled based on real-time MISO prices.
On November 14, 2014, settlement was agreed to regarding the Investigation and the NAV. The settlement required the payment of $978,186 plus interest of $128,827 as disgorgement of profits ($1,107,013) and $2,500,000 as a civil penalty, for a total of $3,607,013, with the disgorgement to be paid to MISO and the penalty to the U.S. Treasury. During the third quarter of 2014, the disgorgement was recorded as a reduction of revenue and the penalty was expensed to operations. The Company booked the settlement as a liability of TCP as TCE and TCPC no longer had any operations.
On December 30, 2014, FERC formally accepted the settlement. The first installment of $500,000 was paid on December 31, 2014 to MISO with the remaining $3,107,000 to be paid in 16 equal quarterly installments of $194,000 each, beginning April 1, 2015, first to MISO the disgorgement is fully paid, and thereafter to the Treasury in satisfaction of the penalty.
On June 1, 2015, the financial obligations under the settlement agreement were transferred to Angell in connection with its purchase of TCP.
As part of the settlement, the Company further agreed to implement certain procedures to improve compliance. Failure to comply with the terms and conditions will be deemed a violation of the final order and may subject the Company to additional action.
| 98 |
Former Employee Litigation
On February 1, 2011, the Company commenced a major restructuring of the operations of TCPC and all personnel were terminated, although several were subsequently re-hired. During the course of 2011, three former employees of TCPC commenced legal proceedings and brought separate summary judgment applications seeking damages aggregating C$3,367,000 for wrongful dismissal and payment of performance bonuses. The Company filed a counterclaim for C$3,096,000 against one of the former employees for losses suffered, inappropriate expenses, and related matters. Two of the three summary judgment applications were dismissed on January 12, 2012. All three summary judgment applications were appealed and were heard on July 4, 5, and 6, 2012 by the Alberta Court of Queen’s Bench. On July 6, 2012, the court dismissed two of the three applications and allowed the third, awarding summary judgment against TCPC for a portion of the claim amounting to C$1,376,726. This third matter will hereinafter be referred to as the “TCPC judgment action” An application to set aside the judgment in the TCPC judgment action has been filed.
In 2013, the former employees brought applications to amend their pleadings to include as additional defendants certain TCPC U.S. affiliates (“Twin Cities USA”). One of the former employees proceeded with the application and the others were adjourned. The application that proceeded went forward on April 29 and 30, 2013. In a decision dated January 31, 2014, the Court of Queen’s Bench dismissed the applications to add additional defendants but allowed certain refinements to the pleadings. Thereafter the Company and TCPC consented to an amendment of pleadings of the other employees consistent with the Court’s ruling.
In addition, on January 31, 2014 within the “TCPC judgment action” the Court of Queen’s Bench ordered Twin Cities USA to post security for costs in the sum of C$75,000 together with security for judgment in the sum of C$1,376,726. In order to preserve its claims and counterclaims against the former employees in the TCPC judgment action, Twin Cities USA posted security for the judgment and costs and continues to maintain that security pending further order or direction from the Court of Queen’s Bench.
Twin Cities USA and TCPC intend to continue to vigorously defend against the allegations and claims of the former employees and have filed counterclaims or amended counterclaims for losses suffered and costs incurred in responding to the FERC investigation, inappropriate expenses, and related matters.
Further, on April 24, 2015, the Company commenced a new action against a former employee of TCPC, Guarav Sharma, claiming amounts owing in relation to the FERC settlement arising from his conduct as an employee. It is hoped this action will be consolidated with the other former employee litigation.
In all former employee litigation, the parties are continuing with discovery. A case management justice has been appointed to assist in scheduling and with any required motions. A trial date has been set for April 2017.
Due to the uncertainty surrounding the outcome of the litigation, including that of its counterclaims against the former employees, the Company is presently unable to determine a range of reasonably possible outcomes.
| 99 |
PJM Resettlements
On May 11, 2012, FERC issued an order denying rehearing motions in regards to PJM resettlement fees confirming its intent to reverse refunds it had granted to a number of market participants in a 2009 order. These refunds were related to transmission line loss refunds issued to the Company by PJM for prior periods. Pursuant to the order, the Company was required to return $782,000 to PJM which amount was paid in full in July 2012.
On July 9, 2012, several parties filed a petition for review of the May 11, 2012 FERC order with the District of Columbia Circuit of the U.S. Court of Appeals and certain subsidiaries of Enterprises filed motions to intervene in the proceeding. In an order issued August 6, 2013, the Court remanded to FERC for further consideration the issue of recoupment of refunds that had previously been directed by FERC. The Court found that FERC’s orders failed to explain why refund recoupment was warranted and therefore its recoupment directive was found to be arbitrary and capricious.
On February 20, 2014, the FERC issued an order establishing a briefing schedule allowing parties to the proceeding to provide briefs on whether or not the recoupment orders should be reconsidered. Although briefing on all issues relevant to the remand was invited by FERC, it also presented five specific questions, primarily relating to the effect of the recoupment orders, for the parties to address. Initial briefs were due on April 7, 2014.
On November 19, 2015, the FERC affirmed its prior order. Management believes that liability for such charges, if any, associated with TCP and SUM’s trading activity was assumed by Angell in conjunction with the purchase of the equity interests of such entities.
PJM Up-To Congestion Fees
On August 29, 2014, FERC initiated a proceeding under Section 206 of the Federal Power Act, as amended, described in Docket No. EL14-37-000 regarding how PJM treats up-to-congestion (“UTC”) transactions in the market (the “§206 proceeding”). The purpose of the proceeding is for FERC to examine how uplift is, or should be, allocated to all virtual transactions within the PJM market. The Company is an active trader of these UTCs.
Currently, under PJM’s Tariff and Operating Agreement, UTCs are treated differently under its FTR forfeiture rule than are INCs and DECs, two other types of virtual transactions. Further, INCs and DECs are subject to uplift charges, but UTCs are not. In Docket No EL14-37-000, FERC noted that should any uplift be charged UTCs, it would apply such back to the date that notice of the proceeding was published in the Federal Register (September 8, 2014), thus setting a “refund effective date”. From the refund effective date to December 31, 2015, the Company traded about 9,000,000 MWh of UTCs in PJM and recorded $13,300,000 of associated revenues. Over 68% of this activity was transacted by TCP and SUM.
Although the Company’s UTC trading activity exposes it to potential uplift charges, none have been billed as the proceeding is still ongoing. Further, Enterprises has not established any reserves for such as management is uncertain as to the probability, amount, and timing of the actual payment, if any, that might be due. Finally, management believes that liability for such charges, if any, associated with TCP and SUM’s trading activity was assumed by Angell in conjunction with the purchase of the equity interests of such entities.
| 100 |
Letter of Credit
In connection with the Restructuring, Enterprises assumed the letter of credit as described below.
On June 24, 2014, the Company’s restricted cash balance of $320,188 was returned by the City of Lakeville and a letter of credit in favor of Cyclone was issued by Vermillion State Bank for the same amount. The note evidencing the letter of credit calls for maximum advances of up to $320,188, bears interest at an annual rate of 5.25%, is secured by a mortgage on the property being developed and the guaranty of Cyclone, and matures on demand. In October 2015, the note was renewed for another year, the letter of credit maximum advance dropped to $257,718, with all other terms remaining the same.
As of December 31, 2015, the Company was in compliance with all terms and conditions of the letter of credit.
Guarantees
In the ordinary course, the Company provided guarantees of the obligations of TCP, SUM, and CEF with respect to their participation in certain ISOs. During 2015, many of these guarantees were cancelled.
On April 13, 2015, the Company pledged additional collateral of $700,000 to PJM and consequently cancelled its guarantees for the benefit of PJM with respect to TCP and SUM effective April 30, 2015.
On May 13, 2015, the Company gave notice to ERCOT and NYISO of the cancellation of its guarantees of TCP’s obligations, and a concurrent pledge of $500,000 of additional collateral to NYISO. On May 14, 2015, NYISO accepted the collateral and the cancellation of the Company’s obligation. On June 9, 2015, ERCOT accepted the cancellation of the Company’s obligation.
On June 17, 2015, REH entered into two separate guaranties of the obligations of TSE and TSEE of up to $1,000,000 in favor of BP Energy Company (“BP”). The guarantees remain effective until the earlier of June 17, 2020 or ten days after REH gives notice of cancellation to BP. Guarantor guarantees the timely payment when due of the obligations of the guaranteed party. If the guaranteed party shall fail to pay any obligation, guarantor shall promptly pay to the counterparty the amount due.
On July 6, 2015, the effective date, the Company gave notice to MISO of the cancellation of its guarantees of TCP, CEF, and SUM’s obligations.
In the ordinary course, Enterprises provided guarantees of the obligations of REH and its subsidiaries with respect to purchases of power from certain wholesale suppliers.
On August 12, 2013, the Company entered into a guaranty of the obligations of TSE of up to $1,000,000 (plus any costs of collection or enforcement) in favor of Noble Americas Energy Solutions LLC (“NEAS”). The Company may cancel the guarantee upon 30 days’ written notice to NEAS.
On April 25, 2014, the Company entered into a guaranty of the obligations of TSEE of up to $1,000,000 (plus any costs of collection or enforcement) in favor of NEAS. The Company may cancel the guarantee upon 30 days’ written notice to NEAS.
| 101 |
On November 5, 2014, the Company entered into two separate guaranties of the obligations of TSE and TSEE of up to $500,000 (plus any costs of enforcement or collection) in favor of Shell Energy North America L.P. (“Shell”). The guarantee is in effect until the earlier of November 5, 2019 or ten days’ after the Company gives notice to Shell of its cancellation. Guarantor guarantees the timely payment when due of the obligations of the guaranteed party. If the guaranteed party shall fail to pay any obligation, guarantor shall promptly pay to the counterparty the amount due.
Legal fees, if any, related to commitments and contingencies are expensed as incurred.
| 26. | Segment Information |
In 2015, as a result of the Restructuring and the distribution of Enterprises, the Company currently has limited operations and assets, but has established two segments used to measure business activity – retail energy services and financial services:
| ● | By the end of 2016, the Company’s goal is to be able to market electricity to approximately 38 million residential customers located in 50 service areas in the 14 jurisdictions that allow all retail customers of investor-owned utilities to choose who supplies them with electricity. |
| ● | Until the retail energy business has gained scale, the Company’s primary sources of cash flow will be Note sales and loan payments received from Enterprises, our first financial services customer. |
Enterprises has three segments used to measure its business activity – wholesale trading, retail energy services, and diversified investments:
| ● | Wholesale trading activities earn profits from trading financial, physical, and derivative electricity in wholesale markets regulated by the FERC and the CFTC. On June 1, 2015, the Company sold two subsidiaries operating within this segment. See “Note 1 - Basis of Presentation and Description of Business – Businesses – The Restructuring”, “Note 2 – Summary of Significant Accounting Policies – Variable Interest Entities”, and “Note 13 – Notes Receivable”. |
| ● | On July 1, 2012, Enterprise began selling electricity to residential and small commercial customers. |
| ● | On October 23, 2013, the Company formed a new entity to take advantage of certain investment opportunities in the residential real estate market and in 2014, it made certain investments in the securities of emerging companies. On June 1, 2015, the Company began selling management and administrative services and licensing software to third parties. In September 2015, the Company acquired Noble and began offering construction services. |
Trading profits and sales are classified as “foreign” or “domestic” based on the location where the trade or sale originated. For the years ended December 31, 2015 and 2014, all such transactions were “domestic”. Furthermore, the Company has no long-lived assets in foreign jurisdictions.
Though these segments are managed separately because they operate under different regulatory structures and are dependent upon different revenue models, the chief operating decision maker reviews monthly financial statements of the reporting segment or operating agreement. The performance of each is evaluated based on the operating income or loss generated.
Certain amounts reported in prior periods have been reclassified to conform to the current period’s presentation as a result of the Restructuring.
| 102 |
Information on segments for the year ended December 31, 2015 is as follows:
| Aspirity | Enterprises | |||||||||||||||||||||||||||
| Retail | Retail | Corporate, | ||||||||||||||||||||||||||
| Financial | Energy | Wholesale | Energy | Diversified | Net of | Consolidated | ||||||||||||||||||||||
| Services | Services | Trading | Services | Investments | Eliminations | Total | ||||||||||||||||||||||
| Year Ended December 31, 2015 | ||||||||||||||||||||||||||||
| Wholesale trading | $ | - | $ | - | $ | 14,667,197 | $ | (373,722 | ) | $ | - | $ | - | $ | 14,293,475 | |||||||||||||
| Retail energy services | - | - | 30,482,812 | - | - | 30,482,812 | ||||||||||||||||||||||
| Financial services | 2,877,149 | - | - | - | - | (2,877,149 | ) | - | ||||||||||||||||||||
| Real estate sales | - | - | - | - | 351,725 | - | 351,725 | |||||||||||||||||||||
| Management services | - | - | - | - | - | 710,000 | 710,000 | |||||||||||||||||||||
| Construction services | - | - | - | - | 2,285,998 | - | 2,285,998 | |||||||||||||||||||||
| Revenues, net | 2,877,149 | - | 14,667,197 | 30,109,090 | 2,637,723 | (2,167,149 | ) | 48,124,010 | ||||||||||||||||||||
| Costs of sales and services | - | - | - | 26,663,003 | 2,023,217 | - | 28,686,220 | |||||||||||||||||||||
| Retail sales and marketing | - | 7,000 | - | 1,325,721 | 20,500 | - | 1,353,221 | |||||||||||||||||||||
| Compensation and benefits | - | - | 9,206,059 | 885,026 | 512,048 | 2,864,798 | 13,467,931 | |||||||||||||||||||||
| Professional fees | - | 6,160 | 45,449 | 994,393 | 41,903 | 1,375,455 | 2,463,360 | |||||||||||||||||||||
| Other general and administrative | - | 4,381 | 198,721 | 1,326,506 | 143,320 | 3,553,074 | 5,226,002 | |||||||||||||||||||||
| Trading tools and subscriptions | - | - | 843,362 | 415,608 | 9,745 | 23,947 | 1,292,662 | |||||||||||||||||||||
| Operating costs and expenses | - | 17,541 | 10,293,591 | 31,610,257 | 2,750,733 | 7,817,274 | 52,489,396 | |||||||||||||||||||||
| Operating income (loss) | $ | 2,877,149 | $ | (17,541 | ) | $ | 4,373,606 | $ | (1,501,167 | ) | $ | (113,010 | ) | $ | (9,984,423 | ) | $ | (4,365,386 | ) | |||||||||
| Capital expenditures | $ | - | $ | - | $ | 1,377 | $ | 72,027 | $ | 795,779 | $ | 101,658 | $ | 970,841 | ||||||||||||||
| At December 31, 2015 | ||||||||||||||||||||||||||||
| Identifiable Assets | ||||||||||||||||||||||||||||
| Cash - unrestricted | $ | - | $ | 100,965 | $ | 771,746 | $ | 652,670 | $ | 44,232 | $ | 761,788 | $ | 2,331,401 | ||||||||||||||
| Cash in trading accounts | - | - | 6,247,059 | 1,800,272 | - | - | 8,047,331 | |||||||||||||||||||||
| Collateral deposits | - | 63,500 | - | 182,500 | - | - | 246,000 | |||||||||||||||||||||
| Accounts receivable - trade | 258,569 | - | 276,017 | 3,558,316 | 1,548,088 | 247,194 | 5,888,184 | |||||||||||||||||||||
| Note recevable, net of deferred gain | - | - | - | - | - | 795,995 | 795,995 | |||||||||||||||||||||
| Prepaid expenses and other assets | - | 12,293 | 45,547 | 273,629 | 281,986 | 219,906 | 833,361 | |||||||||||||||||||||
| Total current assets | 258,569 | 176,758 | 7,340,369 | 6,467,387 | 1,874,306 | 2,024,883 | 18,142,272 | |||||||||||||||||||||
| Property, equipment and furniture, net | - | - | 122,480 | 129,453 | 397,818 | 698,560 | 1,348,311 | |||||||||||||||||||||
| Intangible assets, net | - | - | - | 852,669 | - | 852,669 | ||||||||||||||||||||||
| Deferred financing costs, net | - | - | - | 13,854 | - | 300,171 | 314,025 | |||||||||||||||||||||
| Cash - restricted | - | - | - | - | - | 1,319,371 | 1,319,371 | |||||||||||||||||||||
| Real estate held for development | - | - | - | - | 2,714,297 | - | 2,714,297 | |||||||||||||||||||||
| Note recevable, net of deferred gain | - | - | - | - | 323,342 | 2,263,274 | 2,586,616 | |||||||||||||||||||||
| Investment in convertible notes | - | - | - | - | 502,110 | - | 502,110 | |||||||||||||||||||||
| Term loan | 20,248,186 | - | - | - | - | (20,248,186 | ) | - | ||||||||||||||||||||
| Goodwill and other assets | - | - | - | - | 1,219,583 | - | 1,219,583 | |||||||||||||||||||||
| Total assets | $ | 20,506,755 | $ | 176,758 | $ | 7,462,849 | $ | 6,610,694 | $ | 7,884,125 | $ | (13,641,927 | ) | $ | 28,999,254 | |||||||||||||
| Identifiable Liabilities and Eauitv | ||||||||||||||||||||||||||||
| Accounts payable - trade : | $ | 269,312 | $ | 2,925 | $ | 144,915 | $ | 2,457,144 | $ | 908,301 | $ | 594,386 | $ | 4,376,983 | ||||||||||||||
| Accrued expenses | - | - | - | 2,090,226 | 3,117 | 11,996 | 2,105,339 | |||||||||||||||||||||
| Accrued compensation | - | - | 524,579 | - | 27,876 | 170,900 | 723,355 | |||||||||||||||||||||
| Accrued interest | - | - | - | 19,741 | 1,058 | 1,483,020 | 1,503,819 | |||||||||||||||||||||
| Billings in excess of costs and estimated earnings on uncompleted contracts | - | - | - | - | 710,827 | - | 710,827 | |||||||||||||||||||||
| Revolver | - | - | - | 1,212,705 | 475,700 | - | 1,688,405 | |||||||||||||||||||||
| Senior notes | - | - | - | - | 1,207,295 | 7,467 | 1,214,762 | |||||||||||||||||||||
| Renewable unsecured subordinated notes | - | - | - | - | 10,120,175 | 10,120,175 | ||||||||||||||||||||||
| Total current liabilities | 269,312 | 2,925 | 669,494 | 5,779,816 | 3,334,174 | 12,387,945 | 22,443,666 | |||||||||||||||||||||
| Senior notes | - | - | - | - | 32,248 | 209,984 | 242,232 | |||||||||||||||||||||
| Renewable unsecured subordinated notes | - | - | - | - | - | 14,364,323 | 14,364,323 | |||||||||||||||||||||
| Total long term liabilities | - | - | - | - | 32,248 | 14,574,307 | 14,606,555 | |||||||||||||||||||||
| Total liabilities | 269,312 | 2,925 | 669,494 | 5,779,816 | 3,366,422 | 26,962,252 | 37,050,221 | |||||||||||||||||||||
| Intercompany investment | 20,237,443 | 191,374 | 2,778,158 | 9,944,597 | 3,120,651 | (36,272,223 | ) | - | ||||||||||||||||||||
| Series A preferred equity | - | - | - | - | - | 2,745,000 | 2,745,000 | |||||||||||||||||||||
| Common equity | - | (17,541 | ) | 3,898,567 | (9,050,862 | ) | (563,393 | ) | 4,086,266 | (1,646,963 | ) | |||||||||||||||||
| Accumulated other comprehensive income | - | - | 116,630 | (62,857 | ) | - | (53,773 | ) | - | |||||||||||||||||||
| Total members’ equity (deficit) | 20,237,443 | 173,833 | 6,793,355 | 830,878 | 2,557,258 | (29,494,730 | ) | 1,098,037 | ||||||||||||||||||||
| Noncontrolling interest | - | - | - | - | 1,960,445 | (11,768,221 | ) | (9,807,776 | ) | |||||||||||||||||||
| Accumulated other comprehensive income attributed to NCI | - | - | - | - | - | 658,772 | 658,772 | |||||||||||||||||||||
| Total equity (deficit) | 20,237,443 | 173,833 | 6,793,355 | 830,878 | 4,517,703 | (40,604,179 | ) | (8,050,967 | ) | |||||||||||||||||||
| Total liabilities and equity : | $ | 20,506,755 | $ | 176,758 | $ | 7,462,849 | $ | 6,610,694 | $ | 7,884,125 | $ | (13,641,927 | ) | $ | 28,999,254 | |||||||||||||
| 103 |
| Aspirity | Enterprises | |||||||||||||||||||||||
| Retail | Corporate, | |||||||||||||||||||||||
| Financial | Wholesale | Energy | Diversified | Net of | Consolidated | |||||||||||||||||||
| Services | Trading | Services | Investments | Eliminations | Total | |||||||||||||||||||
| Year Ended December 31, 2014 | ||||||||||||||||||||||||
| Wholesale trading | $ | - | $ | 36,894,702 | $ | 1,717,242 | $ | - | $ | - | $ | 38,611,944 | ||||||||||||
| Retail energy services | _ | 11,229,476 | - | - | 11,229,476 | |||||||||||||||||||
| Financial services | 1,295,975 | - | - | - | (1,295,975 | ) | - | |||||||||||||||||
| Revenues, net | 1,295,975 | 36,894,702 | 12,946,718 | - | (1,295,975 | ) | 49,841,420 | |||||||||||||||||
| Costs of sales and services | - | - | 11,440,672 | - | - | 11,440,672 | ||||||||||||||||||
| Retail sales and marketing | - | - | 324,948 | - | - | 324,948 | ||||||||||||||||||
| Compensation and benefits | - | 19,196,234 | 391,931 | - | 2,134,154 | 21,722,319 | ||||||||||||||||||
| Professional fees | - | 686,643 | 876,488 | 2,200 | 921,725 | 2,487,056 | ||||||||||||||||||
| Other general and administrative | - | 7,720,546 | 1,314,991 | 108,938 | (3,050,632 | ) | 6,093,843 | |||||||||||||||||
| Trading tools and subscriptions | - | 902,364 | 386,349 | 2,765 | 41,326 | 1,332,804 | ||||||||||||||||||
| Operating costs and expenses | - | 28,505,787 | 14,735,379 | 113,903 | 46,573 | 43,401,642 | ||||||||||||||||||
| Operating income (loss) | $ | 1,295,975 | $ | 8,388,915 | $ | (1,788,661 | ) | $ | (113,903 | ) | $ | (1,342,548 | ) | $ | 6,439,778 | |||||||||
| Capital expenditures | $ | - | $ | 15,773 | $ | 738,615 | $ | 185,529 | $ | 127,388 | $ | 1,067,305 | ||||||||||||
| At December 31, 2014 | ||||||||||||||||||||||||
| Identifiable Assets | ||||||||||||||||||||||||
| Cash - unrestricted | $ | - | $ | 1,296,294 | $ | 288,436 | $ | 5,925 | $ | 806,645 | $ | 2,397,300 | ||||||||||||
| Cash in trading accounts | - | 19,642,215 | 1,457,437 | - | - | 21,099,652 | ||||||||||||||||||
| Marketable securities | - | - | - | - | 311,586 | 311,586 | ||||||||||||||||||
| Accounts receivable - trade | - | 501,182 | 1,878,247 | - | 14,817 | 2,394,246 | ||||||||||||||||||
| Note recevable, net of deferred gain | - | - | - | - | - | - | ||||||||||||||||||
| Prepaid expenses and other assets | - | 127,209 | 47,043 | 30,943 | 211,224 | 416,419 | ||||||||||||||||||
| Total current assets | - | 21,566,900 | 3,671,163 | 36,868 | 1,344,272 | 26,619,203 | ||||||||||||||||||
| Property, equipment and furniture, net | - | 80,048 | 99,068 | 1,000 | 582,413 | 762,529 | ||||||||||||||||||
| Intangible assets, net | - | - | 269,149 | - | - | 269,149 | ||||||||||||||||||
| Deferred financing costs, net | - | - | 31,354 | - | 210,390 | 241,744 | ||||||||||||||||||
| Cash - restricted | - | 1,319,371 | - | - | - | 1,319,371 | ||||||||||||||||||
| Real estate held for development | - | - | - | 953,462 | - | 953,462 | ||||||||||||||||||
| Investment in convertible notes | - | - | - | 1,604,879 | - | 1,604,879 | ||||||||||||||||||
| Term loan | 17,653,128 | - | - | - | (17,653,128 | ) | - | |||||||||||||||||
| Total assets | $ | 17,653,128 | $ | 22,966,319 | $ | 4,070,734 | $ | 2,596,209 | $ | (15,516,053 | ) | $ | 31,770,337 | |||||||||||
| Identifiable Liabilities and Eauitv | ||||||||||||||||||||||||
| Accounts payable - trade | $ | - | $ | 369,840 | $ | 803,124 | $ | 25,215 | $ | 345,924 | $ | 1,544,103 | ||||||||||||
| Accrued expenses | - | - | 678,456 | - | 3,539 | 681,995 | ||||||||||||||||||
| Accrued compensation | - | 3,601,282 | - | - | - | 3,601,282 | ||||||||||||||||||
| Accrued interest | - | - | - | - | 849,913 | 849,913 | ||||||||||||||||||
| Obligations under settlement agreement | - | 582,565 | - | - | - | 582,565 | ||||||||||||||||||
| Revolver | - | - | 1,105,259 | - | - | 1,105,259 | ||||||||||||||||||
| Senior notes | - | - | - | 304,952 | 7,116 | 312,068 | ||||||||||||||||||
| Renewable unsecured subordinated notes | - | - | - | - | 7,234,559 | 7,234,559 | ||||||||||||||||||
| Total current liabilities | - | 4,553,687 | 2,586,839 | 330,167 | 8,441,051 | 15,911,744 | ||||||||||||||||||
| Senior notes | - | - | - | - | 217,451 | 217,451 | ||||||||||||||||||
| Renewable unsecured subordinated notes | - | - | - | - | 10,418,569 | 10,418,569 | ||||||||||||||||||
| Obligations under settlement agreement | - | 2,524,448 | - | - | - | 2,524,448 | ||||||||||||||||||
| Total long term liabilities | - | 2,524,448 | - | - | 10,636,620 | 13,160,468 | ||||||||||||||||||
| Total liabilities | - | 7,078,135 | 2,586,839 | 330,167 | 19,077,071 | 29,072,212 | ||||||||||||||||||
| Intercompany investment | 17,653,128 | 7,835,842 | 7,527,746 | 2,489,529 | (35,506,245 | ) | - | |||||||||||||||||
| Series A preferred equity | - | - | - | - | 2,745,000 | 2,745,000 | ||||||||||||||||||
| Common equity | - | 7,053,301 | (5,180,443 | ) | (223,487 | ) | (1,842,995 | ) | (193,624 | ) | ||||||||||||||
| Accumulated other comprehensive income | - | 999,041 | (863,408 | ) | - | 11,116 | 146,749 | |||||||||||||||||
| Total members’ equity (deficit) | 17,653,128 | 15,888,184 | 1,483,895 | 2,266,042 | (34,593,124 | ) | 2,698,125 | |||||||||||||||||
| Total liabilities and equity: | $ | 17,653,128 | $ | 22,966,319 | : | $ | 4,070,734 | $ | 2,596,209 | $ | (15,516,053 | ) | $ | 31,770,337 | ||||||||||
| 104 |
| 27. | Subsequent Events |
From January 1 to March 30, 2015, the Company sold Subordinated Notes totaling $1,436,000 with a weighted average term of 35.1 months and bearing a weighted average interest rate of 13.0%.
On December 21, 2015, ABN AMRO notified CEF that they were terminating the Margin Agreement and the related trading accounts, effective January 12, 2016 and February 12, 2016, respectively. On January 15, 2016, CEF entered into a customer and credit agreement with ED & F Man Client Services, Inc. (“ED&F”). The credit agreement provides CEF with $5,000,000 to meet initial margin requirements in CEF’s commodity accounts established by ED&F for the purpose of trading futures and options contracts. Any loans outstanding are payable on demand and bear interest at a rate equal to 3 month LIBOR plus 5.50%s. The agreement also calls for an annual commitment fee of $50,000 payable in monthly installments. The agreement is secured by all balances in CEF’s trading accounts under the customer agreement and is subject to certain reporting, affirmative, and negative covenants, including certain financial tests.
On January 27, 2016, effective January 1, 2016, the Company and Enterprises signed an amendment to the Term Loan that provided for the elimination of Enterprises’ obligation to reimburse the Company for certain costs incurred as a publicly reporting entity.
On February 18, 2016, REH was informed that on February 12, 2016, the Ontario Superior Court of Justice ordered the winding up and liquidation of Maple Bank and appointed KPMG Inc. as liquidator following reports that the German banking authorities had terminated Maple’s banking license. REH is currently attempting to obtain replacement financing and, at the same time, negotiating with KPMG regarding the timing and method of repayment of amounts outstanding under the Maple Bank revolver.
On March 18, 2016, FERC issued in Docket No. EC16-60-000 an order granting authorization, under Section 203(a)(1) of the Federal Act, for six individuals to acquire equity interests in Aspirity Holdings LLC.
On March 30, 2016, the PSA with Exelon was executed to provide us with all the power and ancillary services we need to serve our customers for an initial term expiring on March 30, 2019. As of December 31, 2015, Exelon was the operator of the second largest generation fleet in the U.S. and its long-term S&P credit rating was BBB.
Enterprises loaned Ultra Green $50,000 on February 29, 2016 and an additional $50,000 on March 17, 2016. The notes are secured by a first mortgage on Ultra Green’s production facility in Devil’s Lake, North Dakota and bear interest at 10% per annum. Interest only payments are due beginning September 1, 2015. The notes mature when the sale of the North Dakota facility is closed. In connection with the issuance of these notes, Ultra Green issued the Company two warrants to purchase 50,000,000 shares each of its common stock for $0.01 per share. The warrants expire February 28, 2026 and March 16, 2026.
Through April 4, 2016 Enterprises has made distributions to Tim Krieger totaling $400,000.
On January 22, 2016, Noble entered into a new loan agreement maturity date of September 22, 2016. The agreement provides Noble with a line of credit of up to $1,500,000 secured by property and assets as well as guarantees. Advances on the note are calculated by certain eligible receivables and inventory as defined and bear interest at 1%, with a floor of 5%, above the base rate as established by CIB. Noble is also subject to certain reporting, affirmative, and negative covenants.
The Company has evaluated subsequent events occurring through the date that the financial statements were issued.
| 105 |
Item 9 – Changes in and Disagreements with Accountants on Accounting and Financial Disclosure
None.
Item 9A - Controls and Procedures
Management, including our Chief Executive Officer and Chief Financial Officer, does not expect that its disclosure controls and procedures or its internal control over financial reporting will prevent all errors and all fraud. A control system, no matter how well conceived and operated, can provide only reasonable, not absolute, assurance that the objectives of the control system are met. Further, the design of a control system must reflect the fact that there are resource constraints and the benefits of controls must be considered relative to their costs. Because of the inherent limitations in all control systems, no evaluation of controls can provide absolute assurance that all control issues and instances of fraud, if any, within the Company have been detected.
Conclusion Regarding Effectiveness of Disclosure Controls and Procedures
Based on their evaluation as of December 31, 2015, the Company’s Chief Executive Officer and Chief Financial Officer have concluded that the Company’s disclosure controls and procedures as defined in Rule 13a-15(e) and 15d-15(e) under the Securities Exchange Act of 1934, as amended, were effective to ensure that the information required to be disclosed by the Company in the reports that it files or submits under the Securities Exchange Act of 1934 is (a) recorded, processed, summarized, and reported within the time periods specified in the SEC’s rules and forms and (b) accumulated and communicated to the Company’s management, including its Chief Executive Officer and Chief Financial Officer, or persons performing similar functions, as appropriate to allow timely decisions regarding required disclosure.
Management’s Report on Internal Control Over Financial Reporting
The Company’s management is responsible for establishing and maintaining adequate internal control over financial reporting as defined in Rule 13a-15(f) under the Securities Exchange Act of 1934, as amended. The Company’s management assessed the effectiveness of the Company’s internal control over financial reporting as of December 31, 2015. In making this assessment, the Company’s management used the criteria established in the 2013 Internal Control - Integrated Framework issued by the Committee of Sponsoring Organizations of the Treadway Commission (COSO). The Company’s management concluded that, as of December 31, 2015, its internal control over financial reporting was effective based on these criteria.
Enterprises has an investment in the Series C convertible notes issued by Ultra Green. Management estimated the fair value of the notes and corresponding other than temporary impairment (“OTTI”) charge to net income to be recorded on our financial statements as of and for the year ended December 31, 2015. The Company’s independent registered public accounting firm, Baker Tilly Virchow Krause, independently determined a lower fair value and higher OTTI charge associated with the notes and informed our Audit Committee that the changes in such estimates constituted a material weakness in our internal control over financial reporting.
An OTTI charge is a function of fair value and as there is no public market for any of the securities of Ultra Green, including its debt, equity securities, or Series C notes, any valuation of such requires the extensive use of Level 3 inputs unobservable in the market. We utilized all three traditional approaches to valuation to first estimate the fair market value of the common equity of Ultra Green and then used the convertible debt variant of the Black Scholes option valuation model to estimate the fair value of the Series C notes. While management accepted the conclusions of our auditors regarding the value of the Series C Notes and, therefore, the amount of the impairment charge, management does not believe that its use of a different valuation methodology constitutes a material weakness.
Changes in Internal Control over Financial Reporting
On September 1, 2015, Krieger Enterprises, LLC (“Enterprises”) acquired 60% of the outstanding common stock of Noble Conservation Solutions, Inc. (“Noble”). At the time of the acquisition, Enterprises was a wholly-owned subsidiary of the Company.
Consistent with the consolidation of Enterprises’ financial results with the Company’s, the Company is in the process of integrating Noble’s operations and has not included Noble’s activity in its evaluation of internal control over financial reporting pursuant to Section 404 of the Sarbanes-Oxley Act of 2002. See “Notes to Consolidated Financial Statements - Note 5- Acquisitions” for additional information relating to the Noble acquisition. Noble’s operations constituted approximately 9 percent of total assets (excluding goodwill and other intangible assets) as of December 31, 2015, and 5 percent of total revenue for the year then ended. Assuming the continued consolidation of Enterprises, Noble’s operations will be included in the Company’s assessment as of December 31, 2016.
Other than the acquisition of Noble, there have been no changes in our internal control over financial reporting that have materially affected or are reasonably likely to materially affect our internal control over financial reporting.
| 106 |
The Company’s internal control report is included in this report in Item 8 under the heading “Management’s Report on Internal Controls over Financial Reporting”.
None.
| 107 |
Item 10 – Directors, Executive Officers, and Corporate Governance
Directors and Executive Officers
On August 1, 2015, a new Minnesota law with respect to limited liability companies became effective and the Company updated its primary governance document, replacing its amended and restated Member Control Agreement with a new Operating Agreement.
Pursuant to the terms of our Operating Agreement, adopted as of the Distribution Date, our affairs are managed by our board of directors (the “Board”). Directors, formerly known as governors, hold office until the election and qualification of their successors and generally serve the same role as directors do for corporations. Officers are elected by the Board and serve at their direction.
On the Distribution Date, Timothy S. Krieger left his positions as President and Chief Executive Officer of the Company, but he remains our Chairman and the President and Chief Executive Officer of Enterprises. Mark A. Cohn left his position with Apollo and became our President and Chief Executive Officer. Wiley H. Sharp III continued to serve as our Vice President and Chief Financial Officer. Scott C. Lutz and Jeremy E. Schupp left their positions with Apollo and became Vice President and Chief Marketing Officer and Vice President and Chief Operating Officer, respectively.
Keith W. Sperbeck and Stephanie E. Staska, formerly Vice President of Operations and Vice President of Risk Management, respectively, resigned their positions with Aspirity and assumed similar roles at Enterprises.
We also disbanded our Risk Management Committee and instituted an Investment Committee.
The following table lists our executive officers and directors as of March 1, 2016:
| Name | Age | Position | ||
| Timothy S. Krieger | 50 | Chairman of the Board | ||
| Mark A. Cohn | 59 | President, Chief Executive Officer, and Director | ||
| Wiley H. Sharp III | 59 | Vice President, Chief Financial Officer, and Secretary | ||
| Scott C. Lutz | 57 | Vice President and Chief Marketing Officer | ||
| Jeremy E. Schupp | 41 | Vice President and Chief Operating Officer | ||
| William M. Goblirsch (1) | 72 | Director | ||
| Paul W. Haglund (2) | 50 | Director | ||
| David B. Johnson (3) | 65 | Director | ||
| 1 | Chair of the Audit Committee until delivery of the 2015 audit, member of the Compensation and Investment Committees, and Chair of the Investment Committee after delivery of the 2015 audit. |
| 2 | Chair of the Investment Committee until delivery of the 2015 audit, member of the Compensation and Audit Committees, and Chair of the Audit Committee after delivery of the 2015 audit. |
| 3 | Chair of the Compensation Committee and member of the Audit and Investment Committees. |
Timothy S. Krieger founded the Company in July 2006 and has served as the Chairman of the Board, Chief Executive Officer and President of the Company and its predecessors from their dates of inception through the Distribution Date, and continues to serve as our Chairman of the Board. On the Distribution Date, Mr. Krieger resigned from all other officer positions with Aspirity and its subsidiaries. Mr. Krieger currently serves as the Chairman of the Board and Chief Executive Officer of Enterprises. Until January 2010, Mr. Krieger was a governor, co-founder, and the Secretary and Treasurer of Fairway Dairy & Ingredients, LLC (“FDI”), a buyer and seller of dairy commodities, and FDI’s affiliates. Mr. Krieger graduated from Iowa State University in 1989 with a BBA in marketing. The principal qualifications that led to Mr. Krieger’s selection as a Director include his extensive experience with the Company and its businesses.
| 108 |
Mark A. Cohn was elected as the Company’s President and Chief Executive Officer effective as of the Distribution Date and has served as a Director since January 2013. From January 1 until the Distribution Date, Mr. Cohn was an employee of our former subsidiary, Apollo. Mr. Cohn also is currently the Chairman and Chief Executive Officer of Third Season, LLC, a company founded as an incubator of micro-consumer marketing companies, a position he has held since founding the company in 2003. During 2010, he was also the Managing Director and Chief Executive Officer of Dorado Ocean Resources Limited, a deep ocean mining company, from April 2010 to March 2011. From 2003 to 2009, he served as Chief Executive Officer of Second Act, an e-commerce company focused on the resale of consumer electronics. Mr. Cohn served as Chairman, President and Chief Executive Officer of Intelefilm Corporation from October 2001 to August 2002. From its inception in 1986 until February 2001, Mr. Cohn was founder and Chief Executive Officer of Damark International, Inc., a consumer catalog company. During that time, Damark grew to become one of the nation’s largest consumer marketing companies with revenues of $600 million. At its peak, Damark had a market capitalization of over $500 million and employed 2,000 people in three states. Mr. Cohn currently serves as a member of the Board of Directors of Christopher and Banks Corporation, a specialty retailer of women’s clothing (NYSE-CBK) with over 650 stores in the US. In 2012, the National Association of Corporate Directors named him a Governance Fellow. The principal qualifications that led to Mr. Cohn’s selection as a Director include his extensive experience with public reporting companies, direct marketing, and finance.
Wiley H. Sharp III was appointed Vice President and Chief Financial Officer of the Company on March 6, 2012. Mr. Sharp is also a co-founder and Partner of Altus Financial Group LLC, a boutique investment banking firm specializing in the institutional placement of senior debt facilities, junior capital, and project financing, a position he has held since 2005. From March 2012 to April 2015, Mr. Sharp was a non-employee registered representative of First Liberties Financial. From May to October 2011, Mr. Sharp also served as Vice President - Finance for Christopher & Banks Corporation, a publicly traded retailer of women’s clothing. Mr. Sharp graduated from Tulane University in 1979 with a BS in management. He currently holds Series 79 (Investment Banking Representative), Series 7 (General Securities Representative), and Series 63 (Uniform State Securities Law) FINRA licenses.
Scott C. Lutz was appointed Vice President and Chief Marketing Officer of the Company effective as of the Distribution Date. Prior to that, Mr. Lutz was an employee of our former subsidiary, Apollo, since May 2015. Before joining Apollo, he worked as a consultant for TK&O Catalysts, a boutique consultancy combining business strategy and commercialization tactics, which Mr. Lutz founded in June 2012. From October 2010 through June 2012, Mr. Lutz served as CEO of Grocery Shopping Network, Inc., an early stage company building digital loyalty solutions for consumers, retailers and advertisers. Prior to that, he served as Chief Marketing Officer for Life Time Fitness, a $1.6B health & wellness fitness club operator, from May 2008 through June 2012. Over the past 25 years, Mr. Lutz has held C-level officer and executive roles at Best Buy, General Mills and Procter & Gamble as well as serving on the boards of multiple private and non-profit organizations. Mr. Lutz presently serves on the board of directors for The E. A. Sween Company and Emergency Physicians P.A. Mr. Lutz graduated from the University of Missouri with a BS in Chemical Engineering (1981).
| 109 |
Jeremy E. Schupp was appointed Vice President and Chief Operating Officer of the Company effective as of the Distribution Date. Prior to that, Mr. Schupp was an employee of our former subsidiary, Apollo, since September 2015. Before joining Apollo, he was President and CEO of energy.me, LLC, a retail energy marketer, with $140 million in annual sales, supplying the electricity needs of more than 10,000 residential and commercial consumers across PJM and MISO from January 2013 through September 2015. From April 2012 through January 2013, Mr. Schupp was Director of Consulting for INTL FCStone Inc., a global supplier of customized price risk management services to commodity producers and consumers with annual operating revenue of more than $500 million. Prior to that, Mr. Schupp was Group Manager - Commodity Procurement for Nestle USA from June 2008 through April 2012.
William M. Goblirsch was elected a Director in May 2012 and became an independent financial consultant in December 2006. From January 2013 to December 2014, Mr. Goblirsch was employed as Chief Financial Officer of Tzfat Spirits of Israel, LLC and also served as a member on its board. Mr. Goblirsch is an independent financial consultant and certified public accountant (inactive license) who started his career in 1966 with Arthur Andersen & Co. From 2003 to 2006, he served at various times as financial consultant to the creditors’ committee, Executive Vice President and Chief Financial Officer, and board member of Stockwalk Group Inc. Prior to 2003, among other roles, he served as an independent financial consultant or financial officer for a blender, packager and distributor of oil products and lubricants; a cellular air time reseller; and a shopping mall franchisor of dental centers. The principal qualifications that led to Mr. Goblirsch’s selection as a Director include his extensive financial background.
Paul W. Haglund became a Director of the Company on June 30, 2015. He has owned and operated Paul Haglund & Co., LLC, a public accounting practice serving small businesses headquartered in Lakeville, MN since 1994. He graduated from the College of St. Thomas in 1988 with a degree in accounting. The principal qualifications that led to Mr. Haglund’s selection as a Director include his extensive financial background.
David B. Johnson has served as a Director of the Company since December 2011. Mr. Johnson is currently Chief Executive Officer of Cedar Point Capital, LLC, a private company that raises capital for early stage companies, a position he has held since May 2007. Prior to forming Cedar Point, he served as a Managing Director of Private Placements at Stifel, Nicolaus & Company, an investment banking firm, beginning in December 2006 when Stifel purchased Miller Johnson Steichen Kinnard, Inc., an investment banking firm specializing in high-tech, medical device and other start-up and growth companies, of which Mr. Johnson was a founder, and lastly served as Chief Executive Officer. Mr. Johnson graduated from Augsburg College in Minneapolis, Minnesota in 1973 with a BS in business. The principal qualifications that led to Mr. Johnson’s selection as a Director include his experience with growth companies and companies that undergo initial public offerings.
Board Composition, Election of Directors, and Committees
Our Board currently consists of five members. All directors serve for an indefinite term until the election and qualification of their successors. Three of our directors are independent as defined by the applicable rules of The Nasdaq Stock Market. While we have not applied for listing on Nasdaq or any other securities exchange or market, we have chosen to apply Nasdaq’s independence standards in making our determination of independence.
The Company has adopted a code of ethics entitled “Code of Conduct” applicable to all employees, officers, and directors, the text of which is included with this Form 10-K as Exhibit 14.1.
| 110 |
Our Board has established an Audit Committee, a Compensation Committee, and an Investment Committee.
All three independent directors, William Goblirsch, Paul Haglund, and David Johnson, serve on each committee. Mr. Goblirsch chairs the Audit Committee until delivery of the 2015 audit at which time he will become Chair of the Investment Committee, Mr. Haglund chairs the Investment Committee until the delivery of the 2015 audit at which time he will become Chair of the Audit Committee and Mr. Johnson chairs the Compensation Committee.
The Audit Committee assists the Board in its oversight of the integrity of our consolidated financial statements, our independent registered public accounting firm’s qualifications and independence, and the performance of our independent registered public accounting firm. The committee’s responsibilities include:
| ● | Appointing, approving the compensation of, and assessing the independence of, our independent registered public accounting firm; |
| ● | Overseeing the work of our independent accountants, including the receipt and consideration of reports; |
| ● | Reviewing and discussing with management and our independent accountants our annual and quarterly consolidated financial statements and related disclosures; |
| ● | Monitoring our internal control over financial reporting, disclosure procedures, and code of business conduct and ethics; |
| ● | Establishing procedures for the receipt and retention of accounting-related complaints and concerns; |
| ● | Meeting independently with our independent accountants and management; and |
| ● | Preparing the Audit Committee report required by SEC rules. |
All audit and non-audit services, other than de minimus non-audit services to be provided by our independent registered public accounting firm must be approved in advance by our Audit Committee.
The Compensation Committee assists the Board in the discharge of its responsibilities relating to the compensation of our executive officers. The committee’s responsibilities include:
| ● | Reviewing, approving, and making recommendations to the Board with respect to executive officer compensation; |
| ● | Evaluating the performance of our Chief Executive Officer; |
| ● | Overseeing and administering, and making recommendations to the Board with respect to any cash and equity incentive plans adopted; and |
| ● | Reviewing and making recommendations to the Board with respect to director compensation. |
The Investment Committee provides oversight of the Company’s investment functions including review and approval of:
| ● | Allocation of capital to subsidiaries; |
| ● | Lending and investment policies and procedures; |
| ● | Individual loans in excess of $100,000; and |
| ● | All acquisitions, strategic alliances, and equity investments. |
The Committee may also consider such other finance and investment matters as it may determine to be advisable.
| 111 |
Item 11 - Executive Compensation
The following table sets forth the compensation paid to our Principal Executive Officer (“PEO”) and named executive officers during the years ended December 31, 2015 and 2014:
| Name and Principal Position | Year | Salary ($) | Bonus ($) | Other Incentive Compen- sation ($) (1) | All
Other Compen- sation ($) (2) | Total ($) | ||||||||||||||||||
| Timothy S. Krieger | 2015 | 600,000 | - | - | 14,717 | 614,717 | ||||||||||||||||||
| Chairman
of the Board, President, and Chief Executive Officer; PEO until October 31, 2015 | 2014 | 300,000 | - | - | 14,055 | 314,055 | ||||||||||||||||||
| Mark A. Cohn | 2015 | 240,000 | - | - | 7,276 | 247,276 | ||||||||||||||||||
| President
and Chief Executive Officer of Aspirity Energy; President and Chief Executive Officer of the Company and PEO after November 1, 2015 | 2014 | - | - | - | - | - | ||||||||||||||||||
| Wiley H. Sharp III | 2015 | 176,500 | - | - | 9,702 | 186,202 | ||||||||||||||||||
| Vice
President, Chief Financial Officer, and Secretary | 2014 | 168,000 | 100,000 | - | 9,350 | 277,350 | ||||||||||||||||||
| Scott C. Lutz | 2015 | 119,971 | - | - | - | 119,971 | ||||||||||||||||||
| Vice
President and Chief Marketing Officer, Aspirity Energy and the Company after November 1, 2015 | 2014 | - | - | - | - | - | ||||||||||||||||||
| Jeremy E. Schupp | 2015 | 57,516 | - | - | 133 | 57,649 | ||||||||||||||||||
| Vice
President and Chief Operating Officer, Aspirity Energy and the Company after November 1, 2015 | 2014 | - | - | - | - | - | ||||||||||||||||||
| Keith W. Sperbeck | 2015 | 180,000 | 37,500 | - | 20,000 | 237,500 | ||||||||||||||||||
| Vice
President - Operations and Secretary until October 31, 2015 | 2014 | 180,000 | 75,000 | - | 18,887 | 273,887 | ||||||||||||||||||
| Stephanie E. Staska | 2015 | 180,000 | - | - | 13,762 | 193,762 | ||||||||||||||||||
| Vice
President – Chief Risk Officer until October 31, 2015 | 2014 | 175,000 | 35,000 | - | 22,801 | 232,801 | ||||||||||||||||||
| 1 | The Company does not have an incentive stock plan, non-equity incentive plan, or non-qualified deferred compensation plan, and consequently, there were no stock awards, option awards, non-equity incentive plan compensation, or non-qualified deferred compensation earnings. |
| 2 | Other compensation consists of health care premiums paid on behalf of the employee and, in the case of Ms. Staska, tuition reimbursement. |
The Company does not have an incentive stock plan, non-equity incentive plan, or non-qualified deferred compensation plan, and consequently, there were no stock awards, option awards, non-equity incentive plan compensation, or non-qualified deferred compensation earnings for any of our named executive officers outstanding as of the end of our last completed fiscal year.
| 112 |
On July 18, 2012, the Board resolved to provide compensation to Board and Committee members as follows:
| ● | Each non-employee director attending board meetings in person - $5,000. |
| ● | Each non-employee director attending a committee meeting in person and serving as chair - $1,500. |
| ● | Each non-employee director attending a committee meeting in person - $1,000. |
| ● | Any Board or Committee meeting attended telephonically reduces fees by one-half. |
The Company does not have an incentive stock plan, non-equity incentive plan, or non-qualified deferred compensation plan, or provide retirement benefits for directors.
The amount of compensation each director received in 2015 is shown in the table below:
| Director | Fees
Earned or Paid in Cash ($) (1) | Stock
Awards ($) (2) | Total ($) | |||||||||
| Timothy S. Krieger (3) | - | - | - | |||||||||
| Mark A. Cohn (3) | - | - | - | |||||||||
| William M. Goblirsch | 29,250 | - | 29,250 | |||||||||
| Paul W. Haglund (4) | 12,500 | - | 12,500 | |||||||||
| David B. Johnson | 34,500 | - | 34,500 | |||||||||
| 1 | Represents cash payments of meeting fees and additional payments service as committee chairs or members. |
| 2 | The Company does not have an incentive stock plan, non-equity incentive plan, or non-qualified deferred compensation plan, and consequently, there were no stock awards, option awards, non-equity incentive plan compensation, or non-qualified deferred compensation earnings. |
| 3 | Historically, Mr. Krieger has never received specific compensation as a director. Effective January 1, 2015, Mr. Cohn became an employee of Apollo and ceased earning director’s fees. |
| 4 | Mr. Haglund became a Director of the Company on June 30, 2015. |
On December 18, 2015, the Compensation Committee recommended that, effective January 1, 2016, the Company change its director compensation plan to incorporate an annual retainer for Board service of $30,000, an annual committee chair fee of $3,500, and an annual committee member fee of $2,000, with all such fees payable in four equal quarterly installments on the first day of each of April, July, October, and January, commencing with April 1, 2016. Based on current committee assignments and roles, each of our independent Board members can expect to earn $37,500 in fees in 2016.
While the Company intends to adopt an equity plan for its independent directors, no definitive plan has yet been adopted. Further, the Company also intends to adopt a cash compensation plan for its chairman.
Except as described below, we currently have no plans that provide for the payment of retirement benefits, or benefits that will be paid primarily following retirement, including but not limited to tax-qualified defined benefit plans, supplemental executive retirement plans, tax-qualified defined contribution plans, and nonqualified defined contribution plans.
The Company maintains a 401(k) plan that is tax-qualified for its employees, including its executive officers. The plan does not offer employer matching, however, it does offer a discretionary employer contribution at year-end. No discretionary contributions have been made.
| 113 |
Potential Payments Upon Termination or Change-in-Control
Except as described below under “Employment Agreements”, we currently have no contract, agreement, plan or arrangement, whether written or unwritten, that provides for payments to a named executive officer at, following, or in connection with any termination, including without limitation resignation, severance, retirement, or a constructive termination of a named executive officer, or a change in control of the Company or a change in the named executive officer’s responsibilities, with respect to each named executive officer.
The following are summaries of our employment and consulting agreements with our named executive officers:
Timothy S. Krieger: On January 1, 2012, TCPH entered into an employment agreement with Mr. Krieger, which was last amended January 21, 2015, effective January 1, 2015 (the “4th Amendment”). Pursuant to the amended employment agreement, as of January 1, 2015, Mr. Krieger receives a salary of $50,000 per month from the Company. If Mr. Krieger’s employment is terminated for reasons other than cause, he will receive no severance pay. If Mr. Krieger’s employment is terminated for any reason other than non-renewal, he is subject to a non-compete agreement for a period of six months. If his employment is not renewed by the Company at the end of the original one-year term or any subsequent renewal term, Mr. Krieger will not be subject to a non-compete and he will not receive any severance pay.
Mr. Krieger’s employment agreement with the Company was terminated effective with the Distribution Date.
Mr. Krieger is the beneficial owner of 100% of the Company’s outstanding preferred equity interests and was the owner of 99.5% of its outstanding common equity interests until March 18, 2016 the date of the FERC approval, at which point his percentage interest in the Company’s financial rights dropped to 45%.
Mark A. Cohn: Effective January 1, 2016, by mutual consent, Mr. Cohn and the Company terminated an earlier agreement between he and the Company and entered into a new agreement. The new agreement provides for Mr. Cohn to perform the duties of President and Chief Executive Officer commencing on January 1, 2016 and continuing through December 31, 2016. In addition, the agreement will automatically extend for successive one-year terms unless either Mr. Cohn or the Company provides 90-day notice to terminate the agreement. Under the agreement Mr. Cohn is entitled to receive a base salary of $240,000 and is eligible to receive an annual bonus pursuant to an incentive plan approved by the Board of Directors of the Company. In addition, If Mr. Cohn’s employment is terminated for reasons other than cause he will receive twelve months of severance pay. If Mr. Cohn’s employment is terminated for any reason, he has agreed to non-competition, non-solicitation, and non-disparagement covenants for a period of twelve months. Further, the agreement provides for certain benefits for Mr. Cohn, and certain additional protections for the Company, in the event of a change of control.
Wiley H. Sharp III: On March 8, 2012, we entered into a Consultant and Professional Services Agreement with Wiley H. Sharp III pursuant to which he served as Vice President – Finance and Chief Financial Officer for TCPH. We paid Mr. Sharp $11,000 per month for his services; subject to an increase to $15,000 per month should the Acquisition Advisory Agreement dated January 5, 2012 between the Company and Altus Financial Group, LLC, of which Mr. Sharp is a 50% partner, be terminated. The Acquisition Advisory Agreement was terminated by mutual consent on July 1, 2012 and effective March 1, 2013, the Company and Mr. Sharp extended the Consultant and Professional Services Agreement until May 31, 2013. Effective June 15, 2013, the independent contractor arrangement between TCPH and Mr. Sharp was terminated by mutual consent and on June 16, 2013, the parties entered into an employment agreement pursuant to which Mr. Sharp serves as Vice President – Finance and Chief Financial Officer for TCPH.
| 114 |
On December 19, 2014, the Company and Mr. Sharp amended his employment agreement dated June 16, 2013 (the “Amendment”). The Amendment provides that the Company shall pay Mr. Sharp a salary of $14,000 per month, subject to review and adjustment by the Company on a monthly basis based on both Mr. Sharp’s performance and the performance of the Company. The Amendment provides further that Mr. Sharp is entitled to participate in all benefit plans adopted by the Company, and is entitled to 20 days per year of personal time off. In addition, the Company will pay Mr. Sharp a discretionary bonus of $100,000 for 2014, but will no longer pay Mr. Sharp severance upon his separation from the Company.
Effective January 1, 2016, by mutual consent, Mr. Sharp and the Company terminated the amended employment agreement described above and entered into a new agreement. The new agreement provides for Mr. Sharp to perform the duties of Vice-President and Chief Financial Officer commencing on January 1, 2016 and continuing through December 31, 2016. In addition, the agreement will automatically extend for successive one-year terms unless either Mr. Sharp or the Company provides 90-day notice to terminate the agreement. Under the agreement Mr. Sharp is entitled to receive a base salary of $185,000 and is eligible to receive an annual bonus pursuant to an incentive plan approved by the Board of Directors of the Company. In addition, If Mr. Sharp’s employment is terminated for reasons other than cause he will receive twelve months of severance pay. If Mr. Sharp’s employment is terminated for any reason, he has agreed to non-competition, non-solicitation, and non-disparagement covenants for a period of twelve months. Further, the agreement provides for certain benefits for Mr. Sharp, and certain additional protections for the Company, in the event of a change of control.
Scott C. Lutz: Effective January 1, 2016, by mutual consent, Mr. Lutz and the Company terminated an earlier agreement between he and the Company and entered into a new agreement. The new agreement provides for Mr. Lutz to perform the duties of Vice-President and Chief Marketing Officer commencing on January 1, 2016 and continuing through December 31, 2016. In addition, the agreement will automatically extend for successive one-year terms unless either Mr. Lutz or the Company provides 90-day notice to terminate the agreement. Under the agreement Mr. Lutz is entitled to receive a base salary of $185,000 and is eligible to receive an annual bonus pursuant to an incentive plan approved by the Board of Directors of the Company. In addition, If Mr. Lutz’s employment is terminated for reasons other than cause he will receive twelve months of severance pay. If Mr. Lutz’s employment is terminated for any reason, he has agreed to non-competition, non-solicitation, and non-disparagement covenants for a period of twelve months. Further, the agreement provides for certain benefits for Mr. Lutz, and certain additional protections for the Company, in the event of a change of control.
Jeremy E. Schupp: Effective January 1, 2016, by mutual consent, Mr. Schupp and the Company terminated an earlier agreement between he and the Company and entered into a new agreement. The new agreement provides for Mr. Schupp to perform the duties of Vice-President and Chief Operating Officer commencing on January 1, 2016 and continuing through December 31, 2016. In addition, the agreement will automatically extend for successive one-year terms unless either Mr. Schupp or the Company provides 90-day notice to terminate the agreement. Under the agreement Mr. Schupp is entitled to receive a base salary of $185,000 and is eligible to receive an annual bonus pursuant to an incentive plan approved by the Board of Directors of the Company. In addition, If Mr. Schupp’s employment is terminated for reasons other than cause he will receive twelve months of severance pay. If Mr. Schupp’s employment is terminated for any reason, he has agreed to non-competition, non-solicitation, and non-disparagement covenants for a period of twelve months. Further, the agreement provides for certain benefits for Mr. Schupp, and certain additional protections for the Company, in the event of a change of control.
| 115 |
Compensation Policies and Practices as They Relate to Risk Management
We believe that risks arising from our compensation policies and practices for our employees, and the respective policies and practices for our subsidiaries, are not reasonably likely to have a material adverse effect on us. In addition, our Board believes that the mix and design of the elements of executive compensation do not encourage management to assume excessive risks.
Indemnification of Directors and Executive Officers and Limitations of Liability
Under our Operating Agreement, we indemnify our directors and officers against liabilities they may incur in such capacities including liabilities under the Securities Act of 1933, as amended (the “Securities Act”). The Operating Agreement provides for the indemnification, to the fullest extent permitted by the Securities Act and Minnesota law, as amended from time to time, of officers, directors, employees, and agents of the Company. We may, prior to the final disposition of any proceeding, pay expenses incurred by an officer or director upon receipt of an undertaking by or on behalf of that director or officer to repay those amounts if it should be determined ultimately that he or she is not entitled to be indemnified under the Operating Agreement or otherwise. We shall indemnify any officer, director, employee or agent upon a determination that such individual has met the applicable standards of conduct specified in the Operating Agreement. In the case of an officer or director, the determination shall be made (1) by the Board by a majority vote of a quorum consisting of directors who are not parties to such action, suit, or proceeding or (2) if such a quorum is not obtainable, or, even if obtainable, if a quorum of disinterested directors so directs, by independent legal counsel in a written opinion, or (3) by a majority vote of disinterested members.
The Operating Agreement provides that each director will continue to be subject to liability for any act or omission that constitutes fraud, willful misconduct, bad faith, gross negligence, or a breach of the Operating Agreement.
We have entered into indemnification agreements with our officers and directors. These agreements provide each such individual with indemnification retroactively for actions taken in his or her role as an officer or director to the Company.
We have been advised that in the opinion of the Securities and Exchange Commission, insofar as indemnification for liabilities arising under the Securities Act may be permitted to our directors, officers, and controlling persons pursuant to the foregoing provisions, or otherwise, such indemnification is against public policy as expressed in the Securities Act and is therefore unenforceable. In the event a claim for indemnification against such liabilities (other than our payment of expenses incurred or paid by a director, officer, or controlling person in the successful defense of any action, suit or proceeding) is asserted by such director, officer, or controlling person in connection with the securities being registered, we will, unless in the opinion of our counsel the matter has been settled by controlling precedent, submit to a court of appropriate jurisdiction the question of whether such indemnification by us is against public policy as expressed in the Securities Act and will be governed by the final adjudication of such issue.
| 116 |
At present, there is no pending litigation or proceeding involving any of our directors, officers, or employees in which indemnification is sought, nor are we aware of any threatened litigation that may result in claims for indemnification.
Item 12 – Security Ownership of Certain Beneficial Owners and Management and Related Stockholder Matters.
The following table sets forth information concerning beneficial ownership of our common units as of March 30, 2016 for:
| ● | Each director; |
| ● | Each holder of five percent or more; |
| ● | Our executive officers as set forth in the Summary Compensation Table; and |
| ● | The directors and current executive officers as a group. |
Unless otherwise indicated, each person has sole investment and voting power (or shares such powers with his or her spouse) with respect to the shares set forth in the following table.
| Voting Units | ||||||||
| Name and Principal Position of Beneficial Owner | Class
A Common Units | Percent
of Voting Rights | ||||||
| Timothy S. Krieger (1) | 4,960 | 45.00 | % | |||||
| Chairman of the Board | ||||||||
| Mark A. Cohn (2) | 1,654 | 15.00 | % | |||||
| President, Chief Executive Officer, and Director | ||||||||
| Wiley H. Sharp III (2) | 1,654 | 15.00 | % | |||||
| Vice President, Chief Financial Officer, and Secretary | ||||||||
| Keith W. Sperbeck (2) | 1,103 | 10.00 | % | |||||
| Former Vice President of Operations and Secretary | ||||||||
| Brandon J. Day (2) | 551 | 5.00 | % | |||||
| Owner | ||||||||
| Scott C. Lutz (2, 3) | 551 | 5.00 | % | |||||
| Vice President and Chief Marketing Officer | ||||||||
| Jeremy E. Schupp (2, 3) | 551 | 5.00 | % | |||||
| Vice President and Chief Operating Officer | ||||||||
| Stephanie E. Staska | - | 0.00 | % | |||||
| Former Vice President of Risk Management and Chief Risk Officer | ||||||||
| William M. Goblirsch | - | 0.00 | % | |||||
| Director | ||||||||
| Paul B. Haglund | - | 0.00 | % | |||||
| Director | ||||||||
| David B. Johnson | - | 0.00 | % | |||||
| Director | ||||||||
| All governors & executive officers as a group (8 persons) | 11,024 | 100.00 | % | |||||
| 1 | Includes 25 Class A units held by Summer Enterprises, LLC, a company controlled by Mr. Krieger. |
| 2 | The issuance of these units was effective March 30, 2016. |
| 4 | Units are subject to the risk of forfeiture upon payment of $1.00 per unit as follows: after April 1, 2016 but before March 31, 2017, 367 units and after April 1, 2017 but before March 31, 2018, 183 units. |
| 117 |
Item 13 – Certain Relationships, Related Transactions, and Director Independence
The following is a description of certain transactions and relationships between us and our directors, officers, and other affiliates during 2015. Other than in connection with the transactions described below, we have not been a party to, and we have no plans to be a party to, any transaction or series of similar transactions in which the amount involved exceeded or will exceed $120,000 and in which any director, executive officer, holder of more than 5% of our units, or any member of the immediate family of any of the foregoing, had or will have a direct or indirect material interest.
Our Board currently consists of five members. All directors serve for an indefinite term until the election and qualification of their successors. Three of our directors are independent as defined by the applicable rules of The Nasdaq Stock Market. While we have not applied for listing on Nasdaq or any other securities exchange or market, we have chosen to apply Nasdaq’s independence standards in making our determination of independence.
Term Loan
The Company and Enterprises are related parties due to ownership by Mr. Krieger. Mr. Krieger owns 100% of the Company’s Series A Preferred Units as of December 31, 2015, controls 100% of its Class A Common Units, and controls 100% of the Common Units of Enterprises.
Effective July 1, 2015, Enterprises borrowed an aggregate principal amount of $22,206,113 with a weighted average interest rate of 14.08% and a maturity date of December 30, 2019 from Aspirity Financial. Although the provision was later removed, Enterprises also agreed to reimburse the Company for certain “Expected Expenses” or particular costs incurred as a publicly reporting entity. Although initially an intercompany relationship and eliminated in consolidation, the loan agreement between the parties is constructed on an arm’s length basis, contains customary protective provisions for the lender, including certain guarantees, collateral, and covenants, and ensures that the cash flows generated by the Legacy Businesses continue to be used to pay the interest and principal on the Notes outstanding as of June 30, 2015. On November 1, 2015, the Term Loan was amended with respect to the definition of “actual redemptions” and to provide the lender with monthly financial statements and on January 27, 2016, it was further amended to eliminated the reimbursement of Expected Expenses.
For the year ended December 31, 2015, Enterprises paid the Company total interest of $1,446,000, principal of $1,958,000, and Expected Expenses of $450,000. These are eliminated in consolidation.
| 118 |
Item 14 – Principal Accountants’ Fees and Services
Baker Tilly Virchow Krause, LLP (“BTVK”) is our principal independent registered public accountant and has audited the Company’s consolidated financial statements since 2009. Audit services provided by BTVK in 2014 included the audit of consolidated financial statements of the Company, reviews of interim consolidated financial information, and consultation on matters related to accounting and financial reporting.
The following table presents fees for professional services performed by BTVK for the audit of the Company’s annual financial statements for 2015 and 2014, the review of the Company’s interim consolidated financial statements for the first, second, and third quarters of 2015 and 2014, and for audit-related, tax, and other services performed in 2014 and 2013.
| Years ended December 31, | ||||||||
| 2015 | 2014 | |||||||
| Audit fees (1) | $ | 240,800 | $ | 134,177 | ||||
| Tax fees (2) | 76,656 | 35,781 | ||||||
| Other fees (3) | - | - | ||||||
| Audit related fees (4) | 117,018 | 17,000 | ||||||
| Total | $ | 434,474 | $ | 186,958 | ||||
| 1 | “Audit fees” includes the annual audits of the Company’s consolidated financial statements, reviews of interim consolidated financial statements included on Form 10-Q for the first, second and third quarters, and consultation on matters related to financial reporting. | |
| 2 | “Tax fees” include fees billed for professional services rendered for tax returns ($76,656 in 2015 and $35,781 in 2014) and tax advice and planning ($0 in 2014 and $0 in 2014). | |
| 3 | “Other fees” includes fees billed for services provided other than the services described above such as miscellaneous research projects and consultations. | |
| 4 | “Audit related fees” principally include fees related to S-1 filings and accounting consultations. |
Audit Committee Pre-Approval Policies
For fiscal years beginning after January 1, 2013, our Audit Committee has adopted pre-approval policies and procedures pursuant to which audit, audit-related, tax services, and all permissible non-audit services, are pre-approved by category of service. The fees are budgeted, and actual fees versus the budgeted amounts are monitored throughout the year.
During the year, circumstances may arise when it may become necessary to engage the independent auditor for additional services not contemplated in the original pre-approval. In those instances, we will obtain the specific pre-approval of the Audit Committee before engaging the independent auditor. Our policy requires the Audit Committee to be informed of each service, and the policies do not include any delegation of the Audit Committee’s responsibilities to management. The Audit Committee may delegate pre-approval authority to one or more of its members. The member to whom such authority is delegated will report any pre-approval decisions to the Audit Committee at its next scheduled meeting.
During 2015, the appointment of Baker Tilly Virchow Krause as Independent Registered Public Accountants was approved by the Board.
On February 19, 2016, the Board of Directors of Aspirity Holdings LLC (the “Company”), based on the recommendation of the Audit Committee of the Board of Directors, approved the appointment of Deloitte & Touche LLP (“Deloitte”) to serve as its independent registered public accounting firm for the Company’s fiscal year ending December 31, 2016 and the dismissal of Baker Tilly Virchow Krause, LLP (“BTVK”). The dismissal of BTVK will become effective upon issuance by BTVK of its reports on the Company’s financial statements as of and for the year ended December 31, 2015 to be included in the filing of the related Annual Report on Form 10-K.
| 119 |
Item 15 – Exhibits, Financial Statement Schedules
| Exhibit Number |
Description | |
| 2.1 | Agreement and Plan of Reorganization, dated November 14, 2011, as amended December 20, 2011 (incorporated by reference to Exhibit 2.1 to the Registrant’s Form S-1 filed February 10, 2012) | |
| 3.1(i) | Articles of Organization (incorporated by reference to Exhibit 3.1 to the Registrant’s Form S-1 filed February 10, 2012) | |
| 3.1(ii) | Form of Amended and Restated Operating Agreement | |
| 4.1 | First Supplemental Indenture (incorporated by reference to Exhibit 4.1 to Registrant’s Form S-1/A filed September 16, 2015) | |
| 4.2 | Form of Indenture (incorporated by reference to Exhibit 4.2 to the Registrant’s Form S-1/A filed March 30, 2012) | |
| 4.3 | Form of Note Confirmation (incorporated by reference to Exhibit 4.3 to the Registrant’s Form S-1/A filed September 16, 2015) | |
| 4.4 | Form of Subscription Agreement (incorporated by reference to Exhibit 4.4 to the Registrant’s Form S-1/A filed September 16, 2015) | |
| 4.5 | Paying Agent Agreement (incorporated by reference to Exhibit 4.5 to the Registrant’s Form S-1/A filed March 30, 2012) | |
| 10.1 | Form of Amended and Restated Outsourcing Agreement (incorporated by reference to Exhibit 10.1 to the Registrant’s Form S-1/A filed September 16, 2015) | |
| 10.2 | Term Loan Agreement between Aspirity Financial and Enterprises (incorporated by reference to Exhibit 10.2 to the Registrant’s Form S-1/A filed September 16, 2015), as amended by Amendment No. 1 to Term Loan Agreement dated November 1, 2015 and as further amended by Amendment No. 2 to Term Loan Agreement dated January 27, 2016. | |
| 10.3 | Employment Agreement between the Company and Mark A. Cohn (incorporated by reference to Exhibit 10.3 to the Registrant’s Form 8-K filed January 6, 2016) | |
| 10.4 | Employment Agreement between the Company and Wiley H. Sharp III (incorporated by reference to Exhibit 10.4 to the Registrant’s Form 8-K filed January 6, 2016) | |
| 10.5 | Employment Agreement between the Company and Jeremy E. Schupp (incorporated by reference to Exhibit 10.5 to the Registrant’s Form 8-K filed January 6, 2016) | |
| 10.6 | Employment Agreement between the Company and Scott C. Lutz (incorporated by reference to Exhibit 10.6 to the Registrant’s Form 8-K filed January 6, 2016) | |
| 10.7 | Springing Equity Pledge Agreement (incorporated by reference to Exhibit 10.7 to the Registrant’s Form S-1/A filed September 16, 2015) | |
| 10.8 | Secured Promissory Note given by Enterprises to Aspirity Financial (incorporated by reference to Exhibit 10.8 to the Registrant’s Form S-1/A filed September 16, 2015) |
| 120 |
| Exhibit Number | Description | |
| 10.9 | Form of Indemnification Agreement between the Company and each of Timothy Krieger, David Johnson, Wiley H. Sharp III, Mark Cohn, Paul W. Haglund, Scott C. Lutz, Jeremy E. Schupp, and William M. Goblirsch (incorporated by reference to Exhibit 10.9 to the Registrant’s Form S-1 filed February 10, 2012) | |
| 10.10 | Office Sublease Agreement, dated June 1, 2015 between the Company and Bell State Bank & Trust (incorporated by reference to Exhibit 10.10 to the Registrant’s Form 8-K filed July 20, 2015) | |
| 10.11 | Base Confirmation Agreement by and between Aspirity Energy and Exelon Generation Company, LLC | |
| 12.1 | Computation of Ratio of Earnings to Fixed Charges | |
| 12.2 | Computation of Ratio of Earnings to Fixed Charges and Preferred Distributions | |
| 14.1 | The Company’s Code of Conduct, adopted December 2015, revised February 29, 2016 | |
| 16 | Letter from Baker Tilly Virchow Krause, LLP (incorporated by reference to Exhibit 16 to the Registrant’s Form 8-K filed February 24, 2016) | |
| 21 | List of Subsidiaries of the Registrant | |
| 23.1 | Consent of Baker Tilly Virchow Krause, LLP | |
| 31.1 | Certification of Chief Executive Officer, pursuant to Rule 13a-14 and 15d-14 of the Securities Exchange Act of 1934. | |
| 31.2 | Certification of Chief Financial Officer, pursuant to Rule 13a-14 and 15d-14 of the Securities Exchange Act of 1934. | |
| 32.1 | Certification of Chief Executive Officer and Chief Financial Officer, pursuant to 18 U.S.C. Section 1350, as adopted pursuant to Section 906 of the Sarbanes-Oxley Act of 2002. | |
| 101.INS* | XBRL Instance Document | |
| 101.SCH* | XBRL Schema Document | |
| 101.CAL* | XBRL Calculation Linkbase Document | |
| 101.DEF* | XBRL Definition Linkbase Document | |
| 101.LAB* | XBRL Labels Linkbase Document | |
| 101.PRE* | XBRL Presentation Linkbase Document | |
| * | Pursuant to Rule 406T of Regulation S-T, the Interactive Data Files on Exhibit 101 hereto are deemed not filed or part of a registration statement or prospectus for purposes of Section 11 or 12 of the Securities Act of 1933, as amended, are deemed not filed for purposes of Section 18 of the Securities Exchange Act of 1934, as amended, and are otherwise not subject to liability under those sections. |
| ** | Indicates compensatory plan or agreement |
| 121 |
Pursuant to the requirements of the Securities Exchange Act of 1934, the registrant has duly caused this report to be signed on its behalf by the undersigned thereto duly authorized.
| ASPIRITY HOLDINGS, LLC | ||
| /S/ MARK A. COHN | ||
| Dated: April 15, 2016 | By: | Mark A. Cohn |
| President and Chief Executive Officer (principal executive officer) |
Pursuant to the requirements of the Securities Exchange Act of 1934, this report on Form 10-K has been signed below on the dates set forth by the following persons on behalf of the registrant and in the capacities indicated:
| /S/ TIMOTHY S. KRIEGER | ||
| Dated: April 15, 2016 | Timothy S. Krieger | |
| Chairman of the Board | ||
| /S/ MARK A. COHN | ||
| Dated: April 15, 2016 | Mark A. Cohn | |
| President, Chief Executive Officer, and Director (principal executive officer) | ||
| /S/ WILEY H. SHARP III | ||
| Dated: April 15, 2016 | Wiley H. Sharp III | |
| Vice President – Finance and Chief Financial Officer (principal accounting and financial officer) | ||
| /S/ WILLIAM M. GOBLIRSCH | ||
| Dated: April 15, 2016 | William M. Goblirsch | |
| Director | ||
| /S/ PAU W. HAGLUND | ||
| Dated: April 15, 2016 | Paul W. Haglund | |
| Director | ||
| /S/ DAVID B. JOHNSON | ||
| Dated: April 15, 2016 | David B. Johnson | |
| Director |
| 122 |