Attached files
UNITED STATES
SECURITIES AND EXCHANGE COMMISSION
WASHINGTON, D.C. 20549
FORM 10-K
x ANNUAL REPORT PURSUANT TO SECTION 13
OR 15(d) OF THE SECURITIES EXCHANGE ACT OF 1934
For the fiscal year ended December 31, 2015
Commission File No. 0-17973
HERITAGE GLOBAL INC.
(Exact Name of Registrant as Specified in Its Charter)
|
Florida |
59-2291344 |
|
(State or Other Jurisdiction of Incorporation or Organization) |
(I.R.S. Employer Identification No.) |
|
|
|
|
12625 High Bluff Drive, Suite 305, San Diego, CA |
92130 |
|
(Address of Principal Executive Offices) |
(Zip Code) |
(858) 847-0656
(Registrant’s Telephone Number, Including Area Code)
Securities registered pursuant to Section 12(b) of the Act: None.
Securities registered pursuant to Section 12(g) of the Act: Common Stock, $0.01 par value.
Indicate by check mark if the registrant is a well-known seasoned issuer, as defined in Rule 405 of the Securities Act. Yes o No x
Indicate by check mark if the registrant is not required to file reports pursuant to Section 13 or Section 15(d) of the Act. Yes o No x
Indicate by check mark whether the registrant (1) has filed all reports required to be filed by Section 13 or 15(d) of the Securities Exchange Act of 1934 during the preceding 12 months (or for such shorter period that the registrant was required to file such reports), and (2) has been subject to such filing requirements for the past 90 days. Yes x No o
Indicate by check mark whether the registrant has submitted electronically and posted on its corporate Web site, if any, every Interactive Data File required to be submitted and posted pursuant to Rule 405 of Regulation S-T during the preceding 12 months (or for such shorter period that the registrant was required to submit and post such files). Yes x No o
Indicate by check mark if disclosure of delinquent filers pursuant to Item 405 of Regulation S-K is not contained herein, and will not be contained, to the best of registrant’s knowledge, in definitive proxy or information statements incorporated by reference in Part III of this Form 10-K or any amendment to this Form 10-K. o
Indicate by check mark whether the registrant is a large accelerated filer, an accelerated filer, a non-accelerated filer, or a smaller reporting company (as defined in Rule 12b-2 of the Exchange Act).
|
Large Accelerated Filer o |
Accelerated Filer o |
Non-Accelerated Filer o |
Smaller Reporting Company x |
Indicate by check mark whether the registrant is a shell company (as defined in Rule 12b-2 of the Act). Yes o No x
The aggregate market value of Common Stock held by non-affiliates based upon the closing price of $0.30 per share on June 30, 2015, as reported by the OTCQB, was approximately $7.1 million.
As of March 11, 2016, there were 28,467,648 shares of Common Stock, $0.01 par value, outstanding.
|
|
|
PAGE |
|
|
PART I |
|||
|
Item 1. |
3 |
||
|
Item 1A. |
6 |
||
|
Item 1B. |
9 |
||
|
Item 2. |
9 |
||
|
Item 3. |
9 |
||
|
Item 4. |
9 |
||
|
|
|
|
|
|
PART II |
|||
|
Item 5. |
10 |
||
|
Item 6. |
11 |
||
|
Item 7. |
Management’s Discussion and Analysis of Financial Condition and Results of Operations. |
11 |
|
|
Item 7A. |
18 |
||
|
Item 8. |
18 |
||
|
Item 9. |
Changes In and Disagreements With Accountants on Accounting and Financial Disclosure. |
18 |
|
|
Item 9A. |
19 |
||
|
Item 9B. |
19 |
||
|
|
|
|
|
|
PART III |
|||
|
Item 10. |
20 |
||
|
Item 11. |
24 |
||
|
Item 12. |
Security Ownership of Certain Beneficial Owners and Management and Related Stockholder Matters. |
30 |
|
|
Item 13. |
Certain Relationships and Related Transactions, and Director Independence. |
32 |
|
|
Item 14. |
33 |
||
|
|
|
|
|
|
PART IV |
|||
|
Item 15. |
35 |
||
2
This Annual Report on Form 10-K (the “Report”) contains certain “forward-looking statements” that are based on management’s exercise of business judgment as well as assumptions made by, and information currently available to, management. When used in this document, the words “may,” "will,” “anticipate,” “believe,” “estimate,” “expect,” “intend,” and words of similar import, are intended to identify any forward-looking statements. You should not place undue reliance on these forward-looking statements. These statements reflect our current view of future events and are subject to certain risks and uncertainties, including those noted under Item 1A “Risk Factors” below. Should one or more of these risks or uncertainties materialize, or should underlying assumptions prove incorrect, our actual results could differ materially from those anticipated in these forward-looking statements. We undertake no obligation, and do not intend, to update, revise or otherwise publicly release any revisions to these forward-looking statements to reflect events or circumstances after the date hereof, or to reflect the occurrence of any unanticipated events. Although we believe that our expectations are based on reasonable assumptions, we can give no assurance that our expectations will materialize.
PART I
Overview, History and Recent Developments
Heritage Global Inc. (“HGI,” “we” or the “Company”) was incorporated in Florida in 1983 under the name “MedCross, Inc.” The Company’s name was changed to “I-Link Incorporated” in 1997, to “Acceris Communications Inc.” in 2003, to “C2 Global Technologies Inc.” in 2005, to “Counsel RB Capital Inc.” in 2011, and to Heritage Global Inc. effective August 22, 2013. The most recent name change more closely identifies the Company with its core auction business, Heritage Global Partners, Inc. (“HGP”).
On March 20, 2014, the Company’s former majority shareholder, Street Capital Group Inc. (formerly Counsel Corporation, herein referred to as “Street Capital”), declared a dividend of all of its shares of the Company. This dividend was paid on April 30, 2014 to Street Capital’s common shareholders of record as of April 1, 2014.
On June 2, 2014, and effective May 31, 2014, the Company acquired all of the issued and outstanding capital stock in National Loan Exchange, Inc. (“NLEX”), a broker of charged-off receivables in the United States and Canada. NLEX operates as a wholly owned division of the Company. The acquisition of NLEX is consistent with HGI’s strategy to expand the services provided by its asset liquidation business. In connection with the acquisition, HGI entered into employment agreements with the previous owner and key employees of NLEX. The purchase price consisted of $2.0 million cash and an earn-out provision (“contingent consideration”) with a cap of $5.0 million, based on the Net Profits (as defined by the NLEX stock purchase agreement) of NLEX during the four years following the acquisition. At December 31, 2015 the present value of the contingent consideration is estimated to be $3.5 million. See Note 3 to the consolidated financial statements for further information.
On March 11, 2016, the Company entered into a purchase and sale agreement with International Auto Processing Inc. (“IAP”) to sell the Company’s real estate inventory. The purchase price of the real estate inventory is $4.1 million. Concurrently, the Company entered into a five year lease agreement with an affiliate of IAP to lease the building during the escrow period, which will terminate at the close of escrow. The purchase agreement gives IAP the right to terminate its obligation to consummate the sale for any reason, but in the event the sale is not consummated, the lease agreement will continue on through the end of the lease term. The purchase and sale agreement is attached hereto as Exhibit 10.24, which exhibit is incorporated by reference herein.
3
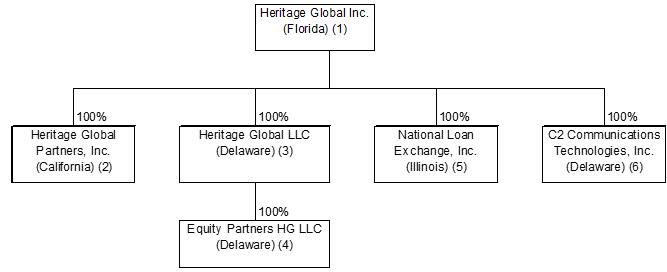
The organization chart on the following page outlines the basic corporate structure of the Company as of December 31, 2015.
|
(1) |
Registrant. |
|
(2) |
Full service global auction, appraisal and asset advisory company. |
|
(3) |
Asset liquidation company which acquires and monetizes distressed and surplus assets. |
|
(4) |
Mergers and acquisitions (M&A) advisory firm specializing in financially distressed companies and properties. |
|
(5) |
Broker of charged-off receivables. |
|
(6) |
Owns and licenses telecommunications patents. |
Asset liquidation
The Company is a value-driven, innovative leader in corporate and financial asset liquidation transactions, valuations and advisory services. The Company specializes both in acting as an adviser, as well as acquiring or brokering turnkey manufacturing facilities, surplus industrial machinery and equipment, industrial inventories, accounts receivable portfolios, intellectual property, and entire business enterprises.
The asset liquidation business began operations in 2009 with the establishment of Heritage Global LLC (“HG LLC”). In addition to acquiring turnkey manufacturing facilities and used industrial machinery and equipment, HG LLC arranges traditional asset disposition sales, including liquidation and auction sales. In 2011, HG LLC acquired 100% of the business of EP USA, LLC (d/b/a Equity Partners) (“Equity Partners”), thereby expanding the Company’s operations. Equity Partners is a boutique M&A advisory firm and provider of financial solutions for distressed businesses and properties.
In 2012 the Company increased its in-house asset liquidation expertise via its acquisition of 100% of the outstanding equity of Heritage Global Partners, Inc. (“HGP”), a global full-service auction, appraisal and asset advisory firm, and in 2012, the Company launched Heritage Global Partners Europe (“HGP Europe”). Through its wholly-owned subsidiary Heritage Global Partners UK Limited, the Company opened three European-based offices, one each in the United Kingdom, Germany and Spain.
In May 2014, the Company again expanded its asset liquidation operations with the acquisition of National Loan Exchange (‘NLEX”). NLEX is the largest volume broker of charged-off receivables in the United States and Canada, and its offerings include national, state and regional portfolios on behalf of many of the world’s top financial institutions. The NLEX acquisition is consistent with HGI’s strategy to expand and diversify the services provided by its asset liquidation business.
As a result of the events and acquisitions outlined above, management believes that HGI’s expanded global platform will allow the Company to achieve its long term industry leadership goals.
Intellectual property licensing
The Company holds several patents, including two that relate to Voice over Internet Protocol (“VoIP”). U.S. Patent No. 6,438,124 was developed by the Company, and encompasses the technology that allows two parties to converse phone-to-phone, regardless of
4
the distance, by transmitting voice/sound via the Internet. U.S. Patent No. 6,243,373 (the “VoIP Patent”) was purchased from a third party (the “Vendor”). These patents, together with related international patents and patent applications, form the Company’s international VoIP Patent Portfolio (the “Portfolio”) that covers the basic process and technology that enable VoIP communication as used in the market today. As part of the consideration for the acquisition of the VoIP Patent, the Vendor is entitled to receive 35% of the net earnings from the Portfolio. At this time, although the Company expects to continue to incur costs relating to maintaining ownership of these patents, it is not expected that either these costs or related revenue will be material.
Employees
As of December 31, 2015, HGI had 52 employees: 29 are employed by HGP, 15 by NLEX, and eight by Equity Partners. In addition, five employees of Street Capital provided management and administrative services to HGI during the first eight months of 2015 under the terms of a management services agreement (the “Services Agreement”) that is described in Item 13 of this Report and Note 14 to the consolidated financial statements. The Services Agreement was terminated effective August 31, 2015. Refer to Note 14 to the consolidated financial statements for more information.
Industry and Competition
The asset liquidation business consists primarily of the auction, appraisal and asset advisory services provided by HGP, mergers and acquisitions advisory services provided by Equity Partners, and the accounts receivable brokerage services provided by NLEX. It also includes the purchase and sale, including at auction, of industrial machinery and equipment, real estate, inventories, accounts receivable and distressed debt. The market for these services and assets is highly fragmented. To acquire auction or appraisal contracts, or assets for resale, HGI competes with other liquidators, auction companies, dealers and brokers. It also competes with them for potential purchasers, as well as with equipment manufacturers, distributors, dealers and equipment rental companies. Some competitors have significantly greater financial and marketing resources and name recognition.
HGI’s business strategy includes the option of partnering with one or more additional purchasers, pursuant to a partnership, joint venture or limited liability company agreement (collectively, “Joint Ventures”). These Joint Ventures give the Company access to more opportunities, helping to mitigate some of the competition from the market’s larger participants and contribute to the Company’s objective to be the leading resource for clients requiring capital asset solutions.
Government Regulation
We are subject to federal, state and local consumer protection laws, including laws protecting the privacy of customer non-public information and regulations prohibiting unfair and deceptive trade practices. Many jurisdictions also regulate "auctions" and "auctioneers" and may regulate online auction services. These consumer protection laws and regulations could result in substantial compliance costs and could interfere with the conduct of our business.
Legislation in the United States, including the Sarbanes-Oxley Act of 2002 and the Dodd-Frank Act of 2010, has increased public companies’ regulatory and compliance costs as well as the scope and cost of work provided by independent registered public accountants and legal advisors. The mandatory adoption of XBRL reporting in 2011 has also increased the Company’s costs paid to third party service providers. As regulatory and compliance guidelines continue to evolve, we expect to continue to incur costs, which may or may not be material, in order to comply with legislative requirements or rules, pronouncements and guidelines by regulatory bodies.
Available Information
HGI is subject to the informational requirements of the Securities Exchange Act of 1934, as amended (the “Exchange Act”), which requires that HGI file periodic reports, and other information with the SEC. The SEC maintains a website at http://www.sec.gov that contains periodic reports, proxy and information statements, and other information regarding issuers, including HGI, which file electronically with the SEC. In addition, HGI’s Exchange Act filings may be viewed at the SEC’s Public Reference Room at 100 F Street, NE, Washington, D.C. 20549. The public may obtain information on the operation of the Public Reference Room by calling the SEC at 1-800-SEC-0330. The Company makes available free of charge through its web site, http://www.heritageglobalinc.com (follow Investor Relations tab to link to “SEC Filings”) its Annual Report on Form 10-K, Quarterly Reports on Form 10-Q, Current Reports on Form 8-K and amendments to those reports filed or furnished pursuant to Section 13(a) or 15(d) of the Exchange Act as soon as reasonably practicable after such material has been electronically filed with, or furnished to, the SEC. The information on the Company’s corporate website is not a part of this Annual Report on Form 10-K.
5
You should carefully consider and evaluate these risk factors, as any of them could materially and adversely affect our business, financial condition and results of operations, which, in turn, can adversely affect the price of our securities.
We face significant competition in our asset liquidation business.
Our asset liquidation business depends on our ability to successfully obtain a continuous supply of auction or appraisal contracts, or distressed and surplus assets for profitable resale to third parties. In this regard, we compete with numerous other organizations, some of which are much larger and better-capitalized, with greater resources available for both asset acquisition and associated marketing to potential customers. Additionally, some competitors have a longer history of activity in the asset liquidation business, and may have advantages with respect to accessing both deals and capital.
Our asset liquidation business is subject to inventory risk and credit risk.
Under our business model, when not acting solely as an auctioneer, we assume the general and physical inventory and credit risks associated with purchasing assets for subsequent resale. Although we do enter into transactions for which a subsequent purchaser has already been identified, in most cases we purchase assets and assume the risk that they may sell for less than our forecasted price. As well, we may miscalculate demand or resale value, and subsequently sell the assets for less than their original purchase price. Either situation could have a material adverse effect upon our use of working capital and our results of operations.
Our operating results are subject to significant fluctuation.
Our revenue and operating results are subject to fluctuation from quarter to quarter and from year to year due to the nature of the asset liquidation business, which involves discrete deals of varying size that are very difficult to predict. The timing of revenue recognition related to significant transactions can materially affect quarterly and annual operating results. Despite the accompanying variability of direct asset liquidation costs, quarterly fixed costs that are largely composed of salaries and benefits could exceed our gross profit. There can therefore be no assurance that we can achieve or sustain profitability on a quarterly or annual basis.
We are subject to the risks associated with managing growth.
Since the establishment of our asset liquidation business in 2009, we have experienced significant growth. This has occurred through the acquisitions of Equity Partners in 2011, HGP in 2012 and NLEX in 2014, as well as through the expansion of our operations to Europe during 2012. This growth requires an increased investment in personnel, systems and facilities. In the absence of continued revenue growth, the Company’s operating margins could decline from current levels. Additional acquisitions will be accompanied by such risks as exposure to unknown liabilities of acquired businesses, unexpected acquisition expenses, greater than anticipated investments in personnel, systems and facilities, the expense of integrating new and existing operations, diversion of senior management resources, and dilution to existing shareholders. Failure to anticipate and manage these risks could have a material adverse effect upon our business and results of operations.
A portion of our asset liquidation business is conducted through Joint Ventures.
Conducting business through Joint Ventures, as described above under “Industry and Competition,” allows us to participate in significantly larger deals than those we could fund independently. If we ceased entering into Joint Ventures, or our Joint Venture partners decide not to partner with us, the pool of potential transactions would be reduced. Further, upon entering into Joint Ventures, we become exposed to the uncertainties of the activities of our partners. This could negatively impact our ability to obtain a continuous supply of assets for resale, and could have a material adverse effect upon our use of working capital and our results of operations.
We are subject to foreign currency exchange rate risk.
During 2012, we expanded our operations to the United Kingdom (“UK”), Spain, and Germany. Our UK operations are conducted in pounds sterling (£) and our Spain and Germany operations are conducted in euros (€), rather than in U.S. dollars. To date we have been required to use funds generated by our US operations to meet a portion of European obligations as they come due. We thereby incur exchange rate risk. We conduct some of our asset liquidation transactions in currencies other than the U.S. dollar, which exposes us to foreign exchange risk. Although this risk has not had a material impact on our business and operations to date, failure to anticipate and continue to manage this risk could have a material adverse effect.
6
The auction portion of our asset liquidation business may be subject to a variety of additional costly government regulations.
Many states and other jurisdictions have regulations governing the conduct of traditional “auctions” and the liability of traditional “auctioneers” in conducting auctions, which may also apply to online auction services. In addition, certain states have laws or regulations that expressly apply to online auction services. We expect to continue to incur costs in complying with these laws and could be subject to fines or other penalties for any failure to comply with these laws. We may be required to make changes in our business to comply with these laws, which could increase our costs, reduce our revenue, and cause us to prohibit the listing of certain items, or otherwise adversely affect our financial condition or operating results.
Certain categories of merchandise that we sell are subject to government restrictions.
We sell merchandise, such as scientific instruments, that is subject to export control and economic sanctions laws, among other laws, imposed by the United States and other governments. Such restrictions include the U.S. Export Administration regulations, the International Traffic in Arms regulations, and economic sanctions and embargo laws administered by the Office of the Foreign Assets Control regulations. These restrictions prohibit us from, among other things, selling property to (1) persons or entities that appear on lists of restricted or prohibited parties maintained by the United States or other governments or (2) countries, regimes, or nationals that are the target of applicable economic sanctions or other embargoes.
We may incur significant costs or be required to modify our business to comply with these requirements. If we are alleged to have violated any of these laws or regulations we may be subject to civil and criminal penalties and administrative sanctions, including termination of contracts, forfeiture of profits, suspension of payments, fines, and suspension or prohibition from doing business with U.S. federal government agencies. In addition, we could suffer serious harm to our reputation if allegations of impropriety are made against us, whether or not true.
We are subject to the U.S. Foreign Corrupt Practices Act (“FCPA”).
We are subject to the FCPA, which generally prohibits U.S. companies and their intermediaries from making improper payments to foreign officials for the purpose of obtaining or retaining business. Our 2012 expansion into Europe has increased the risk of non-compliance with the FCPA. Failure to comply with the FCPA could subject the Company to, among other things, penalties and legal expenses that could harm our reputation and have a material adverse effect on our business, financial condition and results of operations.
Our asset liquidation business is subject to environmental risk.
Our asset liquidation business at times includes the purchase and resale of buildings and land. Although our purchase process includes due diligence to determine that there are no material adverse environmental issues, it is possible that such issues could be discovered subsequent to a completed purchase. Any remediation and related costs could have a material adverse effect upon our business and results of operations.
We are dependent upon key personnel.
Our operations are substantially dependent on the knowledge, skills and performance of several of our executive officers, particularly our Chief Executive Officer and Chief Operating Officer/President, President of NLEX, and Senior Managing Director of Equity Partners. The loss of any of these officers could damage key relationships and result in the loss of essential information and expertise. As our operations expand, we will be required to hire additional employees, and may face competition for them. Therefore, either the loss of the services of the above existing officers, or the inability to attract and retain appropriately skilled new employees, could have a material adverse effect upon our business and results of operations.
We may require additional financing in the future, which may not be available, or may not be available on favorable terms.
We may need additional funds to finance the operations of our asset liquidation business, to make additional investments, or to acquire complementary businesses or assets. We may be unable to generate these funds from our operations. If funds are not available, or not available on acceptable terms, we could experience a material adverse effect upon our business.
Provisions in our Articles of Incorporation, as amended, could prevent or delay stockholders' attempts to replace or remove current management.
Our Articles of Incorporation, as amended, provide for staggered terms for the members of our Board. The Board is divided into three staggered classes, and each director serves a term of three years. At an annual stockholders’ meeting, only those directors comprising one of the three classes will have completed their term and stand for re-election or replacement. These provisions may
7
tend to preserve our current management and the Board in a hostile tender offer, and may have an adverse impact on stockholders who may want to participate in such a tender offer, or who may want to replace some or all of the members of the Board.
Our Board of Directors may issue additional shares of preferred stock without stockholder approval.
Our Articles of Incorporation, as amended, authorize the issuance of up to 10,000,000 shares of preferred stock, $10.00 par value per share. The Board is authorized to determine the rights and preferences of any additional series or class of preferred stock. The Board may, without stockholder approval, issue shares of preferred stock with dividend, liquidation, conversion, voting or other rights that are senior to our shares of common stock or that could adversely affect the voting power or other rights of the existing holders of outstanding shares of preferred stock or common stock. The issuance of additional shares of preferred stock may also hamper or discourage an acquisition or change in control of HGI.
We may conduct future offerings of our common stock and preferred stock and pay debt obligations with our common and preferred stock that may diminish our investors’ pro rata ownership and depress our stock price.
We reserve the right to make future offers and sales, either public or private, of our securities including shares of our preferred stock, common stock or securities convertible into common stock at prices differing from the price of the common stock previously issued. In the event that any such future sales of securities are affected or we use our common or preferred stock to pay principal or interest on our debt obligations, an investor’s pro rata ownership interest may be reduced to the extent of any such issuances and, to the extent that any such sales are effected at consideration which is less than that paid by the investor, the investor may experience dilution and a diminution in the market price of the common stock.
There is a limited public trading market for our common stock; the market price of our common stock has been volatile and could experience substantial fluctuations.
Our common stock is currently traded in the OTC market in the United States and has a limited public trading market in the United States. Our common stock is traded on the Canadian Securities Exchange, and the market there is similarly limited. Without an active trading market, there can be no assurance regarding the liquidity or resale value of the common stock. In addition, the market price of our common stock has been, and may continue to be, volatile. Such price fluctuations may be affected by general market price movements or by reasons unrelated to our operating performance or prospects such as, among other things, announcements concerning us or our competitors, technological innovations, government regulations, and litigation concerning proprietary rights or other matters.
We may not be able to utilize income tax loss carryforwards.
Restrictions in our ability to utilize income tax loss carry forwards have occurred in the past due to the application of certain changes in ownership tax rules in the United States. There is no certainty that the application of these rules may not recur. In addition, further restrictions of, reductions in, or expiration of net operating loss and net capital loss carry forwards may occur through future merger, acquisition and/or disposition transactions or through failure to continue a significant level of business activities. Any such additional limitations could require us to pay income taxes in the future and record an income tax expense to the extent of such liability. We could be liable for income taxes on an overall basis while having unutilized tax loss carry forwards since these losses may be applicable to one jurisdiction and/or particular line of business while earnings may be applicable to a different jurisdiction and/or line of business. Additionally, income tax loss carry forwards may expire before we have the ability to utilize such losses in a particular jurisdiction and there is no certainty that current income tax rates will remain in effect at the time when we have the opportunity to utilize reported tax loss carry forwards.
We have not declared any dividends on our common stock to date and have no expectation of doing so in the foreseeable future.
The payment of cash dividends on our common stock rests within the discretion of our Board of Directors and will depend, among other things, upon our earnings, unencumbered cash, capital requirements and our financial condition, as well as other relevant factors. To date, we have not paid dividends on our common stock nor do we anticipate that we will pay dividends in the foreseeable future. As of December 31, 2015, we do not have any preferred stock outstanding that has any preferential dividends.
We may fail to either adequately protect our proprietary technology and processes, or enforce our intellectual property rights.
The Company’s VoIP Patent Portfolio consists of United States Patents No. 6,243,373 and No. 6,438,124. The ultimate value of these patents has yet to be determined. If we fail to obtain or maintain adequate protections, or are unsuccessful in enforcing our patent rights, we may not be able to either realize additional value from our patents, or prevent third parties from benefiting from those patents without benefit to the Company. Any currently pending or future patent applications may not result in issued patents. In
8
addition, any issued patents may not have priority over any patent applications of others or may not contain claims sufficiently broad to protect us against third parties with similar technologies, products or processes. In addition, the Company’s existing patents have finite lives (although they may be extended by filing continuations and/or divisional applications), most of which expire over the next three years. There is no guarantee that they will be fully exploited or commercialized before expiration.
Item 1B. Unresolved Staff Comments
Not applicable.
The Company, in connection with its asset liquidation business, leases or rents office space in several locations in the U.S. The principal locations are San Diego, CA and Foster City, CA, which are related to HGP’s operations, and Edwardsville, IL, which is related to NLEX’s operations. The Company also maintains offices in Scottsdale, AZ; Farmington Hills, MI; Marietta, GA and Easton, MD. The Foster City and Edwardsville offices are leased from related parties, as discussed in Note 14 to the consolidated financial statements.
The Company is involved in various legal matters arising out of its operations in the normal course of business, none of which are expected, individually or in the aggregate, to have a material adverse effect on the Company. Refer to Note 15 to the consolidated financial statements for further detail.
Item 4. Mine Safety Disclosures.
None.
9
PART II
Item 5. Market for Registrant’s Common Equity, Related Stockholder Matters and Issuer Purchases of Equity Securities.
Market Information
Shares of our common stock, $0.01 par value per share, are quoted under the symbol “HGBL” in the OTC market (“OTCQB”), and under the symbol “HGP” on the Canadian Securities Exchange (“CSE”).
The following table sets forth the high and low prices for our common stock, as quoted on the OTCQB, for the calendar quarters from January 1, 2014 through December 31, 2015, based on inter-dealer quotations, without retail mark-up, mark-down or commissions. These prices may not represent actual transactions, and are quoted in U.S. dollars:
|
Quarter Ended |
|
High |
|
|
Low |
|
||
|
March 31, 2014 |
|
$ |
0.74 |
|
|
$ |
0.31 |
|
|
June 30, 2014 |
|
|
0.80 |
|
|
|
0.27 |
|
|
September 30, 2014 |
|
|
0.50 |
|
|
|
0.26 |
|
|
December 31, 2014 |
|
|
0.44 |
|
|
|
0.15 |
|
|
|
|
|
|
|
|
|
|
|
|
March 31, 2015 |
|
$ |
0.47 |
|
|
$ |
0.05 |
|
|
June 30, 2015 |
|
|
0.51 |
|
|
|
0.17 |
|
|
September 30, 2015 |
|
|
0.35 |
|
|
|
0.15 |
|
|
December 31, 2015 |
|
|
0.26 |
|
|
|
0.11 |
|
On March 11, 2016, the closing price for a share of the Company’s common stock as quoted on the OTCQB was $0.28.
The following table sets forth the high and low prices for our common stock, as quoted on the CSE, for the calendar quarters from January 1, 2014 through December 31, 2015, based on inter-dealer quotations, without retail mark-up, mark-down or commissions. These prices may not represent actual transactions, and are quoted in Canadian dollars:
|
Quarter Ended |
|
High |
|
|
Low |
|
||
|
March 31, 2014 |
(1) |
N/A |
|
(1) |
N/A |
|
||
|
June 30, 2014 |
|
$ |
0.80 |
|
|
$ |
0.25 |
|
|
September 30, 2014 |
|
|
0.48 |
|
|
|
0.27 |
|
|
December 31, 2014 |
|
|
0.41 |
|
|
|
0.20 |
|
|
|
|
|
|
|
|
|
|
|
|
March 31, 2015 |
|
$ |
0.50 |
|
|
$ |
0.20 |
|
|
June 30, 2015 |
|
|
0.42 |
|
|
|
0.20 |
|
|
September 30, 2015 |
|
|
0.33 |
|
|
|
0.17 |
|
|
December 31, 2015 |
|
|
0.25 |
|
|
|
0.15 |
|
|
|
(1) |
The Company was not listed on the CSE until the second quarter of 2014, following the disposition by Street Capital. Refer to Item 13 and Note 14 to the consolidated financial statements for further detail on the disposition. |
On March 11, 2016, the closing price for a share of the Company’s common stock as quoted on the CSE was Canadian $0.22.
Holders
As of March 11, 2016, the Company had approximately 421 holders of common stock of record.
Dividends
To date, we have not paid dividends on our common stock nor do we anticipate that we will pay dividends in the foreseeable future. As of December 31, 2015, we do not have any preferred stock outstanding which has any preferential dividends.
Recent Sales of Unregistered Securities; Use of Proceeds from Registered Securities.
On November 1, 2014 the Company granted restricted stock awards for 300,000 shares to two key employees (150,000 each) as part of their employment agreements. The shares were restricted only by the continued employment of the individuals.
10
Issuer Purchases of Equity Securities.
None.
Item 6. Selected Financial Data.
As a Smaller Reporting Company, we are electing scaled reporting obligations and therefore are not required to provide the information requested by this Item.
Item 7. Management’s Discussion and Analysis of Financial Condition and Results of Operations.
The following discussion and analysis should be read in conjunction with our Consolidated Financial Statements and Notes thereto, included in Item 15 of this Report. Our accounting policies have the potential to have a significant impact on our financial statements, either because of the significance of the financial statement item to which they relate, or because they require judgment and estimation due to the uncertainty involved in measuring, at a specific point in time, events that are continuous in nature.
Business Overview, Recent Developments and Outlook
Please see Item 1, above, of this Report for an overview of the Company’s business and recent developments. Please see Item 1A, above, for a discussion of the risk factors that may impact the Company’s current and future operations, and financial condition.
Liquidity and Capital Resources
Liquidity
At December 31, 2015 the Company had a working capital deficit of $5.1 million, as compared to a working capital deficit of $4.0 million at December 31, 2014, an increased deficit of $1.1 million. The Company’s current assets decreased to $4.3 million compared to $7.6 million at December 31, 2014, however the current liabilities also decreased to $9.4 million compared to $11.5 million at December 31, 2014. Within current assets, the most significant change was a decrease of $2.2 million in accounts receivable, the cash from which was used to pay down balances on the related party loan to Street Capital (the “Street Capital Loan”). The significant movements in current liabilities were: the line of credit with a balance of $0.5 million at December 31, 2014 was paid off and terminated during 2015, and the Street Capital Loan was reduced by $1.3 million during 2015.
The Company believes it can fund its operations and address the working capital deficit, through a combination of its on-going asset liquidation operations, sale of its real estate inventory, accessing new financing from related parties and flexibility on the timing of the repayment of its existing debt obligations with its related party creditor and third party creditor.
The Company’s current debt consists of the “Street Capital Loan”. At December 31, 2015, the third party debt had an outstanding balance of $2.5 million, however consistent with the prior year the outstanding balance was classified as non-current as the maturity date was extended to January 2017. The Street Capital Loan is with the Company’s former majority shareholder, Street Capital, and has fluctuated over time. At December 31, 2015 it had an outstanding balance of $1.7 million as compared to $3.0 million at December 31, 2014.
During 2015, the Company’s primary sources of cash were the operations of its asset liquidation business, cash receipts of $3.5 million related to its equity method investments (including receipt of proceeds of $2.0 million from the sale of the Company’s investment in Polaroid in 2014), and advances of $0.8 million under the Street Capital Loan. Cash disbursements, other than those related to debt repayment of $2.9 million ($0.5 million to third parties and $2.4 million under the Street Capital Loan), were primarily related to operating expenses. Additionally, the Company made its first payment of the contingent consideration owed to the former owner (and current president) of NLEX in the amount of $0.5 million during 2015.
The Company has historically classified both real estate inventory and asset liquidation related equity method investments as non-current, although they are expected to be converted to cash within a year. At December 31, 2015 and 2014, these assets totaled approximately $3.7 million and $7.5 million, respectively.
The Company expects that its asset liquidation business will continue to be the primary source of cash required for ongoing operations for the foreseeable future.
11
Ownership Structure and Capital Resources
|
|
· |
At December 31, 2015 the Company had stockholders’ equity of $3.4 million, as compared to $13.5 million at December 31, 2014. The decrease in the stockholders’ equity was primarily the result of the Company’s $10.4 million net loss for the year-ended December 31, 2015. |
|
|
· |
In 2013, Street Capital, the Company’s former majority shareholder, announced that its Board of Directors had approved a plan to focus Street Capital’s operations on its core business, mortgage lending, and therefore to dispose of its other operating segments, including its interest in HGI. On March 20, 2014, Street Capital declared a dividend of all of its shares of the Company. This dividend was paid on April 30, 2014 to Street Capital’s common shareholders of record as of April 1, 2014. On May 1, 2014, HGI and Street Capital entered into a management services agreement (the “Services Agreement”) under which Street Capital continued to provide management and other services to HGI until the Services Agreement was terminated effective August 31, 2015. For more detail regarding the Services Agreement, see Note 14 to the consolidated financial statements. |
|
|
· |
The Company determines its future capital and operating requirements based upon its current and projected operating performance and the extent of its contractual commitments. The Company expects to be able to finance its future operations through a combination of its asset liquidation business and securing additional debt financing. The Company’s contractual requirements are limited to the outstanding loans and lease commitments with related and unrelated parties. Capital requirements are generally limited to the Company’s purchases of surplus and distressed assets. The Company believes that its current capital resources are sufficient for these requirements. In the event additional capital is needed, the Company believes it can obtain additional debt financing through either related party loans or through a new credit facility. |
Cash Position and Cash Flows
Cash and cash equivalents at December 31, 2015 were $2.8 million compared to $3.6 million at December 31, 2014.
Cash used in operating activities. Cash used in operating activities was $0.8 million during 2015 as compared to $0.6 million cash provided during 2014, which represents an approximate $1.4 million change in operating cash flows between the two years. The $1.4 million change was primarily attributed to the following: the net loss adjusted for noncash items was $0.6 million greater in 2015 compared to 2014 as a result of some general under performance of our asset liquidation business (with the exception of NLEX) during 2015; we generated $0.3 million less of return on investment in equity method investments in 2015 compared to 2014, and we had a net unfavorable change of $0.5 million in the operating assets and liabilities in 2015 compared to 2014. The significant noncash items in 2015 included a $5.4 million impairment of goodwill and intangible assets charge and a $2.7 million real estate inventory write-down charge; whereas the most significant noncash item in 2014 was a $24.7 million income tax expense relating primarily to recording a valuation allowance against our deferred tax assets.
The significant changes in operating assets and liabilities during 2015 as compared to 2014 are primarily due to the nature of the Company’s operations. The Company earns revenue from discrete asset liquidation deals that vary considerably with respect to their magnitude and timing, and that can consist of fees, commissions, asset sale proceeds, or a combination of these. The operating assets and liabilities associated with these deals are therefore subject to the same variability and can be quite different at the end of any given period.
Cash provided by or used in investing activities. Cash provided by investing activities during 2015 was $2.7 million, as compared to $1.5 million cash used during 2014. The 2015 activity consisted primarily of the following cash receipts related to the Company’s equity method investments: $2.0 million of proceeds from the Company’s December 2014 exit from its investment in Polaroid (received in 2015), and $0.9 million of distributions from the Company’s other equity method investments. In 2014 the most significant items were the net $1.4 million cash paid to acquire NLEX and $0.6 million of investments in equity method investments.
Cash used in or provided by financing activities. Cash used in financing activities was $2.7 million during 2015, as compared to $1.3 million cash provided during 2014. The 2015 activity consisted of net $1.6 million of debt repaid to Street Capital, $0.5 million of debt repaid on our credit facility that we terminated in 2015, and $0.5 million of contingent consideration paid to the former owner (and current president) of NLEX. In 2014, the Company received $1.6 million (net of repayments) as loans from third parties, primarily used for the purchase of NLEX.
12
Management’s Discussion of Results of Operations
The following table summarizes our consolidated results of operations for 2015 and 2014 (in thousands).
|
|
|
Year ended December 31, |
|
|||||
|
|
|
2015 |
|
|
2014 |
|
||
|
Revenues: |
|
|
|
|
|
|
|
|
|
Services revenue |
|
$ |
13,485 |
|
|
$ |
13,270 |
|
|
Asset sales |
|
|
3,946 |
|
|
|
6,716 |
|
|
Total revenue |
|
|
17,431 |
|
|
|
19,986 |
|
|
Operating costs and expenses: |
|
|
|
|
|
|
|
|
|
Cost of services revenue |
|
|
3,125 |
|
|
|
4,882 |
|
|
Cost of asset sales |
|
|
3,412 |
|
|
|
5,398 |
|
|
Real estate inventory write-down |
|
|
2,748 |
|
|
|
- |
|
|
Selling, general and administrative |
|
|
12,774 |
|
|
|
11,183 |
|
|
Depreciation and amortization |
|
|
575 |
|
|
|
566 |
|
|
Impairment of goodwill and intangible assets |
|
|
5,437 |
|
|
|
- |
|
|
Total operating costs and expenses |
|
|
28,071 |
|
|
|
22,029 |
|
|
Earnings of equity method investments |
|
|
286 |
|
|
|
143 |
|
|
Operating loss |
|
|
(10,354 |
) |
|
|
(1,900 |
) |
|
Other income |
|
|
297 |
|
|
|
603 |
|
|
Interest expense |
|
|
(349 |
) |
|
|
(495 |
) |
|
Loss before income tax expense |
|
|
(10,406 |
) |
|
|
(1,792 |
) |
|
Income tax expense |
|
|
15 |
|
|
|
24,722 |
|
|
Net loss |
|
$ |
(10,421 |
) |
|
$ |
(26,514 |
) |
The Company’s asset liquidation revenue has several components: (1) traditional fee based asset disposition services, such as commissions from on-line and webcast auctions, liquidations and negotiated sales, and commissions from the NLEX charged-off receivables business, (2) the acquisition and subsequent disposition of distressed and surplus assets, including industrial machinery and equipment and real estate, and (3) fees earned for appraisal and management advisory services. The Company also earns income from its asset liquidation business through its earnings from equity method investments.
2015 Compared to 2014
Revenues and cost of revenues - Revenues were $17.4 million in 2015 compared to $20.0 million in 2014, costs of services revenue and asset sales were $6.5 million in 2015 compared to $10.3 million in 2014, and earnings of equity method investments were $0.3 million in 2015 compared to $0.1 million in 2014. The gross profits of these three items were therefore $11.2 million in 2015 compared to $9.9 million in 2014, an increase of approximately $1.3 million or approximately 14%. Because the Company conducts its asset liquidation operations both independently and through partnerships, and the ratio of the two is unlikely to remain constant in each period, the operations must be considered as a whole rather than on a line-by-line basis. The increased gross profit in the current year reflects the vagaries of the timing of asset liquidation transactions as well as the inclusion of a full year of NLEX gross profit as compared to only seven months of gross profit in 2014. NLEX generated $4.5 million of gross profit in 2015 as compared to $2.1 million of gross profit in 2014.
Real estate inventory write-down - The Company recorded a $2.7 million real estate inventory write-down charge during 2015. No charge was taken in the comparable 2014 period. The write-down represented a net realizable value adjustment to the carrying value of the Company’s real estate inventory and was triggered by the Company’s decision to list the property for sale at a much lower price than which it had previously been listed.
Selling, general and administrative expense – Selling, general and administrative expense, including expenses paid to related parties, was $12.8 million in 2015 as compared to $11.2 million in 2014, an increase of $1.6 million or 14%. Expenses increased overall primarily due to the inclusion of NLEX expenses of $2.8 million for the entire year in 2015, compared to only $1.4 million for the seven month period from acquisition in June 2014 through the end of the year. The Company’s personnel expense also contributed to the increase, as we increased the headcount in our asset liquidation businesses to promote operational growth.
13
Significant components of selling, general and administrative expense were as shown below (dollars in thousands):
|
|
|
Year ended December 31, |
|
|
|
|
|
|||||
|
|
|
2015 |
|
|
2014 |
|
|
% change |
|
|||
|
Compensation: |
|
|
|
|
|
|
|
|
|
|
|
|
|
HGP |
|
$ |
4,233 |
|
|
$ |
3,935 |
|
|
|
8 |
% |
|
Equity Partners |
|
|
1,617 |
|
|
|
1,702 |
|
|
|
-5 |
% |
|
NLEX |
|
|
2,155 |
|
|
|
1,205 |
|
|
|
79 |
% |
|
Former President’s salary |
|
|
138 |
|
|
|
138 |
|
|
|
0 |
% |
|
Stock-based compensation |
|
|
358 |
|
|
|
484 |
|
|
|
-26 |
% |
|
|
|
|
|
|
|
|
|
|
|
|
|
|
|
Legal |
|
|
219 |
|
|
|
268 |
|
|
|
-18 |
% |
|
Consulting |
|
|
553 |
|
|
|
507 |
|
|
|
9 |
% |
|
Street Capital management fees |
|
|
240 |
|
|
|
360 |
|
|
|
-33 |
% |
|
Accounting and tax consulting |
|
|
190 |
|
|
|
323 |
|
|
|
-41 |
% |
|
Insurance |
|
|
233 |
|
|
|
162 |
|
|
|
44 |
% |
|
Occupancy |
|
|
611 |
|
|
|
370 |
|
|
|
65 |
% |
|
Travel and entertainment |
|
|
875 |
|
|
|
717 |
|
|
|
22 |
% |
|
Advertising and promotion |
|
|
408 |
|
|
|
360 |
|
|
|
13 |
% |
|
Other |
|
|
944 |
|
|
|
652 |
|
|
|
45 |
% |
|
Total selling, general and administrative expense |
|
$ |
12,774 |
|
|
$ |
11,183 |
|
|
|
|
|
Depreciation and amortization expense – Depreciation and amortization expense was $0.6 million in both 2015 and 2014. The increased amortization from a full year of expense on the NLEX intangible assets acquired in the second quarter of 2014 was offset by a reduction to the amortization on the HGP customer network resulting from the reduction in carrying value subsequent to the impairment charge at the beginning of the fourth quarter of 2015. In both years the depreciation of property and equipment was not material.
Impairment of goodwill and intangible assets – The Company recorded an impairment charge of $5.4 million to reduce the carrying value of the goodwill and customer network, which resulted from the acquisition of HGP in 2012, to their respective fair values as of October 1, 2015 (the date at which the Company tested its goodwill and intangibles for impairment). There was no such similar charge in 2014. The sustained losses incurred by the Company, and the qualitative and quantitative review of the HGP reporting unit, led to the impairment charge in the fourth quarter of 2015. Refer to Note 8 to the consolidated financial statements for further detail.
Other income – The significant items within other income included the following: In 2014, the Company recorded $0.6 million as its gain on the sale of its investment in Polaroid. There were no similar transactions in 2015. In 2014, the Company recorded $0.3 million as its share of income from its other equity accounted investments. Income from these other equity accounted investments was not material in 2015. In 2015 the Company recorded other income of $0.2 million related to the mark-to-market revaluation of the NLEX contingent consideration. In 2014 the mark-to-market revaluation resulted in other expense of $0.2 million.
Off-Balance Sheet Arrangements – The Company had no off balance sheet arrangements during the years ended December 31, 2015 and 2014.
Future Accounting Pronouncements
In May 2014, the Financial Accounting Standards Board (“FASB”) issued Accounting Standards update 2014-09, Revenue from Contracts with Customers (“ASU 2014-09”). ASU 2014-09 specifies a comprehensive model to be used in accounting for revenue arising from contracts with customers, and supersedes most of the current revenue recognition guidance, including industry-specific guidance. It applies to all contracts with customers except those that are specifically within the scope of other FASB topics, and certain of its provisions also apply to transfers of nonfinancial assets, including in-substance nonfinancial assets that are not an output of an entity’s ordinary activities. The core principal of the model is that revenue is recognized to depict the transfer of goods or services to customers in an amount that reflects the consideration to which the transferring entity expects to be entitled in exchange. To apply the revenue model, an entity will: 1) identify the contract(s) with a customer, 2) identify the performance obligations in the contract, 3) determine the transaction price, 4) allocate the transaction price to the performance obligations in the contract, and 5)
14
recognize revenue when (or as) the entity satisfies a performance obligation. For public companies, ASU 2014-09 is effective for annual reporting periods (including interim reporting periods within those periods) beginning after December 15, 2017. Early adoption is not permitted. Upon adoption, entities can choose to use either a full retrospective or modified approach, as outlined in ASU 2014-09. As compared with current Generally Accepted Accounting Principles (“GAAP”), ASU 2014-09 requires significantly more disclosures about revenue recognition. The Company has not yet assessed the potential impact of ASU 2014-09 on its consolidated financial statements.
In August 2014, the FASB issued Accounting Standards update 2014-15, Disclosure of Uncertainties About an Entity’s Ability to Continue as a Going Concern (“ASU 2014-15”). ASU 2014-15 requires management to determine whether substantial doubt exists regarding the entity’s going concern presumption, which generally refers to an entity’s ability to meet its obligations as they become due, and provides guidance on determining when and how to disclose going-concern uncertainties in an entity’s financial statements. It requires management to perform both interim and annual assessments of an entity’s ability to continue as a going concern within one year of the date the financial statements are issued. The ASU contains guidance on 1) how to perform a going-concern assessment, and 2) when to provide going-concern disclosures. An entity must provide specified disclosures if conditions or events raise substantial doubt about its ability to continue as a going concern. ASU 2014-15 applies to all entities and is effective for annual periods ending after December 15, 2016, and interim periods thereafter, with early adoption permitted. The Company has not yet adopted ASU 2014-15 nor assessed its potential impact on its disclosures.
In January 2015, the FASB issued Accounting Standards update 2015-01, Simplifying Income Statement Presentation by Eliminating the Concept of Extraordinary Items (“ASU 2015-01”). ASU 2015-01 eliminates the requirement for entities to consider whether an underlying event or transaction is extraordinary, and, if so, to separately present the item in the income statement net of tax, after income from continuing operations. Instead, items that are both unusual and infrequent should be separately presented as a component of income from continuing operations, or be disclosed in the notes to the financial statements. ASU 2015-01 will be effective for all entities for fiscal years, and interim periods within those fiscal years, beginning after December 31, 2015. Early adoption is permitted provided that the new standard is applied from the beginning of the fiscal year of adoption. The Company has not historically reported extraordinary items in its consolidated financial statements, and is not aware of any pending transactions or events that might have required reporting as extraordinary items, and therefore does not expect the adoption of ASU 2015-01 to have a material impact on its consolidated financial statements.
In March 2015, the FASB issued Accounting Standards update 2015-02, Amendments to the Consolidation Analysis (“ASU 2015-02”). ASU 2015-02 eliminates entity specific consolidation guidance for limited partnerships, and revises other aspects of the consolidation analysis, but does not change the existing consolidation guidance for corporations that are not variable interest entities (“VIEs”). For public business entities, ASU 2015-02 will be effective for fiscal years, and interim periods within those fiscal years, beginning after December 15, 2015, with early adoption permitted. The Company does not believe that ASU 2015-02 will have a material impact on its consolidated financial statements.
In April 2015, the FASB issued Accounting Standards update 2015-03, Simplifying the Presentation of Debt Issuance Costs (“ASU 2015-03”). ASU 2015-03 changes the presentation of debt issuance costs in financial statements, by requiring them to be presented in the balance sheet as a direct deduction from the related debt liability, rather than as an asset. Amortization of the costs is reported as interest expense. There is no change to the current guidance on the recognition and measurement of debt issuance costs. For public business entities, ASU 2015-03 will be effective for fiscal years, and interim periods within those fiscal years, beginning after December 15, 2015, with early adoption permitted. The Company does not believe that ASU 2015-03 will have a material impact on its consolidated financial statements.
In August 2015, the FASB issued Accounting Standards update 2015-15, Interest – Imputation of Interest, (“ASU 2015-15”). ASU 2015-15 amends subtopic 835-30 of the accounting standards codification (which was previously amended by ASU 2015-03), to allow for the capitalization of debt issuance costs related to line of credit agreements. Capitalized costs would be presented as an asset and subsequently amortized ratably over the term of the line of credit. The Company does not believe that ASU 2015-15 will have a material impact on its consolidated financial statements.
In September 2015, the FASB issued Accounting Standards update 2015-16, Simplifying the Accounting for Measurement-Period Adjustments (“ASU 2015-16”). ASU 2015-16 changes the recognition of business combination adjustments by requiring acquirers to recognize adjustments to provisional amounts identified during the measurement period in the reporting period in which the adjustment amounts are determined. The acquirer is required to record the effect on earnings of changes in depreciation, amortization, or other income effects, if any, as a result of the change to the provisional amounts. These amounts are calculated as if the accounting was completed at acquisition date. The acquirer is also required to present separately on the face of the income statement, or disclose in the notes, the amount recorded in current-period earnings (by line item) that would have been recorded in previous reporting periods had the adjustments been recognized as of the acquisition date. ASU 2015-16 will be effective for fiscal years, and interim
15
periods within those fiscal years, beginning after December 15, 2015. The Company does not believe ASU 2015-16 will have a material impact on its consolidated financial statements.
In November 2015, the FASB issued Accounting Standards update 2015-17, Balance Sheet Classification of Deferred Taxes (“ASU 2015-17”). ASU 2015-17 requires all deferred tax assets and liabilities to be classified as non-current on the balance sheet. This amendment simplifies the presentation of deferred income taxes. ASU 2015-17 will be effective for fiscal years, and interim periods within those fiscal years, beginning after December 15, 2016. The Company has not yet adopted ASU 2015-17, however its effects are not expected to have a material impact on the consolidated financial statements.
In February 2016, the FASB issued Accounting Standards update 2016-02, Leases (“ASU 2016-02”). ASU 2016-02 requires a lessee to recognize a lease asset representing its right to use the underlying asset for the lease term, and a lease liability for the payments to be made to lessor, on its balance sheet for all operating leases greater than 12 months. ASU 2016-02 will be effective for fiscal years, and interim periods within those fiscal years, beginning after December 15, 2018. The Company has not yet adopted ASU 2016-02 nor assessed its potential impact on the financial statements.
Critical Accounting Policies
Use of estimates
The preparation of the Company’s consolidated financial statements in conformity with GAAP requires management to make estimates and assumptions that affect the reported amounts of assets and liabilities and the disclosure of contingent assets and liabilities at the date of the financial statements, as well as the reported amounts of revenues and expenses during the reporting period. Management bases its estimates and judgments on historical experience and various other factors that are believed to be reasonable under the circumstances. Actual results could differ from those estimates.
Significant estimates include the assessment of collectability of revenue recognized, and the valuation of accounts receivable, inventory, investments, goodwill and intangible assets, liabilities, contingent consideration, deferred income tax assets and liabilities, and stock-based compensation. These estimates have the potential to significantly impact our consolidated financial statements, either because of the significance of the financial statement item to which they relate, or because they require judgment and estimation due to the uncertainty involved in measuring, at a specific point in time, events that are continuous in nature.
Revenue recognition
Services revenue generally consists of commissions and fees from providing auction services, appraisals, brokering of sales transactions and providing merger and acquisition advisory services. Revenue is recognized when persuasive evidence of an arrangement exists, the selling price is fixed and determinable, goods or services have been provided, and collectability is reasonably assured. For asset sales revenue is recognized in the period in which the asset is sold, the buyer has assumed the risks and awards of ownership, the Company has no continuing substantive obligations and collectability is reasonably assured.
We evaluate revenue from asset liquidation transactions in accordance with the accounting guidance to determine whether to report such revenue on a gross or net basis. We have determined that we act as an agent for our fee based asset liquidation transactions and therefore we report the revenue from transactions in which we act as an agent on a net basis.
The Company also earns income through asset liquidation transactions that involve the Company acting jointly with one or more additional purchasers, pursuant to a partnership, joint venture or limited liability company (“LLC”) agreements (collectively, “Joint Ventures”). For these transactions, the Company does not record the revenue or expenses associated with these Joint Ventures. Instead, the Company’s proportionate share of the net income (loss) is reported as Earnings of equity method investments. In general, the Joint Ventures apply the same revenue recognition and other accounting policies as the Company.
Cost of services revenue and asset sales
Cost of services revenue generally includes the direct costs associated with generating commissions and fees from the Company’s auction and appraisal services, merger and acquisition advisory services, and brokering of charged-off receivable portfolios. The Company generally recognizes these expenses in the period in which the revenue they relate to is recorded. Cost of asset sales generally includes the cost of purchased inventory and the related direct costs of selling inventory. The Company recognizes these expenses in the period in which title to the inventory passes to the buyer and the buyer assumes the risk and reward of the inventory.
Accounts receivable
The Company’s accounts receivable primarily relate to the operations of its asset liquidation business. They generally consist of three major categories: fees, commissions and retainers relating to appraisals and auctions, receivables from asset sales, and
16
receivables from Joint Venture partners. The initial value of an account receivable corresponds to the fair value of the underlying goods or services. To date, a majority of the receivables have been classified as current and, due to their short-term nature, any decline in fair value would be due to issues involving collectability. At each financial statement date the collectability of each outstanding account receivable is evaluated, and an allowance is recorded if the book value exceeds the amount that is deemed collectable. See Note 9 to the consolidated financial statements for more detail regarding the Company’s accounts receivable.
Inventory
The Company’s inventory consists of assets acquired for resale. Machinery and equipment inventory is classified as current, and historically is sold within a one-year operating cycle. Real estate inventory is classified as non-current due to uncertainties relating to the timing of resale. All inventory is recorded at the lower of cost or net realizable value. There is a risk that assets acquired for resale may be subsequently sold for less than their cost, or may remain unsold. Historically, the assets’ selling prices have generally been in excess of their cost. However, during 2015, the Company recorded an inventory write down charge of $2.7 million related to its real estate inventory. See Note 4 to the consolidated financial statements for further detail.
Equity Method Investments
As noted above, the Company conducts a portion of its asset liquidation business through Joint Ventures. These are accounted for using the equity method of accounting whereby the Company’s proportionate share of the Joint Venture’s net income (loss) is reported in the consolidated statement of operations as Earnings of equity method investments. At the balance sheet date, the Company’s investments in these Joint Ventures are reported in the consolidated balance sheet as equity method investments. The Company monitors the value of each Joint Ventures’ underlying assets and liabilities, and records a write down of its investments should the Company conclude that there has been a decline in the value of the net assets. Given that the underlying transactions are identical, in all material aspects, to asset liquidation transactions that the Company undertakes independently, the net assets are similarly expected to be sold within a one-year operating cycle. However, these investments have historically been classified as non-current in the consolidated financial statements due to the uncertainties relating to the timing of resale of the underlying assets as a result of the Joint Venture relationship.
Intangible assets and goodwill
Intangible assets are recorded at fair value upon acquisition. Those with an estimated useful life are amortized, and those with an indefinite useful life are unamortized. Subsequent to acquisition, the Company monitors events and changes in circumstances that require an assessment of intangible asset recoverability. Indefinite-lived intangible assets are assessed at least annually to determine both if they remain indefinite-lived and if they are impaired. The Company assesses whether or not there have been any events or changes in circumstances that suggest the value of the asset may not be recoverable. Amortized intangible assets are not tested annually, but are assessed when events and changes in circumstances suggest the assets may be impaired. If an assessment determines that the carrying amount of any intangible asset is not recoverable, an impairment loss is recognized in the statement of operations, determined by comparing the carrying amount of the asset to its fair value. All of the Company’s identifiable intangible assets at December 31, 2015 have been acquired as part of the acquisitions of HGP in 2012 and NLEX in 2014, and are discussed in more detail in Note 8 to the consolidated financial statements. During 2015 the Company recorded an impairment charge of $2.7 million related to the customer network acquired as part of the acquisition of HGP. No impairment charges were recorded during 2014. See Note 3 and Note 8 to the consolidated financial statements for more detail regarding the Company’s identifiable intangible assets.
Goodwill, which results from the difference between the purchase price and the fair value of net identifiable tangible and intangible assets acquired in a business combination, is not amortized, but is tested at least annually for impairment. The Company performs its annual impairment test on October 1. Testing goodwill is a two-step process, in which the carrying amount of the reporting unit associated with the goodwill is first compared to the reporting unit’s estimated fair value. If the carrying amount of the reporting unit exceeds its estimated fair value, the fair values of the reporting unit’s assets and liabilities are analyzed to determine whether the goodwill of the reporting unit has been impaired. An impairment loss is recognized to the extent that the Company’s recorded goodwill exceeds its implied fair value as determined by this two-step process. Accounting Standards Update 2011-08, Testing Goodwill for Impairment, provides the option to perform a qualitative assessment prior to performing the two-step process, which may eliminate the need for further testing. Goodwill, in addition to being tested for impairment annually, is tested for impairment at interim periods if an event occurs or circumstances change such that it is more likely than not that the carrying amount of goodwill may be impaired.
In testing goodwill, the Company initially uses a qualitative approach and analyzes relevant factors to determine if events and circumstances have affected the value of the goodwill. If the result of this qualitative analysis indicates that the value has been impaired, the Company then applies a quantitative approach to calculate the difference between the goodwill’s recorded value and its fair value. An impairment loss is recognized to the extent that the recorded value exceeds its fair value. All of the Company’s goodwill relates to its acquisitions of Equity Partners in 2011, HGP in 2012 and NLEX in 2014, and is discussed in more detail in
17
Note 3 and Note 8 to the consolidated financial statements. During 2015 the Company recorded an impairment charge of $2.7 million related to the goodwill from its acquisition of HGP. No impairment charges were recorded during 2014.
Future impairment of the Company’s intangible assets and goodwill could result from changes in assumptions, estimates or circumstances, some of which are beyond the Company’s control. The most significant items that could impact the Company’s business and result in an impairment charge are outlined above in Item 1A. Risk Factors.
Deferred income taxes
The Company recognizes deferred tax assets and liabilities for temporary differences between the tax bases of assets and liabilities and the amounts at which they are carried in the financial statements, based upon the enacted tax rates in effect for the year in which the differences are expected to reverse. The Company periodically assesses the value of its deferred tax assets, which have been generated by a history of net operating and net capital losses, and determines the necessity for a valuation allowance that will reduce deferred tax assets to the amount expected to be realized. The Company evaluates which portion of the deferred tax assets, if any, will more likely than not be realized by offsetting future taxable income, taking into consideration any limitations that may exist on its use of its net operating and net capital loss carryforwards. In 2014, as a result of incurring losses in prior years, the Company recorded a valuation allowance that reduced its deferred tax assets to $0. The Company continued to carry a full valuation allowance in 2015. For further discussion of the Company’s income taxes, see Note 13 to the consolidated financial statements.
Contingent consideration
At December 31, 2015 the Company’s contingent consideration consists of the estimated fair value of an earn-out provision that was part of the consideration for the acquisition of NLEX in 2014. The amount assigned to the contingent consideration at the acquisition date was determined using a discounted cash flow analysis. Its present value is assessed quarterly, and any adjustments, together with the accretion of the fair value discount, are reported as other income/expense on the Company’s consolidated statement of operations. See Note 3 to the consolidated financial statements for more discussion of the acquisition of NLEX and the related contingent consideration.
Liabilities and contingencies
The Company is involved from time to time in various legal matters arising out of its operations in the normal course of business. On a case by case basis, the Company evaluates the likelihood of possible outcomes for these contingent matters. Based on this evaluation, the Company determines whether a loss accrual is appropriate. If the likelihood of a negative outcome is probable, and the amount can be estimated, the Company accrues the estimated loss in the current period. Refer to Note 12 to the consolidated financial statements for further detail.
Stock-based compensation
The Company’s stock-based compensation is primarily in the form of options to purchase common shares. The fair value of stock options is calculated using the Black-Scholes option pricing model. The determination of the fair value of the Company’s stock options is based on a variety of factors including, but not limited to, the price of the Company’s common stock, the expected volatility of the stock price over the expected life of the award, and expected exercise behavior. The fair value of the awards is subsequently expensed over the vesting period. The provisions of the Company’s stock-based compensation plans do not require the Company to settle any options by transferring cash or other assets, and therefore the Company classifies the option awards as equity. See Note 16 to the consolidated financial statements for further discussion of the Company’s stock-based compensation.
Item 7A. Quantitative and Qualitative Disclosures about Market Risk.
As a Smaller Reporting Company, we are electing scaled reporting obligations and therefore are not required to provide the information requested by this Item.
Item 8. Financial Statements and Supplementary Data.
See Consolidated Financial Statements beginning on page F-1.
Item 9. Changes In and Disagreements with Accountants on Accounting and Financial Disclosure.
During Fiscal 2014 and Fiscal 2015 the Company had no disagreements with its auditors and no reportable events.
18
Item 9A. Controls and Procedures.
Evaluation of Disclosure Controls and Procedures
As of the end of the period covered by this Annual Report, under the supervision and with the participation of management, including our Chief Executive Officer and Chief Financial Officer (the “Certifying Officers”), the Company conducted an evaluation of its disclosure controls and procedures. As defined in Rules 13a-15(e) and 15d-15(e) of the Exchange Act, the term “disclosure controls and procedures” means controls and other procedures of an issuer that are designed to ensure that information required to be disclosed by the issuer in the reports that it files or submits under the Exchange Act is recorded, processed, summarized and reported, within the time periods specified in the Commission’s rules and forms. Disclosure controls and procedures include, without limitation, controls and procedures designed to ensure that information required to be disclosed by an issuer in the reports that it files or submits under the Exchange Act is accumulated and communicated to the issuer’s management, including the Certifying Officers, to allow timely decisions regarding required disclosure. Based on this evaluation, the Certifying Officers have concluded that the Company’s disclosure controls and procedures were effective as of December 31, 2015.
Management’s Annual Report on Internal Control Over Financial Reporting
The Company’s management is responsible for establishing and maintaining adequate internal control over financial reporting, in accordance with Rules 13a-15(f) and 15d-15(f) of the Exchange Act. Under the supervision and with the participation of the Company’s management, including the Certifying Officers, we conducted an evaluation of the effectiveness of the Company’s internal control over financial reporting based on the framework in Internal Control—Integrated Framework issued by the Committee of Sponsoring Organizations of the Treadway Commission.
The Company’s internal control over financial reporting is a process designed to provide reasonable assurance regarding the reliability of financial reporting and the preparation of financial statements for external purposes in accordance with generally accepted accounting principles in the United States of America. The Company’s internal control over financial reporting includes those policies and procedures that (i) pertain to the maintenance of records that, in reasonable detail, accurately and fairly reflect the transactions and dispositions of the assets of the Company; (ii) provide reasonable assurance that transactions are recorded as necessary to permit preparation of financial statements in accordance with generally accepted accounting principles, and that receipts and expenditures of the Company are being made only in accordance with authorizations of management and directors of the Company; and (iii) provide reasonable assurance regarding prevention or timely detection of unauthorized acquisition, use, or disposition of the Company’s assets that could have a material effect on the financial statements.
Because of its inherent limitations, internal control over financial reporting may not prevent or detect misstatements. Also, projections of any evaluation of effectiveness to future periods are subject to the risk that controls may become inadequate because of changes in conditions, or that the degree of compliance with the policies or procedures may deteriorate.
Based on its assessment using these criteria, the Company’s management concluded that the Company’s internal control over financial reporting was effective as of December 31, 2015.
This Report does not include an attestation report of the Company’s independent registered public accounting firm regarding internal control over financial reporting. Management’s report is not subject to attestation by the Company’s independent registered public accounting firm pursuant to the rules of the SEC that permit the Company to provide only management’s report in this Report.
Changes in Internal Control over Financial Reporting
There were no changes in our internal control over financial reporting during the fourth fiscal quarter of 2015 that have materially affected, or are reasonably likely to materially affect, our internal control over financial reporting.
None.
19
PART III
Item 10. Directors, Executive Officers and Corporate Governance.
Under our Charter documents, the Board of Directors (the “Board”) is divided into three classes, with the total number of directors to be not less than five and not more than nine. Each director is to serve a term of three years or until his or her successor is duly elected and qualified. As of the date hereof, the Board consists of eight members: three Class I directors (Messrs. Dove, Perlis and Shimer), three Class II directors (Messrs. Toh, Heaton, and Silber) and two Class III directors (Messrs. Turock and Ryan). The following table sets forth the names, ages and positions with HGI of our current directors and executive officers. With the exception of Ross Dove and Kirk Dove, who are brothers, there are no family relationships between any present executive officers and directors.
|
Name |
|
Age (1) |
|
Title |
|
Allan C. Silber |
|
67 |
|
Chairman of the Board |
|
Hal B. Heaton |
|
65 |
|
Director (2), (3), (4) |
|
Henry Y.L. Toh |
|
58 |
|
Director (2), (3), (4) |
|
Samuel L. Shimer |
|
52 |
|
Director (2) |
|
David L. Turock |
|
58 |
|
Director (2) |
|
J. Brendan Ryan |
|
73 |
|
Director (2) |
|
Morris Perlis |
|
67 |
|
Director (2) |
|
Ross Dove |
|
63 |
|
Director, Chief Executive Officer |
|
Kirk Dove |
|
60 |
|
Chief Operating Officer and President |
|
Scott A. West |
|
46 |
|
Chief Financial Officer |
|
James Sklar |
|
50 |
|
Executive Vice President, General Counsel, and Corporate Secretary |
|
Kenneth Mann |
|
48 |
|
Senior Managing Director, Equity Partners HG LLC |
|
David Ludwig |
|
58 |
|
President, National Loan Exchange |
|
|
(1) |
As of December 31, 2015 |
|
|
(2) |
Independent Director |
|
|
(3) |
Member of the Audit Committee |
|
|
(4) |
Member of the Compensation Committee |
Set forth below are descriptions of the backgrounds of the executive officers and directors of the Company:
Allan C. Silber, Chairman of the Board. Mr. Silber was elected to the Board as a Class II director in September 2001. He was appointed as Chairman of the Board in November 2001, a position he held until October 2004, and was again appointed as Chairman of the Board in March 2005. In January 2011, Mr. Silber resigned the position of Chief Executive Officer and assumed the position of President. On May 5, 2015 in connection with the appointment of Ross Dove as Chief Executive Officer and Kirk Dove as Chief Operating Officer and President, Mr. Silber resigned the position of President. Mr. Silber is the Chairman of Street Capital, which he founded in 1979. Mr. Silber sits on a number of public, private and not for profit Boards. Mr. Silber attended McMaster University and received a bachelor’s degree from the University of Toronto.
Hal B. Heaton, Director. Dr. Heaton was appointed by the Board as a Class II director on June 14, 2000 to fill a Board vacancy. Dr. Heaton has expertise in capital markets, corporate finance, emerging markets and entrepreneurial finance, all of which have relevance to the Company as it pursues varied investment and business opportunities in both North America and foreign markets. From 1983 to the present he has been a professor of Finance at Brigham Young University and between 1988 and 1990 was a visiting professor of Finance at Harvard University. From 2001 to 2007, Dr. Heaton served on the board of Mity Enterprises Inc., and was a member of its Compensation Committee. Dr. Heaton holds a bachelor’s degree in Computer Science/Mathematics and a Master’s in Business Administration from Brigham Young University, as well as a master’s degree in Economics and a Ph.D. in Finance from Stanford University.
Henry Y.L. Toh, Director. The Board elected Mr. Toh as a Class II director and as Vice Chairman of the Board in April 1992. Mr. Toh has valuable experience as a director with a variety of technology-oriented companies, in addition to extensive hands-on experience as an executive officer of the Company. Mr. Toh became President of HGI in May 1993, Acting Chief Financial Officer in September 1995 and Chairman of the Board in May 1996, and served as such through September 1996. Mr. Toh was appointed as Chairman of the Audit Committee in March 2005. Mr. Toh currently serves as Vice Chairman/Executive Vice President and Director of NuGen Holdings Inc. (formerly InovaChem, Inc.), a research, development and production company specializing in Axio flux electric motor systems, since January 2008, and President and CEO of Amerique Investments International Corporation since 1992. He previously served as Executive Vice President and a director of NuGen Holdings Inc., from February 2008 to December 2009. Mr. Toh has served as a director of iDNA, Inc., a specialized finance and entertainment company, since 1999; a director of Teletouch Communications, Inc., a retail provider of internet, cellular and paging services, since 2002; a director of Isolagen, Inc., a
20
biotechnology company, from 2003 until 2009; and a director of American Surgical Holdings, Inc. from 2007 to April 2011. Mr. Toh is a graduate of Rice University.
Samuel L. Shimer, Director. Mr. Shimer was appointed by the Board as a Class I director on April 15, 2001 to fill a Board vacancy. Mr. Shimer has extensive expertise in mergers and acquisitions, including those transactions that occurred while he was an officer of the Company and Street Capital, where he was initially employed as a Senior Vice President, Mergers & Acquisitions and Business Development in July 1997. He was appointed Managing Director in February 2000 and he terminated his employment with the Company in February 2004 to join J. H. Whitney & Co., a private equity fund management company, where he remained as a Partner until December 2009. Mr. Shimer is currently Managing Director of SLC Capital Partners, LLC, a private equity fund management company that he co-founded in 2010. From 1991 to 1997, Mr. Shimer worked at two merchant banking funds affiliated with Lazard Frères & Co., Center Partners and Corporate Partners, ultimately serving as a Principal. Mr. Shimer earned a Bachelor of Science in Economics degree from The Wharton School of the University of Pennsylvania, and a Master of Business Administration degree from Harvard Business School.
David L. Turock, Director. Mr. Turock was appointed by the Board as a Class III director on January 16, 2008 to fill a Board vacancy. Mr. Turock is the inventor of the Company’s VoIP Patent, and an expert on numerous technologies and their applications. Mr. Turock began his career working with AT&T Bell Laboratories in 1982 and Bell Communications Research in 1988, and subsequently founded enhanced telephone service provider, Call Sciences. He later formed Interexchange, which designed and operated one of the world’s largest debit card systems. Most recently, from 2001 to 2007, Mr. Turock was Chief Technology Officer of Therap Services, a provider of informatics services to disabled patients. Mr. Turock received his Bachelor of Science in Experimental Psychology from Syracuse University, his Master of Science and Ph.D. degrees in Cognitive Psychology from Rutgers University, and his Master of Science in Engineering in Computer Science from the Moore School of the University of Pennsylvania.
J. Brendan Ryan, Director. Mr. Ryan was appointed by the Board as a Class III director on August 8, 2011 to fill a Board vacancy. Mr. Ryan has had a distinguished career in the advertising industry, most recently serving as the global CEO of Foote Cone & Belding Worldwide (now FCB), and as the Chairman and Chairman Emeritus from June 2005 to December 2010. He has served on the boards of several public companies and currently serves as a board member of several non-profit corporations. Mr. Ryan has extensive experience at the Board level with respect to the workings of public companies as well as an extensive network of contacts that could be of benefit to the Company. Mr. Ryan received his Bachelor degree in History from Fordham College and his Master of Business Administration in Marketing from the Wharton Graduate School of the University of Pennsylvania.
Morris Perlis, Director. Mr. Perlis was appointed by the Board as a Class I director on May 5, 2015. Mr. Perlis previously served as President of Street Capital from 1992 until 2001, a period of tremendous success that included guiding the Company’s health care strategy, resulting in superior growth of three investee companies. In addition to his past experience at Street Capital, Mr. Perlis bring a wealth of expertise gained in senior strategic and management roles with other leading organizations. He spent 13 years with American Express Inc., including five years as President of American Express Canada. During that time he obtained approval for, and directed the launch of, the AMEX Bank of Canada, for which he served as CEO. Among his other responsibilities with American Express, Mr. Perlis served as Executive Vice President, and was a key member of numerous senior level U.S. executive committees. Mr. Perlis also spent four years as President and CEO of Mad Catz Interactive, during which time he completely re-engineered the Company, leading it to become the largest third party manufacturer in its industry. Mr. Perlis is currently the President and CEO of Morris Perlis and Associates, and is active on a number of public, private and not for profit boards.
Ross Dove, Chief Executive Officer and Director. Mr. Ross Dove was appointed Chief Executive Officer of the Company on May 5, 2015 and has served as Co-Managing Partner of Heritage Global Partners, Inc. since its founding in October 2009. Together with his brother, Kirk Dove, Mr. Dove joined the Company when HGI acquired HGP in February 2012. Mr. Dove began his career in the auction business over thirty years ago, beginning with a small family-owned auction house and helping to expand it into a global firm, DoveBid, which was sold to a third party in 2008. The Messrs. Dove remained as global presidents of the business until September 2009, and then formed HGP in October 2009. During his career, Mr. Dove has been actively involved in auction industry advances such as theatre-style auctions, which was a first step in migrating auction events onto the Internet. Mr. Dove has been a member of the National Auctioneers Associations since 1985, and a founding member of the Industrial Auctioneers Association. He served as a director of Critical Path from January 2002 to January 2005 and has served on the boards of several venture funded companies.
Kirk Dove, Chief Operating Officer and President. Mr. Kirk Dove was appointed Chief Operating Officer and President of the Company on May 5, 2015 and has served as Co-Managing Partner of Heritage Global Partners, Inc. since its founding in October 2009. Together with his brother, Ross Dove, Mr. Dove joined the Company when HGI acquired HGP in February 2012. Mr. Dove began his career in the auction business over twenty-five years ago, including, along with his brother, the position of global president of DoveBid, which was sold to a third party in 2008. The Messrs. Dove remained as global presidents of the business until September 2009, and then formed HGP in October 2009. In addition to his experience with the auction business, Mr. Dove was employed at Merrill Lynch for several years as a Senior Account Executive. Mr. Dove holds a Bachelor of Sciences degree in Business from
21
Northern Illinois University. He is a Senior ASA Member of the American Society of Appraisers, and has been a member of the National Auctioneers Associations since 1985.
Scott A. West, Chief Financial Officer. Mr. West became the Chief Financial Officer of HGP in March 2014 and was appointed the Chief Financial Officer of HGI in May 2015. Mr. West has over 25 years of multi-national executive financial accounting and business management experience serving various public and private equity funded companies, including a Fortune 500 company. He has expertise managing financial, technical, M&A and international accounting teams and has deep knowledge of SEC financial reporting, SOX compliance and international accounting matters. Mr. West is responsible for all of the Company’s financial and treasury functions including financial reporting, bank relationships, conducting internal and industry analysis to support the Company’s goals for growth, investor relations, and M&A activity. Mr. West has a bachelor’s degree in Accounting from Arizona State University.
James Sklar, Executive Vice President, General Counsel, and Corporate Secretary. Mr. Sklar became the Executive Vice President and General Counsel of HGP in June 2013 and was appointed the Executive Vice President, General Counsel and Corporate Secretary of HGI in May 2015. Mr. Sklar has over two decades of relevant legal expertise serving leading worldwide asset advisory and auction services firms. Throughout his career, he has played a key role in establishing relationships with global alliance partners and implementing international contracts as well as expanding the adoption of the auction sale process in North America, Europe, Asia and Latin America. Mr. Sklar is responsible for all of the Company’s legal matters including negotiating global transactional business alliance documents, managing relationships and contracts with worldwide clients and business partners, and providing legal representation for all of the Heritage Global companies. Mr. Sklar has a bachelor’s degree in Economics from the Wharton School of the University of Pennsylvania and a Juris Doctorate from Wayne State University Law School.
Kenneth Mann, Senior Managing Director, Equity Partners HG LLC. Mr. Mann has been employed by the Company since March 2011, when he joined the Company in connection with its acquisition of Equity Partners. Prior to the acquisition, Mr. Mann was a Partner at Equity Partners since 1995, and a Managing Partner since September 2002. During his career, Mr. Mann has had extensive experience handling investment banking services for distressed businesses operating in a wide variety of industries. Mr. Mann holds a Bachelor of Science Degree in Business Administration from Salisbury University. He began sponsoring events with the American Bankruptcy Institute in 1995, became a member in March 2003, and has served on its Asset Sales Committee since 2003.
David Ludwig, President, National Loan Exchange Inc. (“NLEX”). Mr. Ludwig joined the Company when HGI acquired NLEX in June 2014. Mr. Ludwig has worked in the financial industry for twenty-five years, and he developed NLEX from its start as a post-Resolution Trust Corporation (RTC) sales outlet to the nation's leading broker of charged-off credit card and consumer debt accounts. He is considered a leading pioneer in the debt sales industry, and has been a featured speaker at many industry conferences, as well as quoted in numerous publications including the New York Times, LA Times, Collections and Credit Risk, and Collector Magazine. Mr. Ludwig also serves as consultant and expert witness within the industry. Mr. Ludwig has a Bachelor of Science Degree in Economics from the University of Illinois.
Each officer of HGI has been appointed by the Board and holds his office at the discretion of the Board.
No director or officer of our company has, during the last ten years: (i) been subject to or involved in any legal proceedings described under Item 401(f) of Regulation S-K, including, without limitation, any criminal proceeding (excluding traffic violations or similar misdemeanors) or (ii) been a party to a civil proceeding of a judicial or administrative body of competent jurisdiction and as a result of such proceeding was or is subject to a judgment, decree or final order enjoining future violations of, or prohibiting or mandating activities subject to, United States federal or state securities laws, or finding any violations with respect to such laws.
Section 16(a) Beneficial Ownership Reporting Compliance
Section 16(a) of the Exchange Act requires our officers and directors, and persons who own more than ten percent of a registered class of our equity securities, to file reports of ownership and changes in ownership of equity securities of HGI with the SEC. Officers, directors, and greater than ten percent stockholders are required by the SEC regulation to furnish us with copies of all Section 16(a) forms that they file.
Based solely upon a review of Forms 3 and Forms 4 furnished to us pursuant to Rule 16a-3 under the Exchange Act during our most recent fiscal year, and Forms 5 with respect to our most recent fiscal year, we believe that all such forms required to be filed pursuant to Section 16(a) were timely filed by the executive officers, directors and security holders required to file same during the fiscal year ended December 31, 2015.
22
Code of Ethics
HGI has adopted a code of ethics that applies to its employees, including its principal executive, financial and accounting officers or persons performing similar functions. The HGI Code of Conduct (the “Code”) can be found on the Company’s website at http://www.heritageglobalinc.com (follow Corporate Governance link to Governance Documents tab). The Company intends to satisfy the disclosure requirements under Item 5.05 of Form 8-K regarding any amendments to, or waivers from, a provision of the Code that applies to its principal executive, financial and accounting officers or persons performing similar functions by posting such information on its website at the website address set forth above.
Corporate Governance
Board Leadership and Risk Oversight
HGI is a small organization, with a market capitalization at December 31, 2015 of approximately $6.5 million. From 2001 until the first quarter of 2014, Street Capital was the Company’s majority shareholder. In the first quarter of 2014 Street Capital declared a dividend in kind, consisting of its 73.3% interest in HGI, which was paid to Street Capital shareholders in April 2014. The Company’s association with Street Capital continued into 2015, and Street Capital remained a related party, due to a management services agreement (the “Services Agreement”) between HGI and Street Capital. The Services Agreement is described in more detail in Item 13 of this Report and in Note 14 to the consolidated financial statements. The Services Agreement was terminated effective August 31, 2015, as described more fully in the Current Report on Form 8-K filed with the SEC on September 1, 2015. After the termination of the Services Agreement, Street Capital remained a related party as a result of the Company’s Chairman of the Board, Mr. Allan Silber, also holding a similar position for Street Capital.
HGI’s operations, even following the acquisitions of HGP in 2012 and NLEX in 2014, and HGP’s expansion into Europe in 2012, remain relatively modest, with only fifty-three employees, as detailed in Item 1 of this report. Given the current size and scale of the Company’s operations, the Company believes that the Board does not require a lead independent director in order to effectively oversee the strategic priorities of the Company. The Board meets quarterly to review and approve the Company’s operating results. It meets annually to review and approve the Company’s strategy and budget. Material matters such as acquisitions and dispositions, investments and business initiatives are approved by the full Board.
Board Meetings and Committees
The Board held four meetings during the fiscal year ended December 31, 2015. The Board has designated two standing committees: the Audit Committee and the Compensation Committee. HGI does not have a nominating or a corporate governance committee. However, corporate governance functions are included in the Audit Committee Charter, and Board nominations are considered by the full Board. There are no specific criteria for Director nominees, and the Company does not specifically consider diversity with respect to the selection of its Board nominees. Given the Company’s limited operations, the Company believes that it would have difficulty identifying and attracting a diverse selection of candidates. To date, it has been deemed most effective to nominate and appoint individuals who are either former employees with detailed knowledge of the business, such as Mr. Toh and Mr. Shimer, individuals with expertise that is unique to the Company’s operations, such as Mr. Turock, or individuals with expertise that will be of value as the Company expands its market presence, such as Dr. Heaton, Mr. Ryan and Mr. Perlis. There has been no material change in the procedures by which our shareholders may recommend nominees to our Board since such procedures were adopted and implemented.
Audit Committee
The Audit Committee is responsible for making recommendations to the Board concerning the selection and engagement of independent accountants and for reviewing the scope of the annual audit, audit fees, results of the audit and independent registered public accounting firm’s independence. The Audit Committee is also responsible for corporate governance, and reviews and discusses with management and the Board such matters as accounting policies, internal accounting controls and procedures for preparation of financial statements. Its membership is currently comprised of Mr. Toh (Chairman) and Dr. Heaton, both independent directors. The Audit Committee held four meetings during the fiscal year ended December 31, 2015. In 2000, the Board approved HGI’s Audit Committee Charter, which was subsequently revised and amended in 2001 and again in 2003 in order to incorporate certain updates in light of regulatory developments, including the Sarbanes-Oxley Act of 2002. A copy of the current Audit Committee Charter is available on the Company’s website www.heritageglobalinc.com.
Audit Committee Financial Expert
The Board has determined that Mr. Henry Y.L. Toh is an Audit Committee financial expert as defined by Item 407(d) of Regulation S-K and is “independent” as such term is defined under Nasdaq Marketplace Rules and applicable federal securities laws and regulations.
23
Item 11. Executive Compensation.
Compensation Discussion and Analysis
Summary
The following sections provide an explanation and analysis of our executive compensation program and the material elements of total compensation paid to each of our named executive officers. Included in the discussion is an overview and description of:
|
|
· |
our compensation philosophy and program; |
|
|
· |
the objectives of our compensation program; |
|
|
· |
what our compensation program is designed to reward; |
|
|
· |
each element of compensation; |
|
|
· |
why we choose to pay each element; |
|
|
· |
how we determine the amount for each element; and |
|
|
· |
how each compensation element and our decision regarding that element fit into our overall compensation objectives and affect decisions regarding other elements, including the relationship between our compensation objectives and our overall risk management. |
In reviewing our executive compensation program, we considered issues pertaining to policies and practices for allocating between long-term and currently paid compensation and those policies for allocating between cash and non-cash compensation. We also considered the determinations for granting awards, performance factors for our company and our named executive officers, and how specific elements of compensation are structured and taken into account in making compensation decisions. Questions related to the benchmarking of total compensation or any material element of compensation, the tax and accounting treatment of particular forms of compensation and the role of executive officers (if any) in the total compensation process also are addressed where appropriate. In addition to the named executive officers discussed below, the Company has only 47 salaried employees.
General Executive Compensation Philosophy
We compensate our executive management through a combination of base salaries, merit based performance bonuses, and long-term equity compensation. We adhere to the following compensation policies, which are designed to support the achievement of our business strategies:
|
|
· |
Our executive compensation program should strengthen the relationship between compensation, both cash and equity-based, and performance by emphasizing variable, at-risk earnings that are dependent upon the successful achievement of specified corporate, business unit and individual performance goals. |
|
|
· |
A portion of each executive’s total compensation should be comprised of long-term, at-risk compensation to focus management on the long-term interests of shareholders. |
|
|
· |
An appropriately balanced mix of at-risk incentive cash and equity-based compensation aligns the interests of our executives with that of our shareholders. The equity-based component promotes a continuing focus on building profitability and shareowner value. |
|
|
· |
Total compensation should enhance our ability to attract, retain, motivate and develop knowledgeable and experienced executives upon whom, in large part, our successful operation and management depends. |
|
|
· |
Total compensation should encourage our executives to ensure that the risks involved in any business decision align that executive’s potential personal return with maximal return to shareholders. |
A core principle of our executive compensation program is the belief that compensation paid to executive officers should be closely aligned with our near- and long-term success, while simultaneously giving us the flexibility to recruit and retain the most qualified key executives. Our compensation program is structured so that it is related to our stock performance and other factors, direct and indirect, all of which may influence long-term shareholder value and our success.
We utilize each element of executive compensation to ensure proper balance between our short- and long-term success as well as between our financial performance and shareholder return. In this regard, we believe that the executive compensation program for our named executive officers is consistent with our financial performance and the performance of each named executive officer. We do not utilize the services of compensation consultants in determining or recommending executive or director compensation.
24
Our Named Executive Officers
This analysis focuses on the compensation paid to our “named executive officers,” a defined term generally encompassing:
|
|
· |
all persons that served as our principal executive officer (“PEO”) at any time during the fiscal year |
|
|
· |
all persons that served as our principal financial officer (“PFO”) at any time during the fiscal year |
|
|
· |
the Company’s three most highly compensated executive officers, other than the PEO and PFO, serving in such positions at the end of the fiscal year. |
During 2015, our named executive officers were:
Allan C. Silber - our Chairman of the Board and former Chief Executive Officer and President. Mr. Silber is the Chairman of Street Capital, our former majority shareholder, which he founded in 1979. In January 2011, Mr. Silber resigned the position of Chief Executive Officer and assumed the position of President. Mr. Silber resigned as the Company’s President effective May 5, 2015, as more fully described on the Company’s Form 8-K filed with the SEC on May 7, 2015.
Stephen A. Weintraub – our former Executive Vice President, Corporate Secretary and Chief Financial Officer who resigned from these positions effective May 5, 2015, as more fully described on the Company’s Form 8-K filed with the SEC on May 7, 2015. Mr. Weintraub is the Corporate Secretary of Street Capital. The Company paid no compensation directly to Mr. Weintraub, as his services were included in the management services agreements between the Company and Street Capital, as discussed in Item 13 of this Report.
Ross Dove – Chief Executive Officer. Mr. Dove (and his brother) co-founded HGP, which was acquired by the Company in February 2012. Effective May 5, 2015, Mr. Dove became Chief Executive Officer of the Company, as more fully described on the Company’s Form 8-K filed with the SEC on May 7, 2015.
Kirk Dove – Chief Operating Officer and President. Mr. Dove (and his brother) co-founded HGP, which was acquired by the Company in February 2012. Effective May 5, 2015, Mr. Dove became Chief Operating Officer and President of the Company, as more fully described on the Company’s Form 8-K filed with the SEC on May 7, 2015.
Scott A. West – Chief Financial Officer. Effective May 5, 2015, Mr. West became Chief Financial Officer of the Company, as more fully described on the Company’s Form 8-K filed with the SEC on May 7, 2015.
Kenneth Mann – Senior Managing Director, Equity Partners. Mr. Mann has held this position prior to and since the Company’s acquisition of Equity Partners in June 2011.
David Ludwig – President, National Loan Exchange. Mr. Ludwig has held this position prior to and since the Company’s acquisition of National Loan Exchange in June 2014.
Elements of Compensation
Base Salaries
Unless specified otherwise in their employment agreements, the base salaries of the Company’s named executive officers are evaluated annually. In evaluating appropriate pay levels and salary increases for such officers, the Compensation Committee uses a subjective analysis, considering achievement of the Company’s strategic goals, level of responsibility, individual performance, and internal equity and external pay practices. In addition, the Committee considers the scope of the executives’ responsibilities, taking into account competitive market compensation for similar positions where available, as well as seniority of the individual, our ability to replace the individual and other primarily judgmental factors deemed relevant by our Board and Compensation Committee. The Compensation Committee does not use any specific benchmark in the determination of base salaries.
Base salaries are reviewed annually by our Compensation Committee and our Board, and adjusted from time to time pursuant to such review or at other appropriate times, in order to align salaries with market levels after taking into account individual responsibilities, performance and experience.
During 2015 and 2014, all of the Company’s named executive officers, with the exception of Mr. Weintraub, were paid employees. As noted above, the Company’s former Chief Executive Officer, Mr. Allan Silber, is also the Chairman of Street Capital. Mr. Silber’s annual salary of $137,500, and a discretionary bonus of up to 100% of his base salary, have been fixed at these amounts since 2005, but neither his salary nor bonus eligibility will continue starting in 2016 due to Mr. Silber no longer being our Chief Executive Officer or President.
25
Mr. Mann earns a base salary of $425,000 and is eligible for a performance bonus as described below.
The Messrs. Dove each earn base salaries of $350,000 and are eligible for discretionary bonuses of up to 50% of their base salaries.
Mr. West earns a base salary of $200,000 and is eligible for a discretionary bonus.
Mr. Ludwig earns a base salary of $400,000 and is subject to the earn-out consideration from the acquisitions of NLEX in 2014, as further described in Note 3 to the consolidated financial statements.
Bonuses
Bonus awards are designed to focus management attention on key operational goals for the current fiscal year. Our executives may earn a bonus based upon achievement of their specific operational goals and achievement by the Company or business unit of its financial targets. Cash bonus awards are distributed based upon the Company and the individual meeting performance criteria objectives. The final determination for all bonus payments is made by our Compensation Committee based on a subjective analysis of the foregoing elements.
We set bonuses based on a subjective analysis of certain performance measures in order to maximize and align the interests of our officers with those of our shareholders. Although performance goals are generally standard for determining bonus awards, we have and will consider additional performance rating goals when evaluating the bonus compensation structure of our executive management. In addition, in instances where the employee has responsibility over a specific area, performance goals may be directly tied to the overall performance of that particular area.
Mr. Silber was entitled to a bonus of up to 100% of his annual salary while he was our President. No bonus was awarded for 2015 or 2014.
Mr. Mann is eligible for a performance bonus calculated as follows: after Equity Partners achieves net operating income of $175,000, the Equity Partners team receives 75% of the next $250,000, with the allocation among the Equity Partners team to be determined by Mr. Mann and the Company’s Chief Executive Officer, Mr. Ross Dove. After this, 50% of net operating income earned by Equity Partners (i.e., net operating income in excess of $425,000) is allocated to the Equity Partners team for allocation as described above. In 2015 Mr. Mann earned a bonus of $53,705. In 2014 he earned a bonus of $317,607.
The Messrs. Dove are eligible to receive an annual bonus of up to 50% of their annual salaries. They did not receive a bonus in either 2015 or 2014.
Mr. West is eligible to receive a discretionary bonus as determined by executive management and approved by the Compensation Committee.
As the bonuses described above, with the exception of Mr. Mann’s bonus, can only be awarded at the discretion of the Compensation Committee, they do not encourage inappropriate risk-taking on the part of the named executive officers, nor represent a risk to the Company. As Mr. Mann’s bonus is closely tied to the Company’s performance, it also does not encourage inappropriate risk-taking on his part.
Equity Incentive Grants
In keeping with our philosophy of providing a total compensation package that favors at-risk components of pay, long-term incentives can comprise a significant component of our executives’ total compensation package. These incentives are designed to motivate and reward executives for maximizing shareowner value and encourage the long-term employment of key employees. Our objective is to provide executives with above-average, long-term incentive award opportunities.
We view stock options as our primary long-term compensation vehicle for our executive officers. Stock options generally are granted at slightly above the prevailing market price on the date of grant and will have value only if our stock price increases. Grants of stock options generally are based upon our performance, the level of the executive’s position, and an evaluation of the executive’s past and expected future performance. We do not time or plan the release of material, non-public information for the purpose of affecting the value of executive compensation.
We believe that stock options will continue to be used as the predominant form of stock-based compensation. No options were granted to any of our named executive officers during 2015 or 2014, other than Mr. West was granted an option to purchase 50,000 shares of common stock with a strike price of $0.70 per share in 2014 when he joined the Company.
26
Other Benefits
The only additional benefits provided to the named executive officers during 2015 and 2014 were the payment of an automobile allowance of $14,029 to Mr. Ross Dove. Mr. Kirk Dove also received a payment of $56,000 during 2015 which represented an automobile allowance for the period from 2012 to 2015. There were no pension or change in control benefits in either 2015 or 2014.
Upon termination of employment by the Company without cause, the Messrs. Dove and Mr. Mann are each entitled to twelve months base salary and a pro rata share of the bonus payable in the fiscal year of termination. Any bonus payable is based on the termination date (provided that, as of the termination date, the performance criteria established with respect to the bonus for the fiscal year have been met), subject to certain conditions.
Tax Considerations
Section 162(m) of the Internal Revenue Code places limits on the deductibility of compensation in excess of $1.0 million paid to executive officers of publicly held companies. The Compensation Committee does not believe that Section 162(m) has had or will have any impact on the compensation policies followed by the Company.
Executive Compensation Process
Compensation Committee
Our Compensation Committee oversees and approves all compensation and awards made to the Chief Executive Officer, Chief Operating Officer/President, Chief Financial Officer and General Counsel. The Compensation Committee reviews the performance and compensation of the executive officers, without their participation, and establishes their compensation accordingly, with consultation from others when appropriate.
Executive and Director Compensation – Tabular Disclosure
Summary Compensation Table
The following table sets forth the aggregate compensation for services rendered during the fiscal years ended December 31, 2015 and 2014 by our named executive officers. As discussed below and in Item 13, certain employees of Street Capital had provided services to HGI, and compensation for those services was provided and paid for under the terms and provisions of management services agreements entered into between Street Capital and HGI.
|
Name and Principal Position1 |
|
Year |
|
Salary |
|
|
Bonus |
|
|
Option Awards 3 |
|
|
All Other Compensation |
|
|
Total |
|
|||||
|
Allan C. Silber |
|
2015 |
|
$ |
137,500 |
|
|
$ |
— |
|
|
$ |
— |
|
|
$ |
— |
|
|
$ |
137,500 |
|
|
Chairman of the Board and former President (6) |
|
2014 |
|
|
137,500 |
|
|
|
— |
|
|
|
— |
|
|
|
— |
|
|
|
137,500 |
|
|
|
|
|
|
|
|
|
|
|
|
|
|
|
|
|
|
|
|
|
|
|
|
|
|
Ross Dove |
|
2015 |
|
|
350,000 |
|
|
|
— |
|
|
|
— |
|
|
|
14,029 |
|
(2) |
|
364,029 |
|
|
Chief Executive Officer |
|
2014 |
|
|
300,000 |
|
|
|
— |
|
|
|
— |
|
|
|
14,029 |
|
(2) |
|
314,029 |
|
|
|
|
|
|
|
|
|
|
|
|
|
|
|
|
|
|
|
|
|
|
|
|
|
|
Kirk Dove |
|
2015 |
|
|
350,000 |
|
|
|
— |
|
|
|
— |
|
|
|
56,000 |
|
(2) |
|
406,000 |
|
|
Chief Operating Officer/President |
|
2014 |
|
|
300,000 |
|
|
|
— |
|
|
|
— |
|
|
|
— |
|
|
|
300,000 |
|
|
|
|
|
|
|
|
|
|
|
|
|
|
|
|
|
|
|
|
|
|
|
|
|
|
Scott A. West |
|
2015 |
|
|
200,000 |
|
|
|
— |
|
|
|
— |
|
|
|
|
|
|
|
200,000 |
|
|
Chief Financial Officer |
|
2014 |
|
|
150,000 |
|
|
|
— |
|
|
|
11,030 |
|
(3) |
|
|
|
|
|
161,030 |
|
|
|
|
|
|
|
|
|
|
|
|
|
|
|
|
|
|
|
|
|
|
|
|
|
|
Kenneth Mann |
|
2015 |
|
|
425,000 |
|
|
|
53,705 |
|
|
|
— |
|
|
|
— |
|
|
|
478,705 |
|
|
Senior Managing Director, Equity Partners |
|
2014 |
|
|
425,000 |
|
|
|
317,607 |
|
|
|
— |
|
|
|
— |
|
|
|
742,607 |
|
|
|
|
|
|
|
|
|
|
|
|
|
|
|
|
|
|
|
|
|
|
|
|
|
|
David Ludwig |
|
2015 |
|
|
400,000 |
|
|
|
|
|
|
|
— |
|
|
|
513,161 |
|
(4) |
|
913,161 |
|
|
President. National Loan Exchange |
|
2014 |
|
|
233,333 |
|
(5) |
|
|
|
|
|
— |
|
|
|
— |
|
|
|
233,333 |
|
|
(1) |
No disclosure is provided with respect to the Company’s former Chief Financial Officer, Mr. Weintraub, as his services were covered under the terms of the Management Services Agreement referenced above, and no compensation was paid directly to Mr. Weintraub by the Company. |
|
(2) |
This amount represents an automobile allowance. Of the $56,000 paid to Mr. Kirk Dove in 2015 $41,971 represents an automobile allowance for 2012, 2013 and 2014. |
|
(3) |
See “Grants of Plan-Based Awards,” below, for details regarding the assumptions made in the valuation of these option awards. |
27
|
(4) |
This amount represents the contingent consideration payment to David Ludwig in connection with the acquisition of NLEX in 2014. See Note 3 to the consolidated financial statements for further details. |
|
(5) |
This amount is prorated from the date of the NLEX acquisition, June 2, 2014 through December 31, 2014. |
|
(6) |
Mr. Silber resigned from the position of President on May 5, 2015. |
Grants of Plan-Based Awards
No grants were made to the named executive officers of the Company noted above during 2015. In 2014 when he joined the Company Mr. West was granted an option to purchase 50,000 shares of common stock with a strike price of $0.70 per share.
Outstanding Equity Awards at Fiscal Year-End
The following table sets forth the detail of outstanding equity awards at December 31, 2015.
|
Name |
|
Number of Securities Underlying Unexercised Options: Exercisable |
|
|
|
Number of Securities Underlying Unexercised Options: Unexercisable |
|
|
|
Option Exercise Price($/Sh) |
|
|
Option Expiration Date |
|||
|
Allan C. Silber |
|
|
250,000 |
|
(1) |
|
|
- |
|
|
|
$ |
1.97 |
|
|
June 29, 2018 |
|
Kenneth Mann |
|
|
200,000 |
|
(2) |
|
|
— |
|
|
|
$ |
1.83 |
|
|
June 23, 2018 |
|
Kenneth Mann |
|
|
75,000 |
|
(3) |
|
|
75,000 |
|
(3) |
|
$ |
1.00 |
|
|
March 11, 2020 |
|
Ross Dove |
|
|
234,375 |
|
(4) |
|
|
78,125 |
|
(4) |
|
$ |
2.00 |
|
|
February 28, 2019 |
|
Kirk Dove |
|
|
234,375 |
|
(4) |
|
|
78,125 |
|
(4) |
|
$ |
2.00 |
|
|
February 28, 2019 |
|
Scott A. West |
|
|
12,500 |
|
(5) |
|
|
37,500 |
|
(5) |
|
$ |
0.70 |
|
|
May 7, 2021 |
|
(1) |
These options are fully vested. |
|
(2) |
These options were part of the consideration paid to acquire Equity Partners on June 23, 2011 and vested immediately. |
|
(3) |
The options vest 25% annually beginning on the first anniversary of the March 11, 2013 grant date. |
|
(4) |
The options vest 25% annually beginning on the first anniversary of the February 29, 2012 grant date. |
|
(5) |
The options vest 25% annually beginning on the first anniversary of the May 7, 2014 grant date. |
There were no adjustments or changes in the terms of any of the Company’s equity awards in 2015 or 2014.
Compensation of Directors
The following table sets forth the aggregate compensation for services rendered during the fiscal year ended December 31, 2015 by each person serving as a director.
|
Name |
|
Fees Earned or Paid in Cash |
|
|
Option Awards(1) |
|
|
Total |
|
|||
|
Henry Y.L. Toh |
|
$ |
40,500 |
|
|
$ |
2,945 |
|
|
$ |
43,445 |
|
|
Hal B. Heaton |
|
|
35,000 |
|
|
|
2,945 |
|
|
|
37,945 |
|
|
Samuel L. Shimer |
|
|
24,000 |
|
|
|
2,945 |
|
|
|
26,945 |
|
|
David L. Turock |
|
|
24,000 |
|
|
|
2,945 |
|
|
|
26,945 |
|
|
J. Brendan Ryan |
|
|
24,000 |
|
|
|
2,945 |
|
|
|
26,945 |
|
|
Morris Perlis |
|
|
14,111 |
|
|
|
— |
|
|
|
14,111 |
|
|
Allan C. Silber |
(2) |
|
— |
|
|
|
— |
|
|
|
— |
|
|
Ross Dove |
(2) |
|
— |
|
|
|
— |
|
|
|
— |
|
|
(1) |
The value included in this column represents the grant date fair value of the option award computed in accordance with FASB ASC Topic 718. The number of shares underlying stock options granted during 2015 for each of the directors listed in the table was as follows: Mr. Toh — 10,000; Dr. Heaton — 10,000; Mr. Shimer — 10,000; Mr. Turock — 10,000; Mr. Ryan — 10,000. |
|
(2) |
Mr. Silber and Mr. Dove were not compensated as directors during 2015, but rather were compensated for their employment as officers of the Company during 2015. |
28
Each director who is not employed by HGI receives a $20,000 per year cash retainer, $1,000 per meeting attended in person or by telephone, and an annual grant of stock options to purchase 10,000 shares of common stock, which is awarded on March 31 or the next business day. In addition, the Chairman of the Audit Committee receives a cash retainer of $10,000 per year, Audit Committee members who are not the chair receive a cash retainer of $5,000 per year, and other committee chairpersons receive an annual cash retainer of $2,000 per year. The directors are also eligible to receive options under our stock option plans at the discretion of the Board. No discretionary stock options were awarded during 2015 or 2014.
Stock Option Plans
At December 31, 2015, the Company had three stock-based employee compensation plans, which are described in Note 16 of the consolidated financial statements included in Item 15 of this Report.
29
Item 12. Security Ownership of Certain Beneficial Owners and Management and Related Stockholder Matters.
The following table sets forth information regarding the ownership of our common stock as of March 11, 2016 by: (i) each director; (ii) each of the Named Executive Officers in the Summary Compensation Table; (iii) all executive officers and directors of the Company as a group; and (iv) all those known by us to be beneficial owners of more than five percent of our common stock. As of March 11, 2016, there are 28,467,648 shares of common stock and 569 shares of Series N Preferred stock issued and outstanding. Each share of Series N Preferred Stock is entitled to 40 votes.
|
Name and Address of Beneficial Owner (1) |
|
Number of Shares Beneficially Owned (2) |
|
|
|
Percentage of Common Stock Beneficially Owned |
|
||
|
Allan C. Silber |
|
|
1,735,183 |
|
(3) |
|
|
5.8 |
% |
|
Zachary Capital L.P. |
|
|
1,613,454 |
|
(4) |
|
|
5.4 |
% |
|
Ross Dove |
|
|
1,431,800 |
|
(5) |
|
|
4.8 |
% |
|
Kirk Dove |
|
|
1,240,000 |
|
(5) |
|
|
4.1 |
% |
|
Morris Perlis |
|
|
537,000 |
|
(6) |
|
|
1.8 |
% |
|
Kenneth Mann |
|
|
444,467 |
|
(7) |
|
|
1.5 |
% |
|
David Ludwig |
|
|
292,500 |
|
(8) |
|
|
1.0 |
% |
|
Scott A. West |
|
|
170,000 |
|
(9) |
|
*% |
|
|
|
Samuel L. Shimer |
|
|
143,803 |
|
(10) |
|
*% |
|
|
|
J. Brendan Ryan |
|
|
125,000 |
|
(11) |
|
*% |
|
|
|
Hal B. Heaton |
|
|
86,750 |
|
(10) |
|
*% |
|
|
|
Henry Y.L. Toh |
|
|
85,000 |
|
(10) |
|
*% |
|
|
|
David L. Turock |
|
|
55,000 |
|
(10) |
|
*% |
|
|
|
All Executive Officers and Directors as a Group (12 people) |
|
|
6,346,503 |
|
|
|
|
21.2 |
% |
|
* |
Indicates less than one percent. |
|
(1) |
Unless otherwise noted, all listed shares of common stock are owned of record by each person or entity named as beneficial owner and that person or entity has sole voting and dispositive power with respect to the shares of common stock owned by each of them. All addresses are c/o Heritage Global Inc. unless otherwise indicated. |
|
(2) |
As to each person or entity named as beneficial owners, that person’s or entity’s percentage of ownership is determined based on the assumption that any options or convertible securities held by such person or entity which are exercisable or convertible within 60 days have been exercised or converted, as the case may be. |
|
(3) |
Includes 250,000 shares of common stock issuable pursuant to options. |
|
(4) |
Unrelated third party with beneficial ownership greater than 5.0%, based solely upon a Schedule 13G filed on July 21, 2015 with the SEC. Zachary Capital L.P.’s address is 12 Castle Street, Helier, Jersey, JE2 3RT. |
|
(5) |
Includes 312,500 shares of common stock issuable pursuant to options, and 427,500 shares of common stock held of record by a trust that is jointly controlled by the Messrs. Dove. |
|
(6) |
Includes 250,000 shares of common stock issuable pursuant to options. |
|
(7) |
Includes 312,500 shares of common stock issuable pursuant to options. Mr. Mann’s address is c/o Equity Partners HG LLC, 16 N. Washington St, Easton, MD 21601. |
|
(8) |
Represents shares of common stock. Mr. Ludwig’s address is c/o National Loan Exchange Inc., 10 Sunset Hills Professional Center, Floor 1, Edwardsville, IL 62025. |
|
(9) |
Includes 25,000 shares of common stock issuable pursuant to options. |
|
(10) |
Includes 45,000 shares of common stock issuable pursuant to options |
|
(11) |
Includes 25,000 shares of common stock issuable pursuant to options. |
There are no arrangements, known to the Company, including any pledge by any person of securities of the registrant or any of its parents, the operation of which may at a subsequent date result in a change of control of the registrant.
30
Securities Authorized for Issuance Under Equity Compensation Plans
The following table sets forth, as of December 31, 2015, information with respect to equity compensation plans (including individual compensation arrangements) under which the Company’s securities are authorized for issuance.
|
Plan Category (1) |
|
Number of Securities to be issued upon exercise of outstanding options |
|
|
Weighted-average exercise price of outstanding options |
|
|
Number of securities remaining available for future issuance under equity compensation plans (excluding securities reflected in column (a)) |
|
|||
|
|
|
(a) |
|
|
(b) |
|
|
(c) |
|
|||
|
Equity compensation plans approved by security holders: |
|
|
|
|
|
|
|
|
|
|
|
|
|
2003 Stock Option and Appreciation Rights Plan |
|
|
1,170,000 |
|
|
$ |
1.65 |
|
|
— |
|
|
|
|
|
|
|
|
|
|
|
|
|
|
|
|
|
Equity compensation plans not approved by security holders: |
|
|
|
|
|
|
|
|
|
|
|
|
|
2010 Non-Qualified Stock Option Plan |
|
|
150,000 |
|
|
$ |
0.60 |
|
|
|
1,100,000 |
|
|
Equity Partners Plan |
|
|
230,000 |
|
|
$ |
1.83 |
|
|
— |
|
|
|
Options issued upon acquisition of HGP |
|
|
625,000 |
|
|
$ |
2.00 |
|
|
— |
|
|
|
Total |
|
|
2,175,000 |
|
|
$ |
1.70 |
|
|
|
1,100,000 |
|
|
(1) |
For a description of the material terms of these plans, see Note 16 to the Company’s consolidated financial statements included in Item 15 of this Report. |
31
Item 13. Certain Relationships and Related Transactions, and Director Independence.
Transactions with Management and Others
See Item 7 hereof for discussion of the Company’s changes in the ownership and control by Street Capital, its former majority owner and parent. See Item 11 hereof for descriptions of the terms of employment, consulting and other agreements between the Company and certain officers and directors.
Transactions with Street Capital
Collateralized Loan Agreement
The Company’s related party debt (the “Street Capital Loan”), which is due on demand, was originally entered into in 2003 and accrued interest at 10% per annum compounded quarterly from the date funds were advanced. The Street Capital Loan is secured by the assets of the Company.
In the second quarter of 2014, following Street Capital’s distribution of its ownership interest in HGI to Street Capital shareholders as a dividend in kind, the unpaid balance of the Street Capital Loan began accruing interest at a rate per annum equal to the lesser of the Wall St. Journal (“WSJ”) prime rate + 2.0%, or the maximum rate allowable by law. As of December 31 2015 and 2014, the interest rate on the loan was 5.50% and 5.25%, respectively. Please see Note 14 to the consolidated financial statements for further discussion of transactions with Street Capital.
During 2015, the largest amount outstanding under the Street Capital Loan was $3.0 million, which occurred during the first quarter of 2015. During 2015, the Company made payments on the loan, net of proceeds received, of $1.6 million. As of March 11, 2016, the outstanding balance of the loan was $1.7 million.
Street Capital Services Provided to Company
Beginning in 2004, HGI and Street Capital entered into successive annual management services agreements (collectively, the “Agreement”). Under the terms of the Agreement, HGI agreed to pay Street Capital for ongoing services provided to HGI by Street Capital personnel. These services included preparation of the Company’s financial statements and regulatory filings, taxation matters, stock-based compensation administration, Board administration, patent portfolio administration and litigation matters. The Street Capital employees providing the services were: 1) its Executive Vice President, Secretary and Chief Financial Officer, 2) its Tax Manager, 3) an Accounting Manager, and 4) its Accounts Payable Clerk. These employees had the same or similar positions with HGI, but none of them received compensation from HGI. Rather, Street Capital allocated to HGI a percentage, based on time incurred, of the employees’ base compensation paid by Street Capital. Beginning in 2011, additional amounts were charged to HGI for Street Capital services specifically relating to the ongoing operations of HGI’s asset liquidation business. The amounts due under the Agreement were payable within 30 days following the respective year end, subject to applicable restrictions. Any unpaid amounts bore interest at 10% per annum commencing on the day after such year end.
In 2013, Street Capital announced its plan to dispose of its interest in HGI, and on March 20, 2014, Street Capital declared a dividend in kind, consisting of Street Capital’s distribution of its majority interest in HGI to Street Capital shareholders. The dividend was paid on April 30, 2014 to shareholders of record as of April 1, 2014.
Following this disposition, the Company and Street Capital entered into a replacement management services agreement (the “Services Agreement”). Under the terms of the Services Agreement, Street Capital remained as external manager and continued to provide the same services, at similar rates, until the Services Agreement was terminated effective August 31, 2015, as described more fully in the Current Report on Form 8-K filed with the SEC on September 1, 2015. Please see Note 14 to the consolidated financial statements for details of the amounts expensed during 2015 and 2014 relating to services provided by Street Capital under the agreements.
Transactions with Other Related Parties
As part of the operations of HGP, the Company leases office space in Foster City, CA that is owned by an entity that is jointly controlled by HGI’s Chief Executive Officer and Chief Operating Officer/President. The total amount paid in both 2015 and 2014 was $0.2 million. As part of the operations of NLEX, the Company leases office space in Edwardsville, IL that is owned by senior officers of NLEX. The total amount paid in both 2015 and 2014 was $0.1 million.
32
Director Independence
Our securities are quoted on the OTC market and the Canadian Securities Exchange. Our Board applies “independence” requirements and standards under the Nasdaq Marketplace Rules. Pursuant to the requirements, the Board periodically undertakes a review of director independence. During this review, the Board considers transactions and relationships between each director or any member of his or her immediate family and HGI and its subsidiaries and affiliates. The purpose of this review is to determine whether any such relationships or transactions exist that are inconsistent with a determination that the director is independent. As a result of this review in 2015, the Board affirmatively determined that during 2015 Messrs. Toh, Heaton, Ryan, Shimer, Turock and Perlis were deemed “independent” as defined under the Nasdaq Marketplace Rules. The Board further determined that each of the foregoing directors met the independence and other requirements, including the Audit Committee membership independence requirements, needed to serve on the Board committees for which they serve.
Item 14. Principal Accountant Fees and Services.
In September 2014 the Company’s Audit Committee engaged Squar, Milner, Peterson, Miranda & Williamson, LLP (“Squar Milner”) as the Company’s independent registered public accounting firm for the fiscal year ended December 31, 2014. Previously, the Company’s independent registered public accounting firm was Deloitte LLP (“Deloitte”). All fees paid to independent registered public accounting firms were pre-approved by the Audit Committee.
Fees paid to Deloitte, our independent registered public accounting firm for the period January 1 – September 23, 2014, are set forth below (in thousands):
|
|
|
Year Ended December 31, |
|
|
|
|
|
2014 |
|
|
|
Audit fees |
|
$ |
38 |
|
|
Audit-related fees |
|
|
74 |
|
|
Tax fees |
|
|
— |
|
|
All other fees |
|
|
— |
|
|
Total |
|
$ |
112 |
|
Fees paid or expected to be paid to Squar Milner, our independent registered public accounting firm for the period September 27 – December 31, 2014 and for all of 2015 are set forth below (in thousands):
|
|
|
Year Ended December 31, |
|
|||||
|
|
|
2015 |
|
|
2014 |
|
||
|
Audit fees |
|
$ |
127 |
|
|
$ |
99 |
|
|
Audit-related fees |
|
|
— |
|
|
|
— |
|
|
Tax fees |
|
|
— |
|
|
|
— |
|
|
All other fees |
|
|
— |
|
|
|
— |
|
|
Total |
|
$ |
127 |
|
|
$ |
99 |
|
Audit Fees
Audit fees are for professional services for the audit of our annual financial statements, the reviews of the financial statements included in our Quarterly Reports on Form 10-Q, and services in connection with our statutory and regulatory filings.
Audit-Related Fees
Audit related fees are for assurance and related services that are reasonably related to the audit and reviews of our financial statements, exclusive of the fees disclosed as Audit Fees above. These fees include benefit plan audits and accounting consultations. In 2014, the audit-related fees paid to Deloitte related to HGI’s requirement to file statutory reports in Canada, prior to Street Capital’s distribution of its ownership in HGI as a dividend in kind. No such fees were paid in 2015.
Tax Fees
Tax fees are for services related to tax compliance, consulting and planning services and include preparation of tax returns,
33
review of restrictions on net operating loss carryforwards and other general tax services. For 2014 and 2015, these services were provided by an independent accounting firm other than Deloitte or Squar Milner.
All Other Fees
We did not incur fees for any services, other than the fees disclosed above relating to audit, audit-related and tax services, rendered during the years ended December 31, 2014 and 2015.
Audit and Non-Audit Service Pre-Approval Policy
In accordance with the requirements of the Sarbanes-Oxley Act of 2002 and the rules and regulations promulgated thereunder, the Audit Committee has adopted an informal approval policy to pre-approve services performed by the independent registered public accounting firm. All proposals for services to be provided by the independent registered public accounting firm, which must include a detailed description of the services to be rendered and the amount of corresponding fees, are submitted to the Chairman of the Audit Committee and the Chief Financial Officer. The Chief Financial Officer authorizes services that have been pre-approved by the Audit Committee. If there is any question as to whether a proposed service fits within a pre-approved service, the Audit Committee chair is consulted for a determination. The Chief Financial Officer submits requests or applications to provide services that have not been pre-approved by the Audit Committee, which must include an affirmation by the Chief Financial Officer and the independent registered public accounting firm that the request or application is consistent with the SEC’s rules on auditor independence, to the Audit Committee (or its Chairman or any of its other members pursuant to delegated authority) for approval. All fees related to audit services during 2015 were pre-approved by the Audit Committee.
Audit Services. Audit services include the annual financial statement audit (including quarterly reviews) and other procedures required to be performed by the independent registered public accounting firm to be able to form an opinion on our financial statements. The Audit Committee pre-approves specified annual audit services engagement terms and fees and other specified audit fees. All other audit services must be specifically pre-approved by the Audit Committee. The Audit Committee monitors the audit services engagement and may approve, if necessary, any changes in terms, conditions and fees resulting from changes in audit scope or other items.
Audit-Related Services. Audit-related services are assurance and related services that are reasonably related to the performance of the audit or review of our financial statements which historically have been provided to us by the independent registered public accounting firm and are consistent with the SEC’s rules on auditor independence. The Audit Committee pre-approves specified audit-related services within pre-approved fee levels. All other audit-related services must be pre-approved by the Audit Committee.
Tax Services. The Audit Committee pre-approves specified tax services that the Audit Committee believes would not impair the independence of the independent registered public accounting firm and that are consistent with SEC rules and guidance. All other tax services must be specifically approved by the Audit Committee.
All Other Services. Other services are services provided by the independent registered public accounting firm that do not fall within the established audit, audit-related and tax services categories. The Audit Committee pre-approves specified other services that do not fall within any of the specified prohibited categories of services.
34
PART IV
Item 15. Exhibits and Financial Statement Schedules
|
|
(a) |
The following financial statements and those financial statement schedules required by Item 8 hereof are filed as part of this Report: |
|
|
1. |
Financial Statements: |
Report of Independent Registered Public Accounting Firm
Consolidated Balance Sheets as of December 31, 2015 and 2014
Consolidated Statements of Operations and Comprehensive Loss for the years ended December 31, 2015 and 2014
Consolidated Statements of Stockholders’ Equity for the years ended December 31, 2015 and 2014
Consolidated Statements of Cash Flows for the years ended December 31, 2015 and 2014
Notes to Consolidated Financial Statements
|
|
2. |
Financial Statement Schedules: |
These schedules are omitted because they are not required, or are not applicable, or the required information is shown in the consolidated financial statements or notes thereto.
|
|
(b) |
The following exhibits are filed as part of this Report: |
|
Exhibit Number |
|
Title of Exhibit |
|
|
|
|
|
3.1(i) |
|
Amended and Restated Articles of Incorporation. (1) |
|
|
|
|
|
3.2(ii) |
|
Bylaws as amended (2) |
|
|
|
|
|
3.2(iii) |
|
Articles of Amendment to the Amended and Restated Articles of Incorporation (8) |
|
|
|
|
|
3.2(iv) |
|
Articles of Amendment to the Amended and Restated Articles of Incorporation |
|
|
|
|
|
10.1* |
|
2003 Stock Option and Appreciation Rights Plan. (3) |
|
|
|
|
|
10.2* |
|
2010 Non-Qualified Stock Option Plan (9) |
|
|
|
|
|
10.3* |
|
Form of Option Grant for Options Granted Under 2003 Stock Option and Appreciation Rights Plan. |
|
|
|
|
|
10.4 |
|
Loan and Security Agreement between Israel Discount Bank of New York (as Agent) and Counsel RB Capital LLC, dated as of June 2, 2009. (7) |
|
|
|
|
|
10.5 |
|
Sixth Amendment to Loan Agreement between C2 Global Technologies Inc. and Street Capital dated January 26, 2004, dated as of May 5, 2009. (7) |
|
|
|
|
|
10.6* |
|
Form of Option Grant for Options Granted Under 2010 Non-Qualified Stock Option Plan. (10) |
|
|
|
|
|
10.7 |
|
Asset Purchase Agreement among EP USA, LLC (as Company), Equity Partners, Inc. of Maryland, The Rexford Company, LLC and Cross Concepts, LLC (as Sellers) and Equity Partners CRB LLC (as Buyer), dated June 23, 2011. (11) |
|
|
|
|
|
10.8 |
|
Share Purchase Agreement by and among Heritage Global Partners, Inc. as the Company; Kirk Dove and Ross Dove as Sellers; and Counsel RB Capital Inc. as Buyer Dated as of February 29, 2012 (12) |
|
|
|
|
|
10.9 |
|
Stock option grant notice to Ross Dove effective February 29, 2012 |
|
|
|
|
|
10.10 |
|
Stock option grant notice to Kirk Dove effective February 29, 2012 |
|
|
|
|
|
10.11 |
|
Mutual Separation and Transition Agreement with Adam Reich, effective as of June 30, 2013 (13) |
|
|
|
|
|
10.12 |
|
Mutual Separation and Transition Agreement with Jonathan Reich, effective as of June 30, 2013 (13) |
|
|
|
|
|
10.13* |
|
Management Services Agreement between Heritage Global Inc. and Street Capital, effective as of May 1, 2014 (14) |
|
|
|
|
|
10.14 |
|
Stock Purchase Agreement between Heritage Global Inc., National Loan Exchange, Inc., and David Ludwig, signed on June 2, 2014 and effective as of May 31, 2014 (15) |
|
|
|
|
35
|
Exhibit Number |
|
Title of Exhibit |
|
10.15 |
|
Promissory Note by and between Heritage Global Inc. and Harvey Frisch, effective as of June 19, 2014. |
|
|
|
|
|
10.16 |
|
Renewed Note to the Promissory Note by and between Heritage Global Inc. and Harvey Frisch dated June 19, 2014, effective as of December 31, 2014. |
|
|
|
|
|
10.17 |
|
Second Renewed Note to the Promissory Note by and between Heritage Global Inc. and Harvey Frisch dated June 19, 2014, effective as of January 15, 2016. |
|
|
|
|
|
10.18 |
|
Employment Agreement between Kenneth Mann and Equity Partners CRB LLC effective as of March 10, 2011. (11) |
|
|
|
|
|
10.19 |
|
Employment Agreement between Ross Dove and Heritage Global Partners, Inc. effective as of February 29, 2012. |
|
|
|
|
|
10.20 |
|
Employment Agreement between Kirk Dove and Heritage Global Partners, Inc. effective as of February 29, 2012. |
|
|
|
|
|
10.21 |
|
Employment Agreement between James Sklar and Heritage Global Partners, Inc. effective as of June 23, 2013. |
|
|
|
|
|
10.22 |
|
Employment Agreement between Scott A. West and Heritage Global Partners, Inc. effective as of March 6, 2014. |
|
|
|
|
|
10.23 |
|
Employment Agreement between David Ludwig and National Loan Exchange, Inc. effective as of May 31, 2014. |
|
|
|
|
|
10.24 |
|
Purchase and Sale Agreement between 737 Gerrard Road, LLC and International Auto Processing Inc., effective as of March 11, 2016. |
|
|
|
|
|
14 |
|
C2 Global Technologies Inc. Code of Conduct. (4) |
|
|
|
|
|
21 |
|
List of subsidiaries. (filed herewith) |
|
|
|
|
|
31.1 |
|
Certification of the Principal Executive Officer pursuant to Rule 13a-14(a) under the Securities Exchange Act of 1934, as adopted pursuant to Section 302 of the Sarbanes-Oxley Act of 2002 (filed herewith) |
|
|
|
|
|
31.2 |
|
Certification of the Principal Financial Officer pursuant to Rule 13a-14(a) under the Securities Exchange Act of 1934, as adopted pursuant to Section 302 of the Sarbanes-Oxley Act of 2002 (filed herewith) |
|
|
|
|
|
32.1 |
|
Certification pursuant to 18 U.S.C. 1350 as adopted pursuant to Section 906 of the Sarbanes Oxley Act of 2002 (filed herewith) |
|
|
|
|
|
32.2 |
|
Certification pursuant to 18 U.S.C. 1350 as adopted pursuant to Section 906 of the Sarbanes Oxley Act of 2002 (filed herewith) |
|
|
|
|
|
101.INS |
|
XBRL Instance Document |
|
|
|
|
|
101.SCH |
|
XBRL Taxonomy Extension Schema |
|
|
|
|
|
101.CAL |
|
XBRL Taxonomy Extension Calculation Linkbase |
|
|
|
|
|
101.DEF |
|
XBRL Taxonomy Extension Definition Linkbase |
|
|
|
|
|
101.LAB |
|
XBRL Taxonomy Extension Label Linkbase |
|
|
|
|
|
101.PRE |
|
XBRL Taxonomy Extension Presentation Linkbase |
|
* |
Indicates a management contract or compensatory plan required to be filed as an exhibit. |
|
(1) |
Incorporated by reference to our Quarterly Report on Form 10-QSB for the quarter ended June 30, 1996, file number 0-17973. |
|
(2) |
Incorporated by reference to our Quarterly Report on Form 10-Q for the period ended September 30, 1998, file number 0-17973. |
|
(3) |
Incorporated by reference to our Definitive Proxy Statement for the November 26, 2003 annual stockholder meeting. |
|
(4) |
Incorporated by reference to our Annual Report on Form 10-K for the year ended December 31, 2003. |
|
(5) |
Incorporated by reference to our Current Report on Form 8-K filed on January 6, 2005. |
|
(6) |
Incorporated by reference to our Annual Report on Form 10-K for the period ended December 31, 2008. |
|
(7) |
Incorporated by reference to our Quarterly Report on Form 10-Q for the period ended June 30, 2009. |
|
(8) |
Incorporated by reference to our Definitive Schedule 14C Information Statement filed on December 23, 2010. |
|
(9) |
Incorporated by reference to our Current Report on Form 8-K filed on January 24, 2011. |
|
(10) |
Incorporated by reference to our Annual Report on Form 10-K for the year ended December 31, 2010. |
|
(11) |
Incorporated by reference to our Quarterly Report on Form 10-Q for the period ended June 30, 2011. |
|
(12) |
Incorporated by reference to our Current Report on Form 8-K filed on March 6, 2012. |
36
|
(13) |
Incorporated by reference to our Current Report on Form 8-K filed on July 31, 2013. |
|
(14) |
Incorporated by reference to our Current Report on Form 8-K filed on May 1, 2014. |
|
(15) |
Incorporated by reference to our Current Report on Form 8-K filed on June 6, 2014. |
(c) Financial Statement Schedules
The following Schedules are included in our Financial Statements:
None.
37
Pursuant to the requirements of Section 13 or 15(d) of the Securities Exchange Act of 1934, the Registrant has duly caused this report to be signed on its behalf by the undersigned, hereunto duly authorized.
|
|
HERITAGE GLOBAL INC. |
|
|
|
(Registrant) |
|
|
|
|
|
|
Dated: March 17, 2016 |
By: |
/s/ Ross Dove |
|
|
Ross Dove, Chief Executive Officer |
|
|
|
(Principal Executive Officer) |
|
|
|
|
|
|
|
By: |
/s/ Scott A. West |
|
|
Scott A. West, Chief Financial Officer |
|
|
|
(Principal Financial Officer) |
|
Pursuant to the requirements of the Securities Exchange Act of 1934, this report has been signed by the following persons on behalf of the registrant and in the capacities and on the dates indicated.
|
Signature |
|
Title |
|
Date |
|
|
|
|
|
|
|
/s/ Ross Dove |
|
Chief Executive Officer and Director (Principal Executive Officer) |
|
March 17, 2016 |
|
Ross Dove |
|
|
|
|
|
|
|
|
|
|
|
/s/ Hal B. Heaton |
|
Director |
|
March 17, 2016 |
|
Hal B. Heaton |
|
|
|
|
|
|
|
|
|
|
|
/s/ Morris Perlis |
|
Director |
|
March 17, 2016 |
|
Morris Perlis |
|
|
|
|
|
|
|
|
|
|
|
/s/ J. Brendan Ryan |
|
Director |
|
March 17, 2016 |
|
J. Brendan Ryan |
|
|
|
|
|
|
|
|
|
|
|
/s/ Samuel L. Shimer |
|
Director |
|
March 17, 2016 |
|
Samuel L. Shimer |
|
|
|
|
|
|
|
|
|
|
|
/s/ Allan C. Silber |
|
Chairman of the Board of Directors |
|
March 17, 2016 |
|
Allan C. Silber |
|
|
|
|
|
|
|
|
|
|
|
/s/ Henry Y. L. Toh |
|
Director |
|
March 17, 2016 |
|
Henry Y.L. Toh |
|
|
|
|
|
|
|
|
|
|
|
/s/ David L. Turock |
|
Director |
|
March 17, 2016 |
|
David L. Turock |
|
|
|
|
|
|
|
|
|
|
38
INDEX OF FINANCIAL STATEMENTS
Title of Document
F-1
Report of Independent Registered Public Accounting Firm
To the Board of Directors and Stockholders of
Heritage Global Inc.
We have audited the accompanying consolidated balance sheets of Heritage Global Inc. and subsidiaries as of December 31, 2015 and 2014, and the related consolidated statements of operations and comprehensive loss, stockholders’ equity and cash flows for the years then ended. These consolidated financial statements are the responsibility of the Company’s management. Our responsibility is to express an opinion on these consolidated financial statements based on our audits.
We conducted our audits in accordance with the standards of the Public Company Accounting Oversight Board (United States). Those standards require that we plan and perform the audits to obtain reasonable assurance about whether the financial statements are free of material misstatement. The Company is not required to have, nor were we engaged to perform an audit of its internal control over financial reporting. Our audits included consideration of internal control over financial reporting as a basis for designing audit procedures that are appropriate in the circumstances, but not for the purpose of expressing an opinion on the effectiveness of the Company’s internal control over financial reporting. Accordingly, we do not express an opinion thereon. An audit also includes examining, on a test basis, evidence supporting the amounts and disclosures in the financial statements, assessing the accounting principles used and significant estimates made by management, as well as evaluating the overall financial statement presentation. We believe that our audits provide a reasonable basis for our opinion.
In our opinion, the consolidated financial statements referred to above present fairly, in all material respects, the financial position of Heritage Global Inc. and subsidiaries as of December 31, 2015 and 2014 and the results of its operations and its cash flows for the years then ended, in conformity with U.S. generally accepted accounting principles.
/s/ SQUAR MILNER LLP
(formerly Squar, Milner, Peterson, Miranda & Williamson, LLP)
San Diego, California
March 17, 2016
F-2
HERITAGE GLOBAL INC.
(In thousands of US dollars, except share amounts)
|
|
|
December 31, |
|
|||||
|
|
|
2015 |
|
|
2014 |
|
||
|
ASSETS |
|
|
|
|
|
|
|
|
|
Current assets: |
|
|
|
|
|
|
|
|
|
Cash and cash equivalents |
|
$ |
2,777 |
|
|
$ |
3,633 |
|
|
Accounts receivable, net |
|
|
639 |
|
|
|
2,857 |
|
|
Deposits |
|
|
4 |
|
|
|
173 |
|
|
Inventory – equipment |
|
|
395 |
|
|
|
139 |
|
|
Other current assets |
|
|
449 |
|
|
|
587 |
|
|
Total current assets |
|
|
4,264 |
|
|
|
7,389 |
|
|
Inventory – real estate |
|
|
3,715 |
|
|
|
6,508 |
|
|
Equity method investments |
|
|
17 |
|
|
|
1,134 |
|
|
Property and equipment, net |
|
|
110 |
|
|
|
150 |
|
|
Intangible assets, net |
|
|
4,382 |
|
|
|
7,657 |
|
|
Goodwill |
|
|
6,158 |
|
|
|
8,846 |
|
|
Other assets |
|
|
156 |
|
|
|
186 |
|
|
Total assets |
|
$ |
18,802 |
|
|
$ |
31,870 |
|
|
|
|
|
|
|
|
|
|
|
|
LIABILITIES AND STOCKHOLDERS’ EQUITY |
|
|
|
|
|
|
|
|
|
Current liabilities: |
|
|
|
|
|
|
|
|
|
Accounts payable and accrued liabilities |
|
$ |
6,673 |
|
|
$ |
7,225 |
|
|
Current portion of third party debt |
|
|
- |
|
|
|
525 |
|
|
Related party debt |
|
|
1,721 |
|
|
|
2,985 |
|
|
Current portion of contingent consideration |
|
|
865 |
|
|
|
803 |
|
|
Other current liabilities |
|
|
97 |
|
|
|
- |
|
|
Total current liabilities |
|
|
9,356 |
|
|
|
11,538 |
|
|
Non-current portion of third party debt |
|
|
2,500 |
|
|
|
2,500 |
|
|
Non-current portion of contingent consideration |
|
|
2,592 |
|
|
|
3,395 |
|
|
Deferred tax liabilities |
|
|
960 |
|
|
|
960 |
|
|
Total liabilities |
|
|
15,408 |
|
|
|
18,393 |
|
|
|
|
|
|
|
|
|
|
|
|
Commitments and contingencies (Note 12) |
|
|
|
|
|
|
|
|
|
|
|
|
|
|
|
|
|
|
|
Stockholders’ equity: |
|
|
|
|
|
|
|
|
|
Preferred stock, $10.00 par value, authorized 10,000,000 shares; issued and outstanding 569 Class N shares at December 31, 2015 and 575 Class N shares at December 31, 2014 |
|
|
6 |
|
|
|
6 |
|
|
Common stock, $0.01 par value, authorized 300,000,000 shares; issued and outstanding 28,467,648 shares at December 31, 2015 and 28,167,408 shares at December 31, 2014 |
|
|
285 |
|
|
|
282 |
|
|
Additional paid-in capital |
|
|
284,046 |
|
|
|
283,691 |
|
|
Accumulated deficit |
|
|
(280,889 |
) |
|
|
(270,468 |
) |
|
Accumulated other comprehensive loss |
|
|
(54 |
) |
|
|
(34 |
) |
|
Total stockholders’ equity |
|
|
3,394 |
|
|
|
13,477 |
|
|
Total liabilities and stockholders’ equity |
|
$ |
18,802 |
|
|
$ |
31,870 |
|
The accompanying notes are an integral part of these consolidated financial statements.
F-3
HERITAGE GLOBAL INC.
CONSOLIDATED STATEMENTS OF OPERATIONS AND COMPREHENSIVE LOSS
(In thousands of US dollars, except per share amounts)
|
|
|
Year Ended December 31, |
|
|||||
|
|
|
2015 |
|
|
2014 |
|
||
|
Revenues: |
|
|
|
|
|
|
|
|
|
Services revenue |
|
$ |
13,485 |
|
|
$ |
13,270 |
|
|
Asset sales |
|
|
3,946 |
|
|
|
6,716 |
|
|
Total revenues |
|
|
17,431 |
|
|
|
19,986 |
|
|
|
|
|
|
|
|
|
|
|
|
Operating costs and expenses: |
|
|
|
|
|
|
|
|
|
Cost of services revenue |
|
|
3,125 |
|
|
|
4,882 |
|
|
Cost of asset sales |
|
|
3,412 |
|
|
|
5,398 |
|
|
Real estate inventory write-down |
|
|
2,748 |
|
|
|
- |
|
|
Selling, general and administrative |
|
|
12,774 |
|
|
|
11,183 |
|
|
Depreciation and amortization |
|
|
575 |
|
|
|
566 |
|
|
Impairment of goodwill and intangible assets |
|
|
5,437 |
|
|
|
- |
|
|
Total operating costs and expenses |
|
|
28,071 |
|
|
|
22,029 |
|
|
Earnings of equity method investments |
|
|
286 |
|
|
|
143 |
|
|
Operating loss |
|
|
(10,354 |
) |
|
|
(1,900 |
) |
|
Gain on sale of equity method investment |
|
|
- |
|
|
|
551 |
|
|
Other income |
|
|
297 |
|
|
|
52 |
|
|
Interest expense |
|
|
(349 |
) |
|
|
(495 |
) |
|
Loss before income tax expense |
|
|
(10,406 |
) |
|
|
(1,792 |
) |
|
Income tax expense |
|
|
15 |
|
|
|
24,722 |
|
|
Net loss |
|
|
(10,421 |
) |
|
|
(26,514 |
) |
|
Other comprehensive (loss) income: |
|
|
|
|
|
|
|
|
|
Foreign currency translation adjustment |
|
|
(20 |
) |
|
|
10 |
|
|
Comprehensive loss |
|
$ |
(10,441 |
) |
|
$ |
(26,504 |
) |
|
|
|
|
|
|
|
|
|
|
|
Weighted average common shares outstanding – basic and diluted |
|
|
28,336,876 |
|
|
|
28,167,378 |
|
|
|
|
|
|
|
|
|
|
|
|
Net loss per share – basic and diluted |
|
$ |
(0.37 |
) |
|
$ |
(0.94 |
) |
The accompanying notes are an integral part of these consolidated financial statements.
F-4
HERITAGE GLOBAL INC.
CONSOLIDATED STATEMENTS OF STOCKHOLDERS’ EQUITY
(In thousands of US dollars, except share amounts)
|
|
|
Preferred stock |
|
|
Common stock |
|
|
Additional paid-in |
|
|
Accumulated |
|
|
Accumulated other comprehensive |
|
|
|
|
|
|||||||||||||
|
|
|
Shares |
|
|
Amount |
|
|
Shares |
|
|
Amount |
|
|
capital |
|
|
deficit |
|
|
income (loss) |
|
|
Total |
|
||||||||
|
Balance at December 31, 2013 |
|
|
579 |
|
|
$ |
6 |
|
|
|
28,167,248 |
|
|
$ |
282 |
|
|
$ |
283,207 |
|
|
$ |
(243,954 |
) |
|
$ |
(44 |
) |
|
$ |
39,497 |
|
|
Conversion of Series N preferred shares |
|
|
(4 |
) |
|
|
— |
|
|
|
160 |
|
|
|
— |
|
|
|
— |
|
|
|
— |
|
|
|
— |
|
|
|
— |
|
|
Stock-based compensation expense |
|
|
— |
|
|
|
— |
|
|
|
— |
|
|
|
— |
|
|
|
484 |
|
|
|
— |
|
|
|
— |
|
|
|
484 |
|
|
Net loss |
|
|
— |
|
|
|
— |
|
|
|
— |
|
|
|
— |
|
|
|
— |
|
|
|
(26,514 |
) |
|
|
— |
|
|
|
(26,514 |
) |
|
Foreign currency translation adjustments |
|
|
— |
|
|
|
— |
|
|
|
— |
|
|
|
— |
|
|
|
— |
|
|
|
— |
|
|
|
10 |
|
|
|
10 |
|
|
Balance at December 31, 2014 |
|
|
575 |
|
|
|
6 |
|
|
|
28,167,408 |
|
|
|
282 |
|
|
|
283,691 |
|
|
|
(270,468 |
) |
|
|
(34 |
) |
|
|
13,477 |
|
|
Conversion of Series N preferred shares |
|
|
(6 |
) |
|
|
— |
|
|
|
240 |
|
|
|
— |
|
|
|
— |
|
|
|
— |
|
|
|
— |
|
|
|
— |
|
|
Issuance of common stock from restricted stock awards |
|
|
|
|
|
|
|
|
|
|
300,000 |
|
|
|
3 |
|
|
|
(3 |
) |
|
|
|
|
|
|
|
|
|
|
— |
|
|
Stock-based compensation expense |
|
|
— |
|
|
|
— |
|
|
|
— |
|
|
|
— |
|
|
|
358 |
|
|
|
— |
|
|
|
— |
|
|
|
358 |
|
|
Net loss |
|
|
— |
|
|
|
— |
|
|
|
— |
|
|
|
— |
|
|
|
— |
|
|
|
(10,421 |
) |
|
|
— |
|
|
|
(10,421 |
) |
|
Foreign currency translation adjustments |
|
|
— |
|
|
|
— |
|
|
|
— |
|
|
|
— |
|
|
|
— |
|
|
|
— |
|
|
|
(20 |
) |
|
|
(20 |
) |
|
Balance at December 31, 2015 |
|
|
569 |
|
|
$ |
6 |
|
|
|
28,467,648 |
|
|
$ |
285 |
|
|
$ |
284,046 |
|
|
$ |
(280,889 |
) |
|
$ |
(54 |
) |
|
$ |
3,394 |
|
The accompanying notes are an integral part of these consolidated financial statements.
F-5
HERITAGE GLOBAL INC.
CONSOLIDATED STATEMENTS OF CASH FLOWS
(In thousands of US dollars)
|
|
|
Year Ended December 31, |
|
|||||
|
|
|
2015 |
|
|
2014 |
|
||
|
Cash flows used in operating activities: |
|
|
|
|
|
|
|
|
|
Net loss |
|
$ |
(10,421 |
) |
|
$ |
(26,514 |
) |
|
Adjustments to reconcile net loss to net cash (used in) provided by operating activities: |
|
|
|
|
|
|
|
|
|
Accrued management fees and other charges added to principal of related party debt |
|
|
290 |
|
|
|
553 |
|
|
Accrued interest added to principal of related party debt |
|
|
90 |
|
|
|
190 |
|
|
Mark-to-market of contingent consideration |
|
|
(228 |
) |
|
|
210 |
|
|
Stock-based compensation expense |
|
|
358 |
|
|
|
484 |
|
|
Real estate inventory write-down |
|
|
2,748 |
|
|
|
— |
|
|
Earnings of equity method investments |
|
|
(291 |
) |
|
|
(404 |
) |
|
Gain on sale of equity method investment |
|
|
— |
|
|
|
(551 |
) |
|
Depreciation and amortization |
|
|
575 |
|
|
|
566 |
|
|
Impairment of goodwill and intangible assets |
|
|
5,437 |
|
|
|
— |
|
|
Return on investment in equity method investments |
|
|
680 |
|
|
|
970 |
|
|
Changes in operating assets and liabilities: |
|
|
|
|
|
|
|
|
|
Accounts receivable |
|
|
216 |
|
|
|
619 |
|
|
Inventory - equipment |
|
|
(211 |
) |
|
|
9 |
|
|
Other assets |
|
|
299 |
|
|
|
(246 |
) |
|
Deferred income taxes |
|
|
— |
|
|
|
24,667 |
|
|
Accounts payable and accrued liabilities |
|
|
(378 |
) |
|
|
68 |
|
|
Net cash (used in) provided by operating activities |
|
|
(836 |
) |
|
|
621 |
|
|
|
|
|
|
|
|
|
|
|
|
Cash flows provided by (used in) investing activities: |
|
|
|
|
|
|
|
|
|
Cash paid for business acquisition, net of cash acquired of $639 |
|
|
— |
|
|
|
(1,361 |
) |
|
Cash distributions from equity method investments |
|
|
850 |
|
|
|
590 |
|
|
Proceeds from sale of equity method investments |
|
|
1,992 |
|
|
|
— |
|
|
Investment in equity method investments |
|
|
(143 |
) |
|
|
(583 |
) |
|
Purchase of property and equipment |
|
|
(9 |
) |
|
|
(127 |
) |
|
Net cash provided by (used in) investing activities |
|
|
2,690 |
|
|
|
(1,481 |
) |
|
|
|
|
|
|
|
|
|
|
|
Cash flows (used in) provided by financing activities: |
|
|
|
|
|
|
|
|
|
Proceeds from debt payable to third parties |
|
|
— |
|
|
|
3,453 |
|
|
Repayment of debt payable to third parties |
|
|
(525 |
) |
|
|
(1,866 |
) |
|
Proceeds from debt payable to related party |
|
|
775 |
|
|
|
2,198 |
|
|
Repayment of debt payable to related party |
|
|
(2,419 |
) |
|
|
(2,505 |
) |
|
Payment of contingent consideration |
|
|
(513 |
) |
|
|
— |
|
|
Net cash (used in) provided by financing activities |
|
|
(2,682 |
) |
|
|
1,280 |
|
|
Net (decrease) increase in cash and cash equivalents |
|
|
(828 |
) |
|
|
420 |
|
|
Effect of exchange rate changes on cash and cash equivalents |
|
|
(28 |
) |
|
|
— |
|
|
Cash and cash equivalents at beginning of year |
|
|
3,633 |
|
|
|
3,213 |
|
|
Cash and cash equivalents at end of year |
|
$ |
2,777 |
|
|
$ |
3,633 |
|
|
|
|
|
|
|
|
|
|
|
|
Supplemental cash flow information: |
|
|
|
|
|
|
|
|
|
Cash paid for income taxes |
|
$ |
75 |
|
|
$ |
55 |
|
|
Cash paid for interest |
|
$ |
178 |
|
|
$ |
168 |
|
The accompanying notes are an integral part of these consolidated financial statements.
F-6
HERITAGE GLOBAL INC.
NOTES TO CONSOLIDATED FINANCIAL STATEMENTS
Note 1 – Description of Business and Principles of Consolidation
These consolidated financial statements include the accounts of Heritage Global Inc. together with its subsidiaries, including Heritage Global Partners, Inc. (“HGP”), Equity Partners HG LLC (“Equity Partners”), National Loan Exchange Inc. (“NLEX”), Heritage Global LLC (“HG LLC”), C2 Communications Technologies Inc., and C2 Investments Inc. These entities, collectively, are referred to as “HGI,” the “Company,” “we” or “our” in these consolidated financial statements. These consolidated financial statements were prepared in conformity with generally accepted accounting principles in the United States of America (“GAAP”), as outlined in the Financial Accounting Standards Board (“FASB”) Accounting Standards Codification (“ASC”) and include the assets, liabilities, revenues, and expenses of all subsidiaries over which HGI exercises control. All significant intercompany accounts and transactions have been eliminated upon consolidation.
The Company’s sole operating segment is its asset liquidation business, which began operations in 2009 with the establishment of Heritage Global LLC (“HG LLC”). The business was subsequently expanded by the acquisitions of Equity Partners, HGP and NLEX in 2011, 2012 and 2014, respectively. As a result, HGI is positioned to provide an array of value-added capital and financial asset solutions: auction and appraisal services, traditional asset disposition sales, and financial solutions for distressed businesses and properties.
Note 2 – Summary of Significant Accounting Policies
Use of estimates
The preparation of the Company’s consolidated financial statements in conformity with GAAP requires management to make estimates and assumptions that affect the reported amounts of assets and liabilities and the disclosure of contingent assets and liabilities at the date of the financial statements, as well as the reported amounts of revenues and expenses during the reporting period. Management bases its estimates and judgments on historical experience and various other factors that are believed to be reasonable under the circumstances. Actual results could differ from those estimates.
Significant estimates include the assessment of collectability of revenue recognized and the valuation of accounts receivable, inventory, investments, goodwill and intangible assets, liabilities, contingent consideration, deferred income tax assets and liabilities, and stock-based compensation. These estimates have the potential to significantly impact our consolidated financial statements, either because of the significance of the financial statement item to which they relate, or because they require judgment and estimation due to the uncertainty involved in measuring, at a specific point in time, events that are continuous in nature.
Foreign Currency
The functional currency of foreign operations is deemed to be the local country’s currency. Assets and liabilities of operations outside of the United States are generally translated into U.S dollars, and the effects of foreign currency translation adjustments are included as a component of accumulated other comprehensive income (loss).
Reclassifications
Certain prior year balances within the consolidated financial statements have been reclassified to conform to current year presentation.
F-7
Nature of Business
The Company earns revenue both from commission or fee-based services, and from the sale of distressed or surplus assets. With respect to the former, revenue is recognized as the services are provided. With respect to the latter, the majority of the asset sale transactions are conducted directly by the Company and the revenue is recognized in the period in which the asset is sold. Fee based revenue is reported as Services revenue, and the associated direct costs are reported as Cost of services revenue. At the balance sheet date, any unsold assets which the Company owns are reported as Inventory, any outstanding accounts receivable are included in the Company’s Accounts receivable, and any associated liabilities are included in the Company’s Accrued liabilities. Equipment inventory is expected to be sold within a year and is therefore classified as a current asset; however, real estate inventory is classified as non-current due to the uncertainty in the timing of its sale.
The remaining asset sale transactions involve the Company acting jointly with one or more additional purchasers, pursuant to a partnership, joint venture or limited liability company (“LLC”) agreement (collectively, “Joint Ventures”). These transactions are accounted for as equity method investments, and, accordingly, the Company’s proportionate share of the net income (loss) is reported as Earnings of equity method investments. At each balance sheet date, the Company’s investments in these Joint Ventures are reported in the consolidated balance sheet as Equity method investments. Although the Company generally expects to exit each of its investments in Joint Ventures in less than one year, they are classified on the balance sheet as non-current assets due to the uncertainties relating to the timing of resale of the underlying assets as a result of the Joint Venture relationship. The Company monitors the value of the Joint Ventures’ underlying assets and liabilities, and records a write down of its investments if the Company concludes that there has been a decline in the value of the net assets. As the activity of the Joint Ventures involves asset purchase/resale transactions, which is similar in nature to the Company’s other asset liquidation activities, the earnings (losses) of the Joint Ventures are included in the operating income/loss in the accompanying consolidated statements of operations.
Liquidity
We have incurred significant operating losses for the past several years and have partially relied on debt financing to fund our operations. As of December 31, 2015, we had an accumulated deficit of $280.9 million. Until we achieve profitability, we may need to continue to partially rely on debt financing to fund our operations. Management expects that a combination of our asset liquidation operations, the sale of our real estate inventory, and debt financing will generate cash flow sufficient to fund our operations in 2016 and beyond.
Cash and cash equivalents
The Company considers all highly liquid investments with an original maturity of three months or less to be cash equivalents. The Company maintains its cash and cash equivalents with financial institutions in the United States and Spain. These accounts may from time to time exceed federally insured limits. The Company has not experienced any losses on such accounts.
Accounts receivable
The Company’s accounts receivable primarily relate to the operations of its asset liquidation business. They generally consist of three major categories: fees, commissions and retainers relating to appraisals and auctions, receivables from asset sales, and receivables from Joint Venture partners. The initial value of an account receivable corresponds to the fair value of the underlying goods or services. To date, a majority of the receivables have been classified as current and, due to their short-term nature, any decline in fair value would be due to issues involving collectability. At each financial statement date the collectability of each outstanding account receivable is evaluated, and an allowance is recorded if the book value exceeds the amount that is deemed collectable. See Note 9 for more detail regarding the Company’s accounts receivable.
Inventory
The Company’s inventory consists of assets acquired for resale, which are normally expected to be sold within a one-year operating cycle. The inventory is recorded at the lower of cost or net realizable value. During the year ended December 31, 2015, the Company recorded an inventory write-down charge of $2.7 million to reduce the carrying value of its real estate inventory to its net realizable value. Refer to Note 4 for further details.
Fair value of financial instruments
The fair value of financial instruments is the amount at which the instruments could be exchanged in a current transaction between willing parties, other than in a forced sale or liquidation. At December 31, 2015 and 2014, the carrying values of the Company’s cash, accounts receivable, deposits, other assets, accounts payable and accrued liabilities approximate fair value given the short term nature of these instruments. The Company’s debt obligations approximate fair value as a result of the interest rate on the debt obligation approximating prevailing market rates.
F-8
There are three levels within the fair value hierarchy: Level 1 – quoted prices in active markets for identical assets or liabilities; Level 2 – significant other observable inputs; and Level 3 – significant unobservable inputs. The Company employs fair value accounting for only the contingent consideration recorded as part of the acquisition of NLEX. The fair value of the Company’s contingent consideration was determined using a discounted cash flow analysis, which is based on significant inputs that are not observable in the market and therefore fall within Level 3. Please see Note 3 and Note 11 for more discussion of this contingent consideration.
Business combinations
Acquisitions are accounted for under FASB Accounting Standards Codification Topic 805, Business Combinations (“ASC 805”), which requires that assets acquired and liabilities assumed that are deemed to be a business are recorded based on their respective acquisition date fair values. ASC 805 further requires that separately identifiable intangible assets be recorded at their acquisition date fair values and that the excess of consideration paid over the fair value of assets acquired and liabilities assumed (including identifiable intangible assets) should be recorded as goodwill. See Note 3 for discussion of the acquisition of NLEX in 2014.
Intangible assets
Intangible assets are recorded at fair value upon acquisition. Those with an estimated useful life are amortized, and those with an indefinite useful life are unamortized. Subsequent to acquisition, the Company monitors events and changes in circumstances that require an assessment of intangible asset recoverability. Indefinite-lived intangible assets are assessed at least annually to determine both if they remain indefinite-lived and if they are impaired. The Company assesses whether or not there have been any events or changes in circumstances that suggest the value of the asset may not be recoverable. Amortized intangible assets are not tested annually, but are assessed when events and changes in circumstances suggest the assets may be impaired. If an assessment determines that the carrying amount of any intangible asset is not recoverable, an impairment loss is recognized in the statement of operations, determined by comparing the carrying amount of the asset to its fair value. All of the Company’s identifiable intangible assets at December 31, 2015 have been acquired as part of the acquisitions of HGP in 2012 and NLEX in 2014, and are discussed in more detail in Note 8. During 2015 the Company recorded an impairment charge of $2.7 million related to the customer network acquired as part of the acquisition of HGP. No impairment charges were recorded during 2014. See Note 3 and Note 8 for more detail regarding the Company’s identifiable intangible assets.
Goodwill
Goodwill, which results from the difference between the purchase price and the fair value of net identifiable tangible and intangible assets acquired in a business combination, is not amortized but, in accordance with GAAP, is tested at least annually for impairment. The Company performs its annual impairment test as of October 1. Testing goodwill is a two-step process, in which the carrying amount of the reporting unit associated with the goodwill is first compared to the reporting unit’s estimated fair value. If the carrying amount of the reporting unit exceeds its estimated fair value, the fair values of the reporting unit’s assets and liabilities are analyzed to determine whether the goodwill of the reporting unit has been impaired. An impairment loss is recognized to the extent that the Company’s recorded goodwill exceeds its implied fair value as determined by this two-step process. FASB Accounting Standards Update 2011-08, Testing Goodwill for Impairment, provides the option to perform a qualitative assessment prior to performing the two-step process, which may eliminate the need for further testing. Goodwill, in addition to being tested for impairment annually, is tested for impairment at interim periods if an event occurs or circumstances change such that it is more likely than not that the carrying amount of goodwill may be impaired.
In testing goodwill, the Company initially uses a qualitative approach and analyzes relevant factors to determine if events and circumstances have affected the value of the goodwill. If the result of this qualitative analysis indicates that the value has been impaired, the Company then applies a quantitative approach to calculate the difference between the goodwill’s recorded value and its fair value. An impairment loss is recognized to the extent that the recorded value exceeds its fair value. All of the Company’s goodwill relates to its acquisitions of Equity Partners in 2011, HGP in 2012 and NLEX in 2014, and is discussed in more detail in Note 3 and Note 8. During 2015 the Company recorded an impairment charge of $2.7 million related to the goodwill from its acquisition of HGP. No impairment charges were recorded during 2014.
In 2015 the Company changed the date of its annual impairment test from December 31 to October 1. The change allows the Company to perform the required testing on a more timely basis for its fiscal year-end close process. The Company does not believe that the change in the date has a material impact on the result of the 2015 annual impairment test.
Deferred income taxes
The Company recognizes deferred tax assets and liabilities for temporary differences between the tax bases of assets and liabilities and the amounts at which they are carried in the financial statements, based upon the enacted tax rates in effect for the year in which
F-9
the differences are expected to reverse. The Company establishes a valuation allowance when necessary to reduce deferred tax assets to the amount expected to be realized. In 2014, as a result of incurring losses in previous years, the Company recorded a valuation allowance against all of its net deferred tax assets. The Company continues to carry the full valuation allowance as of December 31, 2015.
Contingent consideration
At December 31, 2015 the Company’s contingent consideration consists of the estimated fair value of an earn-out provision that was part of the consideration for the acquisition of NLEX in 2014. The estimated fair value assigned to the contingent consideration at the acquisition date was determined using a discounted cash flow analysis. Its fair value is assessed quarterly, and any adjustments, together with the accretion of the present value discount, are reported as other income/expense on the Company’s consolidated statement of operations. See Note 3 to the consolidated financial statements for more discussion of the acquisition of NLEX and the related contingent consideration.
Liabilities and contingencies
The Company is involved from time to time in various legal matters arising out of its operations in the normal course of business. On a case by case basis, the Company evaluates the likelihood of possible outcomes for this litigation. Based on this evaluation, the Company determines whether a loss accrual is appropriate. If the likelihood of a negative outcome is probable, and the amount can be estimated, the Company accounts for the estimated loss in the current period.
Revenue recognition
Services revenue generally consists of commissions and fees from providing auction services, appraisals, brokering of sales transactions and providing merger and acquisition advisory services. Revenue is recognized when persuasive evidence of an arrangement exists, the selling price is fixed and determinable, goods or services have been provided, and collectability is reasonably assured. For asset sales revenue is recognized in the period in which the asset is sold, the buyer has assumed the risks and awards of ownership, the Company has no continuing substantive obligations and collectability is reasonably assured.
We evaluate revenue from asset liquidation transactions in accordance with the accounting guidance to determine whether to report such revenue on a gross or net basis. We have determined that we act as an agent for our fee based asset liquidation transactions and therefore we report the revenue from transactions in which we act as an agent on a net basis.
The Company also earns asset liquidation income through asset liquidation transactions that involve the Company acting jointly with one or more additional purchasers, pursuant to a partnership, joint venture or limited liability company (“LLC”) agreement (collectively, “Joint Ventures”). For these transactions, the Company does not record asset liquidation revenue or expense. Instead, the Company’s proportionate share of the net income (loss) is reported as Earnings of equity method investments. In general, the Joint Ventures apply the same revenue recognition and other accounting policies as the Company.
Cost of services revenue and asset sales
Cost of services revenue generally includes the direct costs associated with generating commissions and fees from the Company’s auction and appraisal services, merger and acquisition advisory services, and brokering of charged-off receivable portfolios. The Company recognizes these expenses in the period in which the revenue they relate to is recorded. Cost of asset sales generally includes the cost of purchased inventory and the related direct costs of selling inventory. The Company recognizes these expenses in the period in which title to the inventory passes to the buyer, and the buyer assumes the risk and reward of the inventory.
Stock-based compensation
The Company’s stock-based compensation is primarily in the form of options to purchase common shares. The grant date fair value of stock options is calculated using the Black-Scholes option pricing model. The determination of the fair value of the Company’s stock options is based on a variety of factors including, but not limited to, the price of the Company’s common stock, the expected volatility of the stock price over the expected life of the award, and expected exercise behavior. The grant date fair value of the awards is subsequently expensed over the vesting period. The provisions of the Company’s stock-based compensation plans do not require the Company to settle any options by transferring cash or other assets, and therefore the Company classifies the option awards as equity. See Note 16 for further discussion of the Company’s stock-based compensation.
F-10
Future accounting pronouncements
In May 2014, the FASB issued Accounting Standards update 2014-09, Revenue from Contracts with Customers (“ASU 2014-09”). ASU 2014-09 specifies a comprehensive model to be used in accounting for revenue arising from contracts with customers, and supersedes most of the current revenue recognition guidance, including industry-specific guidance. It applies to all contracts with customers except those that are specifically within the scope of other FASB topics, and certain of its provisions also apply to transfers of nonfinancial assets, including in-substance nonfinancial assets that are not an output of an entity’s ordinary activities. The core principal of the model is that revenue is recognized to depict the transfer of goods or services to customers in an amount that reflects the consideration to which the transferring entity expects to be entitled in exchange. To apply the revenue model, an entity will: 1) identify the contract(s) with a customer, 2) identify the performance obligations in the contract, 3) determine the transaction price, 4) allocate the transaction price to the performance obligations in the contract, and 5) recognize revenue when (or as) the entity satisfies a performance obligation. For public companies, ASU 2014-09 is effective for annual reporting periods (including interim reporting periods within those periods) beginning after December 15, 2017. Early adoption is not permitted. Upon adoption, entities can choose to use either a full retrospective or modified approach, as outlined in ASU 2014-09. As compared with current GAAP, ASU 2014-09 requires significantly more disclosures about revenue recognition. The Company has not yet assessed the potential impact of ASU 2014-09 on its consolidated financial statements.
In August 2014, the FASB issued Accounting Standards update 2014-15, Disclosure of Uncertainties About an Entity’s Ability to Continue as a Going Concern (“ASU 2014-15”). ASU 2014-15 requires management to determine whether substantial doubt exists regarding the entity’s going concern presumption, which generally refers to an entity’s ability to meet its obligations as they become due, and provides guidance on determining when and how to disclose going-concern uncertainties in an entity’s financial statements. It requires management to perform both interim and annual assessments of an entity’s ability to continue as a going concern within one year of the date the financial statements are issued. The ASU contains guidance on 1) how to perform a going-concern assessment, and 2) when to provide going-concern disclosures. An entity must provide specified disclosures if conditions or events raise substantial doubt about its ability to continue as a going concern. ASU 2014-15 applies to all entities and is effective for annual periods ending after December 15, 2016, and interim periods thereafter, with early adoption permitted. The Company has not yet adopted ASU 2014-15 nor assessed its potential impact on its disclosures.
In January 2015, the FASB issued Accounting Standards update 2015-01, Simplifying Income Statement Presentation by Eliminating the Concept of Extraordinary Items (“ASU 2015-01”). ASU 2015-01 eliminates the requirement for entities to consider whether an underlying event or transaction is extraordinary, and, if so, to separately present the item in the income statement net of tax, after income from continuing operations. Instead, items that are both unusual and infrequent should be separately presented as a component of income from continuing operations, or be disclosed in the notes to the financial statements. ASU 2015-01 will be effective for all entities for fiscal years, and interim periods within those fiscal years, beginning after December 31, 2015. Early adoption is permitted provided that the new standard is applied from the beginning of the fiscal year of adoption. The Company has not historically reported extraordinary items in its consolidated financial statements, and is not aware of any pending transactions or events that might have required reporting as extraordinary items, and therefore does not expect the adoption of ASU 2015-01 to have a material impact on its consolidated financial statements.
In March 2015, the FASB issued Accounting Standards update 2015-02, Amendments to the Consolidation Analysis (“ASU 2015-02”). ASU 2015-02 eliminates entity specific consolidation guidance for limited partnerships, and revises other aspects of the consolidation analysis, but does not change the existing consolidation guidance for corporations that are not variable interest entities (“VIEs”). For public business entities, ASU 2015-02 will be effective for fiscal years, and interim periods within those fiscal years, beginning after December 15, 2015, with early adoption permitted. The Company does not expect ASU 2015-02 to have a material impact on its consolidated financial statements.
In April 2015, the FASB issued Accounting Standards update 2015-03, Simplifying the Presentation of Debt Issuance Costs (“ASU 2015-03”). ASU 2015-03 changes the presentation of debt issuance costs in financial statements, by requiring them to be presented in the balance sheet as a direct deduction from the related debt liability, rather than as an asset. Amortization of the costs is reported as interest expense. There is no change to the current guidance on the recognition and measurement of debt issuance costs. For public business entities, ASU 2015-03 will be effective for fiscal years, and interim periods within those fiscal years, beginning after December 15, 2015, with early adoption permitted. The Company does not expect ASU 2015-03 to have a material impact on its consolidated financial statements.
In August 2015, the FASB issued Accounting Standards update 2015-15, Interest – Imputation of Interest, (“ASU 2015-15”). ASU 2015-15 amends subtopic 835-30 of the accounting standards codification (which was previously amended by ASU 2015-03), to allow for the capitalization of debt issuance costs related to line of credit agreements. Capitalized costs would be presented as an asset
F-11
and subsequently amortized ratably over the term of the line of credit. The Company does not expect ASU 2015-15 to have a material impact on its consolidated financial statements.
In September 2015, the FASB issued Accounting Standards update 2015-16, Simplifying the Accounting for Measurement-Period Adjustments (“ASU 2015-16”). ASU 2015-16 changes the recognition of business combination adjustments by requiring acquirers to recognize adjustments to provisional amounts identified during the measurement period in the reporting period in which the adjustment amounts are determined. The acquirer is required to record the effect on earnings of changes in depreciation, amortization, or other income effects, if any, as a result of the change to the provisional amounts. These amounts are calculated as if the accounting was completed at acquisition date. The acquirer is also required to present separately on the face of the income statement, or disclose in the notes, the amount recorded in current-period earnings (by line item) that would have been recorded in previous reporting periods had the adjustments been recognized as of the acquisition date. ASU 2015-16 will be effective for fiscal years, and interim periods within those fiscal years, beginning after December 15, 2015. The Company does not expect ASU 2015-16 to have a material impact on its consolidated financial statements.
In November 2015, the FASB issued Accounting Standards update 2015-17, Balance Sheet Classification of Deferred Taxes (“ASU 2015-17”). ASU 2015-17 requires all deferred tax assets and liabilities to be classified as non-current on the balance sheet. This amendment simplifies the presentation of deferred income taxes. ASU 2015-17 will be effective for fiscal years, and interim periods within those fiscal years, beginning after December 15, 2016. The Company has not yet adopted ASU 2015-17, however its effects are not expected to have a material impact on the consolidated financial statements.
In February 2016, the FASB issued Accounting Standards update 2016-02, Leases (“ASU 2016-02”). ASU 2016-02 requires a lessee to recognize a lease asset representing its right to use the underlying asset for the lease term, and a lease liability for the payments to be made to lessor, on its balance sheet for all operating leases greater than 12 months. ASU 2016-02 will be effective for fiscal years, and interim periods within those fiscal years, beginning after December 15, 2018. The Company has not yet adopted ASU 2016-02 nor assessed its potential impact on the financial statements.
Note 3 – Acquisition of National Loan Exchange, Inc.
On June 2, 2014, and effective May 31, 2014, the Company acquired all of the issued and outstanding capital stock in National Loan Exchange, Inc. (“NLEX”), a broker of charged-off receivables in the United States and Canada. NLEX operates as a wholly owned division of the Company. The acquisition of NLEX is consistent with HGI’s strategy to expand the services provided by its asset liquidation business. In connection with the acquisition, HGI entered into employment agreements with the previous owner and key employees of NLEX.
The consideration for the acquisition consisted of $2.0 million cash and an earn-out provision (“contingent consideration”). Under the terms of the NLEX purchase agreement, the Company will pay, to the former owner of NLEX, 50% of the Net Profits (as defined in the NLEX stock purchase agreement) of NLEX for each of the four years following the closing. The payments are due on or about July 30 of each year, beginning in 2015. In July 2015 the Company made its first payment to the former owner of NLEX in the amount of $0.5 million. The contingent consideration is capped at an aggregate of $5.0 million, and at December 31, 2015, subject to the application of a 9% discount rate, was estimated to have a present value of approximately $3.5 million. Key assumptions in determining this present value include projected earnings through May 2018 and a weighted average cost of capital of 31.6%. At December 31, 2015, the Company has recorded a current liability of $0.9 million for the estimated second earn-out payment due in 2016, and estimated that the non-current portion of the contingent consideration is $2.6 million.
In connection with the contingent consideration, the Company recognized a total of $0.2 million of other income which represents the mark-to-market of the present value during the year ended December 31, 2015.
F-12
The following table summarizes the consideration paid for NLEX and the amounts of the assets acquired and liabilities assumed, with the excess purchase price recognized as goodwill (in thousands).
|
Consideration |
|
|
|
|
|
Cash paid on closing |
|
$ |
2,000 |
|
|
Contingent consideration |
|
|
3,989 |
|
|
Total purchase price |
|
$ |
5,989 |
|
|
|
|
|
|
|
|
Acquisition related costs (included in selling, general, and administrative expenses in HGI’s consolidated statement of operations and comprehensive loss for the year ended December 31, 2014) |
|
$ |
198 |
|
|
|
|
|
|
|
|
Recognized amounts of identifiable assets acquired and liabilities assumed |
|
|
|
|
|
Cash |
|
$ |
639 |
|
|
Other current assets |
|
|
17 |
|
|
Fixed assets |
|
|
14 |
|
|
Identifiable intangible assets |
|
|
3,390 |
|
|
Accounts payable and accrued liabilities |
|
|
(656 |
) |
|
Deferred tax liability |
|
|
(960 |
) |
|
Total identifiable net assets assumed |
|
|
2,444 |
|
|
Goodwill |
|
|
3,545 |
|
|
|
|
$ |
5,989 |
|
The intangible assets and goodwill are discussed in more detail in Note 8.
The goodwill of $3.5 million arising from the acquisition consists largely of the synergies and economies of scale expected from combining the operations of the Company and NLEX. None of the goodwill recognized is expected to be deductible for income tax purposes.
The amounts of NLEX revenue and net income for the period June 1, 2014 through December 31, 2014, and January 1, 2015 through December 31, 2015 included in HGI’s consolidated statement of operations for the years then ended, are shown below. Also shown are HGI’s pro-forma consolidated revenue and net loss as if the acquisition of NLEX had occurred on January 1, 2014 (in thousands):
|
|
|
Revenue |
|
|
Net income (loss) |
|
||
|
|
|
|
|
|
|
|
|
|
|
NLEX revenue and net income included for the year ended December 31, 2015 |
|
$ |
4,503 |
|
|
$ |
1,640 |
|
|
|
|
|
|
|
|
|
|
|
|
NLEX revenue and net income included for the period June 1, 2014 through December 31, 2014 |
|
$ |
2,076 |
|
|
$ |
526 |
|
|
|
|
|
|
|
|
|
|
|
|
Supplemental pro-forma consolidated revenue and net loss (unaudited): |
|
|
|
|
|
|
|
|
|
HGI revenue and net income for the year ended December 31, 2014 |
|
$ |
15,609 |
|
|
$ |
(26,506 |
) |
Note 4 – Real Estate Inventory Write-down
In October 2015, the Company executed a listing agreement with a real estate broker to list its real estate inventory for sale at a list price of $4.9 million. The carrying value of the inventory had been $6.5 million. The Company determined that the net realizable value for the inventory, based on the most probable selling price net of costs to complete the sale, was $3.7 million. As such, the Company recorded an inventory write-down charge during 2015 of $2.7 million, reducing the carrying cost of the inventory to $3.7 million.
F-13
Note 5 – Equity Method Investments
The table below details the Company’s share of revenues and operating income earned from the Joint Ventures in which it was invested during the years ended December 31, 2015 and 2014 (in thousands):
|
|
|
2015 |
|
|
2014 |
|
||
|
Revenues |
|
$ |
1,007 |
|
|
$ |
2,177 |
|
|
Operating income |
|
$ |
286 |
|
|
$ |
143 |
|
The table below details the summarized components of assets and liabilities, as at December 31, 2015 and 2014, attributable to HGI from the Joint Ventures in which it was invested at those dates (in thousands):
|
|
|
2015 |
|
|
2014 |
|
||
|
Current assets |
|
$ |
194 |
|
|
$ |
1,055 |
|
|
Noncurrent assets |
|
$ |
— |
|
|
$ |
40 |
|
|
Current liabilities |
|
$ |
291 |
|
|
$ |
117 |
|
The table below details the classification of the Earnings of equity method investments within the consolidated statements of operations and comprehensive loss for the years ended December 31, 2015 and 2014 (in thousands):
|
|
|
2015 |
|
|
2014 |
|
||
|
Earnings of equity method investments included within operating loss |
|
$ |
286 |
|
|
$ |
143 |
|
|
Earnings of equity method investments included within other income |
|
|
5 |
|
|
|
261 |
|
|
Total earnings of equity method investments |
|
$ |
291 |
|
|
$ |
404 |
|
Polaroid
In 2009, the Company invested approximately $2.6 million to indirectly acquire an approximate 5% interest in Polaroid Corporation and invested a further $0.3 million in 2010. The Company accounted for its investment in Polaroid using the equity method. Upon exiting the investment in December 2014, the Company recognized a gain on sale of $0.6 million. As of December 31, 2014 a total of $2.0 million is included in accounts receivable in connection with the sale of this investment which was collected in the first quarter of 2015.
Note 6 – Earnings per Share
The Company is required, in periods in which it has net income, to calculate basic earnings per share (“basic EPS”) using the two-class method. The two-class method is required because the Company’s Class N preferred shares, each of which is convertible to 40 common shares, have the right to receive dividends or dividend equivalents should the Company declare dividends on its common stock. Under the two-class method, earnings for the period are allocated on a pro-rata basis to the common and preferred stockholders. The weighted-average number of common and preferred shares outstanding during the period is then used to calculate basic EPS for each class of shares.
In periods in which the Company has a net loss, basic loss per share is calculated by dividing the loss attributable to common stockholders by the weighted-average number of common shares outstanding during the period. The two-class method is not used in periods in which the Company has a net loss because the preferred stock does not participate in losses.
The Company’s restricted share awards have been included in the weighted-average number of common shares outstanding since the date the shares were issued in 2014.
Stock options and other potential common shares are included in the calculation of diluted earnings per share (“diluted EPS”), since they are assumed to be exercised or converted, except when their effect would be anti-dilutive. For the years ended December 31, 2015 and 2014, the Company recorded a net loss and therefore in both years excluded the outstanding options from its calculation of diluted EPS, since they would be anti-dilutive.
F-14
Note 7 – Property and Equipment
Property and equipment are recorded at historical cost. Depreciation is provided for in amounts sufficient to relate the cost of depreciable assets to operations over their estimated service lives on a straight-line basis. Leasehold improvements are amortized over the useful life of the asset or the lease term, whichever is shorter. Estimated service lives are five years for furniture, fixtures and office equipment and three years for software and technology assets. Expenditures for repairs and maintenance not considered to substantially lengthen the life of the asset or increase capacity or efficiency are charged to expense as incurred.
The following summarizes the components of the Company’s property and equipment (in thousands):
|
|
|
December 31, 2015 |
|
|
December 31, 2014 |
|
||
|
Furniture, fixtures and office equipment |
|
$ |
193 |
|
|
$ |
202 |
|
|
Software and technology assets |
|
|
147 |
|
|
|
199 |
|
|
|
|
|
340 |
|
|
|
401 |
|
|
Accumulated depreciation |
|
|
(230 |
) |
|
|
(251 |
) |
|
Property and equipment, net |
|
$ |
110 |
|
|
$ |
150 |
|
Depreciation expense related to property and equipment was $49,000 and $23,000 for 2015 and 2014, respectively.
Note 8 – Intangible Assets and Goodwill
Intangible assets
The details of all identifiable intangible assets as of December 31, 2015 and 2014, are shown below (in thousands except for lives):
|
Amortized Intangible Assets |
Original Life (years) |
|
Remaining Life (years) |
|
Acquisition Cost |
|
|
Accumulated Amortization |
|
|
Impairment |
|
|
Carrying Value December 31, 2015 |
|
||||
|
Customer Network (HGP) |
12 |
|
8.2 |
|
$ |
4,180 |
|
|
$ |
(1,253 |
) |
|
$ |
(2,749 |
) |
|
$ |
178 |
|
|
Trade Name (HGP) |
14 |
|
10.2 |
|
|
1,460 |
|
|
|
(401 |
) |
|
|
— |
|
|
|
1,059 |
|
|
Customer Relationships (NLEX) |
7.6 |
|
6.1 |
|
|
834 |
|
|
|
(174 |
) |
|
|
— |
|
|
|
660 |
|
|
Non-Compete Agreement (NLEX) |
2 |
|
0.4 |
|
|
71 |
|
|
|
(56 |
) |
|
|
— |
|
|
|
15 |
|
|
Website (NLEX) |
5 |
|
3.4 |
|
|
48 |
|
|
|
(15 |
) |
|
|
— |
|
|
|
33 |
|
|
Total |
|
|
|
|
|
6,593 |
|
|
|
(1,899 |
) |
|
|
(2,749 |
) |
|
|
1,945 |
|
|
|
|
|
|
|
|
|
|
|
|
|
|
|
|
|
|
|
|
|
|
|
Unamortized Intangible Assets |
|
|
|
|
|
|
|
|
|
|
|
|
|
|
|
|
|
|
|
|
Trade Name (NLEX) |
N/A |
|
N/A |
|
|
2,437 |
|
|
|
— |
|
|
|
— |
|
|
|
2,437 |
|
|
Total |
|
|
|
|
$ |
9,030 |
|
|
$ |
(1,899 |
) |
|
$ |
(2,749 |
) |
|
$ |
4,382 |
|
|
|
|
|
|
|
|
|
|
|
|
|
|
|
|
|
|
|
|
|
|
|
|
|
|
|
|
|
|
|
|
|
|
|
|
|
|
|
|
|
|
|
|
Amortized Intangible Assets |
Original Life (years) |
|
Remaining Life (years) |
|
Acquisition Cost |
|
|
Accumulated Amortization |
|
|
Impairment |
|
|
Carrying Value December 31 2014 |
|
||||
|
Customer Network (HGP) |
12 |
|
9.2 |
|
$ |
4,180 |
|
|
$ |
(987 |
) |
|
$ |
— |
|
|
$ |
3,193 |
|
|
Trade Name (HGP) |
14 |
|
11.2 |
|
|
1,460 |
|
|
|
(295 |
) |
|
|
— |
|
|
|
1,165 |
|
|
Customer Relationships (NLEX) |
7.6 |
|
7.1 |
|
|
834 |
|
|
|
(64 |
) |
|
|
— |
|
|
|
770 |
|
|
Non-Compete Agreement (NLEX) |
2 |
|
1.4 |
|
|
71 |
|
|
|
(21 |
) |
|
|
— |
|
|
|
50 |
|
|
Website (NLEX) |
5 |
|
4.4 |
|
|
48 |
|
|
|
(6 |
) |
|
|
— |
|
|
|
42 |
|
|
Total |
|
|
|
|
|
6,593 |
|
|
|
(1,373 |
) |
|
|
— |
|
|
|
5,220 |
|
|
|
|
|
|
|
|
|
|
|
|
|
|
|
|
|
|
|
|
|
|
|
Unamortized Intangible Assets |
|
|
|
|
|
|
|
|
|
|
|
|
|
|
|
|
|
|
|
|
Trade Name (NLEX) |
N/A |
|
N/A |
|
|
2,437 |
|
|
|
— |
|
|
|
— |
|
|
|
2,437 |
|
|
Total |
|
|
|
|
$ |
9,030 |
|
|
$ |
(1,373 |
) |
|
$ |
— |
|
|
$ |
7,657 |
|
F-15
Amortization expense during each of 2015 and 2014 was $0.5 million. No significant residual value is estimated for these intangible assets.
The Company performed its annual impairment test in the fourth quarter of 2015. The Company first performed a qualitative assessment of its intangible assets to determine if the two-step impairment test was required. The results of the qualitative analysis assessment of the HGP customer network and tradename indicated that, due to the sustained losses of HGP, the Company would be required to perform the two-step impairment test. The Company tested the recoverability of each asset using an undiscounted cash flow analysis. Based on the results of the test, the Company concluded that the carrying cost of the HGP tradename was recoverable, and therefore no further testing was warranted, however the carrying cost of the HGP customer network was not recoverable, and therefore the Company proceeded to step two of the impairment test. Under step two of the impairment test, the Company used a discounted cash flow analysis to determine the fair value of the customer network, which was then compared against the asset’s carrying cost to determine if an impairment charge is warranted. This step of the assessment indicated that the fair value of the customer network was less than its carrying value, and as a result, the Company recorded a non-cash impairment charge of $2.7 million in the fourth quarter of 2015, reducing the carrying amount of the HGP customer network to $0.2 million.
The estimated amortization expense during the next five fiscal years and thereafter is shown below:
|
Year |
|
Amount |
|
|
|
2016 |
|
$ |
260 |
|
|
2017 |
|
|
245 |
|
|
2018 |
|
|
245 |
|
|
2019 |
|
|
240 |
|
|
2020 |
|
|
236 |
|
|
Thereafter |
|
|
719 |
|
|
Total |
|
$ |
1,945 |
|
Goodwill
As part of its acquisitions, the Company recognized goodwill of $0.6 million related to Equity Partners in 2011, $4.7 million related to HGP in 2012, and $3.5 million related to NLEX in 2014.
A summary of the goodwill for 2015 and 2014 is shown below (in thousands):
|
Acquisition |
|
December 31, 2014 |
|
|
Acquired |
|
|
Disposed |
|
|
Impairment |
|
|
December 31, 2015 |
|
|||||
|
Equity Partners |
|
$ |
573 |
|
|
$ |
— |
|
|
$ |
— |
|
|
$ |
— |
|
|
$ |
573 |
|
|
HGP |
|
|
4,728 |
|
|
|
— |
|
|
|
— |
|
|
|
(2,688 |
) |
|
|
2,040 |
|
|
NLEX |
|
|
3,545 |
|
|
|
— |
|
|
|
— |
|
|
|
— |
|
|
|
3,545 |
|
|
Total goodwill |
|
$ |
8,846 |
|
|
$ |
— |
|
|
$ |
— |
|
|
$ |
(2,688 |
) |
|
$ |
6,158 |
|
|
|
|
|
|
|
|
|
|
|
|
|
|
|
|
|
|
|
|
|
|
|
|
|
|
|
|
|
|
|
|
|
|
|
|
|
|
|
|
|
|
|
|
|
|
Acquisition |
|
December 31, 2013 |
|
|
Acquired |
|
|
Disposed |
|
|
Impairment |
|
|
December 31, 2014 |
|
|||||
|
Equity Partners |
|
$ |
573 |
|
|
$ |
— |
|
|
$ |
— |
|
|
$ |
— |
|
|
$ |
573 |
|
|
HGP |
|
|
4,728 |
|
|
|
— |
|
|
|
— |
|
|
|
— |
|
|
|
4,728 |
|
|
NLEX |
|
|
— |
|
|
|
3,545 |
|
|
|
— |
|
|
|
— |
|
|
|
3,545 |
|
|
Total goodwill |
|
$ |
5,301 |
|
|
$ |
3,545 |
|
|
$ |
— |
|
|
$ |
— |
|
|
$ |
8,846 |
|
In 2015 the Company changed the date of its annual impairment test from December 31 to October 1. The change allows the Company to perform the required testing on a more timely basis for its fiscal year-end close process. The Company does not believe that the change in the date has a material impact on the result of the 2015 annual impairment test.
The Company performed its annual impairment test in the fourth quarter of 2015. The Company first performed a qualitative assessment of its reporting units to determine if the two-step impairment test was required. The results of the qualitative assessment of the HGP reporting unit indicated that due to its sustained losses the Company would be required to perform the two-step impairment test. The Company performed the first step of the impairment test by comparing the fair value of the reporting unit to its carrying
F-16
value. The Company determined the fair value of the reporting unit using a combination of valuation techniques, including multiples from comparable companies and discounted cash flows, due to the lack of quoted market prices for the reporting unit. The carrying value of the reporting unit exceeded its fair value, and the Company proceeded to step two of the impairment test. Under step two of the impairment test the Company performed a hypothetical purchase price allocation as if the reporting unit was being acquired in a business combination, and estimated the fair value of the identifiable assets and liabilities of the reporting unit. This determination required the Company to make estimates and assumptions regarding the fair value of its recorded assets and liabilities. This step of the assessment indicated that the implied fair value of the Company’s goodwill for HGP was $2.0 million. As a result, the Company recorded a non-cash impairment charge of $2.7 million in the fourth quarter of 2015, reducing the carrying amount of its HGP goodwill to $2.0 million.
Note 9 – Accounts Receivable and Accounts Payable
Accounts receivable
As described in Note 2, the Company’s accounts receivable are primarily related to the operations of its asset liquidation business. With respect to auction proceeds and asset dispositions, including NLEX’s accounts receivable brokerage transactions, the assets are not released to the buyer until payment has been received. The Company, therefore, is not exposed to significant collectability risk relating to these receivables. Given this experience, together with the ongoing business relationships between the Company and its joint venture partners, the Company has not historically required a formal credit quality assessment in connection with these activities. The Company has not experienced any significant collectability issues with its accounts receivable. As the Company’s asset liquidation business expands, more comprehensive credit assessments may be required.
The Company’s allowance for doubtful accounts was $44,000 and $31,000 as of December 31, 2015 and 2014, respectively.
Accounts payable and accrued liabilities
Accounts payable and accrued liabilities consisted of the following at December 31 (in thousands):
|
|
|
2015 |
|
|
2014 |
|
||
|
Due to auction clients |
|
$ |
3,457 |
|
|
$ |
2,353 |
|
|
Sales and other taxes |
|
|
1,421 |
|
|
|
1,156 |
|
|
Remuneration and benefits |
|
|
645 |
|
|
|
957 |
|
|
Accounting, auditing and tax consulting |
|
|
128 |
|
|
|
140 |
|
|
Customer deposits |
|
|
108 |
|
|
|
503 |
|
|
Due to Joint Venture partners |
|
|
69 |
|
|
|
1,020 |
|
|
Asset liquidation expenses |
|
|
246 |
|
|
|
540 |
|
|
Interest expense |
|
|
76 |
|
|
|
94 |
|
|
Other |
|
|
523 |
|
|
|
462 |
|
|
Total accounts payable and accrued liabilities |
|
$ |
6,673 |
|
|
$ |
7,225 |
|
Note 10 – Debt
Outstanding debt at December 31, 2015 and 2014 is summarized as follows (in thousands):
|
|
|
December 31, 2015 |
|
|
December 31, 2014 |
|
||
|
Current: |
|
|
|
|
|
|
|
|
|
Third party debt |
|
$ |
— |
|
|
$ |
525 |
|
|
Related party debt |
|
|
1,721 |
|
|
|
2,985 |
|
|
|
|
|
1,721 |
|
|
|
3,510 |
|
|
Non-current: |
|
|
|
|
|
|
|
|
|
Third party debt |
|
|
2,500 |
|
|
|
2,500 |
|
|
Total debt |
|
$ |
4,221 |
|
|
$ |
6,010 |
|
The Company entered into a loan with an unrelated third party during the second quarter of 2014 for a principal amount of $2.5 million. The loan bears interest at 6% and had an original maturity date of January 15, 2015. In December 2014, the maturity date was
F-17
extended to January 15, 2016 at the same interest rate and in early 2016 the maturity date was further extended to January 15, 2017 at the same interest rate.
The Company’s Related Party Debt (the “Street Capital Loan”), which is due on demand, was originally entered into in 2003 and accrued interest at 10% per annum compounded quarterly from the date funds were advanced. The Street Capital Loan is secured by the assets of the Company.
In the second quarter of 2014, following Street Capital’s distribution of its ownership interest in HGI to Street Capital shareholders as a dividend in kind, the unpaid balance of the Street Capital Loan began accruing interest at a rate per annum equal to the lesser of the Wall St. Journal (“WSJ”) prime rate + 2.0%, or the maximum rate allowable by law. As of December 31, 2015 and 2014, the interest rate on the loan was 5.50% and 5.25%, respectively. Please see Note 14 for further discussion of transactions with Street Capital.
The third party debt at December 31, 2014 included $0.5 million outstanding under a credit facility provided by a U.S. bank. The credit facility was repaid in full and terminated in March 2015.
Note 11 – Fair Value Measurements
In accordance with the authoritative guidance for financial assets and liabilities measured at fair value on a recurring basis, the Company prioritizes the inputs used to measure fair value from market-based assumptions to entity specific assumptions:
|
|
· |
Level 1 – Inputs based on quoted market prices for identical assets or liabilities in active markets at the measurement date. |
|
|
· |
Level 2 – Observable inputs other than quoted prices included in Level 1, such as quoted prices for similar assets and liabilities in active markets; quoted prices for identical or similar liabilities in markets that are not active; or other inputs that are observable or can be corroborated by observable market data. |
|
|
· |
Level 3 – Inputs which reflect management’s best estimate of what market participants would use in pricing the asset or liability at the measurement date. The inputs are unobservable in the market and significant to the instruments valuation. |
As of December 31, 2015 and 2014, the Company had no Level 1 or Level 2 assets or liabilities measured at fair value. As of December 31, 2015 and 2014, the Company’s contingent consideration from the acquisition of NLEX in 2014 of $3.5 million and $4.2 million respectively, was the only liability measured at fair value on a recurring basis, and was classified as Level 3 within the fair value hierarchy. The fair value of the Company’s contingent consideration was determined using a discounted cash flow analysis, which is based on significant inputs that are not observable in the market.
The following tables present the Company’s hierarchy for its assets measured at fair value on a recurring basis as of December 31, 2015 and 2014 (in thousands):
|
|
|
Fair Value as of December 31, 2015 |
|
|||||||||||||
|
|
|
Level 1 |
|
|
Level 2 |
|
|
Level 3 |
|
|
Total |
|
||||
|
Liabilities |
|
|
|
|
|
|
|
|
|
|
|
|
|
|
|
|
|
Contingent consideration |
|
$ |
— |
|
|
$ |
— |
|
|
$ |
3,457 |
|
|
$ |
3,457 |
|
|
|
|
|
|
|
|
|
|
|
|
|
|
|
|
|
|
|
|
|
|
|
|
|
|
|
|
|
|
|
|
|
|
|
|
|
|
|
|
Fair Value as of December 31, 2014 |
|
|||||||||||||
|
|
|
Level 1 |
|
|
Level 2 |
|
|
Level 3 |
|
|
Total |
|
||||
|
Liabilities |
|
|
|
|
|
|
|
|
|
|
|
|
|
|
|
|
|
Contingent consideration |
|
$ |
- |
|
|
$ |
- |
|
|
$ |
4,198 |
|
|
$ |
4,198 |
|
When valuing its Level 3 liabilities, the Company gives consideration to operating results, financial condition, economic and/or market events, and other pertinent information that would impact its estimate of the expected contingent consideration payment. The valuation of the liability is primarily based on management’s estimate of the Net Profits of NLEX (as defined in the NLEX stock purchase agreement). Given the short term nature of the contingent consideration periods, changes in the discount rate are not expected to have a material impact on the fair value of the liability.
The following table summarizes the changes in the fair value of the liability during 2014 and 2015 (in thousands):
F-18
|
|
|
|
|
|
|
Balance at December 31, 2013 |
|
$ |
— |
|
|
Acquisition contingent consideration |
|
|
4,198 |
|
|
Balance at December 31, 2014 |
|
|
4,198 |
|
|
Payment of contingent consideration |
|
|
(513 |
) |
|
Mark-to-market of contingent consideration |
|
|
(228 |
) |
|
Balance at December 31, 2015 |
|
$ |
3,457 |
|
The Company’s assets measured at fair value on a non-recurring basis as of December 31, 2015 consisted of its goodwill and intangible assets subject to the impairment charges recorded during the fourth quarter of 2015. No such assets were measured at fair value on a non-recurring basis as of December 31, 2014. Refer to Note 8 for further detail on the fair value techniques used by the Company in assessing the fair value of the goodwill and intangible assets.
Note 12 – Commitments and Contingencies
At December 31, 2015, HGI’s lease commitments related to its offices in California, Illinois, Maryland, Georgia and Arizona, an automobile lease, and a copier lease. The California leases expire in July 2016 and January 2020; the Illinois lease expires in June 2018, and the Georgia and Arizona leases expire in August 2016. The automobile lease expires in June 2017, and the copier lease expires in October 2018. The annual lease obligations are as shown below (in thousands):
|
2016 |
|
$ |
372 |
|
|
2017 |
|
|
226 |
|
|
2018 |
|
|
166 |
|
|
2019 |
|
|
127 |
|
|
2020 |
|
|
6 |
|
|
Total |
|
$ |
897 |
|
In the normal course of its business, HGI may be subject to contingent liabilities with respect to assets sold either directly or through Joint Ventures. At December 31, 2015 HGI does not expect any potential contingent liabilities, individually or in the aggregate, to have a material adverse effect on its assets or results of operations.
Note 13 – Income Taxes
In 2014 the Company recorded a valuation allowance against its deferred tax assets, reducing the carrying value of those assets to zero, as a result of incurring losses in 2012, 2013 and 2014. At December 31, 2015, the Company continued to carry a full valuation allowance against its deferred tax assets. The following table summarizes the change in the valuation allowance during 2014 and 2015 (in thousands):
|
Balance at December 31, 2013 |
|
$ |
4,740 |
|
|
Change during 2014 |
|
|
24,102 |
|
|
Balance at December 31, 2014 |
|
|
28,842 |
|
|
Change during 2015 |
|
|
3,080 |
|
|
Balance at December 31, 2015 |
|
$ |
31,922 |
|
At December 31, 2015 the Company has aggregate tax net operating loss carry forwards of approximately $74.0 million ($58.9 million of unrestricted net operating tax losses and approximately $15.1 million of restricted net operating tax losses) and unused minimum tax credit carry forwards of $0.5 million. Substantially all of the net operating loss carryforwards and unused minimum tax credit carry forwards expire between 2024 and 2034.
F-19
The reported tax expense varies from the amount that would be provided by applying the statutory U.S. Federal income tax rate to the loss before income tax expense for the following reasons in each of the years ending December 31 (in thousands):
|
|
|
2015 |
|
|
2014 |
|
||
|
Expected federal statutory tax benefit |
|
$ |
(4,130 |
) |
|
$ |
(694 |
) |
|
Increase (reduction) in taxes resulting from: |
|
|
|
|
|
|
|
|
|
State income taxes recoverable |
|
|
17 |
|
|
|
56 |
|
|
Non-deductible expenses (permanent differences) |
|
|
1,162 |
|
|
|
537 |
|
|
Change in valuation allowance |
|
|
3,080 |
|
|
|
24,102 |
|
|
Rate changes |
|
|
— |
|
|
|
55 |
|
|
Other |
|
|
(114 |
) |
|
|
666 |
|
|
Income tax expense |
|
$ |
15 |
|
|
$ |
24,722 |
|
The Company’s utilization of restricted net operating tax loss carry forwards against future income for tax purposes is restricted pursuant to the “change in ownership” rules in Section 382 of the Internal Revenue Code. These rules, in general, provide that an ownership change occurs when the percentage shareholdings of 5% direct or indirect stockholders of a loss corporation have, in aggregate, increased by more than 50 percentage points during the immediately preceding three years.
Restrictions in net operating loss carry forwards occurred in 2001 as a result of the acquisition of the Company by Street Capital. Further restrictions may have occurred as a result of subsequent changes in the share ownership and capital structure of the Company and Street Capital and disposition of business interests by the Company. Pursuant to Section 382 of the Internal Revenue Code, the annual usage of the Company’s net operating loss carry forwards was limited to approximately $2.5 million per annum until 2008 and $1.7 million per annum thereafter. There is no certainty that the application of these “change in ownership” rules may not recur, resulting in further restrictions on the Company’s income tax loss carry forwards existing at a particular time. In addition, further restrictions, reductions in, or expiration of net operating loss and net capital loss carry forwards may occur through future merger, acquisition and/or disposition transactions or failure to continue a significant level of business activities. Any such additional limitations could require the Company to pay income taxes on its future earnings and record an income tax expense to the extent of such liability, despite the existence of such tax loss carry forwards.
All loss taxation years remain open for audit pending the application of the respective tax losses against income in a subsequent taxation year. In general, the statute of limitations expires three years from the date that a company files a tax return applying prior year tax loss carry forwards against income for tax purposes in the later year. The 2011 through 2013 taxation years remain open for audit.
The Company is subject to state income tax in multiple jurisdictions. In most states, the Company does not have tax loss carry forwards available to shield income attributable to a particular state from being subject to tax in that particular state.
The components of the deferred tax assets and liabilities as of December 31, 2015 and 2014 are as follows in (thousands):
|
|
|
2015 |
|
|
2014 |
|
||
|
Net operating loss carry forwards |
|
$ |
30,073 |
|
|
$ |
29,437 |
|
|
Stock based compensation |
|
|
1,019 |
|
|
|
870 |
|
|
Write-down of real estate inventory |
|
|
1,550 |
|
|
|
456 |
|
|
Trade names |
|
|
(1,388 |
) |
|
|
(1,418 |
) |
|
Customer relationships |
|
|
(351 |
) |
|
|
(1,597 |
) |
|
Minimum tax credit carry forwards |
|
|
— |
|
|
|
186 |
|
|
Mark to market of contingent consideration |
|
|
91 |
|
|
|
— |
|
|
Other |
|
|
(32 |
) |
|
|
(52 |
) |
|
Gross deferred tax assets |
|
|
30,962 |
|
|
|
27,882 |
|
|
Less: valuation allowance |
|
|
(31,922 |
) |
|
|
(28,842 |
) |
|
Deferred tax assets (liabilities), net of valuation allowance |
|
$ |
(960 |
) |
|
$ |
(960 |
) |
As a result of the acquisition of NLEX in 2014, and the recognition of an indefinite-lived intangible asset in the amount of $2.4 million related to the NLEX trade name, the Company is required to record a non-current deferred tax liability in the amount of $1.0 million.
F-20
Uncertain Tax Positions
The accounting for uncertainty in income taxes requires a more-likely-than-not threshold for financial statement recognition and measurement of tax positions taken or expected to be taken in a tax return. Upon adoption of this principle, effective in 2007, the Company derecognized certain tax positions that, upon examination, more likely than not would not have been sustained as a recognized tax benefit. As a result of derecognizing uncertain tax positions, the Company has recorded a cumulative reduction in its deferred tax assets of approximately $12.0 million associated with prior years’ tax benefits, which are not expected to be available primarily due to change of control usage restrictions, and a reduction in the rate of the tax benefit associated with all of its tax attributes.
Due to the Company’s historic policy of applying a valuation allowance against its deferred tax assets, the effect of the above was an offsetting reduction in the Company’s valuation allowance. Accordingly, the above reduction had no net impact on the Company’s financial position, operations or cash flow. As of December 31, 2015, the unrecognized tax benefit has been determined to be $12.1 million, which is unchanged from the balance as of December 31, 2014.
In the unlikely event that these tax benefits are recognized in the future, the amount recognized at that time should result in a reduction in the Company’s effective tax rate.
The Company’s policy is to recognize accrued interest and penalties related to unrecognized tax benefits in income tax expense. Because the Company has tax loss carry forwards in excess of the unrecognized tax benefits, the Company did not accrue for interest and penalties related to unrecognized tax benefits either upon the initial derecognition of uncertain tax positions or in the current period.
It is possible that the total amount of the Company’s unrecognized tax benefits will significantly increase or decrease within the next 12 months. These changes may be the result of future audits, the application of “change in ownership” rules leading to further restrictions in tax losses arising from changes in the capital structure of the Company, reductions in available tax loss carry forwards through future merger, acquisition and/or disposition transactions, failure to continue a significant level of business activities, or other circumstances not known to management at this time. At this time, an estimate of the range of reasonably possible outcomes cannot be made.
Note 14 – Related Party Transactions
Debt with Street Capital
Until the second quarter of 2014, as discussed below, Street Capital was the Company’s majority shareholder. Street Capital remained a related party following the distribution of its investment in HGI to Street Capital shareholders as a result of the Services Agreement and the relationship of the chairman of the board discussed below. The Services Agreement terminated on August 31, 2015, however subsequent to its termination Street Capital remained a related party because the Company’s chairman of the board, who is also a significant shareholder of the Company, is also the chairman of the board of Street Capital. At December 31, 2015 and 2014, the Company reported amounts owed to Street Capital of $1.7 million and $3.0 million, respectively, as related party debt (see Note 10). Total interest of $0.4 million has been accrued to the principal balance of the debt through December 31, 2015, and remains unpaid.
Street Capital Services Provided to Company
Beginning in 2004, HGI and Street Capital entered into successive annual management services agreements (collectively, the “Agreement”). Under the terms of the Agreement, HGI agreed to pay Street Capital for ongoing services provided to HGI by Street Capital personnel. These services included preparation of the Company’s financial statements and regulatory filings, taxation matters, stock-based compensation administration, Board administration, patent portfolio administration and litigation matters. The Street Capital employees providing the services were: 1) its Executive Vice President, Secretary and Chief Financial Officer, 2) its Tax Manager, 3) an Accounting Manager, and 4) its Accounts Payable Clerk. These employees had the same or similar positions with HGI, but none of them received compensation from HGI. Rather, Street Capital allocated to HGI a percentage, based on time incurred, of the employees’ base compensation paid by Street Capital. Beginning in 2011, additional amounts were charged to HGI for Street Capital services specifically relating to the ongoing operations of HGI’s asset liquidation business. The amounts due under the Agreement were payable within 30 days following the respective year end, subject to applicable restrictions. Any unpaid amounts bore interest at 10% per annum commencing on the day after such year end.
In 2013, Street Capital announced its plan to dispose of its interest in HGI, and on March 20, 2014, Street Capital declared a dividend in kind, consisting of Street Capital’s distribution of its majority interest in HGI to Street Capital shareholders. The dividend was paid on April 30, 2014 to shareholders of record as of April 1, 2014.
F-21
Following this disposition, the Company and Street Capital entered into a replacement management services agreement (the “Services Agreement”). Under the terms of the Services Agreement, Street Capital remained as external manager and continued to provide the same services, at similar rates, until the Services Agreement was terminated effective August 31, 2015, as described more fully in the Current Report on Form 8-K filed with the SEC on September 1, 2015.
The amounts charged by Street Capital, which are included in selling, general and administrative expenses and have been added to the Street Capital Loan balance, are detailed below (in thousands):
|
|
|
Year ended December 31, |
|
|||||
|
|
|
2015 |
|
|
2014 |
|
||
|
Management fees |
|
$ |
240 |
|
|
$ |
360 |
|
|
Other charges |
|
|
50 |
|
|
|
193 |
|
|
Total |
|
$ |
290 |
|
|
$ |
553 |
|
Transactions with Other Related Parties
The Company leases office space in Foster City, CA as part of the operations of HGP. The premises are owned by an entity that is jointly controlled by the HGI Chief Executive Officer and Chief Operating Officer/President. It also leases office space in Edwardsville, IL, as part of the operations of NLEX, which is owned by senior officers of NLEX. The lease amounts paid by the Company to the related parties, which are included in selling, general and administrative expenses during the year ended December 31, 2015 and 2014, are detailed below (in thousands):
|
|
|
Year ended December 31, |
|
|||||
|
Leased premises location |
|
2015 |
|
|
2014 |
|
||
|
Foster City, CA |
|
$ |
228 |
|
|
$ |
228 |
|
|
Edwardsville, IL |
|
|
97 |
|
|
|
57 |
|
|
Total |
|
$ |
325 |
|
|
$ |
285 |
|
Note 15 – Legal Proceedings
The Company is involved in various other legal matters arising out of its operations in the normal course of business, none of which are expected, individually or in the aggregate, to have a material adverse effect on the Company.
Note 16 – Stock-Based Compensation
Stock- Based Compensation Plans
At December 31, 2015, the Company had three stock-based compensation plans which are described below.
F-22
2003 Stock Option and Appreciation Rights Plan
In 2003, the stockholders of the Company approved the 2003 Stock Option and Appreciation Rights Plan (the “2003 Plan”) which provided for the issuance of incentive stock options, non-qualified stock options and Stock Appreciation Rights (“SARs”) up to an aggregate of 2,000,000 shares of common stock (subject to adjustment in the event of stock dividends, stock splits, and other similar events). The plan had a ten-year term, and therefore after 2013 no options have been issued. The price at which shares of common stock covered by the option can be purchased was determined by the Company’s Board or a committee thereof; however, in the case of incentive stock options the exercise price was never less than the fair market value of the Company’s common stock on the date the option was granted.
|
2003 Plan |
|
2015 |
|
|
2014 |
|
||
|
Options outstanding, beginning of year |
|
|
1,210,000 |
|
|
|
1,275,000 |
|
|
Options forfeited |
|
|
— |
|
|
|
(17,500 |
) |
|
Options expired |
|
|
(40,000 |
) |
|
|
(47,500 |
) |
|
Options outstanding, end of year |
|
|
1,170,000 |
|
|
|
1,210,000 |
|
The outstanding options vest over four years at exercise prices ranging from $0.08 to $2.00 per share. No SARs were issued under the 2003 Plan.
2010 Non-Qualified Stock Option Plan
In 2010, the Company’s Board approved the 2010 Non-Qualified Stock Option Plan (the “2010 Plan”) to induce certain key employees of the Company or any of its subsidiaries who are in a position to contribute materially to the Company’s prosperity to remain with the Company, to offer such persons incentives and rewards in recognition of their contributions to the Company’s progress, and to encourage such persons to continue to promote the best interests of the Company. The Company reserved 1,250,000 shares of common stock (subject to adjustment under certain circumstances) for issuance or transfer upon exercise of options granted under the 2010 Plan. Options may be issued under the 2010 Plan to any key employees or consultants selected by the Company’s Board (or an appropriately qualified committee). Options may not be granted with an exercise price less than the fair market value of the common stock of the Company as of the day of the grant. Options granted pursuant to the plan are subject to limitations on transfer and execution and may be issued subject to vesting conditions. Options may also be forfeited in certain circumstances. During 2015, options to purchase 50,000 shares were granted to the Company’s independent directors as part of their annual compensation. During 2014, options to purchase 50,000 shares were granted to the Company’s independent directors as part of their annual compensation, and options to purchase 50,000 shares were granted to an officer of the Company as part of his joining the Company.
|
2010 Plan |
|
2015 |
|
|
2014 |
|
||
|
Options outstanding, beginning of year |
|
|
100,000 |
|
|
|
— |
|
|
Options granted |
|
|
50,000 |
|
|
|
100,000 |
|
|
Options forfeited |
|
|
— |
|
|
|
— |
|
|
Options outstanding, end of year |
|
|
150,000 |
|
|
|
100,000 |
|
The outstanding options vest over four years at exercise prices ranging from $0.42 to $0.70 per share.
Equity Partners Stock Option Plan
In 2011, the Company’s Board approved the Equity Partners Stock Option Plan (the “Equity Partners Plan”) to allow the Company to issue options to purchase common stock as a portion of the purchase price of Equity Partners. The Company reserved 230,000 shares of common stock for issuance upon exercise of options granted under the Equity Partners Plan. During 2011, options to purchase 230,000 shares with an exercise price of $1.83, vesting immediately, were granted under the Equity Partners Plan.
|
Equity Partners Plan |
|
2015 |
|
|
2014 |
|
||
|
Options outstanding, beginning of year |
|
|
230,000 |
|
|
|
230,000 |
|
|
Options granted |
|
|
— |
|
|
|
— |
|
|
Options forfeited |
|
|
— |
|
|
|
— |
|
|
Options outstanding, end of year |
|
|
230,000 |
|
|
|
230,000 |
|
Other Options Issued
In 2012, the Company’s Board approved the issuance of options as part of the acquisition of HGP, and reserved 625,000 shares of common stock for issuance upon option exercise. The options have an exercise price of $2.00, and vest over four years, beginning
F-23
on the first anniversary of the grant date. Unlike other options issued by the Company under its stock option plans, the options issued as part of the HGP acquisition survive termination of employment. None of the option holders have terminated their employment with the Company.
|
Other Options |
|
2015 |
|
|
2014 |
|
||
|
Options outstanding, beginning of year |
|
|
625,000 |
|
|
|
625,000 |
|
|
Options granted |
|
|
— |
|
|
|
— |
|
|
Options forfeited |
|
|
— |
|
|
|
— |
|
|
Options outstanding, end of year |
|
|
625,000 |
|
|
|
625,000 |
|
Stock-Based Compensation Expense
Total compensation cost related to stock options in 2015 and 2014 was $0.3 million and $0.5 million, respectively. These amounts were recorded in selling, general and administrative expense in both years. During both 2015 and 2014 no options were exercised and therefore no tax benefit was recognized.
In connection with the stock option grants during 2015 and 2014, the fair value of each option grant was estimated on the date of the grant using the Black-Scholes option pricing model with the following assumptions:
|
|
|
2015 |
|
|
2014 |
|
||
|
Risk-free interest rate |
|
0.99% |
|
|
0. 69% - 0.88% |
|
||
|
Expected life (years) |
|
|
4.75 |
|
|
|
4.75 |
|
|
Expected volatility |
|
|
94% |
|
|
|
100% |
|
|
Expected dividend yield |
|
Zero |
|
|
Zero |
|
||
|
Expected forfeitures |
|
Zero |
|
|
Zero |
|
||
The risk-free interest rates are those for U.S. Treasury constant maturities for terms matching the expected term of the option. The expected life of the options is calculated according to the simplified method for estimating the expected term of the options, based on the vesting period and contractual term of each option grant. Expected volatility is based on the Company’s historical volatility. The Company has never paid a dividend on its common stock and therefore the expected dividend yield is zero.
The following summarizes the changes in common stock options for 2015 and 2014:
|
|
|
2015 |
|
|
2014 |
|
||||||||||
|
|
|
Options |
|
|
Weighted Average Exercise Price |
|
|
Options |
|
|
Weighted Average Exercise Price |
|
||||
|
Outstanding at beginning of year |
|
|
2,165,000 |
|
|
$ |
1.71 |
|
|
|
2,130,000 |
|
|
$ |
1.75 |
|
|
Granted |
|
|
50,000 |
|
|
$ |
0.42 |
|
|
|
100,000 |
|
|
$ |
0.70 |
|
|
Exercised |
|
|
— |
|
|
N/A |
|
|
|
— |
|
|
N/A |
|
||
|
Expired |
|
|
(40,000 |
) |
|
$ |
0.90 |
|
|
|
(47,500 |
) |
|
$ |
1.18 |
|
|
Forfeited |
|
|
— |
|
|
N/A |
|
|
|
(17,500 |
) |
|
$ |
2.00 |
|
|
|
Outstanding at end of year |
|
|
2,175,000 |
|
|
$ |
1.70 |
|
|
|
2,165,000 |
|
|
$ |
1.71 |
|
|
|
|
|
|
|
|
|
|
|
|
|
|
|
|
|
|
|
|
Options exercisable at year end |
|
|
1,743,750 |
|
|
$ |
1.78 |
|
|
|
1,330,000 |
|
|
$ |
1.75 |
|
|
|
|
|
|
|
|
|
|
|
|
|
|
|
|
|
|
|
|
Weighted-average fair value of options granted during the year |
|
|
|
|
|
$ |
0.29 |
|
|
|
|
|
|
$ |
0.36 |
|
As of December 31, 2014, the Company had 835,000 unvested options with a weighted average grant date fair value of $1.48 per share. As of December 31, 2015, the Company had 431,250 unvested options with a weighted average grant date fair value of $1.13 per share.
As of December 31, 2015, the total unrecognized stock-based compensation expense related to unvested stock options was $0.1 million, which is expected to be recognized over a weighted-average period of 1.8 years.
F-24
The total fair value of options vesting during each of the years ending December 31, 2015 and 2014 was $0.8 million. The unvested options have no associated performance conditions. In general, the Company’s employee turnover is low, and the Company expects that the majority of the unvested options will vest according to the standard four-year timetable.
The following table summarizes information about all stock options outstanding at December 31, 2015:
|
Exercise price |
|
Options Outstanding |
|
|
Weighted Average Remaining Life (years) |
|
|
Weighted Average Exercise Price |
|
|
Number Exercisable |
|
|
Weighted Average Remaining Life (years) |
|
|
Weighted Average Exercise Price |
|
||||||
|
$ 0.08 to $ 0.15 |
|
|
80,000 |
|
|
|
0.8 |
|
|
$ |
0.12 |
|
|
|
80,000 |
|
|
|
0.8 |
|
|
$ |
0.12 |
|
|
$ 0.42 to $ 1.00 |
|
|
390,000 |
|
|
|
4.6 |
|
|
$ |
0.84 |
|
|
|
165,000 |
|
|
|
3.9 |
|
|
$ |
0.93 |
|
|
$ 1.83 to $ 2.00 |
|
|
1,705,000 |
|
|
|
2.8 |
|
|
$ |
1.97 |
|
|
|
1,498,750 |
|
|
|
2.8 |
|
|
$ |
1.96 |
|
|
|
|
|
2,175,000 |
|
|
|
3.1 |
|
|
$ |
1.70 |
|
|
|
1,743,750 |
|
|
|
2.8 |
|
|
$ |
1.78 |
|
At December 31, 2015 and 2014, the aggregate intrinsic value of exercisable options was $9,000 and $16,000, respectively. There were no options exercised during 2015.
Restricted Stock
Restricted stock awards represent a right to receive shares of common stock at a future date determined in accordance with the participant’s award agreement. There is no exercise price and no monetary payment required for receipt of restricted stock awards or the shares issued in settlement of the award. Instead, consideration is furnished in the form of the participant’s services to the Company. Compensation cost for these awards is based on the fair value on the date of grant and recognized as compensation expense on a straight-line basis over the requisite service period.
The Company granted restricted stock awards for 300,000 shares to two key employees (150,000 each), in connection with their employment agreements in 2014.
The following summarizes the changes in restricted stock awards for the year ended December 31, 2015:
|
|
|
Restricted Stock Awards |
|
|
Weighted Average Grant Date Fair Value |
|
||
|
Awards at December 31, 2014 |
|
|
300,000 |
|
|
$ |
0.38 |
|
|
Granted |
|
|
— |
|
|
$ |
— |
|
|
Vested |
|
|
(150,000 |
) |
|
$ |
0.38 |
|
|
Unvested at December 31, 2015 |
|
|
150,000 |
|
|
$ |
0.38 |
|
|
|
|
|
|
|
|
|
|
|
|
Vested at December 31, 2015 |
|
|
150,000 |
|
|
$ |
0.38 |
|
The Company recognized stock-based compensation expense related to restricted stock awards of $0.1 million for the year ended December 31, 2015. As of December 31, 2015 there is approximately $36,000 of unrecognized stock-based compensation expense related to unvested restricted stock awards, which is expected to be recognized over a weighted average period of 1.3 years.
Note 17 – Subsequent Events
The Company has evaluated events subsequent to December 31, 2015 for potential recognition or disclosure in its consolidated financial statements.
In January 2016, the Company extended the maturity date of its third party debt for one year at the same interest rate.
In January 2016, the Company entered into a related party loan with a trust controlled by certain executive officers of the Company. The Company received proceeds of $0.4 million. The loan bears interest at 10% per annum and is payable within 90 days of the loan date.
On March 11, 2016, the Company entered into a purchase and sale agreement with International Auto Processing Inc. (“IAP”) to sell the Company’s real estate inventory. The purchase price of the real estate inventory is $4.1 million. Concurrently, the Company
F-25
entered into a five year lease agreement with an affiliate of IAP to lease the building during the escrow period, which will terminate at the close of escrow. The purchase agreement gives IAP the right to terminate its obligation to consummate the sale for any reason, but in the event the sale is not consummated, the lease agreement will continue on through the end of the lease term.
There have been no other material subsequent events requiring disclosure in this Report.
F-26