Attached files
| file | filename |
|---|---|
| EX-32.2 - EX-32.2 - Heritage Global Inc. | hgbl-ex322_6.htm |
| EX-32.1 - EX-32.1 - Heritage Global Inc. | hgbl-ex321_8.htm |
| EX-31.2 - EX-31.2 - Heritage Global Inc. | hgbl-ex312_7.htm |
| EX-31.1 - EX-31.1 - Heritage Global Inc. | hgbl-ex311_9.htm |
UNITED STATES
SECURITIES AND EXCHANGE COMMISSION
WASHINGTON, D.C. 20549
FORM 10-Q
|
☒ |
QUARTERLY REPORT PURSUANT TO SECTION 13 OR 15(d) OF THE SECURITIES EXCHANGE ACT OF 1934 |
For the quarterly period ended September 30, 2016
OR
|
☐ |
TRANSITION REPORT PURSUANT TO SECTION 13 OR 15(d) OF THE SECURITIES EXCHANGE ACT OF 1934 |
For the transition period from to
Commission file number: 0-17973
Heritage Global Inc.
(Exact name of registrant as specified in its charter)
|
FLORIDA |
59-2291344 |
|
(State or Other Jurisdiction of |
(I.R.S. Employer Identification No.) |
12625 High Bluff Drive, Suite 305, San Diego, CA 92130
(Address of Principal Executive Offices)
(858) 847-0656
(Registrant’s Telephone Number)
N/A
(Registrant’s Former Name)
Indicate by check mark whether the registrant (1) has filed all reports required to be filed by Section 13 or 15(d) of the Securities and Exchange Act of 1934 during the preceding 12 months (or for such shorter time period that the registrant was required to file such reports), and (2) has been subject to such filing requirements for the past 90 days. Yes ☒ No ☐
Indicate by check mark whether the registrant has submitted electronically and posted on its corporate Web site, if any, every Interactive Data File required to be submitted and posted pursuant to Rule 405 of Regulation S-T during the preceding 12 months (or for such shorter period that the registrant was required to submit and post such files). Yes ☒ No ☐
Indicate by check mark whether the registrant is a large accelerated filer, an accelerated filer, a non-accelerated filer, or a smaller reporting company (as defined in Exchange Act Rule 12b-2).
|
Large Accelerated Filer |
☐ |
|
Accelerated Filer |
☐ |
|
Non-Accelerated Filer |
☐ |
|
Smaller reporting company |
☒ |
Indicate by check mark whether the registrant is a shell company (as defined in Rule 12b-2 of the Exchange Act). Yes ☐ No ☒
As of November 4, 2016, there were 28,507,648 shares of common stock, $0.01 par value, outstanding.
|
Part I. |
3 |
|
|
|
|
|
|
Item 1. |
3 |
|
|
|
|
|
|
|
Condensed Consolidated Balance Sheets as of September 30, 2016 and December 31, 2015 |
3 |
|
|
|
|
|
|
4 |
|
|
|
|
|
|
|
5 |
|
|
|
|
|
|
|
6 |
|
|
|
|
|
|
|
7 |
|
|
|
|
|
|
Item 2. |
Management’s Discussion and Analysis of Financial Condition and Results of Operations |
17 |
|
|
|
|
|
Item 3. |
26 |
|
|
|
|
|
|
Item 4. |
26 |
|
|
|
|
|
|
Part II. |
27 |
|
|
|
|
|
|
Item 1. |
27 |
|
|
|
|
|
|
Item 1A. |
27 |
|
|
|
|
|
|
Item 2. |
27 |
|
|
|
|
|
|
Item 3. |
27 |
|
|
|
|
|
|
Item 4. |
27 |
|
|
|
|
|
|
Item 5. |
27 |
|
|
|
|
|
|
Item 6. |
28 |
2
PART I – FINANCIAL INFORMATION
Item 1 – Financial Statements.
HERITAGE GLOBAL INC.
CONDENSED CONSOLIDATED BALANCE SHEETS
(In thousands of US dollars, except share and per share amounts)
(unaudited)
|
|
|
September 30, 2016 |
|
|
December 31, 2015 |
|
||
|
ASSETS |
|
|
|
|
|
|
|
|
|
Current assets: |
|
|
|
|
|
|
|
|
|
Cash and cash equivalents |
|
$ |
3,341 |
|
|
$ |
2,777 |
|
|
Accounts receivable, net |
|
|
1,105 |
|
|
|
639 |
|
|
Inventory – equipment |
|
|
887 |
|
|
|
395 |
|
|
Other current assets |
|
|
336 |
|
|
|
453 |
|
|
Total current assets |
|
|
5,669 |
|
|
|
4,264 |
|
|
Inventory – real estate |
|
|
— |
|
|
|
3,715 |
|
|
Property and equipment, net |
|
|
160 |
|
|
|
110 |
|
|
Identifiable intangible assets, net |
|
|
4,183 |
|
|
|
4,382 |
|
|
Goodwill |
|
|
6,158 |
|
|
|
6,158 |
|
|
Other assets |
|
|
282 |
|
|
|
173 |
|
|
Total assets |
|
$ |
16,452 |
|
|
$ |
18,802 |
|
|
|
|
|
|
|
|
|
|
|
|
LIABILITIES AND STOCKHOLDERS’ EQUITY |
|
|
|
|
|
|
|
|
|
Current liabilities: |
|
|
|
|
|
|
|
|
|
Accounts payable and accrued liabilities |
|
$ |
8,189 |
|
|
$ |
6,673 |
|
|
Current portion of related party debt |
|
|
1,090 |
|
|
|
1,721 |
|
|
Current portion of contingent consideration |
|
|
1,053 |
|
|
|
865 |
|
|
Other current liabilities |
|
|
54 |
|
|
|
97 |
|
|
Total current liabilities |
|
|
10,386 |
|
|
|
9,356 |
|
|
Non-current portion of related party debt |
|
|
460 |
|
|
|
— |
|
|
Non-current portion of third party debt |
|
|
— |
|
|
|
2,500 |
|
|
Non-current portion of contingent consideration |
|
|
877 |
|
|
|
2,592 |
|
|
Deferred tax liabilities |
|
|
960 |
|
|
|
960 |
|
|
Total liabilities |
|
|
12,683 |
|
|
|
15,408 |
|
|
|
|
|
|
|
|
|
|
|
|
Stockholders’ equity: |
|
|
|
|
|
|
|
|
|
Preferred stock, $10.00 par value, authorized 10,000,000 shares; issued and outstanding 569 Class N shares at September 30, 2016 and December 31, 2015 |
|
|
6 |
|
|
|
6 |
|
|
Common stock, $0.01 par value, authorized 300,000,000 shares; issued and outstanding 28,507,648 shares at September 30, 2016 and 28,467,648 shares at December 31, 2015 |
|
|
285 |
|
|
|
285 |
|
|
Additional paid-in capital |
|
|
284,121 |
|
|
|
284,046 |
|
|
Accumulated deficit |
|
|
(280,576 |
) |
|
|
(280,889 |
) |
|
Accumulated other comprehensive loss |
|
|
(67 |
) |
|
|
(54 |
) |
|
Total stockholders’ equity |
|
|
3,769 |
|
|
|
3,394 |
|
|
Total liabilities and stockholders’ equity |
|
$ |
16,452 |
|
|
$ |
18,802 |
|
The accompanying notes are an integral part of these condensed consolidated financial statements.
3
CONDENSED CONSOLIDATED STATEMENTS OF OPERATIONS
AND COMPREHENSIVE (LOSS) INCOME
(In thousands of US dollars, except share and per share amounts)
(unaudited)
|
|
|
Three Months Ended September 30, |
|
|
Nine Months Ended September 30, |
|
||||||||||
|
|
|
2016 |
|
|
2015 |
|
|
2016 |
|
|
2015 |
|
||||
|
Revenues: |
|
|
|
|
|
|
|
|
|
|
|
|
|
|
|
|
|
Services revenue |
|
$ |
3,824 |
|
|
$ |
2,993 |
|
|
$ |
11,718 |
|
|
$ |
9,533 |
|
|
Asset sales |
|
|
4,758 |
|
|
|
767 |
|
|
|
6,193 |
|
|
|
2,434 |
|
|
Total revenues |
|
|
8,582 |
|
|
|
3,760 |
|
|
|
17,911 |
|
|
|
11,967 |
|
|
|
|
|
|
|
|
|
|
|
|
|
|
|
|
|
|
|
|
Operating costs and expenses: |
|
|
|
|
|
|
|
|
|
|
|
|
|
|
|
|
|
Cost of services revenue |
|
|
1,882 |
|
|
|
653 |
|
|
|
3,751 |
|
|
|
2,101 |
|
|
Cost of asset sales |
|
|
4,243 |
|
|
|
538 |
|
|
|
5,479 |
|
|
|
2,173 |
|
|
Real estate inventory write-down |
|
|
— |
|
|
|
2,748 |
|
|
|
— |
|
|
|
2,748 |
|
|
Selling, general and administrative |
|
|
2,783 |
|
|
|
3,090 |
|
|
|
8,937 |
|
|
|
9,131 |
|
|
Depreciation and amortization |
|
|
76 |
|
|
|
166 |
|
|
|
240 |
|
|
|
490 |
|
|
Total operating costs and expenses |
|
|
8,984 |
|
|
|
7,195 |
|
|
|
18,407 |
|
|
|
16,643 |
|
|
(Losses) earnings of equity method investments |
|
|
— |
|
|
|
(34 |
) |
|
|
52 |
|
|
|
105 |
|
|
Operating loss |
|
|
(402 |
) |
|
|
(3,469 |
) |
|
|
(444 |
) |
|
|
(4,571 |
) |
|
Other income |
|
|
16 |
|
|
|
— |
|
|
|
39 |
|
|
|
5 |
|
|
Fair value adjustment of contingent consideration |
|
|
43 |
|
|
|
(87 |
) |
|
|
900 |
|
|
|
(139 |
) |
|
Interest expense |
|
|
(17 |
) |
|
|
(61 |
) |
|
|
(153 |
) |
|
|
(189 |
) |
|
(Loss) income before income tax expense |
|
|
(360 |
) |
|
|
(3,617 |
) |
|
|
342 |
|
|
|
(4,894 |
) |
|
Income tax expense |
|
|
11 |
|
|
|
20 |
|
|
|
29 |
|
|
|
23 |
|
|
Net (loss) income |
|
$ |
(371 |
) |
|
$ |
(3,637 |
) |
|
$ |
313 |
|
|
$ |
(4,917 |
) |
|
|
|
|
|
|
|
|
|
|
|
|
|
|
|
|
|
|
|
Weighted average common shares outstanding – basic |
|
|
28,432,648 |
|
|
|
28,317,648 |
|
|
|
28,390,221 |
|
|
|
28,230,169 |
|
|
Weighted average common shares outstanding – diluted |
|
|
28,432,648 |
|
|
|
28,317,648 |
|
|
|
28,399,759 |
|
|
|
28,230,169 |
|
|
Net (loss) income per share – basic |
|
$ |
(0.01 |
) |
|
$ |
(0.13 |
) |
|
$ |
0.01 |
|
|
$ |
(0.17 |
) |
|
Net (loss) income per share – diluted |
|
$ |
(0.01 |
) |
|
$ |
(0.13 |
) |
|
$ |
0.01 |
|
|
$ |
(0.17 |
) |
|
|
|
|
|
|
|
|
|
|
|
|
|
|
|
|
|
|
|
Comprehensive (loss) income: |
|
|
|
|
|
|
|
|
|
|
|
|
|
|
|
|
|
Net (loss) income |
|
$ |
(371 |
) |
|
$ |
(3,637 |
) |
|
$ |
313 |
|
|
$ |
(4,917 |
) |
|
Other comprehensive (loss) income: |
|
|
|
|
|
|
|
|
|
|
|
|
|
|
|
|
|
Foreign currency translation adjustment |
|
|
(8 |
) |
|
|
4 |
|
|
|
(13 |
) |
|
|
(25 |
) |
|
Comprehensive (loss) income |
|
$ |
(379 |
) |
|
$ |
(3,633 |
) |
|
$ |
300 |
|
|
$ |
(4,942 |
) |
|
|
|
|
|
|
|
|
|
|
|
|
|
|
|
|
|
|
The accompanying notes are an integral part of these condensed consolidated financial statements.
4
CONDENSED CONSOLIDATED STATEMENT OF STOCKHOLDERS’ EQUITY
(In thousands of US dollars, except share amounts)
(unaudited)
|
|
|
|
|
|
|
|
|
|
|
|
|
|
Additional |
|
|
|
|
|
|
Accumulated other |
|
|
|
|
|
|||||||
|
|
|
Preferred stock |
|
|
Common stock |
|
|
paid-in |
|
|
Accumulated |
|
|
comprehensive |
|
|
|
|
|
|||||||||||||
|
|
|
Shares |
|
|
Amount |
|
|
Shares |
|
|
Amount |
|
|
capital |
|
|
deficit |
|
|
loss |
|
|
Total |
|
||||||||
|
Balance at December 31, 2015 |
|
|
569 |
|
|
$ |
6 |
|
|
|
28,467,648 |
|
|
$ |
285 |
|
|
$ |
284,046 |
|
|
$ |
(280,889 |
) |
|
$ |
(54 |
) |
|
$ |
3,394 |
|
|
Stock-based compensation expense |
|
|
— |
|
|
|
— |
|
|
|
— |
|
|
|
— |
|
|
|
71 |
|
|
|
— |
|
|
|
— |
|
|
|
71 |
|
|
Issuance of common stock from exercise of stock options |
|
|
— |
|
|
|
— |
|
|
|
40,000 |
|
|
|
— |
|
|
|
4 |
|
|
|
— |
|
|
|
— |
|
|
|
4 |
|
|
Net income |
|
|
— |
|
|
|
— |
|
|
|
— |
|
|
|
— |
|
|
|
— |
|
|
|
313 |
|
|
|
— |
|
|
|
313 |
|
|
Foreign currency translation adjustment |
|
|
— |
|
|
|
— |
|
|
|
— |
|
|
|
— |
|
|
|
— |
|
|
|
— |
|
|
|
(13 |
) |
|
|
(13 |
) |
|
Balance at September 30, 2016 |
|
|
569 |
|
|
$ |
6 |
|
|
|
28,507,648 |
|
|
$ |
285 |
|
|
$ |
284,121 |
|
|
$ |
(280,576 |
) |
|
$ |
(67 |
) |
|
$ |
3,769 |
|
The accompanying notes are an integral part of these condensed consolidated financial statements.
5
CONDENSED CONSOLIDATED STATEMENTS OF CASH FLOWS
(In thousands of US dollars)
(unaudited)
|
|
|
Nine Months Ended September 30, |
|
|||||
|
|
|
2016 |
|
|
2015 |
|
||
|
Cash flows provided by (used in) operating activities: |
|
|
|
|
|
|
|
|
|
Net income (loss) |
|
$ |
313 |
|
|
$ |
(4,917 |
) |
|
Adjustments to reconcile net income (loss) to net cash provided by (used in) operating activities: |
|
|
|
|
|
|
|
|
|
Accrued management fees and other charges added to principal of related party debt |
|
|
— |
|
|
|
290 |
|
|
Accrued interest added to principal of related party debt |
|
|
54 |
|
|
|
66 |
|
|
Fair value adjustment of contingent consideration |
|
|
(900 |
) |
|
|
139 |
|
|
Stock-based compensation expense |
|
|
71 |
|
|
|
317 |
|
|
Real estate inventory write-down |
|
|
— |
|
|
|
2,748 |
|
|
Earnings of equity method investments |
|
|
(49 |
) |
|
|
(110 |
) |
|
Depreciation and amortization |
|
|
240 |
|
|
|
490 |
|
|
Changes in operating assets and liabilities: |
|
|
|
|
|
|
|
|
|
Accounts receivable |
|
|
(497 |
) |
|
|
294 |
|
|
Deposits |
|
|
(126 |
) |
|
|
171 |
|
|
Inventory |
|
|
3,223 |
|
|
|
(296 |
) |
|
Other assets |
|
|
158 |
|
|
|
468 |
|
|
Accounts payable and accrued liabilities |
|
|
1,490 |
|
|
|
(508 |
) |
|
Net cash provided by (used in) operating activities |
|
|
3,977 |
|
|
|
(848 |
) |
|
|
|
|
|
|
|
|
|
|
|
Cash flows (used in) provided by investing activities: |
|
|
|
|
|
|
|
|
|
Cash distributions from equity method investments |
|
|
20 |
|
|
|
737 |
|
|
Investment in equity method investments |
|
|
— |
|
|
|
(143 |
) |
|
Purchase of property and equipment |
|
|
(91 |
) |
|
|
— |
|
|
Proceeds from sale of equity method investments |
|
|
— |
|
|
|
1,992 |
|
|
Net cash (used in) provided by investing activities |
|
|
(71 |
) |
|
|
2,586 |
|
|
|
|
|
|
|
|
|
|
|
|
Cash flows used in financing activities: |
|
|
|
|
|
|
|
|
|
Repayment of debt payable to third party |
|
|
(2,500 |
) |
|
|
(525 |
) |
|
Proceeds from debt payable to related parties |
|
|
1,099 |
|
|
|
775 |
|
|
Repayment of debt payable to related parties |
|
|
(1,323 |
) |
|
|
(2,419 |
) |
|
Payment of contingent consideration |
|
|
(627 |
) |
|
|
(513 |
) |
|
Proceeds from exercise of options to purchase common shares |
|
|
4 |
|
|
|
— |
|
|
Net cash used in financing activities |
|
|
(3,347 |
) |
|
|
(2,682 |
) |
|
Net increase (decrease) in cash and cash equivalents |
|
|
559 |
|
|
|
(944 |
) |
|
Effect of exchange rate changes on cash and cash equivalents |
|
|
5 |
|
|
|
(32 |
) |
|
Cash and cash equivalents at beginning of period |
|
|
2,777 |
|
|
|
3,633 |
|
|
Cash and cash equivalents at end of period |
|
$ |
3,341 |
|
|
$ |
2,657 |
|
|
|
|
|
|
|
|
|
|
|
|
Supplemental cash flow information: |
|
|
|
|
|
|
|
|
|
Cash paid for taxes |
|
$ |
30 |
|
|
$ |
70 |
|
|
Cash paid for interest |
|
$ |
167 |
|
|
$ |
178 |
|
The accompanying notes are an integral part of these condensed consolidated financial statements.
6
NOTES TO CONDENSED CONSOLIDATED FINANCIAL STATEMENTS
(unaudited)
Note 1 –Basis of Presentation
These unaudited condensed consolidated interim financial statements include the accounts of Heritage Global Inc. together with its subsidiaries, including Heritage Global Partners, Inc. (“HGP”), Heritage Global LLC (“HG LLC”), Equity Partners HG LLC (“Equity Partners”) and National Loan Exchange, Inc. (“NLEX”). These entities, collectively, are referred to as “HGI,” the “Company,” “we” or “our” in these financial statements. Our unaudited condensed consolidated interim financial statements were prepared in conformity with generally accepted accounting principles in the United States of America (“GAAP”), as outlined in the Financial Accounting Standards Board (“FASB”) Accounting Standards Codification (“ASC”), and include the assets, liabilities, revenues, and expenses of all subsidiaries over which HGI exercises control. All significant intercompany accounts and transactions have been eliminated upon consolidation. The Company’s sole operating segment is its asset liquidation business. HGI provides an array of value-added capital and financial asset solutions: auction and appraisal services, traditional asset disposition sales, and financial solutions for distressed businesses and properties.
We have prepared the condensed consolidated interim financial statements included herein pursuant to the rules and regulations of the United States Securities and Exchange Commission (the “SEC”). In management’s opinion, these financial statements reflect all adjustments that are necessary to present fairly the results for the interim periods included herein. Certain information and footnote disclosures normally included in financial statements prepared in accordance with GAAP have been condensed or omitted pursuant to such rules and regulations; however, we believe that the disclosures are appropriate. These unaudited condensed consolidated interim financial statements should be read in conjunction with the audited consolidated financial statements and the notes thereto included in the Company’s annual report on Form 10-K for the year ended December 31, 2015, filed with the SEC on March 17, 2016.
The results of operations for the three and nine month periods ended September 30, 2016 are not necessarily indicative of those operating results to be expected for any subsequent interim period or for the entire year ending December 31, 2016. The accompanying condensed consolidated balance sheet at December 31, 2015 has been derived from the audited consolidated balance sheet at December 31, 2015, contained in the above referenced Form 10-K.
Note 2 – Summary of Significant Accounting Policies
Use of Estimates
The preparation of the Company’s consolidated financial statements in conformity with GAAP requires management to make estimates and assumptions that affect the reported amounts of assets and liabilities and the disclosure of contingent assets and liabilities at the date of the financial statements, as well as the reported amounts of revenues and expenses during the reporting period. Management bases its estimates and judgments on historical experience and various other factors that are believed to be reasonable under the circumstances. Actual results could differ from those estimates.
Significant estimates include the assessment of collectability of revenue recognized, and the valuation of accounts receivable, inventory, investments, goodwill and intangible assets, liabilities, contingent consideration, deferred income tax assets and liabilities, and stock-based compensation. These estimates have the potential to significantly affect our consolidated financial statements, either because of the significance of the financial statement item to which they relate, or because they require judgment and estimation due to the uncertainty involved in measuring, at a specific point in time, events that are continuous in nature.
Foreign Currency
The functional currency of foreign operations is deemed to be the local country’s currency. Assets and liabilities of operations outside of the United States are generally translated into U.S. dollars, and the effects of foreign currency translation adjustments are included as a component of accumulated other comprehensive income (loss).
Reclassifications
Certain prior year balances within the condensed consolidated financial statements have been reclassified to conform to the current year presentation.
7
The critical accounting policies used in the preparation of our audited consolidated financial statements are discussed in our Annual Report on Form 10-K for the year ended December 31, 2015. There have been no changes to these policies in the first nine months of 2016.
Recently Adopted Accounting Pronouncements
In January 2015, the FASB issued Accounting Standards update 2015-01, Simplifying Income Statement Presentation by Eliminating the Concept of Extraordinary Items (“ASU 2015-01”). ASU 2015-01 eliminates the requirement for entities to consider whether an underlying event or transaction is extraordinary, and, if so, to separately present the item in the income statement net of tax, after income from continuing operations. Instead, items that are both unusual and infrequent should be separately presented as a component of income from continuing operations, or be disclosed in the notes to the financial statements. ASU 2015-01 became effective January 1, 2016, and did not have a material impact on the Company’s consolidated financial statements.
In March 2015, the FASB issued Accounting Standards update 2015-02, Amendments to the Consolidation Analysis (“ASU 2015-02”). ASU 2015-02 eliminates entity-specific consolidation guidance for limited partnerships, and revises other aspects of the consolidation analysis, but does not change the existing consolidation guidance for corporations that are not variable interest entities (“VIEs”). ASU 2015-02 became effective January 1, 2016, and did not have a material impact on the Company’s consolidated financial statements.
In April 2015, the FASB issued Accounting Standards update 2015-03, Simplifying the Presentation of Debt Issuance Costs (“ASU 2015-03”). ASU 2015-03 changes the presentation of debt issuance costs in financial statements, by requiring them to be presented in the balance sheet as a direct deduction from the related debt liability, rather than as an asset. Amortization of the costs is reported as interest expense. There is no change to the current guidance on the recognition and measurement of debt issuance costs. ASU 2015-03 became effective January 1, 2016, and did not have a material impact on the Company’s consolidated financial statements.
In August 2015, the FASB issued Accounting Standards update 2015-15, Interest – Imputation of Interest, (“ASU 2015-15”). ASU 2015-15 amends subtopic 835-30 of the ASC (which was previously amended by ASU 2015-03) to allow for the capitalization of debt issuance costs related to line of credit agreements. Capitalized costs would be presented as an asset and subsequently amortized ratably over the term of the line of credit. ASU 2015-15 became effective January 1, 2016, and did not have a material impact on the Company’s consolidated financial statements.
In September 2015, the FASB issued Accounting Standards update 2015-16, Simplifying the Accounting for Measurement-Period Adjustments (“ASU 2015-16”). ASU 2015-16 changes the recognition of business combination adjustments by requiring acquirers to recognize adjustments to provisional amounts identified during the measurement period in the reporting period in which the adjustment amounts are determined. The acquirer is required to record the effect on earnings of changes in depreciation, amortization, or other income effects, if any, as a result of the change to the provisional amounts. These amounts are calculated as if the accounting was completed at acquisition date. The acquirer is also required to present separately on the face of the income statement, or disclose in the notes, the amount recorded in current-period earnings (by line item) that would have been recorded in previous reporting periods had the adjustments been recognized as of the acquisition date. ASU 2015-16 became effective January 1, 2016, and did not have a material impact on the Company’s consolidated financial statements.
Future Accounting Pronouncements
In February 2016, the FASB issued Accounting Standards update 2016-02, Leases, (“ASU 2016-02”). ASU 2016-02 changes the accounting for leases previously classified as operating leases under GAAP, by, among other things, requiring a company to recognize the lease on the balance sheet with a right-of-use asset and a lease liability. ASU 2016-02 will be effective for fiscal years, and interim periods within those fiscal years, beginning after December 15, 2018. The Company has not yet adopted ASU 2016-02 nor assessed its potential impact on its consolidated financial statements.
In March 2016, the FASB issued Accounting Standards update 2016-07, Investments – Equity Method and Joint Ventures (“ASU 2016-07”), which simplifies the transition to the equity method of accounting by, among other things, eliminating retroactive adjustments to the investments as a result of an increase in the level of ownership interest or degree of influence. ASU 2016-07 will be effective for fiscal years, and interim periods within those fiscal years, beginning after December 15, 2016. The Company has not yet adopted ASU 2016-07 nor assessed its potential impact on its consolidated financial statements.
In March 2016, the FASB issued Accounting Standards update 2016-08, Revenue from Contracts with Customers (“ASU 2016-08”), which provides clarity on the implementation of guidance on principal versus agent considerations (reporting of revenue on a
8
gross basis versus net basis). ASU 2016-08 will be effective for fiscal years, and interim periods within those fiscal years, beginning after December 15, 2017. The Company does not believe that the clarification of the implementation of the guidance will change the conclusions reached in its current analysis of principal versus agent considerations for reporting of revenue.
In March 2016, the FASB issued Accounting Standards update 2016-09, Compensation – Stock Compensation (“ASU 2016-09”), which provides improvements to employee share-based payment accounting. ASU 2016-09 simplifies the accounting and presentation of various elements of share-based compensation including, but not limited to, income taxes, excess tax benefits, statutory tax withholding requirements, payment of employee taxes, and award assumptions. ASU 2016-09 will be effective for fiscal years, and interim periods within those fiscal years, beginning after December 15, 2016. The Company is still assessing the impact ASU 2016-09 will have on its consolidated financial statements.
In April 2016, the FASB issued Accounting Standards update 2016-10, Revenue from Contracts with Customers (“ASU 2016-10”), which provides clarity on identifying performance obligations and licensing. ASU 2016-10 clarifies how an entity identifies performance obligations and whether that entity’s promise to grant a license provides a customer with either a right to use the entity’s intellectual property or a right to access the entity’s intellectual property. ASU 2016-10 will be effective for fiscal years, and interim periods within those fiscal years, beginning after December 15, 2017. The Company has not yet adopted ASU 2016-10 nor assessed its potential impact on its consolidated financial statements.
In May 2016, the FASB issued Accounting Standards update 2016-12, Revenue from Contracts with Customers (“ASU 2016-12”), which provides clarity and simplification to the transition guidance from the previously issued ASU 2014-09. ASU 2016-12 provides narrow scope improvements to assessing the collectability criterion, the presentation of sales and other similar taxes, non-cash consideration, contract modifications, completed contracts, and technical corrections. ASU 2016-12 will be effective for fiscal years, and interim periods within those fiscal years, beginning after December 15, 2017. The Company has not yet adopted ASU 2016-12 nor assessed its potential impact on its consolidated financial statements.
In August 2016, the FASB issued Accounting Standards update 2016-15, Statement of Cash Flows (“ASU 2016-15”), which clarifies the classification of certain cash receipts and payments. The specific cash flow issues addressed by ASU 2016-15, with the objective of reducing the existing diversity in practice, are as follows: (1) Debt prepayment or debt extinguishment costs; (2) Settlement of zero-coupon debt instruments or other debt instruments with insignificant coupon interest rates; (3) Contingent consideration payments made after a business combination; (4) Proceeds from the settlement of insurance claims; (5) Proceeds from the settlement of corporate-owned life insurance policies; (6) Distributions received from equity method investees; (7) Beneficial interest in securitization transactions; and (8) Separately identifiable cash flows and application of the predominance in principle. ASU 2016-15 will be effective for fiscal years, and interim periods within those fiscal years, beginning after December 15, 2017. The Company is still assessing the impact of ASU 2016-15 on its consolidated financial statements.
Note 3 – Real Estate Inventory
In the first quarter of 2016, the Company entered into a purchase and sale agreement with International Auto Processing Inc. (“IAP”) to sell the Company’s real estate inventory for $4.1 million. IAP subsequently assigned the purchase and sale agreement to an affiliate, International Investments and Infrastructure, LLC (“III”).
Concurrently, the Company entered into a five-year lease agreement with an affiliate of III to lease the building during the escrow period, which terminates at the close of escrow. The purchase agreement gave IAP the right to terminate its obligation to consummate the sale for any reason before June 9, 2016, but in the event the sale is not consummated, the lease agreement would continue through the end of the lease term.
Annual rental payments under the lease were $0.7 million, and the lessee was responsible for all operating costs associated with the property. During the three and nine months ended September 30, 2016, the Company earned rental income of $10,000 and $0.3 million, respectively, which is included within services revenue in the condensed consolidated statement of operations. No rental income was earned during the three or nine months ended September 30, 2015.
In the third quarter of 2016, the Company completed the sale of its real estate inventory and, in accordance with the purchase and sale agreement, terminated the previously existing lease agreement between the Company and an affiliate of III. The Company sold the real estate inventory for $4.1 million and, after recognizing carrying costs of $3.7 million and closing costs of $0.3 million, realized a gross profit of $0.1 million.
In the third quarter of 2015, the Company determined that the net realizable value of its real estate inventory, based on the most probable selling price net of costs to complete the sale, was $3.8 million. As such, the Company recorded an inventory write-down
9
charge during the three months ended September 30, 2015, of $2.7 million, reducing the carrying cost of the inventory to $3.8 million. There were no such similar charges during the three or nine months ended September 30, 2016, as the Company executed the aforementioned purchase and sale agreement for a sales price in excess of the carrying cost of the real estate inventory.
Note 4 – Stock-based Compensation
Options
At September 30, 2016 the Company had four stock-based compensation plans. Three of these plans are described more fully in Note 16 to the audited consolidated financial statements for the year ended December 31, 2015, contained in the Company’s most recently filed Annual Report on Form 10-K. The fourth plan was adopted on May 5, 2016 and received approval from the Company’s shareholders at the special meeting of stockholders held on September 14, 2016. The maximum aggregate number of shares of common stock that may be issued pursuant to the stock option plan is 3,150,000. Refer to the Form 8-K filed on September 15, 2016 and the Definitive Proxy Statement filed on August 5, 2016 with the SEC for more information on the 2016 stock option plan.
During the first nine months of 2016, the Company issued options to purchase a total of 70,000 shares of common stock to the Company’s independent directors as part of their annual compensation. During the same period, the Company cancelled options to purchase 187,500 shares of common stock as a result of the expiration of the allowable exercise period for options held by the former directors of the Company, who resigned in the second quarter of 2016.
The following summarizes the changes in common stock options for the nine months ended September 30, 2016:
|
|
|
Options |
|
|
Weighted Average Exercise Price |
|
||
|
Outstanding at December 31, 2015 |
|
|
2,175,000 |
|
|
$ |
1.70 |
|
|
Granted |
|
|
70,000 |
|
|
$ |
0.24 |
|
|
Exercised |
|
|
(40,000 |
) |
|
$ |
0.12 |
|
|
Cancelled |
|
|
(187,500 |
) |
|
$ |
0.83 |
|
|
Expired |
|
|
(20,000 |
) |
|
$ |
0.15 |
|
|
Outstanding at September 30, 2016 |
|
|
1,997,500 |
|
|
$ |
1.77 |
|
|
|
|
|
|
|
|
|
|
|
|
Options exercisable at September 30, 2016 |
|
|
1,862,500 |
|
|
$ |
1.86 |
|
The Company recognized stock-based compensation expense related to stock options of $7,000 and $50,000 for the three and nine months ended September 30, 2016, respectively. As of September 30, 2016, there is approximately $33,000 of unrecognized stock-based compensation expense related to unvested option awards outstanding, which is expected to be recognized over a weighted average period of 2.2 years.
Restricted Stock
Restricted stock awards represent a right to receive shares of common stock at a future date determined in accordance with the participant’s award agreement. There is no exercise price and no monetary payment required for receipt of restricted stock awards or the shares issued in settlement of the award. Instead, consideration is furnished in the form of the participant’s services to the Company. Compensation cost for these awards is based on the fair value on the date of grant and recognized as compensation expense on a straight-line basis over the requisite service period.
10
The following summarizes the changes in restricted stock awards for the nine months ended September 30, 2016:
|
|
|
Restricted Stock Awards |
|
|
Weighted Average Grant Date Fair Value Per Share |
|
||
|
Unvested Awards at December 31, 2015 |
|
|
150,000 |
|
|
$ |
0.38 |
|
|
Granted |
|
|
— |
|
|
|
— |
|
|
Vested |
|
|
(75,000 |
) |
|
$ |
0.38 |
|
|
Unvested awards at September 30, 2016 |
|
|
75,000 |
|
|
$ |
0.38 |
|
|
|
|
|
|
|
|
|
|
|
|
Vested awards at September 30, 2016 |
|
|
225,000 |
|
|
$ |
0.38 |
|
Stock-based compensation expense related to restricted stock awards was $7,000 and $21,000 for the three and nine months ended September 30, 2016, respectively.
Note 5 – Earnings Per Share
The Company is required, in periods in which it has net income, to calculate basic earnings per share (“basic EPS”) using the two-class method. The two-class method is required because the Company’s Class N preferred shares, each of which is convertible to 40 common shares, have the right to receive dividends or dividend equivalents should the Company declare dividends on its common stock. Under the two-class method, earnings for the period are allocated on a pro-rata basis to the common and preferred stockholders. The weighted-average number of common and preferred shares outstanding during the period is then used to calculate basic EPS for each class of shares.
In periods in which the Company has a net loss, basic loss per share is calculated by dividing the loss attributable to common stockholders by the weighted-average number of common shares outstanding during the period. The two-class method is not used in periods in which the Company has a net loss because the preferred stock does not participate in losses.
Stock options and other potential common shares are included in the calculation of diluted earnings per share (“diluted EPS”), since they are assumed to be exercised or converted, except when their effect would be anti-dilutive.
The table below shows the calculation of the shares used in computing diluted EPS.
|
|
|
Three Months Ended September 30, |
|
|
Nine Months Ended September 30, |
|
||||||||||
|
Weighted Average Shares Calculation: |
|
2016 |
|
|
2015 |
|
|
2016 |
|
|
2015 |
|
||||
|
Basic weighted average shares outstanding |
|
|
28,432,648 |
|
|
|
28,317,648 |
|
|
|
28,390,221 |
|
|
|
28,230,169 |
|
|
Treasury stock effect of common stock options and restricted stock awards |
|
|
— |
|
|
|
— |
|
|
|
9,538 |
|
|
|
— |
|
|
Diluted weighted average common shares outstanding |
|
|
28,432,648 |
|
|
|
28,317,648 |
|
|
|
28,399,759 |
|
|
|
28,230,169 |
|
There were 1.9 million potential common shares not included in the computation of diluted EPS because they would have been anti-dilutive for the nine months ended September 30, 2016. No potential common shares were included for the three months ended September 30, 2016, nor the three and nine months ended September 30, 2015, as the Company generated a net loss. Therefore basic EPS was the same as diluted EPS during those respective periods.
11
Note 6 – Intangible Assets and Goodwill
Identifiable intangible assets
The Company’s identifiable intangible assets are associated with its acquisitions of HGP in 2012 and NLEX in 2014, as shown in the table below (in thousands), and are amortized using the straight-line method over their estimated useful lives of two to twelve years. The Company’s trade name, acquired as part of the acquisition of NLEX in 2014, has an indefinite life and therefore is not amortized.
|
|
|
Carrying Value |
|
|
|
|
|
|
Carrying Value |
|
||
|
Amortized Intangible Assets |
|
December 31, 2015 |
|
|
Amortization |
|
|
September 30, 2016 |
|
|||
|
Customer Network (HGP) |
|
$ |
178 |
|
|
$ |
(17 |
) |
|
$ |
161 |
|
|
Trade Name (HGP) |
|
|
1,059 |
|
|
|
(78 |
) |
|
|
981 |
|
|
Customer Relationships (NLEX) |
|
|
660 |
|
|
|
(82 |
) |
|
|
578 |
|
|
Non-Compete Agreement (NLEX) |
|
|
15 |
|
|
|
(15 |
) |
|
|
— |
|
|
Website (NLEX) |
|
|
33 |
|
|
|
(7 |
) |
|
|
26 |
|
|
Total |
|
|
1,945 |
|
|
|
(199 |
) |
|
|
1,746 |
|
|
|
|
|
|
|
|
|
|
|
|
|
|
|
|
Unamortized Intangible Assets |
|
|
|
|
|
|
|
|
|
|
|
|
|
Trade Name (NLEX) |
|
|
2,437 |
|
|
|
— |
|
|
|
2,437 |
|
|
Total |
|
$ |
4,382 |
|
|
$ |
(199 |
) |
|
$ |
4,183 |
|
Amortization expense during the first nine months of 2016 and 2015 was $0.2 million and $0.5 million, respectively.
The estimated amortization expense as of September 30, 2016 during the remainder of the current fiscal year, the next four fiscal years, and thereafter is shown below (in thousands):
|
Year |
|
Amount |
|
|
|
2016 (remainder of year from October 1, 2016 to December 31, 2016) |
|
$ |
61 |
|
|
2017 |
|
|
245 |
|
|
2018 |
|
|
245 |
|
|
2019 |
|
|
240 |
|
|
2020 |
|
|
236 |
|
|
Thereafter |
|
|
719 |
|
|
Total |
|
$ |
1,746 |
|
Goodwill
The Company’s goodwill is related to its asset liquidation business, and is comprised of goodwill from three acquisitions, as shown in the table below (in thousands). There were no impairment losses or other charges to the carrying amount of goodwill during the nine months ended September 30, 2016 and 2015.
|
Acquisition |
|
September 30, 2016 |
|
|
December 31, 2015 |
|
||
|
Equity Partners |
|
$ |
573 |
|
|
$ |
573 |
|
|
HGP |
|
|
2,040 |
|
|
|
2,040 |
|
|
NLEX |
|
|
3,545 |
|
|
|
3,545 |
|
|
Total goodwill |
|
$ |
6,158 |
|
|
$ |
6,158 |
|
12
Outstanding debt at September 30, 2016 and December 31, 2015 is summarized as follows (in thousands):
|
|
|
September 30, 2016 |
|
|
December 31, 2015 |
|
||
|
Current: |
|
|
|
|
|
|
|
|
|
Related party debt |
|
|
1,090 |
|
|
|
1,721 |
|
|
|
|
|
1,090 |
|
|
|
1,721 |
|
|
Non-current: |
|
|
|
|
|
|
|
|
|
Related party debt |
|
460 |
|
|
|
— |
|
|
|
Third party debt |
|
|
— |
|
|
|
2,500 |
|
|
|
|
|
|
|
|
|
|
|
|
Total debt |
|
$ |
1,550 |
|
|
$ |
4,221 |
|
The Company entered into a loan with an unrelated party (the “Third Party Debt”) during 2014 for a principal amount of $2.5 million. The loan bore interest at 6% and had an original maturity date of January 15, 2015. In December 2014, the maturity date was extended to January 15, 2016 at the same interest rate, and in the first quarter of 2016, the maturity date was further extended to January 15, 2017 at the same interest rate. The Third Party Debt was not subject to any covenants or conditions.
In July 2016, the Company repaid $2.5 million of outstanding principal, plus accrued interest, on the Third Party Debt, and terminated the loan agreement with the third party.
The Company entered into a related party loan (the “Street Capital Loan”) with Street Capital Group Inc. (“Street Capital”) in 2003. The Street Capital Loan accrued interest at 10% per annum compounded quarterly from the date funds were advanced. In 2014, following Street Capital’s distribution of its ownership interest in HGI to Street Capital shareholders as a dividend in kind, the unpaid balance of the Street Capital Loan began accruing interest at a rate per annum equal to the lesser of the Wall St. Journal (“WSJ”) prime rate + 2.0%, or the maximum rate allowable by law.
In the third quarter of 2016, following an amendment to the Street Capital Loan began accruing interest at a rate per annum equal to the WSJ prime rate + 1.0%. The Company also agreed to a monthly payment schedule to begin in the first quarter of 2017. Additionally, the Company repaid $0.8 million of outstanding principal in connection with the amendment. As of September 30, 2016 and December 31, 2015, the interest rate on the loan was 4.50% and 5.50%, respectively. As of September 30, 2016 and December 31, 2015, amounts owed to Street Capital under the Street Capital Loan were $1.0 million and $1.7 million, respectively. Please see Note 10 for further discussion of transactions with Street Capital.
In the first quarter of 2016, the Company entered into a related party loan with a trust controlled by certain executive officers of the Company. The Company received proceeds of $0.4 million. The loan accrued interest at 10% per annum and was payable within 90 days of the loan date. The Company repaid the loan plus accrued interest in March 2016.
In the third quarter of 2016, the Company entered into a related party loan with an entity owned by certain executive officers of the Company, and the Company’s Chief Executive Officer. The Company received proceeds of $0.7 million. The loan accrues interest at 10% per annum and is payable within 180 days of the loan date. The Company repaid $0.1 million of principal in September 2016. As of September 30, 2016 and December 31, 2015, amounts owed under the loan were $0.6 million and $0, respectively.
Note 8 – Fair Value Measurements
In accordance with the authoritative guidance for financial assets and liabilities measured at fair value on a recurring basis, the Company prioritizes the inputs used to measure fair value from market-based assumptions to entity-specific assumptions:
|
|
• |
Level 1 – Inputs based on quoted market prices for identical assets or liabilities in active markets at the measurement date. |
|
|
• |
Level 2 – Observable inputs other than quoted prices included in Level 1, such as quoted prices for similar assets and liabilities in active markets; quoted prices for identical or similar liabilities in markets that are not active; or other inputs that are observable or can be corroborated by observable market data. |
|
|
• |
Level 3 – Inputs which reflect management’s best estimate of what market participants would use in pricing the asset or liability at the measurement date. The inputs are unobservable in the market and significant to the instruments valuation. |
13
As of September 30, 2016 and December 31, 2015, the Company had no Level 1 or Level 2 assets or liabilities measured at fair value. As of September 30, 2016 and December 31, 2015, the Company’s contingent consideration from the acquisition of NLEX in 2014 of $1.9 and $3.5 million, respectively, was the only liability measured at fair value on a recurring basis, and was classified as Level 3 within the fair value hierarchy. The fair value of the Company’s contingent consideration was determined using a discounted cash flow analysis, which is based on significant inputs that are not observable in the market. As of September 30, 2016 and December 31, 2015, the Company had no Level 3 assets measured at fair value.
The following tables present the Company’s hierarchy for its liabilities measured at fair value on a recurring basis as of September 30, 2016 and December 31, 2015 (in thousands):
|
|
|
Fair Value as of September 30, 2016 |
|
|||||||||||||
|
|
|
Level 1 |
|
|
Level 2 |
|
|
Level 3 |
|
|
Total |
|
||||
|
Liabilities |
|
|
|
|
|
|
|
|
|
|
|
|
|
|
|
|
|
Contingent consideration |
|
$ |
— |
|
|
$ |
— |
|
|
$ |
1,930 |
|
|
$ |
1,930 |
|
|
|
|
|
|
|
|
|
|
|
|
|
|
|
|
|
|
|
|
|
|
|
|
|
|
|
|
|
|
|
|
|
|
|
|
|
|
|
|
Fair Value as of December 31, 2015 |
|
|||||||||||||
|
|
|
Level 1 |
|
|
Level 2 |
|
|
Level 3 |
|
|
Total |
|
||||
|
Liabilities |
|
|
|
|
|
|
|
|
|
|
|
|
|
|
|
|
|
Contingent consideration |
|
$ |
— |
|
|
$ |
— |
|
|
$ |
3,457 |
|
|
$ |
3,457 |
|
When valuing its Level 3 liabilities, the Company gives consideration to operating results, financial condition, economic and/or market events, and other pertinent information that would impact its estimate of the expected contingent consideration payment. The valuation of the liability is primarily based on management’s estimate of the Net Profits of NLEX (as defined in the NLEX stock purchase agreement). Given the short term nature of the contingent consideration periods, changes in the discount rate are not expected to have a material impact on the fair value of the liability.
During the nine months ended September 30, 2016, the Company paid the former owner of NLEX $0.6 million of the total $0.8 million second earn-out payment as required under the earn-out provision of the NLEX stock purchase agreement. The following table summarizes the changes in the fair value of the liability during the nine months ended September 30, 2016 (in thousands):
|
Balance at December 31, 2015 |
|
$ |
3,457 |
|
|
Payment of contingent consideration |
|
|
(627 |
) |
|
Fair value adjustment of contingent consideration |
|
|
(900 |
) |
|
Balance at September 30, 2016 |
|
$ |
1,930 |
|
The Company had no assets or liabilities measured at fair value on a non-recurring basis as of September 30, 2016.
Note 9 – Income Taxes
At September 30, 2016, the Company had aggregate tax net operating loss carry forwards of approximately $74.0 million ($58.9 million of unrestricted net operating tax losses and approximately $15.1 million of restricted net operating tax losses) and unused minimum tax credit carry forwards of $0.5 million. Substantially all of the net operating loss carry forwards and unused minimum tax credit carry forwards expire between 2025 and 2035. The Company’s utilization of restricted net operating tax loss carry forwards against future income for tax purposes is restricted pursuant to the “change in ownership” rules in Section 382 of the Internal Revenue Code.
The reported tax expense varies from the amount that would be provided by applying the statutory U.S. Federal income tax rate to the loss from operations before taxes primarily as a result of the change in the deferred tax asset valuation allowance.
The Company records net deferred tax assets to the extent that it believes such assets will more likely than not be realized. As a result of our cumulative losses and uncertainty with respect to future taxable income, we have provided a full valuation allowance against our net deferred tax assets as of December 31, 2015 and September 30, 2016.
14
Note 10 – Related Party Transactions
Debt with Street Capital
Until the second quarter of 2014, as discussed below, Street Capital was the Company’s majority shareholder. Street Capital remained a related party following the distribution of its investment in HGI to Street Capital shareholders as Allan Silber, an affiliate of Street Capital, is the Company’s chairman of the board, and continues to be a significant shareholder of the Company. In the third quarter of 2016, the Company repaid $0.8 million of outstanding principal on the loan. At September 30, 2016 and December 31, 2015, the Company reported amounts owed to Street Capital of $1.0 million and $1.7 million as related party debt (see Note 7). Total interest of $0.5 million has been accrued on the debt through September 30, 2016.
Street Capital Services Provided to the Company
Beginning in 2004, HGI and Street Capital entered into successive annual management services agreements (collectively, the “Agreement”). Under the terms of the Agreement, HGI agreed to pay Street Capital for ongoing management services provided to HGI by Street Capital personnel. Refer to Note 14 of the Annual Report on Form 10-K filed with the SEC on March 17, 2016 for further detail on the Agreement.
In 2013, Street Capital announced its plan to dispose of its interest in HGI, and on March 20, 2014, Street Capital declared a dividend in kind, consisting of Street Capital’s distribution of its majority interest in HGI to Street Capital shareholders. The dividend was paid on April 30, 2014 to shareholders of record as of April 1, 2014.
Following this disposition, the Company and Street Capital entered into a replacement management services agreement (the “Services Agreement”). Under the terms of the Services Agreement, Street Capital remained as external manager and continued to provide the same services, at similar rates, until the Services Agreement was terminated effective August 31, 2015, as described more fully in the Current Report on Form 8-K filed with the SEC on September 1, 2015.
The amounts charged by Street Capital, which have been accrued and added to the Street Capital Loan balance, are detailed below (in thousands):
|
|
|
Nine Months Ended September 30, |
|
|||||
|
|
|
2016 |
|
|
2015 |
|
||
|
Management fees |
|
$ |
— |
|
|
$ |
240 |
|
|
Other charges |
|
|
— |
|
|
|
50 |
|
|
Total |
|
$ |
— |
|
|
$ |
290 |
|
Other Related Party Transactions
During the first nine months of 2016, the Company leased office space in Foster City, CA as part of the operations of HGP. The premises are owned by an entity that is jointly controlled by senior officers of HGI. In the second quarter of 2016, the Company terminated its lease agreement for the office space in Foster City, CA. The Company also leases office space in Edwardsville, IL, as part of the ongoing operations of NLEX. The premises are owned by senior officers of NLEX. The lease amounts paid by the Company to the related parties, which are included in selling, general and administrative expenses during the three and nine months ended September 30, 2016 and 2015, are detailed below (in thousands):
|
|
|
Three Months Ended September 30, |
|
|||||
|
Leased premises location |
|
2016 |
|
|
2015 |
|
||
|
Foster City, CA |
|
$ |
— |
|
|
$ |
57 |
|
|
Edwardsville, IL |
|
|
25 |
|
|
|
24 |
|
|
Total |
|
$ |
25 |
|
|
$ |
81 |
|
|
|
|
Nine Months Ended September 30, |
|
|||||
|
Leased premises location |
|
2016 |
|
|
2015 |
|
||
|
Foster City, CA |
|
$ |
76 |
|
|
$ |
171 |
|
|
Edwardsville, IL |
|
|
74 |
|
|
|
73 |
|
|
Total |
|
$ |
150 |
|
|
$ |
244 |
|
15
In the first quarter of 2016, the Company entered into a related party loan with a trust controlled by certain executive officers of the Company. The Company received proceeds of $0.4 million. The loan accrued interest at 10% per annum and was payable within 90 days of the loan date. The Company repaid the loan plus accrued interest of $8,000 in March 2016.
In the third quarter of 2016, the Company entered into a related party loan with both an entity owned by certain executive officers of the Company and the Company’s Chief Executive Officer. The Company received proceeds of $0.7 million. The loan accrues interest at 10% per annum and is payable within 180 days of the loan date. The Company repaid $0.1 million of principal in September 2016. Interest expense on this loan for the three and nine months ended September 30, 2016 was $7,000.
Note 11 – Subsequent Events
The Company has evaluated events subsequent to September 30, 2016 for potential recognition or disclosure in its condensed consolidated financial statements.
There have been no material subsequent events requiring recognition or disclosure in this Report.
16
Item 2. Management’s Discussion and Analysis of Financial Condition and Results of Operations.
The following discussion and analysis should be read in conjunction with the information contained in the unaudited condensed consolidated interim financial statements of the Company and the related notes thereto for the three and nine month periods ended September 30, 2016 and 2015, appearing elsewhere herein, and in conjunction with the Management’s Discussion and Analysis of Financial Condition and Results of Operations set forth in the Company’s Annual Report on Form 10-K for the year ended December 31, 2015, filed with the Securities and Exchange Commission (“SEC”) on March 17, 2016.
Forward Looking Information
This Quarterly Report on Form 10-Q (the “Report”) contains certain “forward-looking statements” that are based on management’s exercise of business judgment as well as assumptions made by, and information currently available to, management. When used in this document, the words “may,” "will,” “anticipate,” “believe,” “estimate,” “expect,” “intend,” and words of similar import, are intended to identify any forward-looking statements. You should not place undue reliance on these forward-looking statements. These statements reflect our current view of future events and are subject to certain risks and uncertainties, as noted in the Company’s Annual Report on Form 10-K, filed with the SEC, and as noted below. Should one or more of these risks or uncertainties materialize, or should underlying assumptions prove incorrect, our actual results could differ materially from those anticipated in these forward-looking statements. We undertake no obligation, and do not intend, to update, revise or otherwise publicly release any revisions to these forward-looking statements to reflect events or circumstances after the date hereof, or to reflect the occurrence of any unanticipated events. Although we believe that our expectations are based on reasonable assumptions, we can give no assurance that our expectations will materialize.
Overview, History and Recent Developments
Heritage Global Inc. (“HGI,” “we” or the “Company”) was incorporated in the State of Florida in 1983 under the name “MedCross, Inc.” The Company’s name was changed to “I-Link Incorporated” in 1997, to “Acceris Communications Inc.” in 2003, to “C2 Global Technologies Inc.” in 2005, to “Counsel RB Capital Inc.” in 2011, and to Heritage Global Inc. effective in 2013. The most recent name change more closely identifies the Company with its core auction business, Heritage Global Partners, Inc. (“HGP”).
In 2014, the Company acquired all of the outstanding equity of National Loan Exchange, Inc. (“NLEX”), a broker of charged-off receivables in the United States and Canada. As a result of this acquisition, NLEX now operates as a wholly owned division of the Company.
On July 5, 2016, the Company completed the sale of its real estate inventory to International Investments and Infrastructure, LLC (“III”) for $4.1 million. Concurrently, and in accordance with the purchase and sale agreement, the previously existing lease agreement between the Company and an affiliate of III was terminated.
On July 8, 2016, the Company repaid $2.5 million of outstanding principal, plus accrued interest, on its Third Party Debt and terminated its loan agreement with the third party.
17
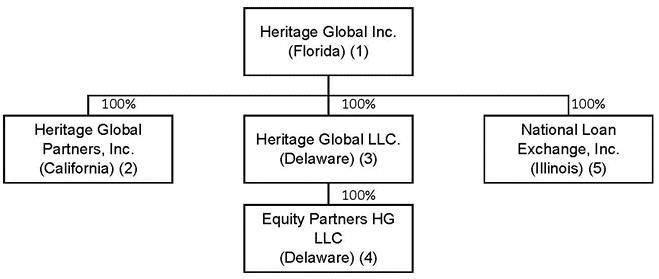
The organization chart below outlines the basic corporate structure of the Company as of September 30, 2016.
|
(1) |
Registrant. |
|
(2) |
Full service, global auction, appraisal and asset advisory company. |
|
(3) |
Asset liquidation company which acquires and monetizes distressed and surplus assets. |
|
(4) |
Mergers and acquisitions (M&A) advisory firm specializing in financially distressed businesses and properties. |
|
(5) |
Broker of charged-off receivables. |
Asset liquidation
The Company is a value-driven, innovative leader in corporate and financial asset liquidation transactions, valuations and advisory services. The Company specializes in both acting as an adviser, as well as acquiring or brokering turnkey manufacturing facilities, surplus industrial machinery and equipment, industrial inventories, accounts receivable portfolios, and entire business enterprises.
The asset liquidation business began operations in 2009 with the establishment of Heritage Global LLC (“HG LLC”). In addition to acquiring turnkey manufacturing facilities and used industrial machinery and equipment, HG LLC arranges traditional asset disposition sales, including liquidation and auction sales. In 2011, HG LLC acquired 100% of the assets of EP USA, LLC (d/b/a Equity Partners) (“Equity Partners”), thereby expanding the Company’s operations. Equity Partners is a boutique M&A advisory firm and provider of financial solutions for distressed businesses and properties.
In 2012, the Company increased its in-house asset liquidation expertise via its acquisition of 100% of the outstanding equity of Heritage Global Partners, Inc. (“HGP”), a global full-service auction, appraisal and asset advisory firm, and launched Heritage Global Partners Europe (“HGP Europe”). Through its wholly-owned subsidiary Heritage Global Partners UK Limited, the Company opened three European-based offices, one each in the United Kingdom, Germany and Spain.
In 2014, the Company again expanded its asset liquidation operations with the acquisition of 100% of the outstanding equity of National Loan Exchange (‘NLEX”). NLEX is the largest volume broker of charged-off receivables in the United States and Canada, and its offerings include national, state and regional portfolios on behalf of many of the world’s top financial institutions. The NLEX acquisition is consistent with HGI’s strategy to expand and diversify the services provided by its asset liquidation business.
As a result of the events and acquisitions outlined above, management believes that HGI’s expanded global platform will allow the Company to achieve its long term industry leadership goals.
Intellectual property licensing
Until the third quarter of 2016, the Company held several patents, including two that relate to Voice over Internet Protocol (“VoIP”). U.S. Patent No. 6,438,124 was developed by the Company, and encompasses the technology that allows two parties to converse phone-to-phone, regardless of the distance, by transmitting voice/sound via the Internet. U.S. Patent No. 6,243,373 (the “VoIP Patent”) was purchased from a third party (the “Vendor”). These patents, together with related international patents and patent
18
applications, form the Company’s international VoIP Patent Portfolio (the “Portfolio”) that covers the basic process and technology that enable VoIP communication as used in the market today. As part of the consideration for the acquisition of the VoIP Patent, the Vendor is entitled to receive 35% of the net earnings from the Portfolio. The Company completed the sale of the Portfolio during the third quarter of 2016 for $0.1 million, and fulfilled all remaining obligations to the Vendor. Subsequent to fulfillment of all obligations to the Vendor, net proceeds retained by the Company was $0.1 million.
Industry and Competition
Asset Liquidation
The Company’s asset liquidation business consists primarily of the auction, appraisal and asset advisory services provided by HGP, mergers and acquisitions advisory services provided by Equity Partners, and the accounts receivable brokerage services provided by NLEX. It also includes the purchase and sale, including at auction, of industrial machinery and equipment, real estate, inventories, accounts receivable and distressed debt. The market for these services and assets is highly fragmented. To acquire auction or appraisal contracts, or assets for resale, HGI competes with other liquidators, auction companies, dealers and brokers. It also competes with them for potential purchasers, as well as with equipment manufacturers, distributors, dealers and equipment rental companies. Some competitors have significantly greater financial and marketing resources and name recognition.
HGI’s business strategy includes the option of partnering with one or more additional purchasers, pursuant to a partnership, joint venture or limited liability company agreement (collectively, “Joint Ventures”). These Joint Ventures give the Company access to more opportunities, helping to mitigate some of the competition from the market’s larger participants and contribute to the Company’s objective to be the leading resource for clients requiring capital asset solutions.
Government Regulation
We are subject to federal, state and local consumer protection laws, including laws protecting the privacy of customer non-public information and regulations prohibiting unfair and deceptive trade practices. Many jurisdictions also regulate "auctions" and "auctioneers" and may regulate online auction services. These consumer protection laws and regulations could result in substantial compliance costs and could interfere with the conduct of our business.
Legislation in the United States, including the Sarbanes-Oxley Act of 2002 and the Dodd-Frank Act of 2010, has increased public companies’ regulatory and compliance costs as well as the scope and cost of work provided by independent registered public accountants and legal advisors. The mandatory adoption of XBRL reporting in 2011 has also increased the Company’s costs paid to third party service providers. As regulatory and compliance guidelines continue to evolve, we expect to continue to incur costs, which may or may not be material, in order to comply with legislative requirements or rules, pronouncements and guidelines by regulatory bodies.
Critical Accounting Policies
Management’s Discussion and Analysis of Financial Condition and Results of Operations references our unaudited condensed consolidated interim financial statements, which have been prepared in accordance with generally accepted accounting principles in the United States of America (“GAAP”). This requires management to make estimates and assumptions that affect the reported amounts of assets and liabilities and the disclosure of contingent assets and liabilities at the date of the financial statements, as well as the reported amounts of revenue and expenses during the reporting period. Management bases its estimates and judgments on historical experience and various other factors that are considered to be reasonable under the circumstances. Actual results could differ from those estimates.
Significant estimates required in the preparation of the unaudited condensed consolidated interim financial statements included in this Report include the assessment of collectability of revenue recognized, and the valuation of accounts receivable, inventory, investments, goodwill, intangible assets, liabilities, contingent consideration, deferred income tax assets and liabilities and stock-based compensation. These estimates are considered significant either because of the significance of the financial statement items to which they relate, or because they require judgment and estimation due to the uncertainty involved in measuring, at a specific point in time, events that are continuous in nature.
The Company has no off-balance sheet arrangements.
The Company has not paid any dividends, and does not expect to pay any dividends in the future.
19
The critical accounting policies used in the preparation of our audited consolidated financial statements are discussed in our Annual Report on Form 10-K for the year ended December 31, 2015. There have been no changes to these policies in the first nine months of 2016.
Management’s Discussion of Financial Condition
Liquidity and Capital Resources
Liquidity
At September 30, 2016 the Company had a working capital deficit of $4.7 million, as compared to a working capital deficit of $5.1 million at December 31, 2015, a slight decrease in the deficit of approximately $0.4 million.
The Company’s current assets increased to $5.7 million compared to $4.3 million at December 31, 2015. The most significant change was due to the increase in cash, primarily the result of the sale of the Company’s real estate inventory, and the timing of the Company’s asset liquidation transactions. A portion of the proceeds received from the sale of the real estate inventory was used to pay down existing debt obligations. Additionally, the Company’s accounts receivable increased $0.5 million as a result of payments owed to the Company at the end of the third quarter of 2016 from asset liquidation transactions.
The Company’s current liabilities increased to $10.4 million compared to $9.4 million at December 31, 2015. The most significant change was the $1.5 million increase in the accounts payable and accrued liabilities, which resulted from the timing of certain auction settlement liabilities with clients.
During the first nine months of 2016, the Company’s primary sources of cash were the operations of its asset liquidation business, including the sale of the Company’s real estate inventory, and advances of $1.1 million from related party loans. Cash disbursements, other than those related to debt repayment of $3.8 million (of which $2.5 million was to a third party, and $1.3 million was to related parties), and earn out payments of $0.6 million, were primarily related to operating expenses.
The Company expects that its asset liquidation business will continue to be the primary source of cash required for ongoing operations for the foreseeable future.
Ownership Structure and Capital Resources
|
|
• |
At September 30, 2016, the Company had stockholders’ equity of $3.8 million, as compared to $3.4 million at December 31, 2015. |
|
|
• |
The Company determines its future capital and operating requirements based upon its current and projected operating performance and the extent of its contractual commitments. The Company expects to be able to finance its future operations through a combination of income from its asset liquidation business and securing additional debt financing. The Company’s contractual requirements are limited to the outstanding loans and lease commitments with related and unrelated parties. The Company intends to repay its outstanding loans at maturity. Capital requirements are generally limited to the Company’s purchases of surplus and distressed assets. The Company believes that its current capital resources are sufficient for these requirements. In the event additional capital is needed, the Company believes it can obtain additional debt financing through either related party loans or through a new bank credit facility. |
20
Cash and cash equivalents at September 30, 2016 were $3.3 million as compared to $2.8 million at December 31, 2015, an increase of approximately $0.5 million.
Cash provided by or used in operating activities. Cash provided by operating activities was $4.0 million during the nine months ended September 30, 2016 as compared to $0.9 million cash used during the same period in 2015. The $4.9 million change was primarily attributable to the following: we had a favorable change in the net income/loss adjusted for noncash items, which was $0.7 million better during the first nine months of 2016 compared to the same period in 2015, and a net favorable change of $4.2 million in operating assets and liabilities in the first nine months of 2016 compared to the same period in 2015, primarily the result of the Company completing the sale of its real estate inventory in the third quarter of 2016. In the first nine months of 2016, the Company had a significant non-cash fair value adjustment of its contingent consideration, which resulted in a $0.9 million gain. In the same period in 2015, the Company had a significant non-cash write-down of its real estate inventory to its net realizable value, which resulted in a $2.7 million loss.
The significant changes in operating assets and liabilities during the first nine months of 2016 as compared to 2015 are primarily due to the completion of the sale of the Company’s real estate inventory in the third quarter of 2016, as well as the nature of the Company’s operations. The Company earns revenue from discrete asset liquidation deals that vary considerably with respect to their magnitude and timing, and that can consist of fees, commissions, asset sale proceeds, or a combination of these. The operating assets and liabilities associated with these deals are therefore subject to the same variability and can be quite different at the end of any given period.
Cash used in or provided by investing activities. Cash used in investing activities was $0.1 million during the nine months ended September 30, 2016, as compared to $2.6 million cash provided by investing activities during the same period in 2015. The Company’s 2015 investing activities consisted primarily of the following cash receipts related to the Company’s equity method investments: $2.0 million of proceeds from the Company’s December 2014 exit from its investment in Polaroid (received in 2015), and $0.7 million of distributions from the Company’s equity method investments. This was offset slightly by a $0.1 million investment in the Company’s equity method investments. The Company’s 2016 investing activities consisted primarily of $0.1 million related to the purchase of property and equipment.
Cash used in financing activities. Cash used in financing activities was $3.3 million during the nine months ended September 30, 2016, as compared to $2.7 million cash used during the same period in 2015. During the first nine months of 2016 the Company received proceeds of $1.1 million from related party loans, of which $0.5 million was repaid during the same period. The Company also repaid $0.8 million of debt to Street Capital, and repaid the $2.5 million balance of its loan with an unrelated party (the “Third Party Loan”) in full. The Company also paid $0.6 million to the former owner of NLEX, which represented approximately three quarters of the second earn-out payment earned. The Company’s 2015 financing activities consisted of net $1.7 million of debt repaid to Street Capital, $0.5 million of debt repaid to third parties, and $0.5 million paid to the former owner of NLEX for the first earn-out payment.
Contractual Obligations
The Company’s only significant contractual obligation, other than its related party loans (which are short term in nature), is its long-term earn-out obligation owed to the former owner (and current president) of NLEX. The Company will pay the former owner of NLEX 50% of the Net Profits (as defined in the NLEX stock purchase agreement) of NLEX for each of the four years following the closing of the acquisition. The payments are due on or about July 30 of each year, began in 2015, and will continue until 2018. In 2015, the Company made the first of the four payments for $0.5 million. During the first nine months of 2016, the Company paid $0.6 million, which represented approximately three quarters of the expected total second payment. The Company expects to pay approximately $1.9 million in full satisfaction of the remainder of the second, third and fourth payments through 2018.
21
Management’s Discussion of Results of Operations
The following table sets out the Company’s condensed consolidated results of operations for the three and nine months ended September 30, 2016 and 2015 (dollars in thousands).
|
|
|
Three months ended |
|
|
Change |
|
|
Nine months ended |
|
|
Change |
|
||||||||||||||||||||
|
|
|
September 30, 2016 |
|
|
September 30, 2015 |
|
|
Dollars |
|
|
Percent |
|
|
September 30, 2016 |
|
|
September 30, 2015 |
|
|
Dollars |
|
|
Percent |
|
||||||||
|
Revenues: |
|
|
|
|
|
|
|
|
|
|
|
|
|
|
|
|
|
|
|
|
|
|
|
|
|
|
|
|
|
|
|
|
|
Services revenue |
|
$ |
3,824 |
|
|
$ |
2,993 |
|
|
$ |
831 |
|
|
|
28 |
% |
|
$ |
11,718 |
|
|
$ |
9,533 |
|
|
$ |
2,185 |
|
|
|
23 |
% |
|
Asset sales |
|
|
4,758 |
|
|
|
767 |
|
|
|
3,991 |
|
|
|
520 |
% |
|
|
6,193 |
|
|
|
2,434 |
|
|
|
3,759 |
|
|
|
154 |
% |
|
Total revenues |
|
|
8,582 |
|
|
|
3,760 |
|
|
|
4,822 |
|
|
|
128 |
% |
|
|
17,911 |
|
|
|
11,967 |
|
|
|
5,944 |
|
|
|
50 |
% |
|
|
|
|
|
|
|
|
|
|
|
|
|
|
|
|
|
|
|
|
|
|
|
|
|
|
|
|
|
|
|
|
|
|
|
Operating costs and expenses: |
|
|
|
|
|
|
|
|
|
|
|
|
|
|
|
|
|
|
|
|
|
|
|
|
|
|
|
|
|
|
|
|
|
Cost of services revenue |
|
|
1,882 |
|
|
|
653 |
|
|
|
1,229 |
|
|
|
188 |
% |
|
|
3,751 |
|
|
|
2,101 |
|
|
|
1,650 |
|
|
|
79 |
% |
|
Cost of asset sales |
|
|
4,243 |
|
|
|
538 |
|
|
|
3,705 |
|
|
|
689 |
% |
|
|
5,479 |
|
|
|
2,173 |
|
|
|
3,306 |
|
|
|
152 |
% |
|
Real estate inventory write-down |
|
|
— |
|
|
|
2,748 |
|
|
|
(2,748 |
) |
|
|
(100 |
)% |
|
|
— |
|
|
|
2,748 |
|
|
|
(2,748 |
) |
|
|
(100 |
)% |
|
Selling, general and administrative |
|
|
2,783 |
|
|
|
3,090 |
|
|
|
(307 |
) |
|
|
(10 |
)% |
|
|
8,937 |
|
|
|
9,131 |
|
|
|
(194 |
) |
|
|
(2 |
)% |
|
Depreciation and amortization |
|
|
76 |
|
|
|
166 |
|
|
|
(90 |
) |
|
|
(54 |
)% |
|
|
240 |
|
|
|
490 |
|
|
|
(250 |
) |
|
|
(51 |
)% |
|
Total operating costs and expenses |
|
|
8,984 |
|
|
|
7,195 |
|
|
|
1,789 |
|
|
|
25 |
% |
|
|
18,407 |
|
|
|
16,643 |
|
|
|
1,764 |
|
|
|
11 |
% |
|
(Losses) earnings of equity method investments |
|
|
— |
|
|
|
(34 |
) |
|
|
34 |
|
|
|
(100 |
)% |
|
|
52 |
|
|
|
105 |
|
|
|
(53 |
) |
|
|
(50 |
)% |
|
Operating loss |
|
|
(402 |
) |
|
|
(3,469 |
) |
|
|
3,067 |
|
|
|
(88 |
)% |
|
|
(444 |
) |
|
|
(4,571 |
) |
|
|
4,127 |
|
|
|
(90 |
)% |
|
Other income |
|
|
16 |
|
|
|
— |
|
|
|
16 |
|
|
|
100 |
% |
|
|
39 |
|
|
|
5 |
|
|
|
34 |
|
|
|
680 |
% |
|
Fair value adjustment of contingent consideration |
|
|
43 |
|
|
|
(87 |
) |
|
|
130 |
|
|
|
(149 |
)% |
|
|
900 |
|
|
|
(139 |
) |
|
|
1,039 |
|
|
|
(747 |
)% |
|
Interest expense |
|
|
(17 |
) |
|
|
(61 |
) |
|
|
44 |
|
|
|
-72 |
% |
|
|
(153 |
) |
|
|
(189 |
) |
|
|
36 |
|
|
|
-19 |
% |
|
(Loss) income before income tax expense |
|
|
(360 |
) |
|
|
(3,617 |
) |
|
|
3,257 |
|
|
|
(90 |
)% |
|
|
342 |
|
|
|
(4,894 |
) |
|
|
5,236 |
|
|
|
(107 |
)% |
|
Income tax expense |
|
|
11 |
|
|
|
20 |
|
|
|
(9 |
) |
|
|
-45 |
% |
|
|
29 |
|
|
|
23 |
|
|
|
6 |
|
|
|
26 |
% |
|
Net (loss) income |
|
$ |
(371 |
) |
|
$ |
(3,637 |
) |
|
$ |
3,266 |
|
|
|
(90 |
)% |
|
$ |
313 |
|
|
$ |
(4,917 |
) |
|
$ |
5,230 |
|
|
|
(106 |
)% |
The Company’s asset liquidation business model has several components: (1) traditional fee based asset disposition services, such as commissions from on-line and webcast auctions, liquidations and negotiated sales, and commissions from the NLEX charged-off receivables business, (2) the acquisition and subsequent disposition of distressed and surplus assets, including industrial machinery and equipment and real estate, and (3) fees earned for appraisal and management advisory services. The Company also earns income from its asset liquidation business through its earnings from equity method investments.
Three-Month Period Ended September 30, 2016 Compared to Three-Month Period Ended September 30, 2015
Revenues and cost of revenues – Revenues were $8.6 million during the three months ended September 30, 2016 compared to $3.8 million during the same period in 2015. Combined costs of services revenue and asset sales were $6.1 million during the three months ended September 30, 2016, compared to $1.2 million during the same period in 2015, and earnings of equity method investments were $0 during the third quarter of 2016 compared to a $34,000 loss during the same period in 2015. The gross profit of these three items was therefore flat at $2.5 million during the third quarters of both 2016 and 2015. The significant increase in the current year’s quarterly revenue was primarily the result of the sale of the Company’s real estate inventory. Because the Company conducts its asset liquidation operations both independently and through partnerships, and the ratio of the two is unlikely to remain constant in each period, the operations should be considered as a whole rather than on a line-by-line basis. The gross profit in the current year reflects the vagaries of the timing of asset liquidation transactions.
Real estate inventory write-down – The Company recorded a $2.7 million real estate inventory write-down charge during the three months ended September 30, 2015. No charge was taken in the comparable 2016 period. The write-down represented a net realizable value adjustment to the carrying value of the Company’s real estate inventory.
Selling, general and administrative expense – Selling, general and administrative expense was $2.8 million during the three months ended September 30, 2016, a decrease of $0.3 million, or approximately 10%, compared to the same period in 2015.
22
Significant components of selling, general and administrative expense were as shown below (dollars in thousands):
|
|
|
|
|
|
|
|
|
|||||
|
|
|
Three Months Ended September 30, |
|
|
|
|
|
|||||
|
|
|
2016 |
|
|
2015 |
|
|
% change |
|
|||
|
Compensation |
|
|
|
|
|
|
|
|
|
|
|
|
|
HGP |
|
$ |
928 |
|
|
$ |
1,100 |
|
|
|
(16 |
)% |
|
Equity Partners |
|
|
318 |
|
|
|
377 |
|
|
|
(16 |
)% |
|
NLEX |
|
|
555 |
|
|
|
488 |
|
|
|
14 |
% |
|
HGI |
|
|
75 |
|
|
|
34 |
|
|
|
121 |
% |
|
Stock-based compensation |
|
|
14 |
|
|
|
41 |
|
|
|
(66 |
)% |
|
|
|
|
|
|
|
|
|
|
|
|
|
|
|
Consulting |
|
|
83 |
|
|
|
125 |
|
|
|
(34 |
)% |
|
Board of Directors fees |
|
|
53 |
|
|
|
39 |
|
|
|
36 |
% |
|
Street Capital management fees |
|
|
— |
|
|
|
60 |
|
|
|
(100 |
)% |
|
Accounting, tax and legal professional fees |
|
|
95 |
|
|
|
145 |
|
|
|
(34 |
)% |
|
Insurance |
|
|
78 |
|
|
|
61 |
|
|
|
28 |
% |
|
Occupancy |
|
|
201 |
|
|
|
154 |
|
|
|
31 |
% |
|
Travel and entertainment |
|
|
170 |
|
|
|
221 |
|
|
|
(23 |
)% |
|
Advertising and promotion |
|
|
112 |
|
|
|
138 |
|
|
|
(19 |
)% |
|
Other |
|
|
101 |
|
|
|
107 |
|
|
|
(6 |
)% |
|
Total selling, general & administrative expense |
|
|
2,783 |
|
|
|
3,090 |
|
|
|
|
|
The Company benefited from reductions in almost all the significant components of selling, general and administrative expense during the third quarter of 2016 as compared to the same period in 2015. Significant cost reductions were achieved in compensation expense, consulting fees, professional fees, and management fees. These decreases were offset slightly by increases in directors’ fees, insurance and occupancy expenses. The overall decrease in the compensation is primarily the result of a change in the workforce as well as stock-based awards becoming fully vested during 2015 and not incurring any related expense in the third quarter of 2016. The decrease in the Street Capital management fee is the result of the termination of the Services Agreement in the third quarter of 2015 (see Note 10 for further detail).
Depreciation and amortization expense – Depreciation and amortization expense was $0.1 million during the three months ended September 30, 2016 compared to $0.2 million during the same period in 2015, and consisted almost entirely of amortization expense related to intangible assets. The decrease in 2016 was the result of an impairment charge taken during the fourth quarter of 2015, reducing the carrying value (and subsequent amortization expense) of the HGP customer network to its fair value. In both years the depreciation of property and equipment was not material.
Nine-Month Period Ended September 30, 2016 Compared to Nine-Month Period Ended September 30, 2015
Revenues and cost of revenues – Revenues were $17.9 million during the nine months ended September 30, 2016 compared to $12.0 million during the same period in 2015. Combined costs of services revenue and asset sales were $9.2 million during the nine months ended September 30, 2016 compared to $4.3 million during the same period in 2015, and earnings of equity method investments were $0.1 million in both the first nine months in 2016 and the same period in 2015. The gross profit of these three items was therefore $8.7 million during the first nine months in 2016 compared to $7.8 million during the same period in 2015, an increase of approximately $0.9 million, or 12%. Because the Company conducts its asset liquidation operations both independently and through partnerships, and the ratio of the two is unlikely to remain constant in each period, the operations should be considered as a whole rather than on a line-by-line basis. The increased gross profit in the current year reflects the vagaries of the timing of asset liquidation transactions.
Selling, general and administrative expense – Selling, general and administrative expense was $8.9 million during the nine months ended September 30, 2016, compared to $9.1 million during the same period in 2015, a decrease of approximately $0.2 million or 2%.
23
Significant components of selling, general and administrative expense were as shown below (dollars in thousands):
|
|
|
|
|
|
|
|
|
|||||
|
|
|
Nine Months Ended September 30, |
|
|
|
|
|
|||||
|
|
|
2016 |
|
|
2015 |
|
|
% change |
|
|||
|
Compensation |
|
|
|
|
|
|
|
|
|
|
|
|
|
HGP |
|
$ |
2,893 |
|
|
$ |
3,093 |
|
|
|
(6 |
)% |
|
Equity Partners |
|
|
1,124 |
|
|
|
1,047 |
|
|
|
7 |
% |
|
NLEX |
|
|
1,741 |
|
|
|
1,520 |
|
|
|
15 |
% |
|
HGI |
|
|
225 |
|
|
|
103 |
|
|
|
118 |
% |
|
Stock-based compensation |
|
|
71 |
|
|
|
317 |
|
|
|
(78 |
)% |
|
|
|
|
|
|
|
|
|
|
|
|
|
|
|
Consulting |
|
|
232 |
|
|
|
250 |
|
|
|
(7 |
)% |
|
Board of Directors fees |
|
|
190 |
|
|
|
117 |
|
|
|
62 |
% |
|
Street Capital management fees |
|
|
— |
|
|
|
240 |
|
|
|
(100 |
)% |
|
Accounting, tax and legal professional fees |
|
|
424 |
|
|
|
386 |
|
|
|
10 |
% |
|
Insurance |
|
|
215 |
|
|
|
146 |
|
|
|
47 |
% |
|
Occupancy |
|
|
545 |
|
|
|
447 |
|
|
|
22 |
% |
|
Travel and entertainment |
|
|
589 |
|
|
|
688 |
|
|
|
(14 |
)% |
|
Advertising and promotion |
|
|
349 |
|
|
|
320 |
|
|
|
9 |
% |
|
Other |
|
|
339 |
|
|
|
457 |
|
|
|
(26 |
)% |
|
Total selling, general & administrative expense |
|
|
8,937 |
|
|
|
9,131 |
|
|
|
|
|
Personnel expense increased during the nine months ended September 30, 2016 compared to the same period in 2015, however this increase was offset by a decrease in stock-based compensation. The decrease in stock-based compensation is primarily the result of awards becoming fully vested during 2015 and not incurring any related expense in the first half of 2016. Personnel expense increased during the nine months ended September 30, 2016 compared to the same period in the prior year, while being less in the three months ended September 30, 2016 compared to the same period in the prior year, as a result of the timing of new hires and terminations during the nine months ended September 30, 2016 and 2015. Increases in directors’ fees, insurance and occupancy were offset by decreases in consulting and travel and entertainment. The Street Capital management fee was eliminated in the third quarter of 2015 in connection with the termination of the Services Agreement in the third quarter of 2015 (see Note 10 for further detail).
Depreciation and amortization expense – Depreciation and amortization expense was $0.2 million during the nine months ended September 30, 2016 compared to $0.5 million during the same period in 2015, and consisted almost entirely of amortization expense related to intangible assets. The decrease in 2016 was the result of an impairment charge taken during the fourth quarter of 2015, reducing the carrying value (and subsequent amortization) of the HGP customer network to its fair value. In both years the depreciation of property and equipment was not material.
24
Non-GAAP Financial Measure – Adjusted Earnings before Interest, Taxes, Depreciation and Amortization (“Adjusted EBITDA”)
We prepared our unaudited condensed consolidated financial statements in accordance with generally accepted accounting principles in the United States (“GAAP”). We use the non-GAAP financial measure “EBITDA” in assessing the Company’s results. Additionally, we use an alternative measure, “Adjusted EBITDA,” to further reconcile from the standard definition to an amount management believes is a more appropriate metric for the Company. We define EBITDA as net (loss) income plus depreciation and amortization, interest expense, and provision for income taxes. We define Adjusted EBITDA as EBITDA plus or minus fair value adjustments of contingent consideration and plus stock-based compensation. We believe that Adjusted EBITDA is relevant and useful supplemental information for our investors. Management believes that the presentation of this non-GAAP financial measure, when considered together with our GAAP financial measures and the reconciliation to the most directly comparable GAAP financial measure, provides a more complete understanding of the factors and trends affecting the Company than could be obtained absent these disclosures. Management uses Adjusted EBITDA to make operating and strategic decisions and to evaluate the Company’s performance. We have disclosed this non-GAAP financial measure so that our investors have the same financial data that management uses, with the intention of assisting investors to make comparisons to our historical operating results and analyze our underlying performance. Management believes that Adjusted EBITDA is a useful supplemental tool to evaluate the underlying operating performance of the Company on an ongoing basis. Our use of Adjusted EBITDA is not meant to be, and should not be, considered in isolation or as a substitute for, or superior to, any GAAP financial measure. You should carefully evaluate the financial information, below, which reconciles our GAAP reported net (loss) income to Adjusted EBITDA for the periods presented (in thousands).
|
|
|
Three Months Ended September 30, |
Nine Months Ended September 30, |
|
||||||||||||
|
|
|
2016 |
|
|
2015 |
|
|
2016 |
|
|
2015 |
|
||||
|
Net (loss) income |
|
$ |
(371 |
) |
|
$ |
(3,637 |
) |
|
$ |
313 |
|
|
$ |
(4,917 |
) |
|
Add back: |
|
|
|
|
|
|
|
|
|
|
|
|
|
|
|
|
|
Depreciation and amortization |
|
|
76 |
|
|
|
166 |
|
|
|
240 |
|
|
|
490 |
|
|
Interest expense |
|
|
17 |
|
|
|
61 |
|
|
|
153 |
|
|
|
189 |
|
|
Income tax expense |
|
|
11 |
|
|
|
20 |
|
|
|
29 |
|
|
|
23 |
|
|
EBITDA |
|
|
(267 |
) |
|
|
(3,390 |
) |
|
|
735 |
|
|
|
(4,215 |
) |
|
|
|
|
|
|
|
|
|
|
|
|
|
|
|
|
|
|
|
Management add back: |
|
|
|
|
|
|
|
|
|
|
|
|
|
|
|
|
|
Fair value adjustment of contingent consideration |
|
|
(43 |
) |
|
|
87 |
|
|
|
(900 |
) |
|
|
139 |
|
|
Stock based compensation |
|
|
14 |
|
|
|
41 |
|
|
|
71 |
|
|
|
317 |
|
|
Adjusted EBITDA |
|
$ |
(296 |
) |
|
$ |
(3,262 |
) |
|
$ |
(94 |
) |
|
$ |
(3,759 |
) |
25
Item 3. Quantitative and Qualitative Disclosures about Market Risk.
As a Smaller Reporting Company, we are not required to provide the information required by this item.
Item 4. Controls and Procedures.
As of the end of the period covered by this Quarterly Report, our Chief Executive Officer and Chief Financial Officer (the “Certifying Officers”) conducted evaluations of our disclosure controls and procedures. As defined in Rules 13a-15(e) and 15d-15(e) of the Securities Exchange Act of 1934, as amended (the “Exchange Act”), the term “disclosure controls and procedures” means controls and other procedures of an issuer that are designed to ensure that information required to be disclosed by the issuer in the reports that it files or submits under the Exchange Act is recorded, processed, summarized and reported, within the time periods specified in the Commission’s rules and forms. Disclosure controls and procedures include, without limitation, controls and procedures designed to ensure that information required to be disclosed by an issuer in the reports that it files or submits under the Exchange Act is accumulated and communicated to the issuer’s management, including principal executive and principal financial officers, or persons performing similar functions, as appropriate, to allow timely decisions regarding required disclosure. Based on this evaluation, the Certifying Officers have concluded that our disclosure controls and procedures were effective.
During the quarter ended September 30, 2016, there were no changes in our internal control over financial reporting during the third fiscal quarter of 2016 that have materially affected, or are reasonably likely to materially affect, our internal control over financial reporting.
26
There have been no material changes to the legal proceedings discussed in our Annual Report on Form 10-K for the year ended December 31, 2015, as filed with the SEC on March 17, 2016.
There have been no material changes to the risk factors discussed in our Annual Report on Form 10-K for the year ended December 31, 2015, as filed with the SEC on March 17, 2016.
Item 2. Unregistered Sales of Equity Securities and Use of Proceeds.
None.
Item 3. Defaults Upon Senior Securities.
None.
Item 4. Mine Safety Disclosures.
Not applicable.
None.
27
(a) List of Exhibits
|
Exhibit No. |
|
Identification of Exhibit |
|
10.1 |
|
Loan Agreement between Heritage Global Partners, Inc. and the Zel Dove Trust UAD 10/31/2006, effective as of January 12, 2016 (1) |
|
|
|
|
|
10.2 |
|
Loan Agreement between Heritage Global Partners, Inc., the Dove Holdings Corporation, and Ross Dove, effective as of August 17, 2016 (1) |
|
|
|
|
|
10.3 |
|
Heritage Global Inc. 2016 Stock Option Plan (2) |
|
|
|
|
|
31.1 |
|
Certification of Principal Executive Officer pursuant to Rule 13a-14(a) and 15d-14(a) as adopted under Section 302 of the Sarbanes-Oxley Act of 2002 |
|
|
|
|
|
31.2 |
|
Certification of Principal Financial Officer pursuant to Rule 13a-14(a) and 15d-14(a) as adopted under Section 302 of the Sarbanes-Oxley Act of 2002 |
|
|
|
|
|
32.1 |
|
Certification of Principal Executive Officer pursuant to 18 U.S.C. Section 1350 as adopted pursuant to Section 906 of the Sarbanes-Oxley Act of 2002 |
|
|
|
|
|
32.2 |
|
Certification of Principal Financial Officer pursuant to 18 U.S.C. Section 1350 as adopted pursuant to Section 906 of the Sarbanes-Oxley Act of 2002 |
|
|
|
|
|
101.INS |
|
XBRL Instance Document |
|
|
|
|
|
101.SCH |
|
XBRL Taxonomy Extension Schema Document |
|
|
|
|
|
101.CAL |
|
XBRL Taxonomy Extension Calculation Linkbase Document |
|
|
|
|
|
101.DEF |
|
XBRL Taxonomy Extension Definition Linkbase Document |
|
|
|
|
|
101.LAB |
|
XBRL Taxonomy Extension Labels Linkbase Document |
|
|
|
|
|
101.PRE |
|
XBRL Taxonomy Extension Presentation Linkbase Document |
|
|
|
|
|
|
|
|
|
|
|
|
|
(1) |
|
Incorporated by reference to our Form 8-K filed on November 4, 2016 |
|
(2) |
|
Incorporated by reference to our Definitive Proxy Statement on Schedule 14A filed on August 5, 2016 |
|
|
|
|
|
|
|
|
|
|
|
|
|
|
|
|
|
|
|
|
28
Pursuant to the requirements of the Securities Exchange Act of 1934, the Registrant has duly caused this report to be signed on its behalf by the undersigned thereunder duly authorized.
|
|
|
Heritage Global Inc. |
||
|
|
|
|
|
|
|
Date: November 7, 2016 |
|
By: |
|
/s/ Ross Dove |
|
|
|
|
|
Ross Dove |
|
|
|
|
|
Chief Executive Officer |
|
|
|
|
|
(Principal Executive Officer) |
|
|
|
|
|
|
|
|
|
By: |
|
/s/ Scott A. West |
|
|
|
|
|
Scott A. West |
|
|
|
|
|
Chief Financial Officer |
|
|
|
|
|
(Principal Financial Officer and |
|
|
|
|
|
Principal Accounting Officer) |
29