Attached files
| file | filename |
|---|---|
| EX-31.2 - EXHIBIT 31.2 - Heritage Global Inc. | exhibit31-2.htm |
| EX-31.1 - EXHIBIT 31.1 - Heritage Global Inc. | exhibit31-1.htm |
| EX-32.1 - EXHIBIT 32.1 - Heritage Global Inc. | exhibit32-1.htm |
| EXCEL - IDEA: XBRL DOCUMENT - Heritage Global Inc. | Financial_Report.xls |
| EX-32.2 - EXHIBIT 32.2 - Heritage Global Inc. | exhibit32-2.htm |
UNITED STATES
SECURITIES AND EXCHANGE COMMISSION
WASHINGTON, D.C.
20549
FORM 10-Q
[X] QUARTERLY REPORT PURSUANT TO SECTION 13 OR 15(d) OF THE SECURITIES EXCHANGE ACT OF 1934
For the quarterly period ended March 31, 2015
OR
[ ] TRANSITION REPORT PURSUANT TO SECTION 13 OR 15(d) OF THE SECURITIES EXCHANGE ACT OF 1934
For the transition period from to
Commission file number: 0-17973
HERITAGE GLOBAL INC.
(Exact name of registrant as specified in its charter)
| Florida | 59-2291344 |
| (State or Other Jurisdiction of | |
| Incorporation or Organization) | (I.R.S. Employer Identification No.) |
12625 High Bluff Drive, Suite 305, San Diego, CA 92130
(Address of Principal Executive Offices)
(858) 847-0656
(Registrant’s Telephone
Number)
N/A
(Registrant’s Former Name)
Indicate by check mark whether the registrant (1) has filed all
reports required to be filed by Section 13 or 15(d) of the Securities and
Exchange Act of 1934 during the preceding 12 months (or for such shorter time
period that the registrant was required to file such reports), and (2) has been
subject to such filing requirements for the past 90 days.
Yes
[X] No [ ]
Indicate by check mark whether the registrant has submitted
electronically and posted on its corporate Web site, if any, every Interactive
Data File required to be submitted and posted pursuant to Rule 405 of Regulation
S-T during the preceding 12 months (or for such shorter period that the
registrant was required to submit and post such files).
Yes
[X] No [ ]
Indicate by check mark whether the registrant is a large accelerated filer, an accelerated filer, a non-accelerated filer, or a smaller reporting company (as defined in Exchange Act Rule 12b-2).
| Large Accelerated Filer | [ ] | Accelerated Filer | [ ] |
| Non-Accelerated Filer | [ ] | Smaller reporting company | [X] |
Indicate by check mark whether the registrant is a shell
company (as defined in Rule 12b-2 of the Exchange Act).
Yes [
] No [X]
As of May 5, 2015, there were 28,167,408 shares of common stock, $0.01 par value, outstanding.
TABLE OF CONTENTS
2
PART I – FINANCIAL INFORMATION
Item 1 – Financial Statements.
HERITAGE GLOBAL INC.
CONDENSED CONSOLIDATED
BALANCE SHEETS
(In thousands of U.S. dollars, except share and per
share amounts)
(unaudited)
|
|
March 31, | December 31, | ||||
|
|
2015 | 2014 | ||||
|
|
||||||
|
ASSETS |
||||||
|
Current assets: |
||||||
|
Cash and cash equivalents |
$ | 3,810 | $ | 3,633 | ||
|
Accounts receivable (net of allowance for doubtful accounts of $31; 2014 - $31) |
742 | 3,043 | ||||
|
Deposits |
2 | 173 | ||||
|
Inventory – equipment |
519 | 139 | ||||
|
Other current assets |
512 | 586 | ||||
|
Income taxes receivable |
10 | 1 | ||||
|
Total current assets |
5,595 | 7,575 | ||||
|
Non-current assets: |
||||||
|
Inventory – real estate |
6,508 | 6,508 | ||||
|
Asset liquidation investments |
801 | 978 | ||||
|
Other equity-method investments |
21 | 156 | ||||
|
Property, plant and equipment, net |
143 | 150 | ||||
|
Identifiable intangible assets, net |
7,505 | 7,657 | ||||
|
Goodwill |
8,846 | 8,846 | ||||
|
Total assets |
$ | 29,419 | $ | 31,870 | ||
|
|
||||||
|
LIABILITIES AND STOCKHOLDERS’ EQUITY |
||||||
|
Current liabilities: |
||||||
|
Accounts payable and accrued liabilities |
$ | 6,522 | $ | 7,131 | ||
|
Debt payable to third parties |
2,617 | 539 | ||||
|
Debt payable to a related party |
2,053 | 2,985 | ||||
|
Contingent consideration |
803 | 803 | ||||
|
Total current liabilities |
11,995 | 11,458 | ||||
|
Non-current liabilities: |
||||||
|
Debt payable to third parties |
— | 2,580 | ||||
|
Contingent consideration |
3,484 | 3,395 | ||||
|
Deferred tax liabilities |
960 | 960 | ||||
|
Total liabilities |
16,439 | 18,393 | ||||
|
|
||||||
|
|
||||||
|
Commitments and contingencies |
||||||
|
|
||||||
|
Stockholders’ equity: |
||||||
|
Preferred stock, $10.00 par value, authorized 10,000,000 shares; issued and outstanding 575 Class N shares at March 31, 2015 and December 31, 2014, liquidation preference of $575 at March 31, 2015 and December 31, 2014 |
6 | 6 | ||||
|
Common stock, $0.01 par value, authorized 300,000,000 shares; issued and outstanding 28,167,408 shares at March 31, 2015 and December 31, 2014 |
282 | 282 | ||||
|
Additional paid-in capital |
283,811 | 283,691 | ||||
|
Accumulated deficit |
(271,055 | ) | (270,468 | ) | ||
|
Accumulated other comprehensive loss |
(64 | ) | (34 | ) | ||
|
Total stockholders’ equity |
12,980 | 13,477 | ||||
|
Total liabilities and stockholders’ equity |
$ | 29,419 | $ | 31,870 | ||
The accompanying notes are an integral part of these condensed consolidated financial statements.
3
HERITAGE GLOBAL INC.
CONDENSED CONSOLIDATED
STATEMENTS OF OPERATIONS
AND COMPREHENSIVE LOSS
(In
thousands of US dollars, except per share amounts)
(unaudited)
| Three Months Ended | ||||||
| March 31, | ||||||
| 2015 | 2014 | |||||
| Revenue: | ||||||
| Asset liquidation | ||||||
| Commissions and other | $ | 2,812 | $ | 1,010 | ||
| Asset sales | 833 | 975 | ||||
| Total revenue | 3,645 | 1,985 | ||||
| Operating costs and expenses: | ||||||
| Asset liquidation | 1,030 | 465 | ||||
| Patent licensing and maintenance | 38 | 11 | ||||
| Selling, general and administrative, including expenses paid to related parties | 2,885 | 2,138 | ||||
| Depreciation and amortization | 159 | 118 | ||||
| Total operating costs and expenses | 4,112 | 2,732 | ||||
| (467 | ) | (747 | ) | |||
| Earnings (loss) of asset liquidation investments | 34 | (30 | ) | |||
| Operating loss | (433 | ) | (777 | ) | ||
| Other income (expenses): | ||||||
| Earnings of other equity method investments | 5 | 11 | ||||
| Interest expense – third party | (134 | ) | (71 | ) | ||
| Interest expense – related party | (22 | ) | (67 | ) | ||
| Total other expenses | (151 | ) | (127 | ) | ||
| Loss before income tax expense | (584 | ) | (904 | ) | ||
| Income tax expense | 3 | 24,667 | ||||
| Net loss | (587 | ) | (25,571 | ) | ||
| Other comprehensive loss: | ||||||
| Currency translation adjustment (net of tax of $0) | (30 | ) | (6 | ) | ||
| Comprehensive loss | $ | (617 | ) | $ | (25,577 | ) |
| Weighted average common shares outstanding – basic and diluted (in thousands) | 28,167 | 28,167 | ||||
| Net loss per share – basic and diluted | $ | (0.02 | ) | $ | (0.91 | ) |
The accompanying notes are an integral part of these condensed consolidated financial statements.
4
HERITAGE GLOBAL INC.
CONDENSED CONSOLIDATED
STATEMENT OF CHANGES IN STOCKHOLDERS’ EQUITY
For the three months
ended March 31, 2015
(in thousands of US dollars, except share
amounts)
(unaudited)
| Accumulated | ||||||||||||||||||||||||
| Additional | other | |||||||||||||||||||||||
| Preferred stock | Common stock | paid-in | Accumulated | comprehensive | ||||||||||||||||||||
| Shares | Amount | Shares | Amount | capital | deficit | loss | Total | |||||||||||||||||
| Balance at January 1, 2015 | 575 | $ | 6 | 28,167,408 | $ | 282 | $ | 283,691 | $ | (270,468 | ) | $ | (34 | ) | $ | 13,477 | ||||||||
| Compensation cost related to stock options |
— | — | — | — | 120 | — | — | 120 | ||||||||||||||||
| Net loss | — | — | — | — | — | (587 | ) | — | (587 | ) | ||||||||||||||
| Foreign currency translation | — | — | — | — | — | — | (30 | ) | (30 | ) | ||||||||||||||
| Balance at March 31, 2015 | 575 | $ | 6 | 28,167,408 | $ | 282 | $ | 283,811 | $ | (271,055 | ) | $ | (64 | ) | $ | 12,980 | ||||||||
The accompanying notes are an integral part of these condensed consolidated financial statements.
5
HERITAGE GLOBAL INC.
CONDENSED CONSOLIDATED
STATEMENTS OF CASH FLOWS
(In thousands of US dollars)
(unaudited)
|
|
Three months ended | |||||
|
|
March 31, | |||||
|
|
2015 | 2014 | ||||
|
Cash flows used in operating activities: |
||||||
|
Net loss |
$ | (587 | ) | $ | (25,571 | ) |
|
Adjustments to reconcile net loss to net cash
provided by (used in) |
||||||
|
Accrued interest added to principal of third party debt |
37 | 10 | ||||
|
Accrued interest added to principal of related party debt |
22 | 67 | ||||
|
Accretion of contingent consideration discount |
89 | — | ||||
|
Stock-based compensation expense |
120 | 123 | ||||
|
Earnings of other equity method investments |
(5 | ) | (11 | ) | ||
|
Depreciation and amortization |
159 | 118 | ||||
|
|
||||||
|
Changes in operating assets and liabilities: |
||||||
|
Decrease in accounts receivable |
310 | 802 | ||||
|
Decrease in deposits |
171 | — | ||||
|
Increase in inventory |
(380 | ) | (113 | ) | ||
|
Decrease in asset liquidation investments |
177 | 369 | ||||
|
Decrease in other current assets |
74 | 32 | ||||
|
Increase in income taxes receivable |
(9 | ) | (21 | ) | ||
|
Decrease in deferred income tax assets |
— | 24,667 | ||||
|
Decrease in accounts payable and accrued liabilities |
(640 | ) | (1,148 | ) | ||
|
Net cash used in operating activities |
(462 | ) | (676 | ) | ||
|
|
||||||
|
Cash flows provided by (used in) investing activities: |
||||||
|
Cash distributions from other equity method investments |
140 | 44 | ||||
| Proceeds from sale of other equity method investments | 1,992 | — | ||||
|
Investment in other equity method investments |
— | (11 | ) | |||
|
Purchase of property, plant and equipment |
— | (7 | ) | |||
|
Net cash provided by investing activities |
2,132 | 26 | ||||
|
|
||||||
|
Cash flows provided by (used in) financing activities: |
||||||
|
Repayment of debt payable to third parties |
(539 | ) | (200 | ) | ||
|
Proceeds from debt payable to a related party |
633 | 439 | ||||
|
Repayment of debt payable to a related party |
(1,587 | ) | — | |||
|
Net cash provided by (used in) financing activities |
(1,493 | ) | 239 | |||
|
Net increase (decrease) in cash and cash equivalents |
177 | (411 | ) | |||
|
Cash and cash equivalents at beginning of period |
3,633 | 3,213 | ||||
|
Cash and cash equivalents at end of period |
$ | 3,810 | $ | 2,802 | ||
|
|
||||||
|
|
||||||
|
Supplemental cash flow information: |
||||||
|
Taxes paid |
$ | 47 | $ | 28 | ||
|
Interest paid |
$ | 22 | $ | 52 | ||
The accompanying notes are an integral part of these condensed consolidated financial statements.
6
HERITAGE GLOBAL INC.
NOTES TO UNAUDITED CONDENSED
CONSOLIDATED FINANCIAL STATEMENTS
March 31, 2015
(amounts
in thousands, except share and per share amounts and where specifically
indicated)
Note 1 –Basis of Presentation
These unaudited condensed consolidated interim financial statements include the accounts of Heritage Global Inc. together with its subsidiaries, including Heritage Global Partners, Inc. (“HGP”), Heritage Global LLC (“HG LLC”), Equity Partners HG LLC (“Equity Partners”), National Loan Exchange, Inc. (“NLEX”), C2 Communications Technologies Inc., and C2 Investments Inc. These entities, collectively, are referred to as “HGI”, the “Company”, “we” or “our” in these financial statements. Our unaudited condensed consolidated interim financial statements were prepared in conformity with accounting principles generally accepted in the United States of America (“GAAP”), as outlined in the Financial Accounting Standards Board (“FASB”) Accounting Standards Codification (“ASC”), and include the assets, liabilities, revenues, and expenses of all subsidiaries over which HGI exercises control. All significant intercompany accounts and transactions have been eliminated upon consolidation. The Company’s sole operating segment is its asset liquidation business, which began operations in 2009.
We have prepared the condensed consolidated interim financial statements included herein pursuant to the rules and regulations of the United States Securities and Exchange Commission (the “SEC”). In management’s opinion, these financial statements reflect all adjustments that are necessary to present fairly the results for the interim periods included herein. Certain information and footnote disclosures normally included in financial statements prepared in accordance with GAAP have been condensed or omitted pursuant to such rules and regulations; however, we believe that the disclosures are appropriate. These unaudited condensed consolidated interim financial statements should be read in conjunction with the audited consolidated financial statements and the notes thereto included in the Company’s annual report on Form 10-K for the year ended December 31, 2014, filed with the SEC on March 31, 2015.
The results of operations for the three month period ended March 31, 2015 are not necessarily indicative of those operating results to be expected for any subsequent interim period or for the entire year ending December 31, 2015. The accompanying condensed consolidated balance sheet at December 31, 2014 has been derived from the audited consolidated balance sheet at December 31, 2014, contained in the above referenced Form 10-K.
Note 2 – Summary of Significant Accounting Policies
Use of estimates
The preparation of the Company’s consolidated financial statements in conformity with GAAP requires management to make estimates and assumptions that affect the reported amounts of assets and liabilities and the disclosure of contingent assets and liabilities at the date of the financial statements, as well as the reported amounts of revenues and expenses during the reporting period. Management bases its estimates and judgments on historical experience and various other factors that are believed to be reasonable under the circumstances. Actual results could differ from those estimates.
Significant estimates include the assessment of collectability of revenue recognized, and the valuation of accounts receivable, inventory, investments, deferred income tax assets, goodwill and intangible assets, liabilities, contingent consideration and stock-based compensation. These estimates have the potential to significantly impact our consolidated financial statements, either because of the significance of the financial statement item to which they relate, or because they require judgment and estimation due to the uncertainty involved in measuring, at a specific point in time, events that are continuous in nature.
The critical accounting policies used in the preparation of our audited consolidated financial statements are discussed in our Annual Report on Form 10-K for the year ended December 31, 2014. There have been no changes to these policies in the first three months of 2015.
7
Recently Adopted Accounting Pronouncements
In April 2014, the FASB issued Accounting Standards Update 2014-08, Reporting Discontinued Operations and Disclosures of Disposals of Components of an Entity (“ASU 2014-08”). ASU 2014-08 requires discontinued operations treatment for disposals of a component or group of components that represents a strategic shift that has or will have a major impact on an entity’s operations or financial results. It also expands the scope of ASC 205-20 to disposals of equity method investments and acquired businesses held for sale. With respect to disclosures, ASU 2014-08 both 1) expands disclosure requirements for transactions that meet the definition of a discontinued operation, and 2) requires entities to disclose information about individually significant components that are disposed of or held for sale and do not qualify as discontinued operations. ASU 2014-08 also requires specific presentation of various items on the face of the financial statements. ASU 2014-08 is effective for interim and annual periods beginning on or after December 15, 2014, with early adoption permitted. The Company therefore adopted ASU 2014-08 in the first quarter of 2015. However, since the Company does not currently have either discontinued operations or any planned disposals that would require the expanded reporting required by ASU 2014-08, its adoption had no impact on its consolidated financial statements.
Future Accounting Pronouncements
In January 2015, the FASB issued Accounting Standards update 2015-01, Simplifying Income Statement Presentation by Eliminating the Concept of Extraordinary Items (“ASU 2015-01”). ASU 2015-01 eliminates the requirement for entities to consider whether an underlying event or transaction is extraordinary, and, if so, to separately present the item in the income statement net of tax, after income from continuing operations. Instead, items that are both unusual and infrequent should be separately presented as a component of income from continuing operations, or be disclosed in the notes to the financial statements. ASU 2015-01 will be effective for all entities for fiscal years, and interim periods within those fiscal years, beginning after December 31, 2015. Early adoption is permitted provided that the new standard is applied from the beginning of the fiscal year of adoption. The Company has not historically reported extraordinary items in its consolidated financial statements, and is not aware of any pending transactions or events that might have required reporting as extraordinary items, and therefore does not expect the adoption of ASU 2015-01 to have a material impact on its consolidated financial statements.
In March 2015, the FASB issued Accounting Standards update 2015-02, Amendments to the Consolidation Analysis (“ASU 2015-02”). ASU 2015-02 eliminates entity specific consolidation guidance for limited partnerships, and revises other aspects of the consolidation analysis, but does not change the existing consolidation guidance for corporations that are not variable interest entities (“VIEs”). For public business entities, ASU 2015-02 will be effective for fiscal years, and interim periods within those fiscal years, beginning after December 15, 2015, with early adoption permitted. The Company has not yet adopted ASU 2015-02 nor assessed its potential impact on its consolidated financial statements.
In April 2015, the FASB issued Accounting Standards update 2015-03, Simplifying the Presentation of Debt Issuance Costs (“ASU 2015-03”). ASU 2015-03 changes the presentation of debt issuance costs in financial statements, by requiring them to be presented in the balance sheet as a direct deduction from the related debt liability, rather than as an asset. Amortization of the costs is reported as interest expense. There is no change to the current guidance on the recognition and measurement of debt issuance costs. For public business entities, ASU 2015-03 will be effective for fiscal years, and interim periods within those fiscal years, beginning after December 15, 2015, with early adoption permitted. The Company has not yet adopted ASU 2015-03 nor assessed its potential impact on its consolidated financial statements.
Note 3 – Acquisition of National Loan Exchange, Inc.
On June 2, 2014, and effective May 31, 2014, the Company acquired all of the issued and outstanding capital stock in National Loan Exchange, Inc. (“NLEX”), a broker of charged-off receivables in the United States and Canada. NLEX operates as a wholly owned division of the Company. The acquisition of NLEX is consistent with HGI’s strategy to expand the services provided by its asset liquidation business. In connection with the acquisition, HGI entered into employment agreements with the previous owner and employees of NLEX.
8
The consideration for the acquisition consisted of $2,000 cash, and an earnout provision (“contingent consideration”). Under the terms of the NLEX purchase agreement, the Company will pay, to the former owner of NLEX, 50% of gross revenues of NLEX and its affiliates, minus 50% of certain expenses, for each of the four years following the closing. The payments are due on or about July 30 of each year, beginning in 2015. The contingent consideration is capped at an aggregate of $5,000, and at March 31, 2015, subject to the application of a 9% discount rate, is estimated to have a present value of $4,287. Key assumptions in determining this present value include projected earnings to the end of 2018 and a weighted average cost of capital of 31.6%. At March 31, 2015, the Company has estimated that the current portion of the contingent consideration is $803, and that the non-current portion is $3,484.
During the period June 1, 2014 through December 31, 2014, the Company recognized a total of $210 of interest expense which represents the accretion of the present value discount during the period. The Company recognized an additional $89 during the period January 1, 2015 through March 31, 2015.
The intangible assets and goodwill are discussed in more detail in Note 6.
Note 4 – Stock-based Compensation
At March 31, 2015 the Company had three stock-based compensation plans, which are described more fully in Note 15 to the audited consolidated financial statements for the year ended December 31, 2014, contained in the Company’s most recently filed Annual Report on Form 10-K.
During the first three months of both 2015 and 2014, the Company issued 50,000 options to the Company’s independent directors as part of their annual compensation. No options were exercised, were forfeited or expired during the first three months of either 2015 or 2014.
The following summarizes the changes in common stock options for the three months ended March 31, 2015:
| Weighted | ||||||
| Average | ||||||
| Exercise | ||||||
| Options | Price | |||||
| Outstanding at December 31, 2014 | 2,165,000 | $ | 1.71 | |||
| Granted | 50,000 | $ | 0.42 | |||
| Outstanding at March 31, 2015 | 2,215,000 | $ | 1.68 | |||
| Options exercisable at March 31, 2015 | 1,583,750 | $ | 1.75 |
As of March 31, 2015 there is approximately $253 of non-recognized stock based compensation expense related to unvested option awards outstanding, which is expected to be recognized over a weighted average period of 1.8 years.
Note 5 – Loss Per Share
The Company is required, in periods in which it has net income, to calculate basic earnings per share (“basic EPS”) using the two-class method. The two-class method is required because the Company’s Class N preferred shares, each of which is convertible to 40 common shares, have the right to receive dividends or dividend equivalents should the Company declare dividends on its common stock. Under the two-class method, earnings for the period are allocated on a pro-rata basis to the common and preferred stockholders. The weighted-average number of common and preferred shares outstanding during the period is then used to calculate basic EPS for each class of shares.
9
In periods in which the Company has a net loss, basic loss per share is calculated by dividing the loss attributable to common stockholders by the weighted-average number of common shares outstanding during the period. The two-class method is not used, because the preferred stock does not participate in losses.
Options are included in the calculation of diluted earnings per share (“diluted EPS”), since they are assumed to be exercised, except when their effect would be anti-dilutive. For the three months ended March 31, 2015 and 2014, respectively, the Company recorded a net loss and therefore included zero options in its calculation of diluted EPS, since they would be anti-dilutive.
Note 6 – Intangible Assets and Goodwill
Identifiable intangible assets
The Company’s identifiable intangible assets are associated with its acquisitions of HGP in 2012 and NLEX in 2014. The HGP-related intangible assets are a Customer/Broker Network and a Trade Name, with useful lives of 12 and 14 years, respectively. The NLEX-related intangible assets are Customer Relationships, a Non-Compete Agreement and a Website, with useful lives of 7.6, 2 and 5 years respectively, and a Trade Name. The Trade Name has an indefinite life and therefore is not being amortized. The details of all identifiable intangible assets are shown below:
| March 31, | December 31, | |||||
| Amortized Intangible Assets | 2015 | 2014 | ||||
| Customer/Broker Network (HGP) | $ | 4,180 | $ | 4,180 | ||
| Accumulated amortization | (1,074 | ) | (987 | ) | ||
| 3,106 | 3,193 | |||||
| Trade Name (HGP) | 1,460 | 1,460 | ||||
| Accumulated amortization | (322 | ) | (295 | ) | ||
| 1,138 | 1,165 | |||||
| Customer Relationships (NLEX) | 834 | 834 | ||||
| Accumulated amortization | (91 | ) | (64 | ) | ||
| 743 | 770 | |||||
| Non-Compete Agreement (NLEX) | 71 | 71 | ||||
| Accumulated amortization | (30 | ) | (21 | ) | ||
| 41 | 50 | |||||
| Website (NLEX) | 48 | 48 | ||||
| Accumulated amortization | (8 | ) | (6 | ) | ||
| 40 | 42 | |||||
| Total net amortized intangible assets | 5,068 | 5,220 | ||||
| Unamortized Intangible Assets | ||||||
| Trade Name (NLEX) | 2,437 | 2,437 | ||||
| Total net intangible assets | $ | 7,505 | $ | 7,657 |
Amortization expense during the first three months of 2015 and 2014 was $152 and $113, respectively. No significant residual value is estimated for these intangible assets.
10
The estimated amortization expense during the next five fiscal years is shown below:
| Year | Amount |
| 2015 | $455 |
| 2016 | $587 |
| 2017 | $572 |
| 2018 | $572 |
| 2019 | $566 |
Goodwill
The Company’s goodwill is related to its asset liquidation business, and is comprised of goodwill from three acquisitions, as shown below. There were no impairment losses or other charges to the carrying amount of goodwill during the three months ended March 31, 2015.
| Entity acquired | Acquisition date | Goodwill | ||
| Equity Partners | June 2011 | $ | 573 | |
| HGP | February 2012 | 4,728 | ||
| NLEX | June 2014 | 3,545 | ||
| Total goodwill | $ | 8,846 |
Note 7 – Asset Liquidation Investments and Other Investments
Summarized financial information – Equity accounted asset liquidation investments
The table below details the summarized results of operations attributable to HGI from the Joint Ventures in which it was invested:
| Three months ended | ||||||
| March 31, | ||||||
| 2015 | 2014 | |||||
| Gross revenues | $ | 34 | $ | 10 | ||
| Gross profit (loss) | $ | 34 | $ | (30 | ) | |
| Net income (loss) | $ | 34 | $ | (30 | ) | |
Other investments
At March 31, 2015 and December 31, 2014, the Company’s sole other equity investment consisted of a one-third interest in Knight’s Bridge Capital Partners Internet Fund No. 1 GP LLC (“Knight’s Bridge GP”), a private company. The investment was acquired in December 2007 for a purchase price of $20. Knight’s Bridge GP is the general partner of Knight’s Bridge Capital Partners Internet Fund No. 1 LP (the “Fund”). The Fund holds investments in several public and non-public Internet-based e-commerce businesses. The Company accounts for its investment under the equity method.
At December 31, 2014 the Company’s net investment was $156, which included approximately $136 representing the Company’s proportionate share of profits related to the Fund’s fair value increase and projected exit from one of its investments. The Company received a distribution of $140 in March 2015, representing the final determination of its share of the profits. At March 31, 2015, following the Company recording its share of Knight’s Bridge GP’s first quarter operations, the Company’s investment had a balance of $21.
11
Note 8 – Debt
| March 31, | December 31, | |||||
| 2015 | 2014 | |||||
| Current: | ||||||
| Credit Facility | $ | — | $ | 539 | ||
| Other third party debt | 2,617 | — | ||||
| Counsel Loan | 2,053 | 2,985 | ||||
| 4,670 | 3,524 | |||||
| Non-current: | ||||||
| Other third party debt | — | 2,580 | ||||
| Total debt | $ | 4,670 | $ | 6,104 |
At March 31, 2015 all of the Company’s debt was current, and consisted of a $2,617 loan payable to an unrelated third party (the “Third Party Loan”), and $2,053 of related party debt (the “Counsel Loan”). At December 31, 2014 the Company had current debt of $3,524, consisting of a third party Credit Facility with a balance of $539 and the Counsel Loan with a balance of $2,985. Also, at December 31, 2014, the Third Party Loan was non-current and had a balance of $2,580.
The Third Party Loan was entered into during the second quarter of 2014, for a principal amount of $2,500. The loan bears interest at 6% and had an original maturity date of January 15, 2015. In December 2014, the maturity date was extended to January 15, 2016 at the same interest rate. The loan is not subject to any covenants or conditions.
The Counsel Loan was originally entered into during the fourth quarter of 2003, accrued interest at 10% per annum compounded quarterly from the date funds were advanced, and was due on demand. Any outstanding balance under the Counsel Loan was secured by the assets of the Company.
In the second quarter of 2014, following Counsel’s distribution of its ownership interest in HGI to Counsel shareholders as a dividend in kind, this facility was replaced and the outstanding balance was transferred to a new facility (also the “Counsel Loan”). Under the new facility, payment is due within thirty days following the end of each quarter. Unpaid balances accrue interest at a rate per annum equal to the lesser of the Wall St. Journal (“WSJ”) prime rate + 2.0%, or the maximum rate allowable by law. For 2014 and 2015 the rate was 5.25%. Please see Note 11 for further discussion of transactions with Counsel.
The Credit Facility that was outstanding at December 31, 2014 was provided to HG LLC by a U.S. bank under the terms and provisions of a certain Loan and Security Agreement (the “Loan Agreement”) originally dated as of June 2, 2009 and most recently amended as of December 1, 2014 (the “Amendment Date”). It was utilized to finance the acquisition of eligible property and equipment for purposes of resale, and bore interest at the greater of the WSJ prime rate + 1.0%, or 4.5%. The maximum borrowing available under the Credit Facility was $15,000. The Credit Facility was repaid in full in March 2015. Subsequent to the repayment of the Credit Facility the Company has not yet obtained equivalent third party financing.
Note 9 – Patent Participation Fee
In 2003, HGI acquired a VoIP patent from a third party. Consideration provided was $100 plus a 35% residual payable to the third party relating to the net proceeds from future licensing and/or enforcement actions from the HGI VoIP Patent Portfolio. Net proceeds are defined as amounts collected from third parties net of the direct costs associated with putting the licensing or enforcement in place and related collection costs. The vendor of the VoIP Patent was also granted a first priority security interest in the patent in order to secure HGI’s obligations under the associated purchase agreement. The Company has not been required to make any payments since 2009.
12
Note 10 – Income Taxes
At March 31, 2015 the Company has aggregate tax net operating loss carry forwards of approximately $86,868 ($58,068 of unrestricted net operating tax losses and approximately $28,800 of restricted net operating tax losses) and unused minimum tax credit carry forwards of $547. Substantially all of the net operating loss carry forwards and unused minimum tax credit carry forwards expire between 2025 and 2035. The Company’s utilization of restricted net operating tax loss carry forwards against future income for tax purposes is restricted pursuant to the “change in ownership” rules in Section 382 of the Internal Revenue Code.
The reported tax expense varies from the amount that would be provided by applying the statutory U.S. Federal income tax rate to the loss from continuing operations before taxes for the following reasons:
|
|
Three months | |||||
|
|
ended March 31, | |||||
|
|
2015 | 2014 | ||||
|
|
||||||
|
Expected federal statutory tax benefit |
$ | (231 | ) | $ | (354 | ) |
|
Increase (reduction) in taxes resulting from: |
||||||
|
State income taxes recoverable |
3 | — | ||||
|
Non-deductible expenses (permanent differences) |
11 | 8 | ||||
|
Change in valuation allowance |
1,164 | 24,749 | ||||
|
Rate changes |
16 | 36 | ||||
|
Other |
(960 | ) | 228 | |||
|
Income tax expense |
$ | 3 | $ | 24,667 | ||
We record net deferred tax assets to the extent that we believe such assets will more likely than not be realized. As a result of our cumulative losses and uncertainty with respect to future taxable income, we have provided a full valuation allowance against our net deferred tax assets as of March 31, 2014 and 2015.
Note 11 – Related Party Transactions
Debt with Counsel
Until the second quarter of 2014, as discussed below, Counsel was the Company’s majority shareholder. Counsel remains a related party, following the distribution of its investment in HGI to Counsel shareholders, as a result of the Services Agreement discussed below. Therefore, at March 31, 2015 and December 31, 2014, the Company reported amounts owed to Counsel of $2,053 and $2,985, respectively, as related party debt. Interest of $379 has been accrued and capitalized as of March 31, 2015.
Counsel Services Provided to the Company
Beginning in December 2004, HGI and Counsel entered into successive annual management services agreements (collectively, the “Agreement”). Under the terms of the Agreement, HGI agreed to pay Counsel for ongoing services provided to HGI by Counsel personnel. These services included preparation of the Company’s financial statements and regulatory filings, taxation matters, stock-based compensation administration, Board administration, patent portfolio administration and litigation matters. The Counsel employees providing the services were: 1) its Executive Vice President, Secretary and Chief Financial Officer, 2) its Tax Manager, 3) an Accounting Manager, and 4) its Accounts Payable Clerk. These employees have the same or similar positions with HGI, but none of them received compensation from HGI. Rather, Counsel allocated to HGI a percentage, based on time incurred, of the employees’ base compensation paid by Counsel. Beginning in the first quarter of 2011, additional amounts were charged to HGI for Counsel services specifically relating to the ongoing operations of HGI’s asset liquidation business. The amounts due under the Agreement were payable within 30 days following the respective year end, subject to applicable restrictions. Any unpaid amounts bore interest at 10% per annum commencing on the day after such year end.
13
In the first quarter of 2013, Counsel announced its plan to dispose of its interest in HGI, and on March 20, 2014, Counsel declared a dividend in kind, consisting of Counsel’s distribution of its majority interest in HGI to Counsel shareholders. The payment was made on April 30, 2014 to shareholders of record at April 1, 2014.
Following this disposition, the Company and Counsel entered into a replacement management services agreement (the “Services Agreement”). Under the terms of the Services Agreement, Counsel remains as external manager and continues to provide the same services, at similar rates. The Services Agreement had an initial term of one year, with a provision for automatic renewal for successive one-year terms unless notice by either party is given within ninety days before the expiration. The Services Agreement may be terminated at any time upon mutual agreement of the Company and Counsel. The Company intends to internalize its management in the future, but at March 31, 2015, the Services Agreement remained in effect.
The amounts charged by Counsel are detailed below:
| Three months ended | ||||||
| March 31, | ||||||
| 2015 | 2014 | |||||
| Management fees | $ | 90 | $ | 90 | ||
| Other charges | 19 | 19 | ||||
| Total | $ | 109 | $ | 109 | ||
Transactions with Other Related Parties
The Company leases office space in Foster City, CA as part of the operations of HGP. The premises are owned by an entity that is jointly controlled by senior officers of HGP. It also leases office space in Edwardsville, IL, as part of the operations of NLEX, which is owned by senior officers of NLEX. The lease amounts paid by the Company to the related parties, which are included in selling, general and administrative expenses, are detailed below:
| Three months | ||||||
| ended March 31, | ||||||
| Leased premises location | 2015 | 2014 | ||||
| Foster City, CA | $ | 57 | $ | 57 | ||
| Edwardsville, IL | 24 | — | ||||
| Total | $ | 81 | $ | 57 | ||
Note 12 – Subsequent Events
The Company has evaluated events subsequent to March 31, 2015 for disclosure. There have been no material subsequent events requiring disclosure in this Report.
14
Item 2. Management’s Discussion and Analysis of Financial Condition and Results of Operations.
(All dollar amounts are presented in thousands of U.S. dollars, unless otherwise indicated, except per share amounts)
The following discussion and analysis should be read in conjunction with the information contained in the unaudited condensed consolidated interim financial statements of the Company and the related notes thereto for the three months ended March 31, 2015, appearing elsewhere herein, and in conjunction with the Management’s Discussion and Analysis of Financial Condition and Results of Operations set forth in the Company’s Annual Report on Form 10-K for the year ended December 31, 2014, filed with the Securities and Exchange Commission (“SEC”).
Forward Looking Information
This Quarterly Report on Form 10-Q (the “Report”) contains certain “forward-looking statements” that are based on management’s exercise of business judgment as well as assumptions made by, and information currently available to, management. When used in this document, the words “may”, "will”, “anticipate”, “believe”, “estimate”, “expect”, “intend”, and words of similar import, are intended to identify any forward-looking statements. You should not place undue reliance on these forward-looking statements. These statements reflect our current view of future events and are subject to certain risks and uncertainties, as noted in the Company’s Annual Report on Form 10-K, filed with the SEC, and as noted below. Should one or more of these risks or uncertainties materialize, or should underlying assumptions prove incorrect, our actual results could differ materially from those anticipated in these forward-looking statements. We undertake no obligation, and do not intend, to update, revise or otherwise publicly release any revisions to these forward-looking statements to reflect events or circumstances after the date hereof, or to reflect the occurrence of any unanticipated events. Although we believe that our expectations are based on reasonable assumptions, we can give no assurance that our expectations will materialize.
Overview, History and Recent Developments
Heritage Global Inc. (“HGI”, “we” or the “Company”) was incorporated in the State of Florida in 1983 under the name “MedCross, Inc.” The Company’s name was changed to “I-Link Incorporated” in 1997, to “Acceris Communications Inc.” in 2003, to “C2 Global Technologies Inc.” in 2005, to “Counsel RB Capital Inc.” in 2011, and to Heritage Global Inc. effective August 22, 2013. The most recent name change more closely identifies the Company with its core auction business, Heritage Global Partners, Inc. (“HGP”).
On March 20, 2014, the Company’s former majority shareholder, Counsel Corporation (together with its subsidiaries, “Counsel”), declared a dividend of all of its shares of the Company. This dividend was paid on April 30, 2014 to Counsel’s common shareholders of record on April 1, 2014.
On June 2, 2014, effective as of May 31 , 2014, the Company acquired all of the outstanding equity of National Loan Exchange, Inc. (“NLEX”), a broker of charged-off receivables in the United States and Canada. As a result of this acquisition, NLEX now operates as a wholly owned division of the Company. Prior to the acquisition, NLEX’s role was limited to being a broker or agent, but that role may expand to include NLEX acting as a principal. The transaction is also discussed in Note 3 of the unaudited condensed consolidated interim financial statements.
15
The organization chart below outlines the basic corporate structure of the Company as of March 31, 2015.
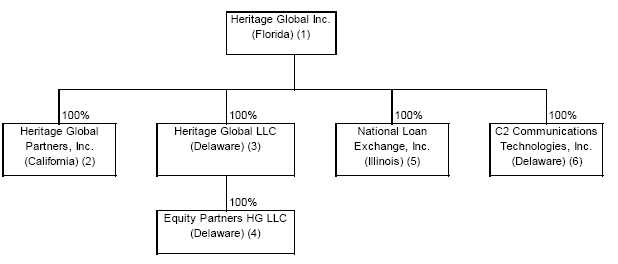
| (1) |
Registrant. |
| (2) |
Full service, global auction, appraisal and asset advisory company. |
| (3) |
Asset liquidation company which acquires and monetizes distressed and surplus assets. |
| (4) |
Investment banking firm specializing in financially distressed companies and properties. |
| (5) |
Broker of charged-off receivables. |
| (6) |
Owns and licenses telecommunications patents. |
Asset liquidation
The Company’s asset liquidation business is its sole operating segment, and the Company’s objective is to build a sustainable, long-term global capital asset solutions business that is the leading resource for clients requiring capital asset solutions.
The asset liquidation business began operations in 2009 with the establishment of Heritage Global LLC (“HG LLC”). In addition to acquiring turnkey manufacturing facilities and used industrial machinery and equipment, HG LLC arranges traditional asset disposition sales, including liquidation and auction sales. In the second quarter of 2011, HG LLC acquired 100% of the business of EP USA, LLC (d/b/a Equity Partners) (“Equity Partners”), thereby expanding the Company’s operations. Equity Partners is a boutique investment banking firm and provider of financial solutions for distressed businesses and properties.
In February 2012 the Company increased its in-house asset liquidation expertise via its acquisition of 100% of the outstanding equity of Heritage Global Partners, Inc. (“HGP”), a global full-service auction, appraisal and asset advisory firm, and in the fourth quarter of 2012, the Company launched Heritage Global Partners Europe (“HGP Europe”). Through its wholly-owned subsidiary Heritage Global Partners UK Limited, the Company opened three European-based offices, one each in the United Kingdom, Germany and Spain.
As described above, effective May 31, 2014, the Company again expanded its asset liquidation operations with the acquisition of NLEX. NLEX is the largest volume broker of charged-off receivables in the United States and Canada, and its offerings include national, state and regional portfolios on behalf of many of the world’s top financial institutions. Prior to the acquisition, NLEX’s role was limited to being a broker or agent, but that role may expand to include NLEX acting as a principal. Its acquisition is consistent with HGI’s strategy to expand and diversify the services provided by its asset liquidation business.
16
As a result of the events and acquisitions outlined above, HGI is positioned to provide an array of value-added capital asset solutions: auction and appraisal services, traditional asset disposition sales, and financial solutions for distressed businesses and properties. Management believes that HGI’s expanded global platform will allow the Company to achieve its long term industry leadership goals.
Intellectual property licensing
The Company holds several patents, including two that relate to Voice over Internet Protocol (“VoIP”). U.S. Patent No. 6,438,124 was developed by the Company, and encompasses the technology that allows two parties to converse phone-to-phone, regardless of the distance, by transmitting voice/sound via the Internet. U.S. Patent No. 6,243,373 (the “VoIP Patent”) was purchased from a third party (the “Vendor”). These patents, together with related international patents and patent applications, form the Company’s international VoIP Patent Portfolio (the “Portfolio”) that covers the basic process and technology that enable VoIP communication as used in the market today. As part of the consideration for the acquisition of the VoIP Patent, the Vendor is entitled to receive 35% of the net earnings from the Portfolio. To date the Company has recognized aggregate revenue of $17,825 from settlement and licensing agreements and paid $2,630 to the vendor. At this time, although the Company expects to continue to incur costs relating to maintaining ownership of these patents, it is not expected that either these costs or related revenue will be material.
Industry and Competition
Asset Liquidation
The asset liquidation business is involved primarily in the auction, appraisal and asset advisory services provided by HGP, and, beginning in the second quarter of 2014, the accounts receivable brokerage services provided by NLEX. It also includes the purchase and sale, including at auction, of industrial machinery and equipment, real estate, inventories, accounts receivable and distressed debt. The market for these services and assets is highly fragmented. To acquire auction or appraisal contracts, or assets for resale, HGI competes with other liquidators, auction companies, dealers and brokers. It also competes with them for potential purchasers, as well as with equipment manufacturers, distributors, dealers and equipment rental companies. Some competitors have significantly greater financial and marketing resources and name recognition.
HGI’s business strategy includes the option of partnering with one or more additional purchasers, pursuant to a partnership, joint venture or limited liability company agreement (collectively, “Joint Ventures”). These Joint Ventures give the Company access to more opportunities, helping to mitigate some of the competition from the market’s larger participants and contribute to the Company’s objective to be the leading resource for clients requiring capital asset solutions.
Government Regulation
We are subject to federal, state and local consumer protection laws, including laws protecting the privacy of customer non-public information and regulations prohibiting unfair and deceptive trade practices. Many jurisdictions also regulate "auctions" and "auctioneers" and may regulate online auction services. These consumer protection laws and regulations could result in substantial compliance costs and could interfere with the conduct of our business.
Legislation in the United States, including the Sarbanes-Oxley Act of 2002 and the Dodd-Frank Act of 2010, has increased public companies’ regulatory and compliance costs as well as the scope and cost of work provided by independent registered public accountants and legal advisors. The mandatory adoption of XBRL reporting in 2011 has also increased the Company’s costs paid to third party service providers. As regulatory and compliance guidelines continue to evolve, we expect to continue to incur costs, which may or may not be material, in order to comply with legislative requirements or rules, pronouncements and guidelines by regulatory bodies.
17
Critical Accounting Policies
Management’s Discussion and Analysis of Financial Condition and Results of Operations references our unaudited condensed consolidated interim financial statements, which have been prepared in accordance with generally accepted accounting principles in the United States of America (“GAAP”). This requires management to make estimates and assumptions that affect the reported amounts of assets and liabilities and the disclosure of contingent assets and liabilities at the date of the financial statements, as well as the reported amounts of revenue and expenses during the reporting period. Management bases its estimates and judgments on historical experience and various other factors that are considered to be reasonable under the circumstances. Actual results could differ from those estimates.
Significant estimates required in the preparation of the unaudited condensed consolidated interim financial statements included in this Report include the assessment of collectability of revenue recognized, and the valuation of accounts receivable, inventory, investments, goodwill, intangible assets, deferred income tax assets, liabilities, contingent consideration, and stock-based compensation. These estimates are considered significant either because of the significance of the financial statement items to which they relate, or because they require judgment and estimation due to the uncertainty involved in measuring, at a specific point in time, events that are continuous in nature.
The critical accounting policies used in the preparation of our audited consolidated financial statements are discussed in our Annual Report on Form 10-K for the year ended December 31, 2014. There have been no changes to these policies in the first three months of 2015.
18
Management’s Discussion of Financial Condition
Liquidity and Capital Resources
Liquidity
At March 31, 2015 the Company had a working capital deficit of $6,400, as compared to a working capital deficit of $3,883 at December 31, 2014, an increase of $2,517.
The Company’s current assets decreased to $5,595 compared to $7,575 at December 31, 2014. The most significant change was a decrease of $2,301 in accounts receivable. This was primarily due to the receipt of $1,992 of proceeds related to the Company’s exit from its investment in Polaroid during the fourth quarter of 2014, $1,587 of which was then used to repay related party debt (the “Counsel Loan”) owing to Counsel.
The Company’s current liabilities increased to $11,995 compared to $11,458 at December 31, 2014. Accounts payable and accrued liabilities decreased by $609, and the Counsel Loan decreased by net $932, for a total decrease of $1,541. This was offset by a net increase of $2,078 in the Company’s current third party debt. Although during the first quarter of 2015 the Company repaid the $539 Credit Facility balance that was outstanding at December 31, 2014, it also increased its current third party debt by $2,580 (the “Third Party Loan”) that was non-current at December 31, 2014. In addition, the Third Party Loan was increased by the accrual of $37 of interest during the first quarter of 2015. The Third Party Loan matures on January 15, 2016.
During the first quarter of 2015, the Company’s primary sources of cash were the operations of its asset liquidation business, cash receipts of $2,132 related to its equity method investments, and advances of $633 under the Counsel Loan. Cash disbursements, other than those related to debt repayment of $2,126 ($539 to third parties and $1,587 under the Counsel Loan), were primarily related to operating expenses.
It should be noted that the Company has historically classified both real estate inventory and asset liquidation investments as non-current, although they are expected to be converted to cash within a year. At March 31, 2015 and December 31, 2014, these assets totaled $7,309 and $7,486, respectively.
The Company is continuing to pursue licensing and royalty agreements with respect to its patents. However, the Company expects that its asset liquidation business will continue to be the primary source of cash required for ongoing operations for the foreseeable future.
Ownership Structure and Capital Resources
- At March 31, 2015 the Company had stockholders’ equity of $12,980, as
compared to $13,477 at December 31, 2014.
- On April 1, 2013, Counsel announced that its Board of Directors had approved a plan to focus Counsel’s operations on its core business, mortgage lending, and therefore to dispose of its other operating segments, including its interest in HGI. On March 20, 2014, Counsel declared a dividend of all of its shares of the Company. This dividend was paid on April 30, 2014 to Counsel’s common shareholders of record on April 1, 2014. On May 1, 2014, HGI and Counsel entered into a management services agreement (the “Services Agreement”) under which Counsel has continued to provide management and other services to HGI. For more detail regarding the Services Agreement, see Note 11 in the unaudited condensed consolidated financial statements.
Cash Position and Cash Flows
Cash and cash equivalents at March 31, 2015 were $3,810 as compared to $3,633 at December 31, 2014, an increase of $177.
19
Cash provided by or used in operating activities Cash used in operating activities was $462 during the three months ended March 31, 2015 as compared to $676 cash used during the same period in 2014. During the first three months of 2015 the Company had a pre-tax loss of $584, as compared to a pre-tax loss of $904 for the same period in 2014, a decrease of $320. The operations of NLEX, which was acquired during the second quarter of 2014, generated $335 of operating profit in the unaudited condensed consolidated interim financial statements for the three months ended March 31, 2015.
With respect to operations, the Company’s operating loss decreased to $433 as compared to $777 for the same period in 2014. Gross profit from asset liquidation operations, including earnings from asset liquidation investments, increased by $1,159. This change was largely due to the inclusion of NLEX gross profit of $962 in 2015. Operating expenses, including depreciation and amortization, increased by $788, of which $628 related to the 2015 inclusion of NLEX. Interest expense in 2015 was $18 greater than in 2014, at $156 compared to $138. In the first three months of 2015 the Company recorded tax expense of $3, as compared to recording expense of $24,667 in 2014, which consisted of a write-down of deferred income tax assets.
The most significant changes in operating activities during the first three months of 2015 as compared to the first three months of 2014, aside from those relating to tax, were in accounts receivable and accounts payable and accrued liabilities. Accounts receivable decreased by $310 in 2015 as compared to decreasing by $802 in 2014. Accounts payable and accrued liabilities decreased $640 in 2015 as compared to decreasing $1,148 in 2014.
Cash provided by or used in investing activities Cash provided by investing activities during the three months ended March 31, 2015 was $2,132, as compared to $26 cash provided during the same period in 2014. The 2015 activity consisted solely of the following cash receipts related to the Company’s equity method investments: $1,992 of proceeds from the Company’s December 2014 exit from Polaroid, and $140 of distribution from Knight’s Bridge GP. In 2014 the Company invested $11 in Polaroid, and received $44 of cash distributions.
Cash provided by or used in financing activities Cash used in financing activities was $1,493 during the three months ended March 31, 2015, as compared to $239 cash provided during the same period in 2014. The 2015 activity consisted of $539 repaid to third parties, and net $954 repaid to Counsel. In 2014, the Company repaid $200 to third parties and received $439 from Counsel.
20
Management’s Discussion of Results of Operations
The following table sets out the Company’s condensed consolidated quarterly results of operations for the eight quarters ended March 31, 2015, as well as for the three months ended March 31, 2014 and 2015.
|
|
Three months ended | |||||||||||||||||||||||||||||
|
|
Q2/13 | Q3/13 | Q4/13 | Q1/14 | Q2/14 | Q3/14 | Q4/14 | Q1/15 | March 31/14 | March 31/15 | ||||||||||||||||||||
|
Revenue |
||||||||||||||||||||||||||||||
|
Asset liquidation: |
||||||||||||||||||||||||||||||
|
Commissions and other |
1,780 | 1,064 | 2,232 | 1,010 | 2,312 | 1,365 | 3,239 | 2,812 | 1,010 | 2,812 | ||||||||||||||||||||
|
Asset sales |
152 | 1,201 | 247 | 975 | 499 | 4,738 | 48 | 833 | 975 | 833 | ||||||||||||||||||||
|
Total asset liquidation revenue |
1,932 | 2,265 | 2,479 | 1,985 | 2,811 | 6,103 | 3,287 | 3,645 | 1,985 | 3,645 | ||||||||||||||||||||
|
Intellectual property licensing |
- | 624 | - | - | - | - | - | - | - | - | ||||||||||||||||||||
|
Total revenue |
1,932 | 2,889 | 2,479 | 1,985 | 2,811 | 6,103 | 3,287 | 3,645 | 1,985 | 3,645 | ||||||||||||||||||||
|
|
||||||||||||||||||||||||||||||
|
Operating costs and expenses: |
||||||||||||||||||||||||||||||
|
Asset liquidation |
341 | 905 | 1,030 | 465 | 569 | 3,385 | 212 | 1,030 | 465 | 1,030 | ||||||||||||||||||||
|
Patent licensing and maintenance |
6 | 10 | 25 | 11 | 5 | 16 | 11 | 38 | 11 | 38 | ||||||||||||||||||||
|
Selling, general and administrative |
2,580 | 2,078 | 2,404 | 2,138 | 2,604 | 2,682 | 3,565 | 2,885 | 2,138 | 2,885 | ||||||||||||||||||||
|
Depreciation and amortization |
119 | 118 | 114 | 118 | 120 | 119 | 209 | 159 | 118 | 159 | ||||||||||||||||||||
|
Interest expense |
174 | 130 | 157 | 138 | 139 | 122 | 305 | 156 | 138 | 156 | ||||||||||||||||||||
|
Total operating costs and expenses |
3,220 | 3,241 | 3,730 | 2,870 | 3,437 | 6,324 | 4,302 | 4,268 | 2,870 | 4,268 | ||||||||||||||||||||
|
|
||||||||||||||||||||||||||||||
|
|
(1,288 | ) | (352 | ) | (1,251 | ) | (885 | ) | (626 | ) | (221 | ) | (1,015 | ) | (623 | ) | (885 | ) | (623 | ) | ||||||||||
|
|
||||||||||||||||||||||||||||||
|
Earnings (loss) of asset liquidation investments |
7 | 456 | (65 | ) | (30 | ) | 18 | (41 | ) | 196 | 34 | (30 | ) | 34 | ||||||||||||||||
|
Earnings of other equity method investments |
38 | 23 | 65 | 11 | 24 | 129 | 97 | 5 | 11 | 5 | ||||||||||||||||||||
|
Other income |
- | - | - | - | - | - | 551 | - | - | - | ||||||||||||||||||||
|
|
||||||||||||||||||||||||||||||
|
Income (loss) before tax |
(1,243 | ) | 127 | (1,251 | ) | (904 | ) | (584 | ) | (133 | ) | (171 | ) | (584 | ) | (904 | ) | (584 | ) | |||||||||||
|
|
||||||||||||||||||||||||||||||
|
Income tax expense (recovery) |
(500 | ) | 387 | 3,495 | 24,667 | - | 55 | - | 3 | 24,667 | 3 | |||||||||||||||||||
|
Net loss |
(743 | ) | (260 | ) | (4,746 | ) | (25,571 | ) | (584 | ) | (188 | ) | (171 | ) | (587 | ) | (25,571 | ) | (587 | ) | ||||||||||
The Company’s asset liquidation revenue has several components: 1) traditional asset disposition services, such as commissions from on-line and webcast auctions, liquidations and negotiated sales, and commissions from the NLEX charged-off receivables business, 2) the acquisition and subsequent disposition of distressed and surplus assets, including industrial machinery and equipment, real estate, inventories, accounts receivable and distressed debt, and 3) fees earned for management advisory services. The Company also earns income from its asset liquidation business through its earnings from asset liquidation investments.
Three-Month Period Ended March 31, 2015 Compared to Three-Month Period Ended March 31, 2014
Asset liquidation revenues were $3,645 in 2015 compared to $1,985 in 2014, asset liquidation expense was $1,030 in 2015 compared to $465 in 2014, and earnings of asset liquidation investments were $34 in 2015 compared to a loss of $30 in 2014. The net earnings of these three items were therefore $2,649 in 2015 compared to $1,490 in 2014, an increase of $1,159 or 77.8%. Because the Company conducts its asset liquidation operations both independently and through partnerships, and the ratio of the two is unlikely to remain constant in each period, the operations must be considered as a whole rather than on a line-by-line basis. The increased net earnings in the current quarter reflect the vagaries of the timing of asset liquidation transactions. They also reflect the acquisition of NLEX, which was responsible for $962 of the quarter’s net asset liquidation earnings.
Patent licensing and maintenance expense was $38 during the three months ended March 31, 2015, compared to $11 during the same period in 2014.
21
Selling, general and administrative expense, including expenses paid to related parties, was $2,885 during the three months ended March 31, 2015, compared to $2,138 during the same period in 2014, an increase of $747 or 34.9%. Expenses increased overall primarily due to the inclusion of NLEX expenses of $628 in 2015.
Significant components of selling, general and administrative expense were as shown below:
| Three months ended | |||||||||
| March 31, | |||||||||
| 2015 | 2014 | % change | |||||||
| Compensation: | |||||||||
| HGP | $ | 943 | $ | 950 | (0.7 | ) | |||
| Equity Partners | 310 | 251 | 23.5 | ||||||
| NLEX | 454 | — | N/A | ||||||
| President’s salary | 34 | 34 | — | ||||||
| Stock-based compensation | 120 | 123 | (2.4 | ) | |||||
| Legal | 111 | 30 | 270.0 | ||||||
| Consulting | 103 | 119 | (13.4 | ) | |||||
| Counsel management fees | 90 | 90 | — | ||||||
| Accounting and tax consulting | 76 | 72 | 5.6 | ||||||
| Insurance, including Directors and Officers liability | 45 | 37 | 21.6 | ||||||
| Occupancy | 143 | 112 | 27.6 | ||||||
| Travel and entertainment | 227 | 160 | 41.9 | ||||||
| Advertising and promotion | 102 | 80 | 27.5 | ||||||
The increases in insurance, occupancy, travel and entertainment, and advertising and promotion expense are due to the inclusion of NLEX expenses in 2015. The increase in legal is due to increased corporate costs, as well as fees incurred with respect to specific asset liquidation deal settlement, and costs to exit the Credit Facility that was paid in full during the first quarter of 2015.
Depreciation and amortization expense was $159 in 2015 compared to $118 in 2014. Amortization expense related to intangible assets was $152 in 2015 compared to $113 in 2014, with the increase in 2015 due to the inclusion of amortization of the NLEX intangible assets acquired in the second quarter of 2014. In both years, the remaining expense represents depreciation of property, plant and equipment.
Inflation. Inflation did not have a significant impact on our results during the most recent fiscal quarter.
Off-Balance Sheet Transactions. We have not engaged in any material off-balance sheet transactions.
22
Non-GAAP Financial Measure - Earnings before Interest, Taxes, Depreciation and Amortization (“EBITDA”)
We prepared our unaudited condensed consolidated financial statements in accordance with accounting principles generally accepted in the United States (“GAAP”).
We use the non-GAAP financial measure “EBITDA” in assessing the Company’s results. We define EBITDA as net income less interest expense, provision for income taxes, depreciation and amortization. We believe that EBITDA is relevant and useful supplemental information for our investors. Management believes that the presentation of this non-GAAP financial measure, when considered together with our GAAP financial measures and the reconciliation to the most directly comparable GAAP financial measure, provides a more complete understanding of the factors and trends affecting the Company than could be obtained absent these disclosures. Management uses EBITDA to make operating and strategic decisions and evaluate the Company’s performance. We have disclosed this non-GAAP financial measure so that our investors have the same financial data that management uses, with the intention of assisting investors to make comparisons to our historical operating results and analyze our underlying performance. Management believes that EBITDA is a useful supplemental tool to evaluate the underlying operating performance of the Company on an ongoing basis. Our use of EBITDA is not meant to be, and should not be, considered in isolation or as a substitute for, or superior to, any GAAP financial measure. You should carefully evaluate the quarterly financial information, below, which reconciles EBITDA to our GAAP reported net loss for the periods presented.
|
|
Three months ended | |||||||||||||||||||||||||||||
|
|
Q2/13 | Q3/13 | Q4/13 | Q1/14 | Q2/14 | Q3/14 | Q4/14 | Q1/15 | March 31/14 | March 31/15 | ||||||||||||||||||||
|
|
||||||||||||||||||||||||||||||
|
EBITDA |
(950 | ) | 375 | (980 | ) | (648 | ) | (325 | ) | 108 | 343 | (269 | ) | (648 | ) | (269 | ) | |||||||||||||
|
|
||||||||||||||||||||||||||||||
|
Deduct: |
||||||||||||||||||||||||||||||
|
Depreciation and amortization |
119 | 118 | 114 | 118 | 120 | 119 | 209 | 159 | 118 | 159 | ||||||||||||||||||||
|
Interest expense |
174 | 130 | 157 | 138 | 139 | 122 | 305 | 156 | 138 | 156 | ||||||||||||||||||||
|
Income tax expense (recovery) |
(500 | ) | 387 | 3,495 | 24,667 | - | 55 | - | 3 | 24,667 | 3 | |||||||||||||||||||
|
|
||||||||||||||||||||||||||||||
|
Net loss |
(743 | ) | (260 | ) | (4,746 | ) | (25,571 | ) | (584 | ) | (188 | ) | (171 | ) | (587 | ) | (25,571 | ) | (587 | ) | ||||||||||
23
Item 3. Quantitative and Qualitative Disclosures about Market Risk.
Our exposure to market risk is limited to interest rate sensitivity, which is affected by changes in the general level of interest rates. Due to the fact that our cash is deposited with major financial institutions, we believe that we are not subject to any material interest rate risk as it relates to interest income. As to interest expense, we have one debt instrument that has a variable interest rate. The Counsel Loan bears interest at a rate per annum equal to the lesser of the WSJ prime rate + 2.0%, or the maximum rate allowable by law. Assuming that the Counsel Loan amount at March 31, 2015 was constant during the next twelve-month period, the impact of a one percent increase in the interest rate would be an increase in interest expense of approximately $21 for that twelve-month period. We do not believe that, in the near term, we are subject to material market risk on our debt.
We did not have any foreign currency hedges or other derivative financial instruments as of March 31, 2015. We do not enter into financial instruments for trading or speculative purposes and do not currently utilize derivative financial instruments. Originally our operations were conducted primarily in the United States and as such were not subject to material foreign currency exchange rate risk. With the expansion of our operations to Europe in the third quarter of 2012, we have become subject to greater foreign currency exchange rate risk. Management monitors operations and will act as required to minimize this risk.
Item 4. Controls and Procedures.
As of the end of the period covered by this Quarterly Report, our President and Chief Financial Officer (the “Certifying Officers”) conducted evaluations of our disclosure controls and procedures. As defined in Rules 13a-15(e) and 15d-15(e) of the Securities Exchange Act of 1934, as amended (the “Exchange Act”), the term “disclosure controls and procedures” means controls and other procedures of an issuer that are designed to ensure that information required to be disclosed by the issuer in the reports that it files or submits under the Exchange Act is recorded, processed, summarized and reported, within the time periods specified in the Commission’s rules and forms. Disclosure controls and procedures include, without limitation, controls and procedures designed to ensure that information required to be disclosed by an issuer in the reports that it files or submits under the Exchange Act is accumulated and communicated to the issuer’s management, including the Certifying Officers, to allow timely decisions regarding required disclosure. Based on this evaluation, the Certifying Officers have concluded that our disclosure controls and procedures were effective.
Further, there were no changes in our internal control over financial reporting during the first fiscal quarter of 2015 that have materially affected, or are reasonably likely to materially affect, our internal control over financial reporting.
24
PART II – OTHER INFORMATION
Item 1. Legal Proceedings
There have been no material changes to the legal proceedings discussed in our Annual Report on Form 10-K for the year ended December 31, 2014, as filed with the SEC on March 31, 2015.
Item 1A. Risk Factors
There have been no material changes to the risk factors discussed in our Annual Report on Form 10-K for the year ended December 31, 2014, as filed with the SEC on March 31, 2015.
Item 2. Unregistered Sales of Equity Securities and Use of Proceeds.
None.
Item 3. Defaults Upon Senior Securities.
None.
Item 4. Mine Safety Disclosures.
Not applicable.
Item 5. Other Information.
None.
25
Item 6. Exhibits.
(a) Exhibits
| Exhibit No. | Identification of Exhibit |
| 31.1 | |
|
| |
| 31.2 | |
|
| |
| 32.1 | |
|
| |
| 32.2 | |
|
| |
| 101.INS | |
|
| |
| 101.SCH | |
|
| |
| 101.CAL | |
|
| |
| 101.DEF | |
|
| |
| 101.LAB | |
|
| |
| 101.PRE | XBRL Taxonomy Extension Presentation Linkbase Document |
26
SIGNATURES
Pursuant to the requirements of the Securities Exchange Act of 1934, the Registrant has duly caused this report to be signed on its behalf by the undersigned thereunder duly authorized.
Heritage Global Inc.
| Date: May 14, 2015 | By: | /s/ Ross Dove |
| Ross Dove | ||
| Chief Executive Officer | ||
| (Principal Executive Officer) | ||
| By: | /s/ Scott A. West | |
| Scott A. West | ||
| Chief Financial Officer | ||
| (Principal Financial Officer and Principal Accounting Officer) |
27