Attached files
| file | filename |
|---|---|
| 8-K - 8-K - TCF FINANCIAL CORP | a14-10826_18k.htm |
| EX-99.1 - EX-99.1 - TCF FINANCIAL CORP | a14-10826_1ex99d1.htm |
Exhibit 99.2
|
|
TCF Financial Corporation 2014 First Quarter Earnings Presentation |
|
|
First Quarter Highlights William Cooper (Chairman & CEO) Credit / Expenses Mike Jones (EVP, Chief Financial Officer) Lending Craig Dahl (Vice Chairman and EVP, Lending) Deposits / Capital Tom Jasper (Vice Chairman and EVP, Funding, Operations & Finance) Summary William Cooper (Chairman & CEO) Q&A Agenda |
|
|
First Quarter 2014 Highlights vs. First Quarter 2013 50.0% Earnings per common share $.24 Revenue $304.7 million 4.4% 62.2% Non-accrual Loans & Leases $266.7 million 22.3% 15.5% Loan and Lease Originations $3.1 billion Average Deposits $14.5 billion 3.4% Provision for Credit Losses $14.5 million |
|
|
First Quarter 2014 Highlights – Revenue 1 Annualized 1 ($ millions) $306 $307 Sold $620.1 million of loans for a $20.3 million pre-tax gain 1Q14 Loan & Lease Sales 1Q14 revenue impacted by: Increased net interest income from prior year due to higher average loan and lease balances as well as decreased rates on various deposit products Increased sales of loans generating additional gains on sale offsetting seasonality of banking fees 1Q14 net interest margin impacted by: Continued loan and lease yield compression due to the impact of a lower interest rate environment Offset by lower average liquidity balances and lower deposit costs Consumer RE & Other $347.4 Net Interest Income Non-interest Income Net Interest Margin 1 $292 $302 $305 $93 $100 $106 $105 $104 $199 $202 $200 $202 $201 4.72% 4.62% 4.67% 4.66% Auto Consumer RE & Other $261.7 $347.4 $11.0 3/13 6/13 9/13 12/13 3/14 |
|
|
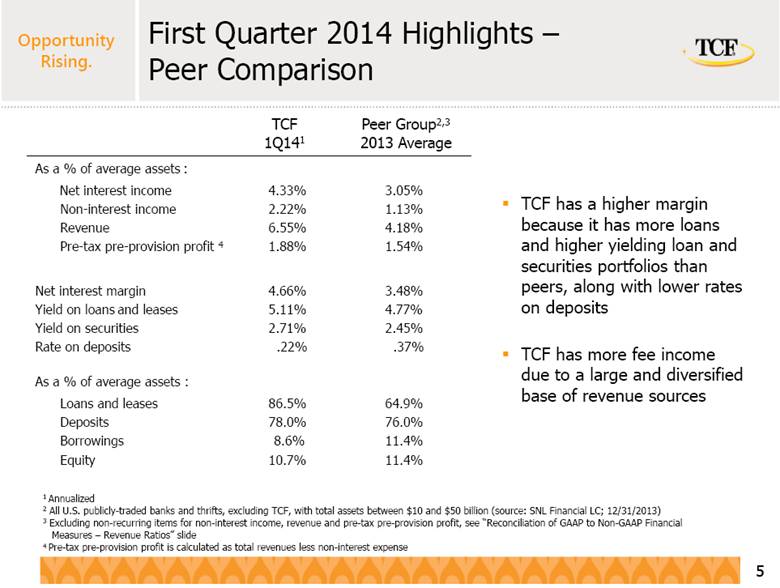
As a % of average assets : Net interest income 4.33% 3.05% Non-interest income 2.22% 1.13% Revenue 6.55% 4.18% Pre-tax pre-provision profit 4 1.88% 1.54% Net interest margin 4.66% 3.48% Yield on loans and leases 5.11% 4.77% Yield on securities 2.71% 2.45% Rate on deposits .22% .37% As a % of average assets : Loans and leases 86.5% 64.9% Deposits 78.0% 76.0% Borrowings 8.6% 11.4% Equity 10.7% 11.4% TCF 1Q141 Peer Group2,3 2013 Average TCF has a higher margin because it has more loans and higher yielding loan and securities portfolios than peers, along with lower rates on deposits TCF has more fee income due to a large and diversified base of revenue sources 1 Annualized 2 All U.S. publicly-traded banks and thrifts, excluding TCF, with total assets between $10 and $50 billion (source: SNL Financial LC; 12/31/2013) 3 Excluding non-recurring items for non-interest income, revenue and pre-tax pre-provision profit, see “Reconciliation of GAAP to Non-GAAP Financial Measures – Revenue Ratios” slide 4 Pre-tax pre-provision profit is calculated as total revenues less non-interest expense First Quarter 2014 Highlights – Peer Comparison |
|
|
Improving Credit Performance ($ millions) 60+ Day Delinquencies1 1 Excludes acquired portfolios and non-accrual loans 2 Annualized 3 Loans and leases that management has concerns regarding the ability of the borrowers to meet existing loan or lease terms and conditions, but may never become non-performing or result in a loss Classified Assets3 Non-Performing Assets ($ millions) Provision for Loan Losses ($ millions) 0.75% 0.50% 0.25% 0.00% .53% .52% .25% .19% 3/13 6/13 9/13 12/13 3/14 Provision Net charge-off 2 50 40 30 20 10 0 $38 $33 $25 $23 $14 1.06% 0.70% 0.71% 0.76% 0.43% 2.00% 1.50% 1.00% 0.50% 0.00% Non-accrual Loans & Leases Other Real Estate Owned NPAs/Loans & Leases 500 400 300 200 100 $415 $345 $348 $346 $330 2.66% 2.21% 2.23% 2.18% 2.04% 6.00% 5.00% 4.00% 3.00% 2.00% 1.00% 0.00% 0 Classified Assets as a % of Tier 1 Capital & ALLL $312 $328 $288 $285 $246 16% 17% 14% 14% 12% 40% 30% 20% 10% 0% |
|
|
Non-interest Expense Continued expense optimization expected to be achieved by: Asset growth in national lending businesses Branch consolidation completed during the first quarter of 2014 Reduction in foreclosed real estate and other credit costs as property values continue to increase and overall credit improves ($ millions) Other (including FDIC Insurance Premiums, Deposit Premiums & Marketing, and Occupancy & Equipment) Foreclosed Real Estate and Other Credit Costs Compensation & Benefits % of Total Avg Assets1: 4.47% 4.64% 4.82% 4.67% 4.55% 1 Annualized 250 200 150 100 50 0 $204 $209 $212 $220 $217 3/13 6/13 9/13 12/13 3/14 |
|
|
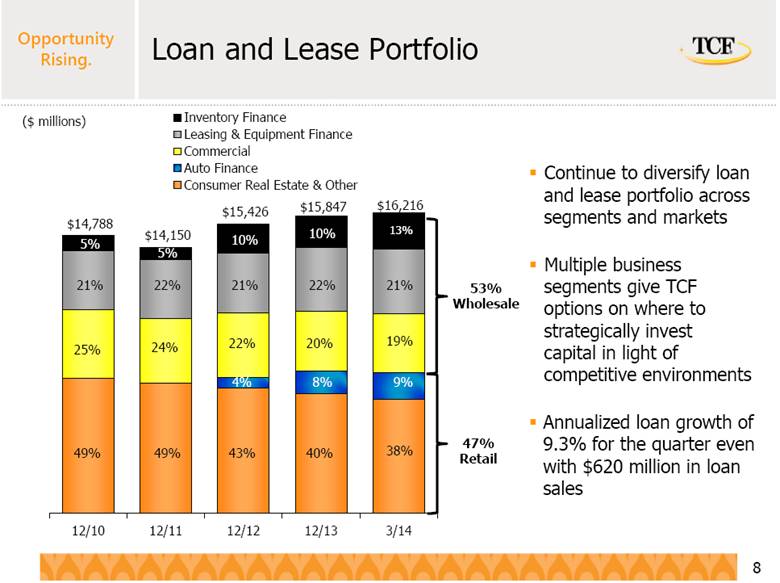
Continue to diversify loan and lease portfolio across segments and markets Multiple business segments give TCF options on where to strategically invest capital in light of competitive environments Annualized loan growth of 9.3% for the quarter even with $620 million in loan sales Loan and Lease Portfolio ($ millions) 5% 19% 38% 21% 22% 20% 40% 10% 8% 53% Wholesale 47% Retail 4% 10% 43% 21% 22% 5% 22% 24% 49% 13% 25% 21% 49% 9% Inventory Finance Leasing & Equipment Finance Commercial Auto Finance Consumer Real Estate & Other |
|
|
($ millions) 1Q13 1Q14 Change Period Beginning Balance $15,436 $15,927 $491 New Volume 2,725 3,147 422 Less Run-off 2 2,057 2,124 67 Subtotal 668 1,023 355 Annual Growth Rate 3 17% 26% Less Loan & Lease Sales 470 620 150 Period Ending Balance $15,634 $16,330 $696 1Q14 vs. 1Q13 Volume Sales Consumer Real Estate $(16) $68 Auto Finance 186 82 Total Retail 170 150 Commercial 115 - Leasing 33 - Inventory Finance 4 104 - Total Wholesale 252 - Total Lending $422 $150 Change in Volume & Sales 1 Includes portfolio loans and leases and loans and leases held for sale 2 Includes activity from payments, pre-payments and charge-offs 3 Excludes loan and lease sales 4 Origination levels impacted by the high velocity of fundings and repayments with dealers Continued strong origination capabilities Diversity across asset classes reduces concentration risk Originate to sell capability a core competency Capacity for earning asset growth Loan and lease origination opportunities continue Loan and Lease Balance Rollforward1 ($ millions) |
|
|
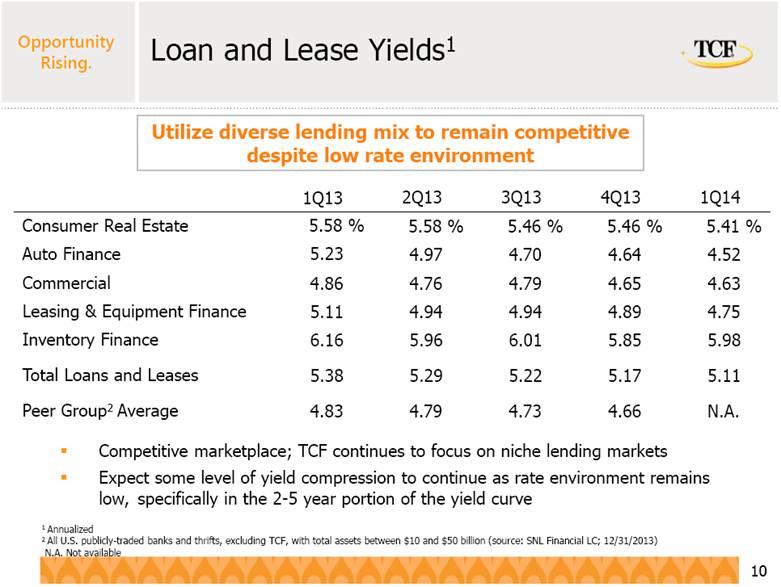
Competitive marketplace; TCF continues to focus on niche lending markets Expect some level of yield compression to continue as rate environment remains low, specifically in the 2-5 year portion of the yield curve Utilize diverse lending mix to remain competitive despite low rate environment Loan and Lease Yields1 1 Annualized 2 All U.S. publicly-traded banks and thrifts, excluding TCF, with total assets between $10 and $50 billion (source: SNL Financial LC; 12/31/2013) N.A. Not available 1Q13 2Q13 3Q13 4Q13 1Q14 Consumer Real Estate 5.58 % 5.58 % 5.46 % 5.46 % 5.41 % Auto Finance 5.23 4.97 4.70 4.64 4.52 Commercial 4.86 4.76 4.79 4.65 4.63 Leasing & Equipment Finance 5.11 4.94 4.94 4.89 4.75 Inventory Finance 6.16 5.96 6.01 5.85 5.98 Total Loans and Leases 5.38 5.29 5.22 5.17 5.11 Peer Group2 Average 4.83 4.79 4.73 4.66 N.A. |
|
|
Average total deposits have increased for fourteen consecutive quarters, funding asset growth Checking account attrition down 1.9% in 1Q14 compared to 1Q13 Strong diversity in deposit base by market and product Decline in customer transaction activity beyond first quarter seasonality .53% .38% .31% .26% .22% Average interest cost: Average Balances ($ millions) Low-Cost Deposit Base – average rate of .22% for 1Q14 Deposit Generation CDs Checking Money Market Savings 14,000 12,000 10,000 8,000 6,000 4,000 2,000 0 2010 2011 2012 2013 2014 |
|
|
1 See “Reconciliation of GAAP to Non-GAAP Financial Measures – Tangible Common Equity” slide 2 See “Reconciliation of GAAP to Non-GAAP Financial Measures – Tier 1 Common Capital Ratio” slide Maintaining capital levels as earnings support strong balance sheet growth Sufficient Capital Levels for Growth Strategy 1Q13 4Q13 1Q14 Tangible common equity1 7.57% 8.03% 8.13% Tier 1 common capital2 9.24% 9.63% 9.59% Tier 1 leverage capital 9.23% 9.71% 9.84% Tier 1 risk-based capital2 11.14% 11.41% 11.37% Total risk-based capital 13.49% 13.64% 13.41% Capital Ratios – TCF Financial Corporation |
|
|
Appendix |
|
|
Cautionary Statements for Purposes of the Safe Harbor Provisions of the Securities Litigation Reform Act Any statements contained in this earnings presentation regarding the outlook for the Company’s businesses and their respective markets, such as projections of future performance, guidance, statements of the Company’s plans and objectives, forecasts of market trends and other matters, are forward-looking statements based on the Company’s assumptions and beliefs. Such statements may be identified by such words or phrases as “will likely result,” “are expected to,” “will continue,” “outlook,” “will benefit,” “is anticipated,” “estimate,” “project,” “management believes” or similar expressions. These forward-looking statements are subject to certain risks and uncertainties that could cause actual results to differ materially from those discussed in such statements and no assurance can be given that the results in any forward-looking statement will be achieved. For these statements, TCF claims the protection of the safe harbor for forward-looking statements contained in the Private Securities Litigation Reform Act of 1995. Any forward-looking statement speaks only as of the date on which it is made, and we disclaim any obligation to subsequently revise any forward-looking statement to reflect events or circumstances after such date or to reflect the occurrence of anticipated or unanticipated events. Certain factors could cause the Company’s future results to differ materially from those expressed or implied in any forward-looking statements contained herein. These factors include the factors discussed in Part I, Item 1A of the Company’s Annual Report on Form 10-K for the year ended December 31, 2013, under the heading “Risk Factors,” the factors discussed below and any other cautionary statements, written or oral, which may be made or referred to in connection with any such forward-looking statements. Since it is not possible to foresee all such factors, these factors should not be considered as complete or exhaustive. Adverse Economic or Business Conditions; Competitive Conditions; Credit and Other Risks. Deterioration in general economic and banking industry conditions, including those arising from government shutdowns, defaults, anticipated defaults or rating agency downgrades of sovereign debt (including debt of the U.S.), or continued high rates of or increases in unemployment in TCF’s primary banking markets; adverse economic, business and competitive developments such as shrinking interest margins, reduced demand for financial services and loan and lease products, deposit outflows, deposit account attrition or an inability to increase the number of deposit accounts; customers completing financial transactions without using a bank; adverse changes in credit quality and other risks posed by TCF’s loan, lease, investment and securities available for sale portfolios, including declines in commercial or residential real estate values, changes in the allowance for loan and lease losses dictated by new market conditions or regulatory requirements, or the inability of home equity line borrowers to make increased payments caused by increased interest rates or amortization of principal; deviations from estimates of prepayment rates and fluctuations in interest rates that result in decreases in value of assets such as interest-only strips that arise in connection with TCF’s loan sales activity; interest rate risks resulting from fluctuations in prevailing interest rates or other factors that result in a mismatch between yields earned on TCF’s interest-earning assets and the rates paid on its deposits and borrowings; foreign currency exchange risks; counterparty risk, including the risk of defaults by our counterparties or diminished availability of counterparties who satisfy our credit quality requirements; decreases in demand for the types of equipment that TCF leases or finances; the effect of any negative publicity. Legislative and Regulatory Requirements. New consumer protection and supervisory requirements and regulations, including those resulting from action by the Consumer Financial Protection Bureau and changes in the scope of Federal preemption of state laws that could be applied to national banks and their subsidiaries; the imposition of requirements that adversely impact TCF’s lending, loan collection and other business activities as a result of the Dodd-Frank Act, or other legislative or regulatory developments such as mortgage foreclosure moratorium laws, use by municipalities of eminent domain on underwater mortgages, or imposition of underwriting or other limitations that impact the ability to use certain variable-rate products; changes affecting customer account charges and fee income, including changes to interchange rates; changes to bankruptcy laws which would result in the loss of all or part of TCF’s security interest due to collateral value declines; deficiencies in TCF’s compliance under the Bank Secrecy Act in past or future periods, which may result in regulatory enforcement action including monetary penalties; increased health care costs resulting from Federal health care reform legislation; regulatory criticism and resulting enforcement actions or other adverse consequences such as increased capital requirements, higher deposit insurance assessments or monetary damages or penalties; heightened regulatory practices, requirements or expectations, including, but not limited to, requirements related to the Bank Secrecy Act and anti-money laundering compliance activity (continued) |
|
|
Cautionary Statements for Purposes of the Safe Harbor Provisions of the Securities Litigation Reform Act (continued) Earnings/Capital Risks and Constraints, Liquidity Risks. Limitations on TCF’s ability to pay dividends or to increase dividends because of financial performance deterioration, regulatory restrictions or limitations; increased deposit insurance premiums, special assessments or other costs related to adverse conditions in the banking industry, the economic impact on banks of the Dodd-Frank Act and other regulatory reform legislation; the impact of financial regulatory reform, including additional capital, leverage, liquidity and risk management requirements or changes in the composition of qualifying regulatory capital (including those resulting from U.S. implementation of Basel III requirements); adverse changes in securities markets directly or indirectly affecting TCF’s ability to sell assets or to fund its operations; diminished unsecured borrowing capacity resulting from TCF credit rating downgrades and unfavorable conditions in the credit markets that restrict or limit various funding sources; costs associated with new regulatory requirements or interpretive guidance relating to liquidity; regulatory actions or changes in customer opt-in preferences with respect to overdrafts, which may have an adverse impact on TCF’s fee revenue; uncertainties relating to future retail deposit account changes, including limitations on TCF’s ability to predict customer behavior and the impact on TCF’s fee revenues. Supermarket Branching Risk; Growth Risks. Adverse developments affecting TCF’s supermarket banking relationships or any of the supermarket chains in which TCF maintains supermarket branches; costs related to closing underperforming branches; slower than anticipated growth in existing or acquired businesses; inability to successfully execute on TCF’s growth strategy through acquisitions or cross-selling opportunities; failure to expand or diversify TCF’s balance sheet through programs or new opportunities; failure to successfully attract and retain new customers, including the failure to attract and retain manufacturers and dealers to expand the inventory finance business; failure to effectuate, and risks of claims related to, sales and securitizations of loans; risks related to new product additions and addition of distribution channels (or entry into new markets) for existing products. Technological and Operational Matters. Technological or operational difficulties, loss or theft of information (including the loss of account information by, or theft from, third parties such as merchants), cyber-attacks and other security breaches, counterparty failures and the possibility that deposit account losses (fraudulent checks, etc.) may increase; failure to keep pace with technological change. Litigation Risks. Results of litigation, including class action litigation concerning TCF’s lending or deposit activities including account servicing processes or fees or charges, or employment practices, the effect of interchange rate litigation against the Federal Reserve on debit card interchange fees and possible increases in indemnification obligations for certain litigation against Visa U.S.A. and potential reductions in card revenues resulting from such litigation or other litigation against Visa. Accounting, Audit, Tax and Insurance Matters. Changes in accounting standards or interpretations of existing standards; federal or state monetary, fiscal or tax policies, including adoption of state legislation that would increase state taxes; ineffective internal controls; adverse federal, state or foreign tax assessments or findings in tax audits; lack of or inadequate insurance coverage for claims against TCF; potential for claims and legal action related to TCF’s fiduciary responsibilities. |
|
|
1 When evaluating capital adequacy and utilization, management considers financial measures such as Tangible Common Equity to Tangible Assets. These measures are non-GAAP financial measures and are viewed by management as useful indicators of capital levels available to withstand unexpected market or economic conditions, and also provide investors, regulators, and other users with information to be viewed in relation to other banking institutions. ($000s, except shares outstanding) Reconciliation of GAAP to Non-GAAP Financial Measures – Tangible Common Equity1 Mar. 31, 2013 Dec. 31, 2013 Mar. 31, 2014 Computation of tangible common equity to tangible assets Total equity $ 1,900,159 $ 1,964,759 $ 2,021,825 Less: Non-controlling interest in subsidiaries 20,933 11,791 21,284 Total TCF stockholders’ equity 1,879,226 1,952,968 2,000,541 Less: Preferred stock 263,240 263,240 263,240 Goodwill 225,640 225,640 225,640 Other intangibles 7,860 6,326 5,905 Tangible common equity $ 1,382,486 $ 1,457,762 $ 1,505,756 Total assets $ 18,504,026 $ 18,379,840 $ 18,760,527 Less: Goodwill 225,640 225,640 225,640 Other intangibles 7,860 6,326 5,905 Tangible assets $ 18,270,526 $ 18,147,874 $ 18,528,982 Tangible common equity to tangible assets 7.57% 8.03% 8.13% |
|
|
1 When evaluating asset utilization, management considers measures related to revenue that adjust for certain operating items. These measures are non-GAAP financial measures and are viewed by management as useful indicators of TCF’s ability to generate returns to cover potential credit losses. 2 All U.S. publicly-traded banks and thrifts, excluding TCF, with total assets between $10 and $50 billion (source: SNL Financial LC; 12/31/2013) Reconciliation of GAAP to Non-GAAP Financial Measures – Revenue Ratios1 ($000s) Peer Group Total Assets 2013 Avg2 % of Total Avg Assets Computation of non-interest income: Total Non-interest income $ 231,714 1.17% Less: Non-recurring revenue 7,661 Non-interest income excluding non-recurring items $ 224,053 1.13% Computation of revenue: Total Revenue $ 838,854 4.22% Less: Non-recurring revenue 7,661 Revenue excluding non-recurring items $ 831,193 4.18% Computation of pre-tax pre-provision profit: Revenue $ 838,854 Less: Non-interest expense 524,894 Non-recurring revenue 7,661 Pre-tax pre-provision profit excluding non-recurring items $ 306,299 1.54% Total Average Assets $ 19,882,841 |
|
|
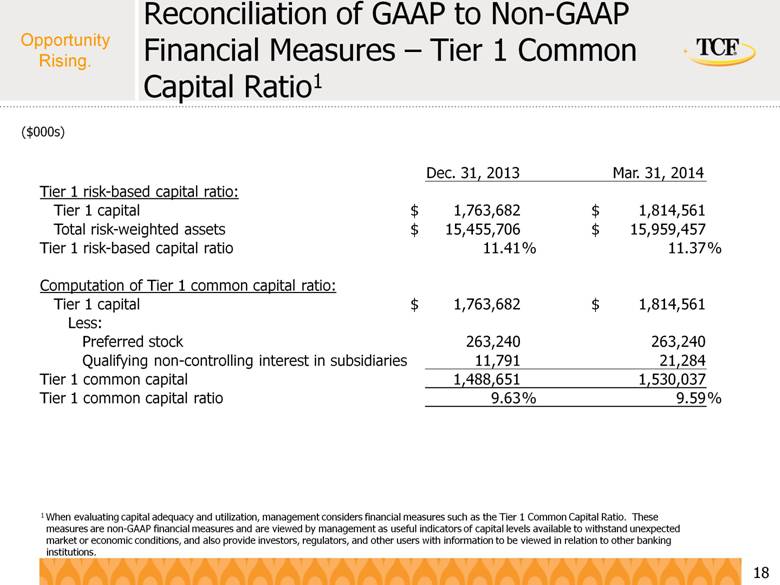
($000s) 1 When evaluating capital adequacy and utilization, management considers financial measures such as the Tier 1 Common Capital Ratio. These measures are non-GAAP financial measures and are viewed by management as useful indicators of capital levels available to withstand unexpected market or economic conditions, and also provide investors, regulators, and other users with information to be viewed in relation to other banking institutions. Reconciliation of GAAP to Non-GAAP Financial Measures – Tier 1 Common Capital Ratio1 Dec. 31, 2013 Mar. 31, 2014 Tier 1 risk-based capital ratio: Tier 1 capital $ 1,763,682 $ 1,814,561 Total risk-weighted assets $ 15,455,706 $ 15,959,457 Tier 1 risk-based capital ratio 11.41 % 11.37 % Computation of tier 1 common capital ratio: Tier 1 capital $ 1,763,682 $ 1,814,561 Less: Preferred stock 263,240 263,240 Qualifying non-controlling interest in subsidiaries 11,791 21,284 Tier 1 common capital 1,488,651 1,530,037 Tier 1 common capital ratio 9.63 % 9.59 % |