Attached files
| file | filename |
|---|---|
| 8-K - 8-K - WASHINGTON FEDERAL INC | wafd8-k.htm |
| EX-99.1 - EXHIBIT 99.1 PRESS RELEASE VERBIAGE - WASHINGTON FEDERAL INC | exhibit991mar2013pressre.htm |
| EX-99.1 - EXHIBIT 99.1 INCOME STATEMENT - WASHINGTON FEDERAL INC | exhibit991mar2013incomes.htm |
| EX-99.1 - EXHIBIT 99.1 BALANCE SHEET - WASHINGTON FEDERAL INC | exhibit991mar2013balance.htm |
| EX-99.2 - EXHIBIT 99.2 DELINQUENCY SUMMARY - WASHINGTON FEDERAL INC | exhibit992mar2013delinqu.htm |
| EX-99.2 - EXHIBIT 99.2 AVERAGE BALANCE SHEET - WASHINGTON FEDERAL INC | exhibit992mar2013average.htm |

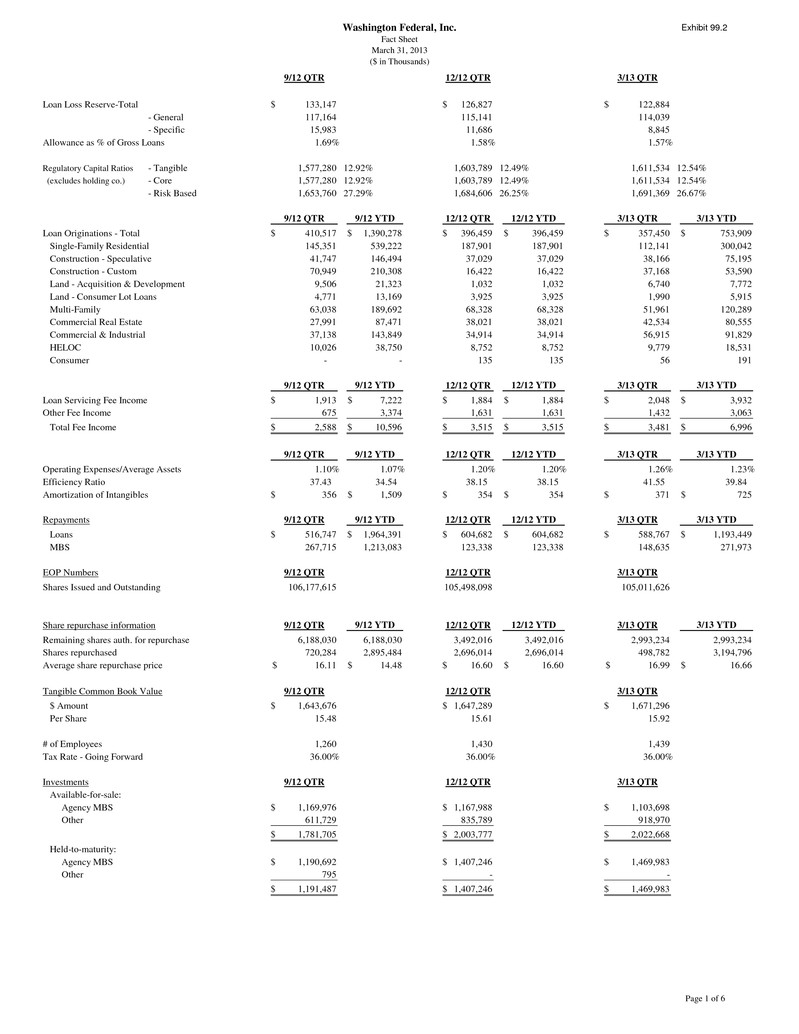
Washington Federal, Inc. Fact Sheet March 31, 2013 ($ in Thousands) Exhibit 99.2 9/12 QTR 12/12 QTR 3/13 QTR Loan Loss Reserve-Total 133,147$ 126,827$ 122,884$ - General 117,164 115,141 114,039 - Specific 15,983 11,686 8,845 Allowance as % of Gross Loans 1.69% 1.58% 1.57% Regulatory Capital Ratios - Tangible 1,577,280 12.92% 1,603,789 12.49% 1,611,534 12.54% (excludes holding co.) - Core 1,577,280 12.92% 1,603,789 12.49% 1,611,534 12.54% - Risk Based 1,653,760 27.29% 1,684,606 26.25% 1,691,369 26.67% 9/12 QTR 12/12 QTR 3/13 QTR Loan Originations - Total 410,517$ 396,459$ 357,450$ Single-Family Residential 145,351 187,901 112,141 Construction - Speculative 41,747 37,029 38,166 Construction - Custom 70,949 16,422 37,168 Land - Acquisition & Development 9,506 1,032 6,740 Land - Consumer Lot Loans 4,771 3,925 1,990 Multi-Family 63,038 68,328 51,961 Commercial Real Estate 27,991 38,021 42,534 Commercial & Industrial 37,138 34,914 56,915 HELOC 10,026 8,752 9,779 Consumer - 135 56 9/12 QTR 12/12 QTR 3/13 QTR Loan Servicing Fee Income 1,913$ 1,884$ 2,048$ Other Fee Income 675 1,631 1,432 Total Fee Income 2,588$ 3,515$ 3,481$ 9/12 QTR 12/12 QTR 3/13 QTR Operating Expenses/Average Assets 1.10% 1.20% 1.26% Efficiency Ratio 37.43 38.15 41.55 Amortization of Intangibles 356$ 354$ 371$ Repayments 9/12 QTR 12/12 QTR 3/13 QTR Loans 516,747$ 604,682$ 588,767$ MBS 267,715 123,338 148,635 EOP Numbers 9/12 QTR 12/12 QTR 3/13 QTR Shares Issued and Outstanding 106,177,615 105,498,098 105,011,626 Share repurchase information 9/12 QTR 12/12 QTR 3/13 QTR Remaining shares auth. for repurchase 6,188,030 3,492,016 2,993,234 Shares repurchased 720,284 2,696,014 498,782 Average share repurchase price 16.11$ 16.60$ 16.99$ Tangible Common Book Value 9/12 QTR 12/12 QTR 3/13 QTR $ Amount 1,643,676$ 1,647,289$ 1,671,296$ Per Share 15.48 15.61 15.92 # of Employees 1,260 1,430 1,439 Tax Rate - Going Forward 36.00% 36.00% 36.00% Investments 9/12 QTR 12/12 QTR 3/13 QTR Available-for-sale: Agency MBS 1,169,976$ 1,167,988$ 1,103,698$ Other 611,729 835,789 918,970 1,781,705$ 2,003,777$ 2,022,668$ Held-to-maturity: Agency MBS 1,190,692$ 1,407,246$ 1,469,983$ Other 795 - - 1,191,487$ 1,407,246$ 1,469,983$ 3/13 YTD 191 3/13 YTD 3,932$ 3,063 6,996$ 5,915 120,289 80,555 91,829 18,531 3/13 YTD 3/13 YTD 21,323 753,909$ 300,042 75,195 53,590 7,772 1,032 9/12 YTD 1,390,278$ 539,222 146,494 210,308 16.66$ 1.07% 34.54 1,509$ 9/12 YTD 1,964,391$ 38.15 1,193,449$ 271,973 3/13 YTD 1.23% 39.84 725$ 354$ 12/12 YTD 604,682$ 9/12 YTD 1,213,083 9/12 YTD 6,188,030 2,895,484 14.48$ 2,993,234 3,194,796 10,596$ 13,169 189,692 87,471 143,849 38,750 - 9/12 YTD 7,222$ 3,374 16.60$ 12/12 YTD 396,459$ 187,901 37,029 16,422 3,925 68,328 38,021 34,914 8,752 135 12/12 YTD 1,884$ 1,631 3,515$ 12/12 YTD 1.20% 123,338 12/12 YTD 3,492,016 2,696,014 Page 1 of 6

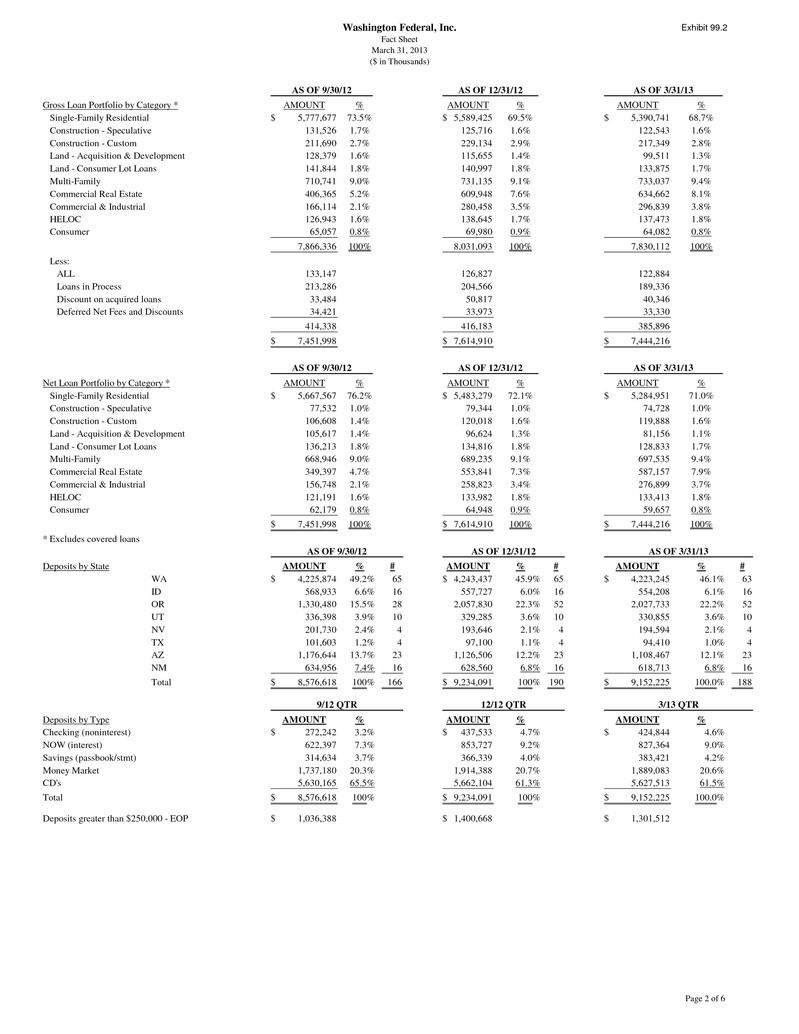
Washington Federal, Inc. Fact Sheet March 31, 2013 ($ in Thousands) Exhibit 99.2 Gross Loan Portfolio by Category * AMOUNT % AMOUNT % AMOUNT % Single-Family Residential 5,777,677$ 73.5% 5,589,425$ 69.5% 5,390,741$ 68.7% Construction - Speculative 131,526 1.7% 125,716 1.6% 122,543 1.6% Construction - Custom 211,690 2.7% 229,134 2.9% 217,349 2.8% Land - Acquisition & Development 128,379 1.6% 115,655 1.4% 99,511 1.3% Land - Consumer Lot Loans 141,844 1.8% 140,997 1.8% 133,875 1.7% Multi-Family 710,741 9.0% 731,135 9.1% 733,037 9.4% Commercial Real Estate 406,365 5.2% 609,948 7.6% 634,662 8.1% Commercial & Industrial 166,114 2.1% 280,458 3.5% 296,839 3.8% HELOC 126,943 1.6% 138,645 1.7% 137,473 1.8% Consumer 65,057 0.8% 69,980 0.9% 64,082 0.8% 7,866,336 100% 8,031,093 100% 7,830,112 100% Less: ALL 133,147 126,827 122,884 Loans in Process 213,286 204,566 189,336 Discount on acquired loans 33,484 50,817 40,346 Deferred Net Fees and Discounts 34,421 33,973 33,330 414,338 416,183 385,896 7,451,998$ 7,614,910$ 7,444,216$ Net Loan Portfolio by Category * AMOUNT % AMOUNT % AMOUNT % Single-Family Residential 5,667,567$ 76.2% 5,483,279$ 72.1% 5,284,951$ 71.0% Construction - Speculative 77,532 1.0% 79,344 1.0% 74,728 1.0% Construction - Custom 106,608 1.4% 120,018 1.6% 119,888 1.6% Land - Acquisition & Development 105,617 1.4% 96,624 1.3% 81,156 1.1% Land - Consumer Lot Loans 136,213 1.8% 134,816 1.8% 128,833 1.7% Multi-Family 668,946 9.0% 689,235 9.1% 697,535 9.4% Commercial Real Estate 349,397 4.7% 553,841 7.3% 587,157 7.9% Commercial & Industrial 156,748 2.1% 258,823 3.4% 276,899 3.7% HELOC 121,191 1.6% 133,982 1.8% 133,413 1.8% Consumer 62,179 0.8% 64,948 0.9% 59,657 0.8% 7,451,998$ 100% 7,614,910$ 100% 7,444,216$ 100% * Excludes covered loans Deposits by State AMOUNT % # AMOUNT % # AMOUNT % # WA 4,225,874$ 49.2% 65 4,243,437$ 45.9% 65 4,223,245$ 46.1% 63 ID 568,933 6.6% 16 557,727 6.0% 16 554,208 6.1% 16 OR 1,330,480 15.5% 28 2,057,830 22.3% 52 2,027,733 22.2% 52 UT 336,398 3.9% 10 329,285 3.6% 10 330,855 3.6% 10 NV 201,730 2.4% 4 193,646 2.1% 4 194,594 2.1% 4 TX 101,603 1.2% 4 97,100 1.1% 4 94,410 1.0% 4 AZ 1,176,644 13.7% 23 1,126,506 12.2% 23 1,108,467 12.1% 23 NM 634,956 7.4% 16 628,560 6.8% 16 618,713 6.8% 16 Total 8,576,618$ 100% 166 9,234,091$ 100% 190 9,152,225$ 100.0% 188 Deposits by Type AMOUNT % AMOUNT % AMOUNT % Checking (noninterest) 272,242$ 3.2% 437,533$ 4.7% 424,844$ 4.6% NOW (interest) 622,397 7.3% 853,727 9.2% 827,364 9.0% Savings (passbook/stmt) 314,634 3.7% 366,339 4.0% 383,421 4.2% Money Market 1,737,180 20.3% 1,914,388 20.7% 1,889,083 20.6% CD's 5,630,165 65.5% 5,662,104 61.3% 5,627,513 61.5% Total 8,576,618$ 100% 9,234,091$ 100% 9,152,225$ 100.0% Deposits greater than $250,000 - EOP 1,036,388$ 1,400,668$ 1,301,512$ AS OF 9/30/12 9/12 QTR AS OF 3/31/13 AS OF 3/31/13 3/13 QTR AS OF 3/31/13 AS OF 9/30/12 AS OF 9/30/12 AS OF 12/31/12 AS OF 12/31/12 AS OF 12/31/12 12/12 QTR Page 2 of 6

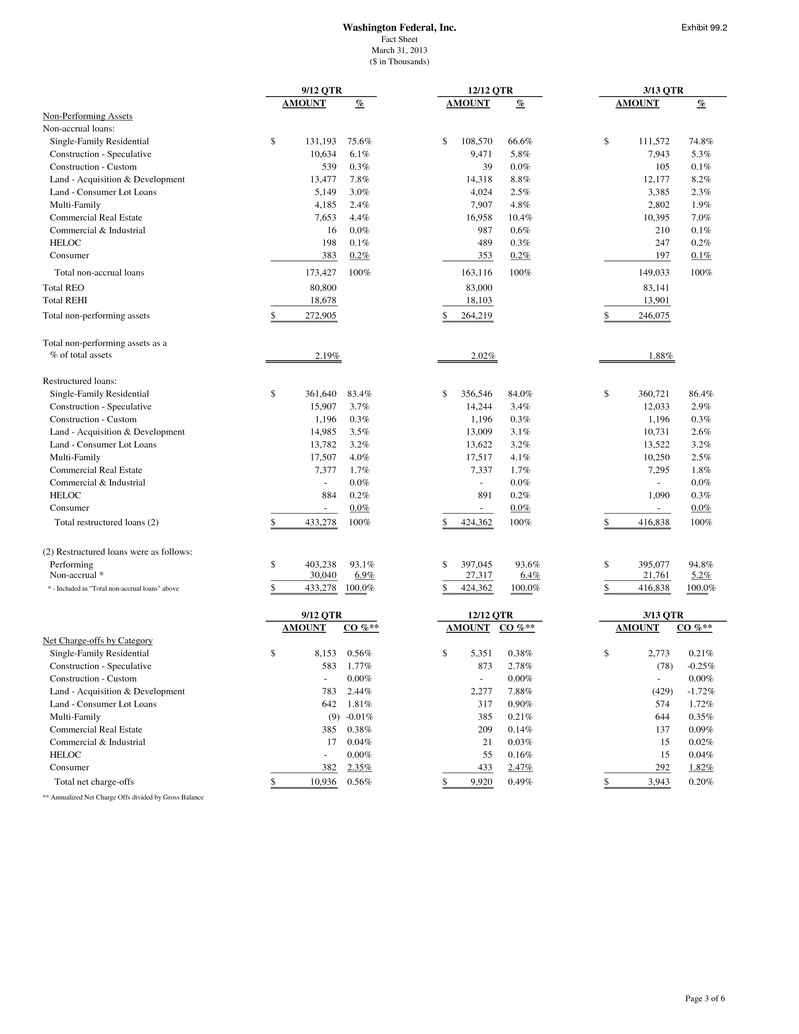
Washington Federal, Inc. Fact Sheet March 31, 2013 ($ in Thousands) Exhibit 99.2 9/12 QTR 12/12 QTR 3/13 QTR AMOUNT % AMOUNT % AMOUNT % Non-Performing Assets Non-accrual loans: Single-Family Residential 131,193$ 75.6% 108,570$ 66.6% 111,572$ 74.8% Construction - Speculative 10,634 6.1% 9,471 5.8% 7,943 5.3% Construction - Custom 539 0.3% 39 0.0% 105 0.1% Land - Acquisition & Development 13,477 7.8% 14,318 8.8% 12,177 8.2% Land - Consumer Lot Loans 5,149 3.0% 4,024 2.5% 3,385 2.3% Multi-Family 4,185 2.4% 7,907 4.8% 2,802 1.9% Commercial Real Estate 7,653 4.4% 16,958 10.4% 10,395 7.0% Commercial & Industrial 16 0.0% 987 0.6% 210 0.1% HELOC 198 0.1% 489 0.3% 247 0.2% Consumer 383 0.2% 353 0.2% 197 0.1% Total non-accrual loans 173,427 100% 163,116 100% 149,033 100% Total REO 80,800 83,000 83,141 Total REHI 18,678 18,103 13,901 Total non-performing assets 272,905$ 264,219$ 246,075$ Total non-performing assets as a % of total assets 2.19% 2.02% 1.88% Restructured loans: Single-Family Residential 361,640$ 83.4% 356,546$ 84.0% 360,721$ 86.4% Construction - Speculative 15,907 3.7% 14,244 3.4% 12,033 2.9% Construction - Custom 1,196 0.3% 1,196 0.3% 1,196 0.3% Land - Acquisition & Development 14,985 3.5% 13,009 3.1% 10,731 2.6% Land - Consumer Lot Loans 13,782 3.2% 13,622 3.2% 13,522 3.2% Multi-Family 17,507 4.0% 17,517 4.1% 10,250 2.5% Commercial Real Estate 7,377 1.7% 7,337 1.7% 7,295 1.8% Commercial & Industrial - 0.0% - 0.0% - 0.0% HELOC 884 0.2% 891 0.2% 1,090 0.3% Consumer - 0.0% - 0.0% - 0.0% Total restructured loans (2) 433,278$ 100% 424,362$ 100% 416,838$ 100% (2) Restructured loans were as follows: Performing 403,238$ 93.1% 397,045$ 93.6% 395,077$ 94.8% Non-accrual * 30,040 6.9% 27,317 6.4% 21,761 5.2% * - Included in "Total non-accrual loans" above 433,278$ 100.0% 424,362$ 100.0% 416,838$ 100.0% 9/12 QTR 12/12 QTR 3/13 QTR AMOUNT CO %** AMOUNT CO %** AMOUNT CO %** Net Charge-offs by Category Single-Family Residential 8,153$ 0.56% 5,351$ 0.38% 2,773$ 0.21% Construction - Speculative 583 1.77% 873 2.78% (78) -0.25% Construction - Custom - 0.00% - 0.00% - 0.00% Land - Acquisition & Development 783 2.44% 2,277 7.88% (429) -1.72% Land - Consumer Lot Loans 642 1.81% 317 0.90% 574 1.72% Multi-Family (9) -0.01% 385 0.21% 644 0.35% Commercial Real Estate 385 0.38% 209 0.14% 137 0.09% Commercial & Industrial 17 0.04% 21 0.03% 15 0.02% HELOC - 0.00% 55 0.16% 15 0.04% Consumer 382 2.35% 433 2.47% 292 1.82% Total net charge-offs 10,936$ 0.56% 9,920$ 0.49% 3,943$ 0.20% ** Annualized Net Charge Offs divided by Gross Balance Page 3 of 6

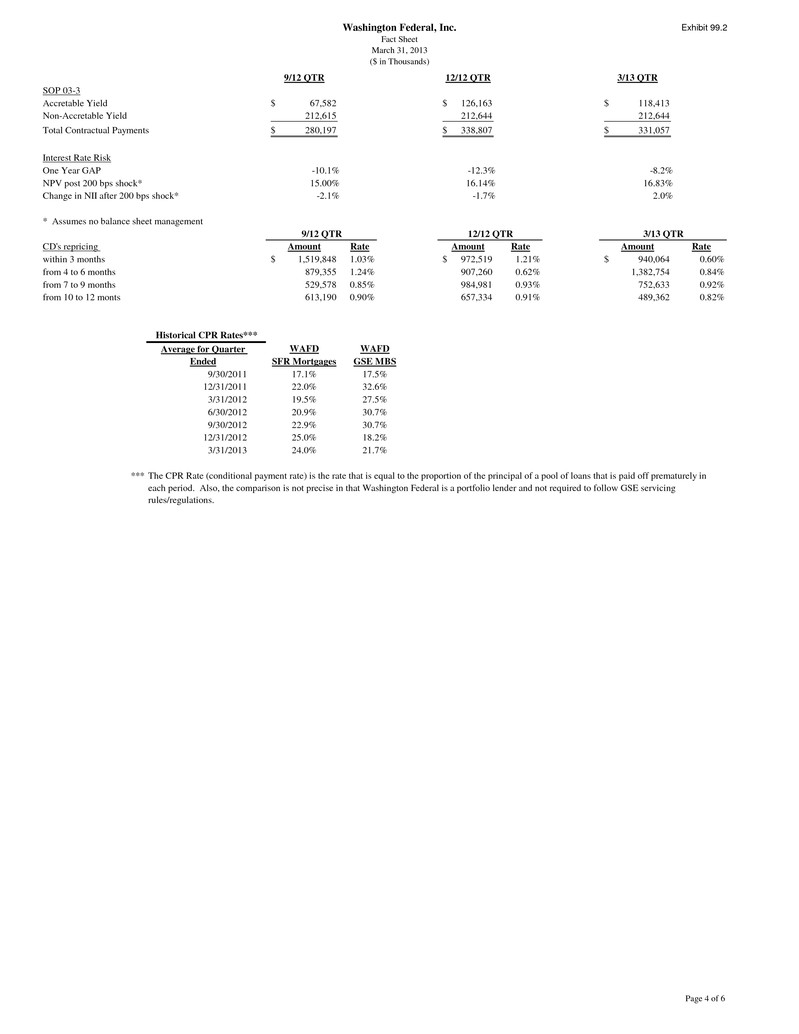
Washington Federal, Inc. Fact Sheet March 31, 2013 ($ in Thousands) Exhibit 99.2 9/12 QTR 12/12 QTR 3/13 QTR SOP 03-3 Accretable Yield 67,582$ 126,163$ 118,413$ Non-Accretable Yield 212,615 212,644 212,644 Total Contractual Payments 280,197$ 338,807$ 331,057$ Interest Rate Risk One Year GAP -10.1% -12.3% -8.2% NPV post 200 bps shock* 15.00% 16.14% 16.83% Change in NII after 200 bps shock* -2.1% -1.7% 2.0% * Assumes no balance sheet management 9/12 QTR 12/12 QTR 3/13 QTR CD's repricing Amount Rate Amount Rate Amount Rate within 3 months 1,519,848$ 1.03% 972,519$ 1.21% 940,064$ 0.60% from 4 to 6 months 879,355 1.24% 907,260 0.62% 1,382,754 0.84% from 7 to 9 months 529,578 0.85% 984,981 0.93% 752,633 0.92% from 10 to 12 monts 613,190 0.90% 657,334 0.91% 489,362 0.82% WAFD WAFD SFR Mortgages GSE MBS 9/30/2011 17.1% 17.5% 12/31/2011 22.0% 32.6% 3/31/2012 19.5% 27.5% 6/30/2012 20.9% 30.7% 9/30/2012 22.9% 30.7% 12/31/2012 25.0% 18.2% 3/31/2013 24.0% 21.7% *** The CPR Rate (conditional payment rate) is the rate that is equal to the proportion of the principal of a pool of loans that is paid off prematurely in each period. Also, the comparison is not precise in that Washington Federal is a portfolio lender and not required to follow GSE servicing rules/regulations. Average for Quarter Ended Historical CPR Rates*** Page 4 of 6
