Attached files
| file | filename |
|---|---|
| 8-K - 8-K - WASHINGTON FEDERAL INC | wafd8-k.htm |
| EX-99.1 - EXHIBIT 99.1 PRESS RELEASE VERBIAGE - WASHINGTON FEDERAL INC | exhibit991mar2013pressre.htm |
| EX-99.1 - EXHIBIT 99.1 BALANCE SHEET - WASHINGTON FEDERAL INC | exhibit991mar2013balance.htm |
| EX-99.2 - EXHIBIT 99.2 DELINQUENCY SUMMARY - WASHINGTON FEDERAL INC | exhibit992mar2013delinqu.htm |
| EX-99.2 - EXHIBIT 99.2 AVERAGE BALANCE SHEET - WASHINGTON FEDERAL INC | exhibit992mar2013average.htm |
| EX-99.2 - EXHIBIT 99.2 FACT SHEET - WASHINGTON FEDERAL INC | exhibit992mar2013factshe.htm |

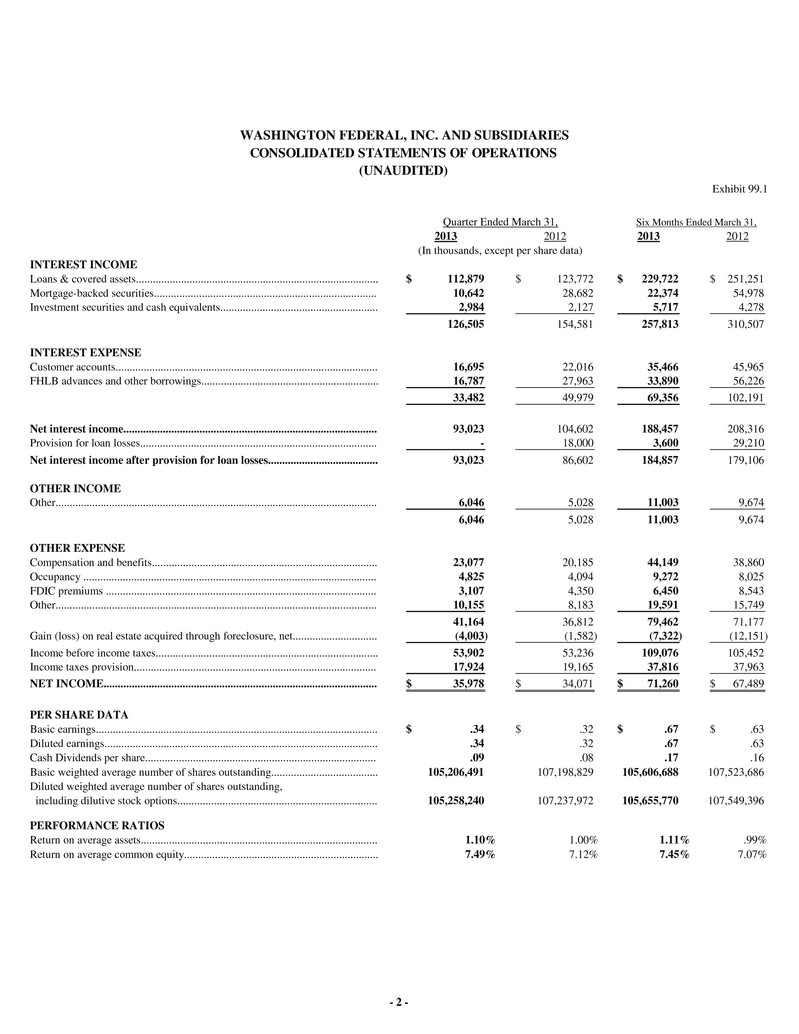
Exhibit 99.1 2013 2012 2013 2012 (In thousands, except per share data) INTEREST INCOME Loans & covered assets...................................................................................... 112,879$ 123,772$ 229,722$ 251,251$ Mortgage-backed securities............................................................................... 10,642 28,682 22,374 54,978 Investment securities and cash equivalents........................................................ 2,984 2,127 5,717 4,278 126,505 154,581 257,813 310,507 INTEREST EXPENSE Customer accounts............................................................................................. 16,695 22,016 35,466 45,965 FHLB advances and other borrowings............................................................... 16,787 27,963 33,890 56,226 33,482 49,979 69,356 102,191 Net interest income.......................................................................................... 93,023 104,602 188,457 208,316 Provision for loan losses.................................................................................... - 18,000 3,600 29,210 Net interest income after provision for loan losses....................................... 93,023 86,602 184,857 179,106 OTHER INCOME Other.................................................................................................................. 6,046 5,028 11,003 9,674 6,046 5,028 11,003 9,674 OTHER EXPENSE Compensation and benefits................................................................................ 23,077 20,185 44,149 38,860 Occupancy ........................................................................................................ 4,825 4,094 9,272 8,025 FDIC premiums ................................................................................................ 3,107 4,350 6,450 8,543 Other.................................................................................................................. 10,155 8,183 19,591 15,749 41,164 36,812 79,462 71,177 Gain (loss) on real estate acquired through foreclosure, net.............................. (4,003) (1,582) (7,322) (12,151) Income before income taxes............................................................................... 53,902 53,236 109,076 105,452 Income taxes provision...................................................................................... 17,924 19,165 37,816 37,963 NET INCOME................................................................................................. 35,978$ 34,071$ 71,260$ 67,489$ PER SHARE DATA Basic earnings.................................................................................................... .34$ .32$ .67$ .63$ Diluted earnings................................................................................................. .34 .32 .67 .63 Cash Dividends per share.................................................................................. .09 .08 .17 .16 Basic weighted average number of shares outstanding...................................... Diluted weighted average number of shares outstanding, including dilutive stock options....................................................................... PERFORMANCE RATIOS Return on average assets.................................................................................... Return on average common equity..................................................................... 105,655,770 .99% 107,237,972 7.49% 7.12% 7.45% 7.07% WASHINGTON FEDERAL, INC. AND SUBSIDIARIES 105,258,240 1.10% 1.00% Six Months Ended March 31, 105,206,491 107,198,829 105,606,688 107,523,686 CONSOLIDATED STATEMENTS OF OPERATIONS (UNAUDITED) 107,549,396 1.11% Quarter Ended March 31, - 2 -
