Attached files
| file | filename |
|---|---|
| 8-K - FORM 8-K - CHEMUNG FINANCIAL CORP | f8k_090921.htm |
Exhibit 99.1
CHEMUNG FINANCIAL CORPORATION 2021 Investor Presentation
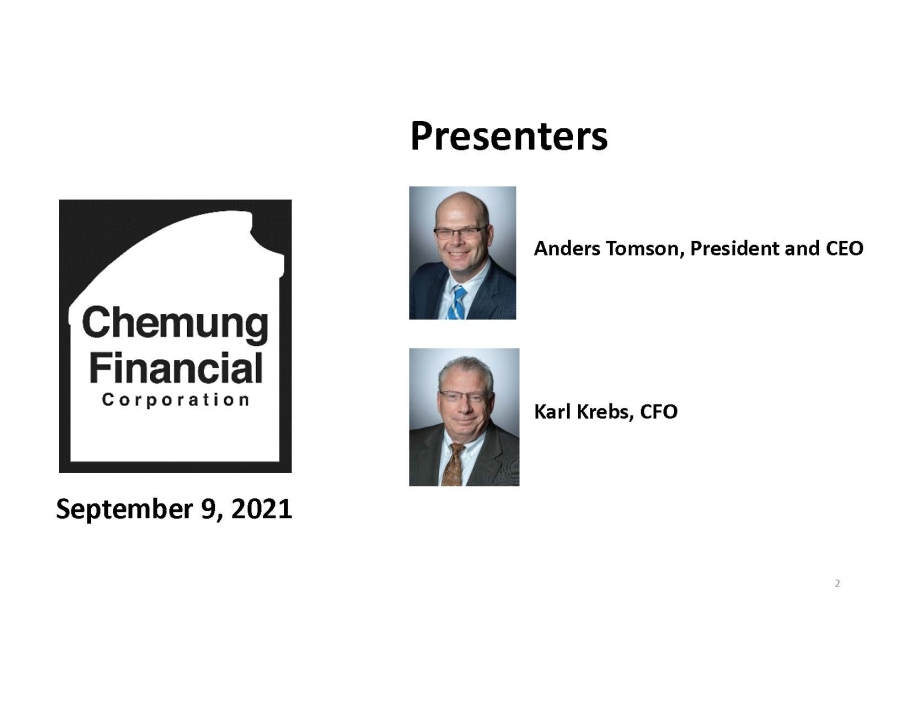
Anders Tomson, President and CEO Karl Krebs, CFO Presenters September 9, 2021 2
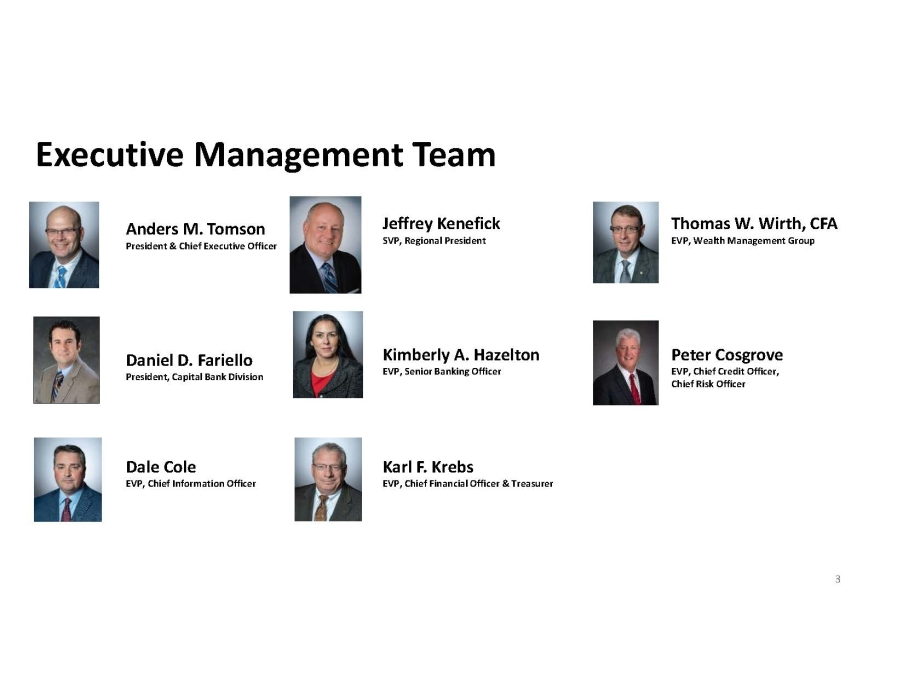
Anders M. Tomson President & Chief Executive Officer Jeffrey Kenefick SVP, Regional President Thomas W. Wirth, CFA EVP, Wealth Management Group Daniel D. Fariello President, Capital Bank Division Kimberly A. Hazelton EVP, Senior Banking Officer Peter Cosgrove EVP, Chief Credit Officer, Chief Risk Officer Dale Cole EVP, Chief Information Officer Karl F. Krebs EVP, Chief Financial Officer & Treasurer Executive Management Team 3
Our namesake…the Chemung Canal 4
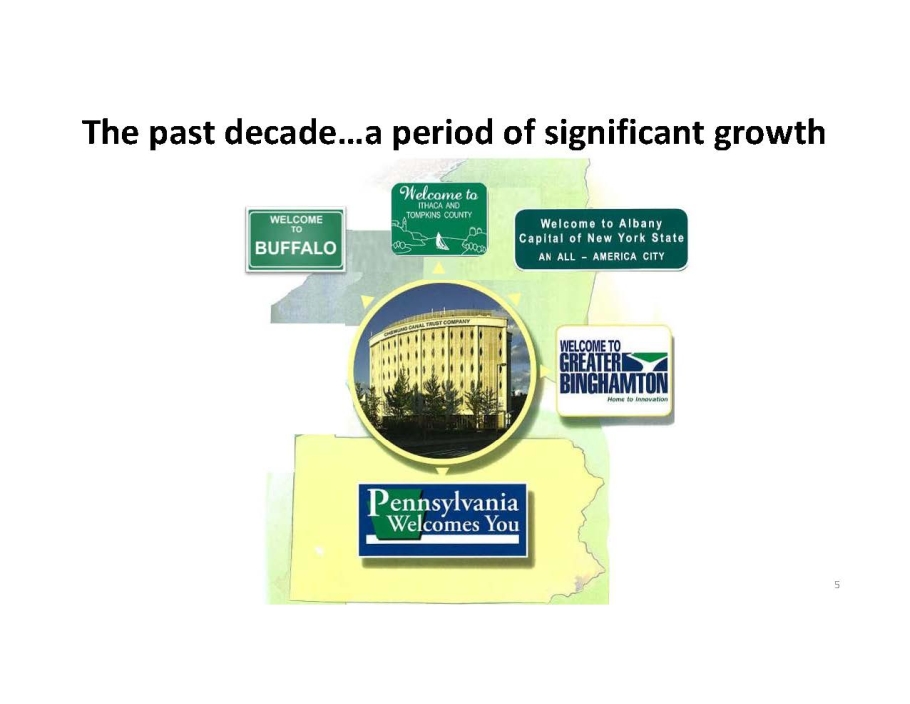
The past decade…a period of significant growth 5
This presentation contains certain statements that may be considered forward - looking statements within the meaning of Section 27 A of the Securities Act, Section 21E of the Exchange Act, and the Private Securities Litigation Reform Act of 1995, which are subject to numerous risk s a nd uncertainties. Forward looking statements can be identified by words such as "anticipates," "believes," "contemplates," "feels", "expects," "estimat es, " "seeks," "strives," "plans," "intends," "outlook," "forecast," "position," "target," "mission," "assume," "achievable," "potential," "strategy," "goal," " asp iration," "opportunity," "initiative," "outcome," "continue," "remain," "maintain," "on course," "trend," "objective," "looks forward," "projects," "m ode ls" and variations of such words and similar expressions, or future or conditional verbs such as "will," "would," "should," "could," "might," "can," "ma y," or similar expressions, which predict or indicate future events or trends and which do not relate to historical matters. These forward - looking statements are predicated on the beliefs and assumptions of Chemung Financial Corporation’s management based on information known to management as of the date of this pr esentation and do not purport to speak as of any other date. Forward looking statements should not be relied upon, because they involve known a nd unknown risks, uncertainties and other factors, some of which are beyond the control of the company. Should one or more of these risks mater ial ize or should underlying beliefs or assumptions prove incorrect, the Corporation’s actual results, performance or achievements could differ materially fr om those discussed. Factors that could cause or contribute to such differences include but are not limited to: changes in general economic, political or ind ustry conditions; changes in monetary and fiscal policies, including changes in interest rates; volatility and disruptions in capital and credit markets; the impact of the COVID - 19 pandemic; changes in regulation or oversight; unfavorable developments concerning credit quality; the effects of more stringe nt capital or liquidity requirements; declines or other changes in the businesses or industries of customers of the Corporation’s and its subsidiarie s; operational difficulties, failure of technology, infrastructure or information security incidents; the implementation of the Corporation’s strategies a nd business initiatives; changes in the financial markets, including fluctuations in interest rates; competitive product and pricing pressures among financial in stitutions within the Corporation’s markets; changes in customer behavior; any future strategic acquisitions or divestitures; management's ability to maintain and expand customer relationships; management's ability to retain key officers and employees; the impact of legal and regulatory proceed ing s or determinations; the effectiveness of methods of reducing risk exposures; the effects of terrorist activities and other hostilities; the effects o f c atastrophic events including, but not limited to, severe weather events and storms; and changes in accounting standards. The Corporation cautions that the fore goi ng list of factors is not exclusive. For a discussion of factors that may cause actual results to differ from expectations, please refer to "Item 1A. R isk Factors" of the Chemung Financial Corporation’s Annual Report on Form 10 - K for the year ended December 31, 2020, as updated by our filings on Form 10 - Q and other filings with the SEC. Forward - looking statements speak only as of the date they are made. The Corporation does not undertake to update forwar d - looking statements to reflect facts, circumstances, assumptions or events that occur after the date the forward - looking statements are made. For an y forward - looking statements made in this presentation or in any documents, the Corporation claims the protection of the safe harbor for forwar d - l ooking statements contained in the Private Securities Litigation Reform Act of 1995. Safe Harbor Statement 6
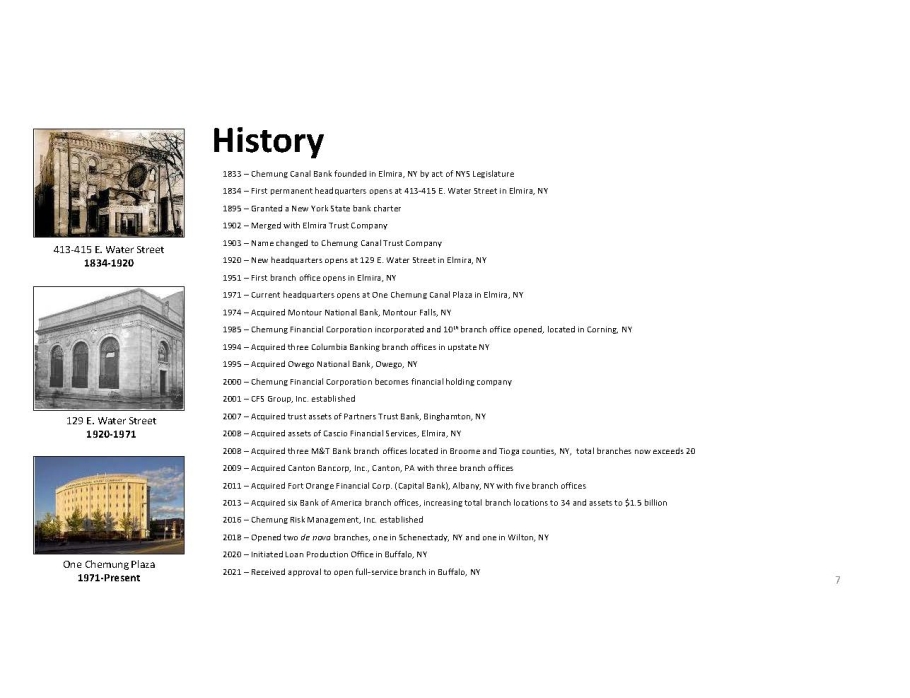
1833 – Chemung Canal Bank founded in Elmira, NY by act of NYS Legislature 1834 – First permanent headquarters opens at 413 - 415 E. Water Street in Elmira, NY 1895 – Granted a New York State bank charter 1902 – Merged with Elmira Trust Company 1903 – Name changed to Chemung Canal Trust Company 1920 – New headquarters opens at 129 E. Water Street in Elmira, NY 1951 – First branch office opens in Elmira, NY 1971 – Current headquarters opens at One Chemung Canal Plaza in Elmira, NY 1974 – Acquired Montour National Bank, Montour Falls, NY 1985 – Chemung Financial Corporation incorporated and 10 th branch office opened, located in Corning, NY 1994 – Acquired three Columbia Banking branch offices in upstate NY 1995 – Acquired Owego National Bank, Owego, NY 2000 – Chemung Financial Corporation becomes financial holding company 2001 – CFS Group, Inc. established 2007 – Acquired trust assets of Partners Trust Bank, Binghamton, NY 2008 – Acquired assets of Cascio Financial Services, Elmira, NY 2008 – Acquired three M&T Bank branch offices located in Broome and Tioga counties, NY, total branches now exceeds 20 2009 – Acquired Canton Bancorp, Inc., Canton, PA with three branch offices 2011 – Acquired Fort Orange Financial Corp. (Capital Bank), Albany, NY with five branch offices 2013 – Acquired six Bank of America branch offices, increasing total branch locations to 34 and assets to $1.5 billion 2016 – Chemung Risk Management, Inc. established 2018 – Opened two de novo branches, one in Schenectady, NY and one in Wilton, NY 2020 – Initiated Loan Production Office in Buffalo, NY 2021 – Received approval to open full - service branch in Buffalo, NY History 413 - 415 E. Water Street 1834 - 1920 129 E. Water Street 1920 - 1971 One Chemung Plaza 1971 - Present 7
Our mission is to remain a strong and independent financial services organization creating value for shareholders, customers, employees and the communities where we do business, while maintaining the highest standards of business ethics. • Value for shareholders means delivering a competitive return on investment through stock appreciation and dividends • Value for customers means delivering superior customer service and competitive products and services • Value for employees means ensuring that Chemung Canal remains a great place to work, providing competitive compensation and benefits, and opportunities for career advancement and growth • Value for communities means continuing to be an integral part of the communities we serve, being responsive to the financial needs within these communities and being a good corporate citizen • Earnings growth is the fuel that drives value creation Mission 8
• Oldest locally - owned and managed community bank in NYS, dating to 1833 • NYS chartered bank and Member of the Federal Reserve • Listed on Nasdaq Global Select Market • Assets of $2.38 billion and 334 employees • Operates through a single subsidiary bank, Chemung Canal Trust Company, with 31 retail offices spread over thirteen counties in NYS and one county in PA. • Twenty - three branch offices operate under CCTC in the Finger Lakes and Southern Tier regions of NYS and the Northern Tier of PA. • One pending branch office in Western NY (recently approved by NYS DFS and the Federal Reserve Bank of NY) • Seven branch offices operate under the Capital Bank name in the Capital Region of NYS. • Strong Chemung Canal Trust Company Board and Capital Bank Advisory Board provides local market knowledge and business development opportunities. • Trust and wealth management division with $2.25 billion in assets under management or administration. • CFS Group Inc. provides mutual funds, securities and insurance brokerage services through LPL Financial. • Chemung Risk Management, Inc., the Corporation’s Nevada - based captive insurance company which insures against certain risks unique to the operations of the Corporation and its subsidiaries for which insurance may not be currently available or economically feasible in today’s insurance marketplace. About Chemung Financial Corporation 9
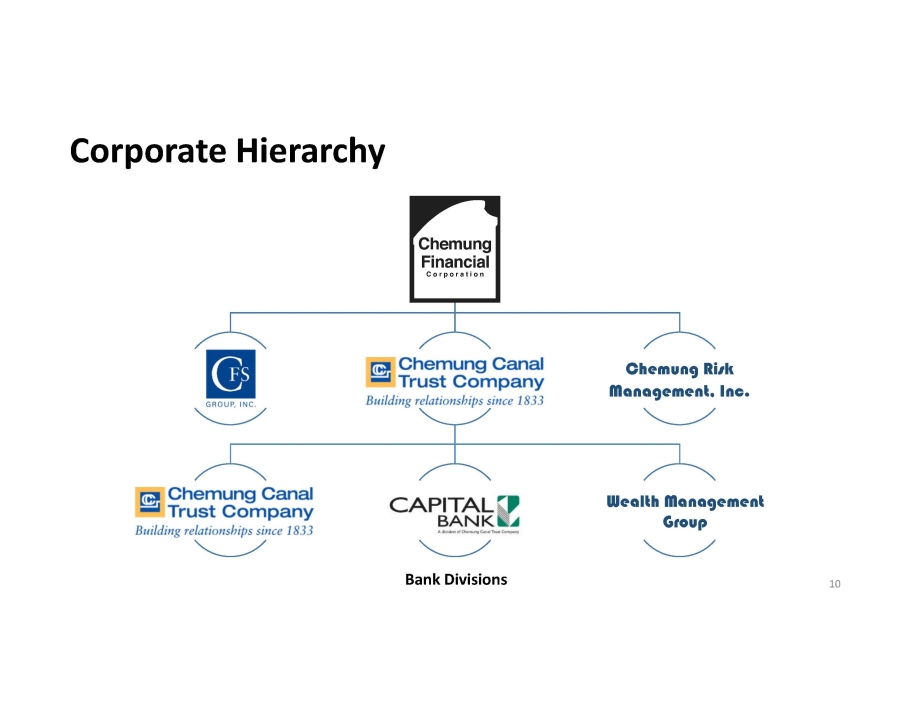
Corporate Hierarchy Chemung Risk Management, Inc. Bank Divisions Wealth Management Group 10
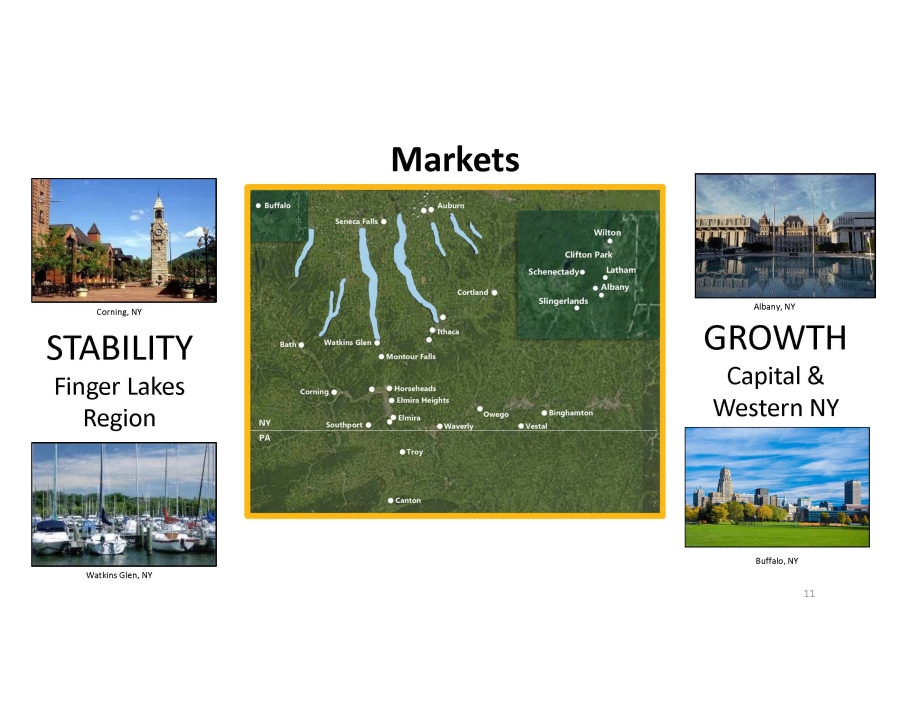
STABILITY Finger Lakes Region Markets Corning, NY Watkins Glen, NY Albany, NY 11 GROWTH Capital & Western NY Buffalo, NY
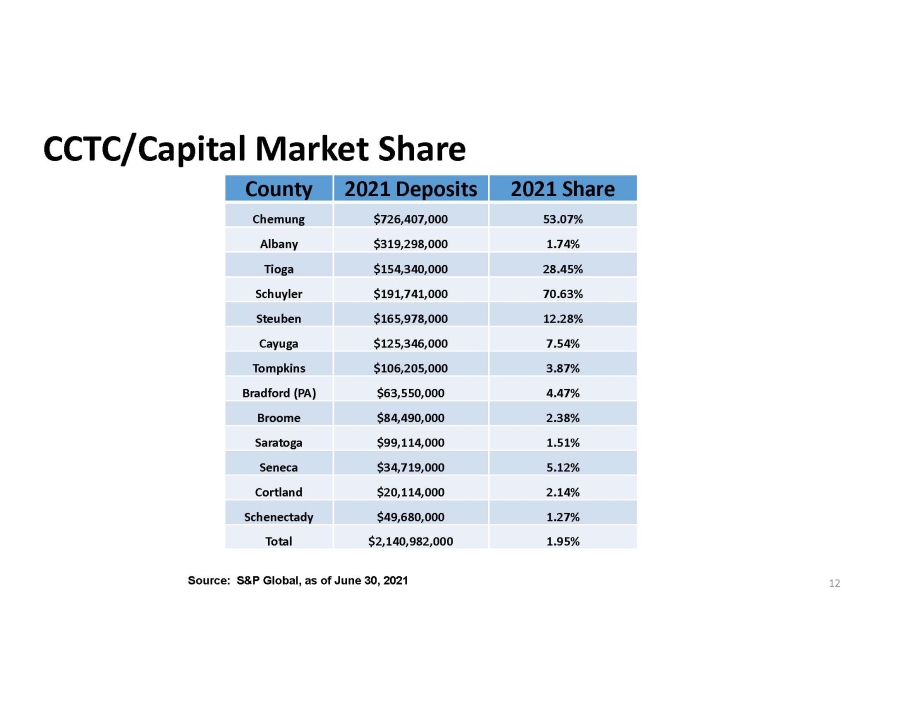
CCTC/Capital Market Share Source: S&P Global, as of June 30, 2021 12 County 2021 Deposits 2021 Share Chemung $726,407,000 53.07% Albany $319,298,000 1.74% Tioga $154,340,000 28.45% Schuyler $191,741,000 70.63% Steuben $165,978,000 12.28% Cayuga $125,346,000 7.54% Tompkins $106,205,000 3.87% Bradford (PA) $63,550,000 4.47% Broome $84,490,000 2.38% Saratoga $99,114,000 1.51% Seneca $34,719,000 5.12% Cortland $20,114,000 2.14% Schenectady $49,680,000 1.27% Total $2,140,982,000 1.95%
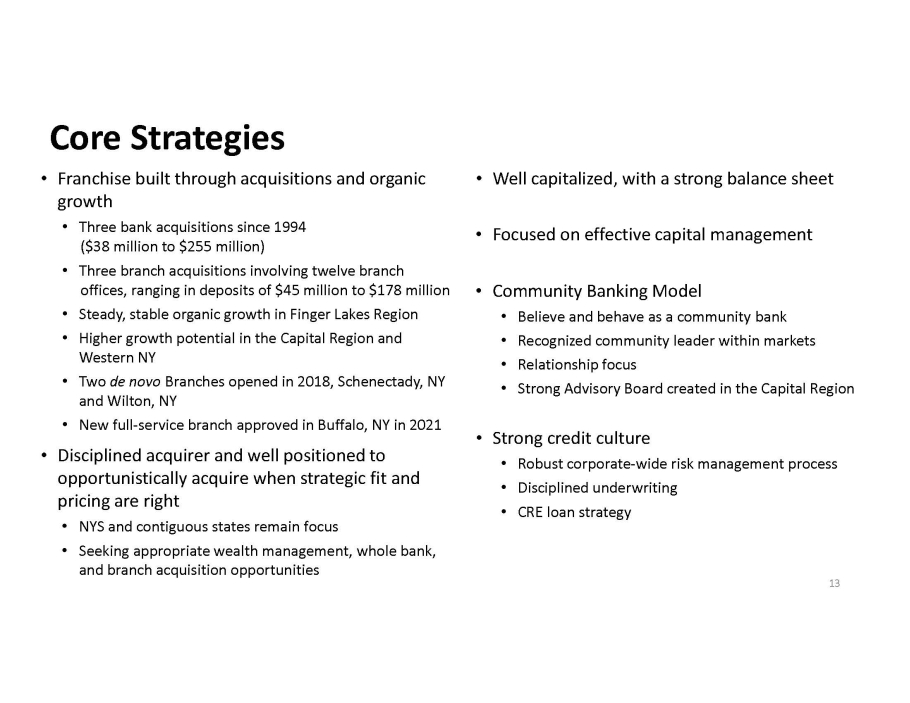
• Franchise built through acquisitions and organic growth • Three bank acquisitions since 1994 ($38 million to $255 million) • Three branch acquisitions involving twelve branch offices, ranging in deposits of $45 million to $178 million • Steady, stable organic growth in Finger Lakes Region • Higher growth potential in the Capital Region and Western NY • Two de novo Branches opened in 2018, Schenectady, NY and Wilton, NY • New full - service branch approved in Buffalo, NY in 2021 • Disciplined acquirer and well positioned to opportunistically acquire when strategic fit and pricing are right • NYS and contiguous states remain focus • Seeking appropriate wealth management, whole bank, and branch acquisition opportunities • Well capitalized, with a strong balance sheet • Focused on effective capital management • Community Banking Model • Believe and behave as a community bank • Recognized community leader within markets • Relationship focus • Strong Advisory Board created in the Capital Region • Strong credit culture • Robust corporate - wide risk management process • Disciplined underwriting • CRE loan strategy Core Strategies 13
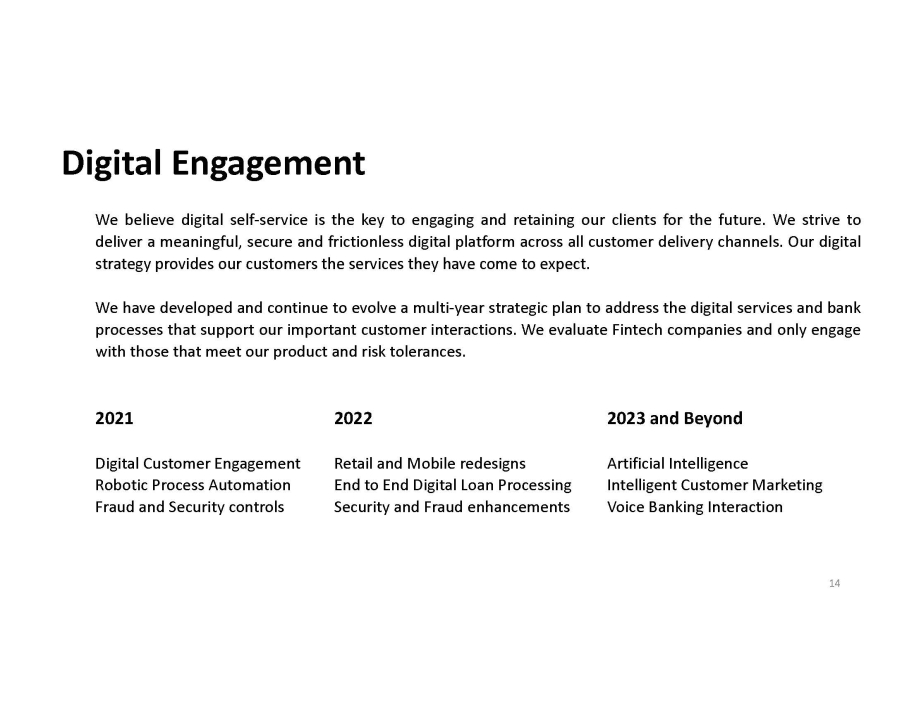
Digital Engagement We believe digital self - service is the key to engaging and retaining our clients for the future . We strive to deliver a meaningful, secure and frictionless digital platform across all customer delivery channels . Our digital strategy provides our customers the services they have come to expect . We have developed and continue to evolve a multi - year strategic plan to address the digital services and bank processes that support our important customer interactions . We evaluate Fintech companies and only engage with those that meet our product and risk tolerances . 2021 2022 2023 and Beyond Digital Customer Engagement Retail and Mobile redesigns Artificial Intelligence Robotic Process Automation End to End Digital Loan Processing Intelligent Customer Marketing Fraud and Security controls Security and Fraud enhancements Voice Banking Interaction 14
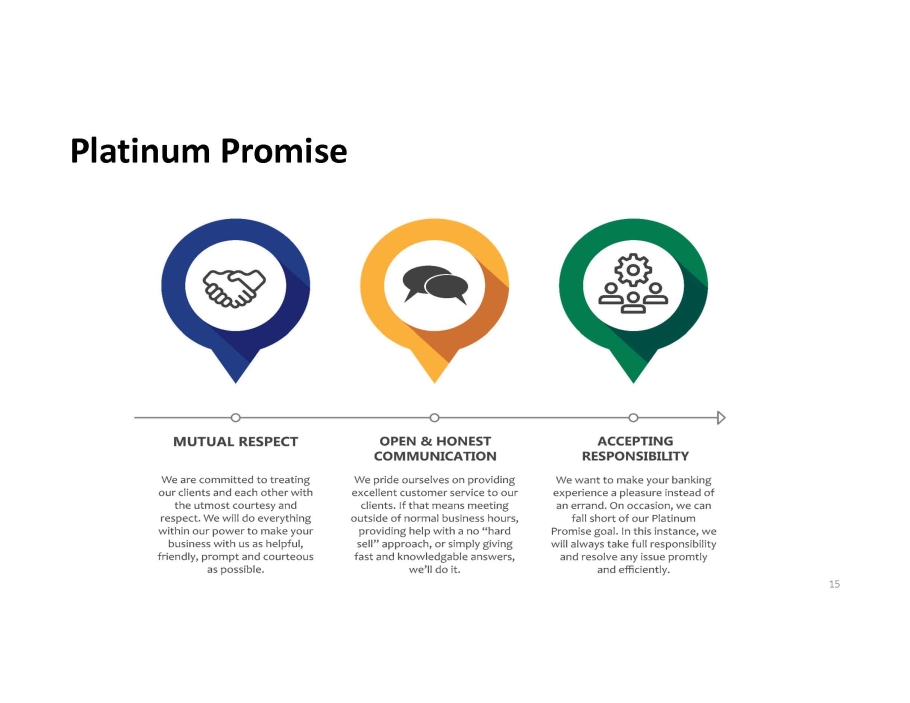
Platinum Promise 15

Supporting Our Community 16
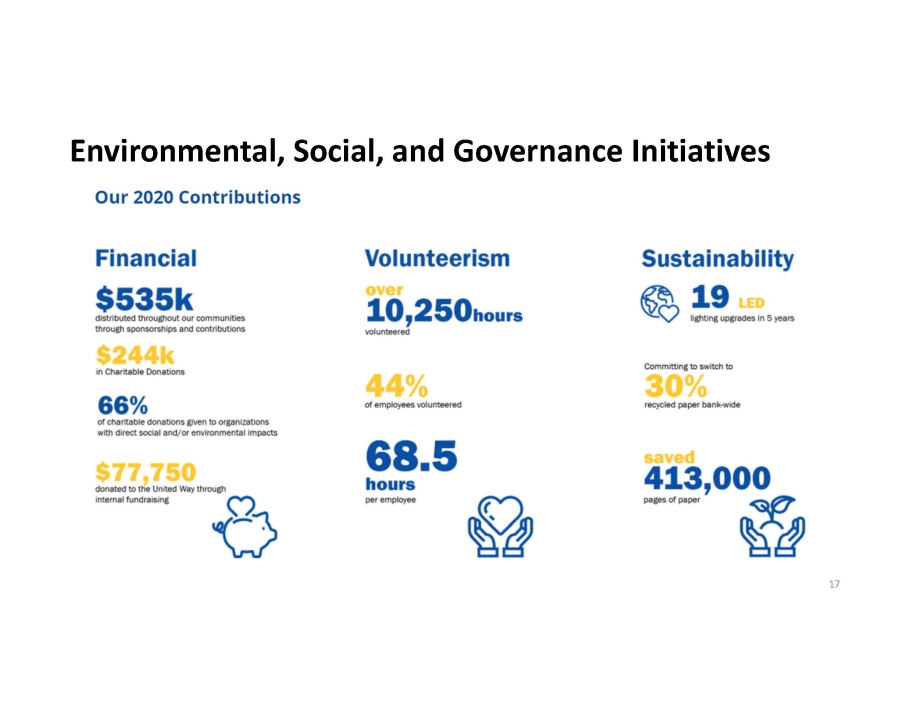
Environmental, Social, and Governance Initiatives 17
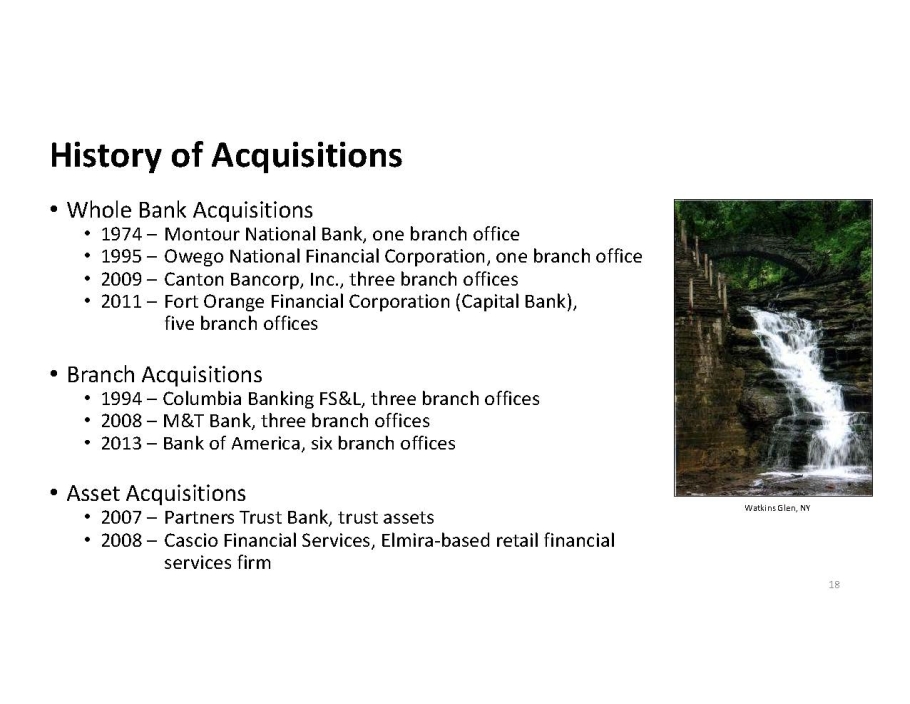
• Whole Bank Acquisitions • 1974 – Montour National Bank, one branch office • 1995 – Owego National Financial Corporation, one branch office • 2009 – Canton Bancorp, Inc., three branch offices • 2011 – Fort Orange Financial Corporation (Capital Bank), five branch offices • Branch Acquisitions • 1994 – Columbia Banking FS&L, three branch offices • 2008 – M&T Bank, three branch offices • 2013 – Bank of America, six branch offices • Asset Acquisitions • 2007 – Partners Trust Bank, trust assets • 2008 – Cascio Financial Services, Elmira - based retail financial services firm History of Acquisitions Watkins Glen, NY 18
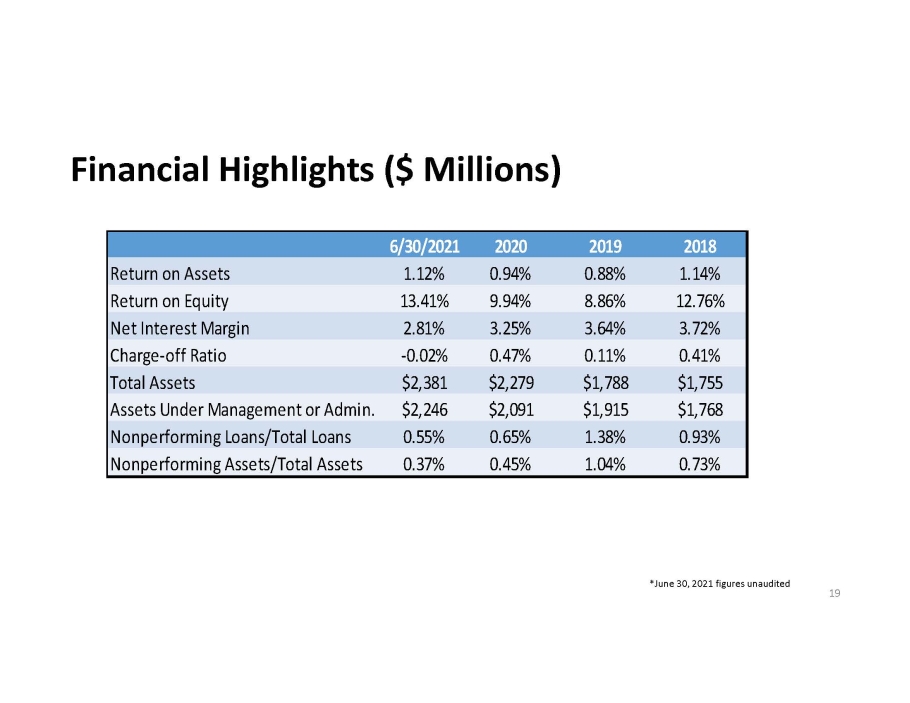
Financial Highlights ($ Millions) 19 *June 30, 2021 figures unaudited 6/30/2021 2020 2019 2018 Return on Assets 1.12% 0.94% 0.88% 1.14% Return on Equity 13.41% 9.94% 8.86% 12.76% Net Interest Margin 2.81% 3.25% 3.64% 3.72% Charge-off Ratio -0.02% 0.47% 0.11% 0.41% Total Assets $2,381 $2,279 $1,788 $1,755 Assets Under Management or Admin. $2,246 $2,091 $1,915 $1,768 Nonperforming Loans/Total Loans 0.55% 0.65% 1.38% 0.93% Nonperforming Assets/Total Assets 0.37% 0.45% 1.04% 0.73%
• Communities and Employees • Complying with local, state, and federal orders to contain the spread of the virus • Implemented social distancing, sanitizing, and face - covering protocols • Limited in - person branch access to appointments and facilitated drive - up and walk - up windows • Allow employees to work remotely • Continual communication to ensure top - tier financial services continue to be provided 20 COVID - 19 Response
• Funded 1,260 PPP loans totaling $189.8 million in Round 1 • Impacting 19,000 employees of approved businesses in our communities • Average balances were $150,607 and average fees were 3.16% • We are assisting customers with the forgiveness application phase of the program. In our most recent 8 - K we noted $88.9MM of PPP loans were forgiven by the SBA. • Funded 874 PPP loans totaling $77.5 million in Round 2 • Average fees received from SBA are 5.28% • Average balances were $88,654. • Provided 30 - 90 day principal and interest deferrals on commercial and consumer loans for borrowers impacted by COVID - 19 21 COVID - 19 Financial Assistance *2021 figures unaudited
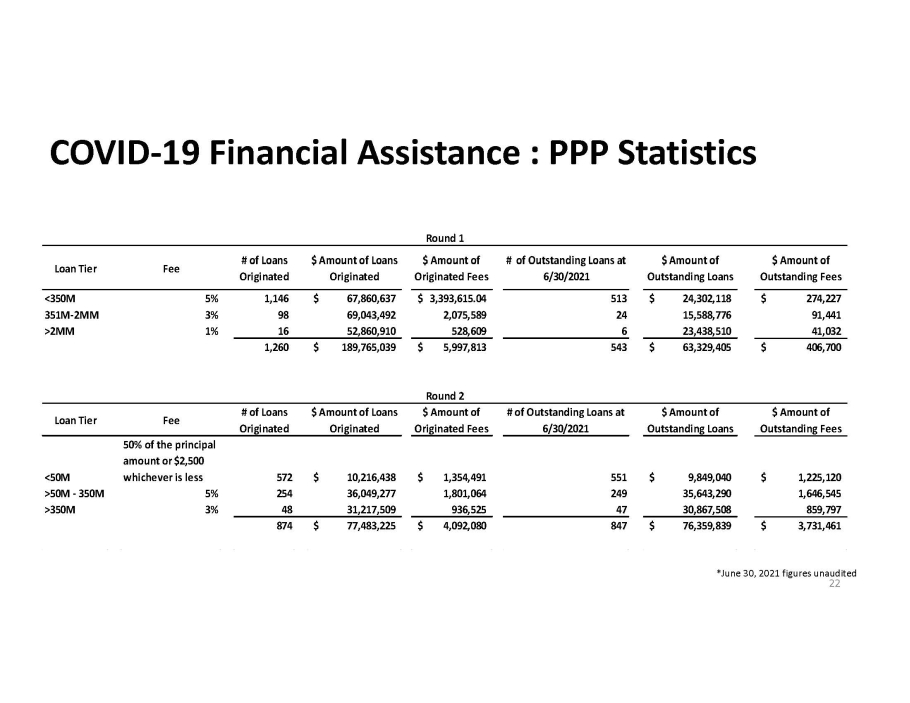
22 COVID - 19 Financial Assistance : PPP Statistics *June 30, 2021 figures unaudited Loan Tier Fee # of Loans Originated $ Amount of Loans Originated $ Amount of Originated Fees # of Outstanding Loans at 6/30/2021 $ Amount of Outstanding Loans $ Amount of Outstanding Fees <350M 5% 1,146 67,860,637$ 3,393,615.04$ 513 24,302,118$ 274,227$ 351M-2MM 3% 98 69,043,492 2,075,589 24 15,588,776 91,441 >2MM 1% 16 52,860,910 528,609 6 23,438,510 41,032 1,260 189,765,039$ 5,997,813$ 543 63,329,405$ 406,700$ Loan Tier Fee # of Loans Originated $ Amount of Loans Originated $ Amount of Originated Fees # of Outstanding Loans at 6/30/2021 $ Amount of Outstanding Loans $ Amount of Outstanding Fees <50M 50% of the principal amount or $2,500 whichever is less 572 10,216,438$ 1,354,491$ 551 9,849,040$ 1,225,120$ >50M - 350M 5% 254 36,049,277 1,801,064 249 35,643,290 1,646,545 >350M 3% 48 31,217,509 936,525 47 30,867,508 859,797 874 77,483,225$ 4,092,080$ 847 76,359,839$ 3,731,461$ Round 1 Round 2
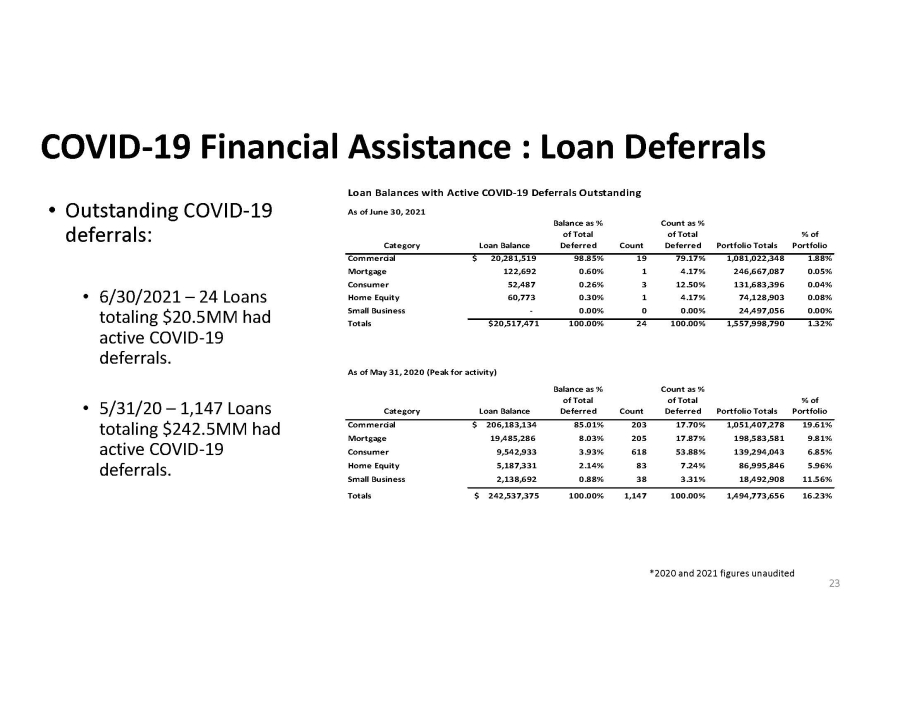
23 COVID - 19 Financial Assistance : Loan Deferrals • Outstanding COVID - 19 deferrals: • 6/30/2021 – 24 Loans totaling $20.5MM had active COVID - 19 deferrals. • 5/31/20 – 1,147 Loans totaling $242.5MM had active COVID - 19 deferrals. *2020 and 2021 figures unaudited Loan Balances with Active COVID-19 Deferrals Outstanding As of June 30, 2021 Category Loan Balance Balance as % of Total Deferred Count Count as % of Total Deferred Portfolio Totals % of Portfolio Commercial $ 20,281,519 98.85% 19 79.17% 1,081,022,348 1.88% Mortgage 122,692 0.60% 1 4.17% 246,667,087 0.05% Consumer 52,487 0.26% 3 12.50% 131,683,396 0.04% Home Equity 60,773 0.30% 1 4.17% 74,128,903 0.08% Small Business - 0.00% 0 0.00% 24,497,056 0.00% Totals $20,517,471 100.00% 24 100.00% 1,557,998,790 1.32% As of May 31, 2020 (Peak for activity) Category Loan Balance Balance as % of Total Deferred Count Count as % of Total Deferred Portfolio Totals % of Portfolio Commercial $ 206,183,134 85.01% 203 17.70% 1,051,407,278 19.61% Mortgage 19,485,286 8.03% 205 17.87% 198,583,581 9.81% Consumer 9,542,933 3.93% 618 53.88% 139,294,043 6.85% Home Equity 5,187,331 2.14% 83 7.24% 86,995,846 5.96% Small Business 2,138,692 0.88% 38 3.31% 18,492,908 11.56% Totals $ 242,537,375 100.00% 1,147 100.00% 1,494,773,656 16.23%
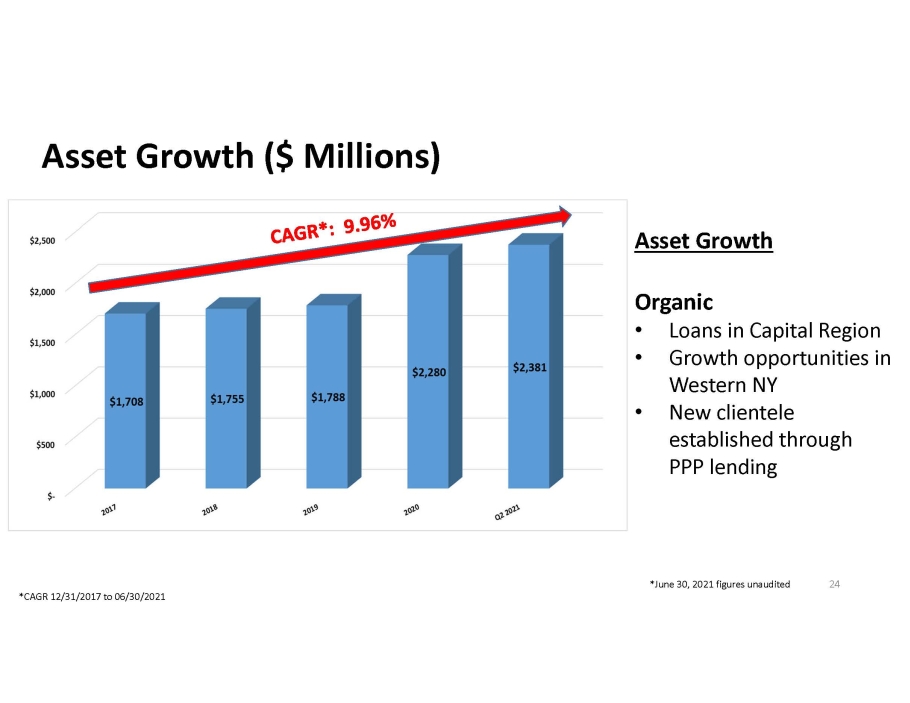
Asset Growth Organic • Loans in Capital Region • Growth opportunities in Western NY • New clientele established through PPP lending Asset Growth ($ Millions) 24 *CAGR 12/31/2017 to 06/30/2021 *June 30, 2021 figures unaudited
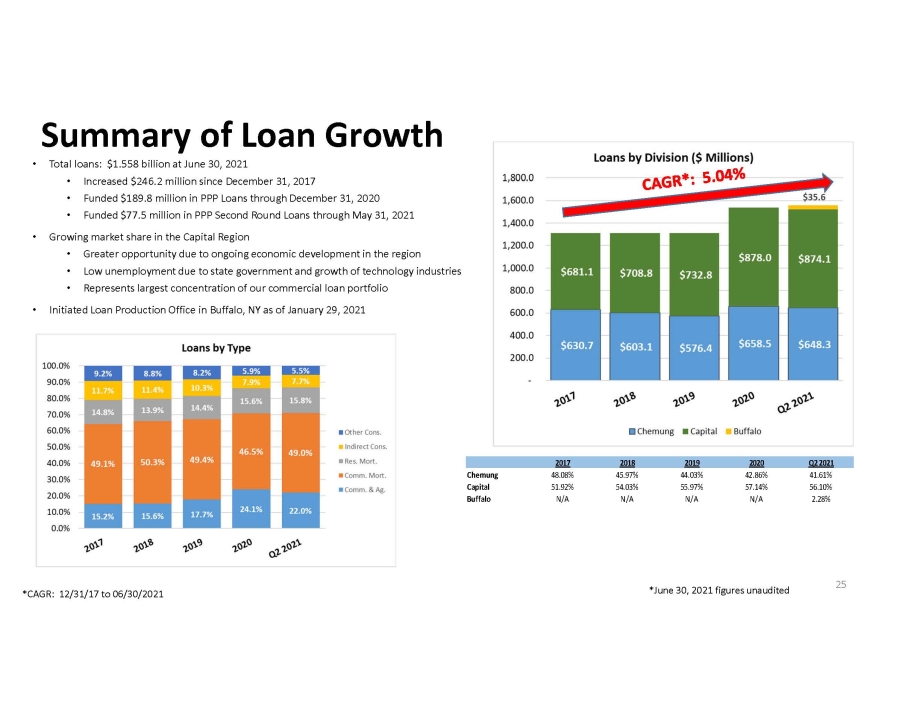
• Total loans: $1.558 billion at June 30, 2021 • Increased $246.2 million since December 31, 2017 • Funded $189.8 million in PPP Loans through December 31, 2020 • Funded $77.5 million in PPP Second Round Loans through May 31, 2021 • Growing market share in the Capital Region • Greater opportunity due to ongoing economic development in the region • Low unemployment due to state government and growth of technology industries • Represents largest concentration of our commercial loan portfolio • Initiated Loan Production Office in Buffalo, NY as of January 29, 2021 Summary of Loan Growth 25 *CAGR: 12/31/17 to 06/30/2021 *June 30, 2021 figures unaudited 2017 2018 2019 2020 Q2 2021 Chemung 48.08% 45.97% 44.03% 42.86% 41.61% Capital 51.92% 54.03% 55.97% 57.14% 56.10% Buffalo N/A N/A N/A N/A 2.28%
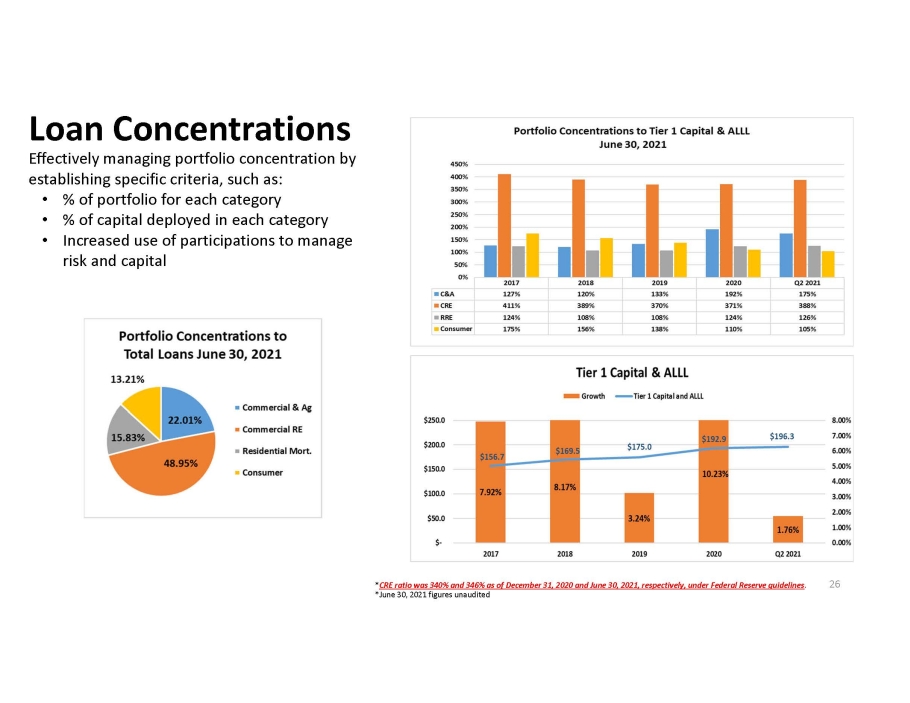
Effectively managing portfolio concentration by establishing specific criteria, such as: • % of portfolio for each category • % of capital deployed in each category • Increased use of participations to manage risk and capital Loan Concentrations 26 * CRE ratio was 340% and 346% as of December 31, 2020 and June 30, 2021, respectively, under Federal Reserve guidelines . *June 30, 2021 figures unaudited
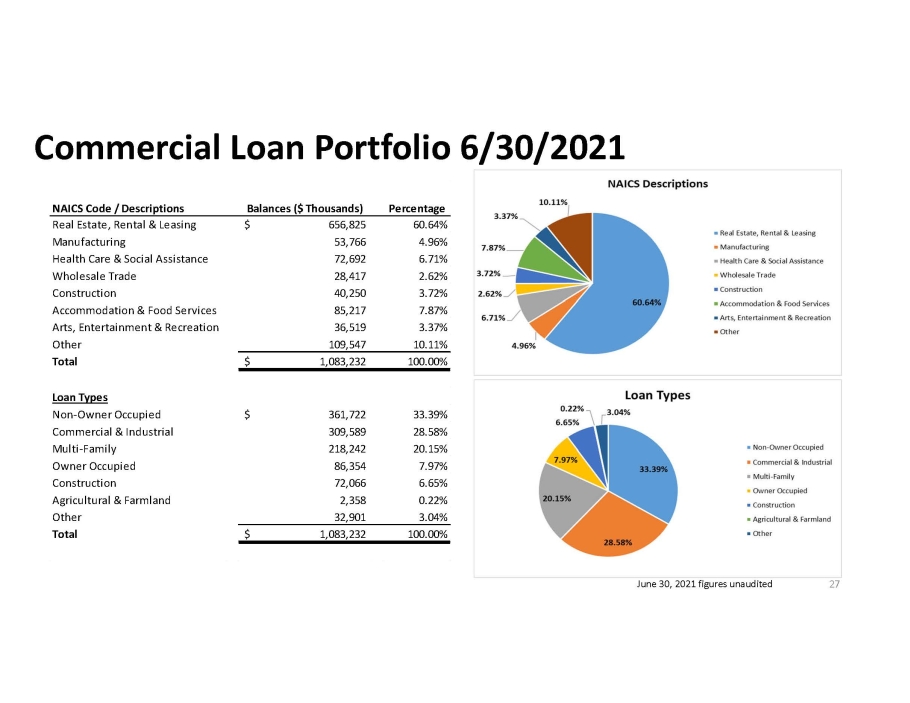
Commercial Loan Portfolio 6/30/2021 27 June 30, 2021 figures unaudited NAICS Code / Descriptions Balances ($ Thousands) Percentage Real Estate, Rental & Leasing 656,825$ 60.64% Manufacturing 53,766 4.96% Health Care & Social Assistance 72,692 6.71% Wholesale Trade 28,417 2.62% Construction 40,250 3.72% Accommodation & Food Services 85,217 7.87% Arts, Entertainment & Recreation 36,519 3.37% Other 109,547 10.11% Total 1,083,232$ 100.00% Loan Types Non-Owner Occupied 361,722$ 33.39% Commercial & Industrial 309,589 28.58% Multi-Family 218,242 20.15% Owner Occupied 86,354 7.97% Construction 72,066 6.65% Agricultural & Farmland 2,358 0.22% Other 32,901 3.04% Total 1,083,232$ 100.00%
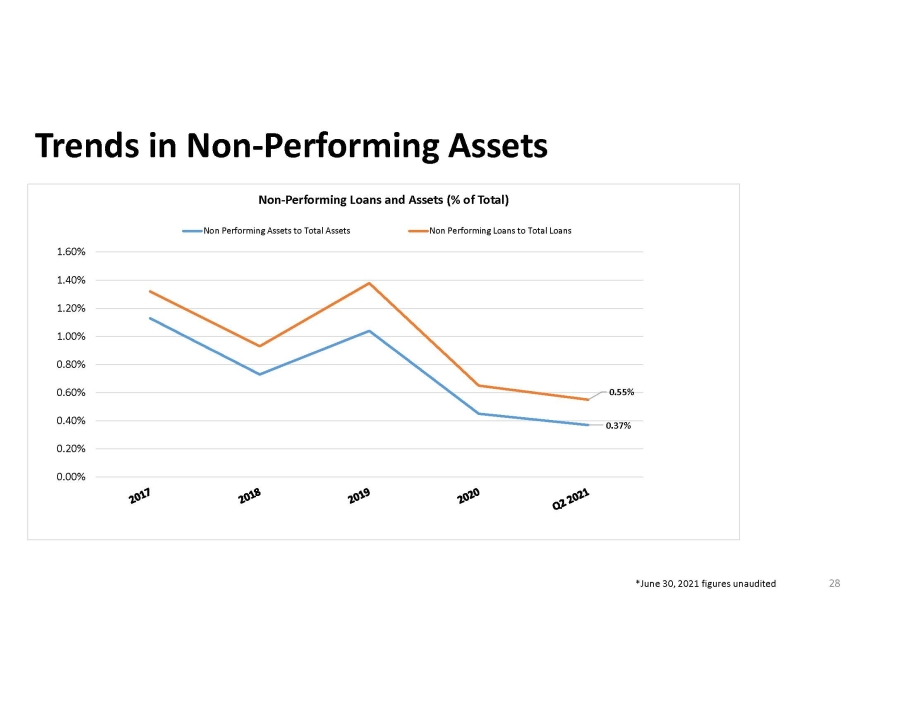
Trends in Non - Performing Assets 28 *June 30, 2021 figures unaudited 0.37% 0.55% 0.00% 0.20% 0.40% 0.60% 0.80% 1.00% 1.20% 1.40% 1.60% Non - Performing Loans and Assets (% of Total) Non Performing Assets to Total Assets Non Performing Loans to Total Loans
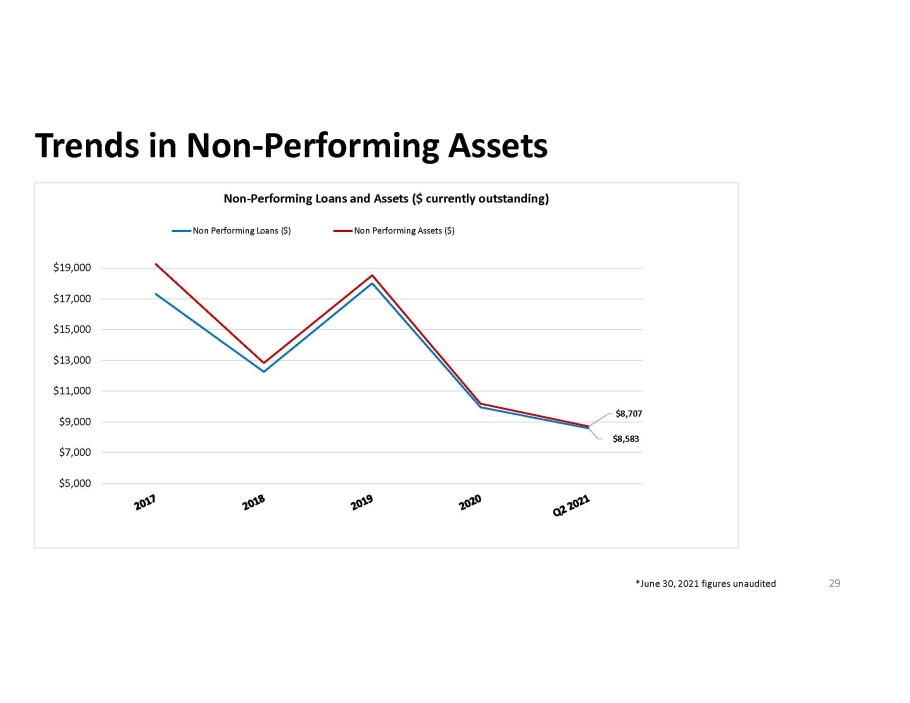
Trends in Non - Performing Assets 29 *June 30, 2021 figures unaudited $8,583 $8,707 $5,000 $7,000 $9,000 $11,000 $13,000 $15,000 $17,000 $19,000 Non - Performing Loans and Assets ($ currently outstanding) Non Performing Loans ($) Non Performing Assets ($)
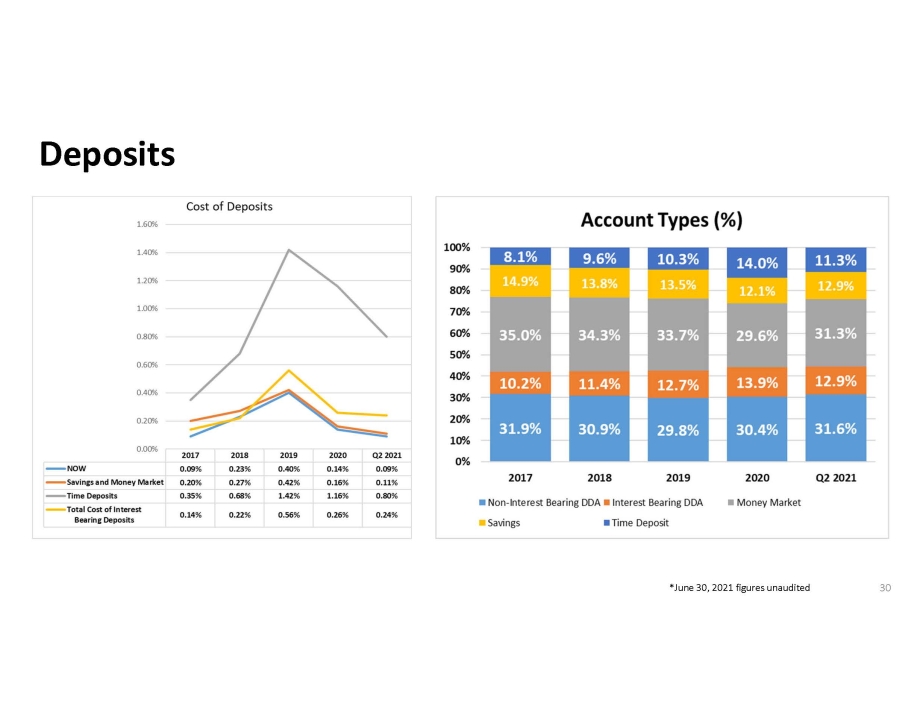
Deposits 30 *June 30, 2021 figures unaudited
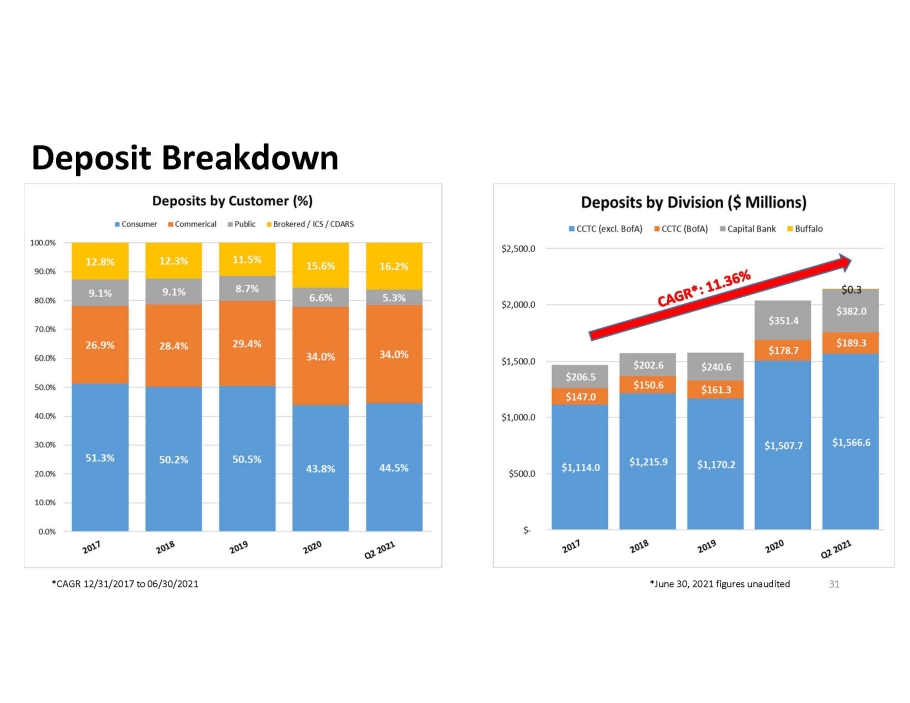
Deposit Breakdown 31 *June 30, 2021 figures unaudited *CAGR 12/31/2017 to 06/30/2021
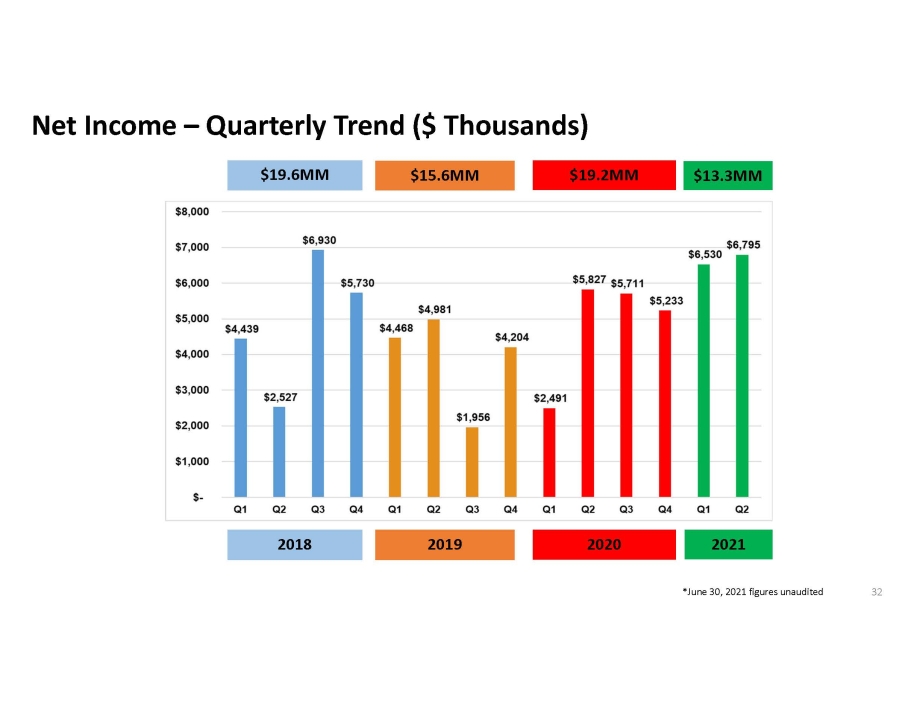
Net Income – Quarterly Trend ($ Thousands) 32 *June 30, 2021 figures unaudited 2018 2019 $19.6MM $15.6MM $19.2MM 2020 $13.3MM 2021
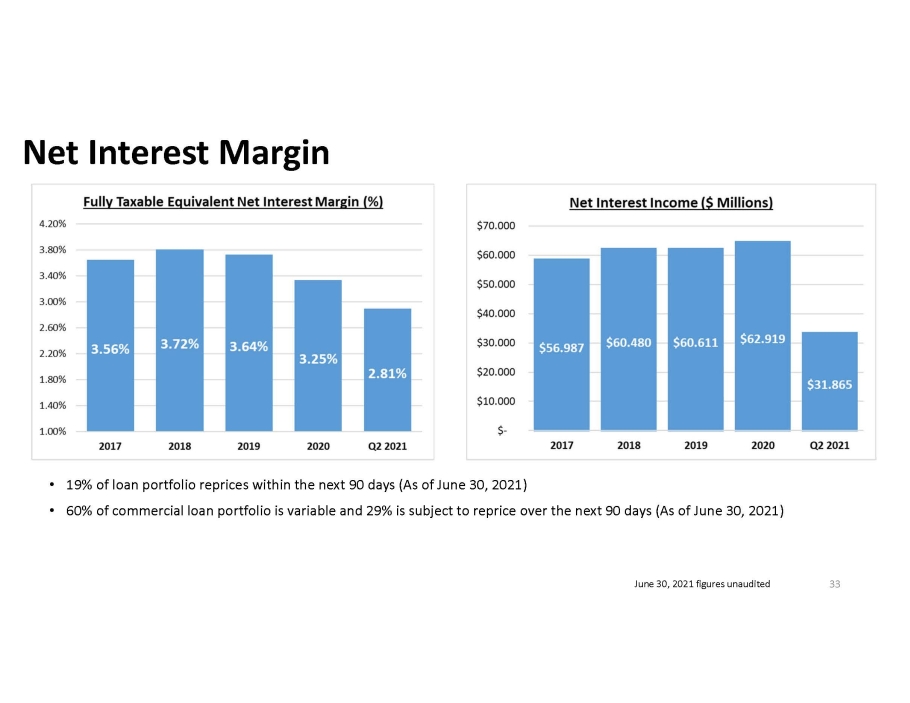
• 19% of loan portfolio reprices within the next 90 days (As of June 30, 2021) • 60% of commercial loan portfolio is variable and 29% is subject to reprice over the next 90 days (As of June 30, 2021) Net Interest Margin 33 June 30, 2021 figures unaudited
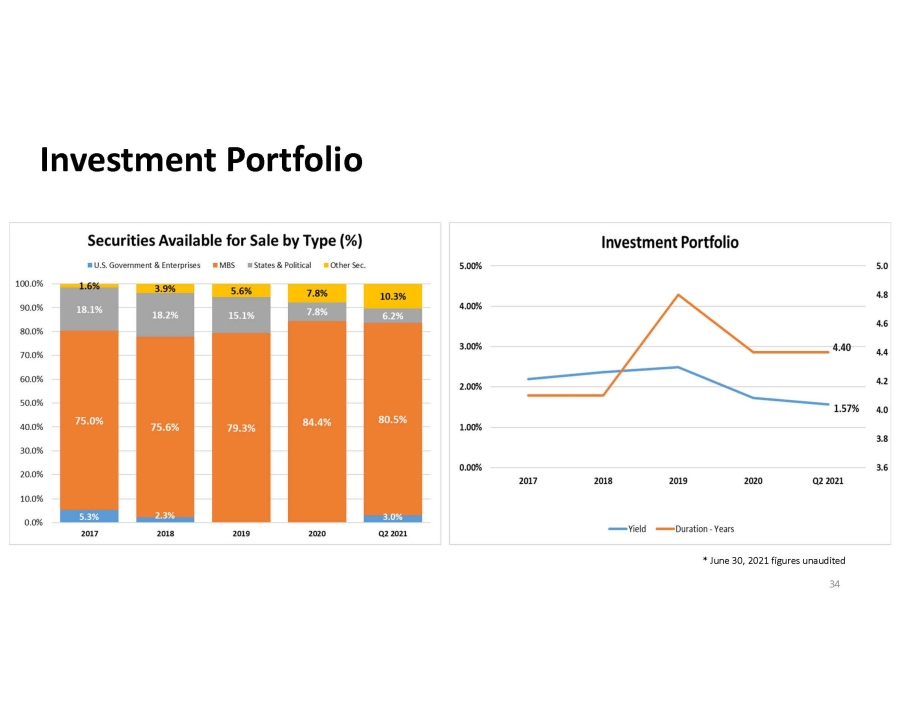
Investment Portfolio 34 * June 30, 2021 figures unaudited
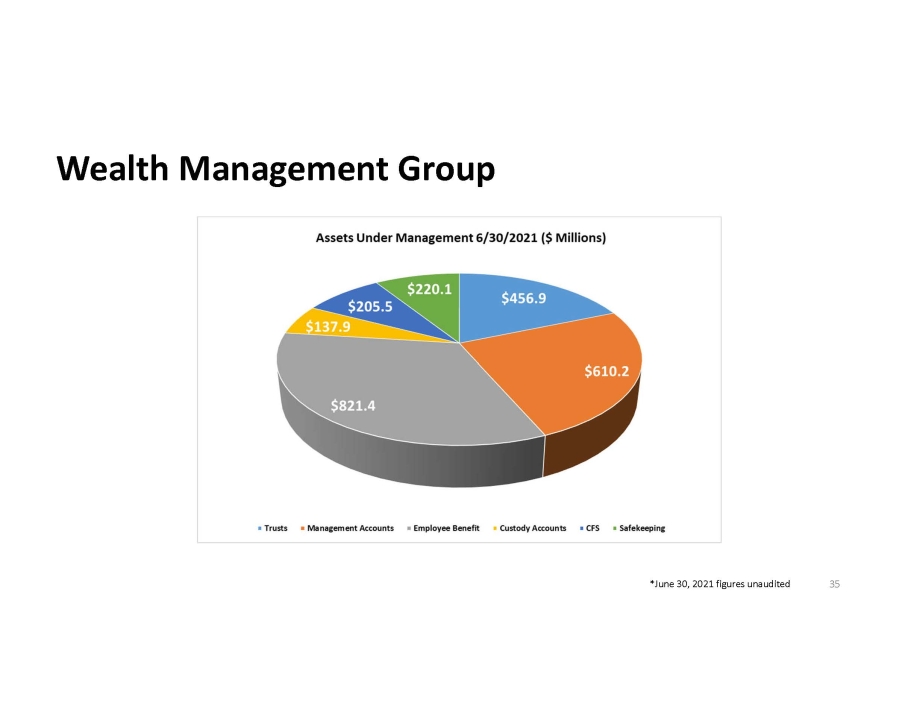
Wealth Management Group 35 *June 30, 2021 figures unaudited
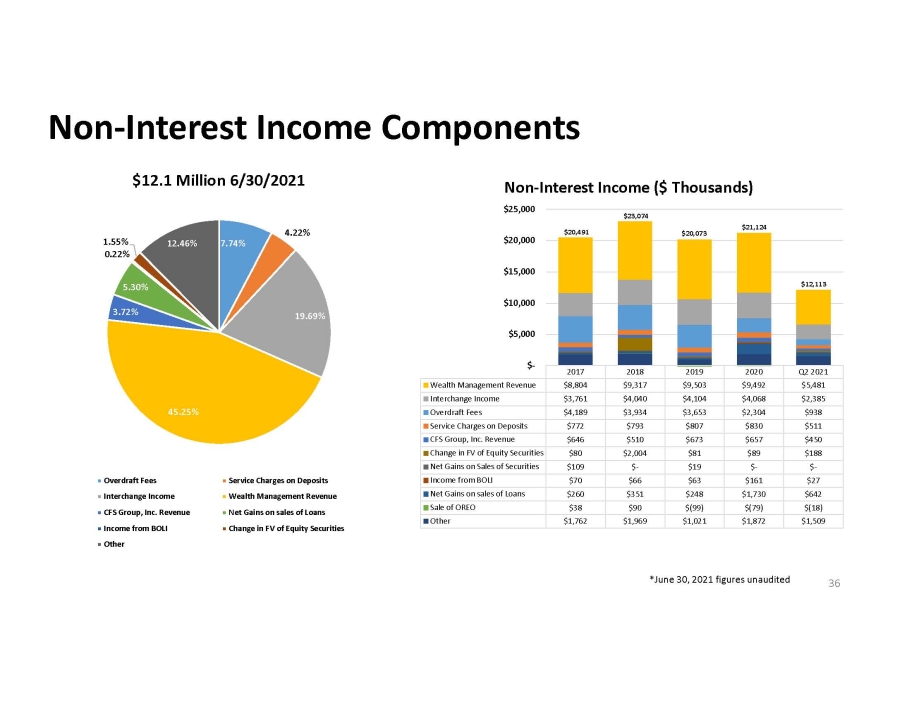
Non - Interest Income Components 36 *June 30, 2021 figures unaudited 2017 2018 2019 2020 Q2 2021 Wealth Management Revenue $8,804 $9,317 $9,503 $9,492 $5,481 Interchange Income $3,761 $4,040 $4,104 $4,068 $2,385 Overdraft Fees $4,189 $3,934 $3,653 $2,304 $938 Service Charges on Deposits $772 $793 $807 $830 $511 CFS Group, Inc. Revenue $646 $510 $673 $657 $450 Change in FV of Equity Securities $80 $2,004 $81 $89 $188 Net Gains on Sales of Securities $109 $- $19 $- $- Income from BOLI $70 $66 $63 $161 $27 Net Gains on sales of Loans $260 $351 $248 $1,730 $642 Sale of OREO $38 $90 $(99) $(79) $(18) Other $1,762 $1,969 $1,021 $1,872 $1,509 $- $5,000 $10,000 $15,000 $20,000 $25,000 Non - Interest Income ($ Thousands) $20,491 $23,074 $20,073 $21,124 $12,113 7.74% 4.22% 19.69% 45.25% 3.72% 5.30% 0.22% 1.55% 12.46% $12.1 Million 6/30/2021 Overdraft Fees Service Charges on Deposits Interchange Income Wealth Management Revenue CFS Group, Inc. Revenue Net Gains on sales of Loans Income from BOLI Change in FV of Equity Securities Other
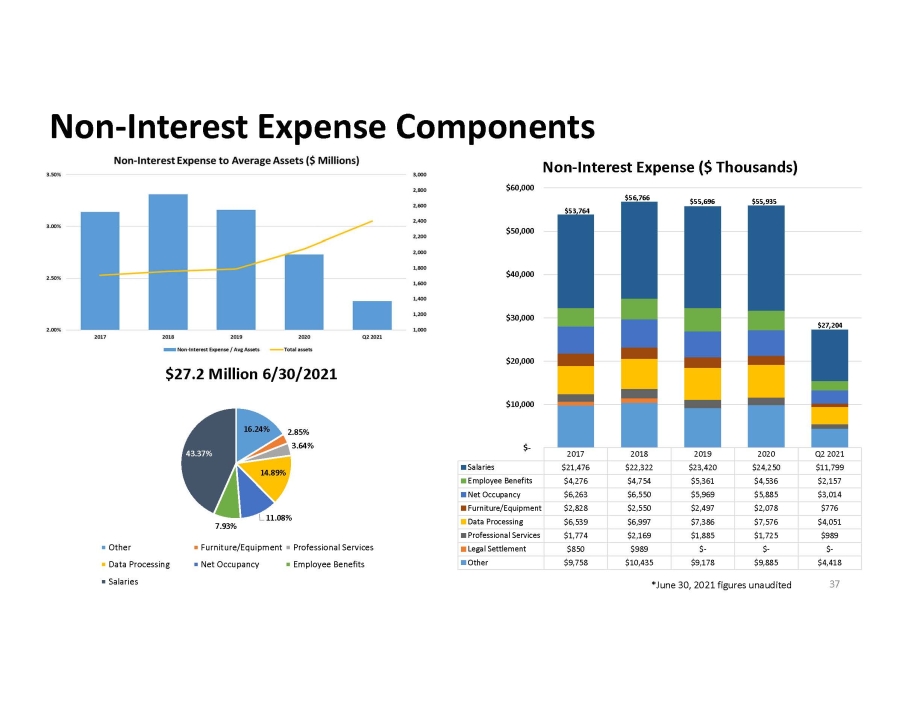
Non - Interest Expense Components 37 *June 30, 2021 figures unaudited 2017 2018 2019 2020 Q2 2021 Salaries $21,476 $22,322 $23,420 $24,250 $11,799 Employee Benefits $4,276 $4,754 $5,361 $4,536 $2,157 Net Occupancy $6,263 $6,550 $5,969 $5,885 $3,014 Furniture/Equipment $2,828 $2,550 $2,497 $2,078 $776 Data Processing $6,539 $6,997 $7,386 $7,576 $4,051 Professional Services $1,774 $2,169 $1,885 $1,725 $989 Legal Settlement $850 $989 $- $- $- Other $9,758 $10,435 $9,178 $9,885 $4,418 $- $10,000 $20,000 $30,000 $40,000 $50,000 $60,000 Non - Interest Expense ($ Thousands) $56,766 $55,935 $27,204 16.24% 2.85% 3.64% 14.89% 11.08% 7.93% 43.37% $27.2 Million 6/30/2021 Other Furniture/Equipment Professional Services Data Processing Net Occupancy Employee Benefits Salaries $53,764 $55,696
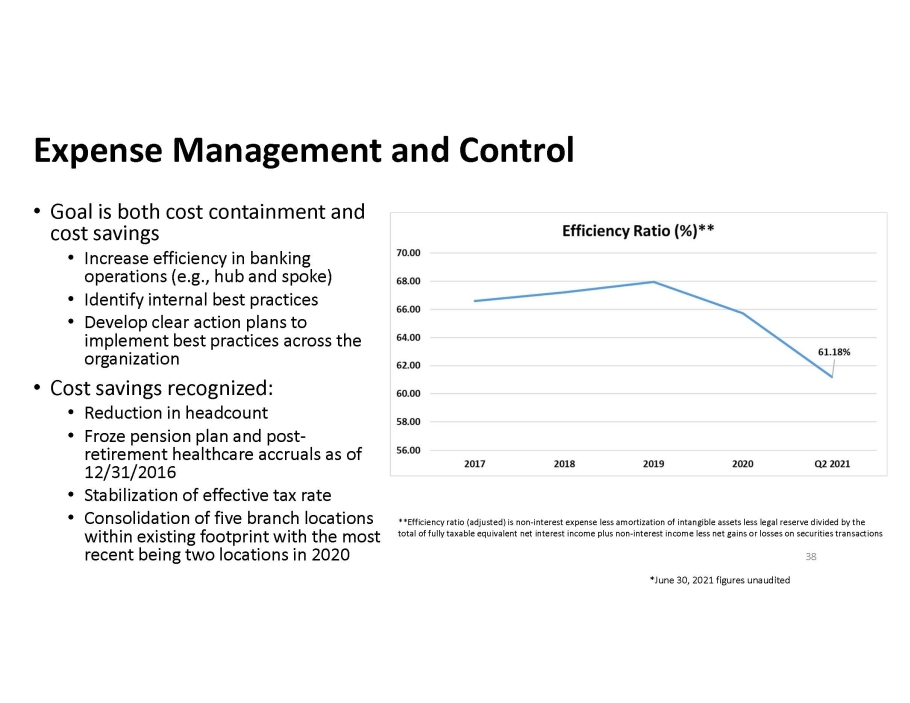
• Goal is both cost containment and cost savings • Increase efficiency in banking operations (e.g., hub and spoke) • Identify internal best practices • Develop clear action plans to implement best practices across the organization • Cost savings recognized: • Reduction in headcount • Froze pension plan and post - retirement healthcare accruals as of 12/31/2016 • Stabilization of effective tax rate • Consolidation of five branch locations within existing footprint with the most recent being two locations in 2020 Expense Management and Control 38 **Efficiency ratio (adjusted) is non - interest expense less amortization of intangible assets less legal reserve divided by the total of fully taxable equivalent net interest income plus non - interest income less net gains or losses on securities transactio ns *June 30, 2021 figures unaudited
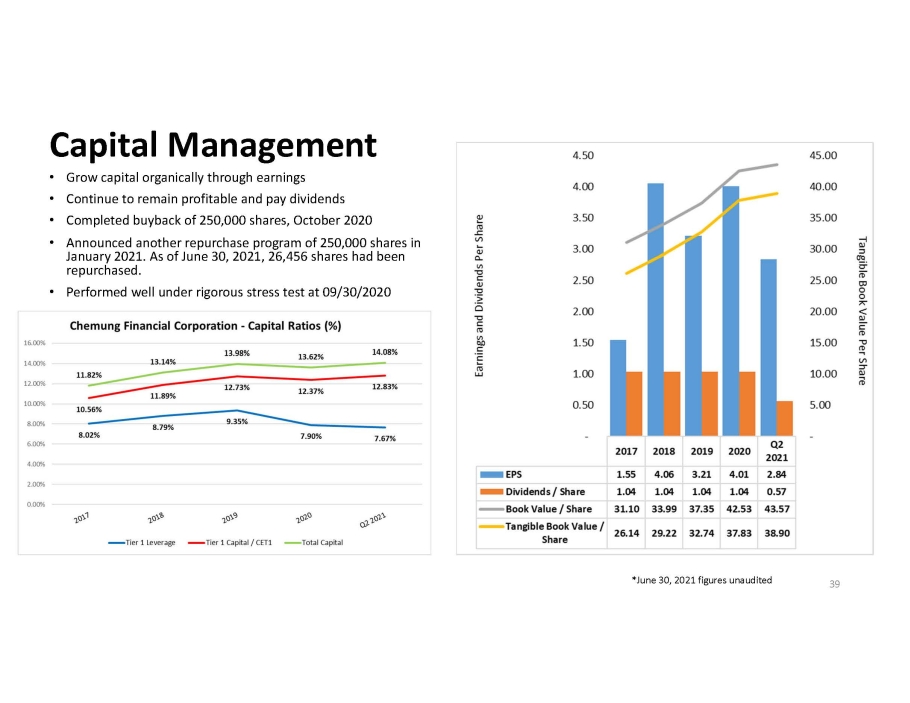
• Grow capital organically through earnings • Continue to remain profitable and pay dividends • Completed buyback of 250,000 shares, October 2020 • Announced another repurchase program of 250,000 shares in January 2021. As of June 30, 2021, 26,456 shares had been repurchased. • Performed well under rigorous stress test at 09/30/2020 Capital Management 39 *June 30, 2021 figures unaudited
• ERM is a Board / Executive Management responsibility guided by our Risk Appetite Statement, supported by our Risk Management Policy, and managed through a Board approved Governance, Risk and Compliance framework • Continuous monitoring of 13 major risk categories (i.e., credit; market and interest rate; earnings; earnings volatility; liquidity capital adequacy; operational; compliance fiduciary and legal; talent and compensation; sustainability; growth and scale; technology and cybersecurity; and environmental, social and governance) as well as emerging risks • Quarterly ERM Dashboard with key performance indicators reported to Enterprise Risk Committee of the Board • ERM is quantitative, incorporating hard indicators with defined risk tolerance triggers requiring immediate response. ERM is also qualitative reviewing strategy, policy and procedure, escalations and incident response. • Risk Assessment is integral to corporate strategy alignment Enterprise Risk Management (ERM) 40
• Listed on Nasdaq Global Select Market • $2.38B in assets • $206.6 market capitalization • Diversified Revenue Stream – 26% Non - Interest Income • Low risk profile – Nonperforming Assets 0.37% of Total Assets • Dividend yield (TTM) – 2.46% • Price to earnings (TTM) – 8.62x • Price to tangible book – 1.14x Investment Considerations* * As of June 30, 2021 (unaudited) 41
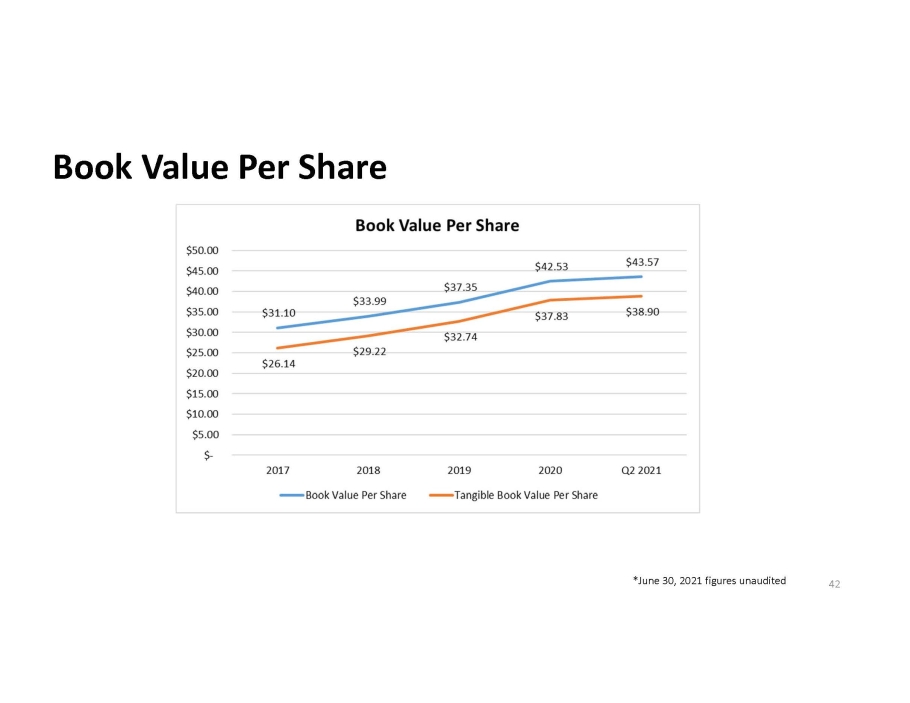
Book Value Per Share 42 *June 30, 2021 figures unaudited
• Strategic growth, through acquisitions and organic performance • Actively looking for acquisition opportunities • Stable low cost of deposits • Growth engine in Capital Region • Strong lending pipeline in new Western New York market • Engaged Corporate Board and Advisory Board • Strong capital base • Competitive dividend • Opportunities to improve efficiencies within the organization to improve earnings • Continue to take a proactive leadership role in the communities we serve Key Takeaways 43
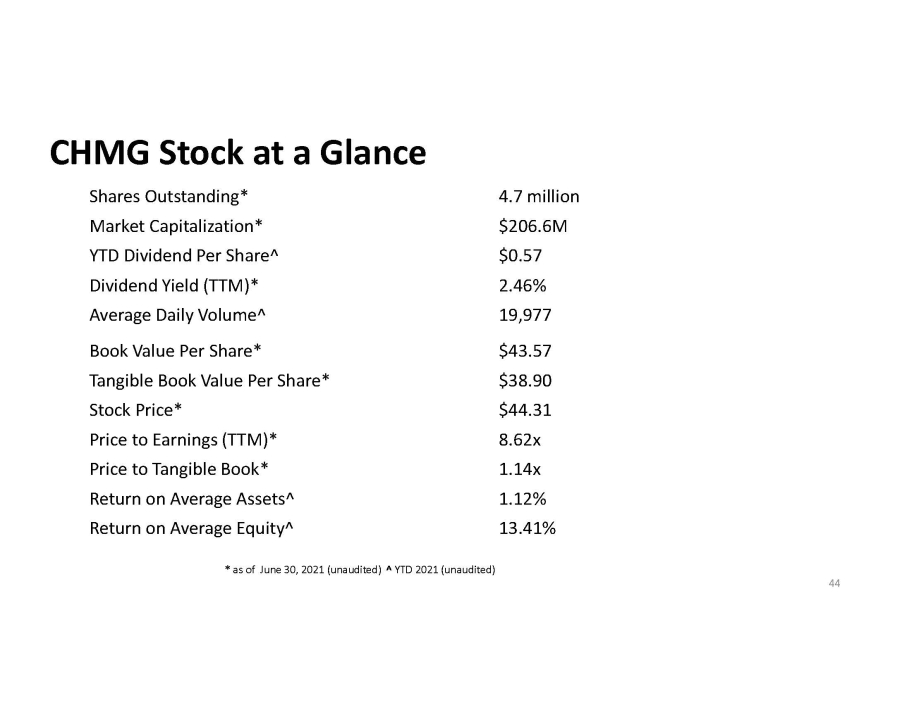
Shares Outstanding* 4.7 million Market Capitalization* $206.6M YTD Dividend Per Share^ $0.57 Dividend Yield (TTM)* 2.46% Average Daily Volume^ 19,977 Book Value Per Share* $43.57 Tangible Book Value Per Share* $38.90 Stock Price* $44.31 Price to Earnings (TTM)* 8.62x Price to Tangible Book* 1.14x Return on Average Assets^ 1.12% Return on Average Equity^ 13.41% CHMG Stock at a Glance * as of June 30, 2021 (unaudited) ^ YTD 2021 (unaudited) 44
45 Anders M. Tomson Karl F. Krebs President & CEO EVP - Chief Financial Officer 518.433.5803 607.737.3714 atomson@chemungcanal.com kkrebs@chemungcanal.com Kathy McKillip - Investor Relations - 607.737.3746 - kmckillip@chemungcanal.com