Attached files
| file | filename |
|---|---|
| 8-K - RELIANT BANCORP, INC. 8-K - Reliant Bancorp, Inc. | a52369570.htm |
Exhibit 99.1

Janney CEO Virtual Forum February 3-4, 2021
Safe Harbor Statements Forward-Looking StatementsAll statements, other than statements of historical
fact, included in this presentation and any oral statements made regarding the subject of this presentation that address activities, events or developments that Reliant Bancorp, Inc. (the “Company”) expects, believes or anticipates will or may
occur in the future are “forward-looking statements” within the meaning of Section 27A of the Securities Act of 1933, as amended, and Section 21E of the Securities Exchange Act of 1934, as amended, and are made pursuant to the safe harbor
provisions of the Private Securities Litigation Reform Act of 1995, including statements relating to the Company upholding its credit quality, the Company's credit quality remaining strong and being a source of strength, the Company having
strong momentum as it enters 2021, management’s optimism about the Company's future, and the Company’s strategy for 2021. The words “believe,” “anticipate,” “expect,” “may,” “will,” “assume,” “should,” “predict,” “could,” “would,” “intend,”
“targets,” “estimates,” “projects,” “plans,” and “potential,” and other similar words and expressions of the future, are intended to identify such forward-looking statements, but other statements not based on historical information may also be
considered forward-looking, including statements about the Company’s future financial and operating results and the Company’s plans, objectives, and intentions. All forward-looking statements are subject to risks, uncertainties, and other
factors that may cause the actual results, performance, or achievements of the Company to differ materially from any results, performance, or achievements expressed or implied by such forward-looking statements. Such risks, uncertainties, and
other factors include, among others: (1) the global health and economic crisis precipitated by the coronavirus (COVID-19) pandemic, (2) actions taken by governments, businesses and individuals in response to the coronavirus (COVID-19) pandemic,
(3) the pace of recovery when the coronavirus (COVID-19) pandemic subsides, (4) the possible recurrence of the coronavirus (COVID-19), (5) changes in political conditions or the legislative or regulatory environment, including governmental
initiatives affecting the financial services industry such as, but not limited to, the Coronavirus Aid, Relief, and Economic Security Act (or CARES Act), (6) the possibility that our asset quality could decline or that we experience greater
loan losses than anticipated, (7) increased levels of other real estate, primarily as a result of foreclosures, (8) the impact of liquidity needs on our results of operations and financial condition, (9) competition from financial institutions
and other financial service providers, (10) the effect of interest rate increases on the cost of deposits, (11) unanticipated weakness in loan demand or loan pricing, (12) greater than anticipated adverse conditions in the national economy or
local economies in which we operate, including in Middle Tennessee, (13) lack of strategic growth opportunities or our failure to execute on available opportunities, (14) deterioration in the financial condition of borrowers resulting in
significant increases in loan losses and provisions for those losses, (15) economic crises and associated credit issues in industries most impacted by the coronavirus (COVID-19) pandemic, including the restaurant, hospitality and retail
sectors, (16) the ability to grow and retain low-cost core deposits and retain large, uninsured deposits, (17) our ability to effectively manage problem credits, (18) our ability to successfully implement efficiency initiatives on time and with
the results projected, (19) our ability to successfully develop and market new products and technology, (20) the impact of negative developments in the financial industry and United States and global capital and credit markets, (21) our ability
to retain the services of key personnel, (22) our ability to adapt to technological changes, (23) risks associated with litigation, including reputational and financial risks and the applicability of insurance coverage, (24) the vulnerability
of Reliant Bank’s computer and information technology systems and networks, and the systems and networks of third parties with whom the Company or Reliant Bank contract, to unauthorized access, computer viruses, phishing schemes, spam attacks,
human error, natural disasters, power loss, and other security breaches and interruptions, (25) changes in state and federal laws, rules, regulations, or policies applicable to banks or bank or financial holding companies, including regulatory
or legislative developments, (26) adverse impacts (including costs, fines, reputational harm, or other negative effects) from current or future litigation, regulatory examinations, or other legal and/or regulatory actions, (27) the risk that
expected cost savings and revenue synergies from (a) the merger of the Company and Tennessee Community Bank Holdings, Inc. ("TCB Holdings") (the “TCB Holdings Transaction”) or (b) the merger of the Company and First Advantage Bancorp ("FABK")
(the “FABK Transaction” and, together with the TCB Holdings Transaction, collectively, the “Transactions”), may not be realized or may take longer than anticipated to be realized, (28) the effect of the Transactions on our customer, supplier,
or employee relationships and operating results (including without limitation difficulties in maintaining relationships with employees and customers), as well as on the market price of the Company’s common stock, (29) the risk that the
businesses and operations of TCB Holdings and its subsidiaries and of FABK and its subsidiaries cannot be successfully integrated with the business and operations of the Company and its subsidiaries or that integration will be more costly or
difficult than expected, (30) the amount of costs, fees, expenses, and charges related to the Transactions, including those arising as a result of unexpected factors or events, (31) reputational risk associated with and the reaction of our
customers, suppliers, employees, or other business partners to the Transactions, (32) the risk associated with Company management’s attention being diverted away from the day-to-day business and operations of the Company to the integration of
the Transactions, and (33) general competitive, economic, political, and market conditions, including economic conditions in the local markets where we operate. Additional factors which could affect the forward-looking statements can be found
in the Company’s annual report on Form 10-K, quarterly reports on Form 10-Q, and current reports on Form 8-K filed with the Securities and Exchange Commission (the “SEC”) and available on the SEC’s website at http://www.sec.gov. The Company
believes the forward-looking statements contained herein are reasonable; however, many of such risks, uncertainties, and other factors are beyond the Company’s ability to control or predict and undue reliance should not be placed on any
forward-looking statements, which are based on current expectations and speak only as of the date that they are made. Therefore, the Company can give no assurance that its future results will be as estimated. The Company does not intend to, and
disclaims any obligation to, update or revise any forward-looking statement. Non-GAAP Financial MeasuresThis presentation contains certain financial measures that are not measures recognized under generally accepted accounting principles
(“GAAP”) and, therefore, are considered non-GAAP financial measures. Members of Company management use these non-GAAP financial measures in their analysis of the Company’s performance, financial condition, and efficiency of operations.
Management of the Company believes that these non-GAAP financial measures provide a greater understanding of ongoing operations, enhance comparability of results with prior periods, and demonstrate the effects of significant gains and charges
in the periods presented. Management of the Company also believes that investors find these non-GAAP financial measures useful as they assist investors in understanding underlying operating performance and identifying and analyzing ongoing
operating trends. However, the non-GAAP financial measures discussed herein should not be considered in isolation or as a substitute for the most directly comparable or other financial measures calculated in accordance with GAAP. Moreover, the
manner in which the non-GAAP financial measures discussed herein are calculated may differ from the manner in which measures with similar names are calculated by other companies. You should understand how other companies calculate their
financial measures similar to, or with names similar to, the non-GAAP financial measures we have discussed herein when comparing such non-GAAP financial measures.The non-GAAP measures in this presentation include “adjusted net interest margin
(NIM),” “bank segment adjusted efficiency ratio,” “allowance for loan losses plus unaccreted purchased loan discounts to total loans,” “adjusted pre-tax pre-provision income,” “return on average tangible common equity (ROATCE),“ “tangible book
value per common share (TBVPS),“ “tangible common equity to tangible assets (TCE/TA),” “bank segment adjusted net income,” “bank segment adjusted noninterest expense,” “adjusted diluted earnings per share (EPS),” “adjusted annualized return on
average assets (ROAA),” and “adjusted annualized return on average tangible common equity (ROATCE).” 1

Why Reliant? High Growth, Desirable MarketsFocused, Balanced Business ModelOpportunistic
AcquisitionsOrganic, In-Market Loan & Deposit Growth Balanced, Sustainable GrowthDisciplined Approach to PricingMargin OptimizationFocus on Expense Management Strong Corporate GovernanceExperienced, Consistent LeadershipStable, Diverse
WorkforceClient Focused Service Scalability of ModelDisciplined Credit CultureConservative Loan Reserves and Purchase DiscountsWell Capitalized Strategic Focus Company Culture Profitability and Growth Financial Strength 2 2

Experienced, Committed Leadership Team 3 Source: S&P Global Market Intelligence DeVan Ard, Jr.
Chairman and CEO Former Area Executive in Middle Tennessee at AmSouth Bank Founder of Reliant Bank in 2006 39 years of banking experience / 15 years at RBNC / 21 years in Middle TN Jerry CookseyEVP, Chief Financial Officer 30
years of banking experience / 8 years at FABK/RNBC / 8 years in Middle TN Alan MimsEVP, Chief Credit Officer Bill FitzgeraldEVP, Chief Risk Officer Kim YorkEVP, Chief Strategy Officer John R. WilsonPresident Executive
Vice President – Chief Credit Officer since December 2017Former Senior Examiner and Case Manager for the Federal Reserve Bank of Atlanta 30 years of banking experience / 3 years at RBNC / 3 years in Middle TN Former Banking Group Audit
Partner for Carr, Riggs & Ingram, LLCHolds CPA, CRMA & CFSA Professional Designations 35 Years of accounting and risk experience / 35 Years in Middle TN 31 years of banking experience / 15 years at RBNC / 30 years in Middle
TN Executive Vice President – Chief Strategy Officer since March 2017Former Senior Vice President and Chief Marketing Officer at Ascend Federal Credit Union 24 years of banking experience / 3 years at RBNC / 24 years in Middle
TN Former Chief Lending Officer of Reliant BankFormer Spring Hill Market President for Cumberland Bank Mark RymanEVP, Chief Lending Officer Former CFO of First Advantage Bancorp and First Advantage BankTransitioned to
Reliant Bank as Chief Administrative Officer prior to assuming CFO role. 34 years of banking experience / 15 years at RNBC / 34 years in Middle TN Former Davidson & Williamson Counties Market President of Reliant BankHeld various roles
with First American Bank, Bank of Nashville & Premier Bank of Brentwood

Digital Channel Initiatives EmployeesEnsuring Health and Safety of our Team
Members CommunitiesHelping the Communities we Serve CommunitiesHelping the Communities we Serve CommunitiesHelping the Communities we Serve Seek opportunities to improve digital channel interactions through diversified
improvements in new technologies. Expand and Invest in Digital Channels Augment telephone software with new contact center software.Service client support calls through the new centralized contact center. Offer live chat, email and SMS
support leveraging the call center through all digital channels; website, online banking, mobile app, search engine interactions and social media.Service online loan payment platform for all consumer loan types. Pivot branch service to focus on
sales, not support. Tight integration into contact center with a focus on creating a personalized sales and service experience to web visitors. Leverage new web technologies to improve speed and performance through scalable content
interactions.Optimize the new website for personalized interactions, improvements to SEO and with a focus on lead generation for new accounts. Implement appointment booking software with deep integration into existing technologies. Offer
appointment booking through owned digital properties such as website and the mobile app as well as through Google search and social media, allowing customers to choose their point of interaction. Implement lobby queue management to increase
staff efficiency and promote branch sales and new account generation. Stand-up Contact Center Redesign and relaunch website. Support by-appointment branch model AI Chatbot with capability to integrate into existing and new platforms.Video
chat support leveraging contact center to create new digital experiences. Begin discovery for next phase 4

Digital Channel Usage 10.8% Mobile DepositsTotal Items 14,929 vs 16,541Q4 2019 vs Q4
2020 7.5% Mobile DepositsTotal Dollars $12,116,363,84 vs $13,022,222.62Q4 2019 vs Q4 2020 8.1% Customer ATM UsageTotal Items 87,910 vs 80,747Q4 2019 vs Q4 2020 7.3% Customer ATM UsageTotal Dollars $13,066,990.83 vs
$14,025,359.60Q4 2019 vs Q4 2020 39.4% Online TransfersTotal Items 105,160 vs 146,637Q4 2019 vs Q4 2020 40.9% Online TransfersTotal Dollars $446,898,406.99 vs $629,501,476.02Q4 2019 vs Q4 2020 3.2% Debit Card UsageTotal
Items 2,224,705 vs 2,296,409Q4 2019 vs Q4 2020 12.6% Debit Card UsageTotal Dollars $88,391,932.63 vs $99,569,770.53Q4 2019 vs Q4 2020 6.3% Branch TransactionsTotal Capture 484,541 vs 454,035Q4 2019 vs Q4 2020 7.6% Branch
TransactionsTotal Transactions 670,916 vs 619,673Q4 2019 vs Q4 2020 5

Reliant Bank Franchise Overview Commercially-oriented bank headquartered in Brentwood, Tennessee Focused
on fast-growing Middle Tennessee markets and the acquisitions of Tennessee Community Bank Holdings, Inc and First Advantage Bancorp(1)2nd largest community bank(2) by deposits headquartered in the Nashville MSA and 10th largest bank by deposits
in TennesseeConcentrated on building in-market banking relationships; 82% of top 50 loan relationships have related deposits at the bankExperienced management team with extensive local market knowledge7.7% insider ownership among management and
the board of directors Q4 ‘20 Financial Summary Key Franchise Highlights Source: S&P Global Market Intelligence, Factset Financial data as of or for the three months ended 6/30/20; ownership data as of 1/25/21; pricing data as of
1/25/21Completed on January 1, 2020 and April 1, 2020 respectivelyCommunity bank defined as institutions with total assets less than $10 billionNon-GAAP figures. Refer to appendix for “reconciliation of non-GAAP financial measures” Pro Forma
Branch Network RBNC Branches (27) (3) (3) RBNC LPO (1) 6 Market Information Price Per Share (1/25/21) $20.59 Market Cap. ($mm) $343 Price / Tang. Book 134 % Price / '20
EPS 10.2 x Balance Sheet ($mm) Total Assets $3,027 Loans Held for Investment 2,301 Deposits 2,579 Tangible Common Equity 256 Loans Held for Investment / Deposits 89.2 % MRQ Profitability Reported
ROAA 1.60 % ROATCE 19.38 % Asset Quality NPAs / Loans + OREO 0.40 % Reserves / NPLs 344.7 Reserves / Loans Held for Investment 0.90 Capital Ratios - RBNC Tang. Com. Equity / Tang. Assets 8.7 % Leverage Ratio 8.9 CET1
Ratio 10.2 Tier 1 Capital Ratio 10.7 Total Capital Ratio 14.0 Loan Concentration C&D Loans / Total Bank Capital 101 % CRE Loans / Total Bank Capital 284

Source: S&P Global Market Intelligence; Company Filings 2006 Our History Total
Assets($mm) RBNC Commerce Union Bank 1/9/2006Reliant Bank established 4/28/2014Commerce Union and Reliant announce merger of equals 7/7/2015Stock (ticker symbol CUBN) begins trading on
Nasdaq 2006 2014 2017 2018 8/14/2006Commerce Union Bank established 4/1/2015Commerce Union and Reliant close merger. $791 million in assets 6/30/2017Surpassed$1 billion inassets 12/31/2017Officially rebranded as Reliant Bancorp,
Inc. 2006 2015 2019 1/1/2018Completed acquisition of Community First 10/22/2018Opened Chattanooga branch 9/16/2019Announced acquisition of Tennessee Community Bank Holdings 10/23/2019Announcedacquisition ofFirst Advantage
Bancorp 8/23/2017Announced acquisition of Community First & $25 million Private
Placement 2007 2008 2009 2010 2011 2012 2013 2014 2015 2016 2017 2018 2019 $111 $205 $317 $382 $379 $363 $385 $385 $450 $35 $98 $133 $148 $187 $209 $232 $253 $296 $876 $912 $1,125 $1,724 $1,898 2020 1/1/2020Completed
acquisition of Tennessee Community Bank Holdings 04/01/2020Completed acquisition of First Advantage Bancorp 2020 $3,027 7

Q4 2020 Financial Highlights & Results Financial Highlights Financial Results Note: Non-GAAP
measure. Refer to appendix for “reconciliation of non-GAAP financial measures.”Annualized. Consistent earnings growth; Diluted EPS for the quarter increased 97% year-over-year to $0.73.Quarterly net income included $2.8 million of
pre-tax, net purchase accounting accretion ($0.12 increase to Diluted EPS).Adjusted NIM(1) increased 73 bps to 4.09% year over year and 11 bps from the linked quarter in the midst of a challenging interest rate environment.Loans held for
investment declined 2% from the linked quarter. However, loan yields, excluding purchase accounting accretion, increased 4 bps over the linked quarter.Noninterest-bearing demand deposits continued to grow faster than overall deposits,
accounting for 22% of all deposits at December 31, 2020. Cost of funds declined 7 bps from the linked quarter to 0.72%.Bank segment adjusted efficiency ratio, has improved 25% over the prior year to 47.2% for the fourth quarter as we continue
to leverage our expense base and grow income.Asset quality metrics remain strong.Allowance for loan loss and unaccreted purchased loan discounts comprised 1.62% of total loans, at December 31, 2020. Charge-offs during the quarter were
minimal.Liquidity and capital levels provide a solid foundation for future growth.Noninterest income during the quarter (BOLI proceeds) provided the opportunity to a) restructure our balance sheet, improving future NIM and, b) accelerate
projects and related expenses into 2020, improving our infrastructure and future expense run rate. $ in millions, except per share data Profitability (Q4’20): Net Income $ 12.2 Adjusted Pre-tax Pre-provision
Income(1) $ 17.3 Diluted EPS $ 0.73 ROAA (2) 1.60 % ROAE (2) 15.48 % ROATCE (1,2) 19.38 % Efficiency Ratio 54.9 % Bank Segment Adjusted Efficiency Ratio (1) 47.2 % Net Interest Margin 4.48 % Adjusted Net
Interest Margin (1) 4.09 % Balance Sheet (12/31/20): Total Loans $ 2,301 Total Deposits $ 2,579 TBVPS (1) $ 15.39 TCE/TA (1) 8.65 % Asset Quality (12/31/20): NPAs to Total Assets 0.31 % Net
Charge-Offs (Recoveries) to Average Loans(2) 0.03 % Allowance for Loan Loss to Total Loans 0.90 % 8

Nashville MSA Deposit Market Share Top 25 Deposit Market Share Note: Dollars in millions; Deposit
market share data as of 12/31/20Source: S&P Global Market IntelligenceCommunity bank defined as an institution with less than $10 billion in total assets 9

Clarksville MSA Deposit Market Share Top Deposit Market Share Note: Dollars in millions; Deposit market
share data as of 12/31/20Source: S&P Global Market IntelligenceCommunity bank defined as an institution with less than $10 billion in total assets 10
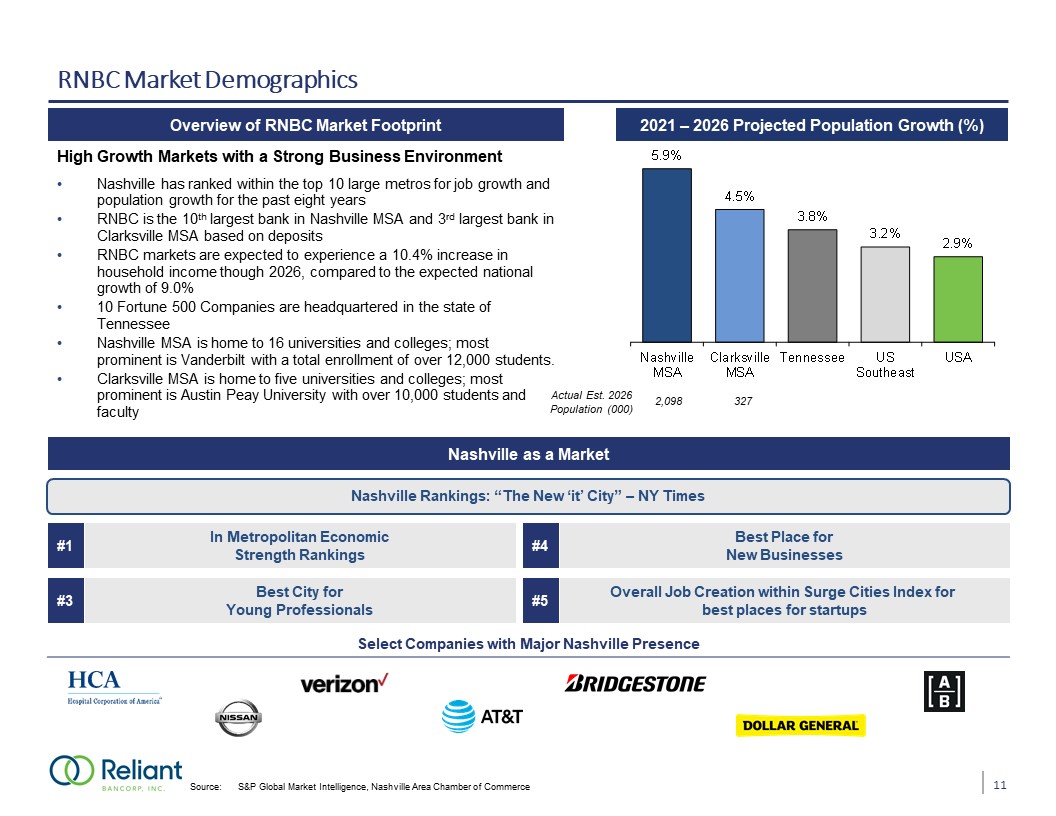
RNBC Market Demographics Overview of RNBC Market Footprint High Growth Markets with a Strong Business
Environment Nashville has ranked within the top 10 large metros for job growth and population growth for the past eight yearsRNBC is the 10th largest bank in Nashville MSA and 3rd largest bank in Clarksville MSA based on depositsRNBC markets
are expected to experience a 10.4% increase in household income though 2026, compared to the expected national growth of 9.0%10 Fortune 500 Companies are headquartered in the state of TennesseeNashville MSA is home to 16 universities and
colleges; most prominent is Vanderbilt with a total enrollment of over 12,000 students.Clarksville MSA is home to five universities and colleges; most prominent is Austin Peay University with over 10,000 students and faculty 2021 – 2026
Projected Population Growth (%) Source: S&P Global Market Intelligence, Nashville Area Chamber of Commerce Nashville Rankings: “The New ‘it’ City” – NY Times #1 In Metropolitan EconomicStrength Rankings #4 Best Place forNew
Businesses #3 Best City forYoung Professionals #5 Overall Job Creation within Surge Cities Index for best places for startups Select Companies with Major Nashville Presence Nashville as a Market Actual Est. 2026 Population
(000) 2,098 327 11

Bank Segment Performance Continues to Improve Bank Segment - Adjusted Net Income (1, 2) Note: $ in
millions, unless otherwise specified. Data as of or for the three months ended each respective quarter or twelve months ended each respective year. The Bank Segment includes all entities included in the Consolidated Financial Statements other
than Reliant Mortgage Ventures, LLC.Non-GAAP measure. Refer to appendix for “reconciliation of non-GAAP financial measures.” Bank Segment - Adjusted Noninterest Expense (1, 2) 51.8% 12
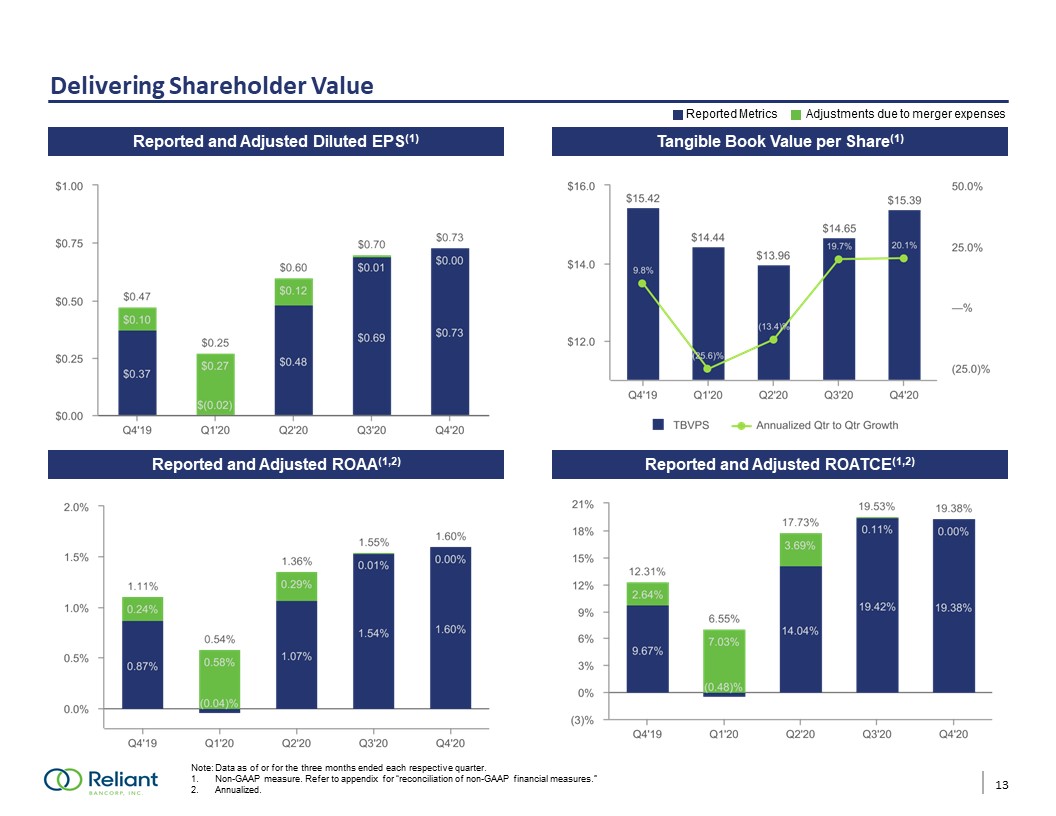
Delivering Shareholder Value Reported and Adjusted Diluted EPS(1) Tangible Book Value per
Share(1) Reported and Adjusted ROAA(1,2) Reported and Adjusted ROATCE(1,2) Note: Data as of or for the three months ended each respective quarter. 1. Non-GAAP measure. Refer to appendix for “reconciliation of non-GAAP financial measures.”2.
Annualized. Reported Metrics Adjustments due to merger expenses 13

Balancing Growth and Profitability Coupon + Fees: Loan Portfolio (1) Note: $ in
millions, unless otherwise specified. Data as of or for the three months ended each respective quarter or twelve months ended each respective year. Does not include loans held for sale. Increase in Manufactured Housing loans due to acquisition
of First Advantage Bank. Increase in PPP loans due to government stimulus program. Loan Yields (2) 4.67 % 4.66 % 4.96 % 5.15 % 5.10 % 5.02 % 5.10 % 5.11 % 5.13 % CAGR: 36.3% 14
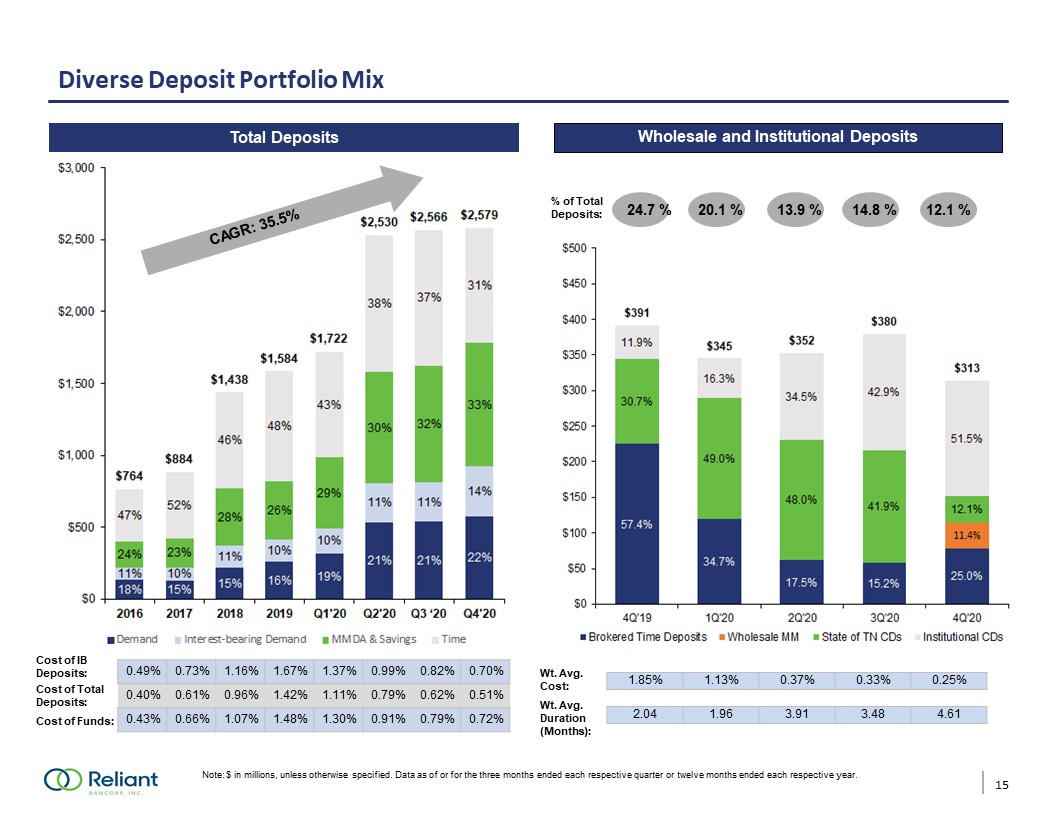
Diverse Deposit Portfolio Mix Cost of IB Deposits: Cost of Funds: Note: $ in millions, unless
otherwise specified. Data as of or for the three months ended each respective quarter or twelve months ended each respective year. Wholesale and Institutional
Deposits 0.49% 0.73% 1.16% 1.67% 1.37% 0.99% 0.82% 0.70% 0.40% 0.61% 0.96% 1.42% 1.11% 0.79% 0.62% 0.51% 0.43% 0.66% 1.07% 1.48% 1.30% 0.91% 0.79% 0.72% Total Deposits % of Total Deposits: Wt. Avg.
Cost: Wt. Avg. Duration (Months): 1.85% 1.13% 0.37% 0.33% 0.25% 2.04 1.96 3.91 3.48 4.61 Cost of Total Deposits: 24.7 % 20.1 % 13.9 % 14.8 % 12.1 % CAGR: 35.5% 15
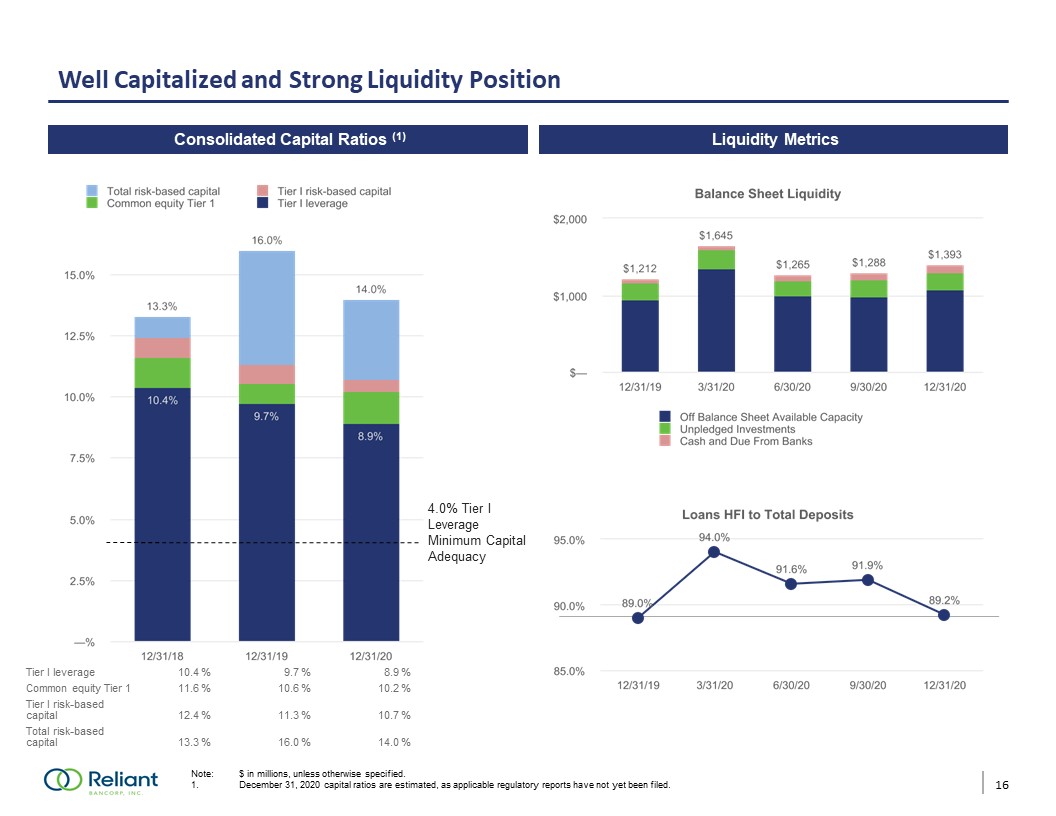
Well Capitalized and Strong Liquidity Position Note: $ in millions, unless otherwise specified. December
31, 2020 capital ratios are estimated, as applicable regulatory reports have not yet been filed. Liquidity Sources Mar-20 Jun-20 Sep-20 Consolidated Capital Ratios (1) 4.0% Tier I Leverage Minimum Capital Adequacy Liquidity
Metrics Tier I leverage 10.4 % 9.7 % 8.9 % Common equity Tier 1 11.6 % 10.6 % 10.2 % Tier I risk-based capital 12.4 % 11.3 % 10.7 % Total risk-based capital 13.3 % 16.0 % 14.0 % 16

Disciplined Credit Culture Allowance for Loan Loss + Purchase Discounts(1) Net Charge-Offs (Recoveries)
/ Average Loans(2) Nonperforming Assets / Total Assets Note: Data as of or for the three months ended each respective quarter.Non-GAAP measure. Refer to appendix for “reconciliation of non-GAAP financial measures.”Data has been annualized
17 Criticized + Classified Loans / Gross Loans

Diversified CRE Portfolio C&D Portfolio Commercial Real Estate Portfolio Note: $ in millions,
unless otherwise specified. Data as of or for the three months ended each respective quarter. 124% 120% 99% 105% 101% 198% 199% 204% 192% 183% Outstanding balance as a % of Total Capital 18

Hospitality Portfolio – Granular Portfolio with Conservative Credit Profile Note: Data as of or for the
three months ended December 31, 2020 (1) Represents committed loan amount. Local vs. National (1) Term vs. Construction (1) Portfolio Highlights Hotel Flags (1) 4.86% of Total Portfolio(1)Portfolio totals as of Q4 ’20: Term: $95.1 million,
32 borrowers with an average loan size of $3.5 millionConstruction: 5 projects totaling $45.2 million with $16.7 million fundedPrimarily limited-service national franchisesStrong LTVs and DSCRsWeighted average LTV – 58.61% Weighted average DSCR
– 2.19xNo nonperforming loans in segmentNo charge-offs in categories in 2019 or 2020Average seasoning of 61 monthsAll secured by first liens on real estate and FFE (Pre-Covid-19) ($mm) Term Construction Total
Oustanding $95.1 $16.7 Total Committed $95.1 $45.2 Avg. LTV 62.10 % 54.41 % ($mm) Local National Total Oustanding $7.6 $104.2 Total Committed $7.6 $132.7 Avg.
LTV 62.84 % 59.42 % Avg. DSCR 1.35x 1.62x ($mm) Full Portfolio Total Oustanding $111.8 Total Committed $140.3 Total Entities 32 Average Exposure per Entity $4.4 19
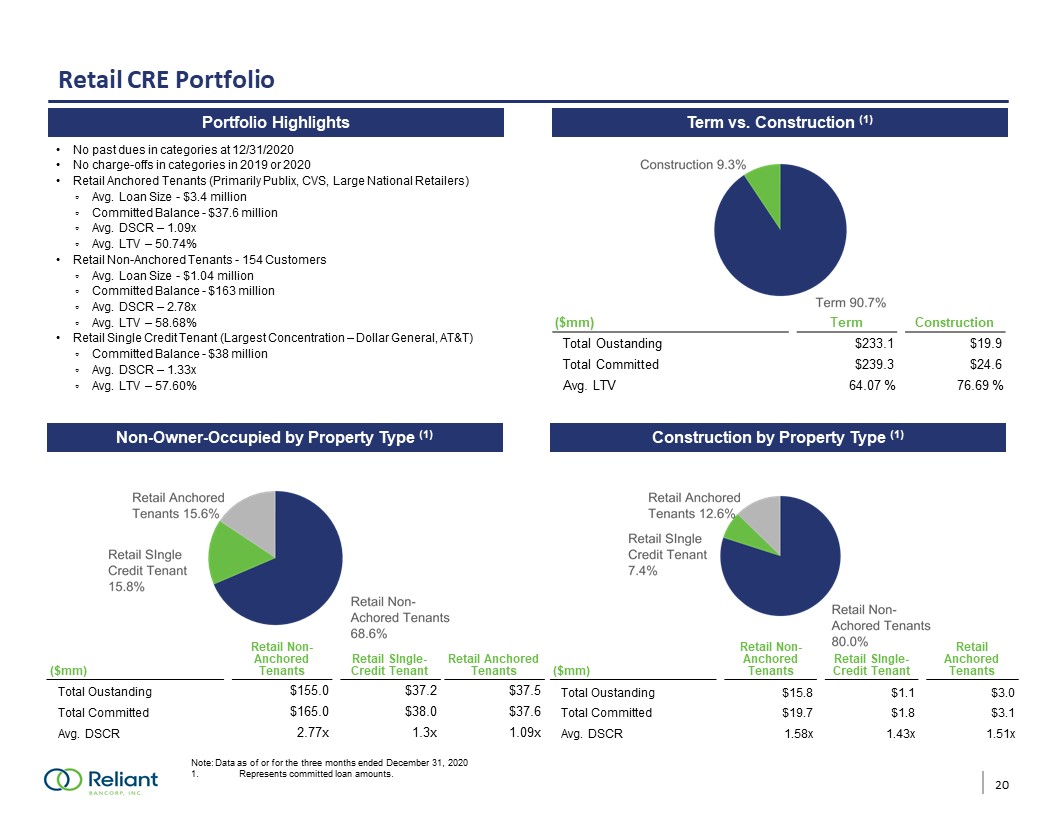
Retail CRE Portfolio Note: Data as of or for the three months ended December 31, 2020 Represents
committed loan amounts. Total $93.7 million Total $124.4 million Portfolio Statistics Burger King Non-Owner-Occupied by Property Type (1) Term vs. Construction (1) Portfolio Highlights Construction by Property Type (1) No past dues in
categories at 12/31/2020No charge-offs in categories in 2019 or 2020Retail Anchored Tenants (Primarily Publix, CVS, Large National Retailers) Avg. Loan Size - $3.4 million Committed Balance - $37.6 millionAvg. DSCR – 1.09xAvg. LTV –
50.74%Retail Non-Anchored Tenants - 154 CustomersAvg. Loan Size - $1.04 million Committed Balance - $163 millionAvg. DSCR – 2.78xAvg. LTV – 58.68%Retail Single Credit Tenant (Largest Concentration – Dollar General, AT&T)Committed Balance -
$38 million Avg. DSCR – 1.33xAvg. LTV – 57.60% DSCR and ‘Other’ brand numbers under progress Show % of total Show % of total TBU TBU – Restaurant Data ($mm) Term Construction Total Oustanding $233.1 $19.9 Total
Committed $239.3 $24.6 Avg. LTV 64.07 % 76.69 % ($mm) Retail Non-Anchored Tenants Retail SIngle-Credit Tenant Retail Anchored Tenants Total Oustanding $155.0 $37.2 $37.5 Total
Committed $165.0 $38.0 $37.6 Avg. DSCR 2.77x 1.3x 1.09x ($mm) Retail Non-Anchored Tenants Retail SIngle-Credit Tenant Retail Anchored Tenants Total Oustanding $15.8 $1.1 $3.0 Total
Committed $19.7 $1.8 $3.1 Avg. DSCR 1.58x 1.43x 1.51x 20

Top Loan Portfolio Segments 21
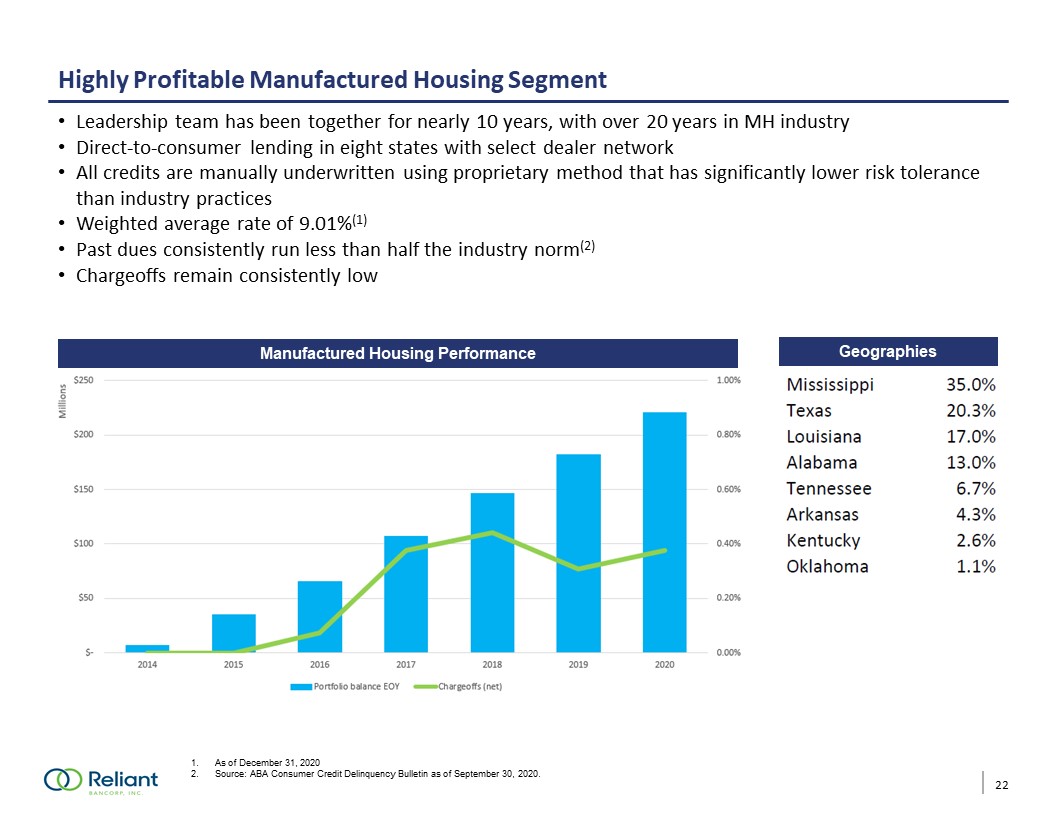
Highly Profitable Manufactured Housing Segment 22 Leadership team has been together for nearly 10
years, with over 20 years in MH industryDirect-to-consumer lending in eight states with select dealer networkAll credits are manually underwritten using proprietary method that has significantly lower risk tolerance than industry
practicesWeighted average rate of 9.01%(1)Past dues consistently run less than half the industry norm(2)Chargeoffs remain consistently low As of December 31, 2020Source: ABA Consumer Credit Delinquency Bulletin as of September 30,
2020. Manufactured Housing Performance Geographies

Providing Relief to Customers - Loan Modifications Modification levels subsided substantially in the
third and fourth quarter ($ in thousands) Initial Modification Request through May 31, 2020 Second Modification Requests through September 30, 2020 Second Modification Requests through December 31,
2020 Amount % of Total Amount % of Total Amount % of Total C&I $ 34,851 1.5 % $ 6,095 0.3 % $ 96 — % Church / Consumer /
Medical 24,809 1.1 % — — % — — % CRE 291,232 12.9 % 1,916 0.1 % 1,400 0.1 % Hospitality 96,047 4.3 % 15,993 0.7 % 21,179 0.9 % Multifamily
14,757 0.7 % — — % — — % Restaurant 54,067 2.4 % — — % — — % Manufactured Housing 14,887 0.7 % — — % 329 — % Total
Modifications $ 530,650 23.6 % $ 24,004 1.1 % $ 23,004 1.0 % Portfolio Totals at Each Period End $ 2,258,390 $ 2,338,064 $ 2,300,783 23

Our Strategy for 2021 Hire selectively to prepare for future growthBuild out and optimize digital
channel - the following initiatives are part of our digital roadmap:Branch appointment booking and lobby queue management that is integrated into the website, online banking and the mobile appCustomer support using chat and SMS integrated into
the website, online banking and the mobile appA full redesign of the website with a focus on personalized interactionsPursue coveted M&A opportunitiesOngoing focus on asset quality, organic earning-asset generation, and improved funding
mixLeverage market presence in new markets as well as markets gained through acquisitionsBranch transformation projectNoninterest expense control 24

Appendix

Reconciliation of Non-GAAP Financial Measures 26

Reconciliation of Non-GAAP Financial Measures (Dollars in thousands, except per share data) December
31, 2020 September 30, 2020 June 30, 2020 March 31, 2020 December 31, 2019 Tangible common equity to tangible assets: Tangible common
equity: Total shareholders' equity $ 321,972 $ 307,086 $ 295,543 $ 234,672 $ 223,753 Less: intangible
assets (65,743 ) (63,326 ) (63,351 ) (61,209 ) (50,912 ) Tangible common equity $ 256,229 $ 243,760 $ 232,192 $ 173,463 $ 172,841 Tangible
assets: Total assets $ 3,026,535 $ 3,044,512 $ 2,991,612 $ 2,177,788 $ 1,901,842 Less: intangible
assets (65,743 ) (63,326 ) (63,351 ) (61,209 ) (50,912 ) Tangible assets $ 2,960,792 $ 2,981,186 $ 2,928,261 $ 2,116,579 $ 1,850,930 Tangible common equity to tangible
assets: 8.65 % 8.18 % 7.93 % 8.20 % 9.34 % Tangible book value per share: Tangible common
equity $ 256,229 $ 243,760 $ 232,192 $ 173,463 $ 172,841 Total shares of common stock oustanding 16,654,409 16,634,572 16,631,604 12,014,495 11,206,254 Tangible book value per
share $ 15.39 $ 14.65 $ 13.96 $ 14.44 $ 15.42 Allowance for loan losses plus unaccreted loan purchase discounts: Allowance for loan
losses $ 20,636 $ 19,834 $ 18,237 $ 15,121 $ 12,578 Unaccreted loan purchase discounts 16,634 18,939 21,939 4,586 2,909 Allowance for loan losses plus unaccreted loan purchase
discounts: $ 37,270 $ 38,773 $ 40,176 $ 19,707 $ 15,487 Total loans 2,300,783 2,357,898 2,317,324 1,619,703 1,409,952 Allowance for loan losses plus unaccreted purchased loan
discounts to total loans 1.62 % 1.64 % 1.73 % 1.22 % 1.10 % 27

Segment Income Statements & Reconciliation of Non-GAAP Financial Measures 28