Attached files
| file | filename |
|---|---|
| EX-99.1 - EXHIBIT 99.1 - Reliant Bancorp, Inc. | a52311692ex99_1.htm |
| 8-K - RELIANT BANCORP, INC. 8-K - Reliant Bancorp, Inc. | a52311692.htm |
Exhibit 99.2
Q3 2020 Earnings Presentation October 23, 2020

Safe Harbor Statements Forward-Looking StatementsAll statements, other than statements of historical fact,
included in this presentation and any oral statements made regarding the subject matter of this presentation that address activities, events, or developments that Reliant Bancorp, Inc. (“Reliant” or the “Company”) expects, believes, or
anticipates will or may occur in the future are “forward-looking statements” within the meaning of Section 27A of the Securities Act of 1933, as amended, and Section 21E of the Securities Exchange Act of 1934, as amended, and are made pursuant to
the safe harbor provisions of the Private Securities Litigation Reform Act of 1995, including statements relating to the Company’s response to the coronavirus (COVID-19) pandemic and the Company’s strategy for 2020. The words “believe,”
“anticipate,” “expect,” “may,” “will,” “assume,” “should,” “predict,” “could,” “would,” “intend,” “targets,” “estimates,” “projects,” “plans,” and “potential,” and other similar words and expressions of the future, are intended to identify such
forward-looking statements, but other statements not based on historical information may also be considered forward-looking, including statements about the Company’s future financial and operating results and the Company’s plans, objectives, and
intentions. All forward-looking statements are subject to risks, uncertainties, and other factors that may cause the actual results, performance, or achievements of the Company to differ materially from any results, performance, or achievements
expressed or implied by such forward-looking statements. Such risks, uncertainties, and other factors include, among others: (1) the global health and economic crisis precipitated by the coronavirus (COVID-19) pandemic, (2) actions taken by
governments, businesses, and individuals in response to the coronavirus (COVID-19) pandemic, (3) the pace of recovery when the coronavirus (COVID-19) pandemic subsides, (4) the possible recurrence of the coronavirus (COVID-19), (5) changes in
political conditions or the legislative or regulatory environment, including governmental initiatives affecting the financial services industry such as, but not limited to, the Coronavirus Aid, Relief, and Economic Security Act, (6) the
possibility that our asset quality could decline or that we experience greater loan losses than anticipated, (7) increased levels of other real estate, primarily as a result of foreclosures, (8) the impact of liquidity needs on our results of
operations and financial condition, (9) competition from financial institutions and other financial service providers, (10) the effect of interest rate increases on the cost of deposits, (11) unanticipated weakness in loan demand or loan pricing,
(12) greater than anticipated adverse conditions in the national economy or local economies in which we operate, including in Middle Tennessee, (13) lack of strategic growth opportunities or our failure to execute on available opportunities, (14)
deterioration in the financial condition of borrowers resulting in significant increases in loan losses and provisions for those losses, (15) economic crises and associated credit issues in industries most impacted by the coronavirus (COVID-19)
pandemic, including the restaurant, hospitality, and retail sectors, (16) the ability to grow and retain low-cost core deposits and retain large, uninsured deposits, (17) our ability to effectively manage problem credits, (18) our ability to
successfully implement efficiency initiatives on time and with the results projected, (19) our ability to successfully develop and market new products and technology, (20) the impact of negative developments in the financial industry and United
States and global capital and credit markets, (21) our ability to attract or retain the services of key personnel, (22) our ability to adapt to technological changes, (23) risks associated with litigation, including reputational and financial
risks and the applicability of insurance coverage, (24) the vulnerability of computers and information technology systems and networks of Reliant Bank (the “Bank”), and the systems and networks of third parties with whom the Company or the Bank
contract, to unauthorized access, computer viruses, phishing schemes, spam attacks, human error, natural disasters, power loss, and other security breaches and interruptions, (25) changes in state and federal laws, rules, regulations, or policies
applicable to banks or bank or financial holding companies, including regulatory or legislative developments, (26) adverse impacts (including costs, fines, reputational harm, and/or other negative effects) from current or future litigation,
regulatory examinations, or other legal and/or regulatory actions, (27) the risk that expected cost savings and revenue synergies from (a) the merger of the Company and Tennessee Community Bank Holdings, Inc. (“TCB Holdings”) (the “TCB Holdings
Transaction”) or (b) the merger of the Company and First Advantage Bancorp (“FABK”) (the “FABK Transaction” and, together with the TCB Holdings Transaction, collectively, the “Transactions”), may not be realized or may take longer than
anticipated to be realized, (28) the effect of the Transactions on our customer, supplier, or employee relationships and operating results (including without limitation difficulties in maintaining relationships with employees and customers), as
well as on the market price of the Company’s common stock, (29) the risk that the businesses and operations of TCB Holdings and its subsidiaries and of FABK and its subsidiaries cannot be successfully integrated with the business and operations
of the Company and its subsidiaries or that integration will be more costly or difficult than expected, (30) the amount of costs, fees, expenses, and charges related to the Transactions, including those arising as a result of unexpected factors
or events, (31) reputational risk associated with and the reaction of our customers, suppliers, employees, or other business partners to the Transactions, (32) the risk associated with Company management’s attention being diverted away from the
day-to-day business and operations of the Company to the integration of the Transactions, and (33) general competitive, economic, political, and market conditions, including economic conditions in the local markets where we operate. Additional
factors which could affect the forward-looking statements can be found in the Company’s annual report on Form 10-K, quarterly reports on Form 10-Q, and current reports on Form 8-K filed with the Securities and Exchange Commission (the “SEC”) and
available on the SEC’s website at http://www.sec.gov. The Company believes the forward-looking statements contained herein are reasonable; however, many of such risks, uncertainties, and other factors are beyond the Company’s ability to control
or predict and undue reliance should not be placed on any forward-looking statements, which are based on current expectations and speak only as of the date that they are made. Therefore, the Company can give no assurance that its future results
will be as estimated. The Company does not intend to, and disclaims any obligation to, update or revise any forward-looking statement. Non-GAAP Financial MeasuresThis presentation contains certain financial measures that are not measures
recognized under U.S. generally accepted accounting principles (“GAAP”) and, therefore, are considered non-GAAP financial measures. Members of the Company’s management use these non-GAAP financial measures in their analysis of the Company’s
performance, financial condition, and efficiency of operations. Management of the Company believes that these non-GAAP financial measures provide a greater understanding of ongoing operations, enhance comparability of results with prior periods,
and demonstrate the effects of significant gains and charges in the current period. Management of the Company also believes that investors find these non-GAAP financial measures useful as they assist investors in understanding underlying
operating performance and the analysis of ongoing operating trends. However, the non-GAAP financial measures discussed herein should not be considered in isolation or as a substitute for the most directly comparable or other financial measures
calculated in accordance with GAAP. Moreover, the manner in which the non-GAAP financial measures discussed herein are calculated may differ from the manner in which measures with similar names are calculated by other companies. You should
understand how other companies calculate their financial measures similar to, or with names similar to, the non-GAAP financial measures we have discussed herein when comparing such non-GAAP financial measures. The non-GAAP financial measures
contained in this presentation include, without limitation, adjusted net income, adjusted return on average assets (adjusted ROAA), average tangible common equity, adjusted return on average tangible common equity (adjusted ROATCE), adjusted
(quarterly) earnings per share, adjusted return on average equity (adjusted ROAE), adjusted net interest rate spread, adjusted net interest margin, tangible assets, tangible common equity, tangible book value per share (TBVPS), tangible common
equity to tangible assets (TCE/TA), return on average tangible common equity (ROATCE), adjusted non-interest expense, adjusted efficiency ratio, and allowance for loan losses plus unaccreted loan purchase discounts. 1
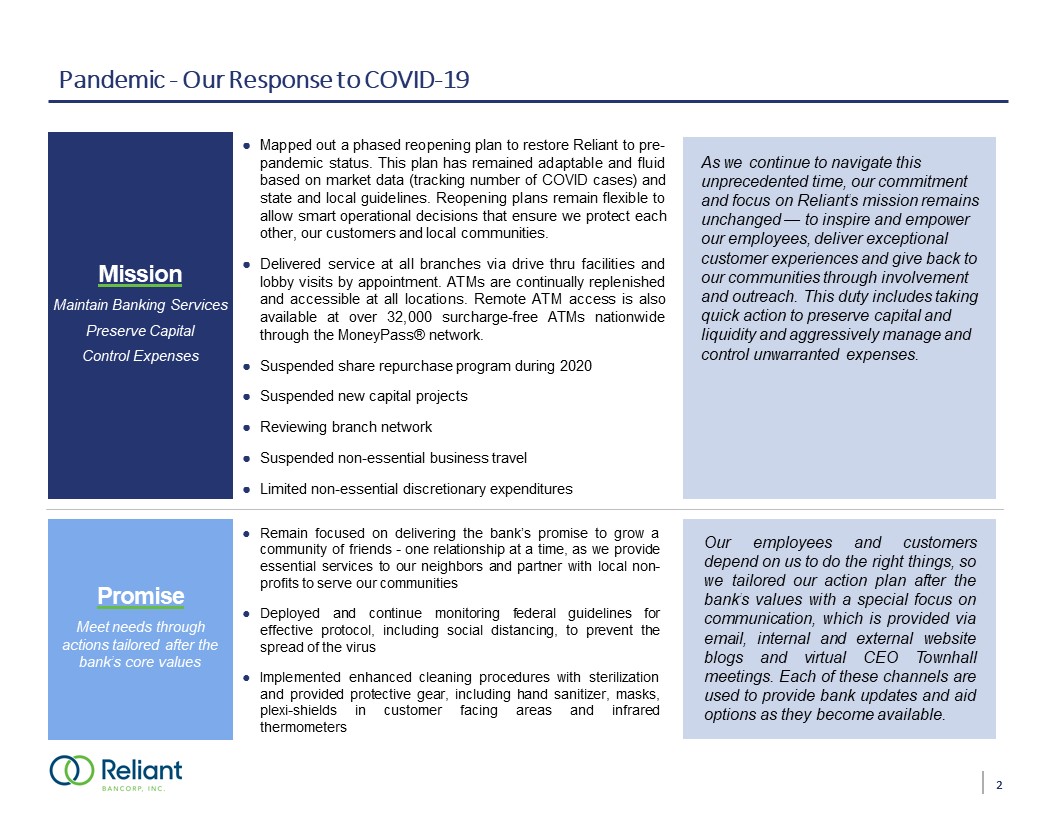
Pandemic - Our Response to COVID-19 EmployeesEnsuring Health and Safety of our Team
Members CommunitiesHelping the Communities we Serve PromiseMeet needs through actions tailored after the bank’s core values MissionMaintain Banking ServicesPreserve Capital Control Expenses CommunitiesHelping the Communities we
Serve CommunitiesHelping the Communities we Serve Remain focused on delivering the bank’s promise to grow a community of friends - one relationship at a time, as we provide essential services to our neighbors and partner with local
non-profits to serve our communitiesDeployed and continue monitoring federal guidelines for effective protocol, including social distancing, to prevent the spread of the virusImplemented enhanced cleaning procedures with sterilization and
provided protective gear, including hand sanitizer, masks, plexi-shields in customer facing areas and infrared thermometers Mapped out a phased reopening plan to restore Reliant to pre-pandemic status. This plan has remained adaptable and fluid
based on market data (tracking number of COVID cases) and state and local guidelines. Reopening plans remain flexible to allow smart operational decisions that ensure we protect each other, our customers and local communities.Delivered service at
all branches via drive thru facilities and lobby visits by appointment. ATMs are continually replenished and accessible at all locations. Remote ATM access is also available at over 32,000 surcharge-free ATMs nationwide through the MoneyPass®
network.Suspended share repurchase program during 2020Suspended new capital projectsReviewing branch networkSuspended non-essential business travelLimited non-essential discretionary expenditures As we continue to navigate this unprecedented
time, our commitment and focus on Reliant’s mission remains unchanged — to inspire and empower our employees, deliver exceptional customer experiences and give back to our communities through involvement and outreach. This duty includes taking
quick action to preserve capital and liquidity and aggressively manage and control unwarranted expenses. Our employees and customers depend on us to do the right things, so we tailored our action plan after the bank’s values with a special focus
on communication, which is provided via email, internal and external website blogs and virtual CEO Townhall meetings. Each of these channels are used to provide bank updates and aid options as they become available. 2 2

Pandemic - Our Response to COVID-19 (Cont’d) EmployeesEnsuring Health and Safety of our Team
Members CommunitiesHelping the Communities we Serve CommunitiesHelping the Communities we Serve CommunitiesHelping the Communities we Serve Adjusted our business model to implement telework for employees whose job
functions can be executed remotely, including virtual meetings using teleconferencing, Teams, Zoom and Go To MeetingReinvented employee training modules for virtual deliveryExtended coverage of First Stop Health Benefit to all employees – even
those not enrolled in Reliant’s group medical plan – to provide virtual medical advice and assistanceEmployees with symptoms or who may have been exposed to the virus are asked to stay home – with full payGifted $500 bonus to each non-executive
employee, in appreciation of the continued efforts to ensure we maintain servicing to our customers and communities during the unprecedented pandemic As a trusted financial advisor, we continue to extend credit and are working directly with our
customers impacted by the COVID-19 pandemic to defer payments, modify loan and repayment terms, assist with overdraft/late fees, provide flexibility with early CD withdrawals and otherwise provide assistance. Promise (cont’d)Meet needs through
actions tailored after the bank’s core values We are serving as a participating lender with SBA’s Paycheck Protection Program (PPP) giving our small business customers access to critical funds. To date, Reliant’s PPP stats reflect: 893 active
PPP borrowers$83,289,903 in PPP loans$3,295,755 in PPP loan feesHardship relief for Reliant credit card holders, including waiver of late fees and the availability of payment deferrals for up to three months. Trusted AdvisorWorking directly with
those impacted by COVID-19 pandemic and providing financial support 24/7 Mobile App Online Banking/Bill Pay 24/7 ATMs Tap-To Pay 24/7 Telephone Banking Debit & Credit Cards 3 3

Pandemic - Our Response to COVID-19 (Cont’d) EmployeesEnsuring Health and Safety of our Team
Members CommunitiesHelping the Communities we Serve CommunitiesHelping the Communities we Serve CommunitiesHelping the Communities we Serve We have increased efforts to educate customers about digital and alternative
options that allow them to bank remotely, including: Trusted Advisor (cont.)Working directly with those impacted by COVID-19 pandemic and providing financial support 24/7 Mobile App Online Banking/Bill Pay 24/7 ATMs Tap-To-Pay 24/7
Telephone Banking Debit & Credit Cards Increased access, education and awareness have resulted in growth in digital channel usage by clients: Mobile Deposits 36.6% Q2 2019* vs Q2 2020** Total Dollars $9,987,467 vs
$13,640,650 Online Transfers 53% Q2 2019* vs Q2 2020** Total Dollars $389,255,454 vs $595,477,186 ATM Deposits 65.3% Q2 2019* vs Q2 2020** Total Dollars $1,864,314 vs $3,081,314 Online Transfers 26.2% Q2 2019* vs Q2
2020** Total Items 97,792 vs 123,363 Mobile Deposits 20.3% Q2 2019* vs Q2 2020** Total Items 14,054 vs 16,912 Branch Transactions 28.1% Q2 2019* vs Q2 2020** Total Items 709,025 vs 509,783 * 2019 Includes figures for
Reliant Bank, Community Bank & Trust and First Advantage Bank.** 2020 Includes figures from the combined bank. 4 4
Financial Highlights & Results Quarterly Highlights for Q3 2020 Financial Results Note: Core figures
exclude mortgage subsidiary financials and one-time merger expenses.Adjusted for merger expenses.Non-GAAP figures. Refer to appendix for “reconciliation of non-GAAP financial measures.”Gross figure, net of unearned income.Bank segment excludes
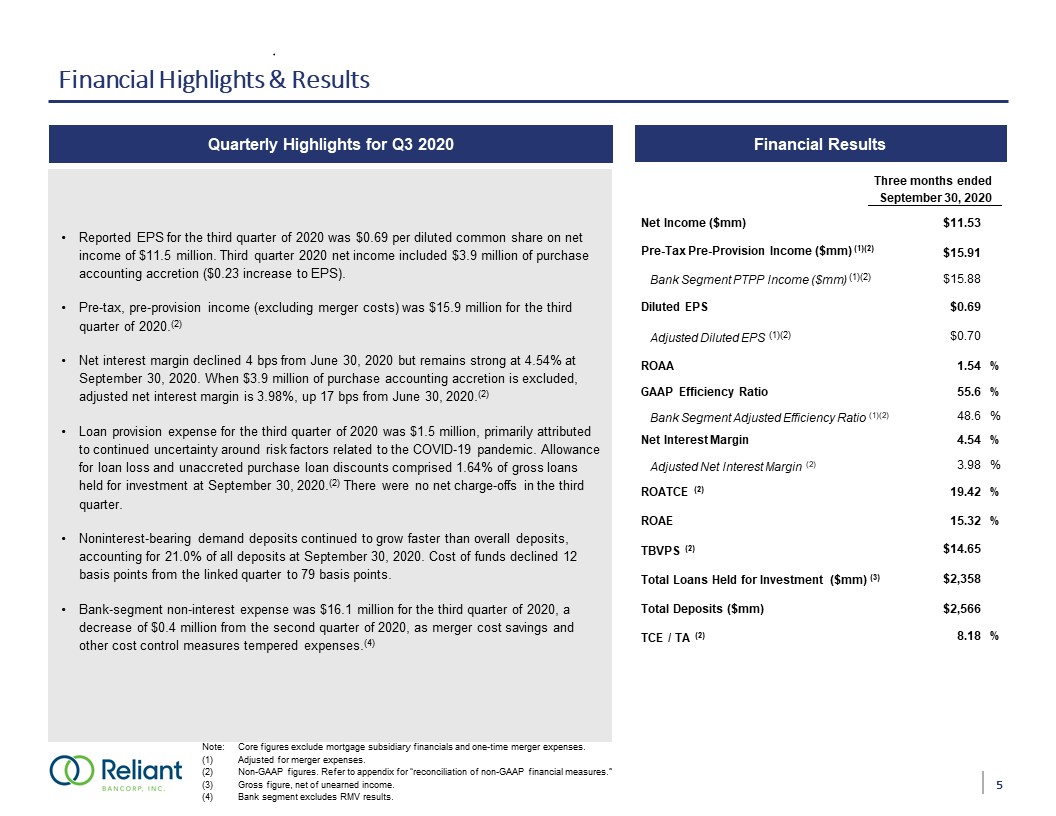
RMV results. 5 Reported EPS for the third quarter of 2020 was $0.69 per diluted common share on net income of $11.5 million. Third quarter 2020 net income included $3.9 million of purchase accounting accretion ($0.23 increase to
EPS).Pre-tax, pre-provision income (excluding merger costs) was $15.9 million for the third quarter of 2020.(2) Net interest margin declined 4 bps from June 30, 2020 but remains strong at 4.54% at September 30, 2020. When $3.9 million of purchase
accounting accretion is excluded, adjusted net interest margin is 3.98%, up 17 bps from June 30, 2020.(2)Loan provision expense for the third quarter of 2020 was $1.5 million, primarily attributed to continued uncertainty around risk factors
related to the COVID-19 pandemic. Allowance for loan loss and unaccreted purchase loan discounts comprised 1.64% of gross loans held for investment at September 30, 2020.(2) There were no net charge-offs in the third quarter.Noninterest-bearing
demand deposits continued to grow faster than overall deposits, accounting for 21.0% of all deposits at September 30, 2020. Cost of funds declined 12 basis points from the linked quarter to 79 basis points.Bank-segment non-interest expense was
$16.1 million for the third quarter of 2020, a decrease of $0.4 million from the second quarter of 2020, as merger cost savings and other cost control measures tempered expenses.(4) Three months ended September 30, 2020 Net Income
($mm) $11.53 Pre-Tax Pre-Provision Income ($mm) (1)(2) $15.91 Bank Segment PTPP Income ($mm) (1)(2) $15.88 Diluted EPS $0.69 Adjusted Diluted EPS (1)(2) $0.70 ROAA 1.54 % GAAP Efficiency Ratio 55.6 % Bank Segment Adjusted
Efficiency Ratio (1)(2) 48.6 % Net Interest Margin 4.54 % Adjusted Net Interest Margin (2) 3.98 % ROATCE (2) 19.42 % ROAE 15.32 % TBVPS (2) $14.65 Total Loans Held for Investment ($mm) (3) $2,358 Total Deposits
($mm) $2,566 TCE / TA (2) 8.18 % 5

Bank Segment Pre-Tax, Pre-Provision Income Continues to Expand Note: $ in thousands, unless
otherwise specified. Data as of or for the three months ended each respective quarter. Adjusted figures exclude RMV results and merger expense. Non-GAAP figures. Refer to appendix for “reconciliation of non-GAAP financial measures.” 6 3Q20 net
interest income includes $3.9 million of purchase accounting accretion. 2Q20 net interest income includes $5.2 million of purchase accounting accretion.2Q20 noninterest income increased by $338 thousand gain on sale of securities and OREO.
Excludes merger expense of $78 thousand in 3Q20, $2.6 million in 2Q20, and $299 thousand in 3Q19Q2 20 NIE increased by FABK acquisition increasing salary expense, occupancy and IT costs 6 % Change from
30-Sep-20 30-Jun-20 30-Sep-19 Highlights Net Interest Income $29,729 1.1% 113.7% Noninterest Income $2,218 2.0% 61.3% Total Revenue $31,947 1.1% 109.0% Adjusted Noninterest Expense (1) $16,065 -2.2% 65.2% Adjusted
Pre-Tax, Pre-Provision Income (1) $15,882 4.8% 185.7%
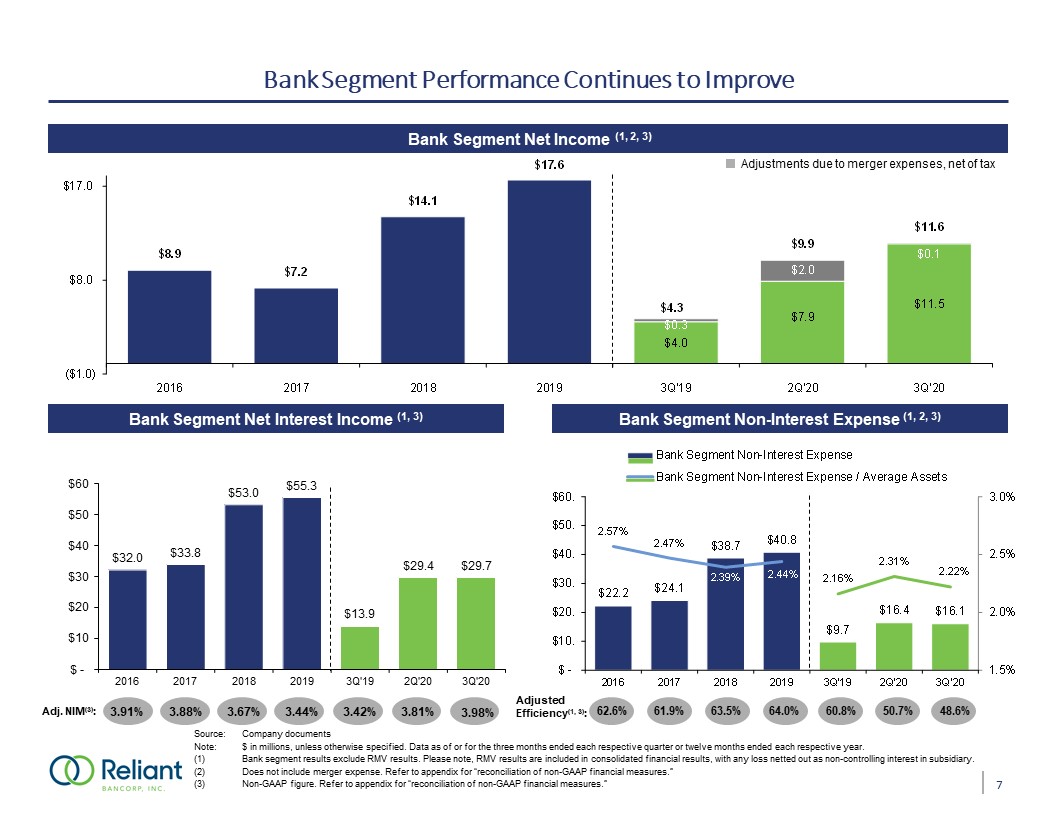
Adjustments due to merger expenses, net of tax Bank Segment Performance Continues to
Improve Bank Segment Net Income (1, 2, 3) Source: Company documentsNote: $ in millions, unless otherwise specified. Data as of or for the three months ended each respective quarter or twelve months ended each respective year. Bank segment
results exclude RMV results. Please note, RMV results are included in consolidated financial results, with any loss netted out as non-controlling interest in subsidiary.Does not include merger expense. Refer to appendix for “reconciliation of
non-GAAP financial measures.”Non-GAAP figure. Refer to appendix for “reconciliation of non-GAAP financial measures.” Bank Segment Net Interest Income (1, 3) Bank Segment Non-Interest Expense (1, 2, 3) Adj. NIM(3): Adjusted
Efficiency(1, 3): 7 3.91% 3.88% 3.67% 3.44% 3.42% 3.81% 3.98% $32.0 $33.8 $53.0 $55.3 $13.9 $29.4 $29.7 $ - $10 $20 $30 $40 $50 $60 2016 2017 2018 2019 3Q'19 2Q'20 3Q'20

Diverse Deposit Portfolio Mix Cost of IB Deposits: Cost of Funds: Note: $ in millions, unless otherwise
specified. Data as of or for the three months ended each respective quarter or twelve months ended each respective year. Reflects consolidated numbers for Reliant Bancorp, Inc. Wholesale and Other Purchased Funds 0.49% 0.73% 1.15% 1.67%
1.76% 0.99% 0.82% 0.40% 0.61% 0.96% 1.42% 1.50% 0.79% 0.62% 0.43% 0.66% 1.07% 1.48% 1.54% 0.91% 0.79% Total Deposits CAGR: 38.1% % of Total Deposits: Wt. Avg. Cost: Wt. Avg. Duration (Months): 2.10%
1.85% 1.13% 0.37% 0.28% 2.2 2.0 2.0 3.9 4.1 Cost of Total Deposits: 8 51.2% 57.4% 34.7% 17.5% 15.2% 41.0% 30.7% 48.9% 48.0% 41.9% 7.8% 11.9% 16.3% 34.5% 42.9% $493
$391 $345 $352 $380 $0 $100 $200 $300 $400 $500 $600 3Q'19 4Q'19 1Q'20 2Q'20 3Q'20 Brokered Time Deposits State of TN CDs Institutional CDs
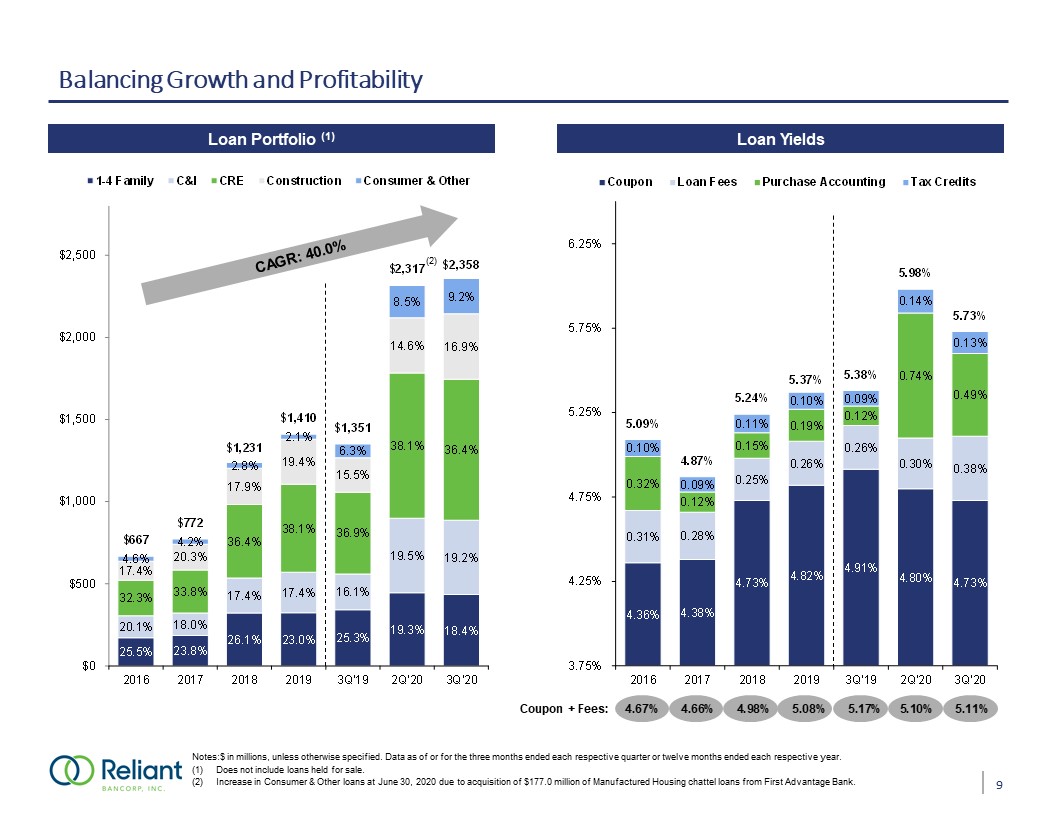
Balancing Growth and Profitability Coupon + Fees: Loan Portfolio (1) Notes:$ in millions,
unless otherwise specified. Data as of or for the three months ended each respective quarter or twelve months ended each respective year. Does not include loans held for sale.Increase in Consumer & Other loans at June 30, 2020 due to
acquisition of $177.0 million of Manufactured Housing chattel loans from First Advantage Bank. CAGR: 40.0% Loan Yields (2) 9
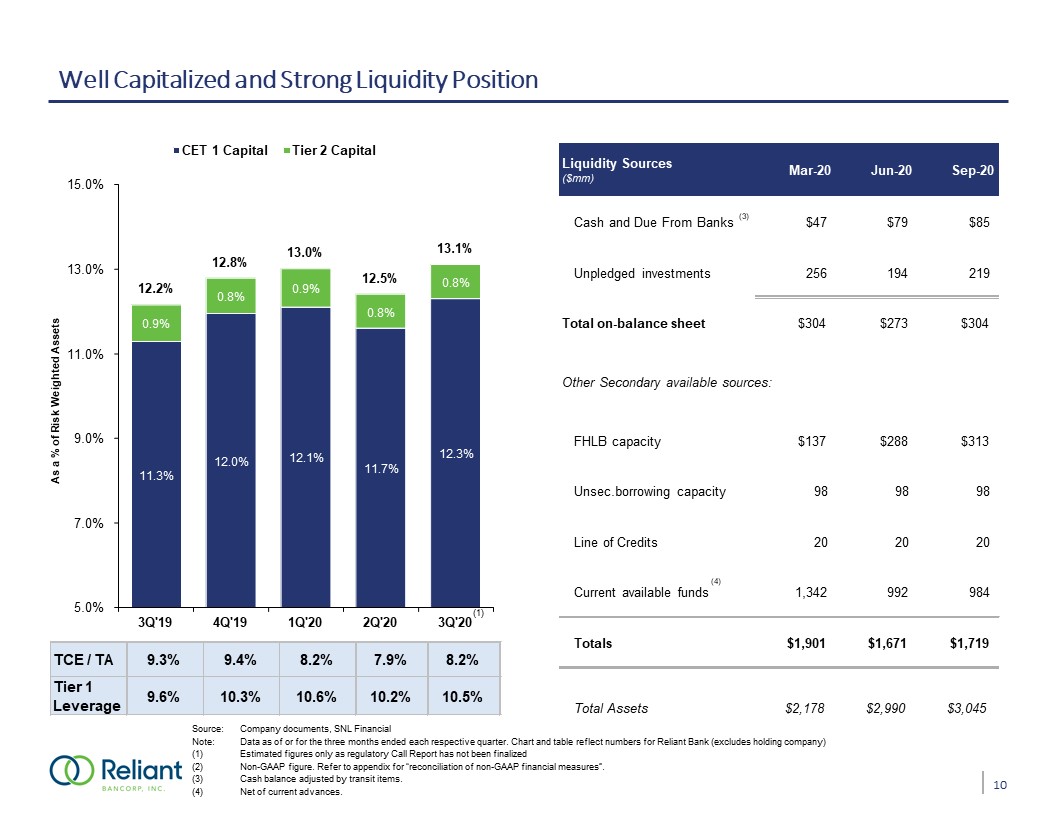
Well Capitalized and Strong Liquidity Position Source: Company documents, SNL FinancialNote: Data as of or
for the three months ended each respective quarter. Chart and table reflect numbers for Reliant Bank (excludes holding company)Estimated figures only as regulatory Call Report has not been finalized Non-GAAP figure. Refer to appendix for
“reconciliation of non-GAAP financial measures”.Cash balance adjusted by transit items.Net of current advances. (1) (2) (4) (3) 10 Liquidity Sources ($mm) Mar-20 Jun-20 Sep-20 Cash and Due From Banks $47 $79 $85 Unpledged
investments 256 194 219 Total on-balance sheet $304 $273 $304 Other Secondary available sources: FHLB capacity $137 $288 $313 Unsec.borrowing capacity 98 98 98 Line of Credits 20 20 20 Current available
funds 1,342 992 984 Totals $1,901 $1,671 $1,719 Total Assets $2,178 $2,990 $3,045 TCE / TA 9.3% 9.4% 8.2% 7.9% 8.2% Tier 1
Leverage 9.6% 10.3% 10.6% 10.2% 10.5% 11.3% 12.0% 12.1% 11.7% 12.3% 0.9% 0.8% 0.9% 0.8% 0.8% 12.2% 12.8% 13.0% 12.5% 13.1%
5.0% 7.0% 9.0% 11.0% 13.0% 15.0% 3Q'19 4Q'19 1Q'20 2Q'20 3Q'20 As a % of Risk Weighted Assets CET 1 Capital Tier 2 Capital
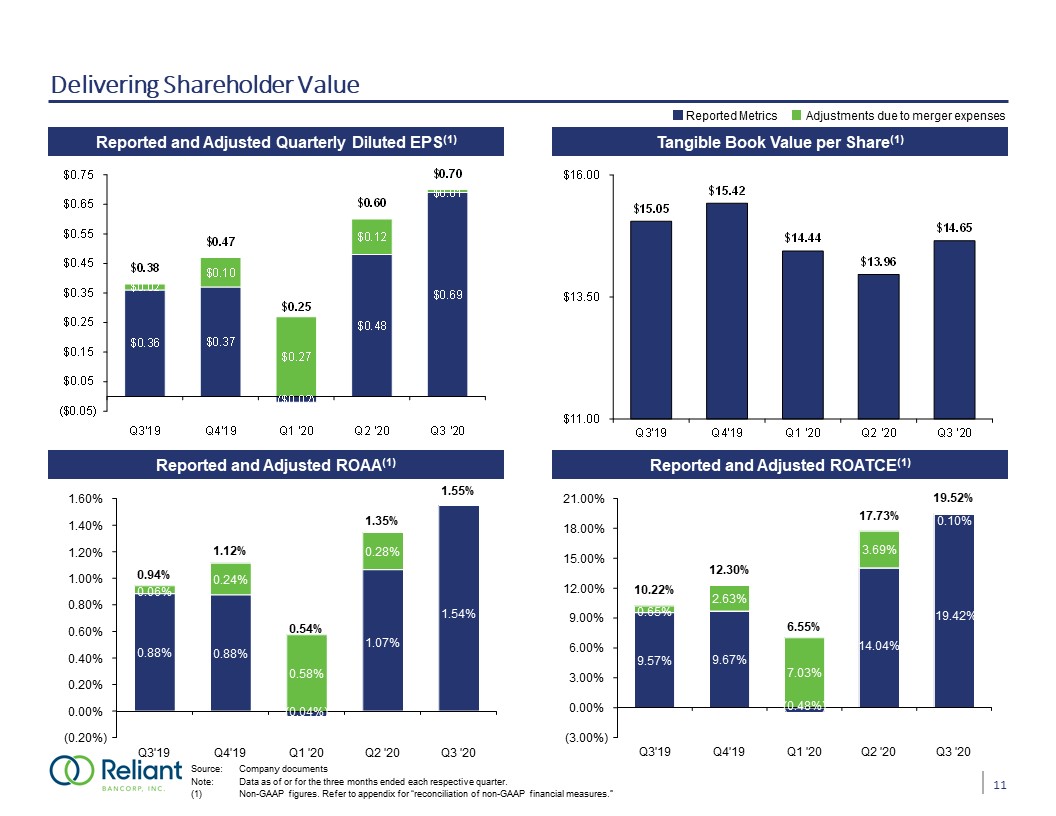
Delivering Shareholder Value Reported and Adjusted Quarterly Diluted EPS(1) Tangible Book Value per
Share(1) Reported and Adjusted ROAA(1) Reported and Adjusted ROATCE(1) Source: Company documentsNote: Data as of or for the three months ended each respective quarter. (1) Non-GAAP figures. Refer to appendix for “reconciliation of non-GAAP
financial measures.” Reported Metrics Adjustments due to merger expenses 11 9.57% 9.67% (0.48%) 14.04% 19.42% 0.65% 2.63% 7.03% 3.69% 0.10% 10.22% 12.30% 6.55% 17.73% 19.52%
(3.00%) 0.00% 3.00% 6.00% 9.00% 12.00% 15.00% 18.00% 21.00% Q3'19 Q4'19 Q1 '20 Q2 '20 Q3 '20 0.88% 0.88% (0.04%) 1.07% 1.54% 0.06% 0.24% 0.58% 0.28% 0.94% 1.12% 0.54% 1.35% 1.55%
(0.20%) 0.00% 0.20% 0.40% 0.60% 0.80% 1.00% 1.20% 1.40% 1.60% Q3'19 Q4'19 Q1 '20 Q2 '20 Q3 '20

Disciplined Credit Culture Allowance for Loan Loss + Purchase Discounts(1) Net Charge-Offs (Recoveries) /
Average Loans(2) Nonperforming Assets / Total Assets Source: Company documentsNote: Data as of or for the three months ended each respective quarter.Non-GAAP figure. Refer to appendix for “reconciliation of non-GAAP financial measures.”Data has
been annualized 12 (0.01%) 0.03% 0.09% (0.02%) (0.02%) (0.10%) 0.00% 0.10% Q3'19 Q4'19 Q1'20 Q2'20 Q3'20 0.16% 0.12% 0.14% 0.15% 0.09% 0.05% 0.35% 0.26% 0.19% 0.39% 0.32%
0.00% 0.15% 0.30% 0.45% Q3'19 Q4'19 Q1'20 Q2'20 Q3'20 Legacy Reliant Bank Acquired (FABK) Retired Facilities

Diversified Lending Platform C&D Portfolio Commercial Real Estate Portfolio Source: S&P Global
Market Intelligence, Company documentsNote: $ in millions, unless otherwise specified. Data as of or for the three months ended each respective quarter. Outstanding balance as a % of Total
Capital 13 323.3% 322.5% 318.9% 305.1% 297.3% 5% 7% 6% 9% 9% 5% 5% 5% 6% 6% 11% 11% 9% 6% 6% 23% 21% 22% 20% 20% 20% 19% 20% 18% 18% 19% 21%
20% 16% 15% 4% 4% 6% 9% 9% 11% 12% 12% 16% 17% $366 $395 $462 $635 $626 $0 $50 $100 $150 $200 $250 $300 $350 $400 $450 $500 $550 $600 $650 Q3'19 Q4'19 Q1'20 Q2'20 Q3'20 Non-RE-secured
CRE Self-storage Properties Retail - Single Credit Retail - Non-anchored Tenant Office - General Hospitality Multifamily Other

14 Hospitality Portfolio – Granular Portfolio with Conservative Credit Profile Source: Company
documentsNote: Data as of or for the three months ended September 30, 2020 (1) Represents committed loan amount. Local vs. National (1) Term vs. Construction (1) Portfolio Highlights Hotel Flags (1) 4.87% of Total Portfolio(1)Portfolio
totals as of Q3 ’20: Term: $96.1 million, 27 borrowers with an average loan size of $3.6 millionConstruction: 5 projects totaling $45.7 million with $13.0 million fundedPrimarily limited-service national franchisesStrong LTVs and DSCRsWeighted
average LTV – 58.88% Weighted average DSCR – 2.23xNo nonperforming loans in segment; 0.0% charge-offs in 2019Average seasoning of 61 monthsAll secured by first liens on real estate and FFE ($mm) Local National Total Outstanding $7.5
$101.6 Total Committed $7.5 $134.4 Avg. LTV 62% 59% Avg. DSCR 2.24x 1.76x

15 Retail CRE Portfolio Source: Company documentsNote: Data as of or for the three months ended September
30, 2020 Represents committed loan amounts. Total $93.7 million Total $124.4 million Portfolio Statistics Burger King Non-Owner-Occupied by Property Type (1) Term vs. Construction (1) Portfolio Highlights Construction by Property Type
(1) No past dues in categories at 9/30/2020No charge-offs in categories in 2019 or YTD 2020Retail Anchored Tenants (Primarily Publix, CVS, Large National Retailers) Avg. Loan Size - $3.3 million Committed Balance - $29.5 millionAvg. DSC –
1.35xAvg. LTV – 56.6%Retail Non-Anchored Tenants - 107 CustomersAvg. Loan Size - $1.04 million Committed Balance - $159.8 millionAvg. DSC – 2.34xAvg. LTV – 66.4%Retail Single Credit Tenant (Largest Concentration – Dollar General,
AT&T)Committed Balance - $38.6 million Avg. DSC – 1.35xAvg. LTV – 61.61% DSCR and ‘Other’ brand numbers under progress Show % of total Show % of total TBU TBU – Restaurant Data

16 Providing Relief to Customers - Loan Modifications Modification levels subsided substantially in the
third quarter Initial Mod Request through May 31, 2020 Second Mod Request – September 30, 2020 Modifications % of Total Modifications % of Total C&I $34,851 1.54% $1,448 0.06% Church / Consumer /
Medical 24,809 1.10% - - CRE 291,232 12.90% 6,179 0.26% Hospitality 96,047 4.25% 14,211 0.61% Multifamily 14,757 0.65% - - Restaurant 54,067 2.39% - - Manufactured Housing 14,887 0.66% - - Total
Modifications $530,650 23.50% $21,838 0.93% Portfolio Total $2,258,390 (1) $2,338,064 (2) ($ in thousands) Source: Company information(1) As of March 31, 2020 – Reliant and FABK combined on a proforma basis.As of
September 30, 2020.The Information presented reflects loan modifications granted on or before September 30, 2020. Additional loan modification requests may be received following September 30, 2020, and the actual numbers of loan modifications
granted may be higher or lower than the numbers presented in this performance measure. (3)
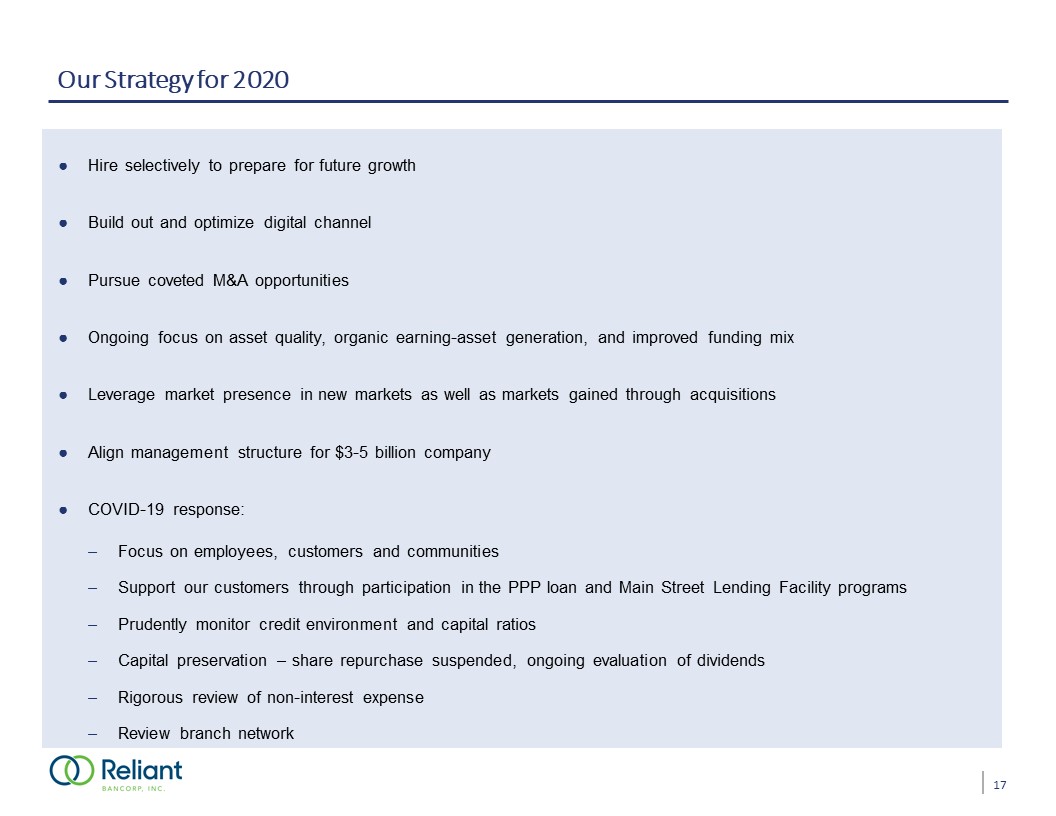
17 Our Strategy for 2020 Hire selectively to prepare for future growthBuild out and optimize digital
channelPursue coveted M&A opportunitiesOngoing focus on asset quality, organic earning-asset generation, and improved funding mixLeverage market presence in new markets as well as markets gained through acquisitionsAlign management structure
for $3-5 billion companyCOVID-19 response:Focus on employees, customers and communitiesSupport our customers through participation in the PPP loan and Main Street Lending Facility programsPrudently monitor credit environment and capital
ratiosCapital preservation – share repurchase suspended, ongoing evaluation of dividendsRigorous review of non-interest expenseReview branch network

Appendix

19 Reconciliation of Non-GAAP Financial Measures Reliant Bancorp, Inc. Adjusted Net Income, Adjusted
Return on Average Assets, Average Tangible Common Equity, Adjusted Return on Average Tangible Common Equity, Adjusted Earnings Per Share and Adjusted Return on Average Equity Quarter Ended, September 30, December 31, March 31, September
30, (Dollars in thousands, except per share data) 2019 2019 2020 2020 2020 Net Income (Loss) Attributable to Common Shareholders $4,000 $4,133 ($215) $7,868 Non-Core Items: Merger expenses 299 1,301 4,186 2,632 Tax
effect of adjustments to net income (27) (173) (1,032) (565) Adjusted net income attributable to common shareholders $4,272 $5,261 $2,939 $9,935 Average Assets $1,806,455 $1,883,723 $2,178,418 $2,981,687 Adjusted Return on Average
Assets 0.94 % 1.11 % 0.54 % 1.36 % Average Tangible Common Equity $165,847 $169,561 $180,426 $225,374 Adjusted Return on Average Tangible Common Equity 10.22 % 12.31 % 6.55 % 17.73 % Diluted Weighted Average Common
Shares 11,177,367 11,189,302 11,895,020 16,529,080 Adjusted Quarterly Earnings Per Share $0.38 $0.47 $0.25 $0.60 Average Stockholders' Equity $217,087 $220,567 $241,899 $288,961 Adjusted Return on Average
Equity 7.81 % 9.46 % 4.87 % 13.83 % June 30, $2,948,366 1.55 % $236,223 19.52 % 16,649,673 $0.70 $299,435 15.40 % $11,531 78 (20) $11,589

20 Reconciliation of Non-GAAP Financial Measures Reliant Bancorp, Inc. Adjusted Net Interest Spread and
Adjusted Net Interest Margin Fiscal Year Ended December 31, Quarter Ended, September 30, June 30, September 30, (Dollars in thousands, except per share data) 2016 2017 2018 2019 2019 2020 2020 Tax Equivalent Net
Interest Rate Spread $34,702 $37,339 $56,898 $58,830 $14,287 $31,117 $31,643 Non-Core Items: Purchase accounting adjustments (2,033) (859) (1,665) ($1,785) (383) (5.232) (3,868) Adjusted Net Interest Rate
Spread $32,669 $36,480 $55,233 $57,045 $14,107 $25,106 $27,775 Total Earning Assets (Average Balance) $835,337 $939,947 $1,505,748 $1,660,049 $1,669,482 $2,734,898 $2,771,917 Adjusted
NIM 3.91 % 3.88 % 3.67 % 3.44 % 3.42 % 3.81 % 3.98 %

21 Reconciliation of Non-GAAP Financial Measures Reliant Bancorp, Inc. Tangible Common Equity to Tangible
Assets, Tangible Book Value per Share and Return on Average Tangible Common Equity Quarter Ended, September 30, December 31, March 31, September 30, (Dollars in thousands, except per share
data) 2019 2019 2020 2020 2020 Tangible Assets Total Assets $1,855,815 $1,898,467 $2,177,788 $3,044,512 Less: Goodwill 43,642 43,642 50,723 51,506 Less: Core deposit intangibles 7,507 7,270 10,486 11,820 Tangible
Assets $1,804,666 $1,847,555 $2,116,579 $2,981,186 Tangible Common Equity Total Common equity $219,652 $223,753 $234,672 $307,086 Less: Goodwill 43,642 43,642 50,723 51,506 Less: Core deposit
intangibles 7,507 7,270 10,486 11,820 Tangible Common Equity $168,503 $172,841 $173,463 $243,760 Average Tangible Common Equity Average shareholders' equity $217,087 $220,567 $241,899 $299,435 Less: Average
goodwill 43,642 43,642 50,723 51,108 Less: Average core deposit intangibles 7,598 7,364 10,750 12,104 Average Tangible Common Equity $165,847 $169,561 $180,426 $236,223 Common Shares
Outstanding 11,195,062 11,206,254 12,014,495 16,634,572 Tangible Book Value per Share $15.05 $15.42 $14.44 $14.65 Tangible Common Equity / Tangible Assets % 9.34 % 9.36 % 8.20 % 8.18 % Net Income Attributable to Common
Shareholders $4,000 $4,133 ($215) $11,531 Return on Average Tangible Common Equity % 9.57 % 9.67 % (0.48) % 19.42 % June
30, 51,058 12,293 $2,926,775 $295,543 51,058 12,293 $232,192 $288,961 51,058 12,529 $225,374 16,631,604 $13.96 7.93 $7,868 14.04 $2,990,126

22 Reconciliation of Non-GAAP Financial Measures Reliant Bancorp, Inc. Bank Segment Profitability Note:
Bank Segment figures exclude mortgage subsidiary financials and one-time merger expenses Quarter Ended September 30, June 30, September 30, (Dollars in thousands, except per share
data) 2016 2017 2018 2019 2019 2020 2020 Adjusted Non-Interest Expense Non-interest expense $22,327 $25,524 $41,512 $42,382 $10,025 $16,143 Less: Merger
expenses (82) (1,426) (2,774) (1,603) (299) ($78) Adjusted Non-Interest Expense $22,245 $24,098 $38,738 $40,779 $9,726 $16,433 $16,065 Average
Assets $864,010 $976,420 $1,619,478 $1,671,456 $1,788,184 $2,863,053 $2,878,034 Adjusted Non-Interest Expense / Average
Assets 2.57 % 2.47 % 2.39 % 2.44 2.16 % 2.31 % 2.22 % $19,065 ($2,632)

23 Reconciliation of Non-GAAP Financial Measures Reliant Bancorp, Inc. Bank Segment Pre-tax Pre-Provision
Net Income Note: Bank Segment figures exclude mortgage subsidiary financials and one-time merger expenses Quarter Ended September 30, June 30, September 30, (Dollars in thousands, except per share data) 2019 2020 2020 Net
Interest Income $13,910 $29,729 Noninterest Income 1,375 2,218 Total Income $15,285 $31,594 $31,947 Adjusted noninterest expense $9,726 $16,065 Bank Segment Pre-Tax, Pre-Provision
Income $5,559 $15,882 $29,420 2,174 $16,433 $15,161

24 Reconciliation of Non-GAAP Financial Measures Reliant Bancorp, Inc. Bank Segment Adjusted Efficiency
Ratio Note: Adjusted figures exclude RMV results and merger expense. Quarter Ended September 30, June 30, September 30, (Dollars in thousands, except per share data) 2016 2017 2018 2019 2019 2020 2020 Operating
Expense Non-interest expense $22,327 $25,524 $41,512 $42,382 $10,025 $16,143 Less: Merger expenses (82) (1,426) (2,774) (1,603) (299) ($78) Operating Expense $22,245 $24,098 $38,738 $40,779 $9,726 $16,433 $16,065 Operating
Revenue Net interest income $32,035 $33,761 $53,008 $55,252 $13,910 $29,729 Add: Tax equivalent adjustment for tax exempt interest income 1,362 2,852 3,069 3,029 726 1,106 Tax equivalent net interest
income $33,397 $36,613 $56,077 $58,281 $14,636 $30,835 Total noninterest income 2,481 2,333 5,232 7,059 1,375 2,218 Less: Loss/(Gain) on sale of securities available for sale (36) (59) (43) (1,451) - - Less: Loss/(Gain) on
sale of other real estate owned (301) (27) (259) (166) - 2 Less: Loss/(Gain) on disposal of premises and equipment - 52 (13) - - 8 Operating Revenue $35,541 $38,912 $60,994 $63,723 $16,011 $32,417 $33,063 Adjusted
Efficiency
Ratio 62.6 % 61.9 % 63.5 % 64.0 60.8 % % 48.6 % $19,065 ($2,632) $29,420 1,161 $30,581 2,174 (327) (11) - 50.7 %
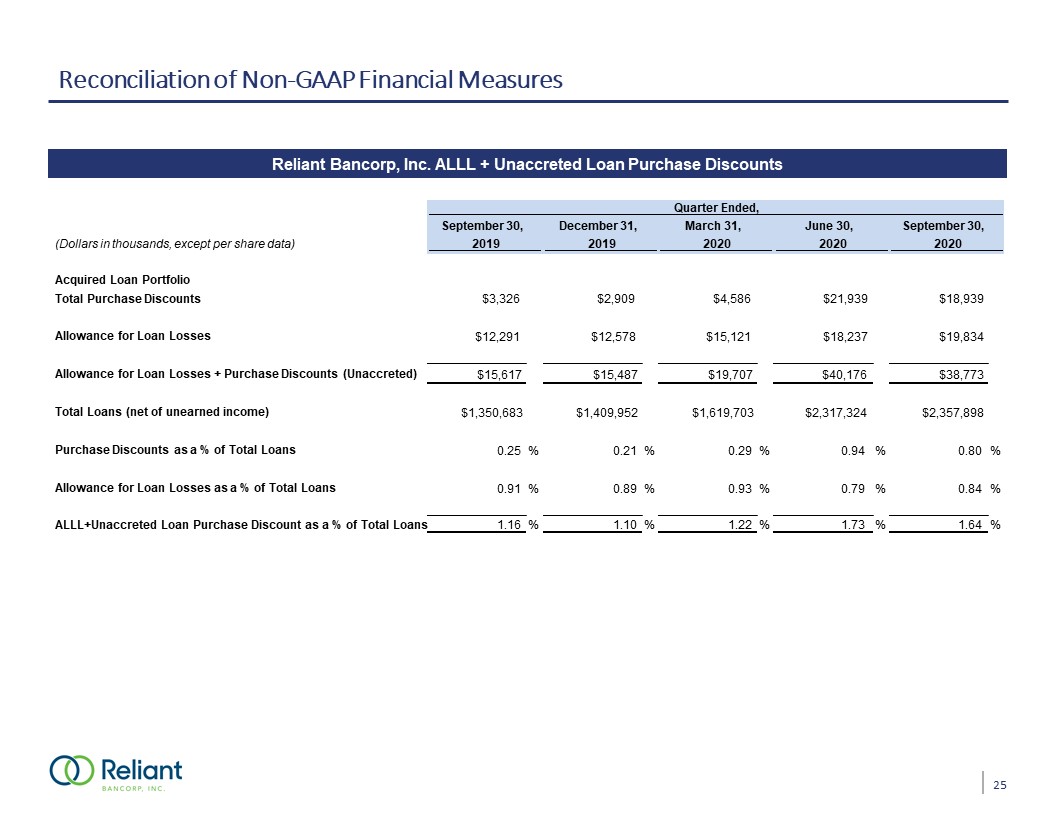
25 Reconciliation of Non-GAAP Financial Measures Reliant Bancorp, Inc. ALLL + Unaccreted Loan Purchase
Discounts Quarter Ended, September 30, December 31, March 31, June 30, (Dollars in thousands, except per share data) 2019 2019 2020 2020 2020 Acquired Loan Portfolio Total Purchase
Discounts $3,326 $2,909 $4,586 $18,939 Allowance for Loan Losses $12,291 $12,578 $15,121 $19,834 Allowance for Loan Losses + Purchase Discounts (Unaccreted) $15,617 $15,487 $19,707 $38,773 Total Loans (net of unearned
income) $1,350,683 $1,409,952 $1,619,703 $2,357,898 Purchase Discounts as a % of Total Loans % 0.25 % 0.21 % 0.29 % 0.80 % Allowance for Loan Losses as a % of Total Loans % 0.91 % 0.89 % 0.93 % 0.84 % ALLL+Unaccreted Loan
Purchase Discount as a % of Total Loans % 1.16 % 1.10 % 1.22 % 1.64 % September 30, $21,939 $18,237 $40,176 $2,317,324 0.94 0.79 1.73