Attached files
| file | filename |
|---|---|
| 8-K - FORM 8-K - TCF FINANCIAL CORP | tv511702_8k.htm |
| EX-99.1 - EXHIBIT 99.1 - TCF FINANCIAL CORP | tv511702_ex99-1.htm |
Exhibit 99.2

TRANSFORMATIONAL PARTNERSHIP Enhancing Value for Our Shareholders, Customers and Communities JANUARY 28, 2019

2 Cautionary Note Regarding Forward - Looking Statements Statements included in this communication which are not historical in nature are intended to be, and hereby are identified as, forward - looking statements within the meaning of the Private Securities Litigation Reform Act of 1995 . Examples of forward - looking statements include, but are not limited to, statements regarding the outlook and expectations of Chemical and TCF with respect to their planned merger, the strategic benefits and financial benefits of the merger, including the expected impact of the transaction on the combined company’s future financial performance (including anticipated accretion to earnings per share, the tangible book value earn - back period and other operating and return metrics), and the timing of the closing of the transaction . Words such as “may,” “anticipate,” “plan,” “estimate,” “expect,” “project,” “assume,” “approximately,” “continue,” “should,” “could,” “will,” “poised,” and variations of such words and similar expressions are intended to identify such forward - looking statements . Forward - looking statements are subject to risks, uncertainties and assumptions that are difficult to predict with regard to timing, extent, likelihood and degree of occurrence, which could cause actual results to differ materially from anticipated results . Such risks, uncertainties and assumptions, include, among others, the following : • the failure to obtain necessary regulatory approvals when expected or at all (and the risk that such approvals may result in the imposition of conditions that could adversely affect the combined company or the expected benefits of the transaction) ; • the failure of either Chemical or TCF to obtain shareholder approval, or to satisfy any of the other closing conditions to the transaction on a timely basis or at all ; • the occurrence of any event, change or other circumstances that could give rise to the right of one or both of the parties to terminate the merger agreement ; • the possibility that the anticipated benefits of the transaction, including anticipated cost savings and strategic gains, are not realized when expected or at all, including as a result of the impact of, or problems arising from, the integration of the two companies or as a result of the strength of the economy, competitive factors in the areas where Chemical and TCF do business, or as a result of other unexpected factors or events ; • the impact of purchase accounting with respect to the transaction, or any change in the assumptions used regarding the assets purchased and liabilities assumed to determine their fair value ; • diversion of management’s attention from ongoing business operations and opportunities ; • potential adverse reactions or changes to business or employee relationships, including those resulting from the announcement or completion of the transaction ; • the ability of either company to effectuate share repurchases and the prices at which such repurchases may be effectuated ; • the outcome of any legal proceedings that may be instituted against Chemical or TCF ; • the integration of the businesses and operations of Chemical and TCF, which may take longer than anticipated or be more costly than anticipated or have unanticipated adverse results relating to Chemical’s or TCF’s existing businesses ; • business disruptions following the merger ; and • other factors that may affect future results of Chemical and TCF including changes in asset quality and credit risk ; the inability to sustain revenue and earnings growth ; changes in interest rates and capital markets ; inflation ; customer borrowing, repayment, investment and deposit practices ; the impact, extent and timing of technological changes ; capital management activities ; and other actions of the Federal Reserve Board and legislative and regulatory actions and reforms . Additional factors that could cause results to differ materially from those described above can be found in the risk factors described in Item 1 A of each of Chemical’s and TCF’s Annual Report on Form 10 - K filed with the SEC for the year ended December 31 , 2017 . Annualized, pro forma, projected and estimated numbers are used for illustrative purpose only, are not forecasts and may not reflect actual results . Chemical and TCF disclaim any obligation to update or revise any forward - looking statements contained in this communication, which speak only as of the date hereof, whether as a result of new information, future events or otherwise, except as required by law .

3 Additional Information Important Additional Information and Where to Find It This communication is being made in respect of the proposed merger transaction between Chemical and TCF . In connection with the proposed merger, Chemical will file with the SEC a Registration Statement on Form S - 4 that will include the Joint Proxy Statement of Chemical and TCF and a Prospectus of Chemical, as well as other relevant documents regarding the proposed transaction . A definitive Joint Proxy Statement/Prospectus will also be sent to Chemical and TCF shareholders . INVESTORS ARE URGED TO READ THE REGISTRATION STATEMENT AND THE JOINT PROXY STATEMENT/PROSPECTUS REGARDING THE MERGER WHEN IT BECOMES AVAILABLE AND ANY OTHER RELEVANT DOCUMENTS FILED WITH THE SEC, AS WELL AS ANY AMENDMENTS OR SUPPLEMENTS TO THOSE DOCUMENTS, BECAUSE THEY WILL CONTAIN IMPORTANT INFORMATION . This communication does not constitute an offer to sell or the solicitation of an offer to buy any securities or a solicitation of any vote or approval, nor shall there be any sale of securities in any jurisdiction in which such offer, solicitation or sale would be unlawful prior to registration or qualification under the securities laws of such jurisdiction . A free copy of the Joint Proxy Statement/Prospectus, once available, as well as other filings containing information about Chemical and TCF, may be obtained at the SEC’s Internet site (http : //www . sec . gov) . You will also be able to obtain these documents, free of charge, from Chemical by accessing Chemical’s website at http : //www . chemicalbank . com (which website is not incorporated herein by reference) or from TCF by accessing TCF’s website at http : //www . tcfbank . com (which website is not incorporated herein by reference) . Copies of the Joint Proxy Statement/Prospectus once available can also be obtained, free of charge, by directing a request to Chemical Investor Relations at Investor Relations, Chemical Financial Corporation, 333 W . Fort Street, Suite 1800 , Detroit, MI 48226 , by calling ( 800 ) 867 - 9757 or by sending an e - mail to investorinformation@chemicalbank . com, or to TCF Investor Relations at Investor Relations, TCF Financial Corporation, 200 Lake Street East, EXO - 02 C, Wayzata, MN 55391 by calling ( 952 ) 745 - 2760 or by sending an e - mail to investor@tcfbank . com . Participants in Solicitation Chemical and TCF and certain of their respective directors and executive officers may be deemed to be participants in the solicitation of proxies from Chemical and TCF shareholders in respect of the transaction described in the Joint Proxy Statement/Prospectus. Information regarding Chemical’s directors and exe cutive officers is contained in Chemical’s Annual Report on Form 10 - K for the year ended December 31, 2017, its Proxy Statement on Schedule 14A, dated March 16, 2018, and certain of its Current Reports on Form 8 - K, which are filed with the SEC. Information regarding TCF’s directors and executive officers is contained in TCF’s Annual Report on Form 10 - K for the year ended December 31, 2017, its Proxy Statement on Schedule 14A, dated March 14, 2018, and certain of its Current Reports on Form 8 - K, which are filed with the SEC. Additional in formation regarding the interests of those participants and other persons who may be deemed participants in the transaction may be obtained by reading the Joint Proxy Statement/Pros pec tus regarding the proposed merger when it becomes available. Free copies of this document may be obtained as described in the preceding paragraph. Non - GAAP Financial Measures This presentation contains certain non - GAAP financial measures that are not in accordance with U . S . generally accepted accounting principles (GAAP) . Chemical and TCF use certain non - GAAP financial measures to provide meaningful, supplemental information regarding their operational results and to enhance investors’ overall understanding of Chemical’s and TCF’s financial performance . The limitations associated with non - GAAP financial measures include the risk that persons might disagree as to the appropriateness of items comprising these measures and that different companies might calculate these measures differently . These disclosures should not be considered an alternative to Chemical’s and TCF’s GAAP results .
4 David T. Provost President & CEO | Chemical Craig R. Dahl Chairman, President & CEO | TCF Dennis Klaeser CFO | Chemical Brian W. Maass CFO | TCF Presenters

5 Complementary Partners Exceptional Financial Benefits Shared Values Enhanced Competitive Position Partnering to Create Significant Strategic and Financial Value ▪ Accelerates shareholder value creation − Material GAAP EPS accretion – 17% to Chemical 3 , 31% to TCF 3 – with just 2.7 - year TBVPS earnback 4 − Approximately 19% pro forma ROATCE 5 drives significant capital generation and compounds TBVPS ▪ Retains deep community ties, customer - centric focus and commitment to performance − Common legacy of providing philanthropic, civic and economic development support − Strong pro forma governance, clear leadership and status as a best - in - class employer ▪ Creates a premier bank in the Midwest¹ − Top 10 regional player with $45 billion of assets² − Scale, profitability and consistent performance required to compete and win in an evolving market ▪ Strengthens each company’s standalone growth profile − Lower risk — limited overlap minimizes disruption of go - to - market strategies and customer relationships − Significant upside — more diversified balance sheet, broader product set, exportable expertise (1) Midwest defined as IL, IN, OH, MI, MN and WI (2) Pro forma balance sheet metrics as of the period ended December 31, 2018; excludes purchase accounting adjustments (3) See page 31 for detail regarding calculation of run - rate GAAP EPS accretion (4) See page 32 for detail regarding calculation of tangible book value per share dilution and earnback (5) Pro forma metric based on 2020E consensus estimates, assuming $180mm pre - tax cost savings are fully phased in

6 Transaction Summary Structure and Exchange Ratio • Merger of Equals • TCF merges into Chemical • 100% stock consideration • Fixed exchange ratio: TCF shareholders will receive 0.5081 shares of Chemical for each TCF share (equivalent to $21.58 per share as of Chemical’s closing stock price on January 25, 2019) Executive Leadership • Gary Torgow Executive Chairman • Craig R. Dahl President & CEO • David T. Provost Chairman of the bank; board member of the holding company • Dennis Klaeser CFO • Brian W. Maass Deputy CFO and Treasurer Board of Directors • 16 members: 8 Chemical / 8 TCF • Vance Opperman , TCF’s Lead Independent Director, will continue as Lead Independent Director of the combined board Ownership • 46.2% Chemical / 53.8% TCF Headquarters • Detroit • Significant operation centers in Minneapolis; Midland; and Chicago Brand • Combined franchise will leverage the strong regional and national brand equity of TCF Other Items • Chemical’s balance sheet will be subject to fair market value accounting • Strong pro forma capitalization Timing and Approvals • Anticipated closing in late Q3 / early Q4 2019 • Approval of Chemical and TCF shareholders • Customary regulatory approvals

7 Stronger Combined Franchise Significant Upside Strong Profitability 4 Balanced Loan & Lease Portfolio 3 $1.3B Capitalized value of net cost savings 2 : ~1.6% ROAA ~19% ROATCE ~53% Efficiency ratio 39% Commercial & Business Banking 38% Residential & Consumer Banking 23% Leasing, Equipment & Inventory Finance (1) See page 31 for detail regarding calculation of run - rate GAAP and Cash EPS accretion; Cash EPS accretion excludes all purchase accounting amortization (2) Capitalized value of cost synergies is calculated as $180 million pre - tax / $142 million after - tax cost synergies, multiplied by market cap weighted NTM P/E multiple of 10.8x , net of $325 million pre - tax / $270 million after - tax one - time restructuring charges; Capitalized value is not discounted to present value (3) Pro forma balance sheet metrics as of the periods ended December 31, 2018 (for combined balances) and periods ended December 31, 2018 (for 2013 – 2018 CAGR calculations); CAGR calculations exclude both companies’ auto finance portfolios (4) Pro forma profitability metrics are based on 2020E consensus estimates and assume $180mm pre - tax cost savings are fully phased i n Two Growth Franchises, Together Scaled for Success 3 $45B Combined assets $34B Gross loans & leases $34B Total deposits +13% 2013 – 2018 combined CAGR +11% 2013 – 2018 combined CAGR +12% 2013 – 2018 combined CAGR EPS accretion to Chemical: 17% 13% GAAP¹ Cash¹ 31% 27% EPS accretion to TCF: GAAP¹ Cash¹

8 Increase return on capital Leverage existing infrastructure, deliver operating leverage, lower efficiency ratio Re - mix balance sheet to increase capital efficiency and reduce risk Grow C&I and CRE lending and deposits Invest in technology to provide a differentiated customer experience Continue expanding national lending Expand mortgage product offering Build core business banking: − Treasury management − Hiring best - in - market talent Grow specialty commercial lines: − ABL − Leasing − Commercial finance Enhance digital platform Double southeast Michigan presence Expand in adjacent markets Together Significantly enhance our operating performance, profitability, and returns Expand geographically, and deploy our respective strengths into each other’s markets Enable faster growth without building concentrations Achieve greater scale on our technology and marketing investments Attract and retain top talent Accelerating the Achievement of Chemical and TCF’s Standalone Strategic Priorities

9 Together, We Are Best in Class Merger Benefits Accrue to All Shareholders Consistently higher returns Double - digit EPS growth Strong capital, liquidity and credit quality Expanded strategic flexibility Increased growth and revenue diversification Significant upside and value creation Top Quartile Revenue Generation (Operating revenue / total assets) 2 Solid Efficiency Ratio 3 Top Quartile Return on Average Tangible Common Equity 3 5.0% Pro forma Pro Forma Financial Performance Relative to $20 – 100B Asset Banks 1 Pro forma 19% Pro forma 53% Source: S&P Global Market Intelligence (1) Includes publicly traded U.S. banks with $ 20 – 100 billion in assets as of most recent available financial data (2) Annualized performance from Q1 2018 to Q3 2018 is shown for peers; Q4 2018 data is shown for the pro forma company (3) Annualized performance from Q1 2018 to Q3 2018 is shown for peers; 2020 pro forma is shown for the pro forma company, based on standalone consensus EPS estimates plus $ 180 million of pre - tax cost savings (fully phased in)

Strategic Rationale
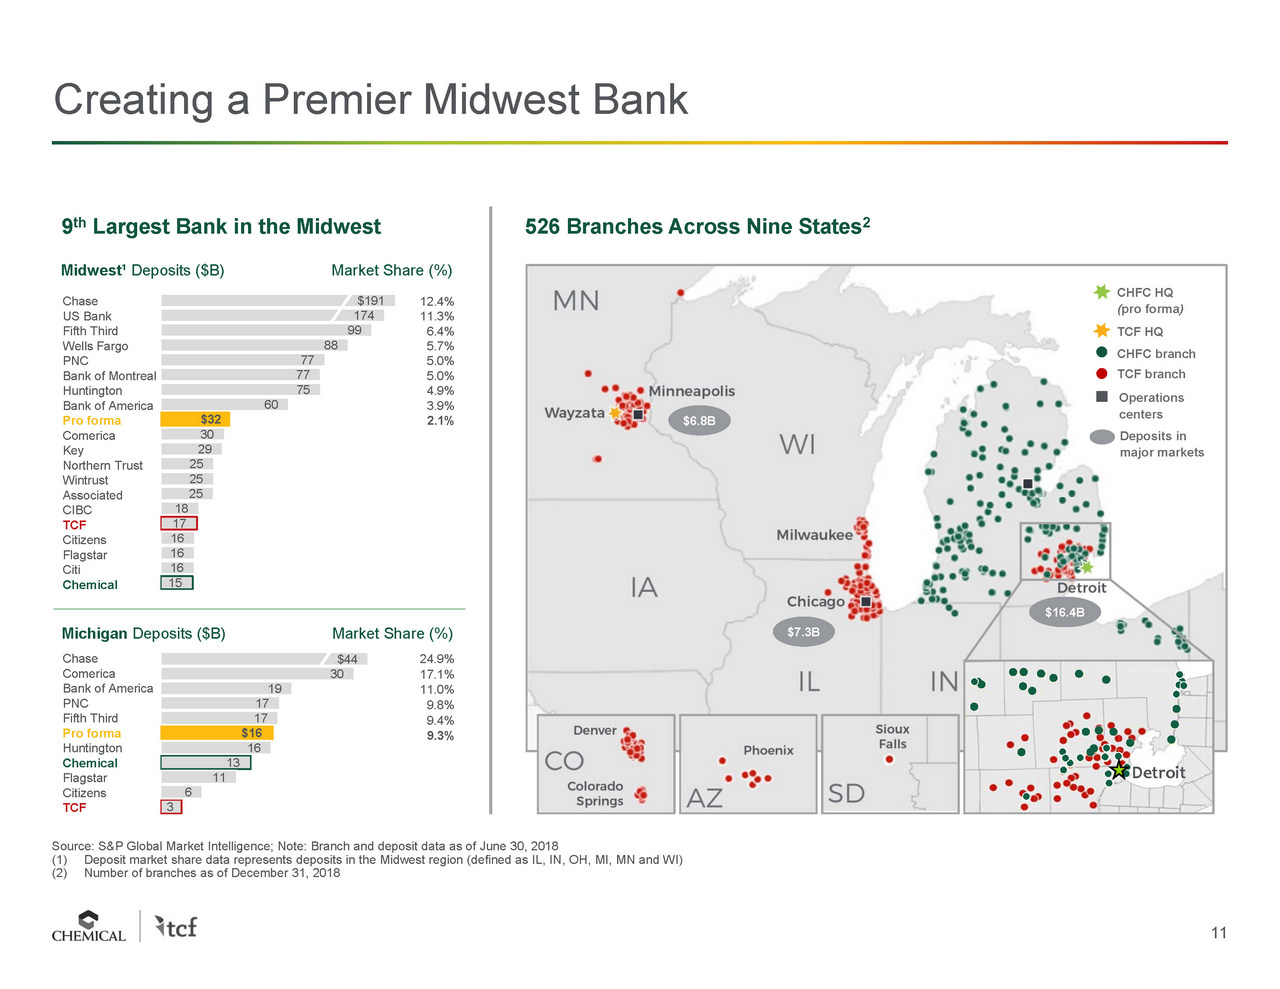
11 Creating a Premier Midwest Bank 15 16 16 16 17 18 25 25 25 29 30 $32 60 75 77 77 88 99 174 $191 Source: S&P Global Market Intelligence; Note: Branch and deposit data as of June 30, 2018 (1) Deposit market share data represents deposits in the Midwest region (defined as IL, IN, OH, MI, MN and WI) (2) Number of branches as of December 31, 2018 3 6 11 13 16 $16 17 17 19 30 $44 12.4% 11.3% 6.4% 5.7% 5.0% 5.0% 4.9% 3.9% 2.1% Chase US Bank Fifth Third Wells Fargo PNC Bank of Montreal Huntington Bank of America Pro forma Comerica Key Northern Trust Wintrust Associated CIBC TCF Citizens Flagstar Citi Chemical Chase Comerica Bank of America PNC Fifth Third Pro forma Huntington Chemical Flagstar Citizens TCF 24.9% 17.1% 11.0% 9.8% 9.4% 9.3% TCF branch CHFC branch CHFC HQ ( pro forma ) TCF H Q Operations centers $ 6.8B $ 7.3B $16.4B Deposits in major markets 526 Branches Across Nine States 2 9 th Largest Bank in the Midwest Michigan Deposits ($B) Market Share (%) Midwest¹ Deposits ($B) Market Share (%) Detroit

12 Better Positioned to Compete, Invest and Win — Today and in the Future External landscape is rapidly changing across many industry sectors Banking industry is faced with these same trends Together, Chemical and TCF are well positioned to leverage joint resources and serve evolving customer needs Environmental Trends Chemical and TCF Together Our Partnership Provides Invest and innovate more efficiently Momentum from adding and expanding customer relationships Enhance customer - facing digital service offerings and streamline internal systems and processes Sustain our competitive advantages and ability to compete as experts in our chosen segments Customer needs and expectations Digitization Mobile capabilities Data analytics Non - bank and fin - tech competitors AI / robotics / automation Scale • Better leverages enterprise - wide services and overhead to drive near - term value creation • Supports more efficient infrastructure • Provides greater profit pool to support future growth initiatives Scope • More customers • Wider geographic reach • More complete product set

13 $13B / 38% of total loans and leases $22B / 64% of deposits • Full suite of deposit products and services, including wealth management and trust • Strong digital experience • 526 branches in nine states • Branch - based mortgage originations • Both companies have been running off / de - emphasizing auto lending portfolio Balanced Go - to - Market Business Model Local Business Banking National Lending Retail & Community Banking $13B / 39% of total loans and leases $12B / 36% of deposits • In - Market , Relationship Commercial Banking • Deposit expertise in Treasury Management and local government • Focused in densely populated metros • Expanded small business mobile platform • Strong talent acquisition program $8B / 23% of total loans and leases • Leasing and Equipment Finance • Inventory Finance • Diversified portfolio by asset class, geography, industry, loan size and collateral type • Granular client base: 77,000 lending relationships • Short duration and highly asset sensitive • Capacity for growth 44% Chemical¹ 56% TCF¹ 29% TCF¹ ~100% TCF¹ Note: Pro forma financial metrics as of the period ended December 31, 2018; excludes purchase accounting adjustments (1) Represents approximate contribution of total loans and leases The New TCF: Strong Regional and National Brand Equity

14 Highly Diversified Loan and Lease Portfolio • Upside growth potential from multiple loan origination engines – without building concentrations − TCF’s Leasing & Equipment Finance and Inventory Finance exposures are reduced from 41% of standalone total loans and leases to 23% of pro forma − Chemical’s Commercial Real Estate and Construction exposures are reduced from 297% of standalone risk based capital to 193% of pro forma • High asset quality; lower - risk loans and leases − Both companies have less than 60 bps of NPAs / total assets¹ − Consistent vision to deemphasize the consumer auto business 14% 22% 3% 6% 28% 4% 9% 14% 38% 5% 6% 6% 4% 8% CRE C&I Leasing & Equipment Finance Inventory Finance Consumer Real Estate Auto Construction Other consumer Michigan Minnesota Illinois Ohio Other Midwest 3 California All other 33% 193% of Risk - Based Capital 4 Note: Chemical and TCF financial data as of the period ended December 31, 2018 (1) NPAs exclude performing troubled debt restructurings (TDRs) (2) Excludes the impact of purchase accounting adjustments (3) Other Midwest includes WI and IN (4) Estimated pro forma risk - based capital at transaction closing incorporating purchase accounting adjustments $34B in Pro Forma Total Loans & Leases² Composition by product type Composition by geography

15 Strong Combined Deposit Base 23% 17% 34% 27% 18% 15% 3% 7% 6% 20% 20% 11% Time Savings and MMDA Interest - bearing transaction Non - interest bearing transaction Greater Michigan 5 Detroit Midland Grand Rapids Minneapolis Chicago Other 4 Note: Chemical and TCF composition data by type of deposit as of the period ended December 31, 2018; Geography composition da ta as of June 30, 2018 (1) Calculated as change in combined cost of deposits (combined interest expense on deposits divided by average combined total deposits ), relative to the change in the Fed Funds Target Rate, between Q3 2015 and Q4 2018 (2) FDIC insurance data as of September 30, 2018 (3) Does not include the impact of purchase accounting adjustments (4) Includes all other markets, including Denver, Youngstown and Cleveland (5) Greater Michigan excludes Detroit, Midland, Grand Rapids and Ann Arbor Ann Arbor • Core deposits are well balanced across both retail and commercial franchises • Limited reliance on wholesale funding • Access to diverse markets and funding sources enables low beta: Chemical and TCF’s combined cumulative deposit beta has been just 23% cycle - to - date¹ • 77% of all deposits are FDIC insured 2 versus 60% median of $20 – 100B asset banks $34B in Pro Forma Deposits 3 Composition by type Composition by geography 73% non - time

16 Robust and Complementary Fee Income Streams • Combined fee income represents approximately 28% of total revenue — relative to 23% median of $20 – 100B asset banks¹ • Complementary mix of non - overlapping revenue − TCF brings Leasing & Equipment Finance and Inventory Finance − Chemical brings trust and wealth management • Overlapping fee income sources are primarily recurring service charges and deposit - based fees • Combined company is well positioned to leverage each partner’s unique businesses across its broader pro forma footprint (1) Full year 2018 data shown for combined company metric; excludes the impact of identified revenue enhancements; Performance from Q1 2018 to Q3 2018 is shown for peers (2) Includes bank - owned life insurance 11% 7% 28% 16% 4% 30% 4% Trust and Wealth Management Mortgage Servicing Leasing & Equipment Finance Other² Mortgage Banking Card, Electronic and ATM Service Charges and Fees 39% from Unique Sources 61% from Overlapping Sources ~$600mm of Pro Forma Fee Income¹ Composition by type

17 8 8 Strong Governance and Proven Leadership Gary Torgow Executive Chairman Craig Dahl President & CEO David Provost Director, Chairman of Bank Vance Opperman Lead Independent Director • Chairman of Chemical since 2016 • Previously served as Chairman of Talmer Bancorp • Chairman of TCF since April 2017; CEO since January 2016 • Joined TCF in 1999 to establish its equipment finance division • 41 - year career in banking • President & CEO of Chemical since mid - 2017 • Previously served as President & CEO of Talmer Bancorp • 42 - year career in banking • Serves as lead independent director of TCF and Thomson Reuters • Owner and CEO of MSP Communications TCF’s Performance With Craig Dahl as CEO Chemical’s eight directors will include: Proven track record of organically building and growing businesses 20.9% 2015 – 2018 EPS CAGR 1 Top quartile total shareholder return since January 2016 2 Reduced risk profile Improved balance sheet positioning and liquidity Pro Forma Board of Directors TCF’s eight directors will include: Source: S&P Global Market Intelligence; Market data as of January 25, 2019 (1) Based on adjusted diluted earnings per common share (2) Top quartile return relative to publicly traded U.S. banks with $20 – 100 billion in assets 52% 28% 21% Jan-16 Jan-17 Jan-18 Jan-19 TCF KRX S&P 500

18 Combination Benefits Key Stakeholders Customers • Broader product suite • Improved speed to market • Lower credit concentrations enabled increased lending capabilities • Further investments in technology and digital banking supported by strong profitability and ability to leverage investments across broader customer base • Maintain strong compliance culture Employees & Culture • Shared values and principles with a strong community orientation • Highly complementary business models • Strengthened ability to recruit and retain top - tier talent • Ability to invest in talent, programs and infrastructure driven by strength of combined balance sheet • Increased professional development and career opportunities within larger banking platform Communities • Combined company will have several major centers of influence - Detroit - Twin Cities - Chicago - Midland • Longstanding commitment to meeting needs of our communities • Continued focus on supporting community development • Commitment to continue to provide meaningful contributions to various charitable and community organizations

Merger Structure

20 Key Merger Assumptions Standalone Earnings Per Share • Chemical: 2020 consensus estimate of $4.38 per share • TCF: 2020 consensus estimate of $2.00 per share Estimated Cost Savings • $180 million pre - tax (represents approximately 13% of combined 2019 expense base) • Assumed phase - in schedule: $75 million in first 12 months after closing, full $180 million run - rate thereafter Revenue Enhancements • Identified but not modeled Estimated Marks on Chemical’s Balance Sheet • Gross credit mark: $189 million (equivalent to 1.18% of gross loans and 1.6x ALLL); approximately $25 million of Chemical non - accretable credit discount will be reversed at closing and netted against the gross credit mark • Rate, spread and other fair market value marks: $200 million discount, accreted based on estimated remaining lives of individual assets and liabilities • Core deposit intangible: $168 million (equivalent to 1.50% of non - time deposits), amortized over 10 years utilizing sum - of - the - years - digits methodology Estimated Merger & Integration Costs • $325 million pre - tax • 80% tax deductible • Fully reflected in computation of pro forma tangible book value per share at closing Other • TCF repurchases $78 million of its stock prior to closing, representing the completion of its existing authorized share repurchase plan

21 Recent $1B+ bank M&A ¹ Premium At - market merger of equals 15% Run - rate GAAP EPS accretion 2 17% to Chemical 31% to TCF 8% ROAA improvement 3 +30 bps + 16 bps ROATCE improvement 3 ~300bps +200bps TBVPS dilution 4 7.9% 5.5% TBVPS crossover earnback 4 2.7 years 3.7 years / Source: S&P Global Market Intelligence (1) Median of $1 billion+ bank mergers and acquisitions since January 1, 2014; Transactions include WSFS - Beneficial, Synovus - FCB, Veritex - Green, Independent - Guaranty, Fifth Third - MB Financial, Cadence - State Bank, First Financial - MainSource , First Horizon - Capital Bank, Sterling - Astoria, IBERIABANK - Sabadell, Pinnacle - BNC, F.N.B. - Yadkin, Chemical - Talmer , Huntington - FirstMerit , BBCN - Wilshire, KeyCorp - First Niagara, BB&T - National Penn, BB&T - Susquehanna and CIT - OneWest (2) Relative to 2020 IBES consensus estimates; see page 31 for additional detail ; assumes fully phased in cost savings (3) Relative to Chemical’s standalone 2020 ROAA and ROATCE implied by IBES consensus estimates (4) See TVBPS dilution and earnback details on page 32 Exceptional Financial Returns Relative to Recent Bank Mergers and Acquisitions

22 35% 35% 10% 15% 5% Achievable Cost Synergies Drive Material Value Creation (1) Standalone market capitalizations as of January 25, 2019 (2) Capitalized value of cost synergies reflects $180 million pre - tax / $142 million after - tax cost synergies, multiplied by market - cap weighted NTM P/E multiple of 10.8x, as of closing share prices and consensus estimates on January 25, 2019, net of $ 325 million pre - tax / $270 million after - tax one - time restructuring charges; Capitalized value is not discounted to present value Centralized overhead and shared services $180 million pre - tax cost savings (13% of combined) Composition by type Illustrative market value creation IT efficiencies Facilities, contracts and procurement Retail banking, including branches Other By reducing duplication, we gain material leverage on categories of costs (e.g. overhead, IT) that have been accelerating for the past decade $1.3 billion capitalized value of net cost savings represents 19% value creation relative to each company’s standalone market capitalization $1.3B Standalone market capitalizations¹ Capitalized value of net cost savings² Illustrative combined value TCF $3.5B Chemical $3.0B $7.8B $6.5B

23 Positioned for Significant Upside $20 – 100B asset banks² Median Top Quartile Profitability¹ ROATCE ~19% 14.7% 17.3% ROAA ~1.6% 1.23% 1.49% Efficiency Ratio ~53% 56.0% 47.7% Fee Income / Revenue ~28% 22.7% 26.5% NIM ~4.0% 3.54% 3.71% Balance Sheet and Capital Loans / Deposits ~94% 93% 86% CET1 ~10.0% 11.2% 13.0% Market Information Stock Price 3 $42.47 – – Pro forma core / run - rate 2020E EPS $4.73 4 / $5.13 5 – – Price to core / run - rate 2020E EPS 9.0x / 8.3x 10.1x 11.4x Source: S&P Global Market Intelligence (1) Pro forma profitability figures for combined company estimated for 2020 assuming fully phased in cost savings; balance sheet estimated for September 30, 2019 transaction close; Balance sheet data includes purchase accounting adjustments (2) Peers include publicly traded U.S. banks with $20 – 100 billion in assets; Profitability data based on annualized performance from Q1 2018 to Q3 2018; Balance sheet information as of September 30, 2018 (3) Chemical’s closing share price on January 25, 2019 (4) Based on consensus 2020 estimates for Chemical and TCF, plus approximately $101 million of cost savings phased in during calendar year 2020 (assuming th e transaction closes in Q3 2019, and cost savings are phased in on a schedule of $75 million annualized during the first four calendar quar ter s and $180 million annualized thereafter) (5) Represents run rate EPS with fully phased in cost savings. See page 31 for detail regarding calculation of run - rate EPS accretion /

24 Premier bank in the Midwest — scaled to compete and win Shared values — strong community ties, customer - centric focus and commitment to performance Exceptional financial benefits and value creation for shareholders of both companies Complementary partners together positioned for superior growth, profitability and consistency Partnering to Create Significant Strategic and Financial Value

Appendix

26 Robust Due Diligence Process Human Capital Management Internal Audit Legal Enterprise Operations Commercial Banking Retail Banking Finance & Accounting Risk, BSA and Compliance Credit Information Technology Specialty Finance Consumer Lending • Comprehensive mutual due diligence process over six - month period • Significant engagement across all functional and business areas with day - to - day involvement of senior management • Detailed credit review • Detailed regulatory and compliance program review Comprehensive Due Diligence Process • Process included cultural assimilation dialogues • Work highlighted the shared culture and values related to both customer and employee relationships • Alignment of shared risk appetite philosophies • Leveraged Chemical’s expertise across multiple depository transactions and TCF’s experience with numerous platform and portfolio acquisitions Due Diligence Partnership Aligned with MOE Framework Diligence Scope

27 Chemical and TCF Benefit From Each Other’s Strengths Inventory Finance, Leasing & Equipment Finance Wealth & Trust Services In - Footprint C&I Lending Infrastructure Digital Platform Mortgage Banking • Robust combined enterprise risk management program • Centralized credit underwriting and credit administration • Leverage surviving core processing system • Deploy TCF’s digital banking innovations across the combined franchise • Offer Chemical’s digital small business banking product to TCF's national commercial customers • Leverage centralized elements platform (e.g. call centers, online, relationship banker) • Export TCF’s product set to Chemical’s markets and middle market customers • Leverage existing depth and diversification of TCF lending verticals • Export Chemical’s middle - market relationship banking model and talent acquisition programs into TCF’s markets • Strategy is underpinned by influential local leaders supported by centralized credit management • Deploy mortgage banking originations across combined branch network • Leverage centralized underwriting, processing, pricing and hedging • Deliver Wealth & Trust Services to all commercial and consumer channels

28 Balanced Contributions to Combined Entity ($ in billions, unless otherwise noted) Combined 1 Total assets $21.5 $23.7 $45.2 Gross loans HFI $15.3 $19.1 $34.3 Total deposits $15.6 $18.9 $34.5 Tangible common equity $1.7 $2.2 $3.9 Market capitalization 2 $3.0 $3.5 $6.5 2019 consensus net income ($mm) 3 $297 $311 $608 2020 consensus net Income ($mm) 3 $314 $314 $627 Branches 212 314 526 Source: FactSet Research Systems and S&P Global Market Intelligence; Financial data as of most recent quarter available; Numbers may not sum due to rounding (1) Combined represents the sum of Chemical and TCF data and is not reflective of any purchase accounting marks or merger adjustments (2) Based on closing prices as of January 25, 2019 (3) Consensus median estimates as of January 25, 2019 48.9% 50.0% 47.6% 44.5% 45.2% 43.1% 46.2% 51.1% 50.0% 52.4% 55.5% 54.8% 56.9% 53.8% 2019 Earnings 2020 Earnings Total Assets Gross Loans HFI Total Deposits Tang. Comm. Equity Ownership 50%

29 26% 32% 4% 28% 10% 21% 13% 41% 25% 25% 21% 26% 28% 23% 17% 34% 27% 5% 13% 2% 10% 28% 16% 25% Pro Forma Loan and Deposit Composition CRE C&I Leasing & Equipment Finance Inventory Finance Consumer Real Estate Auto Construction Other consumer Loans and leases / $15B $19B $34B Time Savings and MMDA Interest - bearing transaction Non - interest bearing transaction $16B $19B $34B Deposits Note: Chemical and TCF financial data as of the period ended December 31, 2018, numbers may not add due to rounding Time Savings and MMDA Interest - bearing transaction Non - interest bearing transaction Time Savings and MMDA Interest - bearing transaction Non - interest bearing transaction CRE C&I Leasing & Equipment Finance Inventory Finance Consumer Real Estate Auto Construction CRE C&I Consumer Real Estate Construction Other consumer 14% 22% 3% 6% 28% 4% 9% 14%

30 Combined Company Has a Strong Presence in the Most Attractive Midwest Markets Source: S&P Global Market Intelligence (1) Ranked in terms of total MSA population (2) Percent of pro forma total deposits; does not include the impact of purchase accounting (3) Deposit data as of 6/30/2018; shown pro forma for pending and recently completed acquisitions (4) Defined as the state of MI excluding the Detroit, Ann Arbor, Midland, and Grand Rapids MSAs Nearly 60% of the pro forma franchise located in 5 of the top 10 Midwest MSAs 1 9.5 4.3 3.7 2.8 2.2 2.2 2.1 2.1 2.1 1.6 Chicago Detroit MSP St. Louis Cincinatti Kansas City Columbus Indianapolis Cleveland Milwaukee 1.9% 1.7% 20.0% 15.1% 19.9% % of Pro forma franchise 2 Total Population (mm) 11.8% 82.3% 9.0% 12.0% Ann Arbor Midland Grand Rapids Greater MI #2 #1 Pro forma market share rank #4 #1 4 Pro forma deposit market share Solid deposit market share in desirable mid - size urban markets 3 $1.0 $2.2 $1.9 $6.0 Deposits in market ($B)
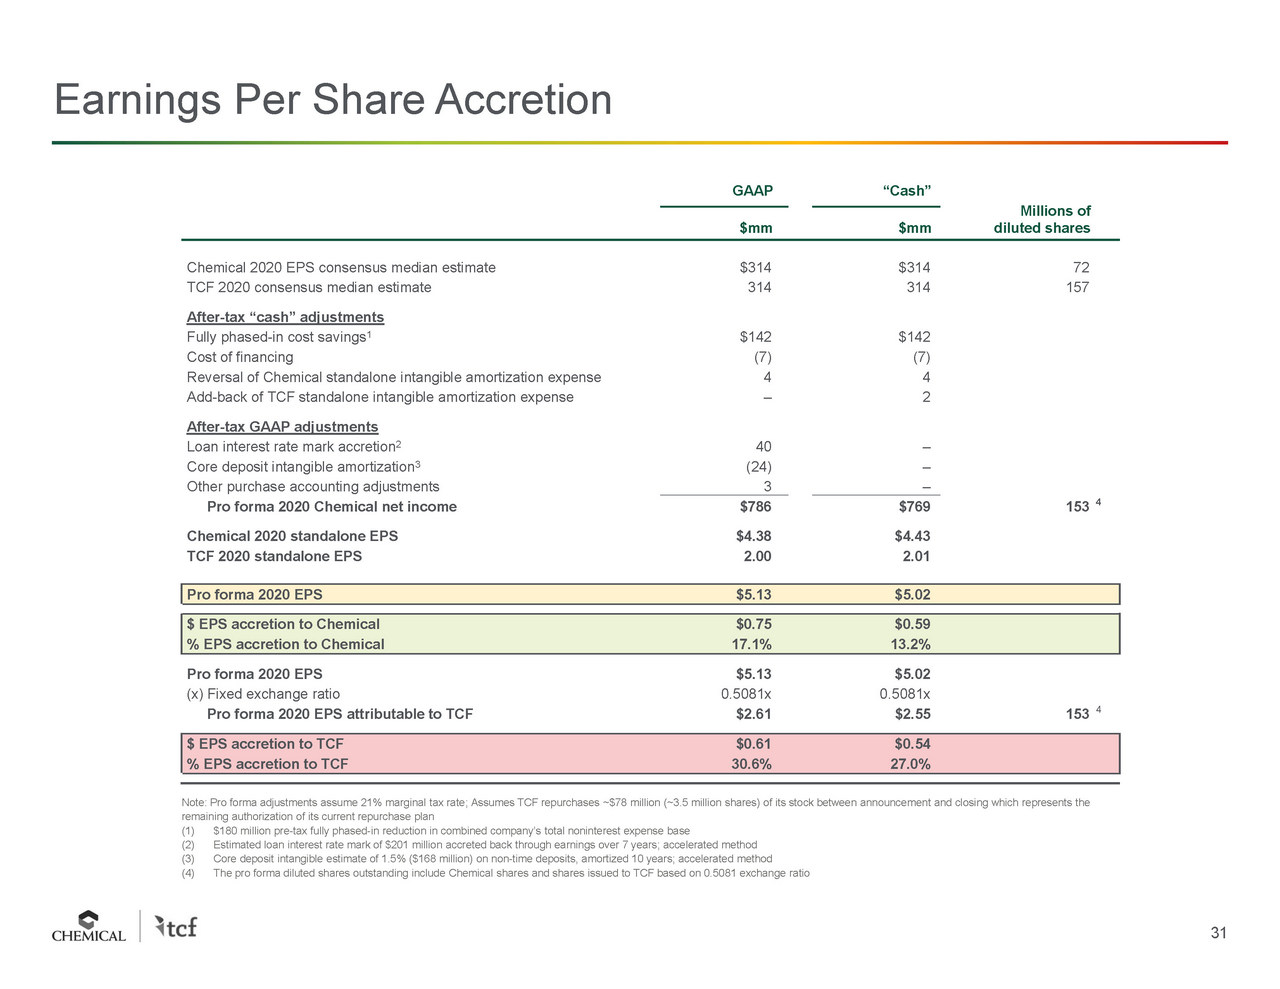
31 Earnings Per Share Accretion Note: Pro forma adjustments assume 21% marginal tax rate; Assumes TCF repurchases ~$78 million (~3.5 million shares) of its stock between announcement and closing which represents the remaining authorization of its current repurchase plan (1) $ 180 million pre - tax fully phased - in reduction in combined company’s total noninterest expense base (2) Estimated loan interest rate mark of $201 million accreted back through earnings over 7 years ; accelerated method (3) Core deposit intangible estimate of 1.5% ($ 168 million) on non - time deposits, amortized 10 years; accelerated method (4) The pro forma diluted shares outstanding include Chemical shares and shares issued to TCF based on 0.5081 exchange ratio GAAP “Cash” $mm $mm Millions of diluted shares Chemical 2020 EPS consensus median estimate $314 $314 72 TCF 2020 consensus median estimate 314 314 157 After - tax “cash” adjustments Fully phased - in c ost savings 1 $142 $142 Cost of financing (7) (7) Reversal of Chemical standalone intangible amortization expense 4 4 Add - back of TCF standalone intangible amortization expense – 2 After - tax GAAP adjustments Loan interest rate mark accretion 2 40 – Core deposit intangible amortization 3 (24) – Other purchase accounting adjustments 3 – Pro forma 2020 Chemical net income $786 $769 153 4 Chemical 2020 standalone EPS $4.38 $4.43 TCF 2020 standalone EPS 2.00 2.01 Pro forma 2020 EPS $5.13 $5.02 $ EPS accretion to Chemical $0.75 $0.59 % EPS accretion to Chemical 17.1% 13.2% Pro forma 2020 EPS $5.13 $5.02 (x) Fixed exchange ratio 0.5081x 0.5081x Pro forma 2020 EPS attributable to TCF $2.61 $2.55 153 4 $ EPS accretion to TCF $0.61 $0.54 % EPS accretion to TCF 30.6% 27.0%

32 Purchase Accounting Summary Note: Pro forma adjustments assume 21% marginal tax rate; Assumes TCF repurchases ~$78 million (~3.5 million shares) of its stock between announcement and closing which represents the remaining authorization of its current rep urc hase plan (1) Chemical tangible book value equal to common shareholders equity less goodwill and other intangible assets (2) Reflects hypothetical transaction value based on 1.9681 shares of TCF stock for each Chemical common share outstanding, based on the reciprocal of the actual consideration being off er ed (3) Based on 0.5081 shares of Chemical stock for each TCF common share outstanding (4) Based on expectations and assumptions as of announcement date; subject to change at transaction closing 9/30/2019 (5) Based on when pro forma tangible book value per share crosses over and begins to exceed projected stand alone Chemical tangible book value per share (6) Estimated TCF tangible common equity at close based on 1Q – 3Q ’19 consensus earnings and dividend estimates (7) Gross pre - tax credit mark of $189mm, net of projected ALLL at closing and certain existing credit marks on Chemical’s loans, tax - effected at a 21% tax rate Tangible book value per share earnback Crossover (dynamic) earnback The point at which the company’s pro forma tangible book value per share crosses where it would have been based upon standalone estimates Static earnback Per share level of tangible book value per share dilution divided by the per share level of fully phased - in annual EPS accretion 2.7 years 2.7 years Tangible book value per share dilution and earnback Forma Millions $ millions of basic s hares $ per share Chemical standalone Chemical tangible book value as of December 31, 2018 1 $1,673 71 Three quarters of consensus earnings prior to close 221 Three quarters of consensus per share common dividends 74 Amortization of existing core deposit intangibles 4 Standalone Chemical tangible book value at close $1,824 71 $25.52 Pro forma Standalone Chemical tangible book value at close $1,824 71 $25.52 Standalone TCF tangible book value at close 2,275 Reversal of Chemical equity capital and intangibles (1,824 ) Merger consideration for accounting purposes 2 3,044 82 3 Goodwill and other intangibles created 4 ( 1,451 ) After - tax restructuring expenses ( 270 ) Pro forma Chemical tangible book value at close $3,596 153 $23.51 $ dilution to Chemical ($2.01) % dilution to Chemical (7.9%) Tangible book value per share earnback 5 2.7 years Calculation of intangibles created $ millions Merger consideration for accounting purposes 2 $3,044 Standalone Chemical tangible book value at close 6 $1,824 (+) Net after - tax credit mark 7 (39) (+) After - tax other fair value adjustments ( 158) Adjusted tangible book value $1,627 Excess over adjusted tangible book value $ 1,416 (+) Core deposit intangible created (168) (+) DTL on CDI 35 Goodwill created $ 1,283 Goodwill and other intangibles created $ 1,451 TBVPS earnback illustration $20.00 $30.00 $40.00 $50.00 Pre- Merger Pro Forma At Close 0.25 1.25 2.25 3.25 4.25 5.25 6.25 TBV per Share ($) TBV Earnback (Years) Pro Forma TBV per Share ($) CHFC TBV per Share ($) CHFC Est. TBV per Share ($) at Close Crossover Static