Attached files
| file | filename |
|---|---|
| 8-K - FORM 8-K - CHEMUNG FINANCIAL CORP | f8k_110718.htm |
Exhibit 99.1
CHEMUNG FINANCIAL CORPORATION 2018 Investor Presentation
Anders Tomson, President and CEO Karl Krebs, CFO Presenters November 16, 2017 Naples, FL 2
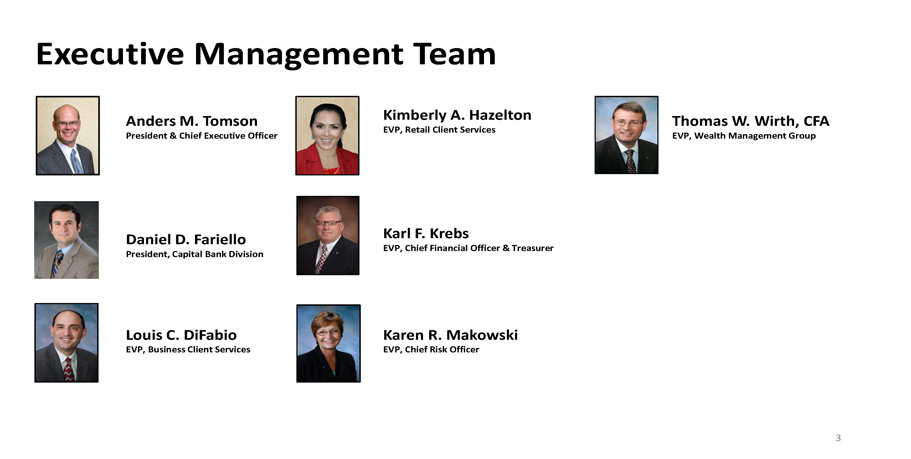
Anders M. Tomson President & Chief Executive Officer Kimberly A. Hazelton EVP, Retail Client Services Thomas W. Wirth, CFA EVP, Wealth Management Group Daniel D. Fariello President, Capital Bank Division Karl F. Krebs EVP, Chief Financial Officer & Treasurer Louis C. DiFabio EVP, Business Client Services Karen R. Makowski EVP, Chief Risk Officer Executive Management Team 3
Our namesake…the Chemung Canal 4
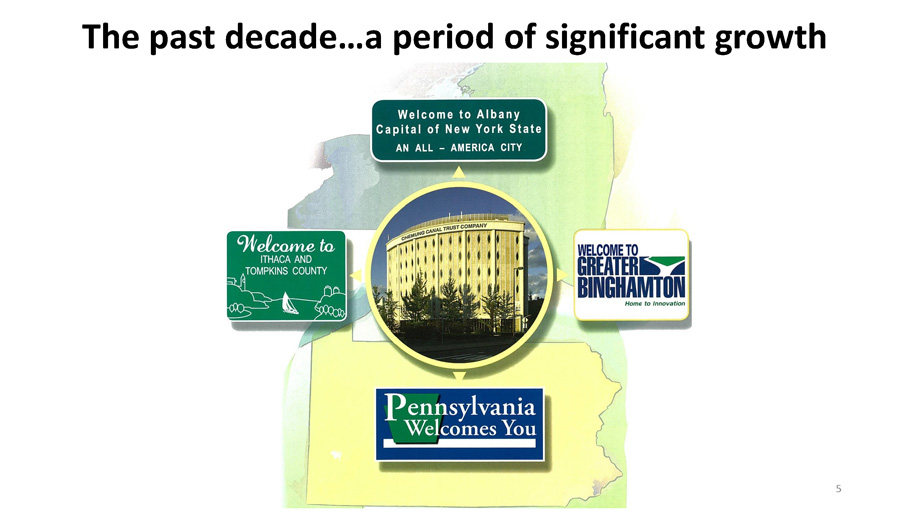
The past decade…a period of significant growth 5
This presentation contains certain statements that may be considered forward - looking statements within the meaning of Section 27 A of the Securities Act, Section 21 E of the Exchange Act, and the Private Securities Litigation Reform Act of 1995 , which are subject to numerous risks and uncertainties . Forward looking statements can be identified by words such as "anticipates," "believes," "contemplates," "feels", "expects," "estimates," "seeks," "strives," "plans," "intends," "outlook," "forecast," "position," "target," "mission," "assume," "achievable," "potential," "strategy," "goal," "aspiration," "opportunity," "initiative," "outcome," "continue," "remain," "maintain," "on course," "trend," "objective," "looks forward," "projects," "models" and variations of such words and similar expressions, or future or conditional verbs such as "will," "would," "should," "could," "might," "can," "may," or similar expressions, which predict or indicate future events or trends and which do not relate to historical matters . These forward - looking statements are predicated on the beliefs and assumptions of Chemung Financial Corporations ' management based on information known to management as of the date of this presentation and do not purport to speak as of any other date . Forward looking statements should not be relied upon, because they involve known and unknown risks, uncertainties and other factors, some of which are beyond the control of the company . Should one or more of these risks materialize or should underlying beliefs or assumptions prove incorrect, the Corporation’s actual results, performance or achievements could differ materially from those discussed . Factors that could cause or contribute to such differences include but are not limited to : changes in general economic, political or industry conditions ; changes in monetary and fiscal policies, including changes in interest rates ; volatility and disruptions in capital and credit markets ; changes in regulation or oversight ; unfavorable developments concerning credit quality ; the effects of more stringent capital or liquidity requirements ; declines or other changes in the businesses or industries of customers of the Corporation’s and its subsidiaries ; operational difficulties, failure of technology infrastructure or information security incidents ; the implementation of the Company’s strategies and business initiatives ; changes in the financial markets, including fluctuations in interest rates ; competitive product and pricing pressures among financial institutions within the Corporation’s markets ; changes in customer behavior ; any future strategic acquisitions or divestitures ; management's ability to maintain and expand customer relationships ; management's ability to retain key officers and employees ; the impact of legal and regulatory proceedings or determinations ; the effectiveness of methods of reducing risk exposures ; the effects of terrorist activities and other hostilities ; the effects of catastrophic events including, but not limited to, severe weather events and storms ; changes in accounting standards . The Corporation cautions that the foregoing list of factors is not exclusive . For a discussion of factors that may cause actual results to differ from expectations, please refer to "Item 1 A . Risk Factors" of the Chemung Financial Corporation’s Annual Report on Form 10 - K for the year ended December 31 , 2016 , as updated by our filings on Form 10 - Q and other filings with the SEC . Forward - looking statements speak only as of the date they are made . The Corporation does not undertake to update forward - looking statements to reflect facts, circumstances, assumptions or events that occur after the date the forward - looking statements are made . For any forward - looking statements made in this presentation or in any documents, the Corporation claims the protection of the safe harbor for forward - looking statements contained in the Private Securities Litigation Reform Act of 1995 . Safe Harbor Statement 6
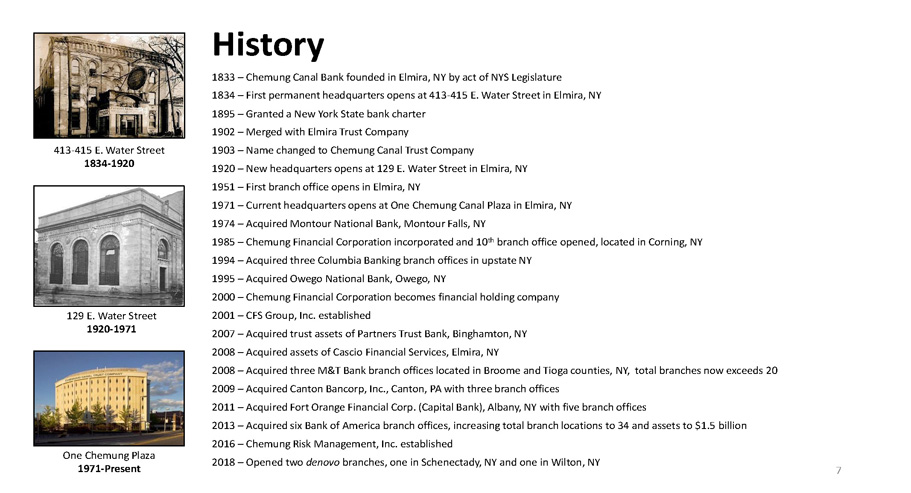
1833 – Chemung Canal Bank founded in Elmira, NY by act of NYS Legislature 1834 – First permanent headquarters opens at 413 - 415 E. Water Street in Elmira, NY 1895 – Granted a New York State bank charter 1902 – Merged with Elmira Trust Company 1903 – Name changed to Chemung Canal Trust Company 1920 – New headquarters opens at 129 E. Water Street in Elmira, NY 1951 – First branch office opens in Elmira, NY 1971 – Current headquarters opens at One Chemung Canal Plaza in Elmira, NY 1974 – Acquired Montour National Bank, Montour Falls, NY 1985 – Chemung Financial Corporation incorporated and 10 th branch office opened, located in Corning, NY 1994 – Acquired three Columbia Banking branch offices in upstate NY 1995 – Acquired Owego National Bank, Owego, NY 2000 – Chemung Financial Corporation becomes financial holding company 2001 – CFS Group, Inc. established 2007 – Acquired trust assets of Partners Trust Bank, Binghamton, NY 2008 – Acquired assets of Cascio Financial Services, Elmira, NY 2008 – Acquired three M&T Bank branch offices located in Broome and Tioga counties, NY, total branches now exceeds 20 2009 – Acquired Canton Bancorp, Inc., Canton, PA with three branch offices 2011 – Acquired Fort Orange Financial Corp. (Capital Bank), Albany, NY with five branch offices 2013 – Acquired six Bank of America branch offices, increasing total branch locations to 34 and assets to $1.5 billion 2016 – Chemung Risk Management, Inc. established 2018 – Opened two denovo branches, one in Schenectady, NY and one in Wilton, NY History 413 - 415 E. Water Street 1834 - 1920 129 E. Water Street 1920 - 1971 One Chemung Plaza 1971 - Present 7
Our mission is to remain a strong and independent financial services organization creating value for shareholders, customers, employees and the communities where we do business, while maintaining the highest standards of business ethics. • Value for shareholders means delivering a competitive return on investment through stock appreciation and dividends • Value for customers means delivering superior customer service and competitive products and services • Value for employees means ensuring that Chemung Canal remains a great place to work, providing competitive compensation and benefits, and opportunities for career advancement and growth • Value for communities means continuing to be an integral part of the communities we serve, being responsive to the financial needs within these communities and being a good corporate citizen • Earnings growth is the fuel that drives value creation Mission 8
• Oldest locally - owned and managed community bank in NYS, dating to 1833 • NYS c hartered b ank and Member of the Federal Reserve • Listed on Nasdaq Stock Market, LLC • Assets of $1.75 billion and 363 employees • Operates through a single subsidiary bank, Chemung Canal Trust Company, with 35 branch offices spread over twelve counties in NYS and one county in PA. • 28 branch offices operate under the CCTC, covering the Finger Lakes Region and Southern Tier of NYS and the Northern Tier of PA. • Seven branch offices operate under the Capital Bank name in the Capital Region of NYS. • Strong Chemung Canal Trust Company Board and Capital Bank A dvisory Board provides local market knowledge and business development opportunities. • Trust and wealth management division with $1.9 billion in assets under management or administration. • CFS Group Inc. provides mutual funds, securities and insurance brokerage services through LPL Financial. • Chemung Risk Management, Inc., the Corporation’s Nevada - based captive insurance company which insures against certain risks unique to the operations of the Corporation and its subsidiaries for which insurance may not be currently available or economically feasible in today’s insurance marketplace. About Chemung Financial Corporation 9
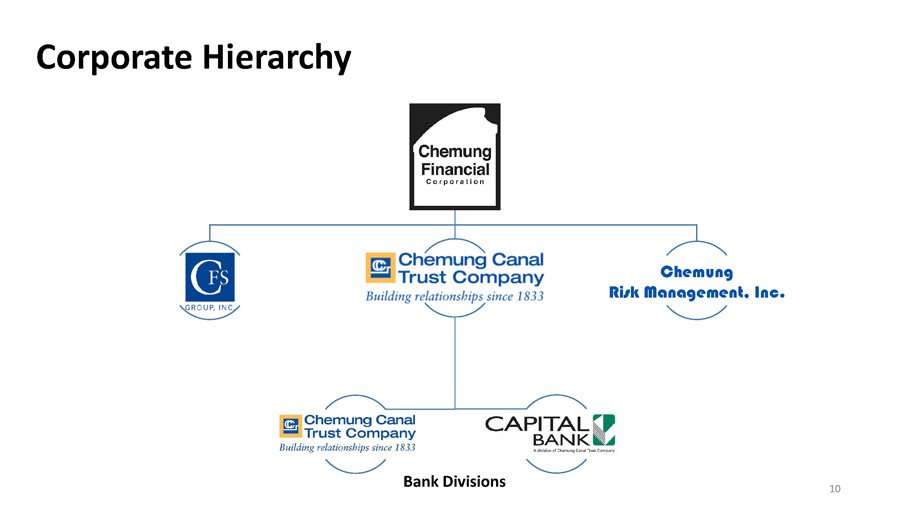
10 Corporate Hierarchy Chemung Risk Management, Inc. Bank Divisions
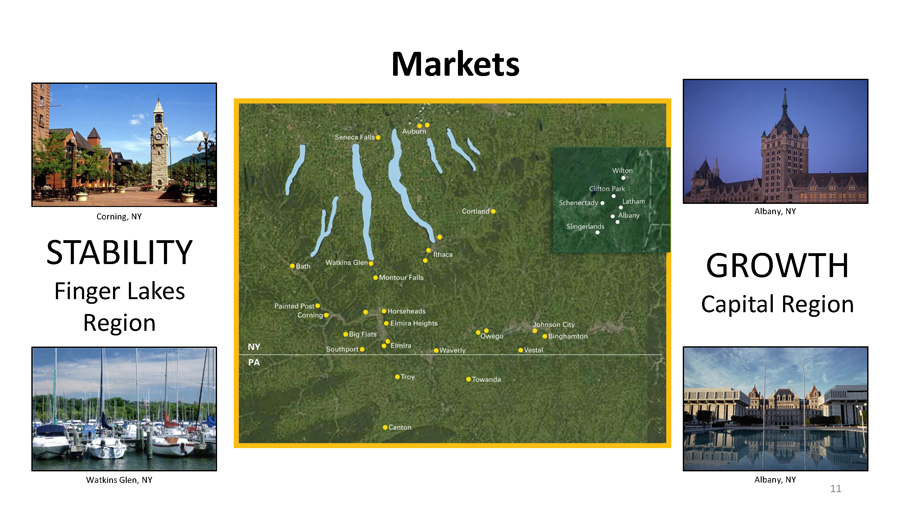
GROWTH Capital Region STABILITY Finger Lakes Region Markets Corning, NY Watkins Glen, NY Albany, NY Albany, NY 11
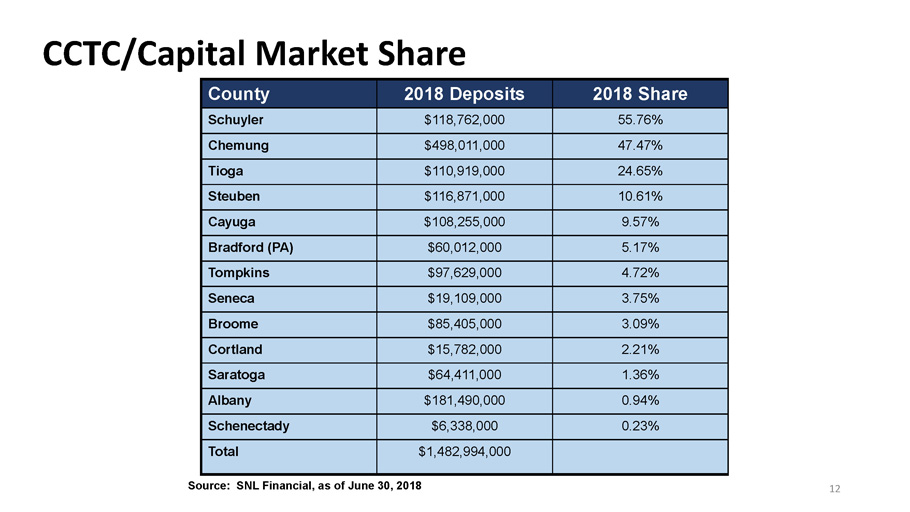
CCTC/Capital Market Share County 2018 Deposits 2018 Share Schuyler $118,762,000 55.76% Chemung $498,011,000 47.47% Tioga $110,919,000 24.65% Steuben $116,871,000 10.61% Cayuga $108,255,000 9.57% Bradford (PA) $60,012,000 5.17% Tompkins $97,629,000 4.72% Seneca $19,109,000 3.75% Broome $85,405,000 3.09% Cortland $15,782,000 2.21% Saratoga $64,411,000 1.36% Albany $181,490,000 0.94% Schenectady $6,338,000 0.23% Total $1,482,994,000 Source: SNL Financial, as of June 30, 2018 12
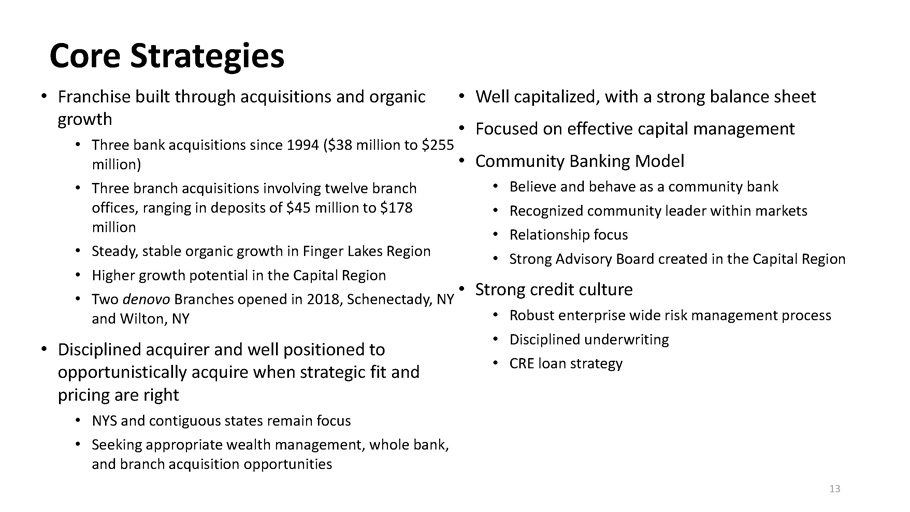
• Franchise built through acquisitions and organic growth • Three bank acquisitions since 1994 ($38 million to $255 million) • Three branch acquisitions involving twelve branch offices, ranging in deposits of $45 million to $178 million • Steady, stable organic growth in Finger Lakes Region • Higher growth potential in the Capital Region • Two denovo Branches opened in 2018, Schenectady, NY and Wilton, NY • Disciplined acquirer and well positioned to opportunistically acquire when strategic fit and pricing are right • NYS and contiguous states remain focus • Seeking appropriate wealth management, whole bank, and branch acquisition opportunities • Well capitalized, with a strong balance sheet • Focused on effective capital management • Community Banking Model • Believe and behave as a community bank • Recognized community leader within markets • Relationship focus • Strong Advisory Board created in the Capital Region • Strong credit culture • Robust enterprise wide risk management process • Disciplined underwriting • CRE loan strategy Core Strategies 13
Platinum Promise is a pledge from every one of us at Chemung Canal Trust Company to do everything within our power to make your business with us as helpful, friendly, prompt and courteous as possible. If it means meeting with you outside normal business hours or on a weekend, we’ll do it. Platinum Promise also means we’ll return your calls and answer your questions quickly. You’ll receive fast answers on loan applications, and knowledgeable help offered professionally with no “hard sell” approach. Since people like to do business with people they like, we’re committed to treating our clients and each other with the utmost courtesy and respect. We want to make your banking experience a pleasure instead of an errand . • Includes external and internal clients • Continuous client surveys • Starts when employees are first hired • Extensive training Platinum Promise 14
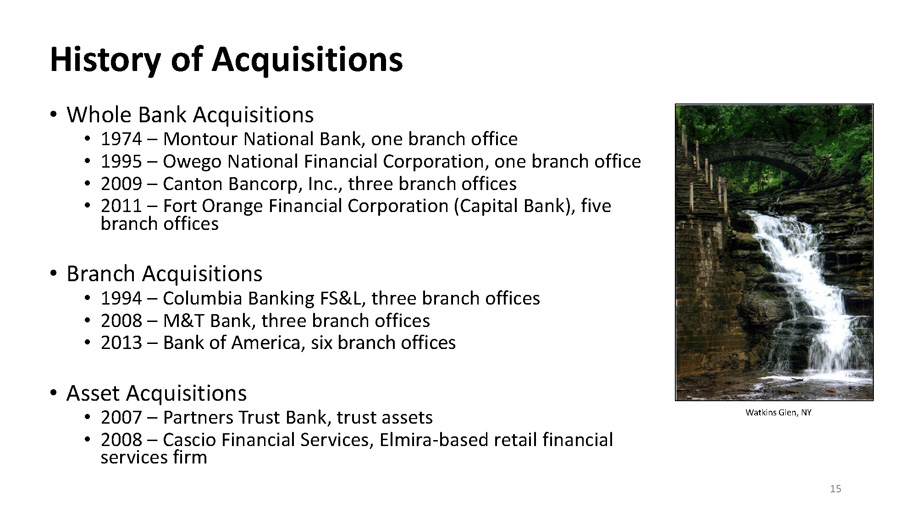
• Whole Bank Acquisitions • 1974 – Montour National Bank, one branch office • 1995 – Owego National Financial Corporation, one branch office • 2009 – Canton Bancorp, Inc., three branch offices • 2011 – Fort Orange Financial Corporation (Capital Bank), five branch offices • Branch Acquisitions • 1994 – Columbia Banking FS&L, three branch offices • 2008 – M&T Bank, three branch offices • 2013 – Bank of America, six branch offices • Asset Acquisitions • 2007 – Partners Trust Bank, trust assets • 2008 – Cascio Financial Services, Elmira - based retail financial services firm History of Acquisitions Watkins Glen, NY 15
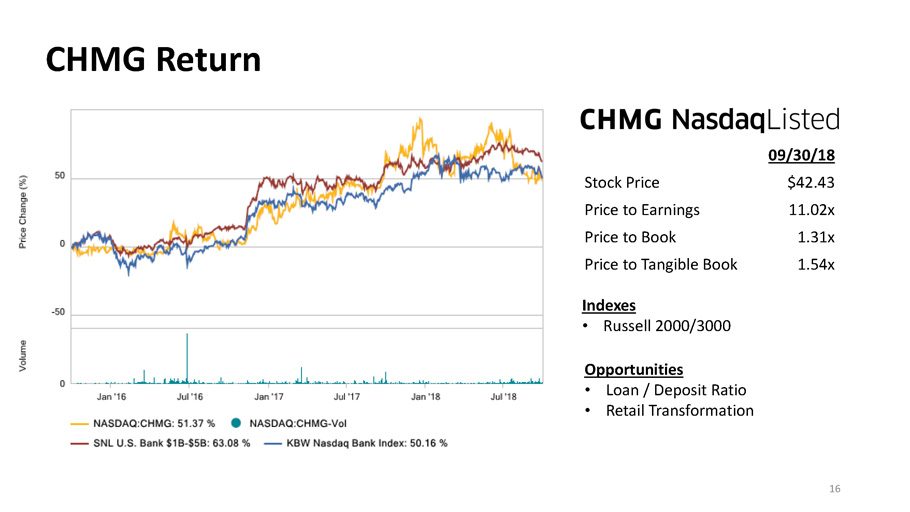
09/30/18 Stock Price $42.43 Price to Earnings 11.02x Price to Book 1.31x Price to Tangible Book 1.54x Opportunities • Loan / Deposit Ratio • Retail Transformation CHMG Return 16 Indexes • Russell 2000/3000
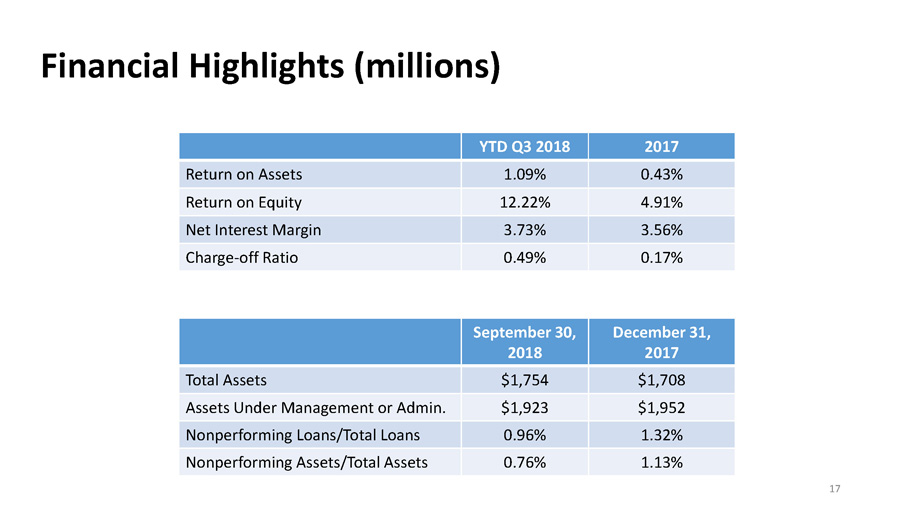
YTD Q3 2018 2017 Return on Assets 1.09% 0.43% Return on Equity 12.22% 4.91% Net Interest Margin 3.73% 3.56% Charge - off Ratio 0.49% 0.17% September 30 , 2018 December 31, 2017 Total Assets $1,754 $1,708 Assets Under Management or Admin. $1,923 $1,952 Nonperforming Loans/Total Loans 0.96% 1.32% Nonperforming Assets/Total Assets 0.76% 1.13% Financial Highlights (millions) 17
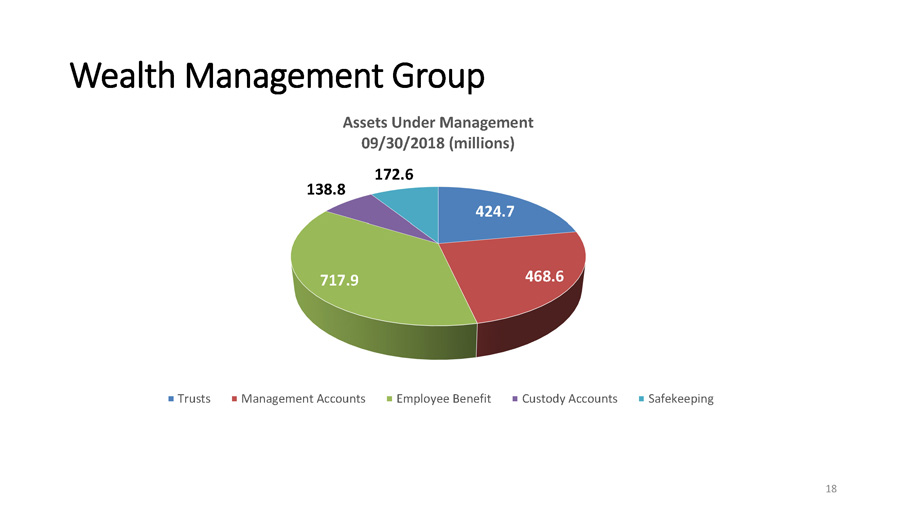
Wealth Management Group 18 424.7 468.6 717.9 138.8 172.6 Assets Under Management 09/30/2018 (millions) Trusts Management Accounts Employee Benefit Custody Accounts Safekeeping
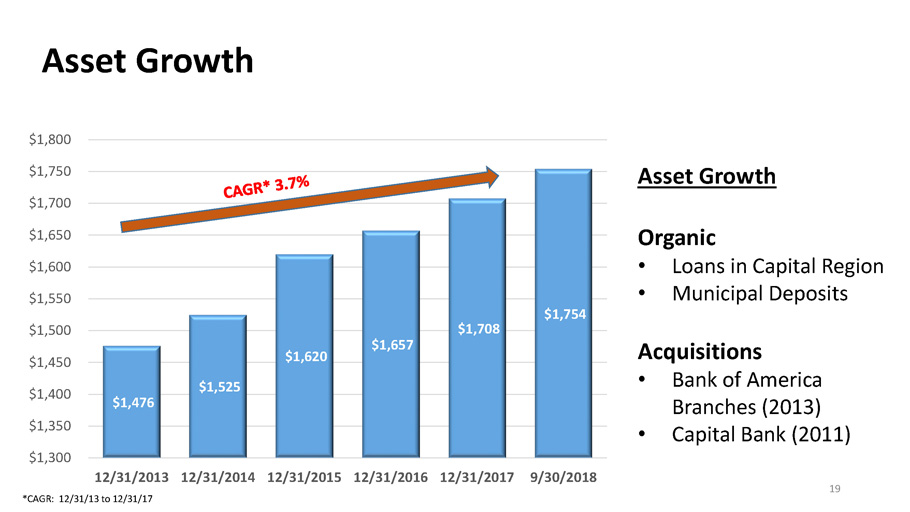
$1,476 $1,525 $1,620 $1,657 $1,708 $1,754 $1,300 $1,350 $1,400 $1,450 $1,500 $1,550 $1,600 $1,650 $1,700 $1,750 $1,800 12/31/2013 12/31/2014 12/31/2015 12/31/2016 12/31/2017 9/30/2018 Asset Growth Organic • Loans in Capital Region • Municipal Deposits Acquisitions • Bank of America Branches (2013) • Capital Bank (2011) Asset Growth 19 *CAGR: 12/31/13 to 12/31/17
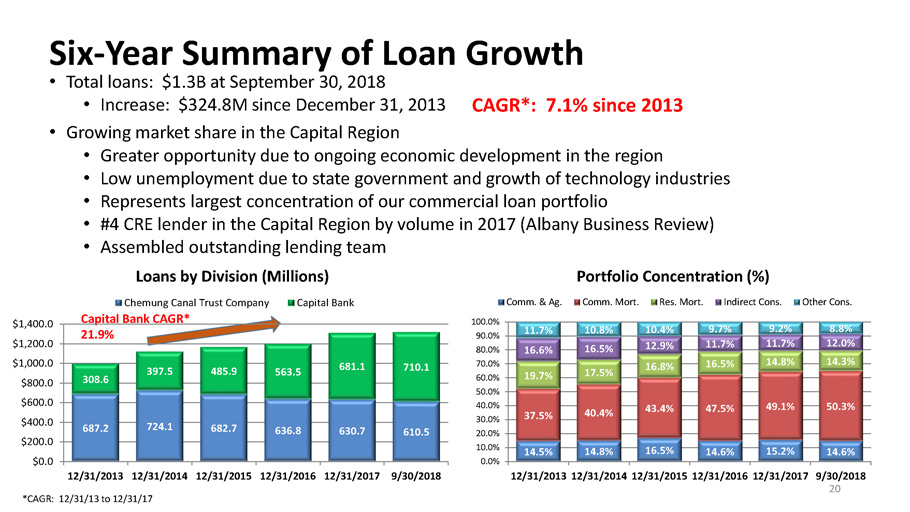
• Total loans: $1.3B at September 30, 2018 • Increase: $324.8M since December 31, 2013 • Growing market share in the Capital Region • Greater opportunity due to ongoing economic development in the region • Low unemployment due to state government and growth of technology industries • Represents largest concentration of our commercial loan portfolio • #4 CRE lender in the Capital Region by volume in 2017 (Albany Business Review) • Assembled outstanding lending team CAGR*: 7.1% since 2013 14.5% 14.8% 16.5% 14.6% 15.2% 14.6% 37.5% 40.4% 43.4% 47.5% 49.1% 50.3% 19.7% 17.5% 16.8% 16.5% 14.8% 14.3% 16.6% 16.5% 12.9% 11.7% 11.7% 12.0% 11.7% 10.8% 10.4% 9.7% 9.2% 8.8% 0.0% 10.0% 20.0% 30.0% 40.0% 50.0% 60.0% 70.0% 80.0% 90.0% 100.0% 12/31/2013 12/31/2014 12/31/2015 12/31/2016 12/31/2017 9/30/2018 Portfolio Concentration (%) Comm. & Ag. Comm. Mort. Res. Mort. Indirect Cons. Other Cons. Six - Year Summary of Loan Growth 20 *CAGR: 12/31/13 to 12/31/17 Capital Bank CAGR* 21.9% 687.2 724.1 682.7 636.8 630.7 610.5 308.6 397.5 485.9 563.5 681.1 710.1 $0.0 $200.0 $400.0 $600.0 $800.0 $1,000.0 $1,200.0 $1,400.0 12/31/2013 12/31/2014 12/31/2015 12/31/2016 12/31/2017 9/30/2018 Loans by Division (Millions) Chemung Canal Trust Company Capital Bank
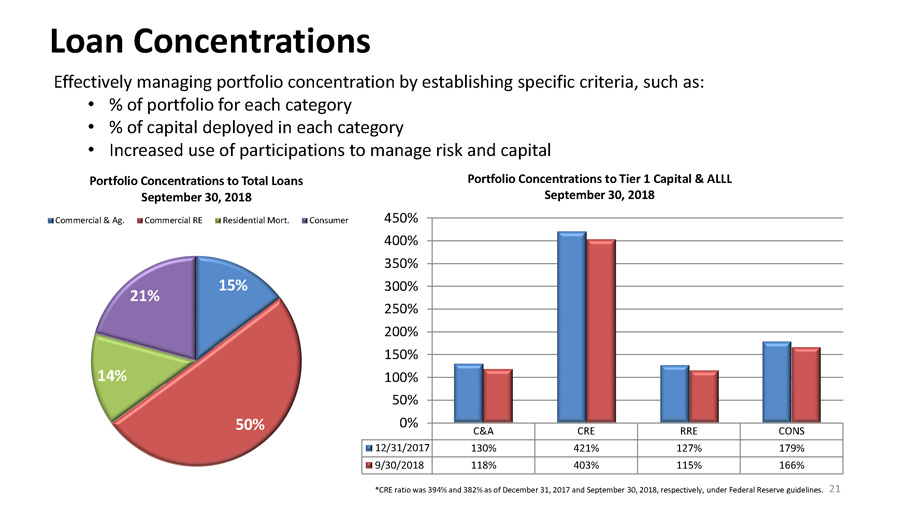
15% 50% 14% 21% Portfolio Concentrations to Total Loans September 30, 2018 Commercial & Ag. Commercial RE Residential Mort. Consumer C&A CRE RRE CONS 12/31/2017 130% 421% 127% 179% 9/30/2018 118% 403% 115% 166% 0% 50% 100% 150% 200% 250% 300% 350% 400% 450% Portfolio Concentrations to Tier 1 Capital & ALLL September 30, 2018 Effectively managing portfolio concentration by establishing specific criteria, such as: • % of portfolio for each category • % of capital deployed in each category • Increased use of participations to manage risk and capital Loan Concentrations 21 *CRE ratio was 394% and 382% as of December 31, 2017 and September 30, 2018, respectively, under Federal Reserve guidelines.
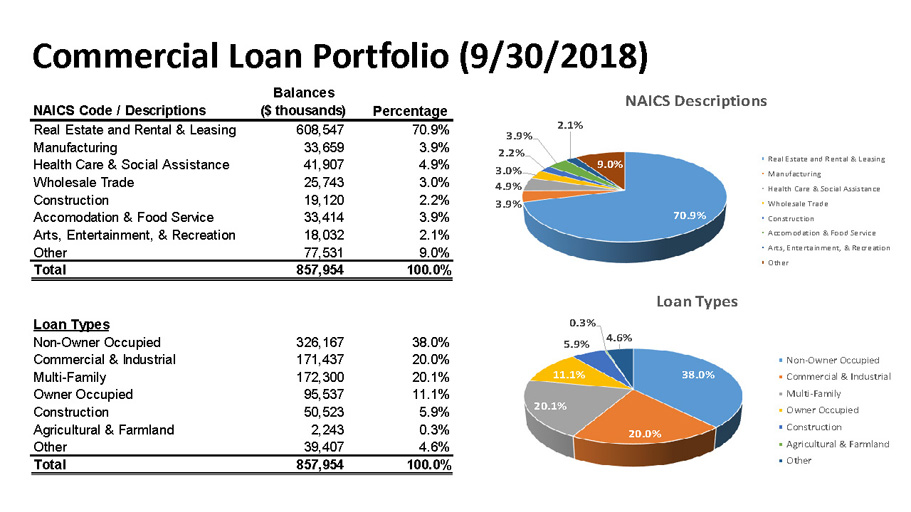
Commercial Loan Portfolio (9/30/2018) 22 NAICS Code / Descriptions Balances ($ thousands) Percentage Real Estate and Rental & Leasing 608,547 70.9% Manufacturing 33,659 3.9% Health Care & Social Assistance 41,907 4.9% Wholesale Trade 25,743 3.0% Construction 19,120 2.2% Accomodation & Food Service 33,414 3.9% Arts, Entertainment, & Recreation 18,032 2.1% Other 77,531 9.0% Total 857,954 100.0% Loan Types Non-Owner Occupied 326,167 38.0% Commercial & Industrial 171,437 20.0% Multi-Family 172,300 20.1% Owner Occupied 95,537 11.1% Construction 50,523 5.9% Agricultural & Farmland 2,243 0.3% Other 39,407 4.6% Total 857,954 100.0% 70.9% 3.9% 4.9% 3.0% 2.2% 3.9% 2.1% 9.0% NAICS Descriptions Real Estate and Rental & Leasing Manufacturing Health Care & Social Assistance Wholesale Trade Construction Accomodation & Food Service Arts, Entertainment, & Recreation Other 38.0% 20.0% 20.1% 11.1% 5.9% 0.3% 4.6% Loan Types Non-Owner Occupied Commercial & Industrial Multi-Family Owner Occupied Construction Agricultural & Farmland Other
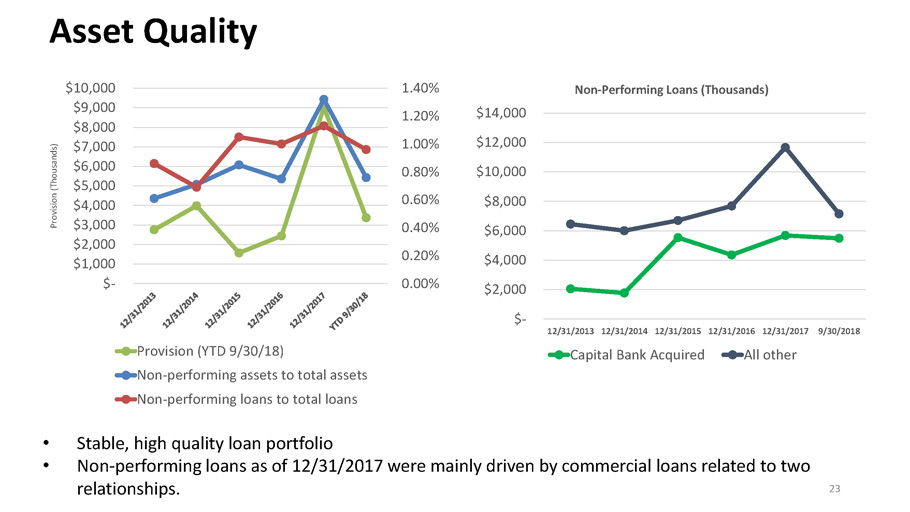
Asset Quality • Stable, high quality loan portfolio • Non - performing loans as of 12/31/2017 were mainly driven by commercial loans related to two relationships. 0.00% 0.20% 0.40% 0.60% 0.80% 1.00% 1.20% 1.40% $- $1,000 $2,000 $3,000 $4,000 $5,000 $6,000 $7,000 $8,000 $9,000 $10,000 Provision (Thousands) Provision (YTD 9/30/18) Non-performing assets to total assets Non-performing loans to total loans 23 $- $2,000 $4,000 $6,000 $8,000 $10,000 $12,000 $14,000 12/31/2013 12/31/2014 12/31/2015 12/31/2016 12/31/2017 9/30/2018 Non - Performing Loans (Thousands) Capital Bank Acquired All other
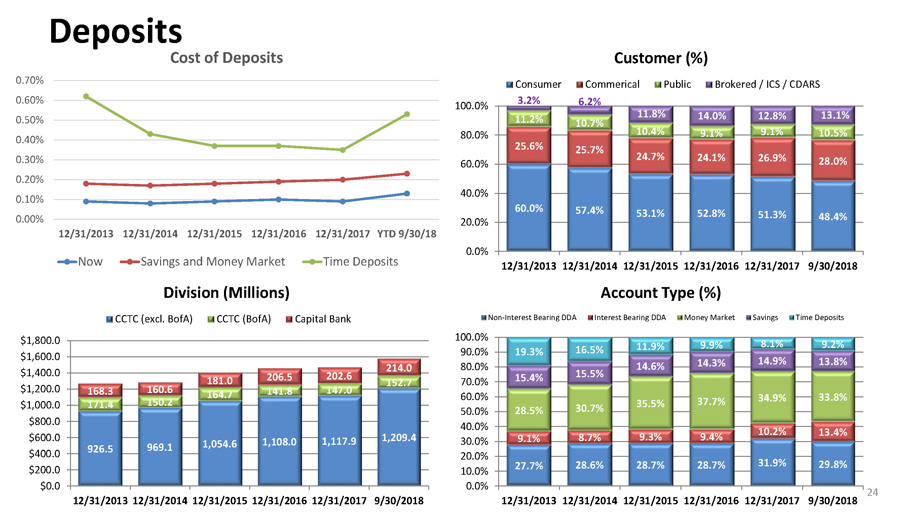
Deposits 24 60.0% 57.4% 53.1% 52.8% 51.3% 48.4% 25.6% 25.7% 24.7% 24.1% 26.9% 28.0% 11.2% 10.7% 10.4% 9.1% 9.1% 10.5% 3.2% 6.2% 11.8% 14.0% 12.8% 13.1% 0.0% 20.0% 40.0% 60.0% 80.0% 100.0% 12/31/2013 12/31/2014 12/31/2015 12/31/2016 12/31/2017 9/30/2018 Customer (%) Consumer Commerical Public Brokered / ICS / CDARS 27.7% 28.6% 28.7% 28.7% 31.9% 29.8% 9.1% 8.7% 9.3% 9.4% 10.2% 13.4% 28.5% 30.7% 35.5% 37.7% 34.9% 33.8% 15.4% 15.5% 14.6% 14.3% 14.9% 13.8% 19.3% 16.5% 11.9% 9.9% 8.1% 9.2% 0.0% 10.0% 20.0% 30.0% 40.0% 50.0% 60.0% 70.0% 80.0% 90.0% 100.0% 12/31/2013 12/31/2014 12/31/2015 12/31/2016 12/31/2017 9/30/2018 Account Type (%) Non-Interest Bearing DDA Interest Bearing DDA Money Market Savings Time Deposits 926.5 969.1 1,054.6 1,108.0 1,117.9 1,209.4 171.4 150.2 164.7 141.8 147.0 152.7 168.3 160.6 181.0 206.5 202.6 214.0 $0.0 $200.0 $400.0 $600.0 $800.0 $1,000.0 $1,200.0 $1,400.0 $1,600.0 $1,800.0 12/31/2013 12/31/2014 12/31/2015 12/31/2016 12/31/2017 9/30/2018 Division (Millions) CCTC (excl. BofA) CCTC (BofA) Capital Bank 0.00% 0.10% 0.20% 0.30% 0.40% 0.50% 0.60% 0.70% 12/31/2013 12/31/2014 12/31/2015 12/31/2016 12/31/2017 YTD 9/30/18 Cost of Deposits Now Savings and Money Market Time Deposits
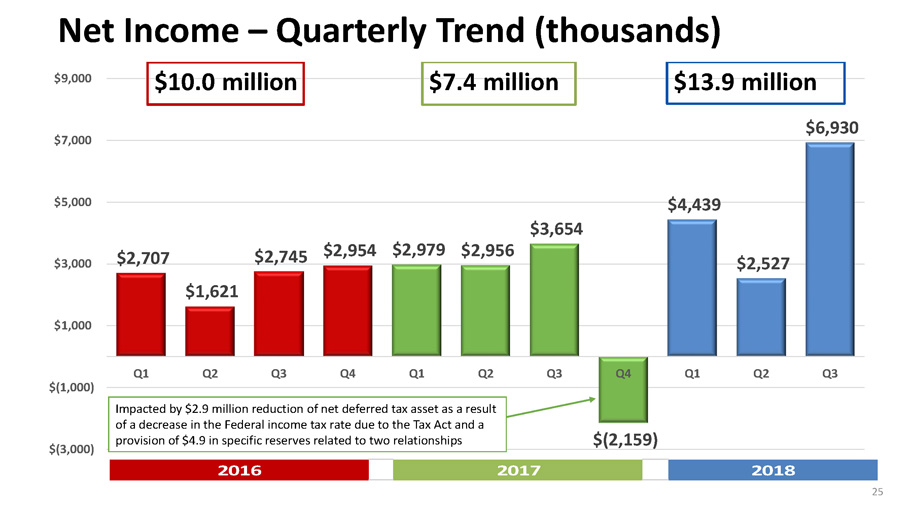
$2,707 $1,621 $2,745 $2,954 $2,979 $2,956 $3,654 $(2,159) $4,439 $2,527 $6,930 $(3,000) $(1,000) $1,000 $3,000 $5,000 $7,000 $9,000 Q1 Q2 Q3 Q4 Q1 Q2 Q3 Q4 Q1 Q2 Q3 $7.4 million $10.0 million $13.9 million Net Income – Quarterly Trend (thousands) 25 Impacted by $2.9 million reduction of net deferred tax asset as a result of a decrease in the Federal income tax rate due to the Tax Act and a provision of $4.9 in specific reserves related to two relationships 2016 2017 2018
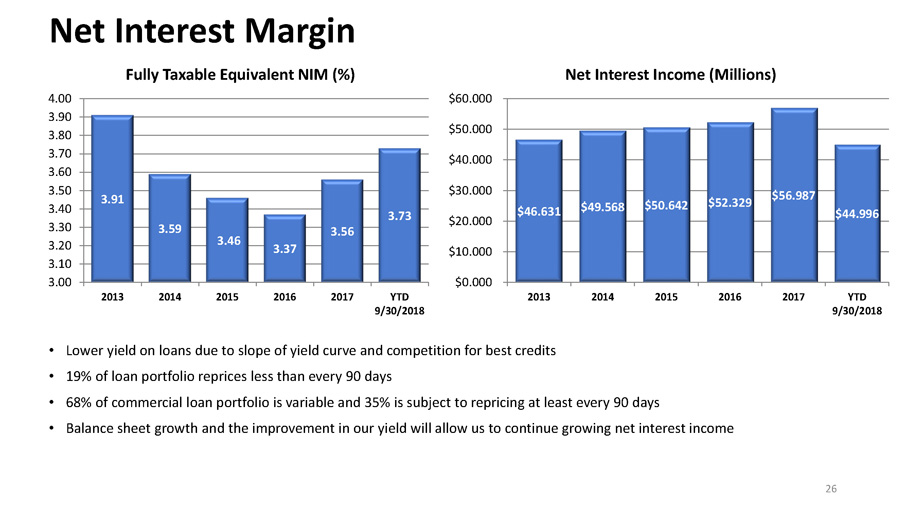
• Lower yield on loans due to slope of yield curve and competition for best credits • 19% of loan portfolio reprices less than every 90 days • 68% of commercial loan portfolio is variable and 35% is subject to repricing at least every 90 days • Balance sheet growth and the improvement in our yield will allow us to continue growing net interest income Net Interest Margin 26 $46.631 $49.568 $50.642 $52.329 $56.987 $44.996 $0.000 $10.000 $20.000 $30.000 $40.000 $50.000 $60.000 2013 2014 2015 2016 2017 YTD 9/30/2018 Net Interest Income (Millions) 3.91 3.59 3.46 3.37 3.56 3.73 3.00 3.10 3.20 3.30 3.40 3.50 3.60 3.70 3.80 3.90 4.00 2013 2014 2015 2016 2017 YTD 9/30/2018 Fully Taxable Equivalent NIM (%)
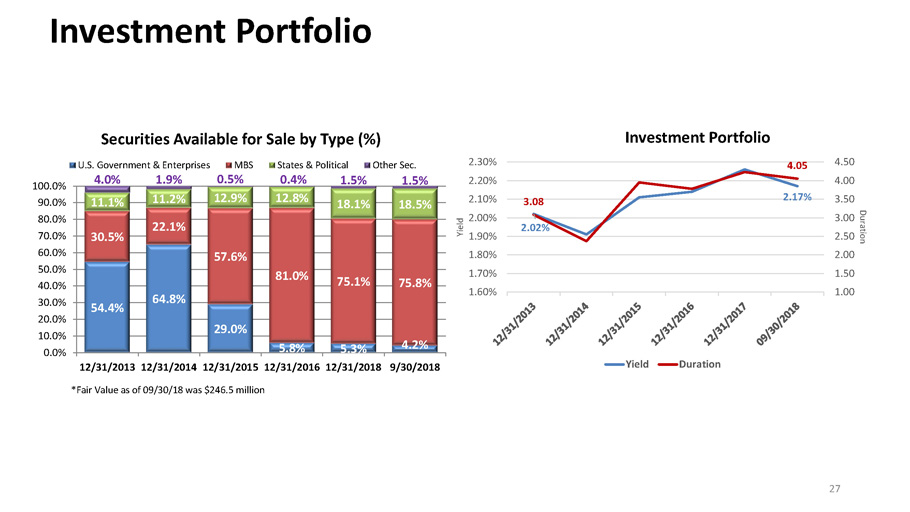
54.4% 64.8% 29.0% 5.8% 5.3% 4.2% 30.5% 22.1% 57.6% 81.0% 75.1% 75.8% 11.1% 11.2% 12.9% 12.8% 18.1% 18.5% 4.0% 1.9% 0.5% 0.4% 1.5% 1.5% 0.0% 10.0% 20.0% 30.0% 40.0% 50.0% 60.0% 70.0% 80.0% 90.0% 100.0% 12/31/2013 12/31/2014 12/31/2015 12/31/2016 12/31/2018 9/30/2018 Securities Available for Sale by Type (%) U.S. Government & Enterprises MBS States & Political Other Sec. 2.02% 2.17% 3.08 4.05 1.00 1.50 2.00 2.50 3.00 3.50 4.00 4.50 1.60% 1.70% 1.80% 1.90% 2.00% 2.10% 2.20% 2.30% Duration Yield Investment Portfolio Yield Duration Investment Portfolio 27 * Fair Value as of 09/30/18 was $246.5 million
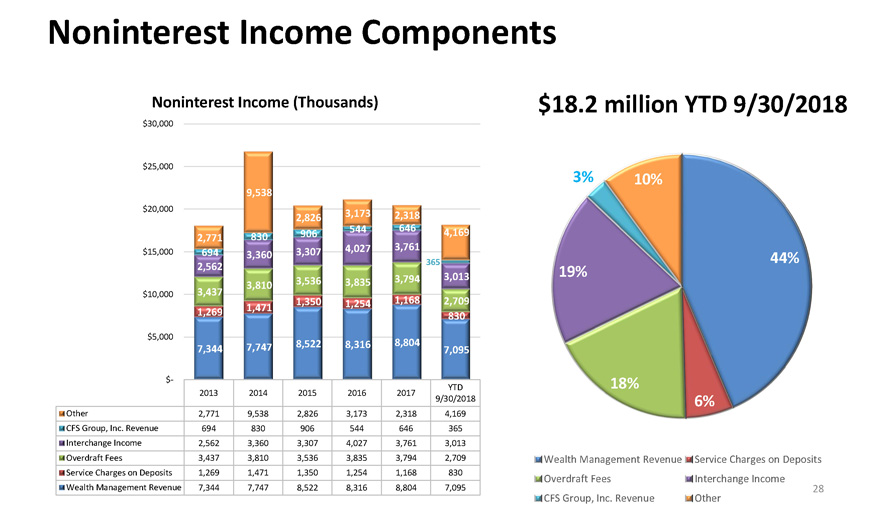
$18.2 million YTD 9/30/2018 Noninterest Income Components 28 2013 2014 2015 2016 2017 YTD 9/30/2018 Other 2,771 9,538 2,826 3,173 2,318 4,169 CFS Group, Inc. Revenue 694 830 906 544 646 365 Interchange Income 2,562 3,360 3,307 4,027 3,761 3,013 Overdraft Fees 3,437 3,810 3,536 3,835 3,794 2,709 Service Charges on Deposits 1,269 1,471 1,350 1,254 1,168 830 Wealth Management Revenue 7,344 7,747 8,522 8,316 8,804 7,095 7,344 7,747 8,522 8,316 8,804 7,095 1,269 1,471 1,350 1,254 1,168 830 3,437 3,810 3,536 3,835 3,794 2,709 2,562 3,360 3,307 4,027 3,761 3,013 694 830 906 544 646 365 2,771 9,538 2,826 3,173 2,318 4,169 $- $5,000 $10,000 $15,000 $20,000 $25,000 $30,000 Noninterest Income (Thousands) 44% 6% 18% 19% 3% 10% Wealth Management Revenue Service Charges on Deposits Overdraft Fees Interchange Income CFS Group, Inc. Revenue Other
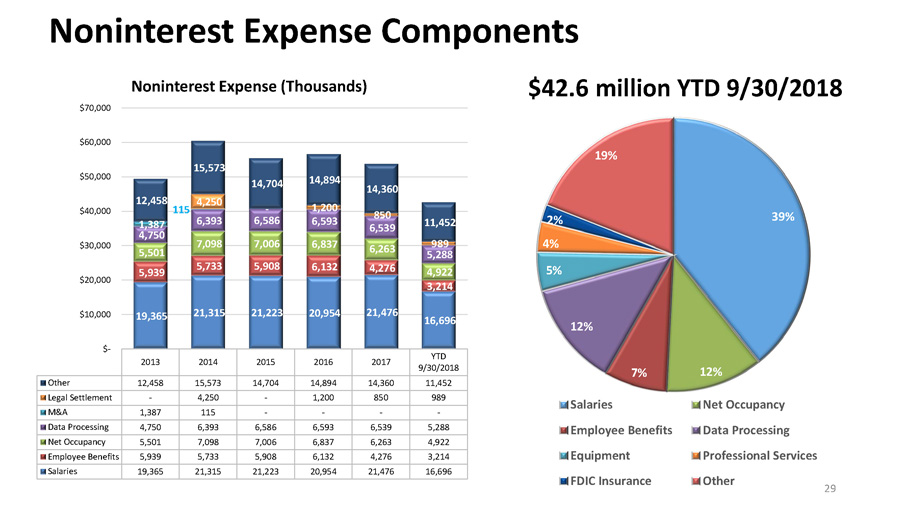
39% 12% 7% 12% 5% 4% 2% 19% Salaries Net Occupancy Employee Benefits Data Processing Equipment Professional Services FDIC Insurance Other $42.6 million YTD 9/30/2018 Noninterest Expense Components 29 2013 2014 2015 2016 2017 YTD 9/30/2018 Other 12,458 15,573 14,704 14,894 14,360 11,452 Legal Settlement - 4,250 - 1,200 850 989 M&A 1,387 115 - - - - Data Processing 4,750 6,393 6,586 6,593 6,539 5,288 Net Occupancy 5,501 7,098 7,006 6,837 6,263 4,922 Employee Benefits 5,939 5,733 5,908 6,132 4,276 3,214 Salaries 19,365 21,315 21,223 20,954 21,476 16,696 19,365 21,315 21,223 20,954 21,476 16,696 5,939 5,733 5,908 6,132 4,276 3,214 5,501 7,098 7,006 6,837 6,263 4,922 4,750 6,393 6,586 6,593 6,539 5,288 1,387 115 - - - - - 4,250 - 1,200 850 989 12,458 15,573 14,704 14,894 14,360 11,452 $- $10,000 $20,000 $30,000 $40,000 $50,000 $60,000 $70,000 Noninterest Expense (Thousands)
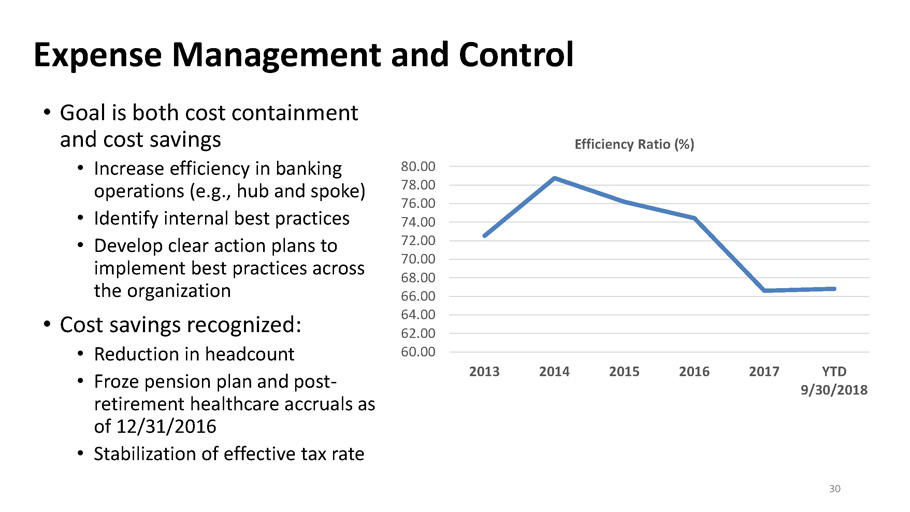
• Goal is both cost containment and cost savings • Increase efficiency in banking operations (e.g., hub and spoke) • Identify internal best practices • Develop clear action plans to implement best practices across the organization • Cost savings recognized: • Reduction in headcount • Froze pension plan and post - retirement healthcare accruals as of 12/31/2016 • Stabilization of effective tax rate 60.00 62.00 64.00 66.00 68.00 70.00 72.00 74.00 76.00 78.00 80.00 2013 2014 2015 2016 2017 YTD 9/30/2018 Efficiency Ratio (%) Expense Management and Control 30
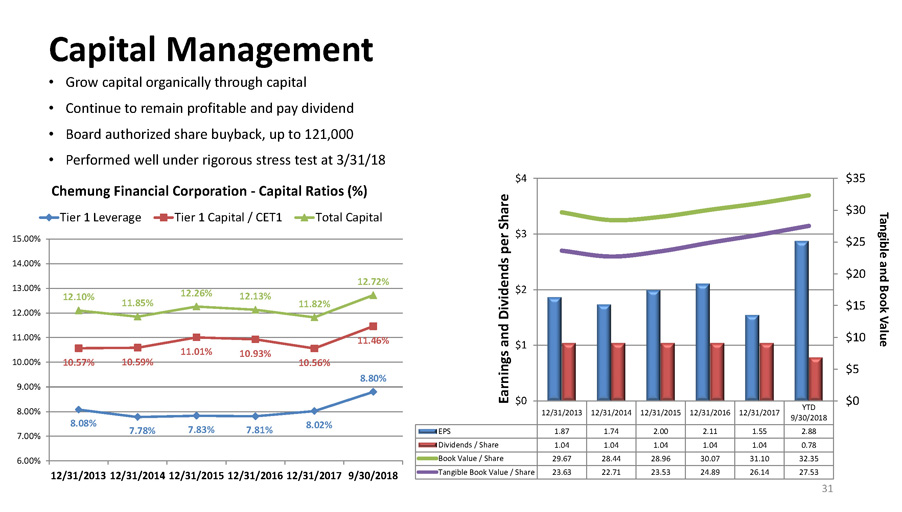
• Grow capital organically through capital • Continue to remain profitable and pay dividend • Board authorized share buyback, up to 121,000 • Performed well under rigorous stress test at 3/31/18 12/31/2013 12/31/2014 12/31/2015 12/31/2016 12/31/2017 YTD 9/30/2018 EPS 1.87 1.74 2.00 2.11 1.55 2.88 Dividends / Share 1.04 1.04 1.04 1.04 1.04 0.78 Book Value / Share 29.67 28.44 28.96 30.07 31.10 32.35 Tangible Book Value / Share 23.63 22.71 23.53 24.89 26.14 27.53 $0 $5 $10 $15 $20 $25 $30 $35 $0 $1 $2 $3 $4 Tangible and Book Value Earnings and Dividends per Share 8.08% 7.78% 7.83% 7.81% 8.02% 8.80% 10.57% 10.59% 11.01% 10.93% 10.56% 11.46% 12.10% 11.85% 12.26% 12.13% 11.82% 12.72% 6.00% 7.00% 8.00% 9.00% 10.00% 11.00% 12.00% 13.00% 14.00% 15.00% 12/31/2013 12/31/2014 12/31/2015 12/31/2016 12/31/2017 9/30/2018 Chemung Financial Corporation - Capital Ratios (%) Tier 1 Leverage Tier 1 Capital / CET1 Total Capital Capital Management 31
• ERM is Board / Executive Management responsibility guided by our Risk Appetite Statement and Supported by our Risk Management Policy • Board approved Risk Governance framework • Continuous monitoring of eight major risk categories (i.e., credit, interest rate, operational, liquidity, compliance, strategy, reputation, market) as well as emerging risks • Quarterly ERM KPI reports to Board • ERM is quantitative incorporating hard indicators with defined risk tolerance triggers requiring immediate response • Risk Assessment in integral to corporate strategy alignment Enterprise Risk Management 32
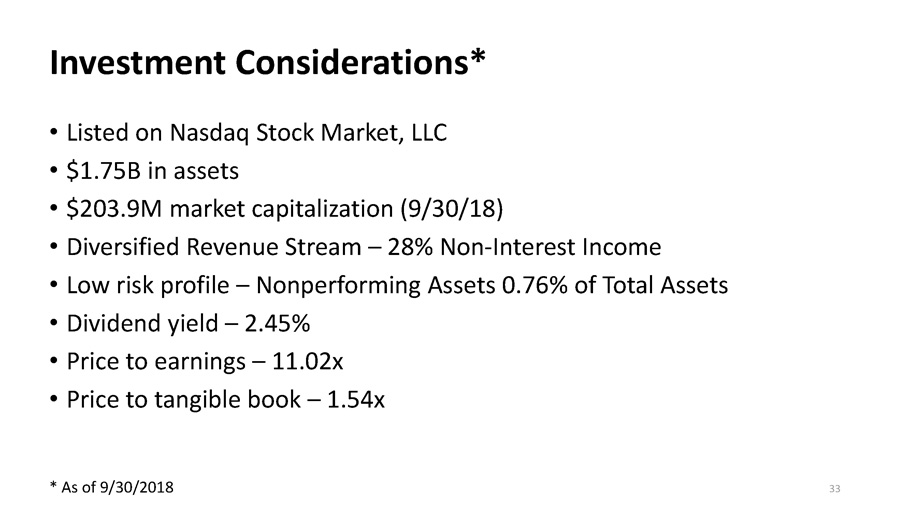
• Listed on Nasdaq Stock Market, LLC • $1.75B in assets • $203.9M market capitalization (9/30/18) • Diversified Revenue Stream – 28% Non - Interest Income • Low risk profile – Nonperforming Assets 0.76% of Total Assets • Dividend yield – 2.45% • Price to earnings – 11.02x • Price to tangible book – 1.54x Investment Considerations* * As of 9/30/2018 33
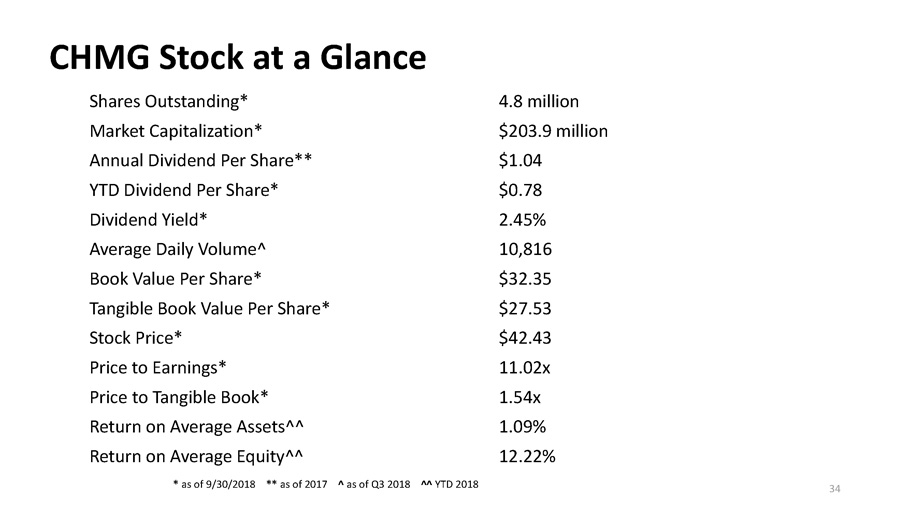
Shares Outstanding* 4.8 million Market Capitalization* $203.9 million Annual Dividend Per Share** $1.04 YTD Dividend Per Share* $0.78 Dividend Yield* 2.45% Average Daily Volume^ 10,816 Book Value Per Share* $32.35 Tangible Book Value Per Share* $27.53 Stock Price* $42.43 Price to Earnings* 11.02x Price to Tangible Book* 1.54x Return on Average Assets^^ 1.09% Return on Average Equity^^ 12.22% CHMG Stock at a Glance * as of 9/30/2018 ** as of 2017 ^ as of Q3 2018 ^^ YTD 2018 34
• Strategic growth, through acquisitions and organic performance • Actively looking for acquisition opportunities • Stable low cost deposits • Growth engine in Capital Region • Engaged corporate board and advisory board • Strong capital base • Competitive dividend • Opportunities to improve efficiencies within the organization to improve earnings • Continue to take a proactive leadership role in the communities we serve Key Takeaways 35
Anders M. Tomson Daniel D. Fariello Louis C. DiFabio Kimberly A. Hazelton Karl F. Krebs Karen R. Makowski Thomas W. Wirth President & CEO President - Capital Bank EVP - Lending EVP - Retail EVP - Chief Financial Officer EVP - Chief Risk Officer EVP - Wealth Management 518.433.5803 518.433.5826 607.735.2055 607.735.2021 607.737.3714 607.737.3891 607.737.3822 atomson@chemungcanal.com dfariello@chemungcanal.com ldifabio@chemungcanal.com khazelton@chemungcanal.com kkrebs@chemungcanal.com kmakowski@chemungcanal.com twirth@chemungcanal.com Kathy McKillip - Investor Relations - 607.737.3746 - kmckillip@chemungcanal.com 36