Attached files
| file | filename |
|---|---|
| EX-99.1 - EX-99.1 - Diplomat Pharmacy, Inc. | a18-18307_1ex99d1.htm |
| 8-K - 8-K - Diplomat Pharmacy, Inc. | a18-18307_18k.htm |
Disclaimers 2 NON-GAAP INFORMATION Adjusted non-GAAP net income and Adjusted EPS add back, net of income taxes, the impact of all merger and acquisition related expenses, including amortization of intangible assets, the change in fair value of contingent consideration, as well as transaction-related costs. We exclude merger and acquisition-related expenses from Adjusted non-GAAP net income and Adjusted EPS because we believe the amount of such expenses in any specific period may not directly correlate to the underlying performance of our business operations and such expenses can vary significantly between periods as a result of new acquisitions, full amortization of previously acquired intangible assets, or ultimate realization of contingent consideration. Investors should note that acquisitions, once consummated, contribute to revenue in the periods presented as well as future periods and should also note that amortization and contingent consideration expenses may recur in future periods. A reconciliation of Adjusted non-GAAP net income and Adjusted EPS, both non-GAAP measures, to net (loss) income attributable to Diplomat and EPS, respectively, each as prepared in accordance with accounting principles generally accepted in the United States (“GAAP”) can be found in the Appendix to this presentation. Please note that going forward; Diplomat will no longer present, or provide guidance with respect to Adjusted Non-GAAP net income or Adjusted EPS. We define Adjusted EBITDA as net income (loss) attributable to Diplomat before interest expense, income taxes, depreciation and amortization, share-based compensation, change in fair value of contingent consideration and other merger and acquisition-related expenses, restructuring and impairment charges, and certain other items that we do not consider indicative of our ongoing operating performance (which are itemized above in the reconciliation to net income (loss) attributable to Diplomat). Adjusted EBITDA is not in accordance with, or an alternative to, GAAP. In addition, this non-GAAP measure is not based on any comprehensive set of accounting rules or principles. You should be aware that in the future we may incur expenses that are the same as or similar to some of the adjustments in the presentation, and we do not infer that our future results will be unaffected by unusual or non-recurring items. We consider Adjusted EBITDA and Adjusted EPS to be supplemental measures of our operating performance. We present Adjusted EBITDA and Adjusted EPS because they are used by our Board of Directors and management to evaluate our operating performance. Adjusted EBITDA is also used as a factor in determining incentive compensation, for budgetary planning and forecasting overall financial and operational expectations, for identifying underlying trends, and for evaluating the effectiveness of our business strategies. Further, we believe they assist us, as well as investors, in comparing performance from period-to-period on a consistent basis. Other companies in our industry may calculate Adjusted EBITDA and Adjusted EPS differently than we do and these calculations may not be comparable to our Adjusted EBITDA and Adjusted EPS metrics. A reconciliation of Adjusted EBITDA, a non-GAAP measure, to net (loss) income attributable to Diplomat as prepared in accordance with GAAP can be found in the Appendix to this presentation. FORWARD-LOOKING STATEMENTS This presentation contains forward-looking statements made pursuant to the safe harbor provisions of the Private Securities Litigation Reform Act of 1995. Forward-looking statements give current expectations or forecasts of future events or our future financial or operating performance and include Diplomat’s expectations regarding revenues, net (loss) income attributable to Diplomat, EPS, Adjusted EBITDA, operating cash flow, reduction of our debt burden, market share, growth trends within the industry and drug pipeline, the expected benefits and performance of acquisitions and growth strategies. The forward-looking statements in this presentation are based on management’s good-faith belief and reasonable judgment based on current information. These statements are qualified by important risks and uncertainties, many of which are beyond our control, that could cause our actual results to differ materially from those forecasted or indicated by such forward-looking statements. For a discussion of such risks and uncertainties, including but not limited to risks related to: our ability to adapt to changes or trends within the specialty pharmacy industry; our relationships with wholesalers and key pharmaceutical manufacturers; revenue concentration of the top specialty drugs we dispense; competition within the prescription benefit management marketplace, and an inability to effectively differentiate our products and services from those of our competitors; our ability to expand the number of specialty drugs we dispense and related services; client losses and/or the failure to win new business; maintaining existing patients; our hub services dependence on the willingness of participants in the specialty pharmacy system to continue outsourcing work and on our reputation for independent, high-quality service; fluctuations in operating results; debt service obligations; our ability to effectively execute our acquisition strategy or successfully integrate acquired businesses, including any delays or difficulties in integrating the combined businesses, and the ability to achieve cost savings and operating synergies and the timing thereof; and the dependence on our senior management and key employees, review Diplomat's filings with the Securities and Exchange Commission, including “Risk Factors” in Diplomat’s Annual Report on Form 10-K for the year ended Dec. 31, 2017, and in subsequent reports filed with or furnished to the Securities and Exchange Commission. Except as may be required by any applicable laws, Diplomat assumes no obligation to publicly update such forward-looking statements, which are made as of the date hereof or the earlier date specified herein, whether as a result of new information, future developments, or otherwise. INDUSTRY AND MARKET DATA Certain information in this presentation concerning our industry and the markets in which we operate is derived from publicly available information released by third-party sources, including independent industry and research organizations, and management estimates. Management estimates are derived from publicly available information released by independent industry and research analysts and other third-party sources, as well as data from our internal research, and are based on assumptions made by us upon reviewing such data and our knowledge of such industry and markets, which we believe to be reasonable. We believe the data from these third-party sources is reliable. In addition, projections, assumptions, and estimates of the future performance of the industry in which we operate and our future performance are necessarily subject to uncertainty and risk due to a variety of factors, as discussed in Diplomat’s reports filed with the Securities and Exchange Commission. These and other factors could cause results to differ materially from those expressed in the estimates made by these third-party sources.
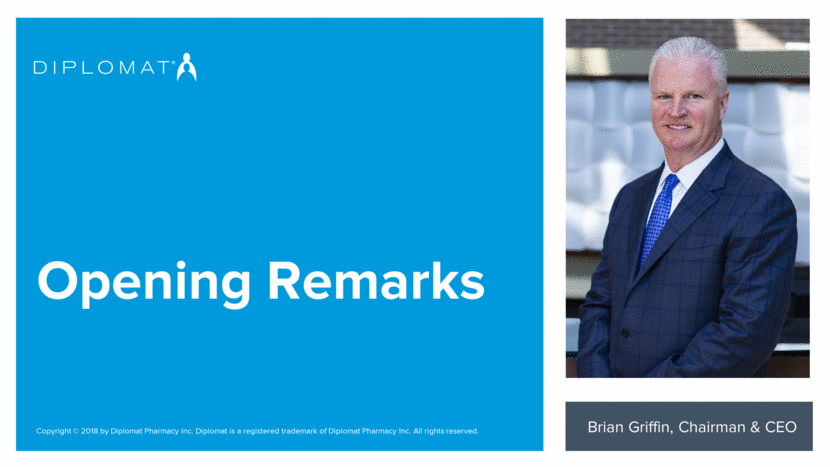
Opening Remarks Brian Griffin, Chairman & CEO
1 A reconciliation of Adjusted EBITDA, a non-GAAP measure, to net (loss) income attributable to Diplomat, as prepared in accordance with GAAP can be found in the Appendix to this presentation. 2Q 2018 Highlights $1.4B (+26%) Revenue $43M (+70%) Adjusted EBITDA1 4 Solid growth in specialty and infusion Additional 8 LDDs added in the quarter Contribution from acquired PBM businesses Strong revenue growth PBM integration outperformance Investing in operational excellence New, state-of-the-art distribution and contact center Several other operational and process enhancements
CastiaRx Highlights 5 2Q 2018 Integration almost complete $3M in 2Q synergies achieved, YTD total of $4M Now expect $8M-$10M in synergies in 2018 (vs. prior expectation of $4M-$6M) Process begun to move legacy PBM patients on LDDs to Diplomat specialty pharmacy Proposal volume remains double a year ago
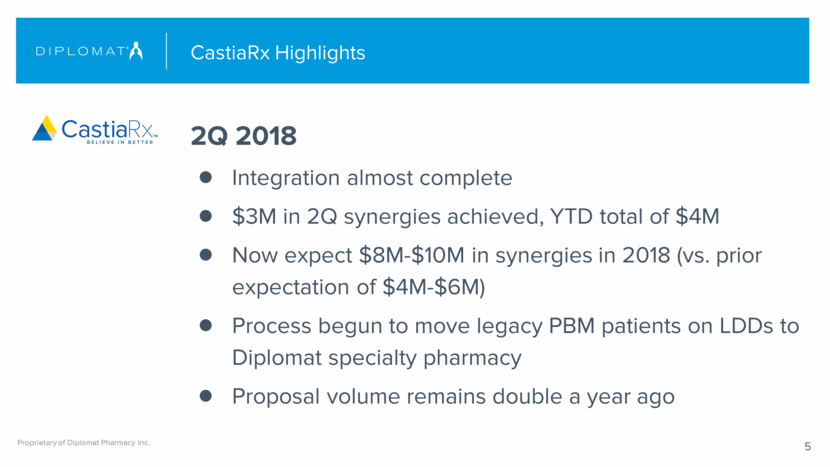
Putting Patients First 6 Specialty Pharmacy Solutions PBM Manufacturer Services Infrastructure Innovation Infusion Employees The industry’s largest independent provider of specialty pharmacy services Specialty-focused PBM targeting middle market clients Nationwide provider of infusion management services Tailored manufacturer services to meet the needs of our partners JAY DIPLOMAT PATIENT
Financial Results Atul Kavthekar, CFO
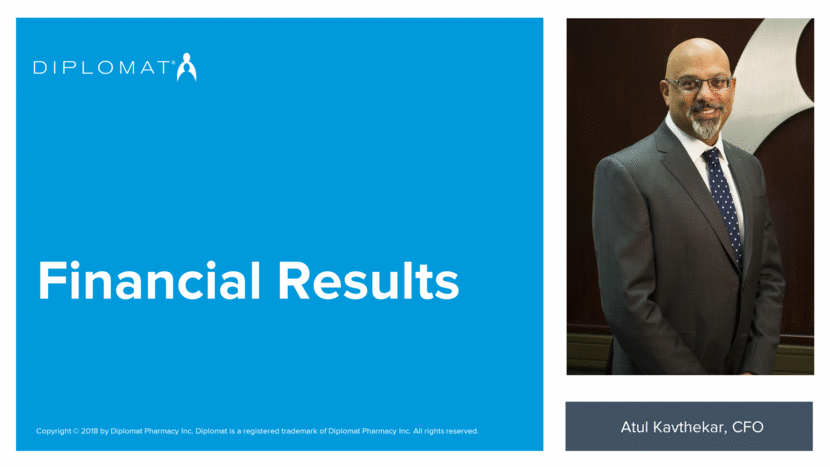
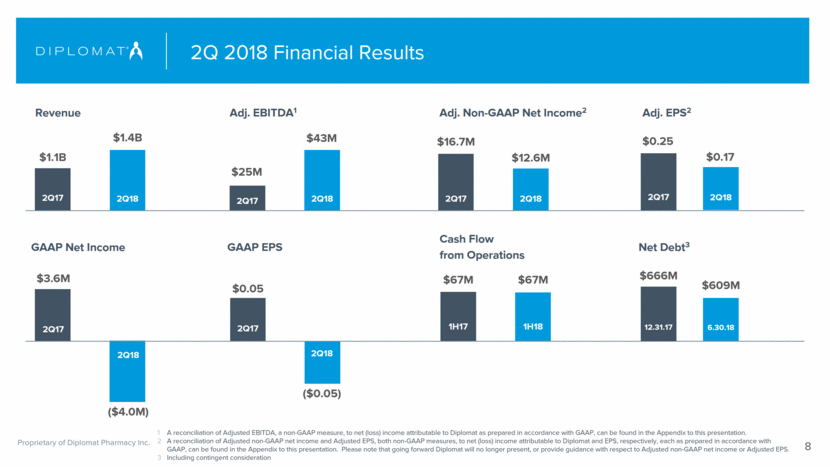
($0.05) ($4.0M) A reconciliation of Adjusted EBITDA, a non-GAAP measure, to net (loss) income attributable to Diplomat as prepared in accordance with GAAP, can be found in the Appendix to this presentation. A reconciliation of Adjusted non-GAAP net income and Adjusted EPS, both non-GAAP measures, to net (loss) income attributable to Diplomat and EPS, respectively, each as prepared in accordance with GAAP, can be found in the Appendix to this presentation. Please note that going forward Diplomat will no longer present, or provide guidance with respect to Adjusted non-GAAP net income or Adjusted EPS. Including contingent consideration 2Q 2018 Financial Results 8 Revenue $1.1B $1.4B 2Q17 2Q18 Adj. EBITDA1 $25M $43M 2Q17 2Q18 Adj. EPS2 $16.7M $12.6M 2Q17 2Q18 Cash Flow from Operations Adj. Non-GAAP Net Income2 GAAP EPS GAAP Net Income Net Debt3 $0.05 2Q17 2Q18 $3.6M 2Q17 2Q18 $0.25 $0.17 2Q17 2Q18 $67M $67M 1H17 1H18 $666M $609M 12.31.17 6.30.18
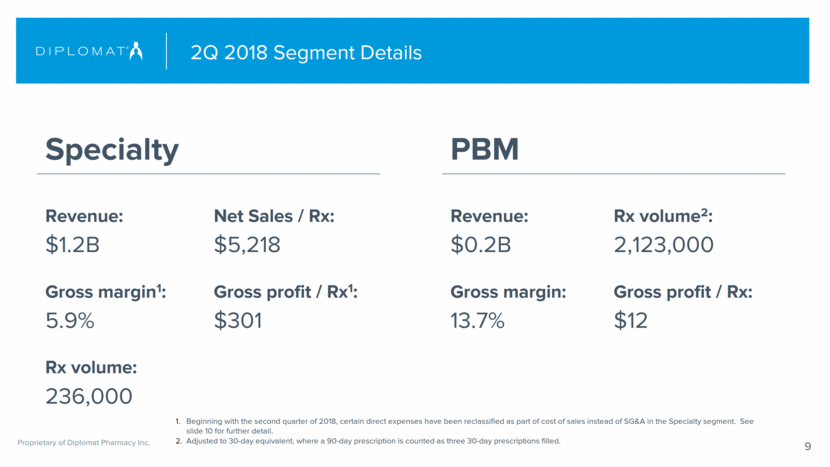
2Q 2018 Segment Details 9 Specialty PBM Revenue: $1.2B Gross margin1: 5.9% Rx volume: 236,000 Net Sales / Rx: $5,218 Gross profit / Rx1: $301 Revenue: $0.2B Gross margin: 13.7% Rx volume2: 2,123,000 Gross profit / Rx: $12 Beginning with the second quarter of 2018, certain direct expenses have been reclassified as part of cost of sales instead of SG&A in the Specialty segment. See slide 10 for further detail. Adjusted to 30-day equivalent, where a 90-day prescription is counted as three 30-day prescriptions filled.
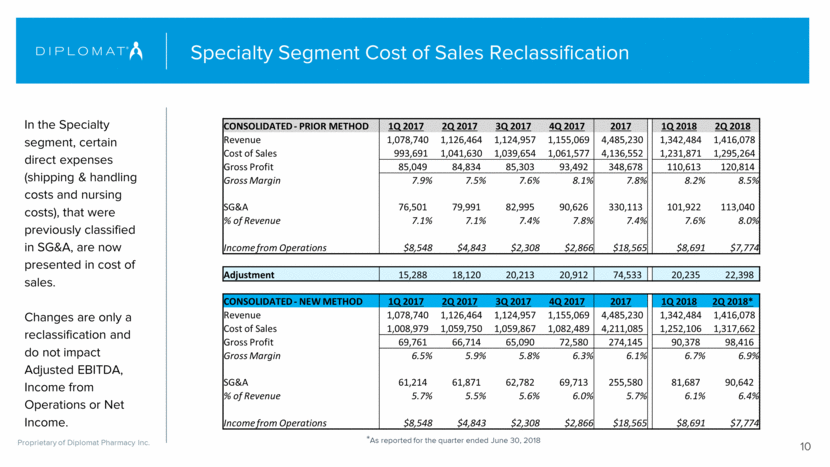
Specialty Segment Cost of Sales Reclassification In the Specialty segment, certain direct expenses (shipping & handling costs and nursing costs), that were previously classified in SG&A, are now presented in cost of sales. Changes are only a reclassification and do not impact Adjusted EBITDA, Income from Operations or Net Income. 10 *As reported for the quarter ended June 30, 2018 CONSOLIDATED - PRIOR METHOD 1Q 2017 2Q 2017 3Q 2017 4Q 2017 2017 1Q 2018 2Q 2018 Revenue 1,078,740 1,126,464 1,124,957 1,155,069 4,485,230 1,342,484 1,416,078 Cost of Sales 993,691 1,041,630 1,039,654 1,061,577 4,136,552 1,231,871 1,295,264 Gross Profit 85,049 84,834 85,303 93,492 348,678 110,613 120,814 Gross Margin 7.9% 7.5% 7.6% 8.1% 7.8% 8.2% 8.5% SG&A 76,501 79,991 82,995 90,626 330,113 101,922 113,040 % of Revenue 7.1% 7.1% 7.4% 7.8% 7.4% 7.6% 8.0% Income from Operations $8,548 $4,843 $2,308 $2,866 $18,565 $8,691 $7,774 Adjustment 15,288 18,120 20,213 20,912 74,533 20,235 22,398 CONSOLIDATED - NEW METHOD 1Q 2017 2Q 2017 3Q 2017 4Q 2017 2017 1Q 2018 2Q 2018* Revenue 1,078,740 1,126,464 1,124,957 1,155,069 4,485,230 1,342,484 1,416,078 Cost of Sales 1,008,979 1,059,750 1,059,867 1,082,489 4,211,085 1,252,106 1,317,662 Gross Profit 69,761 66,714 65,090 72,580 274,145 90,378 98,416 Gross Margin 6.5% 5.9% 5.8% 6.3% 6.1% 6.7% 6.9% SG&A 61,214 61,871 62,782 69,713 255,580 81,687 90,642 % of Revenue 5.7% 5.5% 5.6% 6.0% 5.7% 6.1% 6.4% Income from Operations $8,548 $4,843 $2,308 $2,866 $18,565 $8,691 $7,774
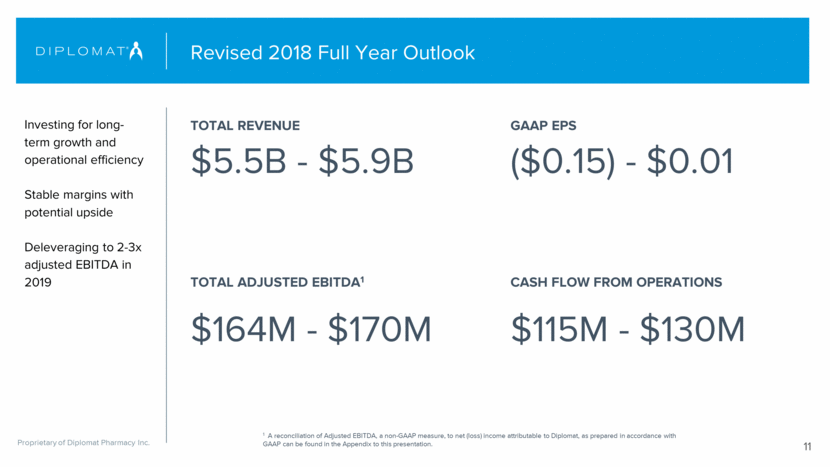
Revised 2018 Full Year Outlook Investing for long-term growth and operational efficiency Stable margins with potential upside Deleveraging to 2-3x adjusted EBITDA in 2019 TOTAL REVENUE $5.5B - $5.9B TOTAL ADJUSTED EBITDA1 $164M - $170M 11 GAAP EPS ($0.15) - $0.01 CASH FLOW FROM OPERATIONS $115M - $130M 1 A reconciliation of Adjusted EBITDA, a non-GAAP measure, to net (loss) income attributable to Diplomat, as prepared in accordance with GAAP can be found in the Appendix to this presentation.
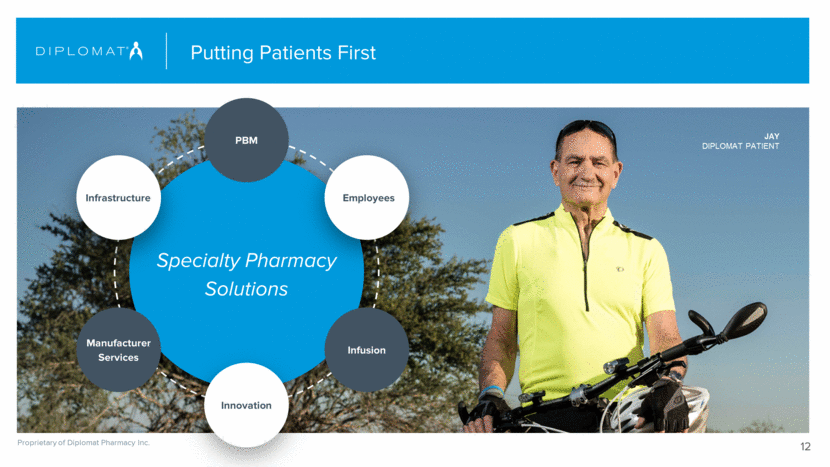
Putting Patients First 12 Specialty Pharmacy Solutions PBM Manufacturer Services Infrastructure Innovation Infusion Employees JAY DIPLOMAT PATIENT
Appendix Supplemental Financial Information
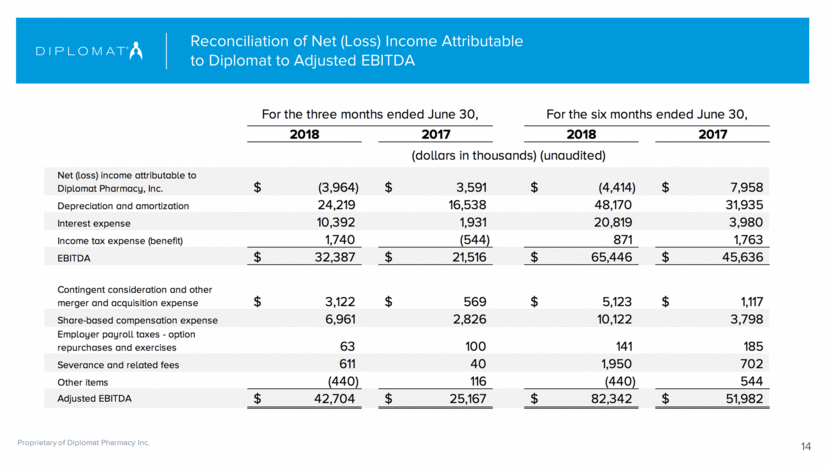
Reconciliation of Net (Loss) Income Attributable to Diplomat to Adjusted EBITDA 14
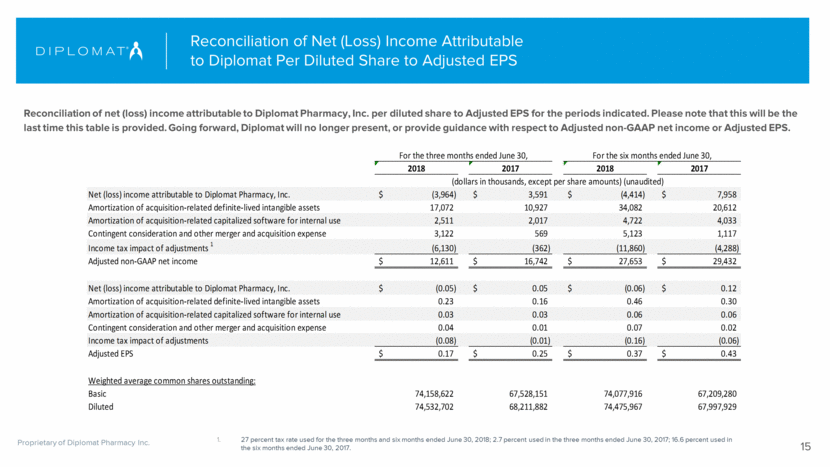
Reconciliation of net (loss) income attributable to Diplomat Pharmacy, Inc. per diluted share to Adjusted EPS for the periods indicated. Please note that this will be the last time this table is provided. Going forward, Diplomat will no longer present, or provide guidance with respect to Adjusted non-GAAP net income or Adjusted EPS. 15 27 percent tax rate used for the three months and six months ended June 30, 2018; 2.7 percent used in the three months ended June 30, 2017; 16.6 percent used in the six months ended June 30, 2017. Reconciliation of Net (Loss) Income Attributable to Diplomat Per Diluted Share to Adjusted EPS 2018 2017 2018 2017 Net (loss) income attributable to Diplomat Pharmacy, Inc. (3,964) $ 3,591 $ (4,414) $ 7,958 $ Amortization of acquisition-related definite-lived intangible assets 17,072 10,927 34,082 20,612 Amortization of acquisition-related capitalized software for internal use 2,511 2,017 4,722 4,033 Contingent consideration and other merger and acquisition expense 3,122 569 5,123 1,117 Income tax impact of adjustments 1 (6,130) (362) (11,860) (4,288) Adjusted non-GAAP net income 12,611 $ 16,742 $ 27,653 $ 29,432 $ Net (loss) income attributable to Diplomat Pharmacy, Inc. (0.05) $ 0.05 $ (0.06) $ 0.12 $ Amortization of acquisition-related definite-lived intangible assets 0.23 0.16 0.46 0.30 Amortization of acquisition-related capitalized software for internal use 0.03 0.03 0.06 0.06 Contingent consideration and other merger and acquisition expense 0.04 0.01 0.07 0.02 Income tax impact of adjustments (0.08) (0.01) (0.16) (0.06) Adjusted EPS 0.17 $ 0.25 $ 0.37 $ 0.43 $ Weighted average common shares outstanding: Basic 74,158,622 67,528,151 74,077,916 67,209,280 Diluted 74,532,702 68,211,882 74,475,967 67,997,929 For the three months ended June 30, For the six months ended June 30, (dollars in thousands, except per share amounts) (unaudited)
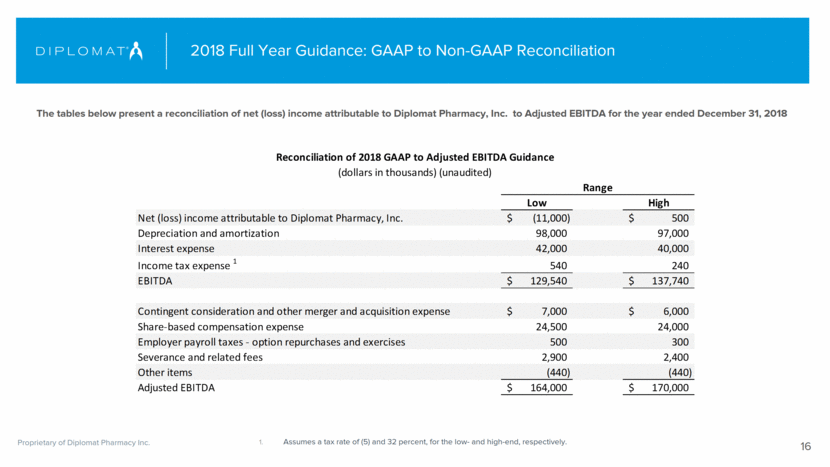
2018 Full Year Guidance: GAAP to Non-GAAP Reconciliation Assumes a tax rate of (5) and 32 percent, for the low- and high-end, respectively. 16 The tables below present a reconciliation of net (loss) income attributable to Diplomat Pharmacy, Inc. to Adjusted EBITDA for the year ended December 31, 2018 Low High Net (loss) income attributable to Diplomat Pharmacy, Inc. (11,000) $ 500 $ Depreciation and amortization 98,000 97,000 Interest expense 42,000 40,000 Income tax expense 1 540 240 EBITDA 129,540 $ 137,740 $ Contingent consideration and other merger and acquisition expense 7,000 $ 6,000 $ Share-based compensation expense 24,500 24,000 Employer payroll taxes - option repurchases and exercises 500 300 Severance and related fees 2,900 2,400 Other items (440) (440) Adjusted EBITDA 164,000 $ 170,000 $ Reconciliation of 2018 GAAP to Adjusted EBITDA Guidance (dollars in thousands) (unaudited) Range
