Attached files
| file | filename |
|---|---|
| 8-K - RELIANT BANCORP, INC. 8-K - Reliant Bancorp, Inc. | a51844351.htm |
July 2018 KBW Community Bank Conference Investor Presentation

Safe Harbor Statements Forward Looking StatementsThis presentation includes forward-looking statements within the meaning of the safe harbor provisions of the Private Securities Litigation Reform Act of 1995, which management believes are a benefit to shareholders. These statements are necessarily subject to risk and uncertainty and actual results could differ materially due to various risk factors, including those set forth from time to time in our filings with the SEC. You should not place undue reliance on forward-looking statements and we undertake no obligation to update any such statements. The words “believe,” “anticipate,” “expect,” “may,” “will,” “assume,” “should,” “predict,” “could,” “would,” “intend,” “targets,” “estimates,” “projects,” “plans,” “potential” and other similar words and expressions of the future are intended to identify such forward-looking statements, but other statements not based on historical information may also be considered forward-looking. All forward-looking statements are subject to risks, uncertainties and other factors that may cause the actual results, performance or achievements of Reliant Bancorp to differ materially from any results, performance or achievements expressed or implied by such forward-looking statements. Such factors include, among others: (i) the possibility that our asset quality would decline or that we experience greater loan losses than anticipated; (ii) increased levels of other real estate, primarily as a result of foreclosures; (iii) the impact of liquidity needs on our results of operations and financial condition; (iv) competition from financial institutions and other financial service providers; (v) the risk that the cost savings and any revenue synergies from our merger with Community First, Inc. (“Community First”) may not be realized or take longer than anticipated to be realized; (vi) the effect of the announcement or completion of the Community First merger on employee and customer relationships and operating results (including, without limitation, difficulties in maintaining relationships with employees and customers); (vii) the risk that integration of Community First’s operations with those of Reliant Bancorp will be materially delayed or will be more costly or difficult than expected; (viii) the amount of costs, fees, expenses, and charges related to the Community First merger; (ix) reputational risk and the reaction of the parties’ customers, suppliers, employees or other business partners to the Community First merger; (x) general competitive, economic, political and market conditions, including economic conditions in the local markets where we operate; (xi) the impact of negative developments in the financial industry and U.S. and global capital and credit markets; (xii) our ability to retain the services of key personnel; (xiii) our ability to adapt to technological changes; (xiv) risks associated with litigation, including the applicability of insurance coverage; (xv) the vulnerability of Reliant Bank’s digital network and online banking portals, and the systems of parties with whom Reliant Bancorp and Reliant Bank contract, to unauthorized access, computer viruses, phishing schemes, spam attacks, human error, natural disasters, power loss and other security breaches; (xvi) changes in state and federal legislation, regulations or policies applicable to banks, including regulatory or legislative developments; (xvii) adverse results (including costs, fines, reputational harm and/or other negative effects) from current or future litigation, regulatory examinations or other legal and/or regulatory actions; (xviii) general competitive, economic, political and market conditions. Non-GAAP Financial MeasuresThis presentation contains certain financial measures that are not measures recognized under U.S. generally accepted accounting principles (GAAP) and, therefore, are considered non-GAAP financial measures. Members of Reliant’s management use these non-GAAP financial measures in their analysis of the Company’s performance, financial condition, and efficiency of operations. Management of Reliant believes that these non-GAAP financial measures provide a greater understanding of ongoing operations, enhance comparability of results with prior periods, and demonstrate the effects of significant gains and charges in the current period. Management also believes that investors find these non-GAAP financial measures useful as they assist investors in understanding underlying operating performance and the analysis of ongoing operating trends. However, the non-GAAP financial measures discussed herein should not be considered in isolation or as a substitute for the most directly comparable or other financial measures calculated in accordance with GAAP. Moreover, the manner in which the non-GAAP financial measures discussed herein are calculated may differ from that of other companies reporting measures with similar names. You should understand how such other banking organizations calculate their financial measures similar to, or with names similar to, the non-GAAP financial measures we have discussed herein when comparing such non-GAAP financial measures.This presentation contains certain non-GAAP financial measures, including, without limitation, tangible assets, tangible book value, tangible common equity, tangible common equity to assets, efficiency ratio, adjusted income return on average assets, and return on tangible common equity. A reconciliation of these non-GAAP financial measures to the most directly comparable GAAP measures are provided in the appendix to this presentation.
Company Overview July 2018

Reliant Bank Franchise Overview Source: SNL Financial Financial data as of or for the three months ended 3/31/18; ownership data as of most recent available; pricing data as of 7/25/18 Note: RBNC reserves / loans excludes mortgage loans held for sale (1) Refer to appendix for “Reconciliation of non-GAAP financial measures” (2) The Nashville-Davidson-Murfreesboro-Franklin Metropolitan Statistical Area (the “Nashville MSA”) (3) Community bank defined as institutions with total assets less than $10 billion Q1 ‘18 Financial Summary Full Service Branch (15) Mortgage LPO (1) Murfreesboro (Q3) Chattanooga (Q4) Commercially oriented bank headquartered in Brentwood, Tennessee Focused on fast growing Middle Tennessee markets coupled with recent expansion into Chattanooga, Tennessee 11th largest bank by deposits in the Nashville MSA(2) and 3rd largest community bank(3) by deposits headquartered in the Nashville MSA Concentrated on building in-market banking relationships; 80% of top 50 loan relationships have related deposits at the bank Experienced management team with extensive local market knowledge 13.0% insider ownership amongst management and the board of directors Key Franchise Highlights Branch Network HAMILTON Chattanooga Market Information Price Per Share (7/25/18) $28.84 Market Cap. ($mm) 321 Price / Tang. Book (1) 221 % Price / '18 EPS 20.9 Price / '19 EPS 18.4 Balance Sheet ($mm) Total Assets $1,660 Loans Held for Investment 1,142 Deposits 1,334 Tangible Common Equity 150 Loans Held for Investment / Deposits 85.6 % MRQ Profitability Adjusted ROAA (1) 0.96 % Asset Quality NPAs / Loans + OREO 0.57 % Reserves / NPLs 230.5 Reserves / Loans Held for Investment 0.89 Capital Ratios Tang. Com. Equity / Tang. Assets (1) 9.33 % Leverage Ratio 9.98 CET1 Ratio 12.14 Tier 1 Capital Ratio 12.14 Total Capital Ratio 12.93 Loan Concentration C&D Loans / Total Bank Capital 113 % CRE Loans / Total Bank Capital 265 Columbia MAURY

Experienced Management Team Source: SNL Financial DeVan D. Ard, Jr.Chairman, President & CEO Former Area Executive in Middle Tennessee at AmSouth BankFounder of Reliant Bank in 2006 37 years of banking experience / 13 years at RBNC / 19 years in Middle TN James Daniel Dellinger CFO Former Chief Financial Officer at Premier Bank of BrentwoodFormer Chief Financial Officer at Erwin National Bank26 years of banking experience / 12 years at RBNC / 21 years in Middle TN Louis E. HollowayExecutive VP, COO Executive Vice President – Chief Operating Officer since January 2018Former Chief Executive Officer of Community First, Inc.42 years of banking experience / <1 year at RBNC / 32 years in Middle TN Alan MimsExecutive VP, CCO Eddie GammonExecutive VP, Director of Operations Kim YorkExecutive VP, CSO John R. WilsonExecutive VP, CLO Executive Vice President – Chief Credit Officer since December 2017Former Senior Examiner and Case Manager for the Federal Reserve Bank of Atlanta29 years of banking experience / 1 year at RBNC / 1 year in Middle TN Executive Vice President – Director of Operations since March 2016Former Senior Vice President of Operations at IBERIABANKFormer Senior Vice President – Director of Deposit Operations at Avenue Bank33 years of banking experience / 2 years at RBNC / 3 years in Middle TN Executive Vice President – Chief Loan Officer Former Spring Hill Market President for Cumberland Bank29 years of banking experience / 12 years at RBNC / 29 years in Middle TN Executive Vice President – Chief Strategy Office since March 2017Former Senior Vice President and Chief Marketing Officer at Ascend Federal Credit Union23 years of banking experience / 2 years at RBNC / 23 years in Middle TN
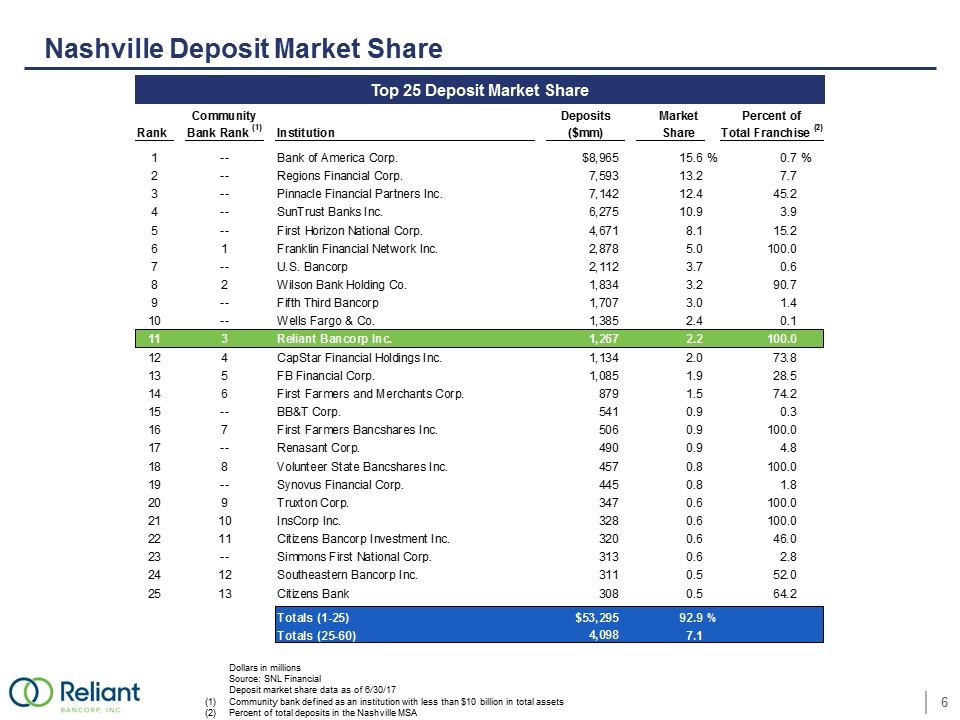
Nashville Deposit Market Share Dollars in millions Source: SNL Financial Deposit market share data as of 6/30/17 (1)Community bank defined as an institution with less than $10 billion in total assets (2)Percent of total deposits in the Nashville MSA Top 25 Deposit Market Share Community Deposits Market Percent of Rank Bank Rank (1)Institution($mm) Share Total Franchise (2)1--Bank of America Corp.$8,96515.6%0.7%2--Regions Financial Corp.7,593 13.27.73--Pinnacle Financial Partners Inc.7,142 12.445.24--SunTrust Banks Inc.6,275 10.93.95--First Horizon National Corp.4,671 8.115.261Franklin Financial Network Inc.2,878 5.0100.07--U.S. Bancorp2,112 3.70.682Wilson Bank Holding Co.1,834 3.290.79--Fifth Third Bancorp1,707 3.01.410--Wells Fargo & Co.1,385 2.40.1113Reliant Bancorp Inc.1,267 2.2100.0124CapStar Financial Holdings Inc.1,134 2.073.8135FB Financial Corp.1,085 1.928.5146First Farmers and Merchants Corp.879 1.574.215--BB&T Corp.541 0.90.3167First Farmers Bancshares Inc.506 0.9100.017--Renasant Corp.490 0.94.8188Volunteer State Bancshares Inc.457 0.8100.019--Synovus Financial Corp.445 0.81.8209Truxton Corp.347 0.6100.02110InsCorp Inc.328 0.6100.02211Citizens Bancorp Investment Inc.320 0.646.023--Simmons First National Corp.313 0.62.82412Southeastern Bancorp Inc.311 0.552.02513Citizens Bank308 0.564.2Totals (1-25)$53,29592.9%Totals (25-60)4,098 7.1

Nashville MSA Demographics Source: SNL Financial, Bureau of Labor Statistics, Nashville Area Chamber of Commerce, U.S. Census Bureau- 2016 (1) RBNC deposit data weighted by county Nashville Market Highlights 2023 Median Household Income (HHI) ($) ‘18 – ‘23 Projected HHI Growth (%) ‘18 – ‘23 Projected Population Growth (%) Scale ‒ The Nashville MSA is expected to surpass the current size of Austin, Charlotte, Portland, and Denver regions by 2035, with a population of 2.6 million ‒ The Nashville MSA is the 8th largest Southeast metropolitan area with a population exceeding 1.9 million as of July 2017 ‒ The Nashville region gained 69 net new people per day on average in 2016 ‒ Population grew approximately 11.6% from 2010 through 2016 at 1.85% annually ‒ Unemployment rate of 2.7% is below the national average of 4.1% as of December 2017 ‒ Median HHI growth of 16.5% from 2000-2012 Strong Business Environment ‒ Personal state income tax: 0.0% ‒ Ranked 3rd in “The Best Big Cities for Jobs 2017” ‒ 7th on Forbes’ list of fastest-growing cities of 2018 ‒ Ranked 1st on Forbes’ list for metro area job growth in professional and business services (2017) ‒ Historic success in landing major brand-name corporate relocations including Nissan North America, Dell Computer, Caterpillar Financial, Ford Motor Credit, and AllianceBernstein (2018) ‒ Home to 14 Fortune 1000 companies, including 5 Fortune 500 headquarters Passionate Sports Fan Base – Nashville Predators – Tennessee Titans 7 11.2% 12.4% 8.7% 8.9% 0.0% 4.0% 8.0% 12.0% 16.0% RBNC Nashville MSA Southeast US 7.3% 6.9% 4.5% 3.5% 0.0% 2.5% 5.0% 7.5% 10.0% 2023 Median Household Income (HHI) ($) $92,929 $72,149 $59,149 $66,452 $0 $30,000 $60,000 $90,000 $120,000 RBNC Nashville MSA Southeast US
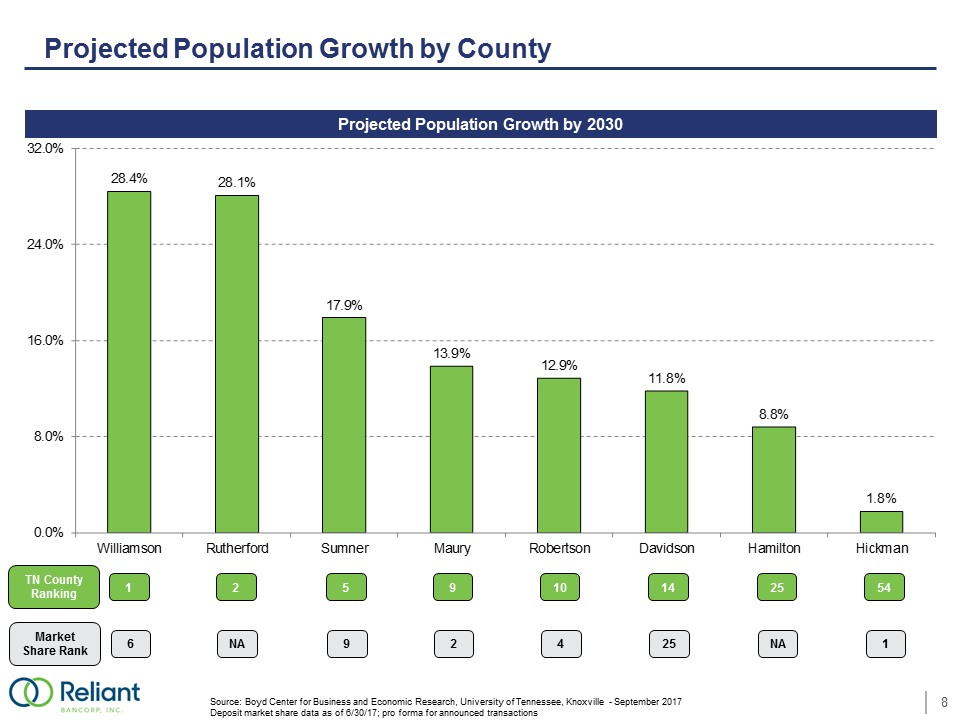
Projected Population Growth by County Projected Population Growth by 2030 Source: Boyd Center for Business and Economic Research, University of Tennessee, Knoxville - September 2017 Deposit market share data as of 6/30/17; pro forma for announced transactions TN County Ranking 1 2 5 9 10 14 25 54 28.4% 28.1% 17.9% 13.9% 12.9% 11.8% 8.8% 1.8% 0.0% 8.0% 16.0% 24.0% 32.0% Williamson Rutherford Sumner Maury Robertson Davidson Hamilton Hickman Market Share Rank 6 NA 9 2 4 25 NA 1

Growing and Diversified Lending Platform Source: SNL Financial, Company documents Data as of or for the three months ended 6/30/18 Note: Loan portfolio composition utilizes call report categories based on collateral type (1) Based upon non-owner occupied CRE portfolio as of 6/30/18 Loan Portfolio Composition Loans Held for Investment ($mm) Commercial Real Estate Portfolio (1) C&D Portfolio 1-4 Family Construction 5% Other C&D 11% Agricultural Related Loans 3% HELOCs 9% 1-4 Family - First Lien 19% 1-4 Family - Junior Lien < 1% Multifamily < 1% Owner- Occupied CRE 13% Non Owner- Occupied CRE 21% C&I 15% Consumer & Other 3% Churches / Religious < 1% Gas Station / C-Store 2% Hotel / Motel 17% Industrial / Warehouse 5% Of f ice - General 16% Of f ice Condo < 1% Retail - Non- Anchored Tenants 34% Restaurant - National Franchise 3% Restaurant - Other < 1% Retail - Single Credit Tenant 13% Self Storage 4% Other 2%Multifamily 3% 1 - 4 Family Residential - Builders / Non- Owner Occupied 27% 1 - 4 Family Residential - Owner Occupied 7% Land and Lots Not Currently Under Development 24% Industrial / Warehouse < 1% Residential Development & Lots 9% Restaurant < 1% Apartment / Multi-Family 6%Church < 1% Hotel / Motel 12% Of f ice - General 3% Retail Construction 4%Self Storage 4% Other < 1% Commercial Construction - Owner- Occupied 2%
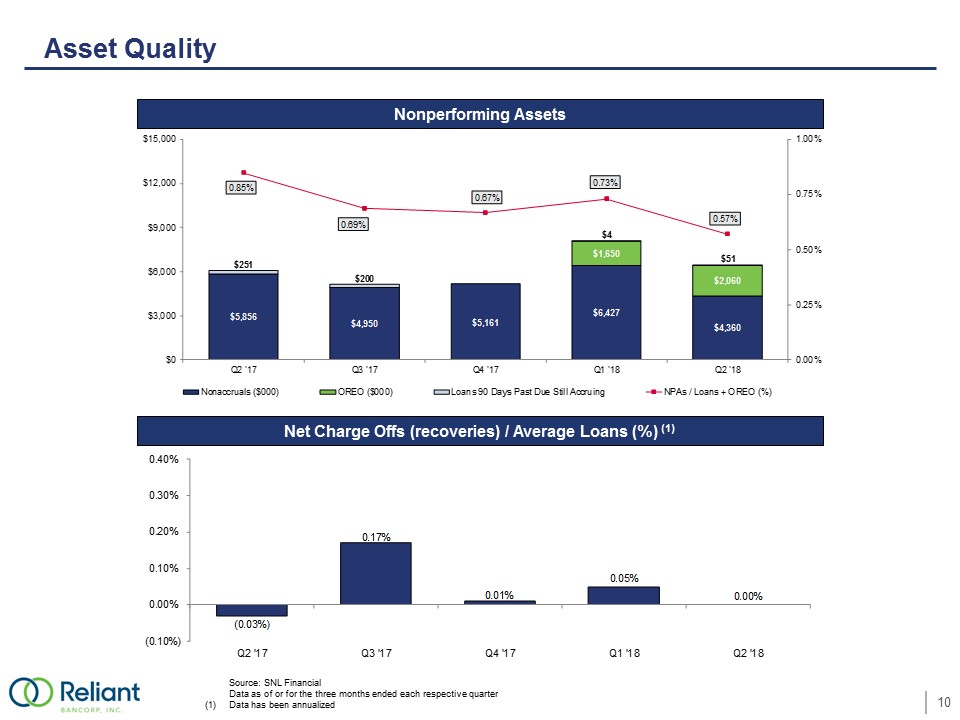
Asset Quality Source: SNL Financial Data as of or for the three months ended each respective quarter (1) Data has been annualized Nonperforming Assets Net Charge Offs (recoveries) / Average Loans (%) (1) $5,856 $4,950 $5,161 $6,427 $4,360 $1,650 $2,060 $251 $200 $4 $51 0.85% 0.69% 0.67% 0.73% 0.57% 0.00% 0.25% 0.50% 0.75% 1.00% $0 $3,000 $6,000 $9,000 $12,000 $15,000 Q2 '17 Q3 '17 Q4 '17 Q1 '18 Q2 '18 Nonaccruals ($000) OREO ($000) Loans 90 Days Past Due Still Accruing NPAs / Loans + OREO (%) (0.03%) 0.17% 0.01% 0.05% 0.00% (0.10%) 0.00% 0.10% 0.20% 0.30% 0.40% Q2 '17 Q3 '17 Q4 '17 Q1 '18 Q2 '18

Deposit Portfolio Dollars in millions Source: SNL Financial; Company Documents Data as of or for the three months ended the date indicated Deposit Composition – 6/30/18 Non-Interest Bearing Deposits ($mm) Total Deposits ($mm) & Cost of Deposits (%) Demand 17% Interest- Bearing Demand 11% Money Market & Savings 26% Time Deposits 46% Deposit Composition Amount % of Total Demand $225 16.9 % Interest-Bearing Demand 140 10.5 Money Market & Savings 353 26.4 Time Deposits 616 46.2 Total Deposits $1,334 100.0 % $116 $135 $140 $135 $136 $136 $132 $132 $228 $225 $0 $60 $120 $180 $240 Q1 '16 Q2 '16 Q3 '16 Q4 '16 Q1 '17 Q2 '17 Q3 '17 Q4 '17 Q1 '18 Q2 '18 $658 $648 $660 $764 $826 $840 $840 $884 $1,349 $1,334 0.40% 0.39% 0.38% 0.45% 0.45% 0.54% 0.64% 0.80% 0.78% 0.85% 0.00% 0.50% 1.00% 1.50% 2.00% $0 $400 $800 $1,200 $1,600 Q1 '16Q2 '16Q3 '16Q4 '16Q1 '17Q2 '17Q3 '17Q4 '17Q1 '18Q2 '18 Total Deposits Cost of Deposits

Historical Profitability Trends Source: SNL Financial, Company Documents Data as of or for the three months ended each respective quarter (1) Refer to appendix for “Reconciliation of non-GAAP financial measures” Adjusted ROAA (1) (%) Reported ROATCE (%) Adjusted ROATCE (1) (%) 0.90% 0.73% 0.43% 0.93% 0.53% 0.00% 0.30% 0.60% 0.90% 1.20% Q2 '17 Q3 '17 Q4 '17 Q1 '18 Q2 '18 9.03% 6.92% 3.77% 10.04% 5.71% 0.00% 3.00% 6.00% 9.00% 12.00% Q2 '17 Q3 '17 Q4 '17 Q1 '18 Q2 '18 0.89% 0.83% 0.89% 0.91% 0.96% 0.00% 0.30% 0.60% 0.90% 1.20% Q2 '17 Q3 '17 Q4 '17 Q1 '18 Q2 '18 8.96% 7.87% 7.75% 9.87% 10.45% 0.00% 3.00% 6.00% 9.00% 12.00% Q2 '17 Q3 '17 Q4 '17 Q1 '18 Q2 '18

Historical Profitability Trends Source: SNL Financial, Company Documents Data as of or for the three months ended each respective quarter (1) Net interest margin is defined as net interest income calculated on a tax-equivalent basis divided by average earning assets (2) Per segment reporting; excludes impact of mortgage joint venture Retail Banking Non-Interest Income (2) / Average Assets (%) Retail Banking Efficiency Ratio (2) (%) Retail Banking Non-Interest Expense (2) / Average Assets (%) 4.01% 4.08% 3.80% 3.79% 3.74% 3.25% 3.50% 3.75% 4.00% 4.25% Q2 '17 Q3 '17 Q4 '17 Q1 '18 Q2 '18 0.24% 0.20% 0.23% 0.32% 0.32% 0.00% 0.10% 0.20% 0.30% 0.40% Q2 '17 Q3 '17 Q4 '17 Q1 '18 Q2 '18 2.38% 2.27% 2.12% 2.23% 2.18% 2.00% 2.15% 2.30% 2.45% 2.60% Q2 '17 Q3 '17 Q4 '17 Q1 '18 Q2 '18 60.8% 57.2% 58.2% 61.1% 59.4% 45.0% 50.0% 55.0% 60.0% 65.0% Q2 '17 Q3 '17 Q4 '17 Q1 '18 Q2 '18
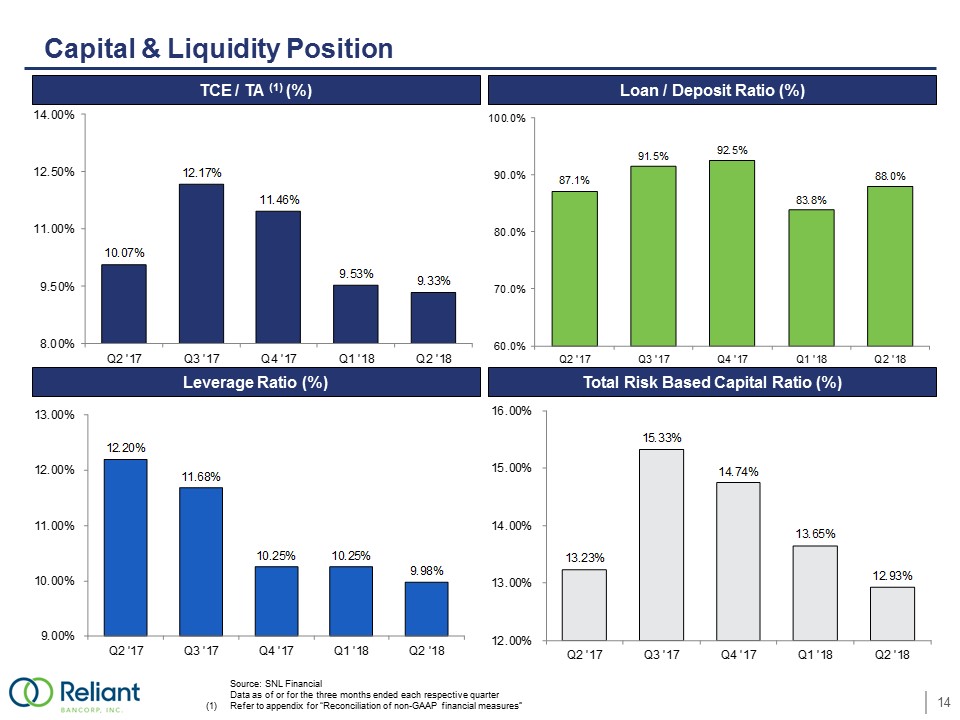
Capital & Liquidity Position TCE / TA (1) (%) Loan / Deposit Ratio (%) Leverage Ratio (%) Total Risk Based Capital Ratio (%) Source: SNL Financial Data as of or for the three months ended each respective quarter (1) Refer to appendix for “Reconciliation of non-GAAP financial measures” 10.07% 12.17% 11.46% 9.53% 9.33% 8.00% 9.50% 11.00% 12.50% 14.00% Q2 '17 Q3 '17 Q4 '17 Q1 '18 Q2 '18 87.1% 91.5% 92.5% 83.8% 88.0% 60.0% 70.0% 80.0% 90.0% 100.0% Q2 '17 Q3 '17 Q4 '17 Q1 '18 Q2 '18 12.20% 11.68% 10.25% 10.25% 9.98% 9.00% 10.00% 11.00% 12.00% 13.00% Q2 '17 Q3 '17 Q4 '17 Q1 '18 Q2 '18 13.23% 15.33% 14.74% 13.65% 12.93% 12.00% 13.00% 14.00% 15.00% 16.00% Q2 '17 Q3 '17 Q4 '17 Q1 '18 Q2 '18 14

Focused on Delivering Shareholder Value Source: SNL Financial, Company Documents Data as of or for the three months ended each respective quarter (1) Refer to appendix for “Reconciliation of non-GAAP financial measures” (2) As announced 6/29/17, represents the first two quarters of 2017, due to shift from annual to quarterly dividend Adjusted Quarterly EPS (1) ($) Tangible Book Value per Share (1) ($) Dividends per Share ($) $0.28 $0.22 $0.13 $0.33 $0.19 $0.00 $0.15 $0.30 $0.45 $0.60 Q2 '17 Q3 '17 Q4 '17 Q1 '18 Q2 '18 $0.28 $0.25 $0.26 $0.32 $0.34 $0.00 $0.10 $0.20 $0.30 $0.40 Q2 '17 Q3 '17 Q4 '17 Q1 '18 Q2 '18 $12.73 $13.88 $14.11 $12.94 $13.06 $0.00 $4.00 $8.00 $12.00 $16.00 Q2 '17 Q3 '17 Q4 '17 Q1 '18 Q2 '18 $0.12 $0.06 $0.06 $0.08 $0.08 $0.00 $0.04 $0.08 $0.12 $0.16 Q2 '17 Q3 '17 Q4 '17 Q1 '18 Q2 '18 (2)

Our History Source: SNL Financial and Company Filings 2006 2014 2015 2017 1/9/2006 Reliant Bank established 4/1/2015 CUBN and Reliant close merger. $791 million in assets 4/28/2014 CUBN and Reliant announce merger 7/7/2015 Stock begins trading on Nasdaq 3/6/2017 Opened Green Hills branch in Davidson County Total Assets ($mm) Reliant Bank Commerce Union Bank 2012 2013 2014 2015 2017 2016 2011 2010 2009 2008 2007 2006 $385 $385 $450 $363 $379 $382 $317 $205 $111 $232 $253 $296 $209 $187 $148 $133 $98 $35 $876 $912 $1,125 2/21/2017 Expansion into Chattanooga 8/14/2006 Commerce Union Bank established 6/30/2017 Surpassed $1 billion in assets 8/23/2017 Announced Merger with Community First & $25 million Private Placement Q2 ’18 $1,660 2018 1/1/2018 Completed Merger with Community First 12/31/2017 Officially rebranded as Reliant Bancorp, Inc.

Our Strategy for 2018 Maintain focus on organic growthCore deposit growth / deposit mixFull service offices in Murfreesboro (Q3) and Chattanooga (Q4) Add lending talent in key growth marketsCommitment to superior asset qualityImprove operating efficiency following Community First integrationExpand digital channelStrategic M&A opportunities

Appendix

Reconciliation of Non-GAAP Financial Measures *Net of taxes as reported in company documentsReliant Bancorp, Inc. Adjusted Return on Average Assets, Tangible Common Equity and Earnings Per ShareJune 30, September 30, December 31, March 31, June 30, (Dollars in thousands)20172017201720182018Net Income Attributable to Common Shareholders$2,187$1,846$1,155$3,741$2,139Interest income recognized on payoff of purchased credit impaired loan--(218)*------Non-Core Items:Purchase accounting adjustments(28)(19)*(19)*(293)(73)Gain on sale of other real estate--(1)*(1)*----Loss on disposal of premises and equipment--31*1*----Merger expenses--460*620*1772,483Deferred tax asset revaluation ----620*----Tax effect of adjustments to net income11----53(632)Adjusted net income attributable to common shareholders$2,170$2,099$2,376$3,678$3,917Average Assets$972,112$1,010,536$1,072,812$1,613,086$1,629,714Adjusted Return on Average Assets0.89%0.83%0.89%0.91%0.96%Average Tangible Common Equity$96,829$106,687$122,648$149,038$149,985Adjusted Return on Average Tangible Common Equity8.96%7.87%7.75%9.87%10.45%Diluted Weighted Average Common Shares7,873,1268,280,8589,039,05011,477,93411,495,233Adjusted Quarterly Earnings Per Share$0.28$0.25$0.26$0.32$0.34

Reconciliation of Non-GAAP Financial Measures (cont.)Reliant Bancorp, Inc. Tangible Common Equity to Tangible Assets and Tangible Book Value per ShareJune 30, September 30, December 31, March 31, June 30, (Dollars in thousands)20172017201720182018Tangible AssetsTotal assets$1,003,950$1,041,180$1,125,034$1,611,625$1,659,658Less: Goodwill11,40411,40411,40443,46443,627Less: Core deposit intangibles1,4041,3361,2808,9318,693Tangible Assets$991,142$1,028,440$1,112,350$1,559,230$1,607,338Tangible Common EquityTotal shareholders' equity$112,589$137,944$140,137$200,951$202,340Less: Total preferred equity----------Total Common equity$112,589$137,944$140,137$200,951$202,340Less: Goodwill11,40411,40411,40443,46443,627Less: Core deposit intangibles1,4041,3361,2808,9318,693Tangible Common Equity$99,781$125,204$127,453$148,556$150,020Common Shares Outstanding 7,839,5629,022,0989,034,43911,479,60811,482,965Tangible Book Value per Share$12.73$13.88$14.11$12.94$13.06Tangible Common Equity / Tangible Assets10.07%12.17%11.46%9.53%9.33%

Reconciliation of Non-GAAP Financial Measures (cont.) (1)Excludes impact of mortgage joint venture Reliant Bancorp, Inc. Retail Banking ProfitabilityJune 30, September 30, December 31, March 31, June 30,(Dollars in thousands)20172017201720182018Retail Banking Non-Interest Income (1)$594$516$629$1,288$1,299Retail Banking Non-Interest Expense (1)$5,780$5,747$5,691$8,980$8,867Average Assets$972,112$1,010,536$1,072,812$1,613,086$1,629,714Retail Banking Non-Interest Income / Average Assets0.24%0.20%0.23%0.32%0.32%Retail Banking Non-Interest Expense / Average Assets2.38%2.27%2.12%2.23%2.18%

Reconciliation of Non-GAAP Financial Measures (cont.) Excludes impact of mortgage joint venture Reliant Bancorp, Inc. Retail Banking Efficiency RatioThree months ended,June 30, September 30,December 31,March 31,June 30, (Dollars in thousands)20172017201720182018Operating ExpenseTotal noninterest expense$5,780$5,747$5,691$8,980$8,867Less: Other real estate owned expense----------Less: Amortization of intangible assets----------Operating Expense$5,780$5,747$5,691$8,980$8,867Operating RevenueNet interest income$8,405$8,924$8,537$13,044$13,190Add: Tax equivalent adjustment for tax exempt interest income530566613445490Tax equivalent net interest Income$8,935$9,490$9,150$13,489$13,680Total noninterest income5945166291,2881,299Less: Gains on sale of securities available for sale23------25Less: Gain on sale of other real estate owned1118920Less: Gain on acquisition of subordinate debentures----------Add: Loss on disposal of premises and equipment--502----Total noninterest income5705656301,1991,254Operating Revenue$9,505$10,055$9,780$14,688$14,934Efficiency Ratio60.8%57.2%58.2%61.1%59.4%