Attached files
| file | filename |
|---|---|
| 8-K - 8-K - ANDEAVOR LOGISTICS LP | andx8-kxubsmlpconference.htm |

UBS Midstream and MLP Conference
January 9, 2018
Creating Superior Value
Go for Extraordinary
EXHIBIT 99.1

Andeavor Logistics
Forward Looking Statements
1
This presentation (and oral statements made regarding the subjects of this presentation) includes forward-looking statements within the meaning of the
federal securities laws. All statements, other than statements of historical fact, are forward-looking statements, including without limitation statements
concerning: our operational, financial and growth strategies, including significant business improvements, sustainable earnings growth, stable, fee-based
business focus, existing asset base optimization, pursuit of organic expansion opportunities, strategic acquisitions, growth capital projects, and future
dropdowns; our ability to successfully effect those strategies and the expected timing and results thereof; our financial and operational outlook, including
targets for EBITDA and capital expenditures, and ability to fulfill that outlook; financial position, liquidity and capital resources; expectations regarding future
economic and market conditions and their effects on us; our 2020 journey plan and targets, including targets for EBITDA and the components thereof,
investments in organic projects, acquisitions and dropdowns, dropdown portfolio and estimated EBITDA contribution from each project, third party revenue
targets, and the expected timing and benefits thereof; plans, goals and targets for growth and execution associated with our Permian, Delaware basin,
Bakken and Rockies gas gathering and processing assets; statements regarding the Conan Crude Oil Gathering Pipeline system and other major projects,
including the expected capacity, timing, capital investment, net earnings and EBITDA contribution and other benefits associated with each project; the
planned transfer of the Conan System and the Los Angeles Pipeline Interconnect System to Andeavor Logistics; the benefits to our business and growth
prospects of our strategic relationship with Andeavor, and Andeavor’s expected EBITDA contributions to us; our financial strategy, including targets for
EBITDA, coverage and leverage ratios, liquidity, growth and maintenance capital, and third party equity; statements regarding our restructuring and
investment grade status, including our ability to maintain investment grade status, and the expected savings and benefits therefrom; our 2018-2020
capitalization and funding plan, including the allocation, sources, uses and expected benefits thereof; our continued focus on unitholder value, and the main
drivers thereof; and other aspects of future performance. Although we believe the assumptions concerning future events are reasonable, a number of
factors could cause results to differ materially from those projected. Our operations involve risks and uncertainties, many of which are outside of our control
and could materially affect our results. For more information concerning factors that could affect these statements, see our annual report on Form 10-K,
quarterly reports on Form 10-Q, and other SEC filings, available at http://www.andeavorlogistics.com. We undertake no obligation to revise or update any
forward-looking statements as a result of new information, future events or otherwise.
See the Appendix for reconciliations of the differences between the non-GAAP financial measures used in this presentation, including various estimates of
EBITDA, and their most directly comparable GAAP financial measures.

Andeavor Logistics
Continue to grow customer-focused, full-service, diversified midstream
business, strategically integrated into Andeavor’s value chain
Targets:
Execute at least $1 billion of annual high-return growth investments
Grow Permian EBITDA* to $200+ million by 2020
Deliver $80+ million of annual EBITDA* from Bakken projects
Increase third-party business to 50% of revenues
Targeting EBITDA* of $1.4 – $1.5 billion in 2020
Positioned for Continued Growth
2 *Represents a non-GAAP measure. Please see the Appendix for a definition of this measure and a reconciliation to its most
directly comparable GAAP measure
Andeavor Logistics
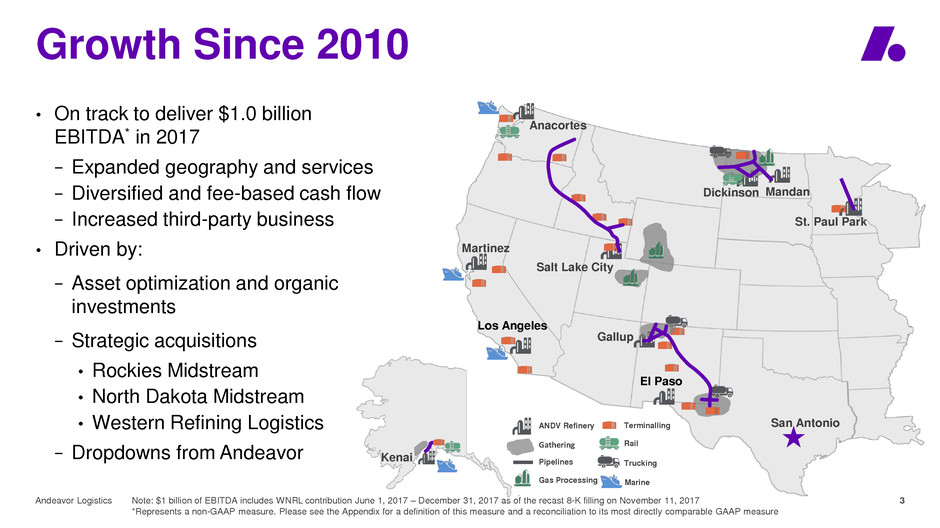
Growth Since 2010
3
Martinez
Anacortes
Dickinson Mandan
St. Paul Park
Salt Lake City
Gallup
San Antonio
Los Angeles
Kenai
Gathering
ANDV Refinery
Pipelines
Gas Processing Marine
Terminalling
Rail
Trucking
Note: $1 billion of EBITDA includes WNRL contribution June 1, 2017 – December 31, 2017 as of the recast 8-K filling on November 11, 2017
*Represents a non-GAAP measure. Please see the Appendix for a definition of this measure and a reconciliation to its most directly comparable GAAP measure
El Paso
• On track to deliver $1.0 billion
EBITDA* in 2017
− Expanded geography and services
− Diversified and fee-based cash flow
− Increased third-party business
• Driven by:
− Asset optimization and organic
investments
− Strategic acquisitions
• Rockies Midstream
• North Dakota Midstream
• Western Refining Logistics
− Dropdowns from Andeavor

Andeavor Logistics
Stable, Fee-Based Cash Flow
4
• Fee-Based Cash Flow
- 95% of cash flow fee based
- 60% backed by Minimum Volume
Commitments (MVCs) or take-or-pay
contracts
• Strong geographic diversity
- PADDs III, IV and V exposure in
Terminalling and Transportation
- Bakken, Permian, and Rockies regions in
Gathering and Processing
• Approximately 75% of revenue from
investment grade customers
Permian
Rockies
Bakken
2017E Pro Forma
Wholesale
Gathering &
Processing
Terminalling &
Transportation
Other
Investment
Grade
Other
Fee-Based
Segment Contribution
To EBITDA*
Gathering & Processing
EBITDA *
Revenues Revenues
Pro forma revenue figures include gross margin for WNRL wholesale
*Represents a non-GAAP measure. Please see the Appendix for a definition of this measure.
Andeavor Logistics
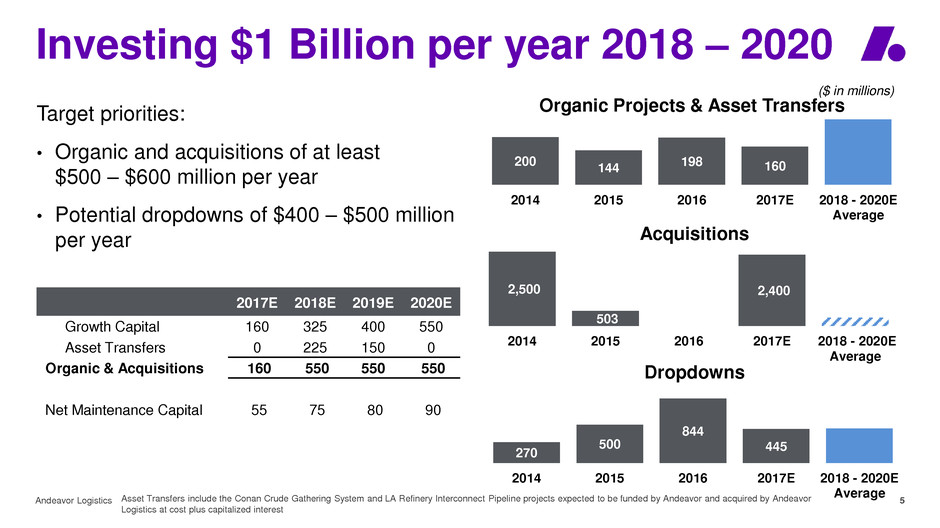
Investing $1 Billion per year 2018 – 2020
5
200
144
198 160
2014 2015 2016 2017E 2018 - 2020E
Average
2,500
503
-
2,400
2014 2015 2016 2017E 2018 - 2020E
Average
($ in millions)
270
500
844
445
2014 2015 2016 2017E 2018 - 2020E
Average
Dropdowns
Organic Projects & Asset Transfers Target priorities:
• Organic and acquisitions of at least
$500 – $600 million per year
• Potential dropdowns of $400 – $500 million
per year Acquisitions
2017E 2018E 2019E 2020E
Growth Capital 160 325 400 550
Asset Transfers 0 225 150 0
Organic & Acquisitions 160 550 550 550
Net Maintenance Capital 55 75 80 90
Asset Transfers include the Conan Crude Gathering System and LA Refinery Interconnect Pipeline projects expected to be funded by Andeavor and acquired by Andeavor
Logistics at cost plus capitalized interest
Andeavor Logistics
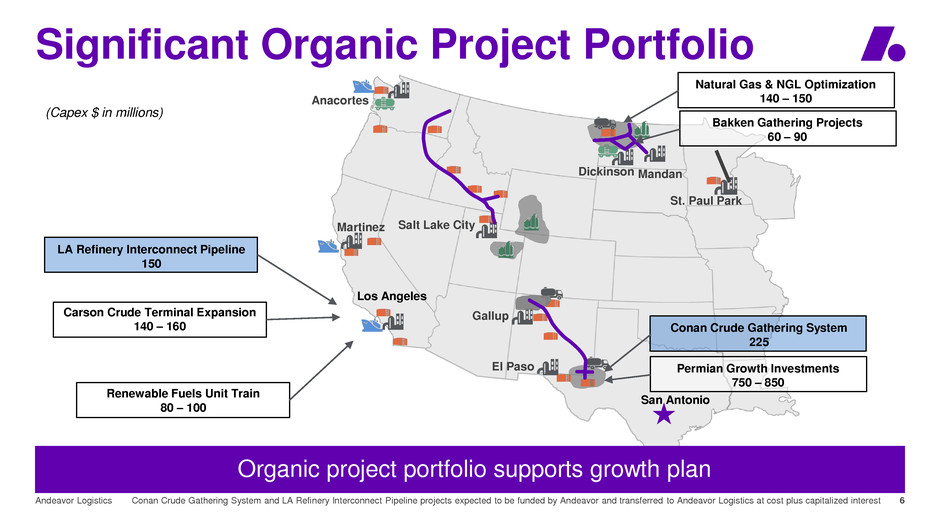
Significant Organic Project Portfolio
6
Martinez
Anacortes
Dickinson Mandan
St. Paul Park
Salt Lake City
Gallup
El Paso
Los Angeles
Permian Growth Investments
750 – 850
Natural Gas & NGL Optimization
140 – 150
Bakken Gathering Projects
60 – 90
Organic project portfolio supports growth plan
San Antonio
Conan Crude Gathering System
225
LA Refinery Interconnect Pipeline
150
Carson Crude Terminal Expansion
140 – 160
Renewable Fuels Unit Train
80 – 100
Conan Crude Gathering System and LA Refinery Interconnect Pipeline projects expected to be funded by Andeavor and transferred to Andeavor Logistics at cost plus capitalized interest
(Capex $ in millions)
Andeavor Logistics
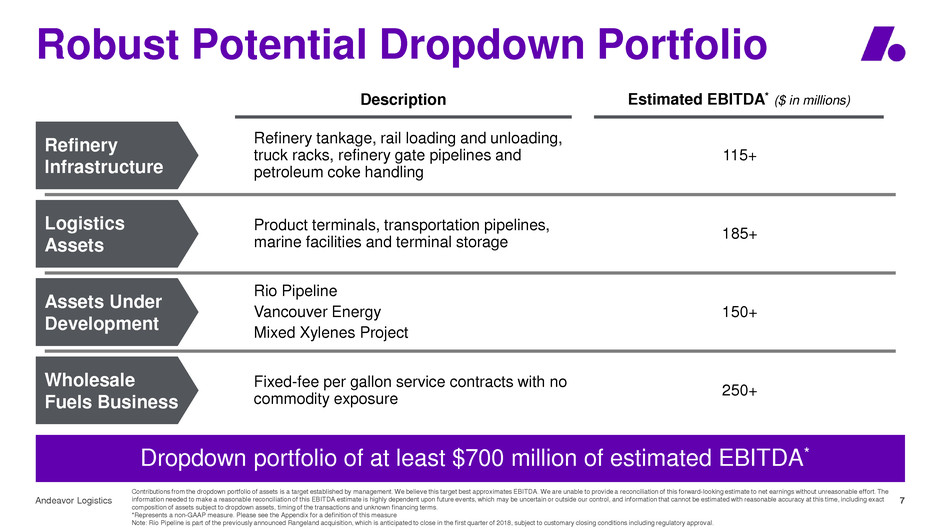
Robust Potential Dropdown Portfolio
7
Dropdown portfolio of at least $700 million of estimated EBITDA*
Description
Logistics
Assets
Product terminals, transportation pipelines,
marine facilities and terminal storage
185+
Assets Under
Development
Rio Pipeline
Vancouver Energy
Mixed Xylenes Project
150+
Wholesale
Fuels Business
Fixed-fee per gallon service contracts with no
commodity exposure
250+
Refinery
Infrastructure
115+
Refinery tankage, rail loading and unloading,
truck racks, refinery gate pipelines and
petroleum coke handling
Estimated EBITDA* ($ in millions)
Contributions from the dropdown portfolio of assets is a target established by management. We believe this target best approximates EBITDA. We are unable to provide a reconciliation of this forward-looking estimate to net earnings without unreasonable effort. The
information needed to make a reasonable reconciliation of this EBITDA estimate is highly dependent upon future events, which may be uncertain or outside our control, and information that cannot be estimated with reasonable accuracy at this time, including exact
composition of assets subject to dropdown assets, timing of the transactions and unknown financing terms.
*Represents a non-GAAP measure. Please see the Appendix for a definition of this measure
Note: Rio Pipeline is part of the previously announced Rangeland acquisition, which is anticipated to close in the first quarter of 2018, subject to customary closing conditions including regulatory approval.
Andeavor Logistics
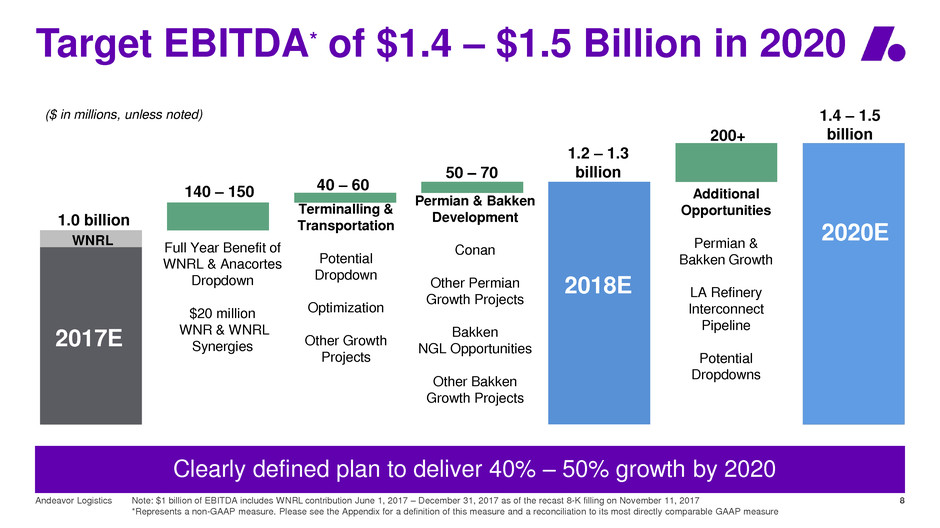
Target EBITDA* of $1.4 – $1.5 Billion in 2020
8
2017E
Clearly defined plan to deliver 40% – 50% growth by 2020
Note: $1 billion of EBITDA includes WNRL contribution June 1, 2017 – December 31, 2017 as of the recast 8-K filling on November 11, 2017
*Represents a non-GAAP measure. Please see the Appendix for a definition of this measure and a reconciliation to its most directly comparable GAAP measure
140 – 150
50 – 70
40 – 60
200+
1.2 – 1.3
billion
1.0 billion
WNRL
Full Year Benefit of
WNRL & Anacortes
Dropdown
$20 million
WNR & WNRL
Synergies
Additional
Opportunities
Permian &
Bakken Growth
LA Refinery
Interconnect
Pipeline
Potential
Dropdowns
Permian & Bakken
Development
Conan
Other Permian
Growth Projects
Bakken
NGL Opportunities
Other Bakken
Growth Projects
Terminalling &
Transportation
Potential
Dropdown
Optimization
Other Growth
Projects
2017E
2018E
2020E
1.4 – 1.5
billion
($ in millions, unless noted)

Andeavor Logistics
Differentiated Permian Position
9
Gallup
New
Mexico Texas
Four Corners Gathering
TexNew Mex System
Bobcat Pipeline
Conan Gathering Project
Refinery
ANDX Pipeline
Andeavor Pipeline
Third-Party Pipeline
Andeavor Receipt
Point / Station
• Cost and capability advantages in the
Delaware Basin and New Mexico
• Inter-basin pipeline transportation for
major gathering systems
• Multiple revenue streams – gathering,
transportation, storage and marketing
• Leverages existing commercial and
refining capabilities
• Physically integrated with El Paso and
Gallup refineries
• Connectivity to multiple takeaway options
from strategically positioned Wink Station
El Paso
Wink Station
Midland
Rio Pipeline
Note: Rio Pipeline is part of the previously announced Rangeland acquisition, which is anticipated to close in the first quarter of 2018, subject to customary closing conditions
including regulatory approval

Andeavor Logistics
Conan Crude Oil Gathering System
10
Conan
Gathering
System
• Expected online 3Q 2018
• Expected EBITDA* $30 – $40 million
• Connectivity to multiple long-haul pipelines from new
terminal in Loving County, Texas
• Initial capacity 250 MBD expandable to 500 MBD
• Three new crude truck offloading points
• Storage capacity 720,000 barrels
• Capex $225 million
*Represents a non-GAAP measure. Please see the Appendix for a definition of this measure and a reconciliation to its most directly comparable GAAP measure
Note: Rio Pipeline is part of the previously announced Rangeland acquisition, which is anticipated to close in the first quarter of 2018, subject to customary closing conditions including
regulatory approval
New Assets Existing Assets
Crude Gathering
New Truck
Offloading
Gathering
Pipelines
Conan
Terminal
Plains Pipeline
Enterprise Pipeline
Midland market hub
Existing Pipelines
CR-1 Station
TexNew Mex
System
Wink Station
Conan
ANDX Pipeline
Andeavor Pipeline
Rio Pipeline
To Midland

Andeavor Logistics
Positioned to Capture Expected Production
Growth in Delaware Basin
11
November 2017 Permian basin
180 day permit activity, current rigs
Delaware
Basin
Midland
Basin
(MBD)
56
200+
2017E 2020E
Permian EBITDA*
($ in millions)
Permian EBITDA represents all Gathering & Processing EBITDA in Texas and New Mexico; 2017E Permian EBITDA includes WNRL on a full year basis
Permian 180 day heat map and production data from DrillingInfo YTD through August 2017, historical rig counts from Marketview, forecast from Andeavor analysis
*Represents a non-GAAP measure. Please see the Appendix for a definition of this measure and a reconciliation to its most directly comparable GAAP measure
Note: Rio Pipeline is part of the previously announced Rangeland acquisition, which is anticipated to close in the first quarter of 2018, subject to customary closing conditions including regulatory approval
1
2
3 4 5
6
7 8
10
11
• Significant production growth expected
in Delaware basin 2017 – 2020 (40%+)
• Potential opportunities:
− Crude oil focused gathering projects
− Long haul pipelines to market hubs
− Strategic partnerships / joint ventures
− Bolt-on acquisitions at accretive
multiples
Conan
Gathering
System
Identified Additional Near-Term
Permian Opportunities
9
Rio Pipeline

Andeavor Logistics
Physically Integrated Bakken System
12
ND
SD
MN
Robinson Lake
Gathering & Processing
Belfield Gathering & Processing
Fryburg Rail Terminal
DAPL
Connection
To Mandan Refinery
Dickinson Refinery
To Guernsey, WY
DAPL &
Enbridge
Connections
• Premier aggregator with wide
geographic footprint and
interconnectivity
• Highly integrated system
supplying four Andeavor
refineries
• Providing crude oil, natural gas,
NGL and water services
• Strong customer value due to
multiple takeaway connections
• Well positioned to capture
upside as production increases
Andeavor Refinery
ANDX Gas Processing
ANDX Crude Pipelines
ANDX Gas Pipelines
ANDX Crude, Gas & Water Pipelines
Andeavor Crude Pipeline
ANDX Bakken Storage Hub

Andeavor Logistics
Executing Bakken Plan
13
1,180
1,040 1,050
88
35
50
2015 2016 2017 YTD 2018E 2020E
Physically integrated, diversified service offering
Actuals data from the State of North Dakota Department of Mineral Resources, YTD through September 2017, forecast based on Andeavor analysis
*Represents a non-GAAP measure. Please see the Appendix for a definition of this measure and a reconciliation to its most directly comparable GAAP measure
• Flat outlook for oil prices and production
• Associated natural gas production at all time
highs; gas liquids rich
• Identified opportunities through 2020 of
$80+ million EBITDA*
− Low capital, high return well connections
on existing systems
− New crude oil and natural gas gathering
projects
− Processing plant capacity expansions
− NGL opportunities
1.6 1.7 1.8
18
11 11
2015 2016 2017 YTD 2018E 2020E
Bakken Crude Oil Production (MBD)
& Rig Count
Bakken Natural Gas Production (Bcf/d)
& Gas Flared (%)

Andeavor Logistics
Increase Third-Party Revenue to 50%
14
2017E Pre-WNRL 2017E Pro Forma 2020E
Affiliate Affiliate
Third-
Party Affiliate
Third-
Party Third-
Party
0.9
1.3
2017E 2020E
• Increases and diversifies Andeavor
earnings
• Permian and Bakken projects underpin
plan
• Strengthens logistics as a customer-
focused, full service midstream business
2017 pro forma includes WNRL on a full year basis, all figures exclude WNRL wholesale business
Third-Party Revenue
($ in billions)

Andeavor Logistics
Sponsor Profile:
A premier refiner in western United States
Investment grade credit rating
No IDRs
Robust and growing Dropdown portfolio
Equity support in Dropdowns
Major project development
Strategic Relationship With Andeavor
15
Andeavor growth creates opportunities for Andeavor Logistics
2011 2012 2013 2014 2015 2016 2017E 2018E 2019E 2020E
Potential
Dropdowns
Initial
Contribution
BP
Carson
Tranche
1 & 2
Alaska &
Northern
California
Anacortes
LA
Storage
West
Coast
&
Alaska
Martinez
Long Beach
Anacortes
CROF
Ten Accretive Dropdowns from Andeavor
Since Initial contribution

Andeavor Logistics
Financial Principles Support
Sustainable Growth
16
Distribution Growth 6% or greater
Debt To EBITDA Ratio Approximately 4x
Available Liquidity $1.0 – $2.0 Billion
Annual Growth Investments At least $1.0 Billion
Maintain
Ample
Liquidity
Strong
Balance
Sheet
Disciplined
Capital
Allocation &
Investment
Sustainable
Cash
Distributions
Annual Maintenance Capital $0.1 Billion
Maintain strong liquidity to allow for
execution of growth plans
Committed to strengthening
investment grade credit ratings
Investing in high return projects
Targeting distribution growth and
coverage consistent with financial
targets
Net maintenance capital spend estimated for 2017, 2018, 2019, and 2020 is $55, $75, $80, and $90 million respectively
Well-positioned to achieve all financial targets in 2018
Distribution Coverage Ratio Approximately 1.1x
Targets

Andeavor Logistics
Investment Grade and IDR Buy-In Benefits
17
13.5%
8.4%
Pre-Announcement Post-Announcement
Pre-Announcement IG Issuance
170 bps
Improvement
• Elimination of IDR results in lower cost of
equity
− Increases breakeven multiple on new
investments by 3 - 4x
− Reduces need for public common equity
• Investment grade rating reduces cost of debt
and allows for extended maturity
− $29 million in annual run-rate interest
savings already realized; additional savings
anticipated
− Extended average maturities by 4.9 years to
9.6 years
• ANDV owns 59% of ANDX common units
Equity cost of capital is calculated as distribution yield grossed up for GP cash flow at time of announcement
Equity cost of capital post-announcement based on current distribution and unit price as of January 2, 2018
Andeavor Logistics Cost of Equity
Andeavor Logistics Cost of Debt
Andeavor Logistics
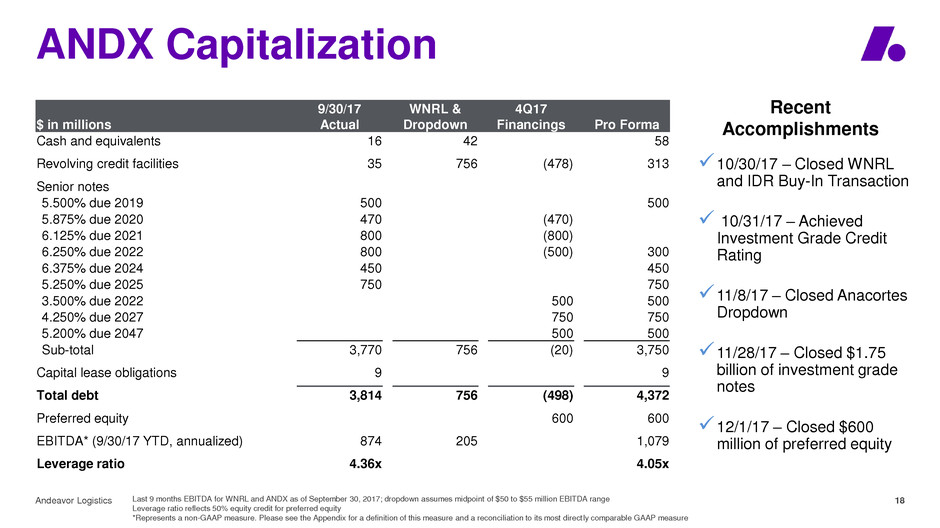
ANDX Capitalization
18 Last 9 months EBITDA for WNRL and ANDX as of September 30, 2017; dropdown assumes midpoint of $50 to $55 million EBITDA range
Leverage ratio reflects 50% equity credit for preferred equity
*Represents a non-GAAP measure. Please see the Appendix for a definition of this measure and a reconciliation to its most directly comparable GAAP measure
$ in millions
9/30/17
Actual
WNRL &
Dropdown
4Q17
Financings Pro Forma
Cash and equivalents 16 42 58
Revolving credit facilities 35 756 (478) 313
Senior notes
5.500% due 2019 500 500
5.875% due 2020 470 (470)
6.125% due 2021 800 (800)
6.250% due 2022 800 (500) 300
6.375% due 2024 450 450
5.250% due 2025 750 750
3.500% due 2022 500 500
4.250% due 2027 750 750
5.200% due 2047 500 500
Sub-total 3,770 756 (20) 3,750
Capital lease obligations 9 9
Total debt 3,814 756 (498) 4,372
Preferred equity 600 600
EBITDA* (9/30/17 YTD, annualized) 874 205 1,079
Leverage ratio 4.36x 4.05x
10/30/17 – Closed WNRL
and IDR Buy-In Transaction
10/31/17 – Achieved
Investment Grade Credit
Rating
11/8/17 – Closed Anacortes
Dropdown
11/28/17 – Closed $1.75
billion of investment grade
notes
12/1/17 – Closed $600
million of preferred equity
Recent
Accomplishments

Andeavor Logistics
Limited Public Common Equity Needs
19
3,300 3,300
Uses Sources
2018 – 2020 Capital Plan
($ in Millions)
Potential
Dropdowns
Growth Capital
Maintenance
Debt
Retained Cash
ANDV Equity
Public Common Equity
• No public common equity expected in 2018
• Less than $200 million public common
equity per year expected 2019 – 2020
• Andeavor plans to take $100 - $150 million of
common equity annually from dropdowns
• Additional perpetual preferred or hybrid capital
will be considered as alternative financing
Andeavor Logistics
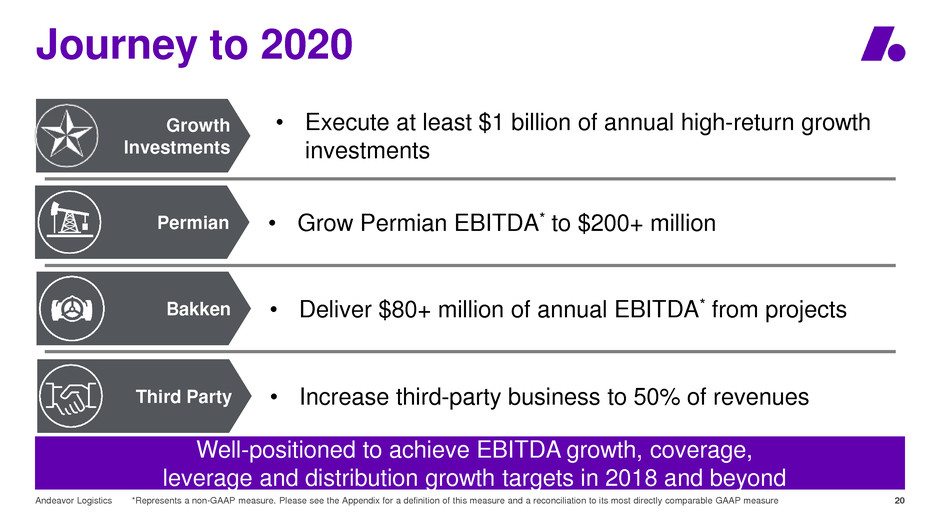
Journey to 2020
20
Well-positioned to achieve EBITDA growth, coverage,
leverage and distribution growth targets in 2018 and beyond
*Represents a non-GAAP measure. Please see the Appendix for a definition of this measure and a reconciliation to its most directly comparable GAAP measure
• Execute at least $1 billion of annual high-return growth
investments
Permian • Grow Permian EBITDA* to $200+ million
Third Party • Increase third-party business to 50% of revenues
• Deliver $80+ million of annual EBITDA* from projects
Growth
Investments
Bakken

Andeavor Logistics
Appendix
21

Andeavor Logistics
Non-GAAP Financial Measures
22
Our management uses certain ―non-GAAP‖ operational measures to analyze operating segment performance and ―non-GAAP‖ financial measures to evaluate past performance and
prospects for the future to supplement our financial information presented in accordance with accounting principles generally accepted in the United States of America (―GAAP‖). These
financial and operational non-GAAP measures are important factors in assessing our operating results and profitability and include:
• EBITDA—GAAP-based net earnings before interest, income taxes, and depreciation and amortization expenses;
• Segment EBITDA—a segment’s GAAP-based operating income before depreciation and amortization expenses plus equity in earnings (loss) of equity method investments and
other income (expense), net;
We present these measures because we believe they may help investors, analysts, lenders and ratings agencies analyze our results of operations and liquidity in conjunction with our
GAAP results, including but not limited to:
• our operating performance as compared to other publicly traded companies in the marketing, logistics and refining industries, without regard to historical cost basis or financing
methods;
• our ability to incur and service debt and fund capital expenditures; and
• the viability of acquisitions and other capital expenditure projects and the returns on investment of various investment opportunities.
Non-GAAP measures have important limitations as analytical tools, because they exclude some, but not all, items that affect net earnings and operating income. These measures
should not be considered substitutes for their most directly comparable GAAP financial measures. See ―Non-GAAP Reconciliations‖ below for reconciliations between non-GAAP
measures and their most directly comparable GAAP measures.

Andeavor Logistics
Non-GAAP Reconciliations
23
