Attached files
| file | filename |
|---|---|
| EX-32.2 - EXHIBIT 32.2 - ANDEAVOR LOGISTICS LP | andx3q201810-qex322.htm |
| EX-32.1 - EXHIBIT 32.1 - ANDEAVOR LOGISTICS LP | andx3q201810-qex321.htm |
| EX-31.2 - EXHIBIT 31.2 - ANDEAVOR LOGISTICS LP | andx3q201810-qex312.htm |
| EX-31.1 - EXHIBIT 31.1 - ANDEAVOR LOGISTICS LP | andx3q201810-qex311.htm |
| EX-10.11 - EXHIBIT 10.11 - ANDEAVOR LOGISTICS LP | andx3q201810-qex1011.htm |
| EX-10.10 - EXHIBIT 10.10 - ANDEAVOR LOGISTICS LP | andx3q201810-qex1010.htm |
| EX-10.9 - EXHIBIT 10.9 - ANDEAVOR LOGISTICS LP | andx3q201810-qex109.htm |
| EX-10.4 - EXHIBIT 10.4 - ANDEAVOR LOGISTICS LP | andx3q201810-qex104.htm |
| EX-10.2 - EXHIBIT 10.2 - ANDEAVOR LOGISTICS LP | andx3q201810-qex102.htm |
| EX-2.5 - EXHIBIT 2.5 - ANDEAVOR LOGISTICS LP | andx3q201810-qex25.htm |
UNITED STATES
SECURITIES AND EXCHANGE COMMISSION
Washington, D.C. 20549
FORM 10‑Q
(Mark One)
þ | QUARTERLY REPORT PURSUANT TO SECTION 13 OR 15(d) OF THE SECURITIES EXCHANGE ACT OF 1934 |
For the quarterly period ended September 30, 2018
or
o | TRANSITION REPORT PURSUANT TO SECTION 13 OR 15(d) OF THE SECURITIES EXCHANGE ACT OF 1934 |
For the transition period from______________to __________
Commission File Number 1‑35143
ANDEAVOR LOGISTICS LP
(Exact name of registrant as specified in its charter)
Delaware |  | 27‑4151603 |
(State or other jurisdiction of | (I.R.S. Employer | |
incorporation or organization) | Identification No.) | |
200 East Hardin Street, Findlay, Ohio 45840 | ||
(Address of principal executive offices) (Zip Code) | ||
419-421-2414 | ||
(Registrant’s telephone number, including area code) | ||
Indicate by check mark whether the registrant (1) has filed all reports required to be filed by Section 13 or 15(d) of the Securities Exchange Act of 1934 during the preceding 12 months (or for such shorter period that the registrant was required to file such reports), and (2) has been subject to such filing requirements for the past 90 days. Yes þ No o
Indicate by check mark whether the registrant has submitted electronically every Interactive Data File required to be submitted pursuant to Rule 405 of Regulation S-T (§232.405 of this chapter) during the preceding 12 months (or for such shorter period that the registrant was required to submit such files). Yes þ No o
Indicate by check mark whether the registrant is a large accelerated filer, an accelerated filer, a non-accelerated filer, a smaller reporting company or an emerging growth company. See definitions of “large accelerated filer,” “accelerated filer,” “smaller reporting company” and “emerging growth company” in Rule 12b-2 of the Exchange Act. (Check one):
Large accelerated filer | þ | Accelerated filer | o | |||
Non-accelerated filer | o | Smaller reporting company | o | |||
Emerging growth company | o | |||||
If an emerging growth company, indicate by check mark if the registrant has elected not to use the extended transition period for complying with any new or revised financial accounting standards provided pursuant to Section 13(a) of the Exchange Act. o
Indicate by check mark whether the registrant is a shell company (as defined in Rule 12b-2 of the Exchange Act). Yes o No þ
There were 245,484,047 common units of the registrant outstanding at November 2, 2018.
Table of Contents | ||
Andeavor Logistics LP
Quarterly Report on Form 10-Q
For the Quarterly Period Ended September 30, 2018
Note 2 - Acquisitions and Divestitures | |||

This Quarterly Report on Form 10-Q (including documents incorporated by reference herein) contains statements with respect to our expectations or beliefs as to future events. These types of statements are “forward-looking” and subject to uncertainties. See “Important Information Regarding Forward-Looking Statements” in Management’s Discussion and Analysis of Financial Condition and Results of Operations in Part I, Item 2.
2 | |  | ||
Financial Statements | |||
Part I - Financial Information
Item 1. Financial Statements
Andeavor Logistics LP
Condensed Statements of Consolidated Operations
(Unaudited)
Three Months Ended September 30, | Nine Months Ended September 30, | ||||||||||||||
2018 (a) | 2017 (a) | 2018 (a) | 2017 (a) | ||||||||||||
(In millions, except per unit amounts) | |||||||||||||||
Revenues: (b) | |||||||||||||||
Affiliate | $ | 415 | $ | 468 | $ | 1,131 | $ | 951 | |||||||
Third-party | 227 | 626 | 626 | 1,184 | |||||||||||
Total Revenues | 642 | 1,094 | 1,757 | 2,135 | |||||||||||
Costs and Expenses: | |||||||||||||||
Cost of fuel and other (excluding items shown separately below) (b) | — | 554 | — | 716 | |||||||||||
NGL expense (excluding items shown separately below) | 73 | 64 | 166 | 179 | |||||||||||
Operating expenses (excluding depreciation and amortization) | 236 | 199 | 658 | 512 | |||||||||||
Depreciation and amortization expenses | 86 | 85 | 268 | 222 | |||||||||||
General and administrative expenses | 31 | 44 | 91 | 107 | |||||||||||
Loss (gain) on asset disposals and impairments | 1 | 1 | 2 | (25 | ) | ||||||||||
Operating Income | 215 | 147 | 572 | 424 | |||||||||||
Interest and financing costs, net | (57 | ) | (68 | ) | (172 | ) | (193 | ) | |||||||
Equity in earnings of equity method investments | 7 | 6 | 25 | 13 | |||||||||||
Other income, net | 1 | 5 | 4 | 9 | |||||||||||
Net Earnings | $ | 166 | $ | 90 | $ | 429 | $ | 253 | |||||||
Loss attributable to Predecessors | $ | 4 | $ | 7 | $ | 28 | $ | 46 | |||||||
Net Earnings Attributable to Partners | 170 | 97 | 457 | 299 | |||||||||||
Preferred unitholders’ interest in net earnings | (10 | ) | — | (34 | ) | — | |||||||||
General partner’s interest in net earnings, including incentive distribution rights | — | — | — | (79 | ) | ||||||||||
Limited Partners’ Interest in Net Earnings | $ | 160 | $ | 97 | $ | 423 | $ | 220 | |||||||
Net earnings per limited partner unit | |||||||||||||||
Common - basic | $ | 0.68 | $ | 0.90 | $ | 1.91 | $ | 2.05 | |||||||
Common - diluted | $ | 0.68 | $ | 0.90 | $ | 1.91 | $ | 2.05 | |||||||
Weighted average limited partner units outstanding | |||||||||||||||
Common units - basic | 234.4 | 108.0 | 223.0 | 107.0 | |||||||||||
Common units - diluted | 234.6 | 108.1 | 223.2 | 107.1 | |||||||||||
Cash distributions paid per unit | $ | 1.030 | $ | 0.971 | $ | 3.045 | $ | 2.821 | |||||||
(a) | Adjusted to include the historical results of the Predecessors. See Note 1 for further discussion. |
(b) | Due to the adoption of the revenue recognition standard effective January 1, 2018, the revenues and costs associated with our fuel purchase and supply arrangements with Andeavor for the three and nine months ended September 30, 2018 were netted. See Note 1 for further discussion. |
The accompanying notes are an integral part of these condensed consolidated financial statements.
September 30, 2018 | 3 | ||
Financial Statements | ||
Andeavor Logistics LP
Condensed Consolidated Balance Sheets
(Unaudited)
September 30, 2018 | December 31, 2017 (a) | ||||||
(In millions, except unit amounts) | |||||||
Assets | |||||||
Current Assets | |||||||
Cash and cash equivalents | $ | 30 | $ | 75 | |||
Receivables, net of allowance for doubtful accounts | |||||||
Trade and other | 250 | 219 | |||||
Affiliate | 251 | 264 | |||||
Prepayments and other current assets | 81 | 27 | |||||
Total Current Assets | 612 | 585 | |||||
Property, Plant and Equipment, Net | |||||||
Property, plant and equipment, at cost | 7,965 | 7,243 | |||||
Accumulated depreciation | (1,215 | ) | (994 | ) | |||
Property, Plant and Equipment, Net | 6,750 | 6,249 | |||||
Acquired Intangibles, Net | 1,116 | 1,154 | |||||
Goodwill | 988 | 956 | |||||
Equity Method Investments | 607 | 440 | |||||
Other Noncurrent Assets, Net | 124 | 121 | |||||
Total Assets | $ | 10,197 | $ | 9,505 | |||
Liabilities and Equity | |||||||
Current Liabilities | |||||||
Accounts payable | |||||||
Trade and other | $ | 201 | $ | 186 | |||
Affiliate | 254 | 207 | |||||
Accrued interest and financing costs | 68 | 40 | |||||
Other current liabilities | 81 | 85 | |||||
Total Current Liabilities | 604 | 518 | |||||
Debt, Net of Unamortized Issuance Costs | 4,829 | 4,127 | |||||
Other Noncurrent Liabilities | 77 | 54 | |||||
Total Liabilities | 5,510 | 4,699 | |||||
Commitments and Contingencies (Note 8) | |||||||
Equity | |||||||
Equity of Predecessors | — | 1,292 | |||||
Preferred unitholders; 600,000 units issued and outstanding in 2018 and 2017 | 594 | 589 | |||||
Common unitholders; 245,472,743 units issued and outstanding (217,097,057 in 2017) | 4,093 | 2,925 | |||||
Total Equity | 4,687 | 4,806 | |||||
Total Liabilities and Equity | $ | 10,197 | $ | 9,505 | |||
(a) | Adjusted to include the historical results of the Predecessors. See Note 1 for further discussion. |
The accompanying notes are an integral part of these condensed consolidated financial statements.
4 | | | ||
Financial Statements | |||
Andeavor Logistics LP
Condensed Statements of Consolidated Cash Flows
(Unaudited)
Nine Months Ended September 30, | |||||||
2018 (a) | 2017 (a) | ||||||
(In millions) | |||||||
Cash Flows From (Used In) Operating Activities | |||||||
Net earnings | $ | 429 | $ | 253 | |||
Adjustments to reconcile net earnings to net cash from operating activities: | |||||||
Depreciation and amortization expenses | 268 | 222 | |||||
Loss (gain) on asset disposals and impairments | 2 | (25 | ) | ||||
Other operating activities | 27 | 23 | |||||
Changes in current assets and liabilities | 4 | 62 | |||||
Changes in noncurrent assets and liabilities | (11 | ) | (11 | ) | |||
Net cash from operating activities | 719 | 524 | |||||
Cash Flows From (Used In) Investing Activities | |||||||
Capital expenditures | (566 | ) | (220 | ) | |||
Acquisitions, net of cash | (379 | ) | (1,230 | ) | |||
Proceeds from sales of assets | — | 46 | |||||
Net cash used in investing activities | (945 | ) | (1,404 | ) | |||
Cash Flows From (Used In) Financing Activities | |||||||
Borrowings under revolving credit agreements | 1,030 | 319 | |||||
Repayments under revolving credit agreements | (333 | ) | (614 | ) | |||
Proceeds from issuance of common units, net of issuance costs | — | 284 | |||||
Proceeds from issuance of general partner units, net of issuance costs | — | 6 | |||||
Quarterly distributions to common unitholders | (620 | ) | (329 | ) | |||
Quarterly distributions to general partner | — | (131 | ) | ||||
Distributions to preferred unitholders | (29 | ) | — | ||||
Distributions in connection with acquisitions | (300 | ) | (5 | ) | |||
Sponsor contributions of equity to the Predecessors | 406 | 678 | |||||
Capital contributions by affiliate | 27 | 24 | |||||
Other financing activities | — | (2 | ) | ||||
Net cash from financing activities | 181 | 230 | |||||
Decrease in Cash and Cash Equivalents | (45 | ) | (650 | ) | |||
Cash and Cash Equivalents, Beginning of Period | 75 | 688 | |||||
Cash and Cash Equivalents, End of Period | $ | 30 | $ | 38 | |||
(a) Adjusted to include the historical results of the Predecessors. See Note 1 for further discussion.
The accompanying notes are an integral part of these condensed consolidated financial statements.
September 30, 2018 | 5 | ||
Notes to Condensed Consolidated Financial Statements (Unaudited) | ||
Note 1 - Organization and Basis of Presentation
Organization
Andeavor Logistics LP (“Andeavor Logistics” or the “Partnership”) is a fee-based, growth-oriented Delaware limited partnership formed in December 2010 by Andeavor and its wholly-owned subsidiary, Tesoro Logistics GP, LLC (“TLGP”), our general partner, to own, operate, develop and acquire logistics and related assets and businesses. Unless the context otherwise requires, references in this report to “we,” “us,” “our,” or “ours” refer to Andeavor Logistics LP, one or more of its consolidated subsidiaries, or all of them taken as a whole. Unless the context otherwise requires, references in this report to “Andeavor” refer collectively to Andeavor for all activity through September 30, 2018, or Andeavor LLC, successor-by-merger to Andeavor effective October 1, 2018 and a wholly owned subsidiary of Marathon Petroleum Corporation (“MPC” or “Marathon”), and any of Andeavor’s or Andeavor LLC’s subsidiaries, as applicable, other than Andeavor Logistics, its subsidiaries and its general partner.
Marathon Petroleum Corporation Merger
On October 1, 2018, MPC completed its acquisition of Andeavor in accordance with the Agreement and Plan of Merger, dated as of April 29, 2018, as amended (the “MPC Merger Agreement”), under which MPC acquired all of Andeavor’s outstanding shares (the “MPC Merger”). Following the MPC Merger, MPC is the beneficial owner of approximately 156 million common units out of approximately 245 million common units outstanding in the Partnership as of October 1, 2018, representing an approximate 64% limited partner interest. MPC is also the beneficial owner of 100% of the equity interests of TLGP.
Principles of Consolidation and Basis of Presentation
Principles of Consolidation
Assets acquired from Andeavor, and the associated liabilities and results of operations, are collectively referred to as the “Predecessors.” See Note 1 of our Annual Report on Form 10-K for the year ended December 31, 2017 and Note 2 for additional information regarding the assets acquired from Andeavor.
Transfers of businesses between entities under common control are accounted for as if the transfer occurred at the beginning of the period, and prior periods are retrospectively adjusted to furnish comparative information. On August 6, 2018, we acquired Permian, refining logistics and asphalt assets (the “2018 Drop Down”) from Andeavor. See Note 2 for additional information. As an entity under common control with Andeavor, we record the assets that we acquire from Andeavor, on our condensed consolidated balance sheet at Andeavor’s historical basis instead of fair value. Accordingly, the accompanying financial statements and related notes of Andeavor Logistics have been retrospectively adjusted to include the historical results of the assets acquired prior to the effective date of the acquisition.
The financial statements of our Predecessors have been prepared from the separate records maintained by Andeavor and may not necessarily be indicative of the conditions that would have existed or the results of operations if our Predecessors had been operated as an unaffiliated entity. For the nine months ended September 30, 2018, the Partnership’s net cash from operating activities includes $40 million and net cash used in investing activities of $446 million from our Predecessors, offset by sponsor contributions of equity to the Predecessors in net cash from financing activities. The Partnership’s operating activities and investing activities for the nine months ended September 30, 2017 include $25 million and $653 million, respectively, of cash used by our Predecessors, offset by sponsor contributions of equity to the Predecessors in net cash from financing activities.
We acquired certain logistics assets located in Anacortes, Washington (the “Anacortes Logistics Assets”) in 2017. While this acquisition is a common control transaction, prior periods have not been recast as these assets did not constitute a business in accordance with Accounting Standards Update (“ASU”) 2017-01, “Clarifying the Definition of a Business.”
The interim condensed consolidated financial statements and notes thereto have been prepared by management without audit according to the rules and regulations of the Securities and Exchange Commission (“SEC”) and reflect all adjustments that, in the opinion of management, are necessary for a fair presentation of results for the periods presented. Such adjustments are of a normal recurring nature, unless otherwise disclosed.
Basis of Presentation
We prepare our condensed consolidated financial statements in conformity with accounting principles generally accepted in the United States of America (“U.S. GAAP”). However, certain information and notes normally included in financial statements prepared under U.S. GAAP have been condensed or omitted pursuant to the SEC’s rules and regulations. Management believes that the disclosures presented herein are adequate to present the information fairly. The accompanying interim condensed consolidated financial statements and notes should be read in conjunction with our Annual Report on Form 10-K for the year ended December 31, 2017. Certain prior year balances have been aggregated or disaggregated in order to conform to the current year presentation, including the adoption of recent accounting standards discussed further below.
6 | | | ||
Notes to Condensed Consolidated Financial Statements (Unaudited) | ||
We are required under U.S. GAAP to make estimates and assumptions that affect the amounts of assets and liabilities and revenues and expenses reported as of and during the periods presented. We review our estimates on an ongoing basis using currently available information. Changes in facts and circumstances may result in revised estimates, and actual results could differ from those estimates. The results of operations of the Partnership for any interim period are not necessarily indicative of results for the full year.
Cost Classifications
Natural gas liquids (“NGL”) expense results from the cost of NGL purchases under our percent of proceeds (“POP”) arrangements as well as the non-cash acquisition of replacement dry gas under our keep-whole arrangements.
During the three and nine months ended September 30, 2017, cost of fuel and other included the purchase cost of refined products sold within our Wholesale segment, the cost of inbound transportation and distribution costs incurred to transport product to our customers. Due to the adoption of ASU 2014-09, “Revenue from Contracts with Customers,” and the associated subsequent amendments (collectively, “ASC 606”) on January 1, 2018, the revenues and costs associated with our fuel purchase and supply arrangements were netted, as further described in Note 10.
Operating expenses are comprised of direct operating costs including costs incurred for direct labor, repairs and maintenance, outside services, chemicals and catalysts, utility costs, including the purchase of electricity and natural gas used by our facilities, property taxes, environmental compliance costs related to current period operations, rent expense and other direct operating expenses incurred in the provision of services.
Depreciation and amortization expenses consist of the depreciation and amortization of property, plant and equipment, deferred charges and intangible assets. General and administrative expenses represent costs that are not directly or indirectly related to or otherwise are not allocated to our operations. NGL expense, direct operating expenses, and depreciation and amortization expenses recognized by our Terminalling and Transportation, Gathering and Processing, and Wholesale segments constitute costs of revenue as defined by U.S. GAAP.
Financial Instruments
The fair value of our senior notes is based on prices from recent trade activity and is categorized in level 2 of the fair value hierarchy. The borrowings under our amended revolving credit facility (the “Revolving Credit Facility”) and our dropdown credit facility (“Dropdown Credit Facility”), which include a variable interest rate, approximate fair value. The carrying value and fair value of our debt were both $4.9 billion as of September 30, 2018 and were $4.2 billion and $4.3 billion at December 31, 2017, respectively. These carrying and fair values of our debt exclude the unamortized issuance costs, which are netted against our total debt.
We believe the carrying value of our other financial instruments, including cash and cash equivalents, receivables, accounts payable and certain accrued liabilities, approximate fair value. Our fair value assessment incorporates a variety of considerations, including the short-term duration of the instruments and the expected future insignificance of bad debt expense, which includes an evaluation of counterparty credit risk.
New Accounting Standards and Disclosures
Revenue Recognition
In May 2014, the Financial Accounting Standards Board (“FASB”) issued ASC 606 to replace existing revenue recognition rules with a single comprehensive model to use in accounting for revenue arising from contracts with customers. Under ASC 606, revenue is recognized when a customer obtains control of promised goods or services for an amount that reflects the consideration the entity expects to receive in exchange for those goods or services. In addition, ASC 606 requires expanded disclosure of the nature, amount, timing and uncertainty of revenue and cash flows arising from contracts with customers.
We adopted ASC 606 on January 1, 2018 utilizing the modified retrospective method. We recognized a $22 million reduction to the opening balance of partners’ equity as of January 1, 2018 for the cumulative effect adjustment related to contracts in process but not substantially complete as of that date. We reflected the aggregate impact of all modifications executed and effective as of January 1, 2018 in applying the new standard to these contracts. The cumulative effect adjustment is primarily related to the period over which revenue is recognized on contracts for which customers pay minimum throughput volume commitments and claw-back provisions apply. Additionally, upon the adoption of ASC 606, the gross versus net presentation of certain contractual arrangements and taxes has changed as further described in Note 10. The current period results and balances are presented in accordance with ASC 606, while comparative periods continue to be presented in accordance with the accounting standards in effect for those periods.
For the three and nine months ended September 30, 2018, we recorded lower revenues of $709 million and $2.0 billion, respectively, and lower costs and expenses of $709 million and $2.0 billion, respectively, for presentation impacts of applying ASC 606. These impacts were primarily associated with the netting of revenues and costs associated with our fuel purchase and supply arrangements with Andeavor, as further described in Note 10. We recorded lower revenues of $13 million and $10 million
September 30, 2018 | 7 | ||
Notes to Condensed Consolidated Financial Statements (Unaudited) | ||
associated with minimum volume commitments during the three and nine months ended September 30, 2018, respectively, as a result of applying the new standard. There were no material impacts during the period to the condensed consolidated balance sheets or condensed statement of consolidated cash flows, as a result of the adoption.
Leases
In February 2016, the FASB issued ASU 2016-02, “Leases” (“ASU 2016-02”), which amends existing accounting standards for lease accounting and adds additional disclosures about leasing arrangements. Under the new guidance, lessees are required to recognize right-of-use assets and lease liabilities on the balance sheet for all leases with terms longer than 12 months. Leases will be classified as either a financing lease or operating lease with classification affecting the pattern of expense recognition in the condensed statements of consolidated operations and presentation of cash flows in the condensed statements of consolidated cash flows. The new standard also requires additional disclosures to help financial statement users better understand the amount, timing, and uncertainty of cash flows arising from leases. ASU 2016-02 is effective for annual reporting periods beginning after December 15, 2018, and interim reporting periods within those annual reporting periods, with early adoption being permitted. In July 2018, the FASB issued ASU 2018-11, which permits entities with the option to adopt the provisions of ASU 2016-02 prospectively without adjusting comparative periods. We will elect this option and adopt the standard on January 1, 2019. In addition, we also expect to adopt the package of practical expedients which allows an entity, on the date of adoption, to not reassess expired or existing contracts in whether they are a lease or contain a lease and to not reassess the historical lease classification for expired or existing leases.
We continue to progress through our implementation plan, which includes the following activities: testing and implementing a new lease accounting system, finalizing design and implementation of new business processes and related internal controls, the continued extraction of the required accounting and reporting data from our lease agreements as well as the continued assessment and documentation of the accounting impacts related to the new standard. While we are still working through our implementation plan, we do expect that the recognition of right-of-use assets and lease liabilities, which are not currently reflected on our consolidated balance sheets, will have a material impact on total assets and liabilities. However, we do not expect the adoption of the standard to have a material impact on our statement of consolidated operations or liquidity. At this time, we are unable to estimate the full impact of the standard given we are still extracting the accounting data from our lease agreements as well as testing and implementing our new lease accounting system, which will be used to calculate the accounting impacts.
Credit Losses
In June 2016, the FASB issued ASU 2016-13, “Measurement of Credit Losses on Financial Instruments” (“ASU 2016-13”), which amends guidance on the impairment of financial instruments. The ASU requires the estimation of credit losses based on expected losses and provides for a simplified accounting model for purchased financial assets with credit deterioration. ASU 2016-13 is effective for annual reporting periods beginning after December 15, 2019, and interim reporting periods within those annual reporting periods. Early adoption is permitted for annual reporting periods beginning after December 15, 2018. While we are still evaluating the impact of ASU 2016-13, we do not expect to early adopt ASU 2016-13 and we do not expect the adoption of this standard to have a material impact on our condensed consolidated financial statements.
Restricted Cash
In November 2016, the FASB issued ASU 2016-18, "Restricted Cash" (“ASU 2016-18”), which clarifies how restricted cash and restricted cash equivalents are presented in the statements of cash flows. The ASU requires that changes in restricted cash that result from transfers between cash, cash equivalents and restricted cash should not be presented as cash flow activities in the statements of cash flows. ASU 2016-18 was effective for annual reporting periods beginning after December 15, 2017, and interim reporting periods within those annual reporting periods. We adopted ASU 2016-08 as of January 1, 2018 on a retrospective basis. Adoption of this standard resulted in an increase in cash and cash equivalents during the second quarter of 2017 of $14 million, but the restriction was released during the third quarter of 2017 as the cash was used to reinvest in assets used in our business and as a payment of debt. As a result, the adoption of this standard did not have an impact on our condensed statement of consolidated cash flows for the nine months ended September 30, 2017. See Note 2 for further information regarding restricted cash.
Pension and Postretirement Costs
In March 2017, the FASB issued ASU 2017-07, “Improving the Presentation of Net Periodic Pension Cost and Net Periodic Postretirement Benefit Cost” (“ASU 2017-07”), which requires the current service-cost component of net benefit costs to be presented similarly with other current compensation costs for related employees on the statement of consolidated operations and stipulates that only the service cost component of net benefit cost is eligible for capitalization. Additionally, the Partnership will present other components of net benefit costs elsewhere on the condensed statements of consolidated operations since these costs are allocated to the Partnership’s financial statements by Andeavor. The amendments to the presentation of the condensed statements of consolidated operations in this update should be applied retrospectively while the change in capitalized benefit cost is to be applied prospectively. We adopted ASU 2017-07 as of January 1, 2018. Adoption of the standard resulted in an increase to interest and financing costs of $2 million and $6 million, respectively, with a corresponding increase to other income of $2 million and $6 million, respectively, for the three and nine months ended September 30, 2017 with no impact to net earnings. ASU 2017-07 does not impact the condensed consolidated balance sheets or condensed statements of consolidated cash flows.
8 | | | ||
Notes to Condensed Consolidated Financial Statements (Unaudited) | ||
Stock Compensation
In June 2018, the FASB issued ASU 2018-07, “Improvements to Nonemployee Share-Based Payment Accounting” (“ASU 2018-07”), which expands the scope of Topic 718 to include share-based payment awards to nonemployees and eliminates the classification differences for employee and nonemployee share-based payment awards. This guidance is effective for interim and annual periods beginning after December 15, 2018. While we are still evaluating the impact of ASU 2018-07, we do not expect the adoption of this standard to have a material impact on our condensed consolidated financial statements.
Note 2 - Acquisitions and Divestitures
Acquisitions
2018 Drop Down
On August 6, 2018, we completed the 2018 Drop Down for total consideration of $1.55 billion comprised of $300 million in cash financed with borrowings under our Dropdown Credit Facility and 28,283,742 newly issued common units of the Partnership with a fair value of $1.25 billion. These assets include gathering, storage and transportation assets in the Permian Basin; legacy Western Refining, Inc. assets and associated crude terminals; the majority of Andeavor’s remaining refining terminalling, transportation and storage assets; and equity method investments in Andeavor Logistics RIO Pipeline LLC (“ALRP”), Minnesota Pipe Line Company, LLC (“MPL”), and PNAC, LLC (“PNAC”). In addition, the Conan Crude Oil Gathering System and the Los Angeles Refinery Interconnect Pipeline (“LARIP”) were transferred at cost plus incurred interest. In conjunction with the 2018 Drop Down, we entered into additional commercial agreements with Andeavor. See Note 3 for further information regarding these agreements.
The 2018 Drop Down includes:
• | Crude oil and other feedstock storage tankage and refined product storage tankage at Andeavor’s Mandan, Salt Lake City and Los Angeles refineries; |
• | Rail terminals and truck racks at Andeavor’s Mandan, Salt Lake City and Los Angeles refineries for the loading and unloading of various refined products from manifest and other railcars and trucks, respectively; |
• | Interconnecting pipeline facilities in the Los Angeles area as well as other railroad tracks and adjoining lands; |
• | Mesquite and Yucca truck unloading stations in New Mexico for the unloading of crude trucks and injection of crude into the TexNewMex pipeline; |
• | Mason East and Jackrabbit (“Wink”) truck unloading and injection stations in Texas that receive crude via the T-Station line and trucks for injection into the Kinder Morgan and Bobcat Pipeline; |
• | The Jal storage, injection and rail unloading facility in New Mexico that stores and supplies natural gas liquids for use in Andeavor’s El Paso refinery; |
• | Natural gas liquid storage tankage, a rail and truck terminal for the loading and unloading of natural gas liquids from railcars and trucks as well as from the waterline at the Wingate facility in New Mexico; |
• | Crude oil and other feedstock storage tankage at the Clearbrook terminal in Minnesota; |
• | Bobcat Pipeline that transports crude oil between the Mason East Station and the Wink Station; |
• | Benny Pipeline that delivers crude oil from the Conan terminal in Texas to a connection with gathering lines in New Mexico; |
• | All of the issued and outstanding limited liability company interests in: (i) Tesoro Great Plains Midstream LLC, which owns BakkenLink Pipeline LLC, (ii) Andeavor MPL Holdings LLC, which holds the investment in MPL, (iii) Andeavor Logistics CD LLC, (iv) Western Refining Conan Gathering, LLC, which owns the Conan Crude Oil Gathering System (v) Western Refining Delaware Basin Storage, LLC, (vi) Asphalt Terminals LLC, which holds the investment in PNAC, and (vii) 67% of all of the issued and outstanding limited liability company interests in ALRP; and |
• | Certain related real property interests. |
SLC Core Pipeline System
On May 1, 2018, we completed our acquisition of the SLC Core Pipeline System (formerly referred to as the Wamsutter Pipeline System) from Plains All American Pipeline, L.P. for total consideration of $180 million. The system consists of pipelines that transport crude oil to another third-party pipeline system that supply the Salt Lake City area refineries, including Andeavor’s Salt Lake City refinery. We financed the acquisition using our Revolving Credit Facility. This acquisition is not material to our condensed consolidated financial statements and its operating results are reported in our Terminalling and Transportation segment.
Western Refining Logistics, LP Merger
Effective October 30, 2017, Andeavor Logistics closed its merger with Western Refining Logistics, LP (“WNRL”) (the “WNRL Merger”), exchanging all outstanding common units of WNRL for units of Andeavor Logistics, representing an equity value of $1.7 billion.
September 30, 2018 | 9 | ||
Notes to Condensed Consolidated Financial Statements (Unaudited) | ||
Andeavor Logistics accounted for the WNRL Merger as a common control transaction and, accordingly, inherited Andeavor’s basis in WNRL’s net assets. Andeavor accounted for the acquisition of WNRL using the acquisition method of accounting, which requires, among other things, that assets acquired at their fair values and liabilities assumed be recognized on the balance sheet as of the acquisition date, or June 1, 2017, the date Andeavor acquired WNRL. The purchase price allocation for the WNRL Merger has been allocated based on fair values of the assets acquired and liabilities assumed at the acquisition date. The allocation of the WNRL purchase price was final as of May 31, 2018. Prior to the purchase price finalization, we recorded adjustments to the allocation to increase property, plant and equipment and reduce goodwill by $7 million during 2018.
Acquisition Date Purchase Price Allocation (in millions)
Cash | $ | 22 | |
Receivables | 112 | ||
Inventories | 11 | ||
Prepayments and Other Current Assets | 25 | ||
Property, Plant and Equipment (a) | 1,357 | ||
Goodwill | 558 | ||
Acquired Intangibles | 130 | ||
Other Noncurrent Assets | 2 | ||
Accounts Payable | (167 | ) | |
Accrued Liabilities | (41 | ) | |
Debt | (347 | ) | |
Total purchase price | $ | 1,662 | |
(a) | Estimated useful lives ranging from 3 to 22 years have been assumed based on the valuation. |
Goodwill
We evaluated several factors that contributed to the amount of goodwill presented above. These factors include the acquisition of a logistics business located in advantageous areas where there is crude oil marketing capabilities and meaningful refining offtake with an assembled workforce that cannot be duplicated at the same costs by a new entrant. Further, the WNRL Merger provides a platform for future growth through operating efficiencies Andeavor Logistics expects to gain from the application of best practices across the combined company and an ability to realize synergies from the geographic diversification of Andeavor Logistics’ business and rationalization of general and administrative costs. We allocated $352 million, $144 million and $62 million of goodwill to the Gathering and Processing, Terminalling and Transportation, and Wholesale segments, respectively.
Property, Plant and Equipment
The fair value of property, plant and equipment is $1.4 billion. This fair value is based on a valuation using a combination of the income, cost and market approaches. The useful lives of acquired assets have been aligned to similar assets at Andeavor Logistics.
Acquired Intangible Assets
The fair value of the acquired identifiable intangible assets is $130 million. This fair value is based on valuation completed for the business enterprise, along with the related tangible assets, using a combination of the income method, cost method and comparable market transactions. We recognized intangible assets associated with customer relationships of $130 million with third parties, all of which will be amortized on a straight-line basis over a weighted average useful life of 15 years. The accumulated amortization of our finite life intangibles acquired from the WNRL Merger was $12 million as of September 30, 2018. Amortization expense related to the acquired intangible assets is expected to be approximately $9 million per year for the next 15 years.
WNRL Revenues and Net Earnings
During the nine months ended September 30, 2018, we recognized $303 million in revenues and $87 million of net earnings related to the business acquired.
Pro Forma Financial Information
The following unaudited pro forma information combines the historical operations of Andeavor Logistics and WNRL, giving effect to the WNRL Merger and related transactions as if they had been consummated on January 1, 2017, the beginning of the earliest period presented.
10 | | | ||
Notes to Condensed Consolidated Financial Statements (Unaudited) | ||
Pro Forma Consolidated Revenues and Consolidated Net Earnings (in millions)
Three Months Ended | Nine Months Ended | ||||||
September 30, 2017 | September 30, 2017 | ||||||
Revenues | $ | 1,094 | $ | 3,172 | |||
Net earnings (a) | 90 | 258 | |||||
(a) | While many recurring adjustments impact the pro forma figures presented, the pro forma condensed statements of consolidated operations for the three and nine months ended September 30, 2017 includes a significant non-recurring adjustment to recognize the WNRL Merger acquisition and integration costs and reflects these costs in the first quarter of 2017, the period the acquisition was assumed to be completed for pro forma purposes. For the nine months ended September 30, 2017, we recognized acquisition costs related to the WNRL Merger of $17 million as well as $3 million of severance costs. |
Post-Acquisition Financial Information
The following tables present our unaudited results of operations disaggregated to present results relating to the Partnership and the Predecessors for the assets acquired from Andeavor and the total amounts included in our combined consolidated financial statements for the three and nine months ended September 30, 2018 and 2017.
Reconciliation of Combined Financial Statements (in millions)
Three Months Ended September 30, 2018 | Nine Months Ended September 30, 2018 | ||||||||||||||||||||||
Combined | Andeavor Logistics LP | Predecessors | Combined | Andeavor Logistics LP | Predecessors | ||||||||||||||||||
Revenues | |||||||||||||||||||||||
Affiliate | $ | 415 | $ | 411 | $ | 4 | $ | 1,131 | $ | 1,110 | $ | 21 | |||||||||||
Third-party | 227 | 224 | 3 | 626 | 617 | 9 | |||||||||||||||||
Total Revenues | 642 | 635 | 7 | 1,757 | 1,727 | 30 | |||||||||||||||||
Costs and Expenses | |||||||||||||||||||||||
NGL expense (exclusive of items shown separately below) | 73 | 73 | — | 166 | 166 | — | |||||||||||||||||
Operating expenses (exclusive of depreciation and amortization) | 236 | 227 | 9 | 658 | 618 | 40 | |||||||||||||||||
Depreciation and amortization expenses | 86 | 83 | 3 | 268 | 246 | 22 | |||||||||||||||||
General and administrative expenses | 31 | 30 | 1 | 91 | 82 | 9 | |||||||||||||||||
Loss on asset disposals and impairments | 1 | 1 | — | 2 | 2 | — | |||||||||||||||||
Operating Income (Loss) | 215 | 221 | (6 | ) | 572 | 613 | (41 | ) | |||||||||||||||
Interest and financing costs, net | (57 | ) | (56 | ) | (1 | ) | (172 | ) | (168 | ) | (4 | ) | |||||||||||
Equity in earnings of equity method investments | 7 | 4 | 3 | 25 | 9 | 16 | |||||||||||||||||
Other income, net | 1 | 1 | — | 4 | 3 | 1 | |||||||||||||||||
Net Earnings (Loss) | $ | 166 | $ | 170 | $ | (4 | ) | $ | 429 | $ | 457 | $ | (28 | ) | |||||||||
Loss attributable to Predecessors | 4 | — | 4 | 28 | — | 28 | |||||||||||||||||
Net Earnings Attributable to Partners | 170 | 170 | — | 457 | 457 | — | |||||||||||||||||
Preferred unitholders’ interest in net earnings | (10 | ) | (10 | ) | — | (34 | ) | (34 | ) | — | |||||||||||||
Limited Partners’ Interest in Net Earnings | $ | 160 | $ | 160 | $ | — | $ | 423 | $ | 423 | $ | — | |||||||||||
September 30, 2018 | 11 | ||
Notes to Condensed Consolidated Financial Statements (Unaudited) | ||
Reconciliation of Combined Financial Statements (in millions)
Three Months Ended September 30, 2017 | Nine Months Ended September 30, 2017 | ||||||||||||||||||||||
Combined | Andeavor Logistics LP | Predecessors | Combined | Andeavor Logistics LP | Predecessors | ||||||||||||||||||
Revenues | |||||||||||||||||||||||
Affiliate | $ | 468 | $ | 219 | $ | 249 | $ | 951 | $ | 624 | $ | 327 | |||||||||||
Third-party | 626 | 225 | 401 | 1,184 | 653 | 531 | |||||||||||||||||
Total Revenues | 1,094 | 444 | 650 | 2,135 | 1,277 | 858 | |||||||||||||||||
Costs and Expenses | |||||||||||||||||||||||
Cost of fuel and other (exclusive of items shown separately below) (a) | 554 | — | 554 | 716 | — | 716 | |||||||||||||||||
NGL expense (exclusive of items shown separately below) | 64 | 64 | — | 179 | 179 | — | |||||||||||||||||
Operating expenses (exclusive of depreciation and amortization) | 199 | 141 | 58 | 512 | 399 | 113 | |||||||||||||||||
Depreciation and amortization expenses | 85 | 60 | 25 | 222 | 178 | 44 | |||||||||||||||||
General and administrative expenses | 44 | 27 | 17 | 107 | 78 | 29 | |||||||||||||||||
(Gain) loss on asset disposals and impairments | 1 | 1 | — | (25 | ) | (24 | ) | (1 | ) | ||||||||||||||
Operating Income (Loss) | 147 | 151 | (4 | ) | 424 | 467 | (43 | ) | |||||||||||||||
Interest and financing costs, net | (68 | ) | (61 | ) | (7 | ) | (193 | ) | (184 | ) | (9 | ) | |||||||||||
Equity in earnings of equity method investments | 6 | 2 | 4 | 13 | 7 | 6 | |||||||||||||||||
Other income, net | 5 | 5 | — | 9 | 9 | — | |||||||||||||||||
Net Earnings (Loss) | $ | 90 | $ | 97 | $ | (7 | ) | $ | 253 | $ | 299 | $ | (46 | ) | |||||||||
Loss attributable to Predecessors | 7 | — | 7 | 46 | — | 46 | |||||||||||||||||
Net Earnings Attributable to Partners | 97 | 97 | — | 299 | 299 | — | |||||||||||||||||
General partner’s interest in net earnings, including incentive distribution rights | — | — | — | (79 | ) | (79 | ) | — | |||||||||||||||
Limited Partners’ Interest in Net Earnings | $ | 97 | $ | 97 | $ | — | $ | 220 | $ | 220 | $ | — | |||||||||||
Divestitures
Alaska Storage and Terminalling Assets
On June 2, 2017, due to Andeavor’s consent decree with the state of Alaska associated with our 2016 acquisition of certain terminalling and storage assets owned by Andeavor, we sold one of our existing Alaska products terminals (“Alaska Terminal”) for $28 million. The sale resulted in a $25 million gain on sale in our condensed statements of consolidated operations for the nine months ended September 30, 2017. The Alaska Terminal divestiture did not have an impact on our operations.
WNRL Lubricant Operations
On June 30, 2017, WNRL sold its remaining lubricant operations located in Arizona and Nevada for $14 million. There was no gain or loss resulting from this sale. Due to provisions in WNRL’s senior secured revolving credit facility agreement and senior notes indenture, the proceeds received from the sale of the lubricant operations were restricted to be used in the business or as a prepayment of debt. This cash was used during the third quarter of 2017 to reinvest in assets used in its business and as a payment of debt.
12 | | | ||
Notes to Condensed Consolidated Financial Statements (Unaudited) | ||
Note 3 - Related-Party Transactions
Affiliate Agreements
The Partnership has various long-term, fee-based commercial agreements with Andeavor, under which we provide terminal distribution, storage services, pipeline transportation, crude oil, natural gas and produced water gathering and processing, wholesale, and trucking services to Andeavor, and Andeavor commits to provide us with minimum monthly throughput volumes of crude oil, refined products and other. If, in any calendar month, Andeavor fails to meet its minimum volume commitments under these agreements, it will be required to pay us a shortfall payment. For the NGLs that we handle under keep-whole agreements, the Partnership transfers the commodity risk exposure associated with these keep-whole agreements to Andeavor pursuant to the Keep-Whole Commodity Fee Agreement, as amended (the “Keep-Whole Commodity Agreement”). Under the Keep-Whole Commodity Agreement, Andeavor pays us a processing fee for NGLs related to the keep-whole agreements and delivers replacement dry gas to the producers on our behalf. We then pay Andeavor a marketing fee in exchange for assuming the commodity risk. The terms and pricing of this agreement are subject to revision each year.
In conjunction with the 2018 Drop Down, the Partnership entered into additional commercial agreements with Andeavor.
Commercial Agreements with Andeavor
Termination Provisions | |||||
Commercial Agreement | Initiation Date | Term | Renewals | Refinery Shutdown Notice Period (a) | Force Majeure |
Transportation Services Agreement (LAR Interconnecting Pipelines) | August 2018 | 10 years | 2 x 5 years | 12 months | Andeavor Logistics can declare (unilateral) |
Master Terminalling Services Agreement | August 2018 | 10 years | 2 x 5 years | ||
Master Unloading and Storage Agreement (WNRL) | August 2018 | 10 years | 2 x 5 years | N/A | |
Asphalt Terminalling, Transportation and Storage Services Agreement | August 2018 | 10 years | 2 x 5 years | ||
(a) | Fixed minimum volumes remain in effect during routine turnarounds. |
In addition, we have agreements for the provision of various general and administrative services by Andeavor. Under our partnership agreement, we are required to reimburse TLGP and its affiliates for all costs and expenses they incur on our behalf for managing and controlling our business and operations. Except to the extent specified under our amended omnibus agreement (the “Amended Omnibus Agreement”) or our amended secondment agreement (the “Amended Secondment Agreement”), TLGP determines the amount of these expenses. The Amended Omnibus Agreement was most recently amended and restated as of September 28, 2018. Under the terms of the Amended Omnibus Agreement in effect as of September 30, 2018, we are required to pay Andeavor an annual corporate services fee of approximately $17 million for the provision of various centralized corporate services, including executive management, legal, accounting, treasury, human resources, health, safety and environmental, information technology, certain insurance coverage, administration and other corporate services. Andeavor charged the Partnership $28 million and $6 million pursuant to the Amended Secondment Agreement for the three months ended September 30, 2018 and 2017, respectively, with $38 million and $16 million for the nine months ended September 30, 2018 and 2017, respectively, reflecting increased services provided in conjunction with the assets acquired in the 2018 Drop Down. Additionally, pursuant to the Amended Omnibus Agreement and Amended Secondment Agreement, we reimburse Andeavor for any direct costs incurred by Andeavor in providing other operational services with respect to certain of our other assets and operations. In conjunction with the 2018 Drop Down, we entered into a construction service agreement with Andeavor to complete the construction of LARIP (the “Construction Service Agreement”). Andeavor charged the Partnership $11 million pursuant to the Construction Service Agreement during the three and nine months ended September 30, 2018.
Summary of Affiliate Transactions
Summary of Revenue and Expense Transactions with Andeavor, Including Predecessors (in millions)
Three Months Ended September 30, | Nine Months Ended September 30, | ||||||||||||||
2018 | 2017 | 2018 | 2017 | ||||||||||||
Revenues (a) | $ | 415 | $ | 468 | $ | 1,131 | $ | 951 | |||||||
Operating expenses (b) | 82 | 67 | 216 | 185 | |||||||||||
General and administrative expenses | 31 | 30 | 77 | 77 | |||||||||||
September 30, 2018 | 13 | ||
Notes to Condensed Consolidated Financial Statements (Unaudited) | ||
(a) | Andeavor accounted for 65% and 43% of our total revenues for the three months ended September 30, 2018 and 2017, respectively, and 64% and 45% for the nine months ended September 30, 2018 and 2017, respectively. |
(b) | Net of reimbursements from Andeavor pursuant to the Amended Omnibus Agreement, the Carson Assets Indemnity Agreement and other affiliate agreements of $2 million and $7 million for the three months ended September 30, 2018 and 2017 respectively, and $12 million for both the nine months ended September 30, 2018 and 2017. |
Distributions
In accordance with our partnership agreement, the unitholders of our limited partner interests are entitled to receive quarterly distributions of available cash. During the nine months ended September 30, 2018, we paid quarterly cash distributions of $347 million to Andeavor. On October 26, 2018, we declared a quarterly cash distribution of $1.03 per unit, which will be paid on November 14, 2018. The distribution will include a payment of $146 million to Marathon. TLGP’s distribution waivers for 2018 and 2019 remain in effect as instituted in 2017 under the terms of our partnership agreement.
Note 4 - Property, Plant and Equipment
Property, Plant & Equipment (in millions)
September 30, 2018 | December 31, 2017 (a) | ||||||
Terminals and tankage | $ | 3,595 | $ | 3,557 | |||
Pipelines | 3,344 | 2,825 | |||||
Land and leasehold improvements | 289 | 282 | |||||
Buildings and improvements | 94 | 91 | |||||
Other | 142 | 142 | |||||
Construction in progress | 501 | 346 | |||||
Property, Plant and Equipment, at Cost | 7,965 | 7,243 | |||||
Accumulated Depreciation | (1,215 | ) | (994 | ) | |||
Property, Plant and Equipment, Net | $ | 6,750 | $ | 6,249 | |||
(a) | Property, plant and equipment transferred to the Partnership in the 2018 Drop Down was recorded at historical costs. The Partnership recorded property, plant and equipment of $948 million and accumulated depreciation of $112 million as of December 31, 2017 in connection with the 2018 Drop Down. |
Note 5 - Goodwill
Goodwill represents the excess of the consideration paid over the fair value of the net assets acquired in a business combination. Goodwill acquired in a business combination is not amortized, but instead tested for impairment at least annually or more frequently should an event occur or circumstances indicate that the carrying amount may be impaired. Goodwill impairment testing is performed at the reporting unit level on November 1 of each year and when circumstances change that might indicate impairment. There were no impairments of goodwill during the three and nine months ended September 30, 2018 and 2017.
Goodwill by Operating Segment (in millions)
September 30, 2018 | December 31, 2017 (a) | ||||||
Terminalling and Transportation (b) | $ | 231 | $ | 260 | |||
Gathering and Processing (b) | 695 | 607 | |||||
Wholesale | 62 | 89 | |||||
Goodwill | $ | 988 | $ | 956 | |||
(a) | Adjusted to include the historical results of the Predecessors. See Note 1 for further discussion. |
(b) | Goodwill transferred to the Partnership in the 2018 Drop Down was recorded at historical cost. We recorded goodwill of $39 million and $225 million in our Terminalling and Transportation and Gathering and Processing segments, respectively, as of December 31, 2017 as a result of the 2018 Drop Down. |
14 | | | ||
Notes to Condensed Consolidated Financial Statements (Unaudited) | ||
Note 6 - Equity Method Investments and Joint Ventures
For each of the following investments, we have the ability to exercise significant influence over each of these investments through our participation in the management committees, which make all significant decisions. However, since we have equal or proportionate influence over each committee as a joint interest partner and all significant decisions require the consent of the other investors without regard to economic interest, we have determined that these entities should not be consolidated and apply the equity method of accounting with respect to our investments in each entity.
• | ALRP - We own a 67% interest in ALRP, a recently constructed crude oil pipeline located in the Delaware and Midland basins in west Texas. |
• | MPL - We have a 17% interest in MPL, which owns and operates a crude oil pipeline in Minnesota. |
• | PNAC - We own a 50% interest in PNAC, which owns and operates an asphalt terminal in Nevada. |
• | RGS - We have a 78% interest in Rendezvous Gas Services, L.L.C. (“RGS”), which owns and operates the infrastructure that transports gas from certain fields to several re-delivery points in southwestern Wyoming, including natural gas processing facilities that are owned by us or a third party. |
• | TRG - We own a 50% interest in Three Rivers Gathering, L.L.C. (“TRG”) located in the southeastern Uinta Basin. TRG was formed with Ute Energy to transport natural gas gathered by Uintah Basin Field Services, L.L.C. (“UBFS”) and other third-party volumes to gas processing facilities. |
• | UBFS - We own a 38% interest in UBFS, which owns and operates the natural gas gathering infrastructure located in the southeastern Uinta Basin. |
Equity Method Investments (in millions)
ALRP (a) | MPL (a) | PNAC (a) | RGS | TRG | UBFS | Total | |||||||||||||||||||||
Balance at December 31, 2017 (b) | $ | — | $ | 120 | $ | — | $ | 268 | $ | 37 | $ | 15 | $ | 440 | |||||||||||||
Acquired interests | 159 | — | 27 | — | — | — | 186 | ||||||||||||||||||||
Equity in earnings | 4 | 14 | — | 4 | 2 | 1 | 25 | ||||||||||||||||||||
Cumulative effect of accounting standard adoption | — | — | — | — | (3 | ) | — | (3 | ) | ||||||||||||||||||
Distributions received | (4 | ) | (14 | ) | — | (16 | ) | (5 | ) | (2 | ) | (41 | ) | ||||||||||||||
Balance at September 30, 2018 (b) | $ | 159 | $ | 120 | $ | 27 | $ | 256 | $ | 31 | $ | 14 | $ | 607 | |||||||||||||
(a) | These equity method investments were included in the 2018 Drop Down. Amounts were adjusted to include the historical results of the Predecessors. See Note 1 for further discussion. |
(b) | The carrying amount of our investments in ALRP, MPL, PNAC, RGS, TRG and UBFS exceeded the underlying equity in net assets by $75 million, $34 million, $17 million, $127 million, $14 million and $6 million, respectively, at September 30, 2018. The carrying amount of our investments in MPL, RGS, TRG and UBFS exceeded the underlying equity in net assets by $35 million, $130 million, $15 million and $6 million, respectively, at December 31, 2017. The carrying amounts of our investments that exceed the underlying equity in net assets are amortized over the useful life of the underlying fixed assets and included in equity in earnings (loss). |
We acquired 67% of all of the issued and outstanding limited liability company interests in ALRP as part of the 2018 Drop Down. ALRP is a variable interest entity. We are not the primary beneficiary of ALRP under the partnership agreement because the Partnership and the other minor shareholder jointly direct the activities of ALRP that most significantly impact its economic performance. In addition, we have a 78% interest in RGS. ALRP and RGS are unconsolidated variable interest entities and we use the equity method of accounting with respect to our investments in each entity.
Note 7 - Debt
Debt Balance, Net of Unamortized Issuance Costs (in millions)
September 30, 2018 | December 31, 2017 | ||||||
Total debt | $ | 4,878 | $ | 4,182 | |||
Unamortized issuance costs | (48 | ) | (54 | ) | |||
Current maturities | (1 | ) | (1 | ) | |||
Debt, Net of Current Maturities and Unamortized Issuance Costs | $ | 4,829 | $ | 4,127 | |||
September 30, 2018 | 15 | ||
Notes to Condensed Consolidated Financial Statements (Unaudited) | ||
Available Capacity Under Credit Facilities (in millions)
Total Capacity | Amount Borrowed as of September 30, 2018 | Outstanding Letters of Credit | Available Capacity as of September 30, 2018 | Weighted Average Interest Rate | Expiration | |||||||||||||||
Revolving Credit Facility (a) | $ | 1,100 | $ | 820 | $ | — | $ | 280 | 3.95 | % | January 29, 2021 | |||||||||
Dropdown Credit Facility | 1,000 | 300 | — | 700 | 3.86 | % | January 29, 2021 | |||||||||||||
Total Credit Facilities (a) | $ | 2,100 | $ | 1,120 | $ | — | $ | 980 | ||||||||||||
(a) | On January 5, 2018, we amended our Revolving Credit Facility to increase the aggregate commitments from $600 million to $1.1 billion and to permit the incurrence of incremental loans. We are allowed to request that the loan availability be increased up to an aggregate of $2.1 billion, subject to receiving increased commitments from the lenders. |
Note 8 - Commitments and Contingencies
In the ordinary course of business, we may become party to lawsuits, disputes, administrative proceedings and governmental investigations, including environmental, regulatory and other matters. The outcome of these matters cannot always be predicted accurately, but we will accrue liabilities for these matters if the amount is probable and can be reasonably estimated. While it is not possible to predict the outcome of such proceedings, if one or more of them were decided against us, we believe there would be no material impact on our condensed consolidated financial statements.
Note 9 - Equity and Net Earnings per Unit
We had 89,299,615 common public units and 600,000 6.875% Series A Fixed-to-Floating Rate Cumulative Redeemable Perpetual Preferred Units (the “Preferred Units”) outstanding as of September 30, 2018. Additionally, Andeavor owned 156,173,128 of our common units, constituting approximately 64% ownership interest in us. Andeavor also held 80,000 Andeavor Logistics TexNew Mex units and all of the outstanding non-economic general partner units as of September 30, 2018.
Changes to Equity (in millions)
Equity of Predecessors (a) | Partnership | Total | |||||||||||||
Common | Preferred | ||||||||||||||
Balance at December 31, 2017 | $ | 1,292 | $ | 2,925 | $ | 589 | $ | 4,806 | |||||||
Sponsor contributions of assets to the Predecessors | 406 | — | — | 406 | |||||||||||
Loss attributable to the Predecessors | (28 | ) | — | — | (28 | ) | |||||||||
Net assets not assumed by Andeavor Logistics | (19 | ) | — | — | (19 | ) | |||||||||
Allocation of net assets acquired by the unitholders | (1,651 | ) | 1,651 | — | — | ||||||||||
Distributions to common and preferred unitholders (b) | — | (620 | ) | (29 | ) | (649 | ) | ||||||||
Distributions to common unitholders related to acquisitions (c) | — | (300 | ) | — | (300 | ) | |||||||||
Net earnings attributable to partners | — | 423 | 34 | 457 | |||||||||||
Cumulative effect of accounting standard adoption | — | (22 | ) | — | (22 | ) | |||||||||
Contributions (d) | — | 34 | — | 34 | |||||||||||
Other | — | 2 | — | 2 | |||||||||||
Balance at September 30, 2018 | $ | — | $ | 4,093 | $ | 594 | $ | 4,687 | |||||||
(a) | Adjusted to include the historical results of the Predecessors. See Notes 1 and 2 for further discussion. |
(b) | Represents cash distributions declared and paid during the nine months ended September 30, 2018. |
(c) | Distributions to common unitholders include $300 million in cash payments for the 2018 Drop Down. As an entity under common control with Andeavor, we record the assets that we acquire from Andeavor in our consolidated balance sheets at Andeavor’s historical book value instead of fair value, and any excess of cash paid over the historical book value of the assets acquired from Andeavor is recorded within equity. As a result of this accounting treatment, this transaction resulted in a net increase of $1.4 billion in our equity balance during the nine months ended September 30, 2018. |
(d) | Includes Andeavor and TLGP contributions to the Partnership primarily related to reimbursements for capital spending pursuant predominantly to the Amended Omnibus Agreement and the Carson Assets Indemnity Agreement. |
16 | | | ||
Notes to Condensed Consolidated Financial Statements (Unaudited) | ||
Cash Distributions
Our partnership agreement, as amended, sets forth the calculation to be used to determine the amount and priority of cash distributions that the limited partner unitholders will receive.
Quarterly Distributions on Common Units
Quarter Ended | Quarterly Distribution Per Common Unit | Total Cash Distribution (in millions) | Date of Distribution | Unitholders Record Date | |||||||
December 31, 2017 (a) | $ | 1.000 | $ | 205 | February 14, 2018 | January 31, 2018 | |||||
March 31, 2018 (a) | 1.015 | 205 | May 15, 2018 | May 1, 2018 | |||||||
June 30, 2018 (a) | 1.030 | 209 | August 14, 2018 | August 3, 2018 | |||||||
September 30, 2018 (a)(b) | 1.030 | 238 | November 14, 2018 | November 5, 2018 | |||||||
(a) | This distribution is net of $15 million waived by TLGP for each of the three months ended September 30, 2018, June 30, 2018 and March 31, 2018, as well as $12.5 million for the three months ended December 31, 2017. TLGP’s distribution waivers for 2018 and 2019 remain in effect as instituted in 2017 under the terms of our partnership agreement. |
(b) | This distribution was declared on October 26, 2018 and will be paid on the date of distribution. |
On August 15, 2018 and February 15, 2018, we paid distributions associated with our Preferred Units of $21 million and $8 million, respectively.
Net Earnings per Unit
Prior to the WNRL Merger, we used the two-class method when calculating the net earnings per unit applicable to limited partners, because we had more than one participating security consisting of limited partner common units, general partner units and incentive distribution rights (“IDRs”). Net earnings earned by the Partnership were allocated between the limited and general partners in accordance with our partnership agreement. At the effective time of the WNRL Merger, the IDRs were canceled (the “IDR Exchange”) and the general partner units were converted into a non-economic general partner interest in Andeavor Logistics (together with the IDR Exchange, the “IDR/GP Transaction”). As a result, the general partner units no longer participate in earnings or distributions, including IDRs. With the issuance of the Preferred Units, earnings are allocated first to the Preferred Units to equal their fixed distribution rate. We base our calculation of net earnings per unit using the weighted-average number of common limited partner units outstanding during the period.
September 30, 2018 | 17 | ||
Notes to Condensed Consolidated Financial Statements (Unaudited) | ||
Net Earnings per Unit (in millions, except per unit amounts)
Three Months Ended September 30, | Nine Months Ended September 30, | ||||||||||||||
2018 | 2017 | 2018 | 2017 | ||||||||||||
Net earnings | $ | 166 | $ | 90 | $ | 429 | $ | 253 | |||||||
Special allocations of net earnings (“Special Allocations”) (a) | — | — | — | 1 | |||||||||||
Net earnings, including Special Allocations | 166 | 90 | 429 | 254 | |||||||||||
Distributions on Preferred Units (b) | (11 | ) | — | (31 | ) | — | |||||||||
Net earnings attributable to common units | 155 | 90 | 398 | 254 | |||||||||||
General partner’s distributions | — | — | — | (6 | ) | ||||||||||
General partner’s IDRs (c) | — | — | — | (75 | ) | ||||||||||
Limited partners’ distributions on common units | (238 | ) | (201 | ) | (652 | ) | (407 | ) | |||||||
Distributions on common units greater than earnings | $ | (83 | ) | $ | (111 | ) | $ | (254 | ) | $ | (234 | ) | |||
General partner’s earnings: | |||||||||||||||
Distributions | $ | — | $ | — | $ | — | $ | 6 | |||||||
General partner’s IDRs (c) | — | — | — | 75 | |||||||||||
Allocation of distributions greater than earnings (d) | (4 | ) | (8 | ) | (28 | ) | (48 | ) | |||||||
Total general partner’s earnings | $ | (4 | ) | $ | (8 | ) | $ | (28 | ) | $ | 33 | ||||
Limited partners’ earnings on common units: | |||||||||||||||
Distributions (e) | $ | 238 | $ | 201 | $ | 652 | $ | 407 | |||||||
Special Allocations (a) | — | — | — | (1 | ) | ||||||||||
Allocation of distributions greater than earnings | (79 | ) | (103 | ) | (226 | ) | (186 | ) | |||||||
Total limited partners’ earnings on common units | $ | 159 | $ | 98 | $ | 426 | $ | 220 | |||||||
Weighted average limited partner units outstanding: | |||||||||||||||
Common units - basic | 234.4 | 108.0 | 223.0 | 107.0 | |||||||||||
Common units - diluted (f) | 234.6 | 108.1 | 223.2 | 107.1 | |||||||||||
Net earnings per limited partner unit: (g) | |||||||||||||||
Common - basic | $ | 0.68 | $ | 0.90 | $ | 1.91 | $ | 2.05 | |||||||
Common - diluted | $ | 0.68 | $ | 0.90 | $ | 1.91 | $ | 2.05 | |||||||
(a) | Normal allocations according to percentage interests are made after giving effect, if any, to priority income allocations in an amount equal to incentive cash distributions fully allocated to the general partner and any special allocations. The adjustment reflects the special allocation to common units held by TLGP for the interest incurred in connection with borrowings on the Revolving Credit Facility in lieu of using all cash on hand to fund the acquisition of crude oil, natural gas and produced water gathering systems and two natural gas processing facilities from Whiting Oil and Gas Corporation, GBK Investments, LLC and WBI Energy Midstream, LLC (the “North Dakota Gathering and Processing Assets”) during the nine months ended September 30, 2017. |
(b) | The Preferred Units entitle unitholders to receive preferred distributions on a semi-annually basis. |
(c) | IDRs entitled the general partner to receive increasing percentages, up to 50%, of quarterly distributions in excess of $0.3881 per unit per quarter. The amount above reflects earnings distributed to our general partner net of $38 million of IDRs waived by TLGP for the nine months ended September 30, 2017, respectively. Our general partner no longer holds IDRs as a result of the IDR/GP Transaction. |
(d) | We have revised the historical allocation of general partner earnings to include the Predecessors’ losses of $4 million and $28 million for the three and nine months ended September 30, 2018, respectively, and losses of $7 million and $46 million for the three and nine months ended September 30, 2017, respectively. |
(e) | Distributions of earnings for limited partners’ common units for the three and nine months ended September 30, 2018 is net of a $15 million and $45 million waiver, respectively, from Andeavor in connection with the WNRL Merger. |
(f) | Diluted net earnings per unit include the effects of potentially dilutive units on our common units, which consist of unvested service and performance phantom units. |
(g) | Amounts may not recalculate due to rounding of dollar and unit information. |
Note 10 - Revenues
We recognize revenue upon transfer of control of promised products or services to customers in an amount that reflects the consideration to which we expect to be entitled in exchange for those products or services. For the three and nine months ended September 30, 2018, revenues from contracts with customers were $528 million and $1.5 billion, respectively, which excludes lease revenues of $114 million and $292 million, respectively. Upon adoption of ASC 606, revenue is recognized net of amounts
18 | | | ||
Notes to Condensed Consolidated Financial Statements (Unaudited) | ||
collected from customers for taxes assessed by governmental authorities on, and concurrent with, specific revenue-producing transactions.
Service Revenue
We generate service revenue for gathering and transporting crude oil, natural gas and water; processing and fractionating natural gas and NGLs; and terminalling, transporting, and storing crude oil and refined products. We perform these services under various contractual arrangements with our customers. Under fee-based arrangements, we receive a fixed rate per volumetric unit for services we provide. For many of these fee-based arrangements, customers are required to make deficiency payments when they do not meet their minimum throughput volume commitments. Some of these contracts allow our customers to claw-back all or a portion of prior deficiency payments against excess volumes in future periods. Under keep-whole arrangements, we gather and process natural gas from producer-customers, retain and sell extracted NGLs, and return to the producer replacement dry gas (“shrink gas”) with an equivalent British thermal unit content of the NGLs retained. For these arrangements, we receive from the producer a combination of fixed rate-per unit of cash consideration as well as non-cash consideration in the form of retained NGLs. Other agreements with producers consist of POP arrangements for which we gather and purchase natural gas from the producers, process purchased natural gas, and sell resulting NGLs and shrink gas at market prices. Reimbursements of certain costs and fees received under these purchase arrangements are recorded as a reduction to NGL expense. See further discussion below on our accounting for product revenues related to the sales of products resulting from our processing activities.
We recognize service revenue over time, as customers simultaneously receive and consume the related benefits of the services that we stand ready to provide. Revenue is recognized using an output measure, such as the throughput volume or capacity utilization, as these measures most accurately depict the satisfaction of our performance obligations. Where contracts contain variable pricing terms, the variability is either resolved within the reporting period, or the variable consideration is allocated to the specific unit of service to which it relates. Deficiency payments under contracts with claw-back provisions are deferred and recognized as revenue as customers reclaim amounts by throughputting excess volumes. To the extent it is probable a customer will not recover all or a portion of the deficiency payment, the estimated residual deficiency is recognized ratably over the claw-back period. Payments for services rendered are generally received no later than 60 days from the month of service, with the exception of deficiency payments described above.
For our keep-whole arrangements, we recognize service revenue for the fair value of non-cash consideration we receive in the form of NGLs. We obtain control of the NGLs we receive from our customers, have discretion in establishing price and have the ability to direct their use. We estimate the fair value of non-cash consideration at the date we obtain control of the respective NGLs, using the monthly average published price of underlying commodity adjusted for geography and commodity specifications.
We experience volume gains and losses, which we sometimes refer to as imbalances, within our pipelines, terminals and storage facilities due to pressure and temperature changes, evaporations and variances in meter reading in other measurement methods. Some of our arrangements require us to bear losses when actual volume losses exceed a contractually specified percentage. Similarly, we receive a benefit when actual volume losses are lower than the contractually specified percentage. For gains and losses which are cash settled, we include the settlement amounts in our service revenues. We recognize non-cash consideration for the stated percentage of commodity we retain and control. We record this non-cash consideration at fair value in service revenue on a gross basis in service revenue and operating expense. The total amount of service revenue and NGL expense recorded associated with these arrangements is not material to our condensed statement of consolidated operations.
Product Revenue
We generate product revenue from the sale of NGLs and related products along with the sale of gasoline and diesel fuel within our wholesale business. We sell NGLs, shrink gas and condensate using natural gas we acquire from producers under our POP arrangements. We record revenues for the sale of these NGLs and related products at market prices, and record the payments to producers for the agreed-upon percentage of the total sales proceeds as NGL expense, net of certain charges, which is reported within costs and expenses in our condensed statement of consolidated operations.
We have certain fuel purchase and sale arrangements with Andeavor under which we receive certain minimum guaranteed margins with upside potential on a certain portion of our branded and unbranded fuel sales. Andeavor retains control of fuel and is the principal in these affiliate arrangements. Therefore, we net the purchase and sale of fuel in our condensed consolidated statements of operations.
NGLs received under keep-whole arrangements are sold to our affiliate. In return, we receive shrink gas which we then remit to the producers. This transaction is treated as a sale, for which we record the fair value of the non-cash consideration at the date we obtain control of the shrink gas. We utilize a monthly average of the published price of the commodity, adjusted for geography.
Our product sales arrangements are for specified goods for which enforceable rights and obligations are created when sales volumes are determined, which typically occurs as orders are issued or spot sales are made, but may be determined at contract inception. Each barrel, gallon or other unit of measure of product, is separately identifiable and represents a distinct performance
September 30, 2018 | 19 | ||
Notes to Condensed Consolidated Financial Statements (Unaudited) | ||
obligation to which the transaction price is allocated based on stand-alone selling price. We use observable market prices for the products we sell to determine the stand-alone selling price of each separate performance obligation. Product revenues are recognized at a point-in-time, which generally occurs upon delivery and transfer of title to the customer. Payments for product sales are generally received within 30 days from when control has transferred.
Other Arrangements
Based on the terms of certain storage and other agreements in which the counterparty is primarily Andeavor, we are considered to be the lessor under these implicit operating lease arrangements. Income from these leases is excluded from the scope of the new revenue standard.
Customer Contract Assets
Our receivables are generated primarily from contracts with customers. Our payment terms vary by product or service type. The period between invoicing and payment is not significant, and our assets associated with contracts with customers consist primarily of billed accounts receivable, which are included in receivables, net of allowance for doubtful accounts in our condensed consolidated balance sheets. Our contract assets include amounts recognized for deficiency payments associated with minimum volume commitments which have not been billed to customers. These contract assets are included in prepayments and other current assets in our condensed consolidated balance sheets.
Customer Contract Liabilities
For certain products or services, we receive payment in advance of when performance obligations are satisfied. These liabilities from contracts with customers consist primarily of certain deficiency payments for minimum volume commitments and customer reimbursements of costs for capital projects. Customer advances for capital projects are generally recognized over the contract term. We do not have a material impact for financing components associated with these customer advances. Payments for minimum volume commitments and other customer advances are included in deferred income within other current liabilities and other noncurrent liabilities based on timing of expected recognition, which may extend up to 15 years. During the three and nine months ended September 30, 2018, we recognized $4 million and $24 million in revenue from contract liabilities existing as of January 1, 2018, after cumulative adjustments for the adoption of ASC 606.
Summary of Customer Contract Assets and Liabilities (in millions)
December 31, 2017 (a) | Adjustments for ASC 606 (b) | Balance at January 1, 2018 | September 30, 2018 | ||||||||||||
Receivables from contracts with customers | $ | 443 | $ | (34 | ) | $ | 409 | $ | 437 | ||||||
Other contract assets | — | 34 | 34 | 31 | |||||||||||
Deferred income, current | 23 | — | 23 | 22 | |||||||||||
Deferred income, noncurrent | 43 | 19 | 62 | 64 | |||||||||||
(a) | Adjusted to include the historical results of the Predecessors. See Notes 1 and 2 for further discussion. |
(b) | These amounts exclude balances associated with equity method investments. We recognized a cumulative adjustment of $3 million as a decrease to Equity Method Investments in our condensed consolidated balance sheets as of January 1, 2018 for the impacts related to our equity method investment in Three Rivers Gathering, LLC. There were no material impacts to this balance during the nine months ended September 30, 2018 due to the adoption. |
Remaining Performance Obligations
We do not disclose the value of unsatisfied performance obligations for contracts with original expected terms of one year or less or the value of variable consideration related to unsatisfied performance obligations, when such values are not required to be estimated for purposes of allocation and recognition. Revenues associated with remaining obligations under contracts with terms in excess of one year related primarily to arrangements for which the customer has agreed to fixed consideration based on minimum throughput volume commitments or capacity utilization. As of September 30, 2018, we had $4.1 billion of expected revenues from remaining performance obligations.
The future revenues from our service arrangements with fixed fees or minimum throughput volume commitments will be recognized over the period of performance to which the fixed fee or commitment relates, which ranges from 1 year to 15 years. We expect approximately 80% of our total remaining obligations to be recognized within 5 years.
Disaggregation
We disaggregate our revenues by product and services, and further by product line. For additional information regarding our operating segments, see Note 11.
20 | | | ||
Notes to Condensed Consolidated Financial Statements (Unaudited) | ||
Revenue Disaggregation by Type and Product Line (in millions)
Three Months Ended September 30, 2018 | Nine Months Ended September 30, 2018 | ||||||||||||||||||||||
Terminalling and Transportation | Gathering and Processing | Wholesale | Terminalling and Transportation | Gathering and Processing | Wholesale | ||||||||||||||||||
Service Revenues (a) | |||||||||||||||||||||||
Refined products | $ | 240 | $ | — | $ | 4 | $ | 650 | $ | — | $ | 13 | |||||||||||
Crude oil and water | 39 | 108 | — | 108 | 313 | — | |||||||||||||||||
Natural gas | — | 100 | — | — | 296 | — | |||||||||||||||||
Other | 1 | — | — | 4 | — | — | |||||||||||||||||
Total Service Revenues | 280 | 208 | 4 | 762 | 609 | 13 | |||||||||||||||||
Product Revenues | |||||||||||||||||||||||
NGL products | — | 137 | — | — | 336 | — | |||||||||||||||||
Refined products | — | — | 13 | — | — | 37 | |||||||||||||||||
Total Product Revenues | — | 137 | 13 | — | 336 | 37 | |||||||||||||||||
Total Revenues | $ | 280 | $ | 345 | $ | 17 | $ | 762 | $ | 945 | $ | 50 | |||||||||||
(a) | Includes $114 million and $292 million of lease revenues for the three and nine months ended September 30, 2018, respectively. |
Note 11 - Operating Segments
Our revenues are derived from three operating segments: Terminalling and Transportation, Gathering and Processing and Wholesale. We evaluate the performance of our segments based primarily on segment operating income and net earnings before interest, income taxes, depreciation and amortization expenses (“EBITDA”). For the purposes of our operating segment disclosure, we present operating income as it is the most comparable measure to the amounts presented in our condensed statements of consolidated operations. Segment operating income includes those revenues and expenses that are directly attributable to management of the respective segment. Certain general and administrative expenses and interest and financing costs are excluded from segment operating income as they are not directly attributable to a specific operating segment.
Our Terminalling and Transportation segment consists of pipeline systems, including regulated common carrier refined products pipeline systems and other pipelines, which transport products and crude oil primarily from Andeavor’s refineries to nearby facilities, as well as crude oil and refined products terminals and storage facilities, marine terminals, asphalt terminals, rail-car unloading facilities, an asphalt trucking operation and a petroleum coke handling and storage facility.
Our Gathering and Processing segment consists of crude oil, natural gas, NGLs and produced water gathering systems in the Bakken Shale/Williston Basin area of North Dakota and Montana, the Green River Basin, Uinta Basin, and Vermillion Basin in the states of Utah, Colorado and Wyoming, the Delaware Basin in the Permian Basin area of West Texas and Southern New Mexico, and in the San Juan Basin in the Four Corners area of Northwestern New Mexico. It also consists of gas processing and fractionation complexes in the Bakken Shale, Green River Basin, Uinta Basin and Vermillion Basin.
Our Wholesale segment includes the operations of several bulk petroleum distribution plants and a fleet of refined product delivery trucks that distribute commercial wholesale petroleum products primarily in Arizona, Colorado, Nevada, New Mexico and Texas. The refined product trucking business delivers a significant portion of the volumes sold by our Wholesale segment.
September 30, 2018 | 21 | ||
Notes to Condensed Consolidated Financial Statements (Unaudited) | ||
Segment Information (in millions)
Three Months Ended September 30, | Nine Months Ended September 30, | ||||||||||||||
2018 (a) | 2017 (a) | 2018 (a) | 2017 (a) | ||||||||||||
Revenues | |||||||||||||||
Terminalling and Transportation: | |||||||||||||||
Terminalling | $ | 235 | $ | 189 | $ | 643 | $ | 493 | |||||||
Pipeline transportation | 44 | 34 | 115 | 97 | |||||||||||
Other revenues | 1 | 7 | 4 | 9 | |||||||||||
Total Terminalling and Transportation | 280 | 230 | 762 | 599 | |||||||||||
Gathering and Processing: | |||||||||||||||
NGL sales | 137 | 90 | 336 | 254 | |||||||||||
Gas gathering and processing | 82 | 85 | 249 | 252 | |||||||||||
Crude oil and water gathering | 86 | 76 | 241 | 170 | |||||||||||
Pass-thru and other | 40 | 44 | 119 | 120 | |||||||||||
Total Gathering and Processing | 345 | 295 | 945 | 796 | |||||||||||
Wholesale: | |||||||||||||||
Fuel sales (b) | 13 | 565 | 37 | 730 | |||||||||||
Other wholesale | 7 | 4 | 25 | 10 | |||||||||||
Total Wholesale | 20 | 569 | 62 | 740 | |||||||||||
Intersegment wholesale revenues | (3 | ) | — | (12 | ) | — | |||||||||
Total Revenues | $ | 642 | $ | 1,094 | $ | 1,757 | $ | 2,135 | |||||||
Segment Operating Income | |||||||||||||||
Terminalling and Transportation | $ | 140 | $ | 103 | $ | 351 | $ | 290 | |||||||
Gathering and Processing | 80 | 50 | 226 | 158 | |||||||||||
Wholesale | 7 | 7 | 22 | 9 | |||||||||||
Total Segment Operating Income | 227 | 160 | 599 | 457 | |||||||||||
Unallocated general and administrative expenses | (12 | ) | (13 | ) | (27 | ) | (33 | ) | |||||||
Operating Income | 215 | 147 | 572 | 424 | |||||||||||
Interest and financing costs, net | (57 | ) | (68 | ) | (172 | ) | (193 | ) | |||||||
Equity in earnings of equity method investments | 7 | 6 | 25 | 13 | |||||||||||
Other income, net | 1 | 5 | 4 | 9 | |||||||||||
Net Earnings | $ | 166 | $ | 90 | $ | 429 | $ | 253 | |||||||
Depreciation and Amortization Expenses | |||||||||||||||
Terminalling and Transportation | $ | 35 | $ | 32 | $ | 105 | $ | 85 | |||||||
Gathering and Processing | 47 | 51 | 154 | 134 | |||||||||||
Wholesale | 4 | 2 | 9 | 3 | |||||||||||
Total Depreciation and Amortization Expenses | $ | 86 | $ | 85 | $ | 268 | $ | 222 | |||||||
Capital Expenditures | |||||||||||||||
Terminalling and Transportation | $ | 76 | $ | 51 | $ | 155 | $ | 127 | |||||||
Gathering and Processing | 110 | 41 | 368 | 85 | |||||||||||
Wholesale | — | — | 1 | — | |||||||||||
Total Capital Expenditures | $ | 186 | $ | 92 | $ | 524 | $ | 212 | |||||||
(a) | Adjusted to include the historical results of the Predecessors. See Notes 1 and 2 for further discussion. |
(b) | The presentation of wholesale fuel sales was impacted by adoption of ASC 606 on January 1, 2018. Beginning January 1, 2018 in connection with the adoption, the revenues and costs associated with our fuel purchase and supply arrangements with Andeavor were netted. |
22 | | | ||
Notes to Condensed Consolidated Financial Statements (Unaudited) | ||
Total Identifiable Assets by Segment (in millions)
September 30, 2018 | December 31, 2017 (a) | ||||||
Terminalling and Transportation | $ | 3,408 | $ | 3,045 | |||
Gathering and Processing | 6,378 | 6,006 | |||||
Wholesale | 354 | 342 | |||||
Other | 57 | 112 | |||||
Total Identifiable Assets | $ | 10,197 | $ | 9,505 | |||
(a) | Adjusted to include the historical results of the Predecessors. See Notes 1 and 2 for further discussion. |
September 30, 2018 | 23 | ||
Management’s Discussion and Analysis | ||
Item 2. Management’s Discussion and Analysis of Financial Condition and Results of Operations
Unless the context otherwise requires, references in this report to “Andeavor Logistics LP,” “Andeavor Logistics,” “the Partnership,” “we,” “us” or “our” refer to Andeavor Logistics LP, one or more of its consolidated subsidiaries or all of them taken as a whole. Unless the context otherwise requires, references in this report to Andeavor refer collectively to Andeavor for all activity through September 30, 2018 or Andeavor LLC, the surviving entity in the MPC Merger effective October 1, 2018 and a wholly owned subsidiary of MPC, and any of Andeavor’s or Andeavor LLC’s subsidiaries, as applicable, other than Andeavor Logistics, its subsidiaries and its general partner. Unless the context otherwise requires, references in this report to “Predecessors” refer collectively to the acquired businesses from Andeavor, and its assets, liabilities and results of operations.
Those statements in this section that are not historical in nature should be deemed forward-looking statements that are inherently uncertain. See “Important Information Regarding Forward-Looking Statements” section for a discussion of the factors that could cause actual results to differ materially from those projected in these statements.
This section should be read in conjunction with our Annual Report on Form 10-K for the year ended December 31, 2017.
Business Strategy and Overview
Overview
We are a fee-based, growth oriented Delaware limited partnership formed by Andeavor. We are a leading full-service logistics company operating primarily in the western and inland regions of the United States. We own and operate networks of crude oil, refined products and natural gas pipelines, terminals with crude oil and refined product storage capacity, rail loading and offloading facilities, marine terminals, bulk petroleum distribution facilities, a trucking fleet and natural gas processing and fractionation complexes.
Our assets are categorized into a Terminalling and Transportation segment, a Gathering and Processing segment, and a Wholesale segment. Approximately 65% and 64% of our total revenues for the three and nine months ended September 30, 2018, respectively, were derived from Andeavor under various long-term, fee-based commercial agreements, the majority of which include minimum volume commitments.
On October 1, 2018, MPC completed its acquisition of Andeavor, under which MPC acquired all of Andeavor’s outstanding shares. Following the MPC Merger, MPC became the beneficial owner of approximately 156 million common units out of approximately 245 million common units outstanding in the Partnership as of October 1, 2018, representing an approximate 64% limited partner interest. MPC is also the beneficial owner of 100% of the equity interests of TLGP.
Effective October 30, 2017, we completed the WNRL Merger exchanging all outstanding common units of WNRL for units of Andeavor Logistics. WNRL’s assets include terminals, storage tanks, pipelines and other logistics assets related to the terminalling, transportation, storage and distribution of crude oil, refined products and asphalt. WNRL’s assets and operations include 705 miles of pipelines, approximately 12.4 million barrels of active storage capacity, distribution of wholesale petroleum products and crude oil and asphalt trucking. This acquisition, along with the associated infrastructure and Andeavor’s refining and commercial capabilities, positions us to pursue organic growth opportunities across our combined geographic footprint including the Midland and Delaware Basins of West Texas. Refer to Items Impacting Comparability in this section for more information.
We generate revenues by charging fees for terminalling, transporting and storing crude oil, refined products and asphalt, gathering crude oil and produced water, gathering and processing natural gas and selling fuel through wholesale commercial contracts. We do not engage in the trading of crude oil, natural gas, NGLs or refined products; therefore, we have minimal direct exposure to risks associated with commodity price fluctuations as part of our normal operations. However, we have certain natural gas gathering and processing contracts structured as POP arrangements. Under these POP arrangements, we gather and process the producers’ natural gas, market the natural gas and return the majority of the proceeds to the producer. Under these arrangements, we have exposure to fluctuations in commodity prices; however, this exposure is not expected to be material to our results of operations. Also, as part of the WNRL Merger, we acquired a wholesale fuel business that has exposure to commodity prices while the refined product is being transported but are mitigated by fixed margin contracts.
24 | | | ||
Management’s Discussion and Analysis | ||
Business Strategy and Goals
Our primary business objectives are to maintain and grow stable cash flows. We intend to accomplish these objectives by executing the following strategies:
Growing a stable, fee-based business that provides a competitive, full-service logistics offering to customers | |||
Optimizing Existing Asset Base | ● Operating an incident free workplace ● Improving operational efficiency and maximizing asset utilization ● Expanding third-party business; delivering extraordinary customer service | ||
Pursuing Organic Expansion Opportunities | ● Identifying and executing low-risk, high-return growth projects ● Investing to capture the full commercial value of logistics assets ● Growing asset capability to support Marathon’s refining and marketing business | ||
Growing through Third-Party Acquisitions | ● Pursuing assets and businesses in strategic U.S. geographies that support an integrated business model, delivering synergies and growth ● Focusing on high quality assets that provide stable, fee-based income and enhancing organizational capacity | ||
Growing through Strategic Expansion | ● Strategically partnering with Marathon on organic opportunities and acquisitions | ||
Relative to these goals, in 2018, we intend to continue implementing this strategy and have completed or announced plans to expand our Terminalling and Transportation business across the western and inland U.S. through:
• | increasing our terminalling volumes by expanding capacity and growing our third-party services at certain terminals; |
• | optimizing volumes and growing third-party throughput at our Terminalling and Transportation assets; and |
• | pursuing strategic assets in the western and inland U.S. |
In addition, we have completed or announced plans to grow our assets in our Gathering and Processing segment in support of third-party demand for crude oil, natural gas and water gathering services, natural gas processing services, as well as serving Marathon’s demand for Bakken crude oil in the inland and west coast refining systems and providing crude oil supply to support Marathon’s southwest refining system through our Permian Basin logistics assets, including:
• | further expanding capacity and capabilities as well as adding new origin and destination points for our common carrier pipelines in North Dakota and Montana; |
• | expanding our crude oil, natural gas and water gathering and associated gas processing footprint in the Bakken region to enhance and improve overall basin logistics efficiencies; |
• | expanding our crude oil gathering footprint in the Permian Basin; and |
• | pursuing strategic assets across the western and inland U.S. |
Acquisitions
2018 Drop Down
On August 6, 2018, we completed the 2018 Drop Down for total consideration of $1.55 billion. These assets include gathering, storage and transportation assets in the Permian Basin; legacy Western Refining, Inc. assets and associated crude terminals; the majority of Andeavor’s remaining refining terminalling, transportation and storage assets; and equity method investments in ALRP, MPL and PNAC. In addition, the Conan Crude Oil Gathering System and LARIP were transferred at cost plus incurred interest. The transaction was funded by issuing common units to Andeavor and the remainder with borrowings under our Dropdown Credit Facility.
September 30, 2018 | 25 | ||
Management’s Discussion and Analysis | ||
SLC Core Pipeline System
On May 1, 2018, we completed our acquisition of the SLC Core Pipeline System (formerly referred to as the Wamsutter Pipeline System) from Plains All American Pipeline, L.P. for total consideration of $180 million. The system consists of pipelines that transport crude oil to another third party pipeline system that supply the Salt Lake City area refineries, including Andeavor’s Salt Lake City refinery. We financed the acquisition using our Revolving Credit Facility. This acquisition is not material to our condensed consolidated financial statements and its operating results are reported in our Terminalling and Transportation segment.
Current Market Conditions
During the third quarter of 2018, the spot prices of the benchmarked commodities that we handle remained high, including crude oil, NGLs and refined products. Natural gas prices remained flat during the period. Crude oil prices maintained multi-year premiums as global producers discussed raising production levels to offset falling production from Venezuela as well as the potential of sanctions by the U.S. on Iranian exports. The U.S. benchmark crude West Texas Intermediate increased over $2 per barrel during the quarter, while U.S. production of both oil and gas again reached record levels during the third quarter. Crude inventories in the U.S. climbed up to the five-year average in the third quarter as higher refinery production offset lower U.S. crude exports. Domestic refined product demand for the third quarter remained higher year-over-year, while continued higher exports of refined products are providing incentive for U.S. refiners to maximize production of gasoline and diesel. These factors create a positive outlook for U.S. oil, gas, natural gas and refined product throughput volumes, however, regional impacts may differ.
Seasonal trends and continued healthy domestic economic conditions during the third quarter continued to support refined product demand from our downstream and marketing customers. We continue to monitor the impact of commodity prices and fundamentals as it relates to our business. Given the outlined market conditions, we believe our diversified portfolio of businesses as well as our strong customer base are sufficient to continue to meet our goals and objectives outlined above.
Results of Operations
A discussion and analysis of the factors contributing to our results of operations presented below includes the financial results of our Predecessors and the consolidated financial results of Andeavor Logistics. The financial statements of our Predecessors were prepared from the separate records maintained by Andeavor and may not necessarily be indicative of the conditions that would have existed or the results of operations if our Predecessors had been operated as an unaffiliated entity. The financial statements, together with the following information, are intended to provide investors with a reasonable basis for assessing our historical operations, but should not serve as the only criteria for predicting future performance.
Operating Metrics
Management utilizes the following operating metrics to evaluate performance and compare profitability to other companies in the industry (amounts may not recalculate due to rounding of dollar and volume information):
• | Average terminalling revenue per barrel - calculated as total terminalling revenue divided by terminalling throughput presented in thousands of barrels per day (“Mbpd”) multiplied by 1,000 and multiplied by the number of days in the period, (92 days for both the three months ended September 30, 2018 (the “2018 Quarter”) and 2017 (the “2017 Quarter”) and 273 days for both the nine months ended September 30, 2018 (the “2018 Period”) and 2017 (the “2017 Period”); |
• | Average pipeline transportation revenue per barrel - calculated as total pipeline transportation revenue divided by pipeline transportation throughput presented in Mbpd multiplied by 1,000 and multiplied by the number of days in the period as outlined above; |
• | Average margin on NGL sales per barrel - calculated as the difference between the NGL sales revenues and the amounts recognized as NGL expense divided by our NGL sales volumes in barrels presented in Mbpd multiplied by 1,000 and multiplied by the number of days in the period as outlined above; |
• | Average gas gathering and processing revenue per Million British thermal units (“MMBtu”) - calculated as total gathering and processing fee-based revenue divided by gas gathering throughput presented in thousands of MMBtu per day (“MMBtu/d”) multiplied by 1,000 and multiplied by the number of days in the period as outlined above; |
• | Average crude oil and water gathering revenue per barrel - calculated as total crude oil and water gathering fee-based revenue divided by crude oil and water gathering throughput presented in Mbpd multiplied by 1,000 and multiplied by the number of days in the period as outlined above; |
• | Wholesale fuel sales per gallon - calculated as wholesale fuel revenues divided by our total wholesale fuel sales volume in gallons; and |
• | Average wholesale fuel sales margin per gallon - calculated as the difference between total wholesale fuel revenues and wholesale cost of fuel and other divided by our total wholesale fuel sales volume in gallons. |
26 | | | ||
Management’s Discussion and Analysis | ||
There are a variety of ways to calculate average revenue per barrel, average margin per barrel, average revenue per MMBtu, sales per gallon and average margin per gallon; other companies may calculate these in different ways.
Non-GAAP Measures
As a supplement to our financial information presented in accordance with U.S. GAAP, our management uses certain “non-GAAP” measures to analyze our results of operations, assess internal performance against budgeted and forecasted amounts and evaluate future impacts to our financial performance as a result of capital investments, acquisitions, divestitures and other strategic projects. These measures are important factors in assessing our operating results and profitability and include:
• | Financial non-GAAP measure of EBITDA - calculated as U.S. GAAP-based net earnings before interest, income taxes and depreciation and amortization expense; |
• | Financial non-GAAP measure of Segment EBITDA - calculated as a segment’s U.S. GAAP-based operating income before depreciation and amortization expense plus equity in earnings (loss) of equity method investments and other income (expense), net; |
• | Liquidity non-GAAP measure of distributable cash flow - calculated as U.S. GAAP-based net cash flow from operating activities adjusted for changes in working capital, amounts spent on maintenance capital net of reimbursements and other adjustments not expected to settle in cash; |
• | Liquidity non-GAAP measure of distributable cash flow attributable to common unitholders - calculated as distributable cash flow minus distributions associated with the Preferred Units; |
• | Operating performance measure of average margin on NGL sales per barrel - calculated as the difference between the NGL sales revenues and the amounts recognized as NGL expense divided by our NGL sales volumes in barrels presented in Mbpd multiplied by 1,000 and multiplied by the number of days in the period as previously outlined; and |
• | Operating performance measure of average wholesale fuel sales margin per gallon - calculated as the difference between total wholesale fuel revenues and wholesale’s cost of fuel divided by our total wholesale fuel sales volumes in gallons. |
We present these measures because we believe they may help investors, analysts, lenders and ratings agencies analyze our results of operations and liquidity in conjunction with our U.S. GAAP results, including but not limited to:
• | our operating performance as compared to other publicly traded partnerships in the midstream energy industry, without regard to historical cost basis or financing methods; |
• | the ability of our assets to generate sufficient cash flow to make distributions to our unitholders; |
• | our ability to incur and service debt and fund capital expenditures; and |
• | the viability of acquisitions and other capital expenditure projects and the returns on investment of various investment opportunities. |
Management also uses these measures to assess internal performance, and we believe they may provide meaningful supplemental information to the users of our financial statements. Non-GAAP measures have important limitations as analytical tools, because they exclude some, but not all, items that affect net earnings, operating income and net cash from operating activities. These measures should not be considered substitutes for their most directly comparable U.S. GAAP financial measures.
For further information regarding these non-GAAP measures, including the reconciliation of these non-GAAP measures to their most directly comparable U.S. GAAP financial measures, see the “Non-GAAP Reconciliations” section.
Items Impacting Comparability
Our financial results may not be comparable for the reasons described below. Other than WNRL and certain assets acquired from the 2018 Drop Down, our Predecessors did not record revenues with Andeavor and our Predecessors recorded general and administrative expenses and financed operations differently than the Partnership. See “Items Impacting Comparability” in our Annual Report on Form 10-K for the year ended December 31, 2017 for further discussion.
As previously mentioned, on August 6, 2018, we completed the 2018 Drop Down for total consideration of $1.55 billion. As an entity under common control with Andeavor, we accounted for the transfers of businesses as if the transfer occurred at the beginning of the period, and prior periods are retrospectively adjusted to furnish comparative information. Accordingly, the accompanying results of operations have been retrospectively adjusted to include the historical results of the assets acquired prior to the effective date of the acquisition.
On January 1, 2018, we adopted ASC 606 utilizing the modified retrospective method. The current period results and balances are presented in accordance with ASC 606 while comparative periods continue to be presented in accordance with the accounting standards in effect for those periods. Refer to Note 1 and Note 10 within Item 1 for further details regarding ASC 606 and the financial impact due to adoption of the standard.
September 30, 2018 | 27 | ||
Management’s Discussion and Analysis | ||
On June 1, 2017, pursuant to the Agreement and Plan of Merger, dated as of November 16, 2016, by and among Western Refining, Inc. (“Western Refining”), Andeavor, Andeavor’s wholly-owned subsidiaries Tahoe Merger Sub 1, Inc. and Tahoe Merger Sub 2, LLC, Tahoe Merger Sub 1 was merged with and into Western Refining, with Western Refining surviving such merger as a wholly-owned subsidiary of Andeavor (the “WNR Merger”). As a result of the WNR Merger, Andeavor obtained Western Refining’s controlling interest in WNRL. Thus, the WNRL Merger was treated as a transaction of entities under common control and these condensed consolidated financial statements reflect the operations, financial position and cash flows associated with WNRL and their related subsidiaries as of June 1, 2017.
As a result of the WNRL Merger, we have presented the wholesale fuel distribution business as a separate segment and included the asphalt trucking and crude trucking operations in the Terminalling and Transportation segment and Gathering and Processing segment, respectively.
2018 3rd Quarter Versus 2017 3rd Quarter
Highlights (in millions)
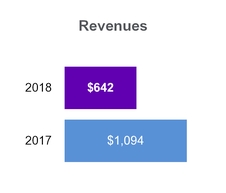
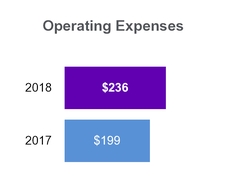
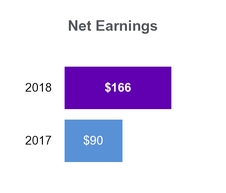
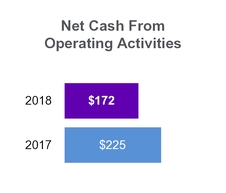
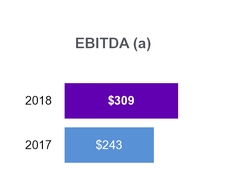
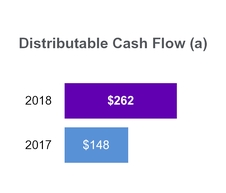
(a) | See “Non-GAAP Reconciliations” section for further information regarding these non-GAAP measures. |
28 | | | ||
Management’s Discussion and Analysis | ||
Percentage of Segment Operating Income by Operating Segment
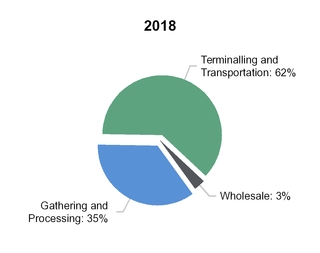
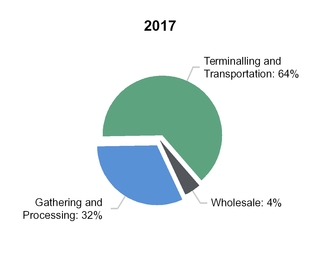
Net Earnings Attributable to Partners Reconciliation (in millions)
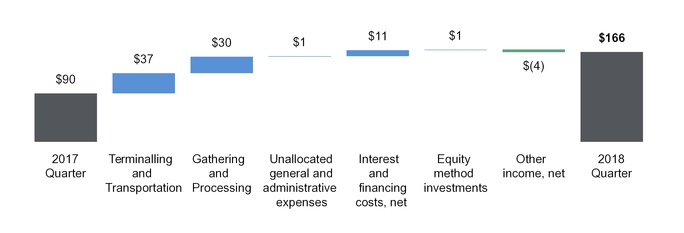
Overview
Our net earnings for the 2018 Quarter increased $76 million to $166 million from $90 million for the 2017 Quarter and EBITDA increased $66 million primarily driven by the 2018 Drop Down, the SLC Core Pipeline System acquisition and our acquisition of the Anacortes Logistics Assets. Partially offsetting those contributions were increases in operating costs and depreciation and amortization expenses related to the 2018 acquisitions.
Segment Results
Operating income increased $68 million to $215 million during the 2018 Quarter compared to $147 million for the 2017 Quarter driven by the 2018 Drop Down, the SLC Core Pipeline System acquisition and our acquisition of the Anacortes Logistics Assets. Refer to our detailed discussion of each segment’s operating and financial results contained in this section.
Revenues
The $452 million decrease in revenue, or 41%, to $642 million was driven primarily by impacts of the adoption of ASC 606 on January 1, 2018. The revenues and costs associated with our fuel purchase and supply arrangements within our Wholesale segment with Andeavor were netted for the 2018 Quarter, as further described in Note 10. This decrease was partially offset by the contributions from the 2018 Drop Down, the SLC Core Pipeline System acquisition and the acquisition of the Anacortes Logistics Assets.
Cost of Fuel and Other
Due to the adoption of ASC 606 on January 1, 2018, the revenues and costs associated with our fuel purchase and supply arrangements within our Wholesale segment with Andeavor were netted for the 2018 Quarter, as noted above and further described in Note 10.
September 30, 2018 | 29 | ||
Management’s Discussion and Analysis | ||
NGL Expense
NGL expense increased $9 million for the 2018 Quarter compared to the 2017 Quarter primarily due to the impact from the adoption of ASC 606 on January 1, 2018. Refer to Note 10 for further information regarding the adoption of ASC 606.
Operating Expenses
Operating expenses increased $37 million for the 2018 Quarter compared to the 2017 Quarter primarily due to the 2018 Drop Down as well as the recognition of non-cash expenses recognized in connection with the adoption of ASC 606.
Interest and Financing Costs, Net
Net interest and financing costs decreased $11 million in the 2018 Quarter compared to the 2017 Quarter primarily due to lower interest rates from the refinancing of debt with new senior notes during the fourth quarter of 2017 reflecting our improved investment grade rating.
2018 Year to Date Period Versus 2017 Year to Date Period
Highlights (in millions)
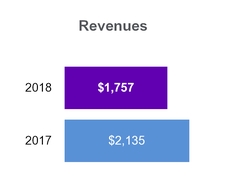
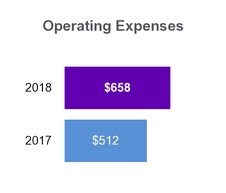
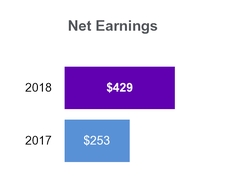
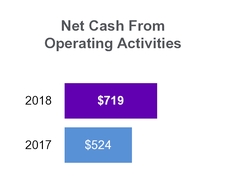

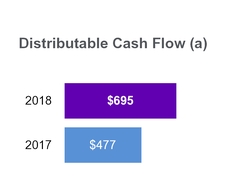
(a) | See “Non-GAAP Reconciliations” section for further information regarding these non-GAAP measures. |
30 | | | ||
Management’s Discussion and Analysis | ||
Percentage of Segment Operating Income by Operating Segment
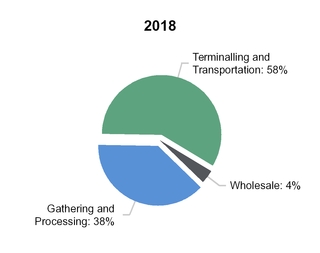
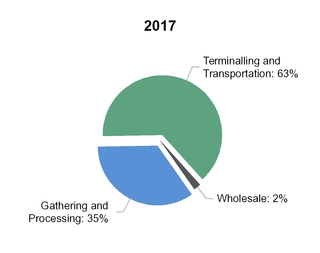
Net Earnings Attributable to Partners Reconciliation (in millions)
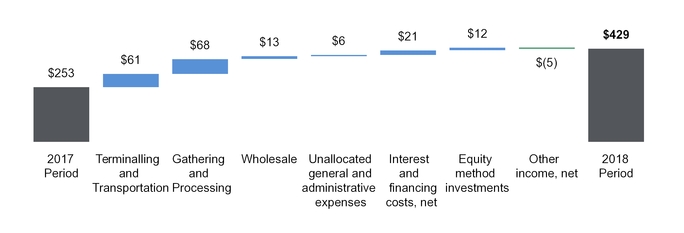
Overview
Our net earnings for the 2018 Period increased $176 million to $429 million from $253 million for the 2017 Period and EBITDA increased $201 million primarily driven by the WNRL Merger, the 2018 Drop Down, the SLC Core Pipeline System acquisition and our acquisition of the Anacortes Logistics Assets. Partially offsetting those contributions were increases in operating costs and depreciation and amortization expenses related to the WNRL Merger and 2018 acquisitions.
Segment Results
Operating income increased $148 million to $572 million during the 2018 Period compared to $424 million for the 2017 Period driven by contributions from the WNRL Merger during the entire 2018 Period across all of our segments, the 2018 Drop Down, the SLC Core Pipeline System acquisition and our acquisition of the Anacortes Logistics Assets. Refer to our detailed discussion of each segment’s operating and financial results contained in this section.
Revenues
The $378 million decrease in revenue, or 18%, to $1.8 billion was due to the adoption of ASC 606 on January 1, 2018, partially offset by the WNRL Merger, the 2018 Drop Down, the SLC Core Pipeline System acquisition and the acquisition of the Anacortes Logistics Assets.
Cost of Fuel and Other
Due to the adoption of ASC 606 on January 1, 2018, the revenues and costs associated with our fuel purchase and supply arrangements with Andeavor were netted for the 2018 Period, as mentioned above and further described in Note 10.
NGL Expense
NGL expense decreased $13 million for the 2018 Period compared to the 2017 Period primarily due to the impact of ASC 606 adopted on January 1, 2018, partially offset by an increase in expense for the Robinson Lake and Belfield facilities due to higher production during the 2018 Period. Refer to Note 10 for further information regarding the adoption of ASC 606.
September 30, 2018 | 31 | ||
Management’s Discussion and Analysis | ||
Operating Expenses
Operating expenses increased $146 million for the 2018 Period compared to the 2017 Period primarily due to the WNRL Merger as well as the recognition of non-cash expenses recognized in connection with the adoption of ASC 606.
Depreciation and Amortization Expense
Depreciation and amortization expenses increased $46 million for the 2018 Period compared to the 2017 Period largely due to the property, plant and equipment and intangibles acquired with the WNRL Merger and the 2018 Drop Down.
(Gain) Loss on Asset Disposals and Impairments
The gain on asset disposals of $25 million during the 2017 Period was due to the sale of a products terminal in Alaska.
Interest and Financing Costs, Net
Net interest and financing costs decreased $21 million in the 2018 Period compared to the 2017 Period primarily due to lower interest rates from the refinancing of debt with new senior notes during the fourth quarter of 2017 reflecting our improved investment grade credit rating.
Equity in Earnings of Equity Method Investments
The increase of $12 million in earnings of equity method investments was due to earnings from ALRP, which was acquired in January 2018, and MPL, which was acquired in June 2017.
32 | | | ||
Management’s Discussion and Analysis | ||
Segment Results of Operations

 Terminalling and Transportation Segment
Our Terminalling and Transportation segment consists of pipeline systems, including regulated common carrier refined products pipeline systems and other pipelines, which transport products and crude oil primarily from Andeavor’s refineries to nearby facilities, as well as crude oil and refined products terminals and storage facilities, marine terminals, asphalt terminals, rail-car unloading facilities, an asphalt trucking operation and a petroleum coke handling and storage facility.
2018 3rd Quarter Versus 2017 3rd Quarter
Highlights (in millions)
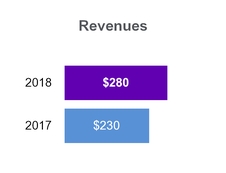
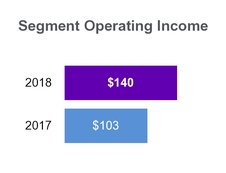
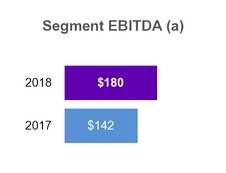
(a) | See “Non-GAAP Reconciliations” section for further information regarding this non-GAAP measure. |
Segment Volumetric Data
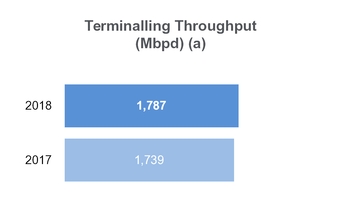
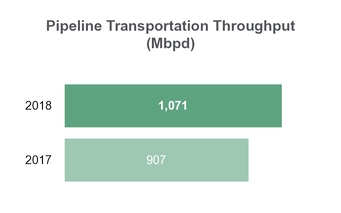
(a) | Adjusted to include the historical results of the Predecessors. |
Volumes
Terminalling throughput volume increased 48 Mbpd, or 3%, in the 2018 Quarter compared to the 2017 Quarter. The increase in the terminalling throughput volume was primarily attributable to contributions from the SLC Core Pipeline System acquisition and the 2018 Drop Down. Pipeline transportation throughput volume increased 164 Mbpd, or 18%, in the 2018 Quarter due to continued strong product demand as well as contributions from the Anacortes Logistics Assets and the SLC Core Pipeline System acquisitions.
September 30, 2018 | 33 | ||
Management’s Discussion and Analysis | ||
Terminalling and Transportation Segment Results (in millions, except per barrel amounts)
Three Months Ended September 30, | |||||||
2018 (a) | 2017 (a) | ||||||
Revenues | |||||||
Terminalling | $ | 235 | $ | 189 | |||
Pipeline transportation | 44 | 34 | |||||
Other revenues | 1 | 7 | |||||
Total Revenues | 280 | 230 | |||||
Costs and Expenses | |||||||
Operating expenses (b) | 99 | 80 | |||||
Depreciation and amortization expenses | 35 | 32 | |||||
General and administrative expenses | 7 | 15 | |||||
Gain on asset disposals and impairments | (1 | ) | — | ||||
Operating Income | $ | 140 | $ | 103 | |||
Segment EBITDA (c) | $ | 180 | $ | 142 | |||
Rates (d) | |||||||
Average terminalling revenue per barrel | $ | 1.43 | $ | 1.18 | |||
Average pipeline transportation revenue per barrel | $ | 0.45 | $ | 0.40 | |||
Financial Results
The Terminalling and Transportation segment’s operating income increased $37 million, or 36%, and Segment EBITDA increased $38 million, or 27%, primarily driven by the SLC Core Pipeline System acquisition, the 2018 Drop Down, the acquisition of the Anacortes Logistics Assets and organic growth.
In addition, we had higher operating expenses for the 2018 Quarter related to the 2018 Drop Down and higher repair and maintenance expenses.
(a) | Adjusted to include the historical results of the Predecessors. |
(b) | Operating expenses included an imbalance settlement gain of $1 million for the 2017 Quarter. There was no gain for the 2018 Quarter. |
(c) | See “Non-GAAP Reconciliations” section for further information regarding this non-GAAP measure. |
(d) | Amounts may not recalculate due to rounding of dollar and volume information. |
2018 Year to Date Period Versus 2017 Year to Date Period
Highlights (in millions)
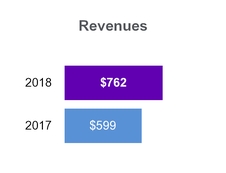
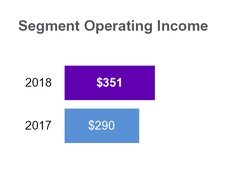
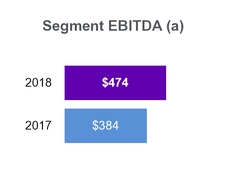
(a) | See “Non-GAAP Reconciliations” section for further information regarding this non-GAAP measure. |
34 | | | ||
Management’s Discussion and Analysis | ||
Segment Volumetric Data
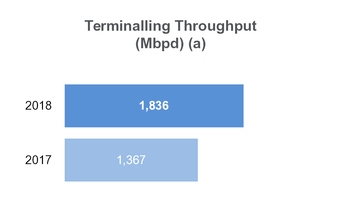
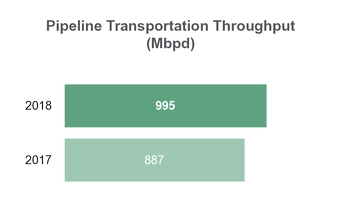
(a) | Adjusted to include the historical results of the Predecessors. |
Volumes
Terminalling throughput volume increased 469 Mbpd, or 34%, in the 2018 Period compared to the 2017 Period. The increase in the terminalling throughput volume was primarily attributable to the assets acquired in the WNRL Merger, the 2018 Drop Down and the SLC Core Pipeline System acquisition. Pipeline transportation throughput volume increased 108 Mbpd, or 12%, in the 2018 Period due to continued strong product demand as well as contributions from the Anacortes Logistics Assets, the SLC Core Pipeline System and the 2018 Drop Down acquisitions.
Terminalling and Transportation Segment Results (in millions, except per barrel amounts)
Nine Months Ended September 30, | |||||||
2018 (a) | 2017 (a) | ||||||
Revenues | |||||||
Terminalling | $ | 643 | $ | 493 | |||
Pipeline transportation | 115 | 97 | |||||
Other revenues | 4 | 9 | |||||
Total Revenues | 762 | 599 | |||||
Costs and Expenses | |||||||
Operating expenses (b) | 279 | 216 | |||||
Depreciation and amortization expenses | 105 | 85 | |||||
General and administrative expenses | 27 | 33 | |||||
Gain on asset disposals and impairments | — | (25 | ) | ||||
Operating Income | $ | 351 | $ | 290 | |||
Segment EBITDA (c) | $ | 474 | $ | 384 | |||
Rates (d) | |||||||
Average terminalling revenue per barrel | $ | 1.28 | $ | 1.32 | |||
Average pipeline transportation revenue per barrel | $ | 0.42 | $ | 0.40 | |||
Financial Results
The Terminalling and Transportation segment’s operating income increased $61 million, or 21%, and Segment EBITDA increased $90 million, or 23%, primarily driven by the WNRL Merger, the 2018 Drop Down, the acquisition of the Anacortes Logistics Assets and organic growth. In addition, we had higher operating expenses as well as depreciation and amortization expenses for the entire 2018 Period related to the WNRL Merger and the SLC Core Pipeline System acquisition.
The gain on asset disposals during 2017 was due to the sale of a products terminal in Alaska.
(a) | Adjusted to include the historical results of the Predecessors. |
(b) | Operating expenses included an imbalance settlement gain of $3 million for the 2017 Period. There was no gain for the 2018 Period. |
(c) | See “Non-GAAP Reconciliations” section for further information regarding this non-GAAP measure. |
(d) | Amounts may not recalculate due to rounding of dollar and volume information. |
September 30, 2018 | 35 | ||
Management’s Discussion and Analysis | ||

 Gathering and Processing Segment
Our Gathering and Processing segment consists of crude oil, natural gas, NGLs and produced water gathering systems in the Bakken Shale/Williston Basin area of North Dakota and Montana, the Green River Basin, Uinta Basin and Vermillion Basin in the states of Utah, Colorado and Wyoming (the “Rockies Region”), the Delaware Basin in the Permian Basin area of West Texas and Southern New Mexico, and in the San Juan Basin in the Four Corners area of Northwestern New Mexico. It also consists of gas processing and fractionation complexes in the Bakken Shale, Green River Basin, Uinta Basin and Vermillion Basin.
2018 3rd Quarter Versus 2017 3rd Quarter
Highlights (in millions)
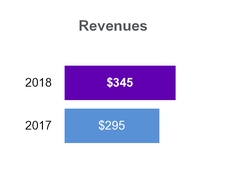
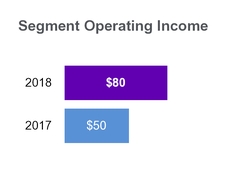

(a) | See “Non-GAAP Reconciliations” section for further information regarding this non-GAAP measure. |
Segment Volumetric Data
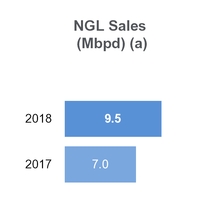
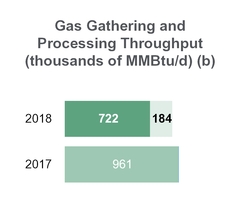
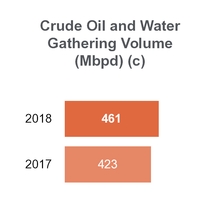
(a) | Volumes represent barrels sold in keep-whole arrangements, net barrels retained in POP arrangements and other associated products. |
(b) | The adoption of ASC 606 changed the presentation of our gas gathering and processing throughput volumes. Volumes processed internally to enhance our NGL sales are no longer reported in our throughput volumes as certain fees contained within our commodity contracts are now reported as a reduction of “NGL expense”. The impact of the adoption during the 2018 Quarter was 184 thousand MMBtu/d now being used internally and not reported in the throughput volumes used to calculate our average gas gathering and processing revenue per MMBtu. |
(c) | Adjusted to include the historical results of the Predecessors. |
Volumes
NGL sales volumes increased in the 2018 Quarter as compared to the 2017 Quarter primarily due to ethane recovery in the Rockies region in the 2018 Quarter. Ethane recovery is the process of capturing ethane during the NGL processing stream, where it is then fractionated and sold. The decrease in gas gathering and processing throughput volumes of 239 thousand MMBtu/d, or 25%, in the 2018 Quarter as compared to the 2017 Quarter was primarily driven by the adoption of ASC 606 which changed the presentation of certain of our volumes. The impact of the adoption is described further in Note 10. In addition, beginning in the 2018 Quarter, certain low-tariff processing agreements expired reducing our throughput approximately 45 thousand MMBtu/d. Crude oil and water throughput volumes increased 38 Mbpd, or 9%, in the 2018 Quarter primarily due to contributions from the 2018 Drop Down.
36 | | | ||
Management’s Discussion and Analysis | ||
Gathering and Processing Segments Results (in millions, except per barrel and per MMBtu amounts)
Three Months Ended September 30, | |||||||
2018 (a) | 2017 (a) | ||||||
Revenues | |||||||
NGL sales (b) | $ | 137 | $ | 90 | |||
Gas gathering and processing | 82 | 85 | |||||
Crude oil and water gathering | 86 | 76 | |||||
Pass-thru and other | 40 | 44 | |||||
Total Revenues | 345 | 295 | |||||
Costs and Expenses | |||||||
NGL expense (excluding items shown separately below) (b) | 73 | 64 | |||||
Operating expenses (c) | 131 | 113 | |||||
Depreciation and amortization expenses | 47 | 51 | |||||
General and administrative expenses | 12 | 16 | |||||
Loss on asset disposals and impairments | 2 | 1 | |||||
Operating Income | $ | 80 | $ | 50 | |||
Segment EBITDA (d) | $ | 130 | $ | 103 | |||
Rates (e) | |||||||
Average margin on NGL sales per barrel (b)(d)(f) | $ | 71.47 | $ | 38.30 | |||
Average gas gathering and processing revenue per MMBtu (f) | $ | 1.27 | $ | 0.96 | |||
Average crude oil and water gathering revenue per barrel | $ | 2.03 | $ | 1.95 | |||
Financial Results
Our Gathering and Processing segment’s operating income increased $30 million, or 60%, in the 2018 Quarter compared to the 2017 Quarter. Segment EBITDA increased $27 million, or 26%, in the 2018 Quarter compared to the 2017 Quarter.
Revenues for our crude oil and water gathering systems improved due to the impact from operations obtained in the WNRL Merger and the 2018 Drop Down which increased the throughput volumes and improved our tariff mix. Revenues also increased due to continued strong volume growth in our Permian crude oil gathering during the 2018 Quarter. Revenues and NGL expense in the 2018 Quarter were impacted by expanded capacity at the Robinson Lake gas processing facility.
Revenues were also impacted by the adoption of ASC 606, as further described in Note 10. Certain cost recoveries previously presented as service revenues are now reflected as reductions to NGL expense, resulting in an increase to the average margin on NGL sales per barrel, but an immaterial impact on our segment operating income and Segment EBITDA.
In addition, we had incremental operating expenses primarily associated with the 2018 Drop Down and ASC 606, as further described in Note 10.
(a) | Adjusted to include the historical results of the Predecessors. |
(b) | We had 24.0 Mbpd and 21.1 Mbpd of gross NGL sales under our agreements for POP and keep-whole arrangements for the 2018 Quarter and 2017 Quarter, respectively. We retained 9.5 Mbpd and 7.0 Mbpd under these arrangements, respectively. The difference between gross sales barrels and barrels retained is reflected in NGL expense resulting from the gross presentation required for the POP arrangements associated with the North Dakota Gathering and Processing Assets. |
(c) | Operating expenses include an imbalance settlement gain of $1 million for the 2017 Quarter. There was no gain for the 2018 Quarter. |
(d) | See “Non-GAAP Reconciliations” section for further information regarding this non-GAAP measure. |
(e) | Amounts may not recalculate due to rounding of dollar and volume information. |
(f) | Due to the adoption of ASC 606, certain cost recoveries previously presented as service revenues are now reflected as reductions to NGL expense, resulting in an increase to the average margin on NGL sales per barrel. In addition, volumes processed internally to enhance our NGL sales are no longer reported in our throughput volumes used to calculate our average gas gathering and processing revenue per MMBtu as certain fees contained within our commodity contracts are now reported as a reduction of NGL expense. The mix of remaining volumes resulted in a higher recognized gas gathering and processing rate. |
September 30, 2018 | 37 | ||
Management’s Discussion and Analysis | ||
2018 Year to Date Period Versus 2017 Year to Date Period
Highlights (in millions)
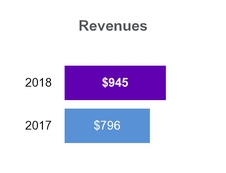
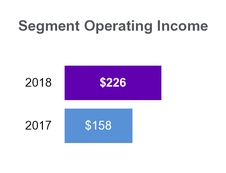
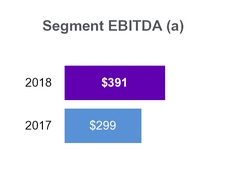
(a) | See “Non-GAAP Reconciliations” section for further information regarding this non-GAAP measure. |
Segment Volumetric Data
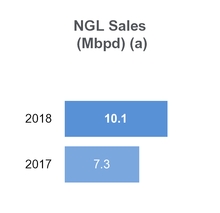
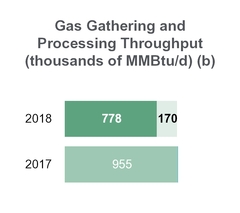
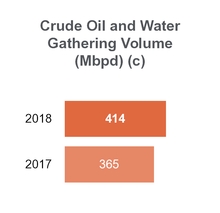
(a) | Volumes represent barrels sold in keep-whole arrangements, net barrels retained in POP arrangements and other associated products. |
(b) | The adoption of ASC 606 changed the presentation of our gas gathering and processing throughput volumes. Volumes processed internally to enhance our NGL sales are no longer reported in our throughput volumes as certain fees contained within our commodity contracts are now reported as a reduction of “NGL expense”. The impact of the adoption during the 2018 Period was 170 thousand MMBtu/d now being used internally and not reported in our throughput volumes used to calculate our average gas gathering and processing revenue per MMBtu. |
(c) | Adjusted to include the historical results of the Predecessors. |
Volumes
NGL sales volumes increased in the 2018 Period as compared to the 2017 Period primarily due to ethane recovery in the Rockies region in the 2018 Period. The decrease in gas gathering and processing throughput volumes of 177 thousand MMBtu/d, or 19%, in the 2018 Period as compared to the 2017 Period was primarily driven by the adoption of ASC 606 which changed the presentation of certain of our volumes. The impact of the adoption is described further in Note 10. Planned downtime at our Robinson Lake gas processing facility also resulted in lower volumes during the 2018 Period. Crude oil and water throughput volumes increased 49 Mbpd, or 13%, in the 2018 Period primarily due to contributions from the WNRL Merger.
38 | | | ||
Management’s Discussion and Analysis | ||
Gathering and Processing Segments Results (in millions, except per barrel and per MMBtu amounts)
Nine Months Ended September 30, | |||||||
2018 (a) | 2017 (a) | ||||||
Revenues | |||||||
NGL sales (b) | $ | 336 | $ | 254 | |||
Gas gathering and processing | 249 | 252 | |||||
Crude oil and water gathering | 241 | 170 | |||||
Pass-thru and other (c) | 119 | 120 | |||||
Total Revenues | 945 | 796 | |||||
Costs and Expenses | |||||||
NGL expense (excluding items shown separately below) (b)(c) | 166 | 179 | |||||
Operating expenses (d) | 361 | 284 | |||||
Depreciation and amortization expenses | 154 | 134 | |||||
General and administrative expenses | 36 | 41 | |||||
Loss on asset disposals and impairments | 2 | — | |||||
Operating Income | $ | 226 | $ | 158 | |||
Segment EBITDA (e) | $ | 391 | $ | 299 | |||
Rates (f) | |||||||
Average margin on NGL sales per barrel (b)(c)(e)(g) | $ | 61.70 | $ | 38.27 | |||
Average gas gathering and processing revenue per MMBtu (g) | $ | 1.17 | $ | 0.97 | |||
Average crude oil and water gathering revenue per barrel | $ | 2.13 | $ | 1.71 | |||
Financial Results
Our Gathering and Processing segment’s operating income increased $68 million, or 43%, in the 2018 Period compared to the 2017 Period. Segment EBITDA increased $92 million, or 31%, in the 2018 Period compared to the 2017 Period. The 2018 Period was impacted by planned downtime at the Robinson Lake gas processing facility to allow for a capacity expansion project, which was successfully completed within the 2018 Period.
Revenues for our crude oil and water gathering systems improved due to the impact from operations obtained in the WNRL Merger increasing the throughput volumes and improving our tariff mix. Revenues also increased due to continued strong volume growth in our Permian crude oil gathering during the 2018 Period and Andeavor’s Mandan refinery undergoing a turnaround in the 2017 Period. Revenues were also impacted by the adoption of ASC 606, as further described in Note 10. Certain cost recoveries previously presented as service revenues are now reflected as reductions to NGL expense, resulting in an increase to the average margin on NGL sales per barrel, but had an immaterial impact on our segment operating income and Segment EBITDA.
In addition, we had incremental operating expenses and depreciation expenses primarily associated with the WNRL Merger and the adoption of ASC 606, as further described in Note 10.
(a) | Adjusted to include the historical results of the Predecessors. |
(b) | We had 24.4 Mbpd and 21.0 Mbpd of gross NGL sales under our agreements for POP and keep-whole arrangements for the 2018 Period and 2017 Period, respectively. We retained 10.1 Mbpd and 7.3 Mbpd under these arrangements, respectively. The difference between gross sales barrels and barrels retained is reflected in NGL expense resulting from the gross presentation required for the POP arrangements associated with the North Dakota Gathering and Processing Assets. |
(c) | Included in the NGL expense for the 2017 Period was approximately $2 million of costs related to crude oil volumes obtained in connection with the North Dakota Gathering and Processing Assets acquisition. The corresponding revenues were recognized in pass-thru and other revenue. As such, the calculation of the average margin on NGL sales per barrel excludes this amount. |
(d) | Operating expenses include an imbalance settlement gain of $4 million for the 2017 Period. There was no gain for the 2018 Period. |
(e) | See “Non-GAAP Reconciliations” section for further information regarding this non-GAAP measure. |
(f) | Amounts may not recalculate due to rounding of dollar and volume information. |
(g) | Due to the adoption of ASC 606, certain cost recoveries previously presented as service revenues are now reflected as reductions to NGL expense, resulting in an increase to the average margin on NGL sales per barrel. In addition, volumes processed internally to enhance our NGL sales are no longer reported in our throughput volumes used to calculate our average gas gathering and processing revenue per MMBtu as certain fees contained within our commodity contracts are now reported as a reduction of NGL expense. The mix of remaining volumes resulted in a higher recognized gas gathering and processing rate. |
September 30, 2018 | 39 | ||
Management’s Discussion and Analysis | ||
 Wholesale
Our Wholesale segment includes the operations of several bulk petroleum distribution plants and a fleet of refined product delivery trucks that distribute commercial wholesale petroleum products primarily in Arizona, Colorado, Nevada, New Mexico and Texas. The refined product trucking business delivers a significant portion of the volumes sold by our Wholesale segment.
The Wholesale segment was added as a result of the WNRL Merger, therefore, there were only four months of activity to report for the Wholesale segment for the nine months ended September 30, 2017.
2018 3rd Quarter Versus 2017 3rd Quarter
Highlights (in millions)
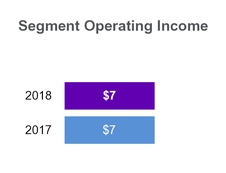
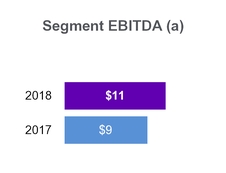
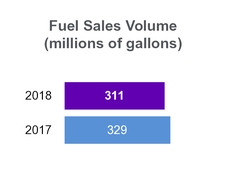
(a) | See “Non-GAAP Reconciliations” section for further information regarding this non-GAAP measure. |
40 | | | ||
Management’s Discussion and Analysis | ||
Wholesale Segment Operating Results and Data (in millions, except gallons and per gallon amounts)
Three Months Ended September 30, | |||||||
2018 | 2017 (a) | ||||||
Revenues | |||||||
Fuel sales (b) | $ | 13 | $ | 565 | |||
Other wholesale | 7 | 4 | |||||
Total Revenues | 20 | 569 | |||||
Costs and Expenses | |||||||
Cost of fuel and other (excluding items shown separately below) (b) | — | 554 | |||||
Operating expenses (excluding depreciation and amortization) | 9 | 6 | |||||
Depreciation and amortization expenses | 4 | 2 | |||||
General and administrative expenses | — | — | |||||
Operating Income | $ | 7 | $ | 7 | |||
Segment EBITDA (c) | $ | 11 | $ | 9 | |||
Volumes and Rates (d) | |||||||
Fuel sales volumes (millions of gallons) | 311 | 329 | |||||
Wholesale fuel sales per gallon (b) | 4.0 | ¢ | |||||
Average wholesale fuel sales margin per gallon (b)(c) | 3.0 | ¢ | |||||
Financial Results
The Wholesale segment’s operating income was $7 million for both the 2018 Quarter and 2017 Quarter. Segment EBITDA was $11 million and $9 million, for the 2018 Quarter and 2017 Quarter, respectively. Results for the 2018 Quarter compared to the 2017 Quarter were driven by an improved wholesale margin environment.
Due to the adoption of ASC 606 effective January 1, 2018, the revenues and costs associated with our fuel purchase and supply arrangements with Andeavor for the 2018 Quarter were netted. Therefore, we no longer present cost of fuel and other or average margin on fuel sales per gallon. Instead, we now present wholesale fuel sales per gallon, which is not a direct comparison of the previous metric. The impact of the adoption is described further in Note 1 and Note 10.
Volumes
Fuel sales volumes decreased 18 million gallons in the 2018 Quarter as compared to the 2017 Quarter.
(a) | Adjusted to include the historical results of the Predecessors. The Wholesale business was acquired in the WNRL Merger and only represents operations since June 1, 2017, the date the business was originally acquired by Andeavor. |
(b) | Due to the adoption of ASC 606 effective January 1, 2018, the revenues and costs associated with our fuel purchase and supply arrangements with Andeavor for the 2018 Quarter were netted. Therefore, we no longer present cost of fuel and other or average margin on fuel sales per gallon. Instead, we now present wholesale fuel sales per gallon, which is not a direct comparison of the previous metric. |
(c) | See “Non-GAAP Reconciliations” section for further information regarding this non-GAAP measure. |
(d) | Amounts may not recalculate due to rounding of dollar and volume information. |
2018 Year to Date Period Versus 2017 Year to Date Period
Highlights (in millions)
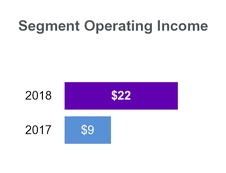
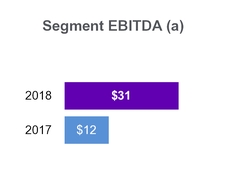
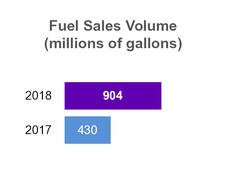
(a) | See “Non-GAAP Reconciliations” section for further information regarding this non-GAAP measure. |
September 30, 2018 | 41 | ||
Management’s Discussion and Analysis | ||
Wholesale Segment Operating Results and Data (in millions, except gallons and per gallon amounts)
Nine Months Ended September 30, | |||||||
2018 | 2017 (a) | ||||||
Revenues | |||||||
Fuel sales (b) | $ | 37 | $ | 730 | |||
Other wholesale | 25 | 10 | |||||
Total Revenues | 62 | 740 | |||||
Costs and Expenses | |||||||
Cost of fuel and other (excluding items shown separately below) (b) | — | 716 | |||||
Operating expenses (excluding depreciation and amortization) | 30 | 12 | |||||
Depreciation and amortization expenses | 9 | 3 | |||||
General and administrative expenses | 1 | — | |||||
Operating Income | $ | 22 | $ | 9 | |||
Segment EBITDA (c) | $ | 31 | $ | 12 | |||
Volumes and Rates (d) | |||||||
Fuel sales volumes (millions of gallons) | 904 | 430 | |||||
Wholesale fuel sales per gallon (b) | 4.0 | ¢ | |||||
Average wholesale fuel sales margin per gallon (b)(c) | 3.0 | ¢ | |||||
Financial Results
The Wholesale segment’s operating income was $22 million and $9 million and Segment EBITDA was $31 million and $12 million for the 2018 Period and 2017 Period, respectively. Results for the 2018 Period compared to the 2017 Period were driven by seasonally higher volumes and an improved wholesale margin environment.
Due to the adoption of ASC 606 effective January 1, 2018, the revenues and costs associated with our fuel purchase and supply arrangements with Andeavor for the 2018 Period were netted. Therefore, we no longer present cost of fuel and other or average margin on fuel sales per gallon. Instead, we now present wholesale fuel sales per gallon, which is not a direct comparison of the previous metric. The impact of the adoption is described further in Note 1 and Note 10.
Volumes
Fuel sales volumes increased 474 million gallons in the 2018 Period as compared to the 2017 Period primarily due to only four months of activity reported for the Wholesale segment for the nine months ended September 30, 2017.
(a) | Adjusted to include the historical results of the Predecessors. The Wholesale business was acquired in the WNRL Merger and only represents operations since June 1, 2017, the date the business was originally acquired by Andeavor. |
(b) | Due to the adoption of ASC 606 effective January 1, 2018, the revenues and costs associated with our fuel purchase and supply arrangements with Andeavor for the 2018 Period were netted. Therefore, we no longer present cost of fuel and other or average margin on fuel sales per gallon. Instead, we now present wholesale fuel sales per gallon, which is not a direct comparison of the previous metric. |
(c) | See “Non-GAAP Reconciliations” section for further information regarding this non-GAAP measure. |
(d) | Amounts may not recalculate due to rounding of dollar and volume information. |
42 | | | ||
Management’s Discussion and Analysis | ||
Capital Resources and Liquidity
Overview
Our primary cash requirements relate to funding capital expenditures, acquisitions, meeting operational needs, servicing our debt and paying distributions to our unitholders. We expect our ongoing sources of liquidity to include cash generated from operations, reimbursement for certain maintenance and expansion expenditures, borrowings under our credit facilities and issuances of additional debt and equity securities. We believe that cash generated from these sources will be sufficient to meet our short-term working capital, long-term capital expenditure, acquisition and debt servicing requirements and allow us to fund at least the minimum quarterly cash distributions.
Capitalization
Capital Structure (in millions)
Debt, including current maturities: | September 30, 2018 | December 31, 2017 | |||||
Credit facilities | $ | 1,120 | $ | 423 | |||
Senior notes | 3,750 | 3,750 | |||||
Capital lease obligations | 8 | 9 | |||||
Total Debt | 4,878 | 4,182 | |||||
Unamortized Issuance Costs | (48 | ) | (54 | ) | |||
Debt, Net of Unamortized Issuance Costs | 4,830 | 4,128 | |||||
Total Equity | 4,687 | 4,806 | |||||
Total Capitalization | $ | 9,517 | $ | 8,934 | |||
Debt Overview and Available Liquidity
Our Revolving Credit Facility, our Dropdown Credit Facility and our senior notes contain covenants that may, among other things, limit or restrict our ability (as well as the ability of our subsidiaries) to engage in certain activities. There have been no changes in these covenants from those described in our Annual Report on Form 10-K for the year ended December 31, 2017. As of September 30, 2018, our Revolving Credit Facility is non-recourse to Andeavor and Marathon, except for Tesoro Logistics GP, LLC, our general partner.
Available Capacity Under Credit Facilities (in millions)
Credit Facility | Total Capacity | Amount Borrowed as of September 30, 2018 | Available Capacity as of September 30, 2018 | Weighted Average Interest Rate | Expiration | |||||||||||
Revolving Credit Facility | $ | 1,100 | $ | 820 | $ | 280 | 3.95 | % | January 29, 2021 | |||||||
Dropdown Credit Facility | 1,000 | 300 | 700 | 3.86 | % | January 29, 2021 | ||||||||||
Total Credit Facilities | $ | 2,100 | $ | 1,120 | $ | 980 | ||||||||||
Revolving Credit Facilities Expense and Fees
Credit Facility | 30 Day Eurodollar (LIBOR) Rate at September 30, 2018 | Eurodollar Margin | Base Rate | Base Rate Margin | Commitment Fee (unused portion) | ||||
Revolving Credit Facility (a) | 2.26% | 1.75% | 5.25% | 0.75% | 0.300% | ||||
Dropdown Credit Facility (a) | 2.26% | 1.76% | 5.25% | 0.76% | 0.300% | ||||
(a) | We have the option to elect whether our borrowings will bear interest at a base rate plus the base rate margin, or a Eurodollar rate, for the applicable period, plus the Eurodollar margin at the time of the borrowing. The applicable margin varies based upon a certain leverage ratio, as defined by the Revolving Credit Facility. We also incur commitment fees for the unused portion of the Revolving Credit Facility at an annual rate. Letters of credit outstanding under the Revolving Credit Facility incur fees at the Eurodollar margin rate. |
September 30, 2018 | 43 | ||
Management’s Discussion and Analysis | ||
Equity Overview
Our partnership agreement authorizes us to issue an unlimited number of additional partnership securities on the terms and conditions determined by our general partner without the approval of the unitholders. Costs associated with the issuance of securities are allocated to all unitholders’ capital accounts based on their ownership interest at the time of issuance. We had 89,299,615 common public units and 600,000 Preferred Units outstanding as of September 30, 2018. Additionally, Andeavor owned 156,173,128 of our common units, constituting approximately 64% ownership interest in us. Andeavor also held 80,000 Andeavor Logistics TexNew Mex units and all of the outstanding non-economic general partner units as of September 30, 2018.
Issuance of Preferred Units
On December 1, 2017, we issued and sold the Preferred Units at a price to the public of $1,000 per unit. Distributions on the Preferred Units will accrue and be cumulative from the original issue date of the Preferred Units and will be payable semi-annually in arrears on the 15th day of February and August of each year through and including February 15, 2023.
Cash Flow Summary
Components of our Cash Flows (in millions)
Nine Months Ended September 30, | |||||||
2018 (a) | 2017 (a) | ||||||
Cash Flows From (Used in): | |||||||
Operating activities | $ | 719 | $ | 524 | |||
Investing activities | (945 | ) | (1,404 | ) | |||
Financing activities | 181 | 230 | |||||
Decrease in Cash and Cash Equivalents | $ | (45 | ) | $ | (650 | ) | |
(a) | Adjusted to include the historical results of the Predecessors. |
Operating Activities
Net cash from operating activities increased $195 million to $719 million in the 2018 Period compared to $524 million for the 2017 Period. The increase in cash from operating activities was primarily driven by an increase in net earnings from the 2017 Period to the 2018 Period and the change in working capital.
Investing Activities
Net cash used in investing activities for the 2018 Period was $945 million compared to $1.4 billion in the 2017 Period. The decrease in cash used was the result of the cash paid for acquisitions in each period and proceeds from the sale of certain Alaska terminalling assets and WNRL’s lubricant operations located in Arizona and Nevada during the 2017 Period. The 2017 Period included the acquisition of the North Dakota Gathering and Processing Assets and MPL and the 2018 Period included the acquisition of the SLC Core Pipeline System and ownership interests in ALRP and PNAC. Partially offsetting these were higher cash spend on capital expenditures during the 2018 Period. See “Capital Expenditures” below for a discussion of the expected capital expenditures for the year ended December 31, 2018.
Financing Activities
The 2018 Period had net cash from financing activities of $181 million compared to $230 million for the 2017 Period. Sources of cash such as issuances of equity decreased by $290 million but net borrowings under our revolving credit facilities increased by $992 million. The use of our cash to make distributions to common and preferred unitholders increased $291 million and $29 million, respectively. There were no distributions to our general partner during the 2018 Period due to the IDR/GP Transaction compared to $131 million during the 2017 Period. During the 2018 Period, we made $300 million in cash payments to common unitholders for the 2018 Drop Down. There was a decrease in cash from sponsor contributions of equity to the Predecessors of $272 million.
Capital Expenditures
We expect capital expenditures for the year ended December 31, 2018 to be approximately $750 million, or approximately $720 million net of reimbursements primarily from Andeavor with whom we contract to provide services. The revised capital expenditure estimate reflects approximately $170 million attributable to amounts spent by our Predecessors during the nine months ended September 30, 2018 as well as additional capital required to complete projects included in the 2018 Drop Down and the acceleration of crude oil gathering projects in the Permian Basin. Refer to Note 2 for further information regarding the 2018 Drop Down.
During the 2018 Period, we spent $454 million on growth capital projects, net of $16 million in reimbursements primarily from Andeavor, and $42 million on maintenance capital projects, net of $12 million in reimbursements primarily from Andeavor. These include approximately $164 million and $6 million of growth and maintenance capital, respectively, spent by our Predecessors. There have been no other material changes to committed amounts for our major capital projects previously discussed in our Annual Report on Form 10-K for the year ended December 31, 2017.
44 | | | ||
Management’s Discussion and Analysis | ||
Distributions
Our partnership agreement, as amended, sets forth the calculation to be used to determine the amount and priority of cash distributions that the limited partner unitholders will receive.
Quarterly Distributions
For the three months ended September 30, 2018, June 30, 2018, March 31, 2018 and December 31, 2017, we declared distributions of $1.03, $1.03, $1.015 and $1.00 per limited partnership common unit, respectively, or $4.12, $4.12, $4.06 and $4.00, respectively, on an annualized basis, resulting in cash distributions of $238 million, $209 million, $205 million and $205 million, respectively. The distribution for the quarter ended September 30, 2018 will be paid November 14, 2018 to all unitholders of record as of November 5, 2018. During the nine months ended September 30, 2018, we paid distributions of $29 million to holders of our Preferred Units.
Environmental and Other Matters
Environmental Regulation
We are subject to extensive federal, state and local environmental laws and regulations. These laws, which change frequently, regulate the discharge of materials into the environment or otherwise relate to protection of the environment. Compliance with these laws and regulations may require us to remediate environmental damage from any discharge of petroleum, natural gas or chemical substances from our facilities or require us to install additional pollution control equipment on our equipment and facilities. Our failure to comply with these or any other environmental or safety-related regulations could result in the assessment of administrative, civil or criminal penalties, the imposition of investigatory and remedial liabilities, and the issuance of injunctions that may subject us to additional operational constraints.
Future expenditures may be required to comply with the federal, state and local environmental requirements for our various sites, including our storage facilities, pipelines, gas processing complexes and refined products terminals. The impact of these legislative and regulatory developments, if enacted or adopted, could result in increased compliance costs and additional operating restrictions on our business, each of which could have an adverse impact on our liquidity, financial position or results of operations. See our discussion of the Amended Omnibus Agreement and the Carson Assets Indemnity Agreement in Note 3 of our Annual Report on Form 10-K for the year ended December 31, 2017, for more information regarding the indemnification of certain environmental matters provided to us by Andeavor and discussion of other certain environmental obligations.
Non-GAAP Reconciliations
Reconciliation of Net Earnings to EBITDA (in millions)
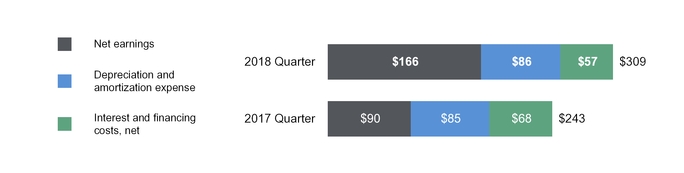
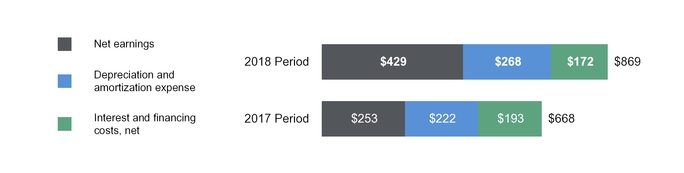
September 30, 2018 | 45 | ||
Management’s Discussion and Analysis | ||
Reconciliation of Segment Operating Income to Segment EBITDA (in millions)
Three Months Ended September 30, | |||||||||||||||||||||||
2018 (a) | 2017 (a) | 2018 (a) | 2017 (a) | 2018 | 2017 (a) | ||||||||||||||||||
Terminalling and Transportation | Gathering and Processing | Wholesale | |||||||||||||||||||||
Segment Operating Income | $ | 140 | $ | 103 | $ | 80 | $ | 50 | $ | 7 | $ | 7 | |||||||||||
Depreciation and amortization expenses | 35 | 32 | 47 | 51 | 4 | 2 | |||||||||||||||||
Equity in earnings of equity method investments | 4 | 4 | 3 | 2 | — | — | |||||||||||||||||
Other income, net | 1 | 3 | — | — | — | — | |||||||||||||||||
Segment EBITDA | $ | 180 | $ | 142 | $ | 130 | $ | 103 | $ | 11 | $ | 9 | |||||||||||
Nine Months Ended September 30, | |||||||||||||||||||||||
2018 (a) | 2017 (a) | 2018 (a) | 2017 (a) | 2018 | 2017 (a) | ||||||||||||||||||
Terminalling and Transportation | Gathering and Processing | Wholesale | |||||||||||||||||||||
Segment Operating Income | $ | 351 | $ | 290 | $ | 226 | $ | 158 | $ | 22 | $ | 9 | |||||||||||
Depreciation and amortization expenses | 105 | 85 | 154 | 134 | 9 | 3 | |||||||||||||||||
Equity in earnings of equity method investments | 14 | 6 | 11 | 7 | — | — | |||||||||||||||||
Other income, net | 4 | 3 | — | — | — | — | |||||||||||||||||
Segment EBITDA | $ | 474 | $ | 384 | $ | 391 | $ | 299 | $ | 31 | $ | 12 | |||||||||||
(a) | Adjusted to include the historical results of the Predecessors. |
Reconciliation of Net Cash from Operating Activities to Distributable Cash Flow (in millions)
Three Months Ended September 30, | Nine Months Ended September 30, | ||||||||||||||
2018 (a) | 2017 (a) | 2018 (a) | 2017 (a) | ||||||||||||
Net Cash from Operating Activities | $ | 172 | $ | 225 | $ | 719 | $ | 524 | |||||||
Changes in assets and liabilities | 96 | (45 | ) | 7 | (51 | ) | |||||||||
Predecessors impact | 1 | (8 | ) | 12 | 20 | ||||||||||
Maintenance capital expenditures (b) | (26 | ) | (33 | ) | (70 | ) | (80 | ) | |||||||
Reimbursement for maintenance capital expenditures (b) | 7 | 7 | 19 | 22 | |||||||||||
Proceeds from sale of assets | — | — | — | 28 | |||||||||||
Adjustments for equity method investments | (6 | ) | 4 | (3 | ) | 5 | |||||||||
Changes in deferred revenue (c) | 13 | (2 | ) | 8 | 5 | ||||||||||
Other (d) | 5 | — | 3 | 4 | |||||||||||
Distributable Cash Flow | 262 | 148 | 695 | 477 | |||||||||||
Less: Preferred unit distributions (e) | (11 | ) | — | (31 | ) | — | |||||||||
Distributable Cash Flow Attributable to Common Unitholders | $ | 251 | $ | 148 | $ | 664 | $ | 477 | |||||||
(a) | Adjusted to include the historical results of the Predecessors. |
(b) | We adjust our reconciliation of distributable cash flows for maintenance capital expenditures, tank restoration costs and expenditures required to ensure the safety, reliability, integrity and regulatory compliance of our assets with an offset for any reimbursements received for such expenditures. |
(c) | Included in changes in deferred revenue are adjustments to remove the impact of the adoption of the new revenue recognition accounting standard on January 1, 2018 as well as the impact from the timing of recognition with certain of our contracts that contain minimum volume commitment with clawback provisions, which are predominantly recognized annually in the third quarter based on current contract terms. |
(d) | Other includes transaction costs related to recent acquisitions and settlement expenses. |
(e) | Represents the cash distributions earned by the Preferred Units for the three and nine months ended September 30, 2018 assuming a distribution is declared by the Board. Cash distributions to be paid to holders of the Preferred Units are not available to common unitholders. |
46 | | | ||
Management’s Discussion and Analysis | ||
Average Margin on NGL Sales per Barrel (in millions, except days and per barrel amounts)
Three Months Ended September 30, | Nine Months Ended September 30, | ||||||||||||||
2018 (a) | 2017 (a) | 2018 (a) | 2017 (a) | ||||||||||||
Segment Operating Income | $ | 80 | $ | 50 | $ | 226 | $ | 158 | |||||||
Add back: | |||||||||||||||
Operating expenses | 131 | 113 | 361 | 284 | |||||||||||
General and administrative expenses | 12 | 16 | 36 | 41 | |||||||||||
Depreciation and amortization expenses | 47 | 51 | 154 | 134 | |||||||||||
Loss on asset disposals and impairments | 2 | 1 | 2 | — | |||||||||||
Other commodity purchases (b) | — | — | — | 2 | |||||||||||
Subtract: | |||||||||||||||
Gas gathering and processing revenues | (82 | ) | (85 | ) | (249 | ) | (252 | ) | |||||||
Crude oil gathering revenues | (86 | ) | (76 | ) | (241 | ) | (170 | ) | |||||||
Pass-thru and other revenues | (40 | ) | (44 | ) | (119 | ) | (120 | ) | |||||||
Margin on NGL Sales | $ | 64 | $ | 26 | $ | 170 | $ | 77 | |||||||
Divided by Total Volumes for the Period: | |||||||||||||||
NGLs sales volumes (Mbpd) | 9.5 | 7.0 | 10.1 | 7.3 | |||||||||||
Number of days in the period | 92 | 92 | 273 | 273 | |||||||||||
Total volumes for the period (thousands of barrels) (c) | 874 | 644 | 2,757 | 1,993 | |||||||||||
Average Margin on NGL Sales per Barrel (c) | $ | 71.47 | $ | 38.30 | $ | 61.70 | $ | 38.27 | |||||||
(a) | Adjusted to include the historical results of the Predecessors. |
(b) | Included in NGL expense for the nine months ended September 30, 2017 was approximately $2 million of costs related to crude oil volumes obtained and immediately sold in connection with the North Dakota Gathering and Processing Assets acquisition. |
(c) | Amounts may not recalculate due to rounding of dollar and volume information. |
Average Wholesale Fuel Sales Margin per Gallon (in millions, except per gallon amounts)
Three Months Ended | Nine Months Ended | ||||||
September 30, 2017 (a) | |||||||
Segment Operating Income | $ | 7 | $ | 9 | |||
Add back: | |||||||
Operating expenses (excluding depreciation and amortization) | 6 | 12 | |||||
Depreciation and amortization expenses | 2 | 3 | |||||
Subtract: | |||||||
Other wholesale revenues | (4 | ) | (10 | ) | |||
Wholesale Fuel Sales Margin | $ | 11 | $ | 14 | |||
Divided by Total Volumes for the Period: | |||||||
Fuel sales volumes (millions of gallons) | 329 | 430 | |||||
Average Wholesale Fuel Sales Margin per Gallon (b) | 3.0 | ¢ | 3.0 | ¢ | |||
(a) | Adjusted to include the historical results of the Predecessors. The Wholesale business was acquired in the WNRL Merger and only represent operations since June 1, 2017, the date the business was originally acquired by Andeavor. |
(b) | Amounts may not recalculate due to rounding of dollar and volume information. |
September 30, 2018 | 47 | ||
Management’s Discussion and Analysis | ||
Important Information Regarding Forward-Looking Statements
This report (including information incorporated by reference) contains “forward-looking statements” within the meaning of Section 27A of the Securities Act of 1933 and Section 21E of the Securities Exchange Act of 1934. All statements other than statements of historical fact, including without limitation statements regarding our business strategy and goals, and expectations regarding revenues, cash flows, capital expenditures, other financial items, growth, acquisitions, our market position, future operations and profitability, are forward-looking statements. Forward-looking statements may be identified by use of the words “anticipate,” “believe,” “could,” “estimate,” “expect,” “intend,” “may,” “plan,” “predict,” “project,” “will,” “would” and similar terms and phrases. Although we believe our assumptions concerning future events are reasonable, a number of risks, uncertainties and other factors could cause actual results and trends to differ materially from those projected, including, but not limited to:
• | changes in the expected value of and benefits derived from acquisitions, including any inability to successfully integrate acquisitions, realize expected synergies or achieve operational efficiency and effectiveness; |
• | changes in global economic conditions on our business, on the business of our key customers, and on our customers’ suppliers, business partners and credit lenders; |
• | a material change in the crude oil and natural gas produced in the basins where we operate; |
• | the ability of our key customers to remain in compliance with the terms of their outstanding indebtedness; |
• | changes in insurance markets impacting costs and the level and types of coverage available; |
• | regulatory and other requirements concerning the transportation of crude oil, natural gas, NGLs and refined products, particularly in the areas where we operate; |
• | changes in the cost or availability of third-party vessels, pipelines and other means of delivering and transporting crude oil, feedstocks, natural gas, NGLs and refined products; |
• | the coverage and ability to recover claims under our insurance policies; |
• | the availability and costs of crude oil, other refinery feedstocks and refined products; |
• | the timing and extent of changes in commodity prices and demand for refined products, natural gas and NGLs; |
• | changes in our cash flow from operations; |
• | changes in our tax status; |
• | the ability of our largest customers to perform under the terms of our gathering agreements; |
• | the risk of contract cancellation, non-renewal or failure to perform by those in our supply and distribution chains, and the ability to replace such contracts and/or customers; |
• | the suspension, reduction or termination of Andeavor’s obligations under our commercial agreements and our secondment agreement; |
• | a material change in profitability among our customers; |
• | direct or indirect effects on our business resulting from actual or threatened terrorist or activist incidents, cyber-security breaches or acts of war; |
• | weather conditions, earthquakes or other natural disasters affecting operations by us or our key customers or the areas in which our customers operate; |
• | disruptions due to equipment interruption or failure at our facilities, MPC’s or Andeavor’s facilities or third-party facilities on which our key customers are dependent; |
• | our inability to complete acquisitions on economically acceptable terms or within anticipated timeframes; |
• | actions of customers and competitors; |
• | changes in our credit profile; |
• | state and federal environmental, economic, health and safety, energy and other policies and regulations, including those related to climate change, and any changes therein and any legal or regulatory investigations, delays in obtaining necessary approvals and permits, compliance costs or other factors beyond our control; |
• | operational hazards inherent in refining and natural gas processing operations and in transporting and storing crude oil, natural gas, NGLs and refined products; |
• | changes in capital requirements or in expected timing, execution and benefits of planned capital projects; |
• | seasonal variations in demand for natural gas and refined products; |
• | adverse rulings, judgments, or settlements in litigation or other legal or tax matters, including unexpected environmental remediation costs in excess of any accruals, which affect us or MPC; |
• | risks related to labor relations and workplace safety; |
• | political developments; and |
• | the factors described in greater detail under “Competition” and “Risk Factors” in Items 1 and 1A of our Annual Report on Form 10-K for the year ended December 31, 2017, in “Risk Factors” in Part II, Item 1A of this Quarterly Report on Form 10-Q, and our other filings with the SEC. |
All forward-looking statements included in this report are based on information available to us on the date of this report. We undertake no obligation to revise or update any forward-looking statements as a result of new information, future events or otherwise.
48 | | | ||
Quantitative and Qualitative Disclosures about Market Risk | ||
Item 3. Quantitative and Qualitative Disclosures about Market Risk
There have been no material changes to our market risks as of and for the nine months ended September 30, 2018 from the risks discussed in Part II, Item 7A of our Annual Report on Form 10-K for the year ended December 31, 2017.
Item 4. Controls and Procedures
Our disclosure controls and procedures are designed to provide reasonable assurance that the information that we are required to disclose in reports we file under the Securities Exchange Act of 1934, as amended (“the Exchange Act”), is accumulated and appropriately communicated to management. With the exception of the new Enterprise Resource Planning (“ERP”) implementation described below, there have been no changes in our internal control over financial reporting identified in connection with the evaluation required by paragraph (d) of Exchange Act Rules 13a-15 or 15d-15 that occurred during the third quarter of 2018 that have materially affected, or are reasonably likely to materially affect, our internal control over financial reporting.
On April 1, 2018, Andeavor implemented the first phases of a new ERP system designed to upgrade the technology and improve the financial and operational information. As a result of the system implementation, we updated our framework of internal controls to reflect the system enhancements and corresponding changes to our business processes. While we believe that the ERP system and related changes to internal controls will ultimately strengthen our internal control over financial reporting, there are inherent risks in implementing a new ERP system. We will continue to evaluate and test these control changes in order to provide certification as of December 31, 2018 on the effectiveness of our internal control over financial reporting.
We carried out an evaluation required by Rule 13a-15(b) of the Exchange Act, under the supervision and with the participation of our management, including the principal executive officer and principal financial officer, of the effectiveness of the design and operation of our disclosure controls and procedures at the end of the reporting period. Based on that evaluation, the principal executive officer and principal financial officer concluded that our disclosure controls and procedures were effective as of the end of the reporting period.
September 30, 2018 | 49 | ||
Legal Proceedings, Risk Factors and Unregistered Sales of Equity Securities | ||
Part II - Other Information
Item 1. Legal Proceedings
Litigation Matters
In the ordinary course of business, we may become party to lawsuits, administrative proceedings and governmental investigations, including environmental, regulatory and other matters. The outcome of these matters cannot always be predicted accurately, but we accrue liabilities for these matters if we have determined that it is probable a loss has been incurred and the loss can be reasonably estimated. While it is not possible to predict the outcome of such proceedings, if one or more of them were decided against us, we believe there would be no material impact on our liquidity, financial position or results of operations.
Environmental Matters
SEC regulations require us to report certain information about any proceeding arising under federal, state or local provisions regulating the discharge of materials into the environment or protecting the environment if a governmental authority is a party to the proceeding and we reasonably believe that the proceeding will result in monetary sanctions of $100,000 or more. There were no new proceedings during the third quarter of 2018. While it is not possible to predict the outcome of such proceedings, if one or more of them were decided against us, we believe there would be no material impact on our liquidity, financial position or results of operations.
Item 1A. Risk Factors
There have been no material changes from the risk factors previously disclosed in Item 1A of our Annual Report on Form 10-K for the year ended December 31, 2017, except as follows:
As a result of the MPC Merger, MPC owns our general partner.
On October 1, 2018, MPC completed its acquisition of Andeavor in accordance with the MPC Merger Agreement, under which MPC acquired all of Andeavor’s outstanding shares. Upon completion of the MPC Merger, Andeavor became a wholly owned subsidiary of MPC. As a result, MPC indirectly owns an approximate 64% limited partner interest in us and 100% of our non-economic general partner interests. Conflicts of interest may arise between MPC and its affiliates, including our general partner, on the one hand, and us and our unitholders, on the other hand. In resolving these conflicts, the general partner may favor its own interests and the interests of its affiliates, including MPC, over the interests of our common unitholders.
Item 2. Unregistered Sales of Equity Securities and Use of Proceeds
We may acquire units to satisfy tax withholdings obligations in connection with the vesting of units issued to certain employees. There were no such units acquired during the three months ended September 30, 2018.
50 | | | ||
Exhibits | ||
Item 6. Exhibits
(a) Exhibits
Exhibit Number | Incorporated by Reference (File No. 1-35143, unless otherwise indicated) | |||||||
Description of Exhibit | Form | Exhibit | Filing Date | |||||
‡2.1 | 8-K | 2.1 | 8/14/2017 | |||||
‡2.2 | 8-K | 2.1 | 11/8/2017 | |||||
‡ 2.3 | 10-Q | 2.3 | 5/7/2018 | |||||
2.4 | 8-K | 2.1 | 8/7/2018 | |||||
*2.5 | ||||||||
3.1 | 8-K | 3.1 | 10/29/2018 | |||||
3.2 | 8-K | 3.1 | 12/1/2017 | |||||
3.3 | 8-K | 3.2 | 10/2/2018 | |||||
10.1 | 8-K | 10.1 | 8/7/2018 | |||||
*10.2 | ||||||||
10.3 | 8-K | 10.2 | 8/7/2018 | |||||
*10.4 | ||||||||
September 30, 2018 | 51 | ||
Exhibits | ||
Exhibit Number | Incorporated by Reference (File No. 1-35143, unless otherwise indicated) | |||||||
Description of Exhibit | Form | Exhibit | Filing Date | |||||
10.5 | 8-K | 10.3 | 8/7/2018 | |||||
10.6 | 8-K | 10.4 | 8/7/2018 | |||||
10.7 | 8-K | 10.5 | 8/7/2018 | |||||
10.8 | 8-K | 10.6 | 8/7/2018 | |||||
*10.9 | ||||||||
*10.10 | ||||||||
*10.11 | ||||||||
*31.1 | ||||||||
*31.2 | ||||||||
*32.1 | ||||||||
*32.2 | ||||||||
**101.INS | XBRL Instance Document | |||||||
**101.SCH | XBRL Taxonomy Extension Schema Document | |||||||
**101.CAL | XBRL Taxonomy Extension Calculation Linkbase Document | |||||||
**101.DEF | XBRL Taxonomy Extension Definition Linkbase Document | |||||||
**101.LAB | XBRL Taxonomy Extension Label Linkbase Document | |||||||
**101.PRE | XBRL Taxonomy Extension Presentation Linkbase Document | |||||||
‡ | Certain schedules have been omitted pursuant to Item 601(b)(2) of Regulation S-K. A copy of any omitted schedule will be furnished supplementally to the SEC on request. |
* | Filed herewith |
** | Submitted electronically herewith |
As permitted by Item 601(b)(4)(iii)(A) of Regulation S-K, the Registrant has not filed with this Report certain instruments defining the rights of holders of long-term debt of the Registrant and its subsidiaries because the total amount of securities authorized under any of such instruments does not exceed 10% of the total assets of the Registrant and its subsidiaries on a consolidated basis. The Registrant agrees to furnish a copy of any such agreements to the SEC upon request.
52 | | | ||
Signatures
Pursuant to the requirements of the Securities Exchange Act of 1934, the Registrant has duly caused this report to be signed on its behalf by the undersigned hereunto duly authorized.
Andeavor Logistics LP | |||
By: | Tesoro Logistics GP, LLC | ||
Its general partner | |||
Date: | November 7, 2018 | By: | /s/ D. ANDREW WOODWARD |
D. Andrew Woodward | |||
Vice President, Finance | |||
(Principal Financial Officer and Duly Authorized Signatory) | |||
September 30, 2018 | 53 | ||