Attached files
| file | filename |
|---|---|
| EX-31.2 - EXHIBIT 31.2 - ANDEAVOR LOGISTICS LP | andx3q201710-qex312.htm |
| EX-32.2 - EXHIBIT 32.2 - ANDEAVOR LOGISTICS LP | andx3q201710-qex322.htm |
| EX-32.1 - EXHIBIT 32.1 - ANDEAVOR LOGISTICS LP | andx3q201710-qex321.htm |
| EX-31.1 - EXHIBIT 31.1 - ANDEAVOR LOGISTICS LP | andx3q201710-qex311.htm |
UNITED STATES
SECURITIES AND EXCHANGE COMMISSION
Washington, D.C. 20549
FORM 10‑Q
(Mark One)
þ | QUARTERLY REPORT PURSUANT TO SECTION 13 OR 15(d) OF THE SECURITIES EXCHANGE ACT OF 1934 |
For the quarterly period ended September 30, 2017
or
o | TRANSITION REPORT PURSUANT TO SECTION 13 OR 15(d) OF THE SECURITIES EXCHANGE ACT OF 1934 |
For the transition period from______________to __________
Commission File Number 1‑35143
ANDEAVOR LOGISTICS LP
(Exact name of registrant as specified in its charter)
Delaware |  | 27‑4151603 |
(State or other jurisdiction of | (I.R.S. Employer | |
incorporation or organization) | Identification No.) | |
19100 Ridgewood Pkwy, San Antonio, Texas 78259-1828 | ||
(Address of principal executive offices) (Zip Code) | ||
210-626-6000 | ||
(Registrant’s telephone number, including area code) | ||
Indicate by check mark whether the registrant (1) has filed all reports required to be filed by Section 13 or 15(d) of the Securities Exchange Act of 1934 during the preceding 12 months (or for such shorter period that the registrant was required to file such reports), and (2) has been subject to such filing requirements for the past 90 days. Yes þ No o
Indicate by check mark whether the registrant has submitted electronically and posted on its corporate Web site, if any, every Interactive Data File required to be submitted and posted pursuant to Rule 405 of Regulation S-T (§232.405 of this chapter) during the preceding 12 months (or for such shorter period that the registrant was required to submit and post such files). Yes þ No o
Indicate by check mark whether the registrant is a large accelerated filer, an accelerated filer, a non-accelerated filer, or a smaller reporting company. See definitions of “large accelerated filer,” “accelerated filer” and “smaller reporting company” in Rule 12b-2 of the Exchange Act. (Check one):
Large accelerated filer | þ | Accelerated filer | o | |||
Non-accelerated filer | o (Do not check if a smaller reporting company) | Smaller reporting company | o | |||
Emerging growth company | o | |||||
If an emerging growth company, indicate by check mark if the registrant has elected not to use the extended transition period for complying with any new or revised financial accounting standards provided pursuant to Section 13(a) of the Exchange Act. o
Indicate by check mark whether the registrant is a shell company (as defined in Rule 12b-2 of the Exchange Act). Yes o No þ
There were 216,116,255 common units of the registrant outstanding at November 3, 2017.
TABLE OF CONTENTS | ||
ANDEAVOR LOGISTICS LP
QUARTERLY REPORT ON FORM 10-Q
FOR THE QUARTERLY PERIOD ENDED SEPTEMBER 30, 2017
PART I — FINANCIAL INFORMATION | |||
This Quarterly Report on Form 10-Q (including documents incorporated by reference herein) contains statements with respect to our expectations or beliefs as to future events. These types of statements are “forward-looking” and subject to uncertainties. See “Important Information Regarding Forward-Looking Statements” in Management’s Discussion and Analysis of Financial Condition and Results of Operations in Part I, Item 2.
2 | |  | ||
FINANCIAL STATEMENTS | |||
PART I - FINANCIAL INFORMATION
ITEM 1. | FINANCIAL STATEMENTS |
ANDEAVOR LOGISTICS LP
CONDENSED STATEMENTS OF CONSOLIDATED OPERATIONS
(Unaudited)
Three Months Ended September 30, | Nine Months Ended September 30, | ||||||||||||||
2017 | 2016 (a) | 2017 | 2016 (a) | ||||||||||||
(In millions, except per unit amounts) | |||||||||||||||
Revenues | |||||||||||||||
Affiliate | $ | 219 | $ | 184 | $ | 624 | $ | 521 | |||||||
Third-party | 225 | 124 | 653 | 380 | |||||||||||
Total Revenues | 444 | 308 | 1,277 | 901 | |||||||||||
Costs and Expenses | |||||||||||||||
NGL expense (excluding items shown separately below) | 64 | 1 | 179 | 2 | |||||||||||
Operating expenses | 141 | 106 | 399 | 322 | |||||||||||
General and administrative expenses | 27 | 25 | 78 | 71 | |||||||||||
Depreciation and amortization expenses | 60 | 47 | 178 | 139 | |||||||||||
(Gain) loss on asset disposals and impairments | 1 | 2 | (24 | ) | 3 | ||||||||||
Operating Income | 151 | 127 | 467 | 364 | |||||||||||
Interest and financing costs, net | (59 | ) | (49 | ) | (178 | ) | (138 | ) | |||||||
Equity in earnings of equity method investments | 2 | 3 | 7 | 10 | |||||||||||
Other income, net | 3 | — | 3 | 6 | |||||||||||
Net Earnings | $ | 97 | $ | 81 | $ | 299 | $ | 242 | |||||||
Loss attributable to Predecessors | $ | — | $ | 7 | $ | — | $ | 21 | |||||||
Net Earnings Attributable to Partners | 97 | 88 | 299 | 263 | |||||||||||
General partner’s interest in net earnings, including incentive distribution rights | — | (40 | ) | (79 | ) | (108 | ) | ||||||||
Limited Partners’ Interest in Net Earnings | $ | 97 | $ | 48 | $ | 220 | $ | 155 | |||||||
Net Earnings per Limited Partner Unit | |||||||||||||||
Common - basic | $ | 0.90 | $ | 0.46 | $ | 2.05 | $ | 1.58 | |||||||
Common - diluted | $ | 0.90 | $ | 0.46 | $ | 2.05 | $ | 1.58 | |||||||
Weighted Average Limited Partner Units Outstanding | |||||||||||||||
Common units - basic | 108.0 | 101.4 | 107.0 | 96.7 | |||||||||||
Common units - diluted | 108.1 | 101.4 | 107.1 | 96.8 | |||||||||||
Cash Distributions Paid Per Unit | $ | 0.971 | $ | 0.842 | $ | 2.821 | $ | 2.432 | |||||||
(a) | Adjusted to include the historical results of the Predecessors. See Note 1 for further discussion. |
The accompanying notes are an integral part of these condensed consolidated financial statements.
September 30, 2017 | 3 | ||
FINANCIAL STATEMENTS | ||
ANDEAVOR LOGISTICS LP
CONDENSED CONSOLIDATED BALANCE SHEETS
(Unaudited)
September 30, 2017 | December 31, 2016 | ||||||
(In millions, except unit amounts) | |||||||
ASSETS | |||||||
Current Assets | |||||||
Cash and cash equivalents | $ | 16 | $ | 688 | |||
Receivables, net of allowance for doubtful accounts | |||||||
Trade and other | 149 | 129 | |||||
Affiliate | 114 | 101 | |||||
Prepayments and other current assets | 17 | 20 | |||||
Total Current Assets | 296 | 938 | |||||
Property, Plant and Equipment, Net | 4,013 | 3,444 | |||||
Acquired Intangibles, Net | 1,038 | 947 | |||||
Equity Method Investments | 325 | 337 | |||||
Goodwill | 127 | 117 | |||||
Other Noncurrent Assets, Net | 65 | 77 | |||||
Total Assets | $ | 5,864 | $ | 5,860 | |||
LIABILITIES AND EQUITY | |||||||
Current Liabilities | |||||||
Accounts payable | |||||||
Trade | $ | 109 | $ | 69 | |||
Affiliate | 43 | 56 | |||||
Accrued interest and financing costs | 92 | 42 | |||||
Other current liabilities | 48 | 45 | |||||
Total Current Liabilities | 292 | 212 | |||||
Debt, Net of Unamortized Issuance Costs | 3,765 | 4,053 | |||||
Other Noncurrent Liabilities | 56 | 53 | |||||
Total Liabilities | 4,113 | 4,318 | |||||
Commitments and Contingencies (Note 6) | |||||||
Equity | |||||||
Common unitholders; 108,075,130 units issued and outstanding (102,981,495 in 2016) | 1,812 | 1,608 | |||||
General partner; 2,202,880 units issued and outstanding (2,100,900 in 2016) | (61 | ) | (66 | ) | |||
Total Equity | 1,751 | 1,542 | |||||
Total Liabilities and Equity | $ | 5,864 | $ | 5,860 | |||
The accompanying notes are an integral part of these condensed consolidated financial statements.
4 | | | ||
FINANCIAL STATEMENTS | |||
ANDEAVOR LOGISTICS LP
CONDENSED STATEMENTS OF CONSOLIDATED CASH FLOWS
(Unaudited)
Nine Months Ended September 30, | |||||||
2017 | 2016 (a) | ||||||
(In millions) | |||||||
Cash Flows From (Used In) Operating Activities | |||||||
Net earnings | $ | 299 | $ | 242 | |||
Adjustments to reconcile net earnings to net cash from operating activities: | |||||||
Depreciation and amortization expenses | 178 | 139 | |||||
(Gain) loss on asset disposals and impairments | (24 | ) | 3 | ||||
Other operating activities | 22 | 24 | |||||
Changes in current assets and liabilities | 56 | 11 | |||||
Changes in noncurrent assets and liabilities | (12 | ) | (5 | ) | |||
Net cash from operating activities | 519 | 414 | |||||
Cash Flows From (Used In) Investing Activities | |||||||
Capital expenditures | (132 | ) | (200 | ) | |||
Acquisitions | (673 | ) | (30 | ) | |||
Proceeds from sale of assets | 28 | (4 | ) | ||||
Net cash used in investing activities | (777 | ) | (234 | ) | |||
Cash Flows From (Used In) Financing Activities | |||||||
Borrowings under revolving credit agreements | 309 | 761 | |||||
Repayments under revolving credit agreements | (604 | ) | (666 | ) | |||
Proceeds from debt offering | — | 701 | |||||
Repayment of term loan facility | — | (250 | ) | ||||
Proceeds from issuance of common units, net of issuance costs | 284 | 364 | |||||
Proceeds from issuance of general partner units, net of issuance costs | 6 | — | |||||
Quarterly distributions to common unitholders | (300 | ) | (234 | ) | |||
Quarterly distributions to general partner | (127 | ) | (95 | ) | |||
Distributions in connection with acquisitions | (5 | ) | (400 | ) | |||
Financing costs | — | (18 | ) | ||||
Sponsor contributions of equity to the Predecessors | — | 113 | |||||
Capital contributions by affiliate | 24 | 21 | |||||
Other financing activities | (1 | ) | 4 | ||||
Net cash from (used in) financing activities | (414 | ) | 301 | ||||
Increase (Decrease) in Cash and Cash Equivalents | (672 | ) | 481 | ||||
Cash and Cash Equivalents, Beginning of Period | 688 | 16 | |||||
Cash and Cash Equivalents, End of Period | $ | 16 | $ | 497 | |||
(a) | Adjusted to include the historical results of the Predecessors. See Note 1 for further discussion. |
The accompanying notes are an integral part of these condensed consolidated financial statements.
September 30, 2017 | 5 | ||
NOTES TO CONDENSED CONSOLIDATED FINANCIAL STATEMENTS (UNAUDITED) | ||
NOTE 1 – ORGANIZATION AND BASIS OF PRESENTATION
ORGANIZATION
Effective August 1, 2017, Tesoro Logistics LP changed its name to Andeavor Logistics LP (“Andeavor Logistics” or the “Partnership”). Andeavor Logistics is a fee-based, growth-oriented Delaware limited partnership formed in December 2010 by Andeavor (formerly Tesoro Corporation) and its wholly-owned subsidiary, Tesoro Logistics GP, LLC (“TLGP”), our general partner, to own, operate, develop and acquire logistics assets. Unless the context otherwise requires, references in this report to “we,” “us,” “our,” or “ours” refer to Andeavor Logistics LP, one or more of its consolidated subsidiaries, or all of them taken as a whole. Unless the context otherwise requires, references in this report to “Andeavor” or our “Sponsor” refer collectively to Andeavor and any of its subsidiaries, other than Andeavor Logistics, its subsidiaries and its general partner.
Effective October 30, 2017, Andeavor Logistics closed its merger with Western Refining Logistics, LP (“WNRL”) (the “WNRL Merger”) exchanging all outstanding common units of WNRL with units of Andeavor Logistics, representing an equity value of $1.7 billion. See Note 2 for additional information regarding the WNRL Merger including the pro forma impact. WNRL public unitholders received 0.5233 units of Andeavor Logistics for each WNRL unit held while Andeavor effectively received 0.4639 units as certain units held by Andeavor’s subsidiaries were canceled in the transaction. The combined effective exchange ratio for the WNRL Merger was 0.4921 units of Andeavor Logistics for every unit of WNRL. Concurrently with the closing of the WNRL Merger, WNRL GP Merger Sub LLC, a direct, wholly-owned subsidiary of Andeavor Logistics merged with and into Western Refining Logistics GP, LLC (“WNRL General Partner”) with WNRL General Partner being the surviving entity and becoming a wholly-owned subsidiary of Andeavor Logistics. The WNRL Merger will have an impact on our segments as integration efforts are completed.
The closing of the WNRL Merger was conditioned upon, among other things, the adoption and effectiveness of the Second Amended and Restated Agreement of Limited Partnership of Andeavor Logistics LP, pursuant to which, simultaneously with the closing of the WNRL Merger: (i) the incentive distribution rights in Andeavor Logistics (the “IDRs”) held by TLGP were canceled (the “IDR Exchange”), (ii) the general partner interests in Andeavor Logistics held by TLGP were converted into a non-economic general partner interest in Andeavor Logistics (together with the IDR Exchange, the “IDR/GP Transaction”), and (iii) Andeavor and its affiliates, including TLGP, agreed to increase and extend existing waivers on distributions to Andeavor and its affiliates by $60 million to an aggregate of $160 million between 2017 and 2019. As consideration for the IDR/GP Transaction, TLGP was issued 78.0 million common units in Andeavor Logistics simultaneously with the closing of the WNRL Merger.
PRINCIPLES OF CONSOLIDATION AND BASIS OF PRESENTATION
PRINCIPLES OF CONSOLIDATION. Acquired assets from Andeavor, and the associated liabilities and results of operations, are collectively referred to as the “Predecessors.” See Note 1 of our Annual Report on Form 10-K for the year ended December 31, 2016 for additional information regarding the acquired assets from Andeavor. The accompanying condensed consolidated financial statements and related notes present the financial position, combined results of operations and combined cash flows of our Predecessors at historical cost. The financial statements of our Predecessors have been prepared from the separate records maintained by Andeavor and may not necessarily be indicative of the conditions that would have existed or the results of operations if our Predecessors had been operated as an unaffiliated entity. Our Predecessors did not record revenue for transactions with Andeavor and the expenses recognized were not material in the Terminalling and Transportation segment. The Partnership’s net cash from operating activities and net cash used in investing activities in the nine months ended September 30, 2016 include $15 million and $98 million, respectively, of cash used by our Predecessors, offset by sponsor contributions of equity to the Predecessors in net cash from financing activities.
The interim condensed consolidated financial statements and notes thereto have been prepared by management without audit according to the rules and regulations of the Securities and Exchange Commission (“SEC”) and reflect all adjustments that, in the opinion of management, are necessary for a fair presentation of results for the periods presented. Such adjustments are of a normal recurring nature, unless otherwise disclosed.
BASIS OF PRESENTATION. We prepare our condensed consolidated financial statements in conformity with accounting principles generally accepted in the United States of America (“U.S. GAAP”). However, certain information and notes normally included in financial statements prepared under U.S. GAAP have been condensed or omitted pursuant to the SEC’s rules and regulations. Management believes that the disclosures presented herein are adequate to present the information fairly. The accompanying interim condensed consolidated financial statements and notes should be read in conjunction with our Annual Report on Form 10-K for the year ended December 31, 2016.
6 | | | ||
NOTES TO CONDENSED CONSOLIDATED FINANCIAL STATEMENTS (UNAUDITED) | ||
We are required under U.S. GAAP to make estimates and assumptions that affect the amounts of assets and liabilities and revenues and expenses reported as of and during the periods presented. We review our estimates on an ongoing basis using currently available information. Changes in facts and circumstances may result in revised estimates, and actual results could differ from those estimates. The results of operations of the Partnership, or our Predecessors, for any interim period are not necessarily indicative of results for the full year. Certain reclassifications have been made to recast prior period presentations to conform to the current year. See Note 8 for further discussion of reclassifications.
COST CLASSIFICATIONS. Natural gas liquid (“NGL”) expense results from the gross presentation required for our percent of proceeds arrangements associated with the crude oil, natural gas and produced water gathering systems and two natural gas processing facilities acquired from Whiting Oil and Gas Corporation, GBK Investments, LLC and WBI Energy Midstream, LLC on January 1, 2017 (the “North Dakota Gathering and Processing Assets”).
Operating expenses is comprised of direct operating costs including costs incurred for direct labor, repairs and maintenance, outside services, chemicals and catalysts, utility costs, including the purchase of electricity and natural gas used by our facilities, property taxes, environmental compliance costs related to current period operations, rent expense and other direct operating expenses incurred in the provision of services.
Depreciation and amortization expenses consist of the depreciation and amortization of property, plant and equipment, deferred charges and intangible assets related to our operating segments along with our corporate operations. General and administrative expenses represent costs that are not directly or indirectly related to or otherwise are not allocated to our operations. NGL expense, direct operating expenses, and depreciation and amortization expenses recognized by our Terminalling and Transportation segment and Gathering and Processing segment (refer to amounts disclosed in Note 8) constitute costs of revenue as defined by U.S. GAAP.
FINANCIAL INSTRUMENTS
Financial instruments including cash and cash equivalents, receivables, accounts payable, and accrued liabilities are recorded at their carrying value. We believe the carrying value of these financial instruments approximates fair value. Our fair value assessment incorporates a variety of considerations, including:
• | the short term duration of the instruments (less than one percent for our trade receivables and approximately four percent of our trade payables have been outstanding for greater than 90 days); and |
• | the expected future insignificance of bad debt expense, which includes an evaluation of counterparty credit risk. |
The fair value of our senior notes is based on prices from recent trade activity and is categorized in level 2 of the fair value hierarchy. The borrowings under our amended secured revolving credit facility (the “Revolving Credit Facility”) and our secured dropdown credit facility (“Dropdown Credit Facility”), which include a variable interest rate, approximate fair value. The carrying value and fair value of our debt were approximately $3.8 billion and $4.0 billion as of September 30, 2017, respectively, and were approximately $4.1 billion and $4.3 billion at December 31, 2016, respectively. These carrying and fair values of our debt do not consider the unamortized issuance costs, which are netted against our total debt.
NEW ACCOUNTING STANDARDS AND DISCLOSURES
REVENUE RECOGNITION. In May 2014, the Financial Accounting Standards Board (“FASB”) issued Accounting Standards Update (“ASU”) 2014-09, “Revenue from Contracts with Customers” (“ASU 2014-09”), and has since amended the standard with ASU 2015-14, “Revenue From Contracts with Customers: Deferral of the Effective Date,” ASU 2016-08, ”Revenue From Contracts with Customers: Principal versus Agent Considerations (Reporting Revenue Gross versus Net),” ASU 2016-10, “Revenue From Contracts with Customers: Identifying Performance Obligations and Licensing,” and ASU 2016-12, “Revenue From Contracts with Customers: Narrow-Scope Improvements and Practical Expedients.” These standards replace existing revenue recognition rules with a single comprehensive model to use in accounting for revenue arising from contracts with customers. We are required to adopt ASU 2014-09 on January 1, 2018. We will transition to the new standard under the modified retrospective transition method, whereby a cumulative effect adjustment will be recognized upon adoption and the guidance will be applied prospectively.
We are progressing through our implementation plan and have substantially completed our assessment of expected impacts on our financial statements, business processes, accounting systems and controls. We are currently implementing changes to our processes and controls for impacted areas, and are also drafting the initial adoption disclosures and the new ongoing disclosure requirements. We do not expect the standard to have a material impact to the amount or timing of revenues recognized for substantially all of our revenue arrangements. However, we expect some impact on presentation and disclosures in our financial statements relating to contracts that include minimum volume commitments with claw back provisions and where revenue is based on percentage of gross proceeds or is in the form of non-cash consideration.
LEASES. In February 2016, the FASB issued ASU 2016-02, “Leases” (“ASU 2016-02”), which amends existing accounting standards for lease accounting and adds additional disclosures about leasing arrangements. Under the new guidance, lessees are required to recognize right-of-use assets and lease liabilities on the balance sheet for all leases with terms longer than 12 months. Leases will be classified as either a finance lease or operating lease with the classification affecting the pattern of expense recognition
September 30, 2017 | 7 | ||
NOTES TO CONDENSED CONSOLIDATED FINANCIAL STATEMENTS (UNAUDITED) | ||
in the income statement and presentation of cash flows in the statement of cash flows. ASU 2016-02 is effective for annual reporting periods beginning after December 15, 2018, and interim reporting periods within those annual reporting periods. Early adoption is permitted and modified retrospective application is required, however, we do not intend to early adopt the standard. While it is early in our assessment of the impacts from this standard, we expect the recognition of right-of-use assets and lease liabilities not currently reflected in our balance sheet could have a material impact on total assets and liabilities. Additionally, we expect the presentation changes required for amounts currently reflected in our statement of operations to impact certain financial statement line items. We cannot estimate the impact on our business processes, accounting systems, controls and financial statement disclosures due to the implementation of this standard given the preliminary stage of our assessment.
CREDIT LOSSES. In June 2016, the FASB issued ASU 2016-13, “Measurement of Credit Losses on Financial Instruments” (“ASU 2016-13”), which amends guidance on the impairment of financial instruments. The ASU requires the estimation of credit losses based on expected losses and provides for a simplified accounting model for purchased financial assets with credit deterioration. ASU 2016-13 is effective for annual reporting periods beginning after December 15, 2019, and interim reporting periods within those annual reporting periods. Early adoption is permitted for annual reporting periods beginning after December 15, 2018. While we are still evaluating the impact of ASU 2016-13, we do not expect the adoption of this standard to have a material impact on our financial statements.
DEFINITION OF A BUSINESS. In January 2017, the FASB issued ASU 2017-01, “Clarifying the Definition of a Business” (“ASU 2017-01”), which revises the definition of a business and assists in the evaluation of when a set of transferred assets and activities is a business. ASU 2017-01 is effective for interim and annual reporting periods beginning after December 15, 2017, and should be applied prospectively on or after the effective date. As permitted under ASU 2017-01, we have elected to early adopt this standard and will apply the new guidance to applicable transactions during and after the fourth quarter of 2017. We do not expect the adoption of this standard to have a material impact on our financial statements.
GOODWILL. In January 2017, the FASB issued ASU 2017-04, “Simplifying the Test for Goodwill Impairment” (“ASU 2017-04”), which eliminates the second step from the goodwill impairment test that required goodwill impairments to be measured as the amount that a reporting unit’s carrying amount of goodwill exceeded its implied fair value of goodwill. Instead, an entity can perform its annual, or interim, goodwill impairment test by comparing the fair value of a reporting unit with its carrying amount with any impairment being limited to the total amount of goodwill allocated to that reporting unit. ASU 2017-04 is effective for interim and annual reporting periods beginning after December 15, 2019 and should be applied on a prospective basis. As permitted under ASU 2017-04, we have elected to early adopt this standard for our 2017 goodwill impairment tests to be performed as of November 1, 2017. The adoption of this standard is not expected to have a material impact on our financial statements.
PENSION AND POSTRETIREMENT COSTS. In March 2017, the FASB issued ASU 2017-07, “Improving the Presentation of Net Periodic Pension Cost and Net Periodic Postretirement Benefit Cost” (“ASU 2017-07”), which requires the current service-cost component of net benefit costs to be presented similarly with other current compensation costs for related employees on the condensed statement of consolidated operations and stipulates that only the service cost component of net benefit cost is eligible for capitalization. Additionally, the Partnership will present other components of net benefit costs elsewhere on the condensed statement of consolidated operations since these costs are allocated to the Partnership’s financial statements by Andeavor. ASU 2017-07 is effective for interim and annual reporting periods beginning after December 15, 2017, with early adoption permitted in the first quarter of 2017 only. The amendments to the presentation of the condensed statement of consolidated operations in this update should be applied retrospectively while the change in capitalized benefit cost is to be applied prospectively. We have evaluated the impact of this standard on our financial statements and determined there will be no impact to net earnings, but it is expected to have an immaterial impact on other line items such as operating income. We did not elect to early adopt and will implement when the standard becomes effective.
NOTE 2 – ACQUISITIONS AND DIVESTITURES
NORTH DAKOTA GATHERING AND PROCESSING ASSETS
On January 1, 2017, the Partnership acquired the North Dakota Gathering and Processing Assets for total consideration of approximately $705 million, including payments for working capital amounts, funded with cash on-hand, which included borrowings under our Revolving Credit Facility. The North Dakota Gathering and Processing Assets include crude oil, natural gas, and produced water gathering pipelines, natural gas processing and fractionation capacity in the Sanish and Pronghorn fields of the Williston Basin in North Dakota. With this acquisition, we expanded the assets in our Gathering and Processing segment located in the Williston Basin area of North Dakota to further grow our integrated, full-service logistics capabilities in support of third-party demand for crude oil, natural gas and water gathering services as well as natural gas processing services. In addition, this acquisition increases our capacity and capabilities while extending our crude oil, natural gas and water gathering and associated gas processing footprint to enhance overall basin logistics efficiencies.
We accounted for the North Dakota Gathering and Processing Assets acquisition using the acquisition method of accounting, which requires, among other things, that assets acquired at their fair values and liabilities assumed be recognized on the balance sheet as of the acquisition date. The purchase price allocation for the North Dakota Gathering and Processing Assets acquisition is preliminary and has been allocated based on estimated fair values of the assets acquired and liabilities assumed at the acquisition
8 | | | ||
NOTES TO CONDENSED CONSOLIDATED FINANCIAL STATEMENTS (UNAUDITED) | ||
date, pending the completion of an independent valuation and other information as it becomes available to us. The purchase price allocation adjustments can be made through the end of Andeavor Logistics’ measurement period, which is not to exceed one year from the acquisition date. During the nine months ended September 30, 2017, we recorded adjustments to our preliminary allocation to increase property, plant and equipment and goodwill by $31 million and $4 million, respectively, and to reduce intangibles and inventory by $32 million and $3 million, respectively.
PRELIMINARY ACQUISITION DATE PURCHASE PRICE ALLOCATION (in millions)
Inventory | $ | 2 | |
Property, plant and equipment | 571 | ||
Intangibles (a) | 122 | ||
Goodwill (b) | 10 | ||
Total purchase price | $ | 705 | |
(a) | The intangibles consist of customer contracts with a weighted average amortization period of 10.6 years. Amortization of intangible assets for the three and nine months ended September 30, 2017 was $2 million and $9 million, respectively. |
(b) | We evaluated several factors that contributed to the amount of goodwill presented above. These factors include the geographic proximity of the acquired assets to existing assets owned by the Partnership along with the improved overall basin logistics efficiencies we can leverage. |
For the three and nine months ended September 30, 2017, we recognized $111 million and $307 million in revenues, respectively, and $16 million and $42 million of net earnings, respectively, related to the assets acquired. If the North Dakota Gathering and Processing Assets acquisition had been completed on January 1, 2016, our pro forma consolidated revenues and consolidated net earnings would have been $373 million and $100 million, respectively, for the three months ended September 30, 2016 and $1.1 billion and $277 million, respectively, for the nine months ended September 30, 2016.
WESTERN REFINING LOGISTICS, LP MERGER
Effective October 30, 2017, Andeavor Logistics completed the WNRL Merger at a purchase price of approximately $1.8 billion. The WNRL assets include logistic assets consisting of pipeline and gathering, terminalling, storage and transportation assets and provides services to Andeavor’s Refining segment. The majority of WNRL's logistics assets are integral to the operations of Andeavor’s El Paso, Gallup and St. Paul Park refineries. It also includes a wholesale business that operates primarily in the Southwest United States and includes the operations of several bulk petroleum distribution plants and a fleet of crude oil, asphalt and refined product delivery trucks. It distributes commercial wholesale petroleum products primarily in Arizona, Colorado, Nevada, New Mexico and Texas. See Note 1 for further discussion of the WNRL Merger.
Andeavor Logistics accounted for the WNRL Merger as a common control transaction and, accordingly, inherited Andeavor’s basis in WNRL’s net assets. Andeavor accounted for the acquisition of WNRL using the acquisition method of accounting, which requires, among other things, that assets acquired at their fair values and liabilities assumed be recognized on the balance sheet as of the acquisition date, or June 1, 2017, the date Andeavor acquired WNRL. However, we accounted for the WNRL Merger as a reorganization of entities under common control, which requires us to recognize the assets and liabilities acquired using Andeavor’s basis. The purchase price allocation for the WNRL Merger is preliminary and has been allocated based on estimated fair values of the assets acquired and liabilities assumed at the acquisition date, pending the completion of an independent valuation and other information as it becomes available to us. We expect that, as we obtain more information, the preliminary purchase price allocation disclosed below may change. The purchase price allocation adjustments can be made through the end of Andeavor’s measurement period, which is not to exceed one year from the acquisition date.
September 30, 2017 | 9 | ||
NOTES TO CONDENSED CONSOLIDATED FINANCIAL STATEMENTS (UNAUDITED) | ||
PRELIMINARY ACQUISITION DATE PURCHASE PRICE ALLOCATION (in millions)
Cash | $ | 22 | |
Receivables | 112 | ||
Inventories | 11 | ||
Prepayments and Other Current Assets | 6 | ||
Property, Plant and Equipment (a) | 1,301 | ||
Goodwill | 734 | ||
Acquired Intangibles | 130 | ||
Other Noncurrent Assets | 2 | ||
Accounts Payable | (167 | ) | |
Accrued Liabilities | (41 | ) | |
Debt | (347 | ) | |
Total purchase price | $ | 1,763 | |
(a) | Estimated useful lives ranging from 3 to 22 years have been assumed based on the preliminary valuation. |
GOODWILL. We evaluated several factors that contributed to the amount of goodwill presented above. These factors include the acquisition of a logistics business located in areas with access to cost-advantaged feedstocks with an assembled workforce that cannot be duplicated at the same costs by a new entrant. Further, the WNRL Merger provides a platform for future growth through operating efficiencies Andeavor Logistics expects to gain from the application of best practices across the combined company and an ability to realize synergies from the geographic diversification of Andeavor Logistics’ business and rationalization of general and administrative costs. The amount of goodwill by reportable segment is as follows: Terminalling and Transportation $67 million and Wholesale $667 million.
PROPERTY, PLANT AND EQUIPMENT. The fair value of property, plant and equipment is $1.3 billion. This preliminary fair value is based on a valuation using a combination of the income, cost and market approaches. The useful lives are based on similar assets at Andeavor Logistics.
ACQUIRED INTANGIBLE ASSETS. We estimated the fair value of the acquired identifiable intangible assets at $130 million. This fair value is based on a preliminary valuation completed for the business enterprise, along with the related tangible assets, using a combination of the income method, cost method and comparable market transactions. We recognized intangible assets associated with customer relationships of $130 million with third parties, all of which will be amortized on a straight-line basis over an estimated weighted average useful life of 15 years. The gross carrying value of our finite life intangibles acquired from the WNRL Merger was $130 million and the accumulated amortization was $3 million as of September 30, 2017. Amortization expense is expected to be approximately $9 million per year for the next five years. We have not yet finalized our valuation estimate and related evaluation of the useful lives; accordingly, future amortization of intangible assets related to customer relationships may be revised.
ACQUISITION COSTS. We recognized acquisition costs related to the WNRL Merger of $4 million in general and administrative expenses for both the three and nine months ended September 30, 2017. Additionally, WNRL recognized $5 million of acquisition costs for both the three and nine months ended September 30, 2017.
PRO FORMA FINANCIAL INFORMATION. The following unaudited pro forma information combines the historical operations of Andeavor Logistics and WNRL, giving effect to the merger and related transactions as if they had been consummated on January 1, 2016, the beginning of the earliest period presented.
10 | | | ||
NOTES TO CONDENSED CONSOLIDATED FINANCIAL STATEMENTS (UNAUDITED) | ||
PRO FORMA CONSOLIDATED REVENUES AND CONSOLIDATED NET EARNINGS (in millions)
Three Months Ended September 30, | Nine Months Ended September 30, | ||||||||||||||
2017 | 2016 | 2017 | 2016 | ||||||||||||
Revenues | $ | 1,086 | $ | 877 | $ | 3,148 | $ | 2,515 | |||||||
Net earnings (a) | 115 | 86 | 349 | 245 | |||||||||||
(a) | While many recurring adjustments impact the pro forma figures presented, the increase in pro forma net earnings compared to our net earnings presented on the condensed statements of consolidated operations for the nine months ended September 30, 2017 includes a significant non-recurring adjustment removing acquisition and integration costs from 2017 and reflects these costs in the first quarter of 2016, the period the acquisition was assumed to be completed for pro forma purposes. |
ANACORTES LOGISTICS ASSETS
On November 8, 2017, we announced our acquisition of logistics assets located in Anacortes, Washington (the “Anacortes Logistics Assets”) from a subsidiary of Andeavor for total consideration of $445 million. The Anacortes Logistics Assets include 3.9 million barrels of crude oil, feedstock and refined products storage at Andeavor’s Anacortes Refinery, the Anacortes marine terminal with approximately 73 thousand barrels per day of feedstock and refined product throughput, a manifest rail facility with approximately 4 thousand barrels of throughput and crude oil and refined products pipelines with approximately 111 thousand barrels per day of throughput combined. We paid $445 million, including $400 million of cash financed with borrowings on our revolving credit facilities and $45 million in common units issued to Andeavor. This acquisition was immaterial to our condensed consolidated financial statements.
DIVESTITURES
On June 2, 2017, due to Andeavor’s consent decree with the state of Alaska associated with certain terminalling and storage assets owned by Andeavor that we acquired in 2016 (the “Alaska Storage and Terminalling Assets”), Andeavor Logistics sold one of its existing Alaska products terminals (“Alaska Terminal”) for $28 million. The sale resulted in a $25 million gain on sale in our condensed statements of consolidated operations for the nine months ended September 30, 2017. The Alaska Terminal divestiture did not have an impact on our operations.
NOTE 3 – RELATED-PARTY TRANSACTIONS
AFFILIATE AGREEMENTS
The Partnership has various long-term, fee-based commercial agreements with Andeavor, under which we provide pipeline transportation, trucking, terminal distribution, and storage services to Andeavor. Andeavor typically commits to provide us with minimum monthly throughput volumes of crude oil and refined products. For the natural gas liquids that we handle under keep-whole agreements, the Partnership has a fee-based processing agreement with Andeavor which minimizes the impact of commodity price movements during the annual period subsequent to renegotiation of terms and pricing each year.
In addition, we have agreements for the provision of various general and administrative services by Andeavor. Under our partnership agreement, we are required to reimburse TLGP and its affiliates for all costs and expenses that they incur on our behalf for managing and controlling our business and operations. Except to the extent specified under our amended omnibus agreement (the “Amended Omnibus Agreement”) or our amended secondment agreement (the “Amended Secondment Agreement”), TLGP determines the amount of these expenses. The Amended Omnibus Agreement and the Amended Secondment Agreement were amended and restated in connection with the Alaska Storage and Terminalling Assets acquisition. Under the terms of the Amended Omnibus Agreement as of September 30, 2017, we are required to pay Andeavor an annual corporate services fee of $11 million for the provision of various centralized corporate services, including executive management, legal, accounting, treasury, human resources, health, safety and environmental, information technology, certain insurance coverage, administration and other corporate services. Andeavor charged the Partnership $6 million and $1 million pursuant to the Amended Secondment Agreement for the three months ended September 30, 2017 and 2016, respectively, and $16 million and $7 million for the nine months ended September 30, 2017 and 2016, respectively. Additionally, pursuant to the Amended Omnibus Agreement and Amended Secondment Agreement, we reimburse Andeavor for any direct costs actually incurred by Andeavor in providing other operational services with respect to certain of our other assets and operations. In conjunction with the WNRL Merger, certain agreements have been amended and are effective as of October 30, 2017.
September 30, 2017 | 11 | ||
NOTES TO CONDENSED CONSOLIDATED FINANCIAL STATEMENTS (UNAUDITED) | ||
SUMMARY OF AFFILIATE TRANSACTIONS
SUMMARY OF REVENUE AND EXPENSE TRANSACTIONS WITH ANDEAVOR, INCLUDING PREDECESSORS (in millions)
Three Months Ended September 30, | Nine Months Ended September 30, | ||||||||||||||
2017 | 2016 | 2017 | 2016 | ||||||||||||
Revenues (a) | $ | 219 | $ | 184 | $ | 624 | $ | 521 | |||||||
Operating expenses (b) | 32 | 38 | 109 | 107 | |||||||||||
General and administrative expenses | 20 | 19 | 58 | 52 | |||||||||||
(a) | Andeavor accounted for 49% and 60% of our total revenues for the three months ended September 30, 2017 and 2016, respectively, and 49% and 58% for the nine months ended September 30, 2017 and 2016, respectively. |
(b) | Net of reimbursements from Andeavor pursuant to the Amended Omnibus Agreement, the Carson Assets Indemnity Agreement and other affiliate agreements of $7 million and $3 million for the three months ended September 30, 2017 and 2016, respectively, and $12 million for both the nine months ended September 30, 2017 and 2016. |
DISTRIBUTIONS. In accordance with our partnership agreement, the unitholders of our common and general partner interests are entitled to receive quarterly distributions of available cash. During the nine months ended September 30, 2017, we paid quarterly cash distributions of $223 million to Andeavor and TLGP, including IDRs. On October 18, 2017, we declared a quarterly cash distribution of $0.9852 per unit, which will be paid on November 14, 2017. The distribution will include payments of $125 million to Andeavor and TLGP.
NOTE 4 – PROPERTY, PLANT AND EQUIPMENT
PROPERTY, PLANT AND EQUIPMENT BY SEGMENT (in millions)
September 30, 2017 | December 31, 2016 | ||||||
Terminalling and Transportation | $ | 2,146 | $ | 2,076 | |||
Gathering and Processing | 2,617 | 1,983 | |||||
Property, Plant and Equipment, at Cost | 4,763 | 4,059 | |||||
Accumulated depreciation | (750 | ) | (615 | ) | |||
Property, Plant and Equipment, Net | $ | 4,013 | $ | 3,444 | |||
NOTE 5 – DEBT
DEBT BALANCE, NET OF UNAMORTIZED ISSUANCE COSTS (in millions)
September 30, 2017 | December 31, 2016 | ||||||
Total debt | $ | 3,814 | $ | 4,109 | |||
Unamortized issuance costs | (48 | ) | (55 | ) | |||
Current maturities | (1 | ) | (1 | ) | |||
Debt, Net of Current Maturities and Unamortized Issuance Costs | $ | 3,765 | $ | 4,053 | |||
12 | | | ||
NOTES TO CONDENSED CONSOLIDATED FINANCIAL STATEMENTS (UNAUDITED) | ||
AVAILABLE CAPACITY UNDER CREDIT FACILITIES (in millions)
Total Capacity | Amount Borrowed as of September 30, 2017 | Outstanding Letters of Credit | Available Capacity as of September 30, 2017 | Expiration | |||||||||||||
Andeavor Logistics Revolving Credit Facility (a) | $ | 600 | $ | 35 | $ | — | $ | 565 | January 29, 2021 | ||||||||
Andeavor Logistics Dropdown Credit Facility | 1,000 | — | — | 1,000 | January 29, 2021 | ||||||||||||
Total Credit Facilities (b) | $ | 1,600 | $ | 35 | $ | — | $ | 1,565 | |||||||||
(a) | The weighted average interest rate for borrowings under our Revolving Credit Facility was 3.49% at September 30, 2017. |
(b) | We are allowed to request that the loan availability be increased up to an aggregate of $2.1 billion, subject to receiving increased commitments from the lenders. |
NOTE 6 – COMMITMENTS AND CONTINGENCIES
CONTINGENCIES
In the ordinary course of business, we may become party to lawsuits, administrative proceedings and governmental investigations, including environmental, regulatory and other matters. The outcome of these matters cannot always be predicted accurately, but we will accrue liabilities for these matters if the amount is probable and can be reasonably estimated. Other than as described below, in Part II, Item 1 of this Report, in our Annual Report on Form 10-K for the year ended December 31, 2016 or in our Quarterly Reports on Form 10-Q for the quarters ended March 31, 2017 and June 30, 2017, we do not have any other material outstanding lawsuits, administrative proceedings or governmental investigations.
TIOGA, NORTH DAKOTA CRUDE OIL PIPELINE RELEASE. In September 2013, the Partnership responded to the release of crude oil in a rural field northeast of Tioga, North Dakota (the “Crude Oil Pipeline Release”). In February 2017, we settled the Notice of Violation issued in March 2015 by the North Dakota Department of Health (“NDDOH”). The NDDOH had alleged violations of water pollution regulations as a result of the Crude Oil Pipeline Release. During the third quarter of 2017, we recognized an incremental charge of $19 million to amounts previously recognized for estimated costs to complete our remediation and closure activities along with long-term monitoring. The ultimate resolution of the matter is not expected to have a material impact on our liquidity, financial position, or results of operations.
NOTE 7 – EQUITY AND NET EARNINGS PER UNIT
We had 74,020,088 of publicly held outstanding common units as of September 30, 2017. Additionally, Andeavor owned 34,055,042 of our common units and 2,202,880 of our general partner units (the 2% general partner interest) as of September 30, 2017, which together constitutes a 33% ownership interest in us.
CHANGE IN THE CARRYING AMOUNT OF OUR EQUITY (in millions)
Partnership | Total | ||||||||||
Common | General Partner | ||||||||||
Balance at December 31, 2016 | $ | 1,608 | $ | (66 | ) | $ | 1,542 | ||||
Proceeds from issuance of units, net of issuance costs | 281 | 6 | 287 | ||||||||
Distributions to unitholders and general partner (a) | (300 | ) | (127 | ) | (427 | ) | |||||
Net earnings attributable to partners (b) | 180 | 119 | 299 | ||||||||
Contributions (c) | 39 | 2 | 41 | ||||||||
Equity offering under ATM Program, net of issuance costs | 3 | — | 3 | ||||||||
Other | 1 | 5 | 6 | ||||||||
Balance at September 30, 2017 | $ | 1,812 | $ | (61 | ) | $ | 1,751 | ||||
(a) | Represents cash distributions declared and paid during the nine months ended September 30, 2017, relating to the fourth quarter of 2016 through the second quarter of 2017. |
(b) | See reconciliation of general partner and limited partner’s earnings to amounts recorded to equity for the periods presented. |
September 30, 2017 | 13 | ||
NOTES TO CONDENSED CONSOLIDATED FINANCIAL STATEMENTS (UNAUDITED) | ||
(c) | Includes Andeavor and TLGP contributions to the Partnership primarily related to reimbursements for capital spending pursuant predominantly to the Amended Omnibus Agreement and the Carson Assets Indemnity Agreement. |
UNIT ISSUANCE. We closed a registered public offering of 5,000,000 common units representing limited partner interests at a public offering price of $56.19 per unit on February 27, 2017. The net proceeds of $281 million were used to repay borrowings outstanding under our Revolving Credit Facility and for general partnership purposes. Also, general partner units of 101,980 were issued for proceeds of $6 million.
Furthermore, in connection with the WNRL Merger, we issued 15,182,996 publicly held common units and 14,853,542 common units to subsidiaries of Andeavor. In addition, on October 30, 2017, we issued 78.0 million of our common units to TLGP in connection with the IDR/GP Transaction and converted our general partner units into non-economic general partner units. As a result, after giving effect to the WNRL Merger and IDR/GP Transaction, we had 89,203,084 of publicly held outstanding common units and 126,908,584 outstanding common units held by Andeavor, which constituted an approximate 59% ownership interest in us as of October 30, 2017.
ATM PROGRAM. On August 22, 2017, we filed a prospectus supplement to our shelf registration filed with the SEC on August 21, 2015, authorizing the continuous issuance of up to an aggregate of $750 million of common units, in amounts, at prices and on terms to be determined by market conditions and other factors at the time of our offerings (such continuous offering program, or at-the-market program, referred to as our “ATM Program”). During both the three and nine months ended September 30, 2017, we issued an aggregate of 72,857 common units under our ATM Program, generating proceeds of approximately $3 million before issuance costs. The net proceeds from sales under the ATM Program will be used for general partnership purposes, which may include debt repayment, future acquisitions, capital expenditures and additions to working capital.
CASH DISTRIBUTIONS
Our partnership agreement, as amended, sets forth the calculation to be used to determine the amount and priority of cash distributions that the limited partner unitholders and general partner will receive.
QUARTERLY DISTRIBUTIONS
Quarter Ended | Quarterly Distribution Per Unit | Total Cash Distribution including general partner IDRs (in millions) | Date of Distribution | Unitholders Record Date | |||||||
December 31, 2016 | $ | 0.9100 | $ | 140 | February 14, 2017 | February 3, 2017 | |||||
March 31, 2017 (a) | 0.9400 | 140 | May 15, 2017 | May 5, 2017 | |||||||
June 30, 2017 (a) | 0.9710 | 147 | August 14, 2017 | August 4, 2017 | |||||||
September 30, 2017 (a)(b) | 0.9852 | 201 | November 14, 2017 | November 3, 2017 | |||||||
(a) | This distribution is net of $12.5 million waived by TLGP on either IDRs or common units for each of the three months ended September 30, 2017, June 30, 2017, and March 31, 2017. |
(b) | This distribution was declared on October 18, 2017 and will be paid on the date of distribution. |
NET EARNINGS PER UNIT
Prior to the three months ended September 30, 2017, we used the two-class method when calculating the net earnings per unit applicable to limited partners, because we had more than one participating security consisting of limited partner common units, general partner units and IDRs. Net earnings earned by the Partnership were allocated between the limited and general partners in accordance with our partnership agreement through June 30, 2017. We based our calculation of net earnings per limited partner common unit on the weighted average number of common limited partner units outstanding during the period. However, as a result of the IDR/GP Transaction that occurred on October 30, 2017, our general partner and its IDRs no longer participated in earnings or distributions for the three months ended September 30, 2017. All distributions, earnings, and allocations of distributions less than or greater than earnings related to the three months ended September 30, 2017 have been attributed to limited partner common units in existence as of November 3, 2017.
14 | | | ||
NOTES TO CONDENSED CONSOLIDATED FINANCIAL STATEMENTS (UNAUDITED) | ||
NET EARNINGS PER UNIT (in millions, except per unit amounts)
Three Months Ended September 30, | Nine Months Ended September 30, | ||||||||||||||
2017 | 2016 | 2017 | 2016 | ||||||||||||
Net earnings | $ | 97 | $ | 81 | $ | 299 | $ | 242 | |||||||
Special allocations of net earnings (“Special Allocations”) (a) | — | 2 | 1 | 2 | |||||||||||
Net earnings, including Special Allocations | 97 | 83 | 300 | 244 | |||||||||||
General partner’s distributions | — | (3 | ) | (6 | ) | (7 | ) | ||||||||
General partner’s IDRs (b) | — | (39 | ) | (75 | ) | (105 | ) | ||||||||
Limited partners’ distributions on common units | (201 | ) | (89 | ) | (407 | ) | (250 | ) | |||||||
Distributions greater than earnings | $ | (104 | ) | $ | (48 | ) | $ | (188 | ) | $ | (118 | ) | |||
General partner’s earnings: | |||||||||||||||
Distributions | $ | — | $ | 3 | $ | 6 | $ | 7 | |||||||
General partner’s IDRs (b) | — | 39 | 75 | 105 | |||||||||||
Allocation of distributions greater than earnings (c) | — | (8 | ) | (2 | ) | (23 | ) | ||||||||
Total general partner’s earnings | $ | — | $ | 34 | $ | 79 | $ | 89 | |||||||
Limited partners’ earnings on common units: | |||||||||||||||
Distributions (d) | $ | 201 | $ | 89 | $ | 407 | $ | 250 | |||||||
Special Allocations (a) | — | (2 | ) | (1 | ) | (2 | ) | ||||||||
Allocation of distributions greater than earnings | (104 | ) | (40 | ) | (186 | ) | (95 | ) | |||||||
Total limited partners’ earnings on common units | $ | 97 | $ | 47 | $ | 220 | $ | 153 | |||||||
Weighted average limited partner units outstanding: | |||||||||||||||
Common units - basic | 108.0 | 101.4 | 107.0 | 96.7 | |||||||||||
Common units - diluted (e) | 108.1 | 101.4 | 107.1 | 96.8 | |||||||||||
Net earnings per limited partner unit: | |||||||||||||||
Common - basic | $ | 0.90 | $ | 0.46 | $ | 2.05 | $ | 1.58 | |||||||
Common - diluted | $ | 0.90 | $ | 0.46 | $ | 2.05 | $ | 1.58 | |||||||
(a) | Normal allocations according to percentage interests are made after giving effect, if any, to priority income allocations in an amount equal to incentive cash distributions fully allocated to the general partner and any special allocations. The adjustment reflects the special allocation to common units held by TLGP for the interest incurred in connection with borrowings on the Dropdown Credit Facility in lieu of using all cash on hand to fund the Alaska Storage and Terminalling Assets acquisition. |
(b) | IDRs entitled the general partner to receive increasing percentages, up to 50%, of quarterly distributions in excess of $0.3881 per unit per quarter. The amount above reflects earnings distributed to our general partner net of $38 million of IDRs waived by TLGP for the nine months ended September 30, 2017, respectively. See Note 11 of our Annual Report on Form 10-K for the year ended December 31, 2016 and Note 1 for further discussion related to IDRs. |
(c) | We have revised the historical allocation of general partner earnings to include the Predecessors’ losses of $7 million and $21 million for the three and nine months ended September 30, 2016, respectively. There were no Predecessor losses for the three and nine months ended September 30, 2017. |
(d) | Distributions of earnings for limited partners’ common units is net of a $12.5 million waiver from Andeavor in connection with the WNRL Merger for the three and nine months ended September 30, 2017. |
(e) | Diluted net earnings per unit include the effects of potentially dilutive units on our common units, which consist of unvested service and performance phantom units. |
September 30, 2017 | 15 | ||
NOTES TO CONDENSED CONSOLIDATED FINANCIAL STATEMENTS (UNAUDITED) | ||
RECONCILIATION OF GENERAL AND LIMITED PARTNER EARNINGS TO AMOUNTS RECOGNIZED IN EQUITY (in millions)
Three Months Ended September 30, | Nine Months Ended September 30, | ||||||||||||||
2017 | 2016 | 2017 | 2016 | ||||||||||||
Total general partner’s earnings | $ | — | $ | 34 | $ | 79 | $ | 89 | |||||||
Impact of general partner units and IDRs (a) | 40 | — | 40 | — | |||||||||||
Net earnings attributed to general partner equity | $ | 40 | $ | 34 | $ | 119 | $ | 89 | |||||||
Total limited partners’ earnings on common units | $ | 97 | $ | 47 | $ | 220 | $ | 153 | |||||||
Impact of general partner units and IDRs (a) | (40 | ) | — | (40 | ) | — | |||||||||
Net earnings attributed to limited partners’ equity | $ | 57 | $ | 47 | $ | 180 | $ | 153 | |||||||
(a) | Total general partner earnings and limited partner earnings on common units for the three and nine months ended September 30, 2017 differ from the amounts recognized in equity as of September 30, 2017. The table above reconciles general and limited earnings calculated using the ownership structure in place after the WNRL Merger and IDR/GP Transaction to amounts recorded to equity as of September 30, 2017 by showing the earnings that were allocated to the general partner’s capital account based on the ownership structure in place for three months ended September 30, 2017. |
NOTE 8 – OPERATING SEGMENTS
We changed our operating segment presentation in the first quarter of 2017 to reflect our expanded gathering and processing assets and operations and how our chief operating decision maker (“CODM”) manages our business. With the completion of the North Dakota Gathering and Processing Assets acquisition on January 1, 2017, our gathering and processing assets and operations expanded significantly and enhanced our ability to offer integrated gathering and processing services to our customers. Given the business’s focus on providing integrated services along with the revised reporting structure implemented by management to assess performance and make resource allocation decisions, we have determined our operating segments, which are the same for reporting purposes, are the (i) Terminalling and Transportation segment and (ii) Gathering and Processing segment. No changes were deemed necessary to our Terminalling and Transportation segment. Comparable prior period information for the newly presented Gathering and Processing segment has been recast to reflect our current presentation.
In addition, as part of the CODM’s reevaluation of how it monitors and evaluates the business and allocates resources, management revised its methodology for the allocation of corporate general and administrative expenses which resulted in additional corporate costs being allocated to our Gathering and Processing segment for certain administrative activities associated with our gathering and processing business in the Rockies region. The change to our Terminalling and Transportation segment was not material. Comparable prior period segment information has been recast to reflect our revised allocation methodology.
Our Terminalling and Transportation segment consists of crude oil and refined products terminals and marine terminals, storage facilities for crude oil, refined products and petroleum coke handling, rail-car unloading facilities and pipelines, which transport products and crude oil. Our Gathering and Processing segment consists of crude oil, natural gas and produced water gathering systems and natural gas processing assets in the Bakken Shale/Williston Basin area of North Dakota and Montana and the Green River Basin, Uinta Basin and Vermillion Basin in the states of Utah, Colorado and Wyoming as well as gas processing complexes and fractionation facilities.
Our revenues are generated from commercial contracts we have entered into with Andeavor and with third-party contracts under which we are paid fees for gathering crude oil, natural gas and produced water, processing natural gas and distributing, transporting and storing crude oil, refined products, natural gas and natural gas liquids. The commercial agreements with Andeavor are described in Note 3 to our Annual Report on Form 10-K for the year ended December 31, 2016. We do not have any foreign operations.
Our operating segments are strategic business units that offer different services in various geographical locations. We evaluate the performance of each segment based on its respective operating income. Certain general and administrative expenses and interest and financing costs are excluded from segment operating income as they are not directly attributable to a specific operating segment. Identifiable assets are those used by the segment, whereas other assets are principally cash, deposits and other assets that are not associated with a specific operating segment.
16 | | | ||
NOTES TO CONDENSED CONSOLIDATED FINANCIAL STATEMENTS (UNAUDITED) | ||
SEGMENT INFORMATION (in millions)
Three Months Ended September 30, | Nine Months Ended September 30, | ||||||||||||||
2017 | 2016 | 2017 | 2016 | ||||||||||||
Revenues | |||||||||||||||
Terminalling and Transportation: | |||||||||||||||
Terminalling | $ | 155 | $ | 125 | $ | 447 | $ | 345 | |||||||
Pipeline transportation | 34 | 32 | 97 | 93 | |||||||||||
Total Terminalling and Transportation | 189 | 157 | 544 | 438 | |||||||||||
Gathering and Processing: | |||||||||||||||
NGL sales | 90 | 24 | 254 | 78 | |||||||||||
Gas gathering and processing | 85 | 67 | 252 | 198 | |||||||||||
Crude oil and water gathering | 43 | 33 | 116 | 100 | |||||||||||
Pass-thru and other | 37 | 27 | 111 | 87 | |||||||||||
Total Gathering and Processing | 255 | 151 | 733 | 463 | |||||||||||
Total Segment Revenues | $ | 444 | $ | 308 | $ | 1,277 | $ | 901 | |||||||
Segment Operating Income | |||||||||||||||
Terminalling and Transportation | $ | 110 | $ | 80 | $ | 329 | $ | 211 | |||||||
Gathering and Processing | 47 | 54 | 160 | 173 | |||||||||||
Total Segment Operating Income | 157 | 134 | 489 | 384 | |||||||||||
Unallocated general and administrative expenses | (6 | ) | (7 | ) | (22 | ) | (20 | ) | |||||||
Interest and financing costs, net | (59 | ) | (49 | ) | (178 | ) | (138 | ) | |||||||
Equity in earnings of equity method investments | 2 | 3 | 7 | 10 | |||||||||||
Other income, net | 3 | — | 3 | 6 | |||||||||||
Net Earnings | $ | 97 | $ | 81 | $ | 299 | $ | 242 | |||||||
Capital Expenditures | |||||||||||||||
Terminalling and Transportation | $ | 26 | $ | 38 | $ | 77 | $ | 99 | |||||||
Gathering and Processing | 25 | 23 | 64 | 82 | |||||||||||
Total Capital Expenditures | $ | 51 | $ | 61 | $ | 141 | $ | 181 | |||||||
TOTAL IDENTIFIABLE ASSETS BY OPERATING SEGMENT (in millions)
September 30, 2017 | December 31, 2016 | ||||||
Identifiable Assets | |||||||
Terminalling and Transportation | $ | 1,795 | $ | 1,768 | |||
Gathering and Processing | 4,048 | 3,392 | |||||
Other (a) | 21 | 700 | |||||
Total Identifiable Assets | $ | 5,864 | $ | 5,860 | |||
(a) | Other consists mainly of $688 million in cash and cash equivalents as of December 31, 2016, of which $673 million was used to fund the acquisition of the North Dakota Gathering and Processing Assets on January 1, 2017, increasing the Gathering and Processing segment’s identifiable assets as of September 30, 2017. |
September 30, 2017 | 17 | ||
MANAGEMENT’S DISCUSSION AND ANALYSIS | ||
ITEM 2. | MANAGEMENT’S DISCUSSION AND ANALYSIS OF FINANCIAL CONDITION AND RESULTS OF OPERATIONS |
Unless the context otherwise requires, references in this report to “Andeavor Logistics LP,” “Andeavor Logistics,” “the Partnership,” “we,” “us” or “our” refer to Andeavor Logistics LP, one or more of its consolidated subsidiaries or all of them taken as a whole. Unless the context otherwise requires, references in this report to Andeavor refer collectively to Andeavor and any of its subsidiaries, other than Andeavor Logistics, its subsidiaries and its general partner. Unless the context otherwise requires, references in this report to “Predecessors” refer collectively to the acquired assets from Andeavor, and those assets, liabilities and results of operations.
Those statements in this section that are not historical in nature should be deemed forward-looking statements that are inherently uncertain. See “Important Information Regarding Forward-Looking Statements” section for a discussion of the factors that could cause actual results to differ materially from those projected in these statements.
This section should be read in conjunction with our Annual Report on Form 10-K for the year ended December 31, 2016.
BUSINESS STRATEGY AND OVERVIEW
OVERVIEW
We are a leading full-service logistics company operating primarily in the western and mid-continent regions of the United States. We own and operate networks of crude oil, refined products and natural gas pipelines, terminals with dedicated and non-dedicated storage capacity for crude oil and refined products, rail facilities with loading and offloading capabilities, marine terminals, a trucking fleet and natural gas processing and fractionation complexes. We are a fee-based, growth oriented Delaware limited partnership formed by Andeavor and are headquartered in San Antonio, Texas. Our assets are categorized into a Terminalling and Transportation segment and Gathering and Processing segment. Approximately 49% of our total revenues for both the three and nine months ended September 30, 2017 were derived from Andeavor under various long-term, fee-based commercial agreements, the majority of which include minimum volume commitments.
We drive revenues and earnings growth by charging fees for terminalling, transporting and storing crude oil and refined products as well as fees for gathering crude oil and produced water, gathering and processing natural gas. We do not engage in the trading of crude oil, natural gas, natural gas liquids (“NGLs”) or refined products; therefore, we have minimal direct exposure to risks associated with commodity price fluctuations as part of our normal operations. However, as part of our acquisition of gathering systems and processing facilities from Whiting Oil and Gas Corporation, GBK Investments, LLC and WBI Energy Midstream, LLC (“North Dakota Gathering and Processing Assets”), we acquired certain natural gas gathering and processing contracts structured as Percent of Proceeds (“POP”) arrangements. Under these POP arrangements, we gather and process the producers’ natural gas and market the natural gas and NGLs (“Equity NGLs”) and return the majority
of the proceeds to the producer. Under these arrangements, we have exposure to fluctuations in commodity prices; however,
this exposure is not expected to be material to our results of operations. The revenue and costs associated with these POP arrangements are reported gross on our financial statements. Also, we may be subject to nominal commodity risk exposure due to pipeline loss allowance provisions in many of our pipeline gathering and transportation contracts and a nominal amount of condensate retained as part of our natural gas gathering services. In the event actual measured pipeline losses are less than the loss allowance, we are able to sell the crude oil at market prices; correspondingly, when actual losses exceed loss allowances, we purchase crude oil at market prices. For the NGLs that we handle under keep-whole agreements, also included in Equity NGLs, the Partnership has a fee-based processing agreement with Andeavor, which minimizes the impact of commodity price movements during the annual period subsequent to renegotiation of terms and pricing. See Item 3 for additional discussion regarding our market risk.
Effective October 30, 2017, we completed our merger with Western Refining Logistics, LP (“WNRL”) exchanging all outstanding common units of WNRL with units of Andeavor Logistics (the “WNRL Merger”). WNRL’s assets include terminals, storage tanks, pipelines and other logistics assets related to the terminalling, transportation, storage and distribution of crude oil, refined products and asphalt. WNRL’s assets and operations include 705 miles of pipelines, approximately 12.4 million barrels of active storage capacity, distribution of wholesale petroleum products and crude oil and asphalt trucking. This acquisition along with the associated infrastructure and Andeavor’s refining and commercial capabilities well positions us to pursue organic growth opportunities across our combined geographic footprint including the Midland and Delaware Basins of West Texas.
18 | | | ||
MANAGEMENT’S DISCUSSION AND ANALYSIS | ||
BUSINESS STRATEGY AND GOALS
Our primary business objectives are to maintain stable cash flows and to increase our quarterly cash distribution per unit over time. We have been implementing our strategy and goals discussed above, allowing us to increase our distributions by 13% over the last year. We intend to accomplish these objectives by executing the following strategies:
Growing a stable, fee-based business that provides a competitive, full-service logistics offering to customers | |||
Optimizing Existing Asset Base | ● Operating an incident free workplace ● Improving operational efficiency and maximizing asset utilization ● Expanding third-party business; delivering extraordinary customer service | ||
Pursuing Organic Expansion Opportunities | ● Identifying and executing low-risk, high-return growth projects ● Investing to capture the full commercial value of logistics assets ● Growing asset capability to support Andeavor value chain optimization | ||
Growing through Third-Party Acquisitions | ● Pursuing assets and businesses in strategic U.S. geographies that support an integrated business model, delivering synergies and growth ● Focusing on high quality assets that provide stable, fee-based income and enhancing organizational capacity | ||
Growing through Andeavor Strategic Expansion | ● Strategically partnering with Andeavor on acquisitions in refining and marketing value chains ● Capturing full value of Andeavor’s embedded logistics assets | ||
Relative to these goals, in 2017, we intend to continue implementing this strategy and have completed or announced plans to expand our Terminalling and Transportation business across the western U.S. through:
• | increasing our terminalling volumes by expanding capacity and growing our third-party services at certain of our terminals; |
• | optimizing Andeavor volumes and growing third-party throughput at our Terminalling and Transportation assets; |
• | completing the WNRL Merger; and |
• | pursuing strategic assets in the western U.S. |
In addition, we have completed or announced plans to grow our assets on our Gathering and Processing segment in support of third-party demand for crude oil, natural gas and water gathering services, natural gas processing services, as well as serving Andeavor’s demand for Bakken crude oil in the mid-continent and west coast refining systems, including:
• | further expanding capacity and capabilities as well as adding new origin and destination points for our common carrier pipelines in North Dakota and Montana; |
• | expanding our crude oil, natural gas and water gathering and associated gas processing footprint in the Bakken Shale/Williston Basin area of North Dakota and Montana (the “Bakken Region”) to enhance and improve overall basin logistics efficiencies; |
• | increasing compression on our natural gas gathering systems in the Green River and Vermillion basins to enhance natural gas volumes recovered from existing wells and support potential new drilling activity; |
• | expanding our gathering footprint and increase compression capabilities in the Uinta basin to increase volumes on our gathering systems and through our processing assets; |
• | completing the WNRL Merger to expand our geographic footprint in the Permian Basin, principally in the Delaware basin where Andeavor has a strong logistics asset base, crude oil marketing capabilities and meaningful refining offtake; and |
• | pursuing strategic assets across the western U.S. including potential acquisitions from Andeavor. |
ACQUISITIONS
NORTH DAKOTA GATHERING AND PROCESSING ASSETS. On January 1, 2017, we acquired the North Dakota Gathering and Processing Assets for total consideration of approximately $705 million, including payments for working capital adjustments, funded with cash on-hand, which included borrowings under our secured revolving credit facility (the “Revolving Credit Facility”). The North Dakota Gathering and Processing Assets include crude oil, natural gas, and produced water gathering pipelines, natural gas processing capacity and fractionation capacity in the Sanish and Pronghorn fields of the Williston Basin in North Dakota. With this acquisition, we expanded the assets in our Gathering and Processing segment located in the Williston Basin area of North Dakota to further grow our integrated, full-service logistics capabilities in support of third-party demand for crude oil, natural gas and water gathering services as well as natural gas processing services. In addition, this increases our capacity and capabilities while
September 30, 2017 | 19 | ||
MANAGEMENT’S DISCUSSION AND ANALYSIS | ||
extending our crude oil, natural gas and water gathering and associated gas processing footprint to enhance overall basin logistics efficiencies.
WESTERN REFINING LOGISTICS, LP. Effective October 30, 2017, Andeavor Logistics closed the WNRL Merger exchanging all outstanding common units of WNRL with units of Andeavor Logistics. WNRL public unitholders received 0.5233 units of Andeavor Logistics for each WNRL unit held while Andeavor effectively received 0.4639 units as certain units held by Andeavor’s subsidiaries were canceled in the transaction. The combined effective exchange ratio for the WNRL Merger was 0.4921 units of Andeavor Logistics for every unit of WNRL. Concurrently with the closing of the WNRL Merger, WNRL GP Merger Sub LLC, a direct, wholly-owned subsidiary of Andeavor Logistics merged with and into Western Refining Logistics GP, LLC (“WNRL General Partner”) with WNRL General Partner being the surviving entity and becoming a wholly-owned subsidiary of Andeavor Logistics.
The closing of the WNRL Merger was conditioned upon, among other things, the adoption and effectiveness of the Second Amended and Restated Agreement of Limited Partnership of Andeavor Logistics LP, pursuant to which, simultaneously with the closing of the WNRL Merger: (i) the incentive distribution rights in Andeavor Logistics (the “IDRs”) were canceled (the “IDR Exchange”), (ii) the general partner interests in Andeavor Logistics held by Tesoro Logistics GP, LLC (“TLGP”) were converted into a non-economic general partner interest in Andeavor Logistics (together with the IDR Exchange, the “IDR/GP Transaction”), and (iii) Andeavor and its affiliates, including TLGP, agreed to increase and extend existing waivers on distributions to Andeavor and its affiliates by $60 million to an aggregate of $160 million between 2017 and 2019. As consideration for the IDR/GP Transaction, TLGP was issued 78.0 million common units in Andeavor Logistics simultaneously with the closing of the WNRL Merger.
ANACORTES LOGISTICS ASSETS. On November 8, 2017, we announced our acquisition of logistics assets located in Anacortes, Washington (the “Anacortes Logistics Assets”) from a subsidiary of Andeavor for total consideration of $445 million. The Anacortes Logistics Assets include 3.9 million
barrels of crude oil, feedstock and refined products storage at Andeavor’s Anacortes Refinery, the Anacortes marine terminal with approximately 73 thousand barrels per day of feedstock and refined product throughput, a manifest rail facility with approximately 4 thousand barrels of throughput and crude oil and refined products pipelines with approximately 111 thousand barrels per day of throughput combined.
CURRENT MARKET CONDITIONS
During the third quarter, the spot prices of the commodities we handle increased, including crude oil, refined products and NGLs, while natural gas was relatively stable. Prior to Hurricane Harvey, U.S. refiners were running at record utilization rates, which led to high demand for crude and significant declines in U.S. crude inventories during July and August. With overall U.S. crude stock levels falling within the five-year range combined with improved global fundamentals, the price of West Texas Intermediate crude rose over $5 per barrel in the quarter. Despite a flat rig count in the third quarter, the U.S. oil and gas drilling landscape remains healthy due to premium locational drilling and increased well performance. Domestic crude production exhibited material growth versus the prior quarter even with a number of hurricane related production shut-ins. The higher price environment has improved shale economics and U.S. crude production is expected to grow year over year. Additionally, growing export opportunities are providing an incentive for U.S. refiners to maximize production of gasoline and diesel. These factors create a positive outlook for U.S. oil, gas, natural gas and refined product throughput volumes, however, regional impacts may differ.
Seasonal trends and continued healthy domestic economic conditions during the third quarter continued to support healthy refined product demand from our downstream and marketing customers. We continue to monitor the impact of commodity prices and fundamentals as it relates to our business. Given the outlined market conditions, we believe our diversified portfolio of businesses as well as our strong customer base are sufficient to continue to meet our goals and objectives outlined above.
20 | | | ||
MANAGEMENT’S DISCUSSION AND ANALYSIS | ||
RESULTS OF OPERATIONS
A discussion and analysis of the factors contributing to our results of operations presented below includes the financial results of our Predecessors and the consolidated financial results of Andeavor Logistics. The financial statements of our Predecessors were prepared from the separate records maintained by Andeavor and may not necessarily be indicative of the conditions that would have existed or the results of operations if our Predecessors had been operated as an unaffiliated entity. The financial statements, together with the following information, are intended to provide investors with a reasonable basis for assessing our historical operations, but should not serve as the only criteria for predicting future performance.
OPERATING METRICS
Management utilizes the following operating metrics to evaluate performance and compare profitability to other companies in the industry (amounts may not recalculate due to rounding of dollar and volume information):
• | Average terminalling revenue per barrel—calculated as total terminalling revenue divided by terminalling throughput presented in thousands of barrels per day (“Mbpd”) multiplied by 1,000 and multiplied by the number of days in the period, (92 days for both the three months ended September 30, 2017 (the “2017 Quarter”) and three months ended September 30, 2016 (the “2016 Quarter”), 273 days for the nine months ended September 30, 2017 (the “2017 Period”) and 274 days for the nine months ended September 30, 2016 (the “2016 Period”)); |
• | Average pipeline transportation revenue per barrel—calculated as total pipeline transportation revenue divided by pipeline transportation throughput presented in Mbpd multiplied by 1,000 and multiplied by the number of days in the period as outlined above; |
• | Average gas gathering and processing revenue per Million British thermal units (“MMBtu”)—calculated as total gathering and processing fee-based revenue divided by gas gathering throughput presented in thousands of MMBtu per day (“MMBtu/d”) multiplied by 1,000 and multiplied by the number of days in the period as outlined above; and |
• | Average crude oil and water gathering revenue per barrel—calculated as total crude oil and water gathering fee-based revenue divided by crude oil and water gathering throughput presented in Mbpd multiplied by 1,000 and multiplied by the number of days in the period as outlined above. |
There are a variety of ways to calculate average revenue per barrel, average margin per barrel and average revenue per MMBtu; other companies may calculate these in different ways.
NON-GAAP MEASURES
As a supplement to our financial information presented in accordance with accounting principles generally accepted in the United States of America (“U.S. GAAP”), our management uses certain “non-GAAP” measures to analyze our results of operations, assess internal performance against budgeted and forecasted amounts and evaluate future impacts to our financial performance as a result of capital investments, acquisitions, divestitures and other strategic projects. These measures are important factors in assessing our operating results and profitability and include:
• | Financial non-GAAP measure of earnings before interest, income taxes, and depreciation and amortization expenses (“EBITDA”); |
• | Liquidity non-GAAP measure of distributable cash flow, which is calculated as U.S. GAAP-based net cash flow from operating activities plus or minus changes in working capital, amounts spent on maintenance capital net of reimbursements and other adjustments not expected to settle in cash; |
• | Liquidity non-GAAP measure of pro forma distributable cash flow, which is calculated as distributable cash flow plus or minus adjustments for the WNRL Merger; and |
• | Operating performance measure of average margin on NGL sales per barrel—calculated as the difference between the NGL sales revenues and the amounts recognized as NGL expense divided by our NGL sales volumes in barrels presented in Mbpd multiplied by 1,000 and multiplied by the number of days in the period as previously outlined. |
We present these measures because we believe they may help investors, analysts, lenders and ratings agencies analyze our results of operations and liquidity in conjunction with our U.S. GAAP results, including but not limited to:
• | our operating performance as compared to other publicly traded partnerships in the midstream energy industry, without regard to historical cost basis or financing methods; |
• | the ability of our assets to generate sufficient cash flow to make distributions to our unitholders; |
• | our ability to incur and service debt and fund capital expenditures; and |
• | the viability of acquisitions and other capital expenditure projects and the returns on investment of various investment opportunities. |
Management also uses these measures to assess internal performance, and we believe they may provide meaningful supplemental information to the users of our financial statements. Non-GAAP measures have important limitations as analytical tools, because they exclude some, but not all, items that affect net earnings, operating income and net cash from operating activities. These measures should not be considered substitutes for their most directly comparable U.S. GAAP financial measures.
September 30, 2017 | 21 | ||
MANAGEMENT’S DISCUSSION AND ANALYSIS | ||
For further information regarding these non-GAAP measures including the reconciliation of these non-GAAP measures to their most directly comparable U.S. GAAP financial measures, see “Non-GAAP Reconciliations” section below.
ITEMS IMPACTING COMPARABILITY
Our financial results may not be comparable for the reasons described below. Our Predecessors did not record revenues with Andeavor and our Predecessors recorded general and administrative expenses and financed operations differently than the Partnership. See “Factors Affecting the Comparability of Our Financial Results” in our Annual Report on Form 10-K for the year ended December 31, 2016 for further discussion.
We changed our operating segment presentation in the first quarter of 2017 to reflect our expanded gathering and processing operations and capabilities. With the completion of the North Dakota Gathering and Processing Assets acquisition on January 1, 2017, our gathering and processing assets and operations expanded significantly and enhanced our ability to offer integrated gathering and processing services to our customers. Given the business’s focus on providing integrated services along with the revised reporting structure implemented by management to assess performance and make resource allocation decisions, we have determined our operating segments, which are the same for reporting purposes, are the
(i) Terminalling and Transportation segment and (ii) Gathering and Processing segment. Comparable prior period information for the newly presented Gathering and Processing segment has been recast to reflect our current presentation. No changes were deemed necessary to our Terminalling and Transportation segment.
On November 21, 2016, we acquired certain terminalling and storage assets located in Martinez, California purchased from subsidiaries of Andeavor (“Northern California Terminalling and Storage Assets”) for total consideration of $400 million. The Northern California Terminalling and Storage Assets include crude oil, feedstock, and refined product storage capacity at Andeavor’s Martinez Refinery along with the Avon marine terminal capable of handling throughput of feedstocks and refined products.
On July 1 and September 16, 2016, we purchased certain terminalling and storage assets owned by Andeavor (the “Alaska Storage and Terminalling Assets”) for total consideration of $444 million. The storage assets include tankage and ancillary facilities used for the operations at Andeavor’s Kenai Refinery. The refined product terminals are located in Anchorage and Fairbanks.
2017 3RD QUARTER VERSUS 2016 3RD QUARTER
HIGHLIGHTS (in millions)
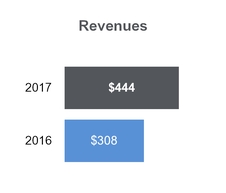
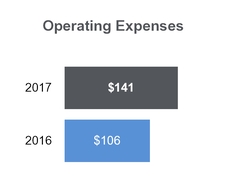
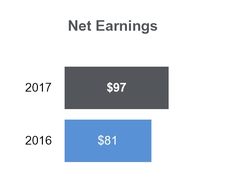
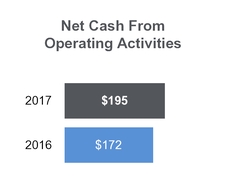
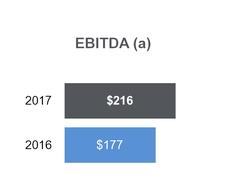
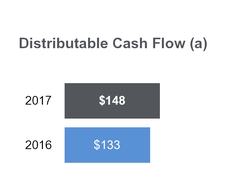
(a) See “Non-GAAP Reconciliations” section below for further information regarding these non-GAAP measures.
22 | | | ||
MANAGEMENT’S DISCUSSION AND ANALYSIS | ||
PERCENTAGE OF SEGMENT OPERATING INCOME BY OPERATING SEGMENT
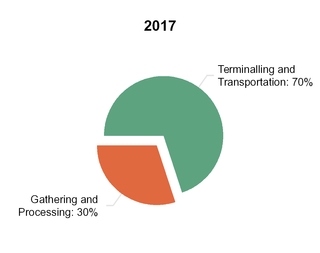
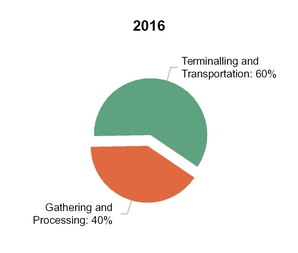
OVERVIEW. Our net earnings for the 2017 Quarter increased $16 million to $97 million from $81 million for the 2016 Quarter primarily driven by strong product demand and high refinery utilization generating higher throughput at our California marine terminals. The 2017 Quarter also benefited from contributions from the Northern California Terminalling and Storage Assets as well as the Alaska Storage and Terminalling Assets acquisitions completed in the second half of 2016. Partially offsetting those contributions were increases in operating costs, depreciation and amortization expenses as well as interest and financing costs related to our acquisitions. EBITDA in the 2017 Quarter increased $39 million reflecting the impact of acquisitions from Andeavor during the second half of 2016 and the North Dakota Gathering and Processing Assets acquisition in January 2017.
As part of our acquisition of the North Dakota Gathering and Processing Assets, we acquired certain natural gas gathering and processing contracts structured as POP arrangements. The revenue and cost of sales associated with these POP arrangements are reported gross on our financial statements contributing to our higher revenue and operating costs.
REVENUES. The $136 million increase in revenue, or 44%, to $444 million was driven primarily by the North Dakota
Gathering and Processing Assets along with the acquisitions of the Alaska Storage and Terminalling Assets and the Northern California Terminalling and Storage Assets.
NGL EXPENSE AND OPERATING EXPENSES. NGL expense and operating expenses increased $63 million and $35 million, respectively, for the 2017 Quarter compared to the 2016 Quarter primarily due to the North Dakota Gathering and Processing Assets acquired during the first quarter of 2017 and estimated costs to complete our remediation and closure activities along with long-term monitoring in Tioga, North Dakota.
DEPRECIATION AND AMORTIZATION EXPENSES. Depreciation and amortization expenses increased $13 million for the 2017 Quarter versus the 2016 Quarter largely due to the property, plant and equipment and intangibles acquired with the North Dakota Gathering and Processing Assets and the Northern California Terminalling and Storage Assets.
INTEREST AND FINANCING COSTS, NET. Net interest and financing costs increased $10 million in the 2017 Quarter compared to the 2016 Quarter mostly due to the issuance of new senior notes in December 2016 to fund our growth.
September 30, 2017 | 23 | ||
MANAGEMENT’S DISCUSSION AND ANALYSIS | ||
2017 YEAR TO DATE PERIOD VERSUS 2016 YEAR TO DATE PERIOD
HIGHLIGHTS (in millions)
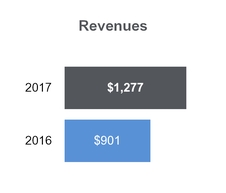
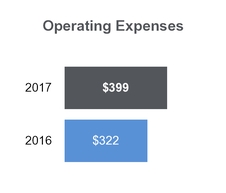
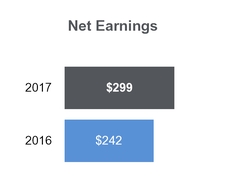
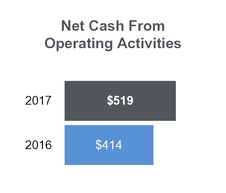
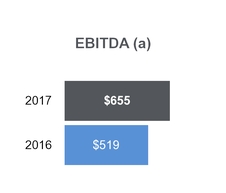
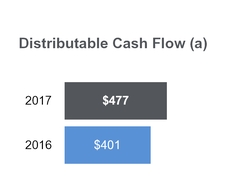
(a) See “Non-GAAP Reconciliations” section below for further information regarding these non-GAAP measures.
PERCENTAGE OF SEGMENT OPERATING INCOME BY OPERATING SEGMENT
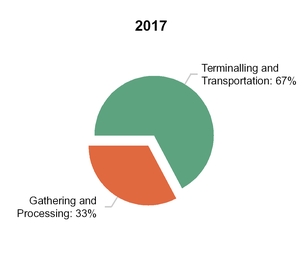
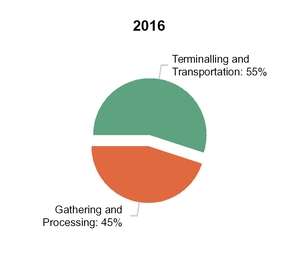
OVERVIEW. Our net earnings for the 2017 Period increased 24% to $299 million from $242 million for the 2016 Period primarily driven by a gain on the sale of a products terminal and increased contribution from acquisitions from Andeavor during the second half of 2016. Partially offsetting those contributions were increases in operating costs, depreciation and amortization expenses as well as interest and financing costs in connection with our acquisitions. EBITDA increased $136 million reflecting the sale of a products terminal,
the impact of the acquisitions from Andeavor, the North Dakota Gathering and Processing Assets acquisition in January 2017 and organic growth in the pipeline and terminalling assets.
The revenue and costs of sales associated with the POP arrangements we acquired in the North Dakota Gathering and Processing Assets acquisition are reported gross on our financial statements contributing to the higher revenue and operating costs.
24 | | | ||
MANAGEMENT’S DISCUSSION AND ANALYSIS | ||
REVENUE. The increase in revenue of $376 million, or 42%, to $1.3 billion was driven by the North Dakota Gathering and Processing Assets and the acquisitions of the Alaska Storage and Terminalling Assets and Northern California Terminalling and Storage Assets that were purchased from Andeavor in the second half of 2016.
NGL EXPENSE AND OPERATING EXPENSES. NGL expense and operating expenses increased $177 million and $77 million, respectively, for the 2017 Period compared to the 2016 Period primarily due to the North Dakota Gathering and Processing Assets acquired during the first quarter of 2017 and estimated costs to complete our remediation and closure activities along with long-term monitoring in Tioga, North Dakota.
DEPRECIATION AND AMORTIZATION EXPENSES. Depreciation and amortization expenses increased $39 million for the 2017 Period versus the 2016 Period largely due to the property, plant and equipment and intangibles acquired with the North Dakota Gathering and Processing Assets and the acquisitions of the Alaska Storage and Terminalling Assets and Northern California Terminalling and Storage Assets that were purchased from Andeavor in the second half of 2016.
INTEREST AND FINANCING COSTS, NET. Net interest and financing costs increased $40 million in the 2017 Period compared to the 2016 Period mostly related to the issuance of new senior notes in May and December 2016 to fund our growth.
September 30, 2017 | 25 | ||
MANAGEMENT’S DISCUSSION AND ANALYSIS | ||
SEGMENT RESULTS OF OPERATIONS

 TERMINALLING AND TRANSPORTATION SEGMENT
Our Terminalling and Transportation segment consists of pipeline systems, including regulated common carrier refined products pipeline systems and other pipelines, which transport products and crude oil from Andeavor’s refineries to nearby facilities, as well as crude oil and refined products terminals and storage facilities, rail-car unloading facilities and a petroleum coke handling and storage facility.
2017 3RD QUARTER VERSUS 2016 3RD QUARTER
HIGHLIGHTS (in millions)
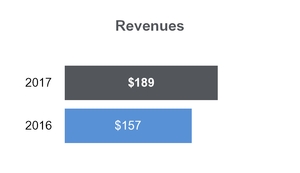
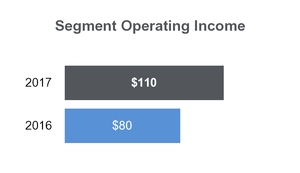
SEGMENT VOLUMETRIC DATA
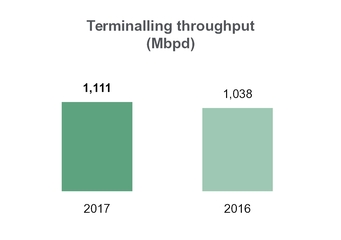
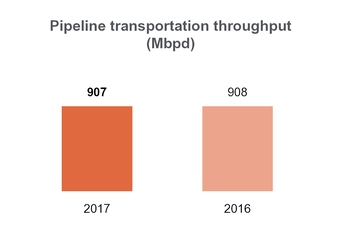
VOLUMES. Terminalling throughput volume increased 73 Mbpd, or 7%, in the 2017 Quarter compared to the 2016 Quarter. The increase in the Terminalling throughput volume was primarily attributable to strong demand in marine services in Southern California, from the Avon marine terminal assets contributed in the Northern California Terminalling and Storage Assets acquisition, and from the assets contributed in the Alaska Storage and Terminalling Assets acquisition. Pipeline transportation throughput volume remained high in the 2017 Quarter due to continued strong product demand.
26 | | | ||
MANAGEMENT’S DISCUSSION AND ANALYSIS | ||
TERMINALLING AND TRANSPORTATION SEGMENT RESULTS (in millions, except per barrel amounts)
Three Months Ended September 30, | |||||||
2017 | 2016 (a) | ||||||
Revenues | |||||||
Terminalling | $ | 155 | $ | 125 | |||
Pipeline transportation | 34 | 32 | |||||
Total Revenues | 189 | 157 | |||||
Costs and Expenses | |||||||
Operating expenses (b) | 47 | 48 | |||||
General and administrative expenses | 8 | 9 | |||||
Depreciation and amortization expenses | 24 | 20 | |||||
Terminalling and Transportation Segment Operating Income | $ | 110 | $ | 80 | |||
Rates (c) | |||||||
Average terminalling revenue per barrel | $ | 1.51 | $ | 1.31 | |||
Average pipeline transportation revenue per barrel | $ | 0.40 | $ | 0.38 | |||
FINANCIAL RESULTS. The Terminalling and Transportation segment’s operating income increased $30 million, or 38%, primarily driven by growth associated with new commercial terminalling and storage agreements executed with Andeavor in connection with the Northern California Terminalling and Storage Assets and the Alaska Storage and Terminalling Assets acquisitions in the second half of 2016. Also contributing to the increase were higher marine terminalling revenues in California driven by higher refinery utilization. The increase in revenues was partially offset by higher depreciation and amortization expenses, particularly related to the Northern California Terminalling and Storage Assets.
(a) | Adjusted to include the historical results of the Predecessors. Our Predecessors did not record revenue for transactions with Andeavor in the Terminalling and Transportation segment prior to the effective date of the acquisition of the Alaska Storage and Terminalling Assets and the Northern California Terminalling and Storage Assets. |
(b) | Operating expenses include imbalance settlement gains of $1 million for both the 2017 Quarter and 2016 Quarter. |
(c) | Amounts may not recalculate due to rounding of dollar and volume information. |
2017 YEAR TO DATE PERIOD VERSUS 2016 YEAR TO DATE PERIOD
HIGHLIGHTS (in millions)
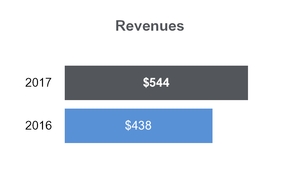
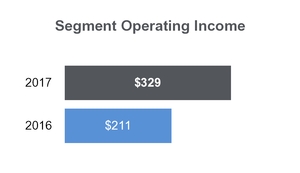
SEGMENT VOLUMETRIC DATA
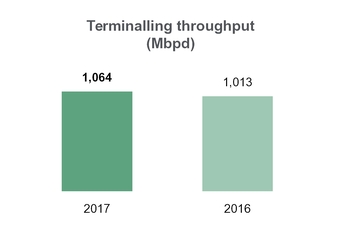
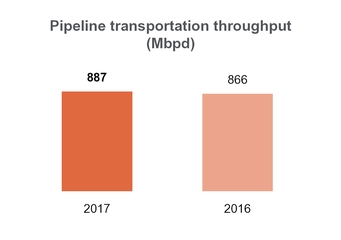
VOLUMES. Terminalling throughput volume increased 51 Mbpd, or 5%, in the 2017 Period compared to the 2016 Period. The increase in the Terminalling throughput volume was primarily attributable to an increase in marine volumes in Southern California
September 30, 2017 | 27 | ||
MANAGEMENT’S DISCUSSION AND ANALYSIS | ||
and contributions from assets acquired from Andeavor. In particular, marine volumes from the Avon marine terminal assets from the Northern California Terminalling and Storage Assets acquisition and contributions from the operations from the Alaska Storage and Terminalling Assets acquisition. Pipeline transportation throughput volume increased 21 Mbpd, or 2%, in the 2017 Period compared to the 2016 Period, which was primarily attributable to an increase in pipeline volumes in Southern California.
TERMINALLING AND TRANSPORTATION SEGMENT RESULTS (in millions, except per barrel amounts)
Nine Months Ended September 30, | |||||||
2017 | 2016 (a) | ||||||
Revenues | |||||||
Terminalling | $ | 447 | $ | 345 | |||
Pipeline transportation | 97 | 93 | |||||
Total Revenues | 544 | 438 | |||||
Costs and Expenses | |||||||
Operating expenses (b) | 149 | 143 | |||||
General and administrative expenses | 23 | 24 | |||||
Depreciation and amortization expenses | 68 | 60 | |||||
Gain on assets disposals and impairments | (25 | ) | — | ||||
Terminalling and Transportation Segment Operating Income | $ | 329 | $ | 211 | |||
Rates (c) | |||||||
Average terminalling revenue per barrel | $ | 1.54 | $ | 1.25 | |||
Average pipeline transportation revenue per barrel | $ | 0.40 | $ | 0.39 | |||
FINANCIAL RESULTS. The Terminalling and Transportation segment’s operating income increased $118 million, or 56% in the 2017 Period compared to the 2016 Period primarily attributable to revenues associated with new commercial terminalling and storage agreements executed with Andeavor in connection with the Northern California Terminalling and Storage Assets and the Alaska Storage and Terminalling Assets acquisitions in the second half of 2016 in addition to the gain on the sale of a products terminal in Alaska in the 2017 Period. Also contributing to the increase in segment operating income was higher marine terminalling revenues in California driven by higher refinery utilization. The increase in revenues was partially offset by higher operating expenses due to the recent acquisitions and depreciation and amortization expenses mostly attributable to the Northern California Terminalling and Storage Assets.
(a) | Adjusted to include the historical results of the Predecessors. Our Predecessors did not record revenue for transactions with Andeavor in the Terminalling and Transportation segment prior to the effective date of the acquisition of the Alaska Storage and Terminalling Assets and the Northern California Terminalling and Storage Assets. |
(b) | Operating expenses include imbalance settlement gains of $3 million for both the 2017 Period and 2016 Period. |
(c) | Amounts may not recalculate due to rounding of dollar and volume information. |
28 | | | ||
MANAGEMENT’S DISCUSSION AND ANALYSIS | ||

 GATHERING AND PROCESSING SEGMENT
Our Gathering and Processing segment consists of crude oil, natural gas and produced water gathering systems and processing complexes in the Bakken Region and the Green River Basin, Uinta Basin and Vermillion Basin in the states of Utah, Colorado and Wyoming (the “Rockies Region”). Our High Plains System, located in the Bakken Region, gathers and transports crude oil from various production locations in this area for transportation to Andeavor’s North Dakota refineries and other destinations in the Bakken Region, including export rail terminals and pipelines. Approximately 25-30% of our processing plant production is currently supported by long-term, fee-based processing agreements with minimum volume commitments.
2017 3RD QUARTER VERSUS 2016 3RD QUARTER
HIGHLIGHTS (in millions)
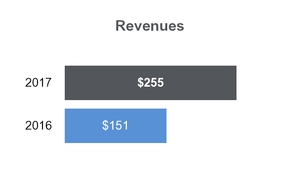
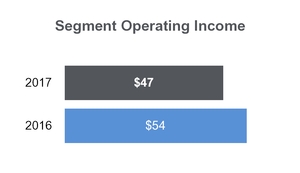
SEGMENT VOLUMETRIC DATA
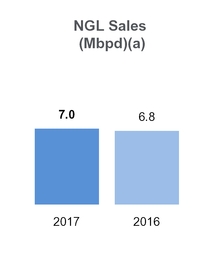
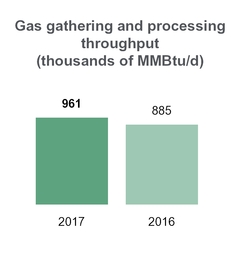
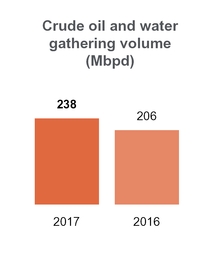
(a) | Volumes represent barrels sold in keep-whole arrangements, net barrels retained in POP arrangements and other associated products. |
VOLUMES. NGL sales volumes increased slightly in the 2017 Quarter as compared to the 2016 Quarter primarily due to an increase related to the Equity NGLs associated with the acquired North Dakota Gathering and Processing Assets slightly offset by keep-whole volume decreases in the Rockies Region. The increase in gas gathering and processing throughput volumes of 76 thousand MMBtu/d, or 9%, in the 2017 Quarter as compared to the 2016 Quarter was primarily driven by the North Dakota Gathering and Processing Assets acquired, which led to increased volumes on our gathering system and processed at our facilities. Crude oil and water throughput volumes increased 32 Mbpd, or 16%, in the 2017 Quarter primarily due to contributions from the North Dakota Gathering and Processing Assets acquisition and interconnections on the High Plains Pipeline System both completed in the first quarter 2017.
September 30, 2017 | 29 | ||
MANAGEMENT’S DISCUSSION AND ANALYSIS | ||
GATHERING AND PROCESSING SEGMENT RESULTS (in millions, except per barrel and per MMBtu amounts)
Three Months Ended September 30, | |||||||
2017 | 2016 | ||||||
Revenues | |||||||
NGL sales (a) | $ | 90 | $ | 24 | |||
Gas gathering and processing | 85 | 67 | |||||
Crude oil and water gathering | 43 | 33 | |||||
Pass-thru and other | 37 | 27 | |||||
Total Revenues | 255 | 151 | |||||
Costs and Expenses | |||||||
NGL expense (excluding items shown separately below) (a) | 64 | 1 | |||||
Operating expenses (b) | 94 | 57 | |||||
General and administrative expenses | 13 | 10 | |||||
Depreciation and amortization expenses | 36 | 27 | |||||
Loss on asset disposals and impairments | 1 | 2 | |||||
Gathering and Processing Segment Operating Income | $ | 47 | $ | 54 | |||
Rates (c) | |||||||
Average margin on NGL sales per barrel (a)(d) | $ | 38.30 | $ | 38.71 | |||
Average gas gathering and processing revenue per MMBtu | $ | 0.96 | $ | 0.82 | |||
Average crude oil and water gathering revenue per barrel | $ | 1.96 | $ | 1.71 | |||
FINANCIAL RESULTS. Our Gathering and Processing segment’s operating income decreased $7 million, or 13%, in the 2017 Quarter compared to the 2016 Quarter.
The North Dakota Gathering and Processing Assets added margin of $3 million associated with the sale of NGLs. Revenues increased across our natural gas gathering and processing systems and our crude oil and water gathering systems with this acquisition and expanded capabilities on existing assets. Offsetting those contributions was a decline in revenues resulting from lower volumes in the Rockies Region. In addition, we had incremental administrative, operating and depreciation expenses primarily associated with the North Dakota Gathering and Processing Assets acquisition and we recognized estimated costs to complete our remediation and closure activities along with long-term monitoring in Tioga, North Dakota.
(a) | For the 2017 Quarter, we had 21.1 Mbpd of gross NGL sales under POP and keep-whole arrangements. We retained 7.0 Mbpd under these arrangements. The difference between gross sales barrels and barrels retained is reflected in NGL expense resulting from the gross presentation required for the POP arrangements associated with the North Dakota Gathering and Processing Assets. |
(b) | Operating expenses include an imbalance settlement gain of $1 million for both the 2017 Quarter and 2016 Quarter. |
(c) | Amounts may not recalculate due to rounding of dollar and volume information. |
(d) | See “Non-GAAP Reconciliations” section below for further information regarding this non-GAAP measure. |
30 | | | ||
MANAGEMENT’S DISCUSSION AND ANALYSIS | ||
2017 YEAR TO DATE PERIOD VERSUS 2016 YEAR TO DATE PERIOD
HIGHLIGHTS (in millions)
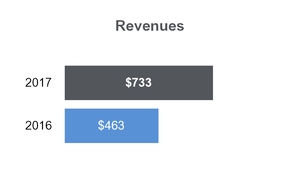
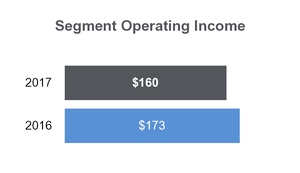
SEGMENT VOLUMETRIC DATA
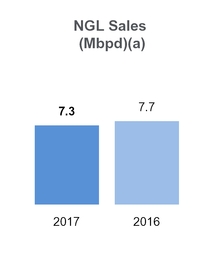
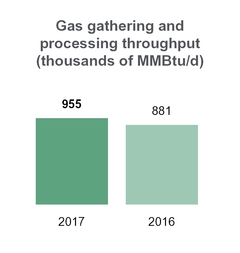
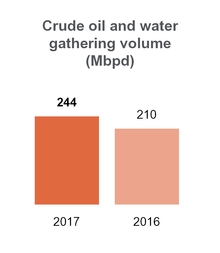
(a) | Volumes represent barrels sold in keep-whole arrangements, net barrels retained in POP arrangements and other associated products. |
VOLUMES. NGL sales volumes decreased slightly in the 2017 Period compared to the 2016 Period primarily due to keep-whole volume decreases in the Rockies Region slightly offset by an increase related to the Equity NGLs associated with the acquired North Dakota Gathering and Processing Assets. The increase in gas gathering and processing throughput volumes of 74 thousand MMBtu/d, or 8%, in the 2017 Period compared to the 2016 Period was primarily driven by the North Dakota Gathering and Processing Assets acquired providing more volumes on our systems. Crude oil and water throughput volumes increased 34 Mbpd, or 16%, in the 2017 Period as a result of projects to expand the pipeline gathering system capabilities, which included additional origin and destination inter-connections and the North Dakota Gathering and Processing Assets acquired. This was partially offset by decreased volumes related to the turnaround completed on Andeavor’s Mandan refinery, which impacted volumes as well as the average crude oil and water revenue per barrel due to shorter pipeline haul movements.
September 30, 2017 | 31 | ||
MANAGEMENT’S DISCUSSION AND ANALYSIS | ||
GATHERING AND PROCESSING SEGMENT RESULTS (in millions, except per barrel and per MMBtu amounts)
Nine Months Ended September 30, | |||||||
2017 | 2016 | ||||||
Revenues | |||||||
NGL sales (a) | $ | 254 | $ | 78 | |||
Gas gathering and processing | 252 | 198 | |||||
Crude oil and water gathering | 116 | 100 | |||||
Pass-thru and other (b) | 111 | 87 | |||||
Total Revenues | 733 | 463 | |||||
Costs and Expenses | |||||||
NGL expense (excluding items shown separately below) (a)(b) | 179 | 2 | |||||
Operating expenses (c) | 250 | 179 | |||||
General and administrative expenses | 33 | 27 | |||||
Depreciation and amortization expenses | 110 | 79 | |||||
Loss on asset disposals and impairments | 1 | 3 | |||||
Gathering and Processing Segment Operating Income | $ | 160 | $ | 173 | |||
Rates (d) | |||||||
Average margin on NGL sales per barrel (a)(b)(e) | $ | 38.27 | $ | 36.48 | |||
Average gas gathering and processing revenue per MMBtu | $ | 0.97 | $ | 0.82 | |||
Average crude oil and water gathering revenue per barrel | $ | 1.75 | $ | 1.73 | |||
FINANCIAL RESULTS. Our Gathering and Processing segment’s operating income decreased $13 million, or 8%, in the 2017 Period compared to the 2016 Period.
The North Dakota Gathering and Processing Assets added margin of $8 million associated with the sale of NGLs. Revenues increased across our natural gas gathering and processing systems and our crude oil and water gathering systems with this acquisition and expanded capabilities on existing assets. Offsetting the incremental margin was a decline in revenues resulting from lower volumes in the Rockies Region and incremental administrative, operating and depreciation expenses primarily associated with the North Dakota Gathering and Processing Assets acquisition. In addition, we recognized estimated costs to complete our remediation and closure activities along with long-term monitoring in Tioga, North Dakota in the 2017 Period.
(a) | For the 2017 Period, we had 21.0 Mbpd of gross NGL sales under POP and keep-whole arrangements. We retained 7.3 Mbpd under these arrangements. The difference between gross sales barrels and barrels retained is reflected in NGL expense resulting from the gross presentation required for the POP arrangements associated with the North Dakota Gathering and Processing Assets. |
(b) | Included in NGL expense for the 2017 Period were approximately $2 million of costs related to crude oil volumes obtained in connection with the North Dakota Gathering and Processing Assets acquisition. The corresponding revenues were recognized in pass-thru and other revenue. As such, the calculation of the average margin on NGL sales per barrel excludes this amount. |
(c) | Operating expenses include an imbalance settlement gain of $4 million and $2 million for the 2017 Period and 2016 Period, respectively. |
(d) | Amounts may not recalculate due to rounding of dollar and volume information. |
(e) | See “Non-GAAP Reconciliations” section below for further information regarding this non-GAAP measure. |
32 | | | ||
MANAGEMENT’S DISCUSSION AND ANALYSIS | ||
NON-GAAP RECONCILIATIONS
RECONCILIATION OF NET EARNINGS TO EBITDA (in millions)
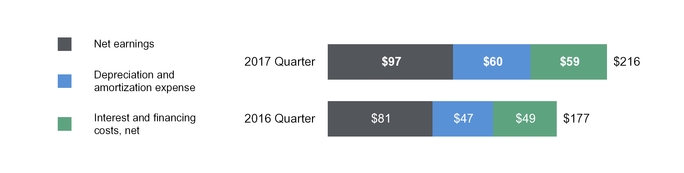
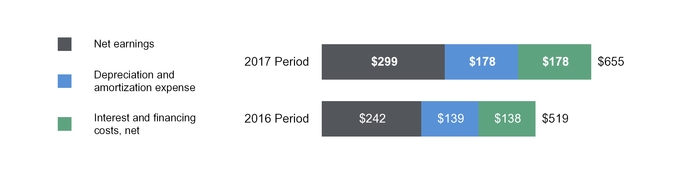
RECONCILIATION OF NET CASH FROM OPERATING ACTIVITIES TO DISTRIBUTABLE CASH FLOW (in millions)
Three Months Ended September 30, | Nine Months Ended September 30, | ||||||||||||||
2017 | 2016 (a) | 2017 | 2016 (a) | ||||||||||||
Net cash from operating activities | $ | 195 | $ | 172 | $ | 519 | $ | 414 | |||||||
Changes in assets and liabilities | (32 | ) | (37 | ) | (44 | ) | (6 | ) | |||||||
Predecessors impact | — | 5 | — | 15 | |||||||||||
Maintenance capital expenditures (b) | (24 | ) | (20 | ) | (60 | ) | (44 | ) | |||||||
Reimbursement for maintenance capital expenditures (b) | 7 | 6 | 22 | 20 | |||||||||||
Adjustments for equity method investments | 3 | 4 | 3 | 1 | |||||||||||
Proceeds from sale of assets | — | — | 28 | — | |||||||||||
Other | (1 | ) | 3 | 9 | 1 | ||||||||||
Distributable Cash Flow | 148 | 133 | 477 | 401 | |||||||||||
Add: Acquisition costs related to the WNRL Merger (c) | 4 | — | 4 | — | |||||||||||
Pro Forma Distributable Cash Flow | $ | 152 | $ | 133 | $ | 481 | $ | 401 | |||||||
(a) | Adjusted to include the historical results of the Predecessors. |
(b) | We adjust our reconciliation of distributable cash flows for maintenance capital expenditures, tank restoration costs and expenditures required to ensure the safety, reliability, integrity and regulatory compliance of our assets with an offset for any reimbursements received for such expenditures. |
(c) | Reflects the acquisition costs associated with the WNRL Merger as well as the costs associated with the IDR/GP Transaction recognized in general and administrative expenses during the periods presented. Both transactions were completed on October 30, 2017. |
September 30, 2017 | 33 | ||
MANAGEMENT’S DISCUSSION AND ANALYSIS | ||
AVERAGE MARGIN ON NGL SALES PER BARREL (in millions, except days and per barrel amounts)
Three Months Ended September 30, | Nine Months Ended September 30, | ||||||||||||||
2017 | 2016 | 2017 | 2016 | ||||||||||||
Segment Operating Income | $ | 47 | $ | 54 | $ | 160 | $ | 173 | |||||||
Add back: | |||||||||||||||
Operating expenses | 94 | 57 | 250 | 179 | |||||||||||
General and administrative expenses | 13 | 10 | 33 | 27 | |||||||||||
Depreciation and amortization expenses | 36 | 27 | 110 | 79 | |||||||||||
Loss on asset disposals and impairments | 1 | 2 | 1 | 3 | |||||||||||
Other commodity purchases (a) | — | — | 2 | — | |||||||||||
Subtract: | |||||||||||||||
Gas gathering and processing revenues | (85 | ) | (67 | ) | (252 | ) | (198 | ) | |||||||
Crude oil gathering revenues | (43 | ) | (33 | ) | (116 | ) | (100 | ) | |||||||
Pass-thru and other revenues | (37 | ) | (27 | ) | (111 | ) | (87 | ) | |||||||
Margin on NGL Sales | $ | 26 | $ | 23 | $ | 77 | $ | 76 | |||||||
Divided by Total Volumes for the Period: | |||||||||||||||
NGLs sales volumes (Mbpd) | 7.0 | 6.8 | 7.3 | 7.7 | |||||||||||
Number of days in the period | 92 | 92 | 273 | 274 | |||||||||||
Total volumes for the period (thousands of barrels) | 648.5 | 630.1 | 1,979.8 | 2,109.0 | |||||||||||
Average Margin on NGL Sales per Barrel (b) | $ | 38.30 | $ | 38.71 | $ | 38.27 | $ | 36.48 | |||||||
(a) | Included in the NGL expense for the nine months ended September 30, 2017 was approximately $2 million of costs related to crude oil volumes obtained and immediately sold in connection with the North Dakota Gathering and Processing Assets acquisition. |
(b) | Amounts may not recalculate due to rounding of dollar and volume information. |
34 | | | ||
MANAGEMENT’S DISCUSSION AND ANALYSIS | ||
CAPITAL RESOURCES AND LIQUIDITY
OVERVIEW
Our primary cash requirements relate to funding capital expenditures, acquisitions, meeting operational needs and paying distributions to our unitholders. We expect our ongoing sources of liquidity to include cash generated from operations, reimbursement for certain maintenance and expansion expenditures, borrowings under our credit facilities and issuances of additional debt and equity securities. We believe that cash generated from these sources will be sufficient to meet our short-term working capital, long-term capital expenditure, acquisition and debt servicing requirements and allow us to fund at least the minimum quarterly cash distributions.
CAPITALIZATION
CAPITAL STRUCTURE (in millions)
Debt, including current maturities: | September 30, 2017 | December 31, 2016 | |||||
Credit facilities | $ | 35 | $ | 330 | |||
Senior notes | 3,770 | 3,770 | |||||
Capital lease obligations | 9 | 9 | |||||
Total Debt | 3,814 | 4,109 | |||||
Unamortized Issuance Costs | (48 | ) | (55 | ) | |||
Debt, Net of Unamortized Issuance Costs | 3,766 | 4,054 | |||||
Total Equity | 1,751 | 1,542 | |||||
Total Capitalization | $ | 5,517 | $ | 5,596 | |||
DEBT OVERVIEW AND AVAILABLE LIQUIDITY
Our Revolving Credit Facility, our secured dropdown credit facility (“Dropdown Credit Facility”) and our senior notes contain covenants that may, among other things, limit or restrict our ability (as well as the ability of our subsidiaries) to engage in certain activities. There have been no changes in these covenants from those described in our Annual Report on Form 10-K for the year ended December 31, 2016. As of September 30, 2017, our Revolving Credit Facility is non-recourse to Andeavor, except for TLGP, and is guaranteed by all of our consolidated subsidiaries and secured by substantially all of our assets.
AVAILABLE CAPACITY UNDER CREDIT FACILITIES (in millions)
Credit Facility | Total Capacity | Amount Borrowed as of September 30, 2017 | Available Capacity as of September 30, 2017 | Weighted Average Interest Rate | Expiration | |||||||||||
Revolving Credit Facility | $ | 600 | $ | 35 | $ | 565 | 3.49 | % | January 29, 2021 | |||||||
Dropdown Credit Facility | 1,000 | — | 1,000 | — | % | January 29, 2021 | ||||||||||
Total Credit Facilities | $ | 1,600 | $ | 35 | $ | 1,565 | ||||||||||
REVOLVING CREDIT FACILITIES EXPENSES AND FEES
Credit Facility | 30 Day Eurodollar (LIBOR) Rate at September 30, 2017 | Eurodollar Margin | Base Rate | Base Rate Margin | Commitment Fee (unused portion) | ||||
Revolving Credit Facility (a) | 1.23% | 2.25% | 4.25% | 1.25% | 0.375% | ||||
Dropdown Credit Facility (a) | 1.23% | 2.26% | 4.25% | 1.26% | 0.375% | ||||
(a) | We have the option to elect if the borrowings will bear interest at a base rate plus the base rate margin, or a Eurodollar rate, for the applicable period, plus the Eurodollar margin at the time of the borrowing. The applicable margin varies based upon a certain leverage ratio, as defined by the Revolving Credit Facility. We also incur commitment fees for the unused portion of the Revolving Credit Facility at an annual rate. Letters of credit outstanding under the Revolving Credit Facility incur fees at the Eurodollar margin rate. |
September 30, 2017 | 35 | ||
MANAGEMENT’S DISCUSSION AND ANALYSIS | ||
WNRL DEBT REPAYMENT. On October 30, 2017, in connection with the WNRL Merger, we repaid $20 million of outstanding borrowings under WNRL’s revolving credit facility and terminated that facility. In addition, we repaid $300 million of WNRL’s 7.5% senior notes due 2023. Both repayments were made using borrowings under the Andeavor Logistics Revolving Credit Facility.
INVESTMENT GRADE CREDIT RATING. In February 2017, Fitch Ratings assigned a first-time Long-Term Issuer Default Rating of “BBB-“ to Andeavor Logistics, and S&P Global Ratings raised our corporate credit and senior unsecured issue ratings to "BBB-" with a stable outlook on October 31, 2017. As a result, we achieved an investment grade credit rating. Additionally, on October 26, 2017, Moody's Investors Service upgraded our Corporate Family Rating to “Ba1” with a positive outlook from “Ba2”.
ANACORTES LOGISTICS ASSETS. On November 8, 2017, we paid $445 million in connection with our acquisition of the Anacortes Logistics Assets, including $400 million of cash financed with borrowings on our revolving credit facilities and approximately $45 million in common units issued to Andeavor.
EQUITY OVERVIEW
Our partnership agreement authorizes us to issue an unlimited number of additional partnership securities on the terms and conditions determined by our general partner without the approval of the unitholders. Costs associated with the issuance of securities are allocated to all unitholders’ capital accounts based on their ownership interest at the time of issuance.
UNIT ISSUANCE. We closed a registered public offering of 5,000,000 common units representing limited partner interests at a public offering price of $56.19 per unit on February 27, 2017. The net proceeds of $281 million were used to repay borrowings outstanding under our Revolving Credit Facility and for general partnership purposes. Also, general partner units of 101,980 were issued for proceeds of $6 million.
In connection with the WNRL Merger, we issued 15,182,996 publicly held common units and 14,853,542 common units held by Andeavor. In addition, on October 30, 2017, we issued 78.0 million of our common units to TLGP in connection with the IDR/GP Transaction and converted our general partner units into non-economic general partner units. As a result, after giving effect to the WNRL Merger and IDR/GP Transaction, we had 89,203,084 of publicly held outstanding common units and 126,908,584 outstanding common units held by Andeavor, which constituted an approximate 59% ownership interest in us as of October 30, 2017.
ATM PROGRAM. On August 22, 2017, we filed a prospectus supplement to our shelf registration filed with the Securities and Exchange Commission (“SEC”) on August 21, 2015, authorizing the continuous issuance of up to an aggregate of $750 million of common units, in amounts, at prices and on terms to be determined by market conditions and other factors at the time of our offerings (such continuous offering program, or at-the-market program, referred to as our “ATM Program”). During both the three and nine months ended September 30, 2017, we issued an aggregate of 72,857 common units under our ATM Program, generating proceeds of approximately $3 million before issuance costs. We paid fees of less than $1 million related to the issuance of units under this program for both the three and nine months ended September 30, 2017. The net proceeds from sales under the ATM Program will be used for general partnership purposes, which may include debt repayment, future acquisitions, capital expenditures and additions to working capital.
SOURCES AND USES OF CASH
COMPONENTS OF OUR CASH FLOWS (in millions)
Nine Months Ended September 30, | |||||||
2017 | 2016 | ||||||
Cash Flows From (Used in): | |||||||
Operating activities | $ | 519 | $ | 414 | |||
Investing activities | (777 | ) | (234 | ) | |||
Financing activities | (414 | ) | 301 | ||||
Increase (Decrease) in Cash and Cash Equivalents | $ | (672 | ) | $ | 481 | ||
OPERATING ACTIVITIES. Net cash from operating activities increased $105 million to $519 million in the 2017 Period compared to $414 million for the 2016 Period. The increase in cash from operating activities was primarily driven by an increase in net earnings from the 2016 Period to the 2017 Period and the change in working capital.
INVESTING ACTIVITIES. Net cash used in investing activities for the 2017 Period was $777 million compared to $234 million in the 2016 Period. The increase in cash used resulted from the acquisition of the North Dakota Gathering and Processing Assets partially offset by proceeds from the sale of certain Alaska terminalling assets and reduced capital expenditures. See “Capital Expenditures” below for a discussion of the expected capital expenditures for the year ended December 31, 2017.
FINANCING ACTIVITIES. The 2017 Period had net cash used in financing activities of $414 million compared to net cash from financing activities of $301 million for the 2016 Period, a $715 million increase in cash used. Sources of cash such as issuances of long-term debt, borrowings under our revolving credit facilities and issuances of equity decreased $701 million, $452 million and $74 million, respectively. However, the use of our cash in connection with acquisitions, to repay long-term debt, borrowings on the credit facilities and financing costs also decreased $395 million, $250 million, $62 million and $18 million, respectively. Distributions to unitholders and our general partner increased $66 million and $32 million, respectively.
Historically, the Predecessors’ sources of liquidity included cash generated from operations and funding from Andeavor. Cash receipts were deposited in Andeavor’s bank accounts and all cash disbursements were made from those accounts. While
36 | | | ||
MANAGEMENT’S DISCUSSION AND ANALYSIS | ||
there was no Sponsor contribution for the 2017 Period, $113 million was included in cash from financing activities in the 2016 Period, which funded the cash portion of the net loss, capital expenditures and acquisition attributable to the Predecessors.
CAPITAL EXPENDITURES
We expect capital expenditures for the year ended December 31, 2017 to be approximately $245 million, or approximately $200 million net of reimbursements primarily from Andeavor with whom we contract to provide services. The revised capital expenditure estimate reflects changes in our funding strategy for the Los Angeles Pipeline Interconnect System and the remaining 2017 capital expenditures at WNRL. During the 2017 Quarter, we spent $30 million on growth capital projects, net of $2 million in reimbursements primarily from Andeavor, and $14 million on maintenance capital projects, net of $5 million in reimbursements primarily from Andeavor. During the 2017 Period, we spent $74 million on growth capital projects, net of $19 million in reimbursements primarily from Andeavor, and $34 million on maintenance capital projects, net of $14 million in reimbursements primarily from Andeavor. There have been no other material changes to committed amounts for our major capital projects previously discussed in our Annual Report on Form 10-K for the year ended December 31, 2016.
During the quarter, Andeavor announced that it has received sufficient commitments from third party shippers to warrant construction of the Conan Crude Oil Gathering Pipeline system in the Delaware Basin. The gathering system will be approximately 130 miles in length and transport crude oil from origins in Lea County, New Mexico and Loving County, Texas to a terminal to be constructed in Loving County, Texas, where the gathering system interconnects with long-haul pipeline carriers. The system is under construction and is expected to begin commercial service in mid-2018. The estimated capital investment for the first phase of the gathering system is approximately $225 million of which $75 million is expected to be spent in 2017. This project is expected to be offered to Andeavor Logistics upon completion in 2018.
DISTRIBUTIONS
Our partnership agreement, as amended, sets forth the calculation to be used to determine the amount and priority of cash distributions that the limited partner unitholders and general partner will receive.
QUARTERLY DISTRIBUTIONS. For the three months ended September 30, 2017, June 30, 2017, March 31, 2017 and December 31, 2016, we declared distributions of $0.9852, $0.971, $0.94 and $0.91 per limited partnership unit, respectively, or $3.94, $3.88, $3.76 and $3.64, respectively, on an annualized basis, resulting in cash distributions of $140 million for both the fourth quarter 2016 and first quarter 2017, $147 million for the second quarter 2017, as well as an expected cash distribution of $201 million for the third quarter 2017, which includes the additional units issued in connection with the WNRL Merger as well as the IDR/GP Transaction. The distribution for the quarter ended September 30, 2017 will be paid November 14, 2017 to all unitholders of record as of November 3, 2017.
ENVIRONMENTAL AND OTHER MATTERS
ENVIRONMENTAL REGULATION. We are subject to extensive federal, state and local environmental laws and regulations. These laws, which change frequently, regulate the discharge of materials into the environment or otherwise relate to protection of the environment. Compliance with these laws and regulations may require us to remediate environmental damage from any discharge of petroleum, natural gas or chemical substances from our facilities or require us to install additional pollution control equipment on our equipment and facilities. Our failure to comply with these or any other environmental or safety-related regulations could result in the assessment of administrative, civil, or criminal penalties, the imposition of investigatory and remedial liabilities, and the issuance of injunctions that may subject us to additional operational constraints.
Future expenditures may be required to comply with the federal, state and local environmental requirements for our various sites, including our storage facilities, pipelines, gas processing complexes and refined products terminals. The impact of these legislative and regulatory developments, if enacted or adopted, could result in increased compliance costs and additional operating restrictions on our business, each of which could have an adverse impact on our liquidity, financial position or results of operations. See our discussion in Note 6 regarding the environmental matter in Tioga, North Dakota. Also, see our discussion of the Amended Omnibus Agreement and the Carson Assets Indemnity Agreement in Note 3 of our Annual Report on Form 10-K for the year ended December 31, 2016, for more information regarding the indemnification of certain environmental matters provided to us by Andeavor and discussion of other certain environmental obligations.
September 30, 2017 | 37 | ||
MANAGEMENT’S DISCUSSION AND ANALYSIS | ||
IMPORTANT INFORMATION REGARDING FORWARD-LOOKING STATEMENTS
This report (including information incorporated by reference) contains “forward-looking statements” within the meaning of Section 27A of the Securities Act of 1933 and Section 21E of the Securities Exchange Act of 1934. All statements other than statements of historical fact, including without limitation statements regarding our business strategy and goals, and expectations regarding revenues, cash flows, capital expenditures, other financial items, growth, acquisitions, our market position, future operations and profitability, are forward-looking statements. Forward-looking statements may be identified by use of the words “anticipate,” “believe,” “could,” “estimate,” “expect,” “intend,” “may,” “plan,” “predict,” “project,” “will,” “would” and similar terms and phrases. Although we believe our assumptions concerning future events are reasonable, a number of risks, uncertainties and other factors could cause actual results and trends to differ materially from those projected, including, but not limited to:
• | changes in the expected value of and benefits derived from acquisitions, including any inability to successfully integrate acquisitions or realize expected synergies; |
• | changes in global economic conditions on our business, on the business of our key customers, including Andeavor, and on our customers’ suppliers, business partners and credit lenders; |
• | a material change in the crude oil and natural gas produced in the Bakken Shale/Williston Basin area of North Dakota and Montana or the Green River Basin, Uinta Basin and Vermillion Basin in the states of Utah, Colorado and Wyoming; |
• | the ability of our key customers, including Andeavor, to remain in compliance with the terms of their outstanding indebtedness; |
• | changes in insurance markets impacting costs and the level and types of coverage available; |
• | changes in the cost or availability of third-party vessels, pipelines and other means of delivering and transporting crude oil, feedstocks, natural gas, NGLs and refined products; |
• | the coverage and ability to recover claims under our insurance policies; |
• | the availability and costs of crude oil, other refinery feedstocks and refined products; |
• | the timing and extent of changes in commodity prices and demand for refined products, natural gas and NGLs; |
• | changes in our cash flow from operations; |
• | impact of QEP Resources’ and Questar Gas Company’s ability to perform under the terms of our gathering agreements as they are the largest customers in our natural gas business. |
• | the risk of contract cancellation, non-renewal or failure to perform by those in our supply and distribution chains, including Andeavor and Andeavor’s customers, and the ability to replace such contracts and/or customers; |
• | the suspension, reduction or termination of Andeavor’s obligations under our commercial agreements and our secondment agreement; |
• | a material change in profitability among our customers, including Andeavor; |
• | direct or indirect effects on our business resulting from actual or threatened terrorist or activist incidents, cyber-security breaches or acts of war; |
• | weather conditions, earthquakes or other natural disasters affecting operations by us or our key customers, including Andeavor, or the areas in which our customers operate; |
• | disruptions due to equipment interruption or failure at our facilities, Andeavor’s facilities or third-party facilities on which our key customers, including Andeavor, are dependent; |
• | our inability to complete acquisitions on economically acceptable terms or within anticipated timeframes; |
• | actions of customers and competitors; |
• | changes in our credit profile; |
• | state and federal environmental, economic, health and safety, energy and other policies and regulations, including those related to climate change and any changes therein and any legal or regulatory investigations, delays in obtaining necessary approvals and permits, compliance costs or other factors beyond our control; |
• | operational hazards inherent in refining and natural gas processing operations and in transporting and storing crude oil, natural gas, NGLs and refined products; |
• | changes in capital requirements or in execution and benefits of planned capital projects; |
• | seasonal variations in demand for natural gas and refined products; |
• | adverse rulings, judgments, or settlements in litigation or other legal or tax matters, including unexpected environmental remediation costs in excess of any accruals, which affect us or Andeavor; |
• | risks related to labor relations and workplace safety; |
• | political developments; and |
• | the factors described in greater detail under “Competition” and “Risk Factors” in Items 1 and 1A of our Annual Report on Form 10-K for the year ended December 31, 2016, and our other filings with the SEC. |
All forward-looking statements included in this report are based on information available to us on the date of this report. We undertake no obligation to revise or update any forward-looking statements as a result of new information, future events or otherwise.
38 | | | ||
QUANTITATIVE AND QUALITATIVE DISCLOSURES ABOUT MARKET RISK | ||
ITEM 3. | QUANTITATIVE AND QUALITATIVE DISCLOSURES ABOUT MARKET RISK |
MARKET RISK
Market risk is the risk of loss arising from adverse changes in market rates and prices. We do not own or expect to own any material amounts of the refined products, natural gas or crude oil that are shipped through our pipelines, distributed through our terminals or held in our storage facilities, and therefore we have minimal direct exposure to risks associated with fluctuating commodity prices. As part of our acquisition of the North Dakota Gathering and Processing Assets, we acquired certain natural gas gathering and processing contracts structured as POP arrangements. Under these POP arrangements, we gather and process the producers’ natural gas and retain and market a portion of the natural gas and NGLs and remit a percentage of the proceeds to the producer. Under these arrangements, we will have exposure to fluctuations in commodity prices; however, this exposure is not expected to be material to our results of operations. Assuming all other factors remained constant, a 10% change in pricing, based on our year-to-date sales, would be less than $1 million to our consolidated operating income.
In addition, we are exposed to a limited degree of commodity price risk with respect to our gathering contracts.
Specifically, pursuant to our contracts, we retain and sell condensate that is recovered during the gathering of natural gas. Thus, a portion of our revenue is dependent on the price received for the condensate. Condensate historically sells at a price representing a slight discount to the price of crude oil. We consider our exposure to commodity price risk associated with these arrangements to be minimal based on the amount of revenues generated under these arrangements compared to our overall revenues. We do not hedge our exposure using commodity derivative instruments because of the minimal impact of commodity price risk on our liquidity, financial position and results of operations. Assuming all other factors remained constant, a $1 change in condensate pricing, based on our quarter-to-date average throughput, would be immaterial to our consolidated operating income for the three and nine months ended September 30, 2017. Actual results may differ from our expectation above.
There have been no other material changes to our market risks as of and for the nine months ended September 30, 2017 from the risks discussed in Part II, Item 7A of our Annual Report on Form 10-K for the year ended December 31, 2016.
ITEM 4. | CONTROLS AND PROCEDURES |
Our disclosure controls and procedures are designed to provide reasonable assurance that the information that we are required to disclose in reports we file under the Securities Exchange Act of 1934, as amended (“the Exchange Act”), is accumulated and appropriately communicated to management. There have been no significant changes in our internal controls over financial reporting (as defined by applicable SEC rules) during the quarter ended September 30, 2017, that have materially affected or are reasonably likely to materially affect these controls.
We carried out an evaluation required by Rule 13a-15(b) of the Exchange Act, under the supervision and with the participation of our management, including the Chief Executive Officer and Chief Financial Officer, of the effectiveness of the design and operation of our disclosure controls and procedures at the end of the reporting period. Based on that evaluation, the Chief Executive Officer and Chief Financial Officer concluded that our disclosure controls and procedures were effective as of the end of the reporting period.
September 30, 2017 | 39 | ||
LEGAL PROCEEDINGS, RISK FACTORS AND UNREGISTERED SHARES OF EQUITY SECURITIES | ||
PART II — OTHER INFORMATION
ITEM 1. | LEGAL PROCEEDINGS |
In the ordinary course of business, we may become party to lawsuits, administrative proceedings and governmental investigations, including environmental, regulatory and other matters. There were no new proceedings or material developments in proceedings that we previously reported in our Annual Report on Form 10-K for the year ended December 31, 2016 or our Quarterly Reports on Form 10-Q for the quarters ended March 31, 2017 and June 30, 2017. Although we cannot provide assurance, we believe that an adverse resolution of such proceedings would not have a material impact on our liquidity, financial position, or results of operations.
ITEM 1A. | RISK FACTORS |
There have been no material changes from the risk factors previously disclosed in Item 1A of our Annual Report on Form 10-K for the year ended December 31, 2016.
ITEM 2. | UNREGISTERED SALES OF EQUITY SECURITIES AND USE OF PROCEEDS |
We may acquire units to satisfy tax withholdings obligations in connection with the vesting of units issued to certain employees. There were no such units acquired during the three months ended September 30, 2017.
40 | | | ||
EXHIBITS | ||
ITEM 6. | EXHIBITS |
(a) Exhibits
Incorporated by Reference (File No. 1-35143, unless otherwise indicated) | ||||||||
Exhibit Number | Description of Exhibit | Form | Exhibit | Filing Date | ||||
‡ 2.1 | 8-K | 2.1 | 8/14/17 | |||||
2.2 | 8-K | 2.1 | 11/8/2017 | |||||
3.1 | 8-K | 3.1 | 8/1/2017 | |||||
3.2 | S-1 (File No. 333-171525) | 3.3 | 1/4/2011 | |||||
3.3 | 8-K | 3.2 | 8/1/2017 | |||||
3.4 | 10-Q | 3.4 | 5/9/2017 | |||||
3.5 | 8-K | 3.1 | 11/8/2017 | |||||
10.1 | 8-K | 10.1 | 8/14/17 | |||||
10.2 | 8-K | 10.2 | 8/14/17 | |||||
*31.1 | ||||||||
*31.2 | ||||||||
*32.1 | ||||||||
*32.2 | ||||||||
**101.INS | XBRL Instance Document | |||||||
**101.SCH | XBRL Taxonomy Extension Schema Document | |||||||
**101.CAL | XBRL Taxonomy Extension Calculation Linkbase Document | |||||||
**101.DEF | XBRL Taxonomy Extension Definition Linkbase Document | |||||||
**101.LAB | XBRL Taxonomy Extension Label Linkbase Document | |||||||
**101.PRE | XBRL Taxonomy Extension Presentation Linkbase Document | |||||||
‡ | Certain schedules have been omitted pursuant to Item 601(b)(2) of Regulation S-K. A copy of any omitted schedule will be furnished supplementally to the SEC on request. |
* | Filed herewith |
** | Submitted electronically herewith |
September 30, 2017 | 41 | ||
SIGNATURES
Pursuant to the requirements of the Securities Exchange Act of 1934, the Registrant has duly caused this report to be signed on its behalf by the undersigned hereunto duly authorized.
ANDEAVOR LOGISTICS LP | |||
By: | Tesoro Logistics GP, LLC | ||
Its general partner | |||
Date: | November 9, 2017 | By: | /s/ STEVEN M. STERIN |
Steven M. Sterin | |||
President and Chief Financial Officer | |||
(Principal Financial Officer and Duly Authorized Officer) | |||
42 | | | ||