Attached files
| file | filename |
|---|---|
| EX-99.1 - EX-99.1 - RAIT Financial Trust | ras-ex991_6.htm |
| 8-K - 8-K EARNINGS SUPPLEMENT - RAIT Financial Trust | ras-8k_20171102.htm |
Exhibit 99.2

Third Quarter 2017
Supplemental Information
1

TABLE OF CONTENTS
|
Company Information
|
3 |
|
Forward-Looking Statements
|
5 |
|
Earnings Release Text
|
6 |
|
Financial Highlights
|
11 |
|
Balance Sheets |
|
|
Consolidated by quarter |
12 |
|
Statements of Operations, FFO & CORE FFO |
|
|
Consolidated |
13 |
|
Consolidated – Trailing 5 Quarters |
14 |
|
Fee and Other Income
|
15 |
|
Adjusted EBITDA and Coverage Ratios
|
16 |
|
Portfolio Data: |
|
|
Loan Portfolio Data |
17 |
|
Real Estate Portfolio Data |
18 |
|
Real Estate Properties, Changes in the portfolio
|
19 |
|
Indebtedness Overview
|
20 |
|
Definitions |
21 |
2

RAIT Financial Trust
September 30, 2017
Company Information:
RAIT Financial Trust is an internally-managed real estate investment trust focused on providing debt financing options to owners of commercial real estate throughout the United States.
|
Corporate Headquarters |
Two Logan Square 100 N. 18th Street, 23rd Floor Philadelphia, Pa 19103 215.207.2100
|
|
Trading Symbol |
NYSE: “RAS”
|
|
Investor Relations Contact |
Andres Viroslav Two Logan Square 100 N. 18th Street, 23rd Floor Philadelphia, Pa 19103 215.207.2100 |
3
Common and Preferred Stock Information:
|
|
For the Three Months Ended |
|
|||||||||||||||||
|
|
September 30, 2017 |
|
|
June 30, 2017 |
|
|
March 31, 2017 |
|
|
December 31, 2016 |
|
|
September 30, 2016 |
|
|||||
|
Common: |
|
|
|
|
|
|
|
|
|
|
|
|
|
|
|
|
|
|
|
|
Share Price, period end |
$ |
0.73 |
|
|
$ |
2.19 |
|
|
$ |
3.20 |
|
|
$ |
3.36 |
|
|
$ |
3.38 |
|
|
Share Price, high |
$ |
2.25 |
|
|
$ |
3.18 |
|
|
$ |
3.91 |
|
|
$ |
3.45 |
|
|
$ |
3.40 |
|
|
Share Price, low |
$ |
0.55 |
|
|
$ |
1.90 |
|
|
$ |
2.80 |
|
|
$ |
2.41 |
|
|
$ |
2.88 |
|
|
Dividends declared |
$ |
- |
|
|
$ |
0.05 |
|
|
$ |
0.09 |
|
|
$ |
0.09 |
|
|
$ |
0.09 |
|
|
Dividend yield, period end |
|
0.0 |
% |
|
|
9.1 |
% |
|
|
11.3 |
% |
|
|
10.7 |
% |
|
|
10.7 |
% |
|
Common shares outstanding |
|
93,046,621 |
|
|
|
93,105,742 |
|
|
|
92,691,743 |
|
|
|
92,295,478 |
|
|
|
92,174,644 |
|
|
Weighted Average common shares, basic |
|
91,559,636 |
|
|
|
91,453,415 |
|
|
|
91,300,812 |
|
|
|
91,203,955 |
|
|
|
91,201,784 |
|
|
Weighted Average common shares, diluted |
|
91,559,636 |
|
|
|
91,453,415 |
|
|
|
91,300,812 |
|
|
|
91,971,817 |
|
|
|
91,201,784 |
|
|
|
|
|
|
|
|
|
|
|
|
|
|
|
|
|
|
|
|
|
|
|
Preferred: |
|
|
|
|
|
|
|
|
|
|
|
|
|
|
|
|
|
|
|
|
Series A |
|
|
|
|
|
|
|
|
|
|
|
|
|
|
|
|
|
|
|
|
Shares outstanding |
|
5,344,353 |
|
|
|
5,344,353 |
|
|
|
5,344,353 |
|
|
|
5,344,353 |
|
|
|
5,344,353 |
|
|
Share price, period end |
$ |
14.30 |
|
|
$ |
20.60 |
|
|
$ |
21.47 |
|
|
$ |
20.28 |
|
|
$ |
20.34 |
|
|
Par, per share |
$ |
25.00 |
|
|
$ |
25.00 |
|
|
$ |
25.00 |
|
|
$ |
25.00 |
|
|
$ |
25.00 |
|
|
Par |
$ |
133,608,825 |
|
|
$ |
133,608,825 |
|
|
$ |
133,608,825 |
|
|
$ |
133,608,825 |
|
|
$ |
133,608,825 |
|
|
Dividend |
$ |
0.484375 |
|
|
$ |
0.484375 |
|
|
$ |
0.484375 |
|
|
$ |
0.484375 |
|
|
$ |
0.484375 |
|
|
Yield |
|
13.5 |
% |
|
|
9.4 |
% |
|
|
9.0 |
% |
|
|
9.6 |
% |
|
|
9.5 |
% |
|
Series B |
|
|
|
|
|
|
|
|
|
|
|
|
|
|
|
|
|
|
|
|
Shares outstanding |
|
2,340,969 |
|
|
|
2,340,969 |
|
|
|
2,340,969 |
|
|
|
2,340,969 |
|
|
|
2,340,969 |
|
|
Share price, period end |
$ |
15.17 |
|
|
$ |
22.90 |
|
|
$ |
22.85 |
|
|
$ |
21.26 |
|
|
$ |
21.76 |
|
|
Par, per share |
$ |
25.00 |
|
|
$ |
25.00 |
|
|
$ |
25.00 |
|
|
$ |
25.00 |
|
|
$ |
25.00 |
|
|
Par |
$ |
58,524,225 |
|
|
$ |
58,524,225 |
|
|
$ |
58,524,225 |
|
|
$ |
58,524,225 |
|
|
$ |
58,524,225 |
|
|
Dividend |
$ |
0.5234375 |
|
|
$ |
0.5234375 |
|
|
$ |
0.5234375 |
|
|
$ |
0.5234375 |
|
|
$ |
0.5234375 |
|
|
Yield |
|
13.8 |
% |
|
|
9.1 |
% |
|
|
9.2 |
% |
|
|
9.8 |
% |
|
|
9.6 |
% |
|
Series C |
|
|
|
|
|
|
|
|
|
|
|
|
|
|
|
|
|
|
|
|
Shares outstanding |
|
1,640,425 |
|
|
|
1,640,425 |
|
|
|
1,640,425 |
|
|
|
1,640,425 |
|
|
|
1,640,425 |
|
|
Share price, period end |
$ |
15.74 |
|
|
$ |
23.98 |
|
|
$ |
24.00 |
|
|
$ |
22.56 |
|
|
$ |
22.93 |
|
|
Par, per share |
$ |
25.00 |
|
|
$ |
25.00 |
|
|
$ |
25.00 |
|
|
$ |
25.00 |
|
|
$ |
25.00 |
|
|
Par |
$ |
41,010,625 |
|
|
$ |
41,010,625 |
|
|
$ |
41,010,625 |
|
|
$ |
41,010,625 |
|
|
$ |
41,010,625 |
|
|
Dividend |
$ |
0.5546875 |
|
|
$ |
0.5546875 |
|
|
$ |
0.5546875 |
|
|
$ |
0.5546875 |
|
|
$ |
0.5546875 |
|
|
Yield |
|
14.1 |
% |
|
|
9.3 |
% |
|
|
9.2 |
% |
|
|
9.8 |
% |
|
|
9.7 |
% |
|
Series D (not publicly traded) |
|
|
|
|
|
|
|
|
|
|
|
|
|
|
|
|
|
|
|
|
Shares outstanding |
|
3,133,720 |
|
|
|
3,133,720 |
|
|
|
3,536,000 |
|
|
|
3,536,000 |
|
|
|
4,000,000 |
|
|
Par, per share |
$ |
25.00 |
|
|
$ |
25.00 |
|
|
$ |
25.00 |
|
|
$ |
25.00 |
|
|
$ |
25.00 |
|
|
Par |
$ |
78,343,000 |
|
|
$ |
78,343,000 |
|
|
$ |
88,400,000 |
|
|
$ |
88,400,000 |
|
|
$ |
100,000,000 |
|
|
Coupon |
|
8.50 |
% |
|
|
8.50 |
% |
|
|
8.50 |
% |
|
|
8.50 |
% |
|
|
8.50 |
% |
4
This supplement may contain certain forward-looking statements within the meaning of Section 27A of the Securities Act of 1933, as amended, and Section 21E of the Securities Exchange Act of 1934, as amended. Such forward-looking statements can generally be identified by our use of forward-looking terminology such as “may,” “plan”, “should,” “expect,” “intend,” “anticipate,” “estimate,” “believe,” “seek,” “opportunities,” “transform,” “target”, “in the process” “transformation,” “focus,” “progress,” ‘on-track,” or other similar words or terms of a future or forward-looking nature. RAIT’s forward-looking statements in this press release include, but are not limited to, statements regarding (i) RAIT’s review of its strategic and financial alternatives, (ii) RAIT’s initiatives to further simplify its business to focus on its commercial real estate lending business, reduce costs, reduce indebtedness and enhance value and returns for shareholders, (iii) RAIT’s actions taken or contemplated to enhance its long-term prospects and create value for its shareholders, (iv) RAIT’s suspension of the dividend on RAIT’s common shares and any potential future reinstatement thereof, (v) RAIT’s intention to cure the deficiency set forth in the Notice, (vi) any options RAIT may take in an effort to cure this deficiency and possible consequences to RAIT of the Notice, (vii) RAIT’s aggregating loans for RAIT’s eighth floating-rate loan securitization, including the anticipated closing date of such transaction, and (viii) RAIT’s expectation that it will continue to make further progress executing on its strategic transformation throughout 2017. Such forward-looking statements are based upon RAIT’s historical performance and its current plans, estimates, predictions and expectations and are not a representation that such plans, estimates, predictions or expectations will be achieved. Because such statements include risks, uncertainties and contingencies, actual results may differ materially from the expectations, intentions, beliefs, plans or predictions of the future expressed or implied by such forward-looking statements. Risks, uncertainties and contingencies that may affect the results expressed or implied by RAIT’s forward-looking statements include, but are not limited to: (i) the effect of the announcement of RAIT’s review of, or any implementation of, strategic and financial alternatives on RAIT’s business, including its financial and operating results and its employees, capital sources and customers, (ii) RAIT’s ability to implement any new strategic and financial alternatives or continue its previously announced transition to a more focused, cost-efficient and lower leverage business, (iii) RAIT’s ability to continue to sell properties and repay the related debt, (iv) final accounting determinations on gains or losses realized in the event properties or other assets are sold or liabilities repurchased for prices that differ from their carrying value or if property valuations are adjusted in the process of revaluating properties when they are characterized as held for disposition or sale, (v) whether and, if so, when, the Board would determine to resume declaring a dividend on RAIT’s common shares and whether the Board will continue to declare a dividend on RAIT’s preferred shares, (vi) whether RAIT will be able to regain compliance with NYSE listing requirements or maintain compliance with the other continued listing requirements set forth in the NYSE Listed Company Manual; (vii) whether RAIT will be able to continue to divest RAIT’s legacy REO portfolio and existing property management operations and the majority of RAIT’s non-lending assets, including whether the closing conditions relating to properties RAIT has under contract to sell will be satisfied or whether RAIT and the applicable buyers will otherwise be able to complete such sales; (viii) whether anticipated cost savings from the internalization of Independence Realty Trust, Inc. will be achieved; (ix) whether the divestiture of RAIT’s commercial real estate portfolio and other non-lending assets will lead to lower asset management costs and lower expenses; (x) whether RAIT will continue to be able to further reduce compensation and G&A expenses and indebtedness; (xi) whether RAIT’s changes to its Board composition and leadership and to its executive management team will lead to enhanced value for shareholders; (xii) whether RAIT will be able to create sustainable earnings and grow book value; (xiii) whether RAIT will be able to successfully redeploy capital from non-lending related asset sales; (xiii) whether RAIT will be able to increase loan origination levels; (xiv) whether the disposition of non-core assets, reductions in debt levels and expected loan repayments will impact RAIT’s earnings and CAD; (xv) whether RAIT will be able to organically increase reliance on match-funded asset-level debt; (xvi) overall conditions in commercial real estate and the economy generally; (xvii) whether market conditions will enable us to continue to implement our capital recycling and debt reduction plan involving selling properties and repurchasing or paying down our debt; (xviii) whether we will be able to originate sufficient bridge loans; (xix) changes in the expected yield of our investments; (xx) changes in financial markets and interest rates, or to the business or financial condition of RAIT or its business; (xxi) whether RAIT will generate any CMBS gain on sale profits; (xxii) whether our management changes will be successfully implemented; (xxiii) whether RAIT will be able to aggregate sufficient loans or whether market conditions will permit RAIT to complete future securitizations of floating rate loans, including RAIT’s currently contemplated eighth floating-rate loan securitization; (xxiv) whether and when RAIT will be able to recognize a gain, which will offset the previously reported non-cash loss on deconsolidation of its industrial real estate portfolio; (xxv) whether RAIT will have any legal obligations on the non-recourse debt on its industrial real estate portfolio;; (xxvi) increases to RAIT’s leverage or decreases in total common equity resulting from such determinations or revaluation; (xxvii) the availability of financing and capital, including through the capital and securitization markets; (xxviii) whether the credit quality of RAIT’s post-financial crisis loans and financing structures will continue to perform as expected; (xxix) whether RAIT will need to recognize further non-cash asset and/or goodwill impairment charges in future quarters and the effect of such charges, including with respect to RAIT’s compliance with the financial covenants set forth in its debt instruments; (xxx) whether RAIT will be able to recognize a gain upon the redemption of the Warrants and SARs and, if so, the amount thereof; (xxxi) whether any expressions of interest received by RAIT or discussions RAIT has engaged in relating to RAIT’s strategic and financial alternatives will result in any transaction or the timing or nature of any such transaction; and (xxxii) other factors described in RAIT’s Annual Report on Form 10-K, Quarterly Reports on Form 10-Q and other filings with the SEC. If RAIT’s common shares ultimately were to be suspended from trading on, and delisted from, the NYSE for any reason, it could have material adverse consequences on RAIT including, among others: triggering the right of holders of our secured notes and convertible notes to require us to repurchase their notes, satisfying one condition which, if all other relevant conditions were satisfied, would trigger an increased dividend rate on RAIT’s series C preferred shares, possibly triggering non-compliance with covenants applicable to RAIT’s series D preferred shares and would likely result in the delisting of our preferred shares and senior
5
notes currently listed on the NYSE. Delisting of RAIT’s common shares could also negatively affect RAIT’s ability to implement any new strategic and financial alternatives or continue its previously announced transition to a more focused, cost-efficient and lower leverage business, lower demand and market price for RAIT’s common shares, reduce interest in RAIT from investors, analysts and other market participants and/or adversely affect RAIT’s ability to raise additional capital, complete future securitizations of floating rate loans and attract and retain employees by means of equity compensation. RAIT undertakes no obligation to update these forward-looking statements to reflect events or circumstances after the date hereof or to reflect the occurrence of unanticipated events, except as may be required by law.
6
RAIT Financial Trust Announces Third Quarter 2017 Financial Results
RAIT continues making progress with its strategic transformation into a more focused, cost-efficient, pure play commercial real estate lender
PHILADELPHIA, PA — November 2, 2017 — RAIT Financial Trust (“RAIT”) (NYSE: RAS) — today announced its financial results for the third quarter of 2017. All per share results in this press release are reported on a diluted basis.
Q3 2017 Key Highlights
|
|
- |
Net loss available to common shares of $(24.2) million, $(0.26) loss per share-diluted, and cash available for distribution (“CAD”) of $(1.3) million, or $(0.01) per common share, during the quarter ended September 30, 2017. |
|
|
- |
Senior loan originations of $100.6 million during the quarter ended September 30, 2017, which is an increase from $25.6 million in senior loan originations during the quarter ended September 30, 2016. |
|
|
- |
Senior loan originations of $375.3 million during the nine-month period ended September 30, 2017, surpassing total loan originations for all of 2016, which totaled $156.8 million. |
|
|
- |
RAIT sold three properties and divested seven properties totaling $63.3 million, in the aggregate, during the quarter ended September 30, 2017 and subsequently sold three additional properties totaling $65.3 million through November 1, 2017. From January 1, 2017 through November 1, 2017, RAIT sold or divested $339.8 million of its properties and reduced $275.9 million of its related indebtedness. Since the beginning of 2016, RAIT has sold or divested $677.7 million of its properties and reduced $571.8 million of its related indebtedness. |
|
|
- |
Total recourse debt, excluding RAIT’s secured warehouse facilities, declined by $10.2 million, or 3.2%, during the quarter ended September 30, 2017 and has declined $113.4 million, or 27.2%, since January 1, 2016. RAIT has no remaining recourse debt maturities in 2017, excluding RAIT’s secured warehouse facilities. |
|
|
- |
On September 7, 2017, the Board of Trustees of RAIT (the “Board”) formed a special committee to explore strategic and financial alternatives to enhance shareholder value and capitalize on RAIT’s real estate lending platform. |
|
|
- |
On November 1, 2017, the Board declared fourth quarter dividends on RAIT’s preferred shares and suspended dividends on RAIT’s common shares. |
Scott Davidson, RAIT’s Chief Executive Officer said, “During the quarter, we continued to make meaningful progress on our strategic transformation and focusing RAIT on its lending activities. Though our reported results continue to be impacted by the short-term effects from executing on our strategic plan, our lending business performed well, we continued making headway selling our property portfolio and we made further progress reducing our debt. We remain focused on growing our lending activities over the long term and, in the near term, on aggregating loans for our eighth floating-rate CMBS transaction.”
Financial Results
|
|
- |
GAAP loss per share of $(0.26) for the quarter ended September 30, 2017, compared to loss per share of $(0.00) for the quarter ended September 30, 2016. The GAAP loss per share for the quarter ended September 30, 2017 includes a $(0.04) per share, non-cash loss on deconsolidation of seven properties which RAIT expects to be offset by a gain on deconsolidation in future periods. RAIT incurred a provision for loan losses against certain legacy CRE loans of $5.5 million and non-cash asset impairment charges of $3.1 million for the quarter ended September 30, 2017. |
|
|
- |
GAAP loss per share of $(1.97) for the nine months ended September 30, 2017 compared to loss per share of $(0.28) for the nine months ended September 30, 2016. The increase in GAAP loss per share for the stated nine-month period was primarily caused by the previously announced non-cash asset impairment charges and provision for loan losses on certain legacy CRE loans. |
|
|
- |
CAD per share of $(0.01) for the quarter ended September 30, 2017, compared to $0.12 per share for the quarter ended September 30, 2016. |
7
|
|
- |
CAD per share of $0.00 for the nine months ended September 30, 2017, compared to $0.37 per share for the nine months ended September 30, 2016. |
|
|
- |
RAIT’s compensation and G&A expense declined by 16.8% for the quarter ended September 30, 2017 compared to the quarter ended September 30, 2016. RAIT’s compensation and G&A expense declined 14.9% for the nine months ended September 30, 2017 compared to the nine months ended September 30, 2016. The decline in compensation and G&A expense is primarily due to a decrease in the number of employees and a decrease across multiple types of general and administrative expenses as part of our strategic transformation and transition to a simpler and more cost-efficient business model. |
|
|
- |
RAIT’s total indebtedness, based on principal amount, declined by 10.0%, or $161.7 million, during the quarter ended September 30, 2017, and 40.6%, or $995.6 million, from January 1, 2016 to September 30, 2017. |
|
|
- |
RAIT reported a loss on deconsolidation of properties of $(20.0) million or $(0.22) per common share for the nine months ended September 30, 2017. RAIT expects this loss on deconsolidation to be offset by a gain on deconsolidation in future periods. |
|
|
- |
RAIT expects to recognize a $5.5 million gain in its fourth quarter 2017 financial results related to the purchase by RAIT for $20.5 million of common share purchase warrants (the “Warrants”) and common share appreciation rights (the “SARs”) pursuant to the exercise by the holder of a put right with respect to the Warrants and SARs. RAIT had classified both Warrants and SARs as liabilities and included their combined fair value in RAIT’s liabilities. This gain would represent the excess of this fair value over the purchase price. |
Commercial Real Estate (“CRE”) Lending Business
|
|
- |
RAIT’s senior loan originations increased 294% to $100.6 million during the quarter ended September 30, 2017 from $25.6 million in senior loans originated during the quarter ended September 30, 2016. RAIT is also in the process of aggregating loans for RAIT’s eighth floating-rate loan securitization. |
|
|
- |
RAIT increased total loan originations 321% to $375.3 million during the nine-month period ended September 30, 2017 from $89.2 million in loans originated during the nine-month period ended September 30, 2016, surpassing total loan originations for all of 2016, which totaled $156.8 million. |
|
|
- |
CRE loan repayments were $110.0 million and $384.6 million for the quarter and nine-month period ended September 30, 2017, respectively. |
CRE Property Portfolio and Property Sales
|
|
- |
The gross carrying amount of RAIT’s real estate portfolio, as of September 30, 2017, declined by $453.8 million since December 31, 2016 to a gross carrying amount of $399.7 million. This decline is due to sales, divestitures, depreciation and property impairments on legacy properties. |
|
|
- |
Subsequent to September 30, 2017, RAIT sold three properties totaling $65.3 million, reducing the gross carrying amount of RAIT’s real estate portfolio to approximately $336 million at November 1, 2017. |
|
|
- |
As of September 30, 2017, RAIT had 24 properties with a gross carrying amount of $399.7 million. Due to the subsequent property sales described above, at November 1, 2017, RAIT had 21 properties with a gross carrying amount of approximately $336 million consisting of 15 properties with a gross carrying amount of approximately $238 million in various stages of the selling process and six properties with a gross carrying amount of $97.7 million classified as held for investment. |
Other Developments
Dividends
8
|
|
- |
On November 1, 2017, the Board decided to suspend the dividend on RAIT’s common shares. The Board expects to consider whether to reinstate a dividend on RAIT’s common shares after RAIT completes its previously announced strategic transformation and exploration of strategic and financial alternatives. |
Strategic and Financial Alternatives
|
|
- |
RAIT previously announced the formation of a committee of independent members of the Board (the “Special Committee”) to explore and evaluate strategic and financial alternatives to enhance shareholder value. The Special Committee continues to work diligently with Barclays and UBS Investment Bank on this process. Expressions of interest have been received from, and discussions are advancing with, multiple parties with respect to a potential transaction involving RAIT. There can be no assurance that any transaction will result from this process or as to the timing or nature of such potential transaction. |
NYSE Notice
|
|
- |
As previously disclosed, effective September 21, 2017, RAIT received written notification (the “Notice”) from the New York Stock Exchange (the “NYSE”) that RAIT was not in compliance with the continued listing standard set forth under Rule 802.01C of the NYSE Listed Company Manual because the average closing price of RAIT’s common shares fell below $1.00 over a consecutive 30 trading-day period ending September 15, 2017. Upon receipt of the Notice, RAIT became subject to the procedures set forth in Rule 802.01C of the NYSE Listed Company Manual, and in accordance with such procedures, RAIT acknowledged receipt of the Notice and notified the NYSE of its intention to seek to cure the deficiency set forth therein. RAIT is considering various options it may take in an effort to cure this deficiency and regain compliance with Rule 802.01C of the NYSE Listed Company Manual. |
Non-GAAP Financial Measures and Definitions
RAIT discloses the following non-GAAP financial measures in this release: funds from operations (“FFO”) and CAD. A reconciliation of RAIT’s reported net income (loss) allocable to common shares to its FFO and CAD is included as Schedule IV to this release. See Schedule VI to this release for management’s respective definitions and rationales for the usefulness of each of these non-GAAP financial measures and other definitions used in this release.
Supplemental Information
RAIT produces supplemental information that includes details regarding the performance of the portfolio, financial information, FFO, CAD and other non-GAAP financial measures and other useful information for investors. Reconciliations of these non-GAAP financial measures to their respective most directly comparable GAAP measures are also included in this supplemental information. The supplemental information also contains deconsolidating financial information. The supplemental information is available via the Company's website, www.rait.com, through the "Investor Relations" section.
Conference Call to Discuss Results for RAIT’s Third Fiscal Quarter of 2017
RAIT will be conducting a conference call to discuss its financial results for its third fiscal quarter of 2017 at 9:00 AM ET on Thursday, November 2, 2017. All interested parties can listen to the live conference call webcast from the home page of the RAIT Financial Trust website at www.rait.com or by dialing 1.844.775.2541, access code 95365064. For those who are not available to listen to the live call, the replay will be available shortly following the live call on RAIT’s website and telephonically until Thursday, November 9, 2017, by dialing 855.859.2056, access code 95365064.
About RAIT Financial Trust
RAIT Financial Trust is an internally-managed real estate investment trust focused on providing debt financing options to owners of commercial real estate throughout the United States. For more information, please visit www.rait.com or call Investor Relations at 215.207.2100.
This press release may contain certain forward-looking statements within the meaning of Section 27A of the Securities Act of 1933, as amended, and Section 21E of the Securities Exchange Act of 1934, as amended. Such forward-looking statements can generally be identified by our use of forward-looking terminology such as “may,” “plan”, “should,” “expect,” “intend,” “anticipate,” “estimate,” “believe,” “seek,” “opportunities,” “transform,” “target”, “in the process” “transformation,”
9
“focus,” “progress,” ‘on-track,” or other similar words or terms of a future or forward-looking nature. RAIT’s forward-looking statements in this press release include, but are not limited to, statements regarding (i) RAIT’s review of its strategic and financial alternatives, (ii) RAIT’s initiatives to further simplify its business to focus on its commercial real estate lending business, reduce costs, reduce indebtedness and enhance value and returns for shareholders, (iii) RAIT’s actions taken or contemplated to enhance its long-term prospects and create value for its shareholders, (iv) RAIT’s suspension of the dividend on RAIT’s common shares and any potential future reinstatement thereof, (v) RAIT’s intention to cure the deficiency set forth in the Notice, (vi) any options RAIT may take in an effort to cure this deficiency and possible consequences to RAIT of the Notice, (vii) RAIT’s aggregating loans for RAIT’s eighth floating-rate loan securitization, including the anticipated closing date of such transaction, and (viii) RAIT’s expectation that it will continue to make further progress executing on its strategic transformation throughout 2017. Such forward-looking statements are based upon RAIT’s historical performance and its current plans, estimates, predictions and expectations and are not a representation that such plans, estimates, predictions or expectations will be achieved. Because such statements include risks, uncertainties and contingencies, actual results may differ materially from the expectations, intentions, beliefs, plans or predictions of the future expressed or implied by such forward-looking statements. Risks, uncertainties and contingencies that may affect the results expressed or implied by RAIT’s forward-looking statements include, but are not limited to: (i) the effect of the announcement of RAIT’s review of, or any implementation of, strategic and financial alternatives on RAIT’s business, including its financial and operating results and its employees, capital sources and customers, (ii) RAIT’s ability to implement any new strategic and financial alternatives or continue its previously announced transition to a more focused, cost-efficient and lower leverage business, (iii) RAIT’s ability to continue to sell properties and repay the related debt, (iv) final accounting determinations on gains or losses realized in the event properties or other assets are sold or liabilities repurchased for prices that differ from their carrying value or if property valuations are adjusted in the process of revaluating properties when they are characterized as held for disposition or sale, (v) whether and, if so, when, the Board would determine to resume declaring a dividend on RAIT’s common shares and whether the Board will continue to declare a dividend on RAIT’s preferred shares, (vi) whether RAIT will be able to regain compliance with NYSE listing requirements or maintain compliance with the other continued listing requirements set forth in the NYSE Listed Company Manual; (vii) whether RAIT will be able to continue to divest RAIT’s legacy REO portfolio and existing property management operations and the majority of RAIT’s non-lending assets, including whether the closing conditions relating to properties RAIT has under contract to sell will be satisfied or whether RAIT and the applicable buyers will otherwise be able to complete such sales; (viii) whether anticipated cost savings from the internalization of Independence Realty Trust, Inc. will be achieved; (ix) whether the divestiture of RAIT’s commercial real estate portfolio and other non-lending assets will lead to lower asset management costs and lower expenses; (x) whether RAIT will continue to be able to further reduce compensation and G&A expenses and indebtedness; (xi) whether RAIT’s changes to its Board composition and leadership and to its executive management team will lead to enhanced value for shareholders; (xii) whether RAIT will be able to create sustainable earnings and grow book value; (xiii) whether RAIT will be able to successfully redeploy capital from non-lending related asset sales; (xiii) whether RAIT will be able to increase loan origination levels; (xiv) whether the disposition of non-core assets, reductions in debt levels and expected loan repayments will impact RAIT’s earnings and CAD; (xv) whether RAIT will be able to organically increase reliance on match-funded asset-level debt; (xvi) overall conditions in commercial real estate and the economy generally; (xvii) whether market conditions will enable us to continue to implement our capital recycling and debt reduction plan involving selling properties and repurchasing or paying down our debt; (xviii) whether we will be able to originate sufficient bridge loans; (xix) changes in the expected yield of our investments; (xx) changes in financial markets and interest rates, or to the business or financial condition of RAIT or its business; (xxi) whether RAIT will generate any CMBS gain on sale profits; (xxii) whether our management changes will be successfully implemented; (xxiii) whether RAIT will be able to aggregate sufficient loans or whether market conditions will permit RAIT to complete future securitizations of floating rate loans, including RAIT’s currently contemplated eighth floating-rate loan securitization; (xxiv) whether and when RAIT will be able to recognize a gain, which will offset the previously reported non-cash loss on deconsolidation of its industrial real estate portfolio; (xxv) whether RAIT will have any legal obligations on the non-recourse debt on its industrial real estate portfolio;; (xxvi) increases to RAIT’s leverage or decreases in total common equity resulting from such determinations or revaluation; (xxvii) the availability of financing and capital, including through the capital and securitization markets; (xxviii) whether the credit quality of RAIT’s post-financial crisis loans and financing structures will continue to perform as expected; (xxix) whether RAIT will need to recognize further non-cash asset and/or goodwill impairment charges in future quarters and the effect of such charges, including with respect to RAIT’s compliance with the financial covenants set forth in its debt instruments; (xxx) whether RAIT will be able to recognize a gain upon the redemption of the Warrants and SARs and, if so, the amount thereof; (xxxi) whether any expressions of interest received by RAIT or discussions RAIT has engaged in relating to RAIT’s strategic and financial alternatives will result in any transaction or the timing or nature of any such transaction; and (xxxii) other factors described in RAIT’s Annual Report on Form 10-K, Quarterly Reports on Form 10-Q and other filings with the SEC. If RAIT’s common shares ultimately were to be suspended from trading on, and delisted from, the NYSE for any reason, it could have material adverse consequences on RAIT including, among others: triggering the right of holders of our secured notes and convertible notes to require us to repurchase their notes, satisfying one condition which, if all other relevant conditions were satisfied, would trigger an increased dividend rate on RAIT’s series C preferred shares, possibly triggering non-compliance with covenants applicable to RAIT’s series D preferred
10
shares and would likely result in the delisting of our preferred shares and senior notes currently listed on the NYSE. Delisting of RAIT’s common shares could also negatively affect RAIT’s ability to implement any new strategic and financial alternatives or continue its previously announced transition to a more focused, cost-efficient and lower leverage business, lower demand and market price for RAIT’s common shares, reduce interest in RAIT from investors, analysts and other market participants and/or adversely affect RAIT’s ability to raise additional capital, complete future securitizations of floating rate loans and attract and retain employees by means of equity compensation. RAIT undertakes no obligation to update these forward-looking statements to reflect events or circumstances after the date hereof or to reflect the occurrence of unanticipated events, except as may be required by law.
RAIT Financial Trust Contact
Andres Viroslav
215-207-2100
aviroslav@rait.com
11
|
($'s in 000's) |
|
For the Three Months Ended |
|
|||||||||||||||||
|
|
|
September 30, 2017 |
|
|
June 30, 2017 |
|
|
March 31, 2017 |
|
|
December 31, 2016 |
|
|
September 30, 2016 |
|
|||||
|
OPERATING DATA: |
|
|
|
|
|
|
|
|
|
|
|
|
|
|
|
|
|
|
|
|
|
Lending: |
|
|
|
|
|
|
|
|
|
|
|
|
|
|
|
|
|
|
|
|
|
Investments in loans |
|
$ |
1,260,346 |
|
|
$ |
1,267,705 |
|
|
$ |
1,315,539 |
|
|
$ |
1,292,639 |
|
|
$ |
1,373,615 |
|
|
Gross loan production |
|
$ |
100,585 |
|
|
$ |
154,675 |
|
|
$ |
120,040 |
|
|
$ |
67,540 |
|
|
$ |
25,550 |
|
|
Weighted average interest rate of loan production (a) |
|
|
5.4 |
% |
|
|
5.7 |
% |
|
|
5.6 |
% |
|
|
5.6 |
% |
|
|
5.7 |
% |
|
CMBS income |
|
$ |
25 |
|
|
$ |
5 |
|
|
$ |
16 |
|
|
$ |
20 |
|
|
$ |
305 |
|
|
CMBS loans sold |
|
$ |
- |
|
|
$ |
- |
|
|
$ |
- |
|
|
$ |
- |
|
|
$ |
13,800 |
|
|
Average CMBS Gain on Sale (points) |
|
|
- |
|
|
|
- |
|
|
|
- |
|
|
|
- |
|
|
|
2.2 |
|
|
|
|
|
|
|
|
|
|
|
|
|
|
|
|
|
|
|
|
|
|
|
|
Real estate portfolio: |
|
|
|
|
|
|
|
|
|
|
|
|
|
|
|
|
|
|
|
|
|
Gross real estate investments |
|
$ |
399,674 |
|
|
$ |
470,249 |
|
|
$ |
694,230 |
|
|
$ |
854,646 |
|
|
$ |
965,362 |
|
|
Property dispositions |
|
$ |
63,260 |
|
|
$ |
73,153 |
|
|
$ |
138,326 |
|
|
$ |
146,068 |
|
|
$ |
125,900 |
|
|
Property income |
|
$ |
15,012 |
|
|
$ |
16,946 |
|
|
$ |
20,065 |
|
|
$ |
23,501 |
|
|
$ |
29,614 |
|
|
Operating expenses |
|
$ |
8,313 |
|
|
$ |
9,509 |
|
|
$ |
10,634 |
|
|
$ |
13,084 |
|
|
$ |
14,635 |
|
|
Net operating income |
|
$ |
6,699 |
|
|
$ |
7,437 |
|
|
$ |
9,431 |
|
|
$ |
10,417 |
|
|
$ |
14,979 |
|
|
NOI margin |
|
|
44.6 |
% |
|
|
43.9 |
% |
|
|
47.0 |
% |
|
|
44.3 |
% |
|
|
50.6 |
% |
|
|
|
|
|
|
|
|
|
|
|
|
|
|
|
|
|
|
|
|
|
|
|
EARNINGS & DIVIDENDS: |
|
|
|
|
|
|
|
|
|
|
|
|
|
|
|
|
|
|
|
|
|
Earnings (loss) per share from continuing operations - diluted |
|
$ |
(0.26 |
) |
|
$ |
(1.38 |
) |
|
$ |
(0.33 |
) |
|
$ |
(0.37 |
) |
|
$ |
(0.02 |
) |
|
Earnings (loss) per share from discontinued operations - diluted |
|
$ |
- |
|
|
$ |
- |
|
|
$ |
- |
|
|
$ |
0.54 |
|
|
$ |
0.02 |
|
|
Earnings (loss) per share -- diluted |
|
$ |
(0.26 |
) |
|
$ |
(1.38 |
) |
|
$ |
(0.33 |
) |
|
$ |
0.17 |
|
|
$ |
- |
|
|
FFO per share |
|
$ |
(0.18 |
) |
|
$ |
(0.54 |
) |
|
$ |
(0.30 |
) |
|
$ |
0.05 |
|
|
$ |
0.12 |
|
|
CAD per share (b) |
|
$ |
(0.01 |
) |
|
$ |
(0.04 |
) |
|
$ |
0.06 |
|
|
$ |
0.07 |
|
|
$ |
0.12 |
|
|
Dividends per share |
|
$ |
- |
|
|
$ |
0.05 |
|
|
$ |
0.09 |
|
|
$ |
0.09 |
|
|
$ |
0.09 |
|
|
CAD payout ratio |
|
|
0.0 |
% |
|
|
-125.0 |
% |
|
|
150.0 |
% |
|
|
128.6 |
% |
|
|
75.0 |
% |
|
|
|
|
|
|
|
|
|
|
|
|
|
|
|
|
|
|
|
|
|
|
|
RECOURSE DEBT REDUCTIONS: |
|
|
|
|
|
|
|
|
|
|
|
|
|
|
|
|
|
|
|
|
|
Reductions of recourse debt, excluding warehouse facilities |
|
$ |
10,160 |
|
|
$ |
14,500 |
|
|
$ |
32,000 |
|
|
$ |
2,000 |
|
|
$ |
2,000 |
|
|
|
|
|
|
|
|
|
|
|
|
|
|
|
|
|
|
|
|
|
|
|
|
CAPITALIZATION AND COVERAGE RATIOS: |
|
|
|
|
|
|
|
|
|
|
|
|
|
|
|
|
|
|
|
|
|
Recourse/Non-Recourse Debt: |
|
|
|
|
|
|
|
|
|
|
|
|
|
|
|
|
|
|
|
|
|
Recourse |
|
$ |
410,042 |
|
|
$ |
328,858 |
|
|
$ |
439,733 |
|
|
$ |
365,921 |
|
|
$ |
509,938 |
|
|
Non-Recourse |
|
|
976,996 |
|
|
|
1,218,329 |
|
|
|
1,142,815 |
|
|
|
1,361,246 |
|
|
|
1,441,510 |
|
|
Total Recourse/Non-Recourse debt |
|
|
1,387,038 |
|
|
|
1,547,187 |
|
|
|
1,582,548 |
|
|
|
1,727,167 |
|
|
|
1,951,448 |
|
|
Preferred shares (par) |
|
|
311,487 |
|
|
|
311,487 |
|
|
|
321,544 |
|
|
|
321,544 |
|
|
|
333,144 |
|
|
Common shares (market capitalization) |
|
|
67,924 |
|
|
|
203,902 |
|
|
|
296,669 |
|
|
|
310,113 |
|
|
|
311,550 |
|
|
Noncontrolling interests, at carrying value (c) |
|
|
3,880 |
|
|
|
3,880 |
|
|
|
5,506 |
|
|
|
5,386 |
|
|
|
5,386 |
|
|
Total capitalization |
|
$ |
1,770,329 |
|
|
$ |
2,066,456 |
|
|
$ |
2,206,267 |
|
|
$ |
2,364,210 |
|
|
$ |
2,601,528 |
|
|
|
|
|
|
|
|
|
|
|
|
|
|
|
|
|
|
|
|
|
|
|
|
Total Liabilities/Total Gross Assets |
|
|
84.4 |
% |
|
|
84.3 |
% |
|
|
76.3 |
% |
|
|
76.2 |
% |
|
|
74.9 |
% |
|
Total Liabilities + Preferred/Total Gross Assets |
|
|
100.8 |
% |
|
|
99.2 |
% |
|
|
90.0 |
% |
|
|
88.8 |
% |
|
|
83.0 |
% |
|
|
|
|
|
|
|
|
|
|
|
|
|
|
|
|
|
|
|
|
|
|
|
Interest Coverage (d) |
|
|
1.20 |
x |
|
|
0.96 |
x |
|
|
1.34 |
x |
|
|
1.40 |
x |
|
|
1.85 |
x |
|
Interest + Preferred Coverage (e) |
|
|
0.85 |
x |
|
|
0.68 |
x |
|
|
0.94 |
x |
|
|
1.00 |
x |
|
|
1.46 |
x |
|
|
|
|
|
|
|
|
|
|
|
|
|
|
|
|
|
|
|
|
|
|
|
OTHER KEY BENCHMARKS: |
|
|
|
|
|
|
|
|
|
|
|
|
|
|
|
|
|
|
|
|
|
Total Assets Under Management (AUM) |
|
$ |
2,929,378 |
|
|
$ |
3,170,495 |
|
|
$ |
3,390,885 |
|
|
$ |
3,575,224 |
|
|
$ |
5,128,101 |
|
|
Total Gross Assets |
|
$ |
1,902,295 |
|
|
$ |
2,081,631 |
|
|
$ |
2,347,452 |
|
|
$ |
2,556,302 |
|
|
$ |
4,118,215 |
|
|
|
(a) |
At the time of loan origination. |
|
|
(b) |
For the three months ended June 30, 2017, CAD includes the non-cash effect of a $3,636 write-off of accrued interest receivable related to a loan that was determined to be impaired during the period. CAD would have been $0.00 per share without the effect of this non-cash write-off. |
|
|
(c) |
Excludes noncontrolling interests associated with discontinued operations. |
|
|
(d) |
For the three months ended June 30, 2017, Interest Coverage includes the non-cash effect of a $3,636 write-off of accrued interest receivable related to a loan that was determined to be impaired during the period. Interest Coverage would have been 1.19x without the effect of this non-cash write-off. |
|
|
(e) |
For the three months ended June 30, 2017, Interest + Preferred Coverage includes the non-cash effect of a $3,636 write-off of accrued interest receivable related to a loan that was determined to be impaired during the period. Interest + Preferred Coverage would have been 0.84x without the effect of this non-cash write-off. |
12
CONSOLIDATED, by quarter
|
($'s in 000's) |
|
As of |
|
|
|||||||||||||||||
|
|
|
September 30, 2017 |
|
|
June 30, 2017 |
|
|
March 31, 2017 |
|
|
December 31, 2016 |
|
|
September 30, 2016 |
|
|
|||||
|
Assets |
|
|
|
|
|
|
|
|
|
|
|
|
|
|
|
|
|
|
|
|
|
|
Investments in loans: |
|
|
|
|
|
|
|
|
|
|
|
|
|
|
|
|
|
|
|
|
|
|
Investment in loans |
|
$ |
1,260,346 |
|
|
$ |
1,267,705 |
|
|
$ |
1,315,539 |
|
|
$ |
1,292,639 |
|
|
$ |
1,373,615 |
|
|
|
Allowance for loan losses |
|
|
(25,140 |
) |
|
|
(23,514 |
) |
|
|
(13,531 |
) |
|
|
(12,354 |
) |
|
|
(18,655 |
) |
|
|
Investments in loans, net |
|
|
1,235,206 |
|
|
|
1,244,191 |
|
|
|
1,302,008 |
|
|
|
1,280,285 |
|
|
|
1,354,960 |
|
|
|
Investments in real estate: |
|
|
|
|
|
|
|
|
|
|
|
|
|
|
|
|
|
|
|
|
|
|
Investments in real estate at cost |
|
|
399,674 |
|
|
|
470,249 |
|
|
|
694,230 |
|
|
|
854,646 |
|
|
|
965,362 |
|
|
|
Accumulated depreciation |
|
|
(30,974 |
) |
|
|
(35,359 |
) |
|
|
(114,179 |
) |
|
|
(138,214 |
) |
|
|
(156,613 |
) |
|
|
Investments in real estate, net |
|
|
368,700 |
|
|
|
434,890 |
|
|
|
580,051 |
|
|
|
716,432 |
|
|
|
808,749 |
|
|
|
Cash and cash equivalents |
|
|
46,019 |
|
|
|
89,317 |
|
|
|
96,432 |
|
|
|
110,531 |
|
|
|
36,019 |
|
|
|
Restricted cash |
|
|
142,489 |
|
|
|
193,580 |
|
|
|
141,610 |
|
|
|
190,179 |
|
|
|
229,957 |
|
|
|
Accrued interest receivable |
|
|
32,307 |
|
|
|
32,141 |
|
|
|
36,176 |
|
|
|
36,271 |
|
|
|
41,603 |
|
|
|
Other assets |
|
|
34,905 |
|
|
|
36,753 |
|
|
|
49,080 |
|
|
|
53,878 |
|
|
|
81,546 |
|
|
|
Intangible assets, net |
|
|
8,062 |
|
|
|
10,901 |
|
|
|
17,258 |
|
|
|
19,267 |
|
|
|
23,165 |
|
|
|
Assets of discontinued operations |
|
|
- |
|
|
|
- |
|
|
|
- |
|
|
|
- |
|
|
|
1,306,532 |
|
|
|
Total assets |
|
$ |
1,867,688 |
|
|
$ |
2,041,773 |
|
|
$ |
2,222,615 |
|
|
$ |
2,406,843 |
|
|
$ |
3,882,531 |
|
|
|
|
|
|
|
|
|
|
|
|
|
|
|
|
|
|
|
|
|
|
|
|
|
|
Liabilities and Equity |
|
|
|
|
|
|
|
|
|
|
|
|
|
|
|
|
|
|
|
|
|
|
Indebtedness, net |
|
$ |
1,427,947 |
|
|
$ |
1,588,067 |
|
|
$ |
1,623,133 |
|
|
$ |
1,751,082 |
|
|
$ |
1,975,863 |
|
|
|
Accrued interest payable |
|
|
10,780 |
|
|
|
9,229 |
|
|
|
9,591 |
|
|
|
8,347 |
|
|
|
10,464 |
|
|
|
Accounts payable and accrued expenses |
|
|
15,201 |
|
|
|
15,157 |
|
|
|
14,033 |
|
|
|
20,016 |
|
|
|
20,082 |
|
|
|
Derivative liabilities |
|
|
- |
|
|
|
- |
|
|
|
- |
|
|
|
- |
|
|
|
1,748 |
|
|
|
Borrowers' escrows |
|
|
113,996 |
|
|
|
104,197 |
|
|
|
101,805 |
|
|
|
107,183 |
|
|
|
112,255 |
|
|
|
Deferred taxes and other liabilities |
|
|
38,217 |
|
|
|
37,535 |
|
|
|
43,572 |
|
|
|
60,864 |
|
|
|
56,437 |
|
|
|
Liabilities of discontinued operations |
|
|
- |
|
|
|
- |
|
|
|
- |
|
|
|
- |
|
|
|
906,225 |
|
|
|
Total liabilities |
|
|
1,606,141 |
|
|
|
1,754,185 |
|
|
|
1,792,134 |
|
|
|
1,947,492 |
|
|
|
3,083,074 |
|
|
|
|
|
|
|
|
|
|
|
|
|
|
|
|
|
|
|
|
|
|
|
|
|
|
Series D preferred stock |
|
|
77,653 |
|
|
|
75,654 |
|
|
|
83,505 |
|
|
|
81,581 |
|
|
|
90,728 |
|
|
|
|
|
|
|
|
|
|
|
|
|
|
|
|
|
|
|
|
|
|
|
|
|
|
Equity: |
|
|
|
|
|
|
|
|
|
|
|
|
|
|
|
|
|
|
|
|
|
|
Shareholders' Equity: |
|
|
|
|
|
|
|
|
|
|
|
|
|
|
|
|
|
|
|
|
|
|
7.75% Series A Preferred shares |
|
|
53 |
|
|
|
53 |
|
|
|
53 |
|
|
|
53 |
|
|
|
53 |
|
|
|
8.375% Series B Preferred shares |
|
|
23 |
|
|
|
23 |
|
|
|
23 |
|
|
|
23 |
|
|
|
23 |
|
|
|
8.875% Series C Preferred shares |
|
|
17 |
|
|
|
17 |
|
|
|
17 |
|
|
|
17 |
|
|
|
17 |
|
|
|
Common shares, $0.03 par value per share |
|
|
2,791 |
|
|
|
2,793 |
|
|
|
2,781 |
|
|
|
2,769 |
|
|
|
2,766 |
|
|
|
Additional paid in capital |
|
|
2,094,035 |
|
|
|
2,093,270 |
|
|
|
2,092,695 |
|
|
|
2,093,257 |
|
|
|
2,090,210 |
|
|
|
Accumulated other comprehensive income (loss) |
|
|
- |
|
|
|
- |
|
|
|
- |
|
|
|
- |
|
|
|
(112 |
) |
|
|
Retained earnings (deficit) |
|
|
(1,916,905 |
) |
|
|
(1,888,102 |
) |
|
|
(1,754,099 |
) |
|
|
(1,723,735 |
) |
|
|
(1,731,141 |
) |
|
|
Total shareholders' equity |
|
|
180,014 |
|
|
|
208,054 |
|
|
|
341,470 |
|
|
|
372,384 |
|
|
|
361,816 |
|
|
|
Noncontrolling interests - continuing operations |
|
|
3,880 |
|
|
|
3,880 |
|
|
|
5,506 |
|
|
|
5,386 |
|
|
|
5,386 |
|
|
|
Noncontrolling interests - discontinued operations |
|
|
- |
|
|
|
- |
|
|
|
- |
|
|
|
- |
|
|
|
341,527 |
|
|
|
Total noncontrolling interests |
|
|
3,880 |
|
|
|
3,880 |
|
|
|
5,506 |
|
|
|
5,386 |
|
|
|
346,913 |
|
|
|
Total equity |
|
|
183,894 |
|
|
|
211,934 |
|
|
|
346,976 |
|
|
|
377,770 |
|
|
|
708,729 |
|
|
|
Total liabilities and equity |
|
$ |
1,867,688 |
|
|
$ |
2,041,773 |
|
|
$ |
2,222,615 |
|
|
$ |
2,406,843 |
|
|
$ |
3,882,531 |
|
|
13
STATEMENTS OF OPERATIONS, FFO & CAD
CONSOLIDATED – THREE AND NINE MONTHS ENDED SEPTEMBER 30, 2017
|
|
|
For the Three Months Ended September 30, |
|
|
For the Nine Months Ended September 30, |
|
||||||||||
|
|
|
2017 |
|
|
2016 |
|
|
2017 |
|
|
2016 |
|
||||
|
Revenue: |
|
|
|
|
|
|
|
|
|
|
|
|
|
|
|
|
|
Net interest margin |
|
|
|
|
|
|
|
|
|
|
|
|
|
|
|
|
|
Investment interest income |
|
$ |
18,115 |
|
|
$ |
20,189 |
|
|
$ |
50,647 |
|
|
$ |
69,510 |
|
|
Investment interest expense |
|
|
(10,236 |
) |
|
|
(8,512 |
) |
|
|
(30,555 |
) |
|
|
(26,957 |
) |
|
Net interest margin |
|
|
7,879 |
|
|
|
11,677 |
|
|
|
20,092 |
|
|
|
42,553 |
|
|
Property income |
|
|
15,012 |
|
|
|
29,614 |
|
|
|
52,023 |
|
|
|
89,335 |
|
|
Fee and other income |
|
|
1,712 |
|
|
|
1,946 |
|
|
|
4,904 |
|
|
|
5,974 |
|
|
Total revenue |
|
|
24,603 |
|
|
|
43,237 |
|
|
|
77,019 |
|
|
|
137,862 |
|
|
|
|
|
|
|
|
|
|
|
|
|
|
|
|
|
|
|
|
Expenses: |
|
|
|
|
|
|
|
|
|
|
|
|
|
|
|
|
|
Interest expense |
|
|
8,656 |
|
|
|
13,298 |
|
|
|
27,682 |
|
|
|
43,135 |
|
|
Real estate operating expenses |
|
|
8,313 |
|
|
|
14,635 |
|
|
|
28,456 |
|
|
|
43,810 |
|
|
Property management expenses |
|
|
1,908 |
|
|
|
2,226 |
|
|
|
6,772 |
|
|
|
7,239 |
|
|
General and administrative expenses: |
|
|
|
|
|
|
|
|
|
|
|
|
|
|
|
|
|
Compensation expenses |
|
|
3,194 |
|
|
|
4,675 |
|
|
|
10,210 |
|
|
|
12,162 |
|
|
Other general and administrative expenses |
|
|
3,233 |
|
|
|
3,052 |
|
|
|
8,627 |
|
|
|
9,973 |
|
|
Total general and administrative expenses |
|
|
6,427 |
|
|
|
7,727 |
|
|
|
18,837 |
|
|
|
22,135 |
|
|
Acquisition and integration expenses |
|
|
57 |
|
|
|
197 |
|
|
|
296 |
|
|
|
376 |
|
|
Provision for loan losses |
|
|
5,516 |
|
|
|
1,533 |
|
|
|
27,914 |
|
|
|
4,202 |
|
|
Depreciation and amortization expense |
|
|
6,139 |
|
|
|
11,466 |
|
|
|
23,712 |
|
|
|
39,273 |
|
|
IRT internalization and management transition expenses |
|
|
— |
|
|
|
— |
|
|
|
736 |
|
|
|
— |
|
|
Shareholder activism expenses |
|
|
155 |
|
|
|
— |
|
|
|
2,464 |
|
|
|
— |
|
|
Employee separation expenses |
|
|
575 |
|
|
|
— |
|
|
|
575 |
|
|
|
— |
|
|
Total expenses |
|
|
37,746 |
|
|
|
51,082 |
|
|
|
137,444 |
|
|
|
160,170 |
|
|
Operating Income |
|
|
(13,143 |
) |
|
|
(7,845 |
) |
|
|
(60,425 |
) |
|
|
(22,308 |
) |
|
Other income (expense) |
|
|
283 |
|
|
|
(70 |
) |
|
|
144 |
|
|
|
30 |
|
|
Gains (loss) on assets |
|
|
30 |
|
|
|
18,194 |
|
|
|
22,795 |
|
|
|
23,811 |
|
|
Asset impairment |
|
|
(3,121 |
) |
|
|
(18,872 |
) |
|
|
(96,354 |
) |
|
|
(26,658 |
) |
|
Goodwill impairment |
|
|
- |
|
|
|
— |
|
|
|
(8,342 |
) |
|
|
— |
|
|
Gain (loss) on deconsolidation of properties |
|
|
(4,035 |
) |
|
|
— |
|
|
|
(19,982 |
) |
|
|
— |
|
|
Gain (loss) on debt extinguishment |
|
|
(644 |
) |
|
|
(6 |
) |
|
|
944 |
|
|
|
998 |
|
|
Change in fair value of financial instruments |
|
|
4,753 |
|
|
|
(1,375 |
) |
|
|
6,693 |
|
|
|
(7,055 |
) |
|
Income (loss) before taxes |
|
|
(15,877 |
) |
|
|
(9,974 |
) |
|
|
(154,527 |
) |
|
|
(31,182 |
) |
|
Income tax benefit (provision) |
|
|
34 |
|
|
|
15,302 |
|
|
|
261 |
|
|
|
18,051 |
|
|
Income from continuing operations |
|
|
(15,843 |
) |
|
|
5,328 |
|
|
|
(154,266 |
) |
|
|
(13,131 |
) |
|
Discontinued operations: |
|
|
|
|
|
|
|
|
|
|
|
|
|
|
|
|
|
Income (loss) from discontinued operations |
|
|
— |
|
|
|
4,112 |
|
|
|
— |
|
|
|
38,473 |
|
|
Net income (loss) |
|
|
(15,843 |
) |
|
|
9,440 |
|
|
|
(154,266 |
) |
|
|
25,342 |
|
|
Income allocated to preferred shares |
|
|
(8,387 |
) |
|
|
(8,715 |
) |
|
|
(25,730 |
) |
|
|
(25,850 |
) |
|
(Income) loss allocated to noncontrolling interests |
|
|
- |
|
|
|
(729 |
) |
|
|
(76 |
) |
|
|
(24,920 |
) |
|
Net income (loss) available to common shares |
|
$ |
(24,230 |
) |
|
$ |
(4 |
) |
|
$ |
(180,072 |
) |
|
$ |
(25,428 |
) |
|
|
|
|
|
|
|
|
|
|
|
|
|
|
|
|
|
|
|
Amount attributable to common shares: |
|
|
|
|
|
|
|
|
|
|
|
|
|
|
|
|
|
Net income (loss) available to common shares from continuing operations |
|
$ |
(24,230 |
) |
|
$ |
(2,048 |
) |
|
$ |
(180,072 |
) |
|
$ |
(35,526 |
) |
|
Net income (loss) available to common shares from discontinued operations |
|
|
- |
|
|
|
2,044 |
|
|
|
— |
|
|
|
10,098 |
|
|
Net income (loss) available to common shares |
|
$ |
(24,230 |
) |
|
$ |
(4 |
) |
|
$ |
(180,072 |
) |
|
$ |
(25,428 |
) |
|
|
|
|
|
|
|
|
|
|
|
|
|
|
|
|
|
|
|
EPS - BASIC: |
|
|
|
|
|
|
|
|
|
|
|
|
|
|
|
|
|
Earnings (loss) per share from continuing operations |
|
$ |
(0.26 |
) |
|
$ |
(0.02 |
) |
|
$ |
(1.97 |
) |
|
$ |
(0.39 |
) |
|
Earnings (loss) per share from discontinued operations |
|
|
— |
|
|
|
0.02 |
|
|
|
— |
|
|
|
0.11 |
|
|
Earnings per share - BASIC |
|
$ |
(0.26 |
) |
|
$ |
- |
|
|
$ |
(1.97 |
) |
|
$ |
(0.28 |
) |
|
|
|
|
|
|
|
|
|
|
|
|
|
|
|
|
|
|
|
EPS - DILUTED: |
|
|
|
|
|
|
|
|
|
|
|
|
|
|
|
|
|
Earnings (loss) per share from continuing operations |
|
$ |
(0.26 |
) |
|
$ |
(0.02 |
) |
|
$ |
(1.97 |
) |
|
$ |
(0.39 |
) |
|
Earnings (loss) per share from discontinued operations |
|
|
— |
|
|
|
0.02 |
|
|
|
— |
|
|
|
0.11 |
|
|
Earnings per share - DILUTED |
|
$ |
(0.26 |
) |
|
$ |
- |
|
|
$ |
(1.97 |
) |
|
$ |
(0.28 |
) |
|
Weighted-average shares outstanding - Basic |
|
|
91,559,636 |
|
|
|
91,201,784 |
|
|
|
91,438,884 |
|
|
|
91,137,041 |
|
|
Weighted-average shares outstanding - Diluted |
|
|
91,559,636 |
|
|
|
91,201,784 |
|
|
|
91,438,884 |
|
|
|
91,137,041 |
|
|
|
|
|
|
|
|
|
|
|
|
|
|
|
|
|
|
|
|
FUNDS FROM OPERATIONS (FFO): |
|
|
|
|
|
|
|
|
|
|
|
|
|
|
|
|
|
Net Income (loss) available to common shares |
|
$ |
(24,230 |
) |
|
$ |
(4 |
) |
|
$ |
(180,072 |
) |
|
$ |
(25,428 |
) |
|
Add-Back (Deduct): |
|
|
|
|
|
|
|
|
|
|
|
|
|
|
|
|
|
Depreciation |
|
|
4,657 |
|
|
|
8,884 |
|
|
|
17,171 |
|
|
|
28,539 |
|
|
(Gains) Losses on the sale of real estate |
|
|
(30 |
) |
|
|
(18,194 |
) |
|
|
(22,795 |
) |
|
|
(24,301 |
) |
|
Asset impairment |
|
|
3,121 |
|
|
|
18,872 |
|
|
|
91,989 |
|
|
|
26,658 |
|
|
Adjustments related to discontinued operations |
|
|
— |
|
|
|
1,195 |
|
|
|
— |
|
|
|
(1,322 |
) |
|
FFO |
|
$ |
(16,482 |
) |
|
$ |
10,753 |
|
|
$ |
(93,707 |
) |
|
$ |
4,146 |
|
|
FFO per share--basic |
|
$ |
(0.18 |
) |
|
$ |
0.12 |
|
|
$ |
(1.02 |
) |
|
$ |
0.05 |
|
|
Weighted-average shares outstanding |
|
|
91,559,636 |
|
|
|
91,201,784 |
|
|
|
91,438,884 |
|
|
|
91,137,041 |
|
|
|
|
|
|
|
|
|
|
|
|
|
|
|
|
|
|
|
|
CASH AVAILABLE FOR DISTRIBUTION (CAD): |
|
|
|
|
|
|
|
|
|
|
|
|
|
|
|
|
|
Net Income (loss) available to common shares |
|
$ |
(24,230 |
) |
|
$ |
(4 |
) |
|
$ |
(180,072 |
) |
|
$ |
(25,428 |
) |
|
Add-Back (Deduct): |
|
|
|
|
|
|
|
|
|
|
|
|
|
|
|
|
|
Depreciation and amortization expense |
|
|
6,139 |
|
|
|
11,466 |
|
|
|
23,712 |
|
|
|
39,273 |
|
|
Change in fair value of financial instruments |
|
|
(4,753 |
) |
|
|
1,375 |
|
|
|
(6,693 |
) |
|
|
7,055 |
|
|
(Gains) losses on assets |
|
|
(30 |
) |
|
|
(18,194 |
) |
|
|
(22,795 |
) |
|
|
(23,811 |
) |
|
(Gains) losses on deconsolidation of properties |
|
|
4,035 |
|
|
|
— |
|
|
|
19,982 |
|
|
|
— |
|
|
(Gains) losses on debt extinguishment |
|
|
644 |
|
|
|
6 |
|
|
|
(944 |
) |
|
|
(998 |
) |
|
Deferred income tax (benefit) provision |
|
|
— |
|
|
|
(15,249 |
) |
|
|
22 |
|
|
|
(18,090 |
) |
|
Straight-line rental adjustments |
|
|
(463 |
) |
|
|
(622 |
) |
|
|
(286 |
) |
|
|
(1,182 |
) |
|
Equity based compensation |
|
|
779 |
|
|
|
819 |
|
|
|
1,833 |
|
|
|
2,841 |
|
|
Acquisition and integration expenses |
|
|
57 |
|
|
|
197 |
|
|
|
296 |
|
|
|
376 |
|
|
Origination fees and other deferred items |
|
|
6,490 |
|
|
|
8,536 |
|
|
|
26,654 |
|
|
|
21,377 |
|
|
Provision for loan losses |
|
|
5,516 |
|
|
|
1,533 |
|
|
|
27,914 |
|
|
|
4,202 |
|
|
IRT internalization and management transition expenses |
|
|
— |
|
|
|
— |
|
|
|
736 |
|
|
|
— |
|
|
Asset impairment |
|
|
3,121 |
|
|
|
18,872 |
|
|
|
96,354 |
|
|
|
26,658 |
|
|
Goodwill impairment |
|
|
— |
|
|
|
— |
|
|
|
8,342 |
|
|
|
— |
|
|
Shareholder activism expenses |
|
|
155 |
|
|
|
— |
|
|
|
2,464 |
|
|
|
— |
|
|
Employee separation expenses |
|
|
575 |
|
|
|
— |
|
|
|
575 |
|
|
|
— |
|
|
Net expenses associated with deconsolidated properties |
|
|
689 |
|
|
|
— |
|
|
|
2,037 |
|
|
|
— |
|
|
Discontinued operations and noncontrolling interest effect of certain adjustments |
|
|
— |
|
|
|
1,885 |
|
|
|
— |
|
|
|
1,762 |
|
|
CAD (a) |
|
$ |
(1,276 |
) |
|
$ |
10,619 |
|
|
$ |
131 |
|
|
$ |
34,035 |
|
|
CAD per share (a) |
|
$ |
(0.01 |
) |
|
$ |
0.12 |
|
|
$ |
0.00 |
|
|
$ |
0.37 |
|
|
Weighted-average shares outstanding |
|
|
91,559,636 |
|
|
|
91,201,784 |
|
|
|
91,438,884 |
|
|
|
91,137,041 |
|
|
|
(a) |
For the nine months ended September 30, 2017, CAD includes the non-cash effect of a $3,636 write-off of accrued interest receivable related to a loan that was determined to be impaired during the second quarter. For the nine months ended September 30, 2017, CAD would have been $3,767 or $0.04 per share, without the effect of this non-cash write-off. |
14
STATEMENT OF OPERATIONS, FFO & CAD
CONSOLIDATED – by quarter
|
($'s in 000's, except per share amounts) |
|
For the Three Months Ended |
|
|||||||||||||||||||||||
|
|
|
September 30, 2017 |
|
|
June 30, 2017 |
|
|
|
|
March 31, 2017 |
|
|
|
|
December 31, 2016 |
|
|
|
|
September 30, 2016 |
|
|||||
|
Revenue: |
|
|
|
|
|
|
|
|
|
|
|
|
|
|
|
|
|
|
|
|
|
|
|
|
|
|
|
Net interest margin |
|
|
|
|
|
|
|
|
|
|
|
|
|
|
|
|
|
|
|
|
|
|
|
|
|
|
|
Investment interest income |
|
$ |
18,115 |
|
|
$ |
14,882 |
|
|
|
|
$ |
17,650 |
|
|
|
|
$ |
19,693 |
|
|
|
|
$ |
20,189 |
|
|
Investment interest expense |
|
|
(10,236 |
) |
|
|
(10,546 |
) |
|
|
|
|
(9,773 |
) |
|
|
|
|
(8,849 |
) |
|
|
|
|
(8,512 |
) |
|
Net interest margin |
|
|
7,879 |
|
|
|
4,336 |
|
|
|
|
|
7,877 |
|
|
|
|
|
10,844 |
|
|
|
|
|
11,677 |
|
|
Property income |
|
|
15,012 |
|
|
|
16,946 |
|
|
|
|
|
20,065 |
|
|
|
|
|
23,501 |
|
|
|
|
|
29,614 |
|
|
Fee and other income |
|
|
1,712 |
|
|
|
1,531 |
|
|
|
|
|
1,661 |
|
|
|
|
|
1,400 |
|
|
|
|
|
1,946 |
|
|
Total revenue |
|
|
24,603 |
|
|
|
22,813 |
|
|
|
|
|
29,603 |
|
|
|
|
|
35,745 |
|
|
|
|
|
43,237 |
|
|
Expenses: |
|
|
|
|
|
|
|
|
|
|
|
|
|
|
|
|
|
|
|
|
|
|
|
|
|
|
|
Interest expense |
|
|
8,656 |
|
|
|
8,883 |
|
|
|
|
|
10,143 |
|
|
|
|
|
11,914 |
|
|
|
|
|
13,298 |
|
|
Real estate operating expenses |
|
|
8,313 |
|
|
|
9,509 |
|
|
|
|
|
10,634 |
|
|
|
|
|
13,084 |
|
|
|
|
|
14,635 |
|
|
Property management expenses |
|
|
1,908 |
|
|
|
2,651 |
|
|
|
|
|
2,213 |
|
|
|
|
|
2,240 |
|
|
|
|
|
2,226 |
|
|
General and administrative expenses: |
|
|
|
|
|
|
|
|
|
|
|
|
|
|
|
|
|
|
|
|
|
|
|
|
|
|
|
Compensation expenses |
|
|
3,194 |
|
|
|
3,529 |
|
|
|
|
|
3,487 |
|
|
|
|
|
6,275 |
|
|
|
|
|
4,675 |
|
|
General and administrative expenses |
|
|
3,233 |
|
|
|
2,689 |
|
|
|
|
|
2,705 |
|
|
|
|
|
3,300 |
|
|
|
|
|
3,052 |
|
|
Total general and administrative expenses |
|
|
6,427 |
|
|
|
6,218 |
|
|
|
|
|
6,192 |
|
|
|
|
|
9,575 |
|
|
|
|
|
7,727 |
|
|
Acquisition and integration expenses |
|
|
57 |
|
|
|
67 |
|
|
|
|
|
172 |
|
|
|
|
|
248 |
|
|
|
|
|
197 |
|
|
Provision for loan losses |
|
|
5,516 |
|
|
|
20,863 |
|
|
|
|
|
1,535 |
|
|
|
|
|
3,848 |
|
|
|
|
|
1,533 |
|
|
Depreciation and amortization expense |
|
|
6,139 |
|
|
|
7,819 |
|
|
|
|
|
9,754 |
|
|
|
|
|
12,031 |
|
|
|
|
|
11,466 |
|
|
IRT internalization and management transition expenses |
|
|
- |
|
|
|
- |
|
|
|
|
|
736 |
|
|
|
|
|
6,271 |
|
|
|
|
|
— |
|
|
Shareholder activism expense |
|
|
155 |
|
|
|
1,615 |
|
|
|
|
|
694 |
|
|
|
|
|
— |
|
|
|
|
|
— |
|
|
Employee separation expenses |
|
|
575 |
|
|
|
— |
|
|
|
|
|
— |
|
|
|
|
|
— |
|
|
|
|
|
— |
|
|
Total expenses |
|
|
37,746 |
|
|
|
57,625 |
|
|
|
|
|
42,073 |
|
|
|
|
|
59,211 |
|
|
|
|
|
51,082 |
|
|
Operating Income |
|
|
(13,143 |
) |
|
|
(34,812 |
) |
|
|
|
|
(12,470 |
) |
|
|
|
|
(23,466 |
) |
|
|
|
|
(7,845 |
) |
|
Other income (expense) |
|
|
283 |
|
|
|
(153 |
) |
|
|
|
|
14 |
|
|
|
|
|
(457 |
) |
|
|
|
|
(70 |
) |
|
Gains (losses) on assets |
|
|
30 |
|
|
|
10,759 |
|
|
|
|
|
12,006 |
|
|
|
|
|
29,461 |
|
|
|
|
|
18,194 |
|
|
Asset impairment |
|
|
(3,121 |
) |
|
|
(85,809 |
) |
|
|
|
|
(7,424 |
) |
|
|
|
|
(11,127 |
) |
|
|
|
|
(18,872 |
) |
|
Goodwill impairment |
|
|
— |
|
|
|
(8,342 |
) |
|
|
|
|
— |
|
|
|
|
|
— |
|
|
|
|
|
— |
|
|
Gains (losses) on deconsolidation of properties |
|
|
(4,035 |
) |
|
|
— |
|
|
|
|
|
(15,947 |
) |
|
|
|
|
— |
|
|
|
|
|
— |
|
|
Gains (losses) on debt extinguishment |
|
|
(644 |
) |
|
|
(1,598 |
) |
|
|
|
|
3,186 |
|
|
|
|
|
333 |
|
|
|
|
|
(6 |
) |
|
Change in fair value of financial instruments |
|
|
4,753 |
|
|
|
3,093 |
|
|
|
|
|
(1,153 |
) |
|
|
|
|
1,109 |
|
|
|
|
|
(1,375 |
) |
|
Income (loss) before taxes |
|
|
(15,877 |
) |
|
|
(116,862 |
) |
|
|
|
|
(21,788 |
) |
|
|
|
|
(4,147 |
) |
|
|
|
|
(9,974 |
) |
|
Income tax benefit (provision) |
|
|
34 |
|
|
|
(22 |
) |
|
|
|
|
249 |
|
|
|
|
|
(20,601 |
) |
|
|
|
|
15,302 |
|
|
Income (loss) from continuing operations |
|
|
(15,843 |
) |
|
|
(116,884 |
) |
|
|
|
|
(21,539 |
) |
|
|
|
|
(24,748 |
) |
|
|
|
|
5,328 |
|
|
Discontinued operations: |
|
|
|
|
|
|
|
|
|
|
|
|
|
|
|
|
|
|
|
|
|
|
|
|
|
|
|
Income (loss) from discontinued operations |
|
|
— |
|
|
|
— |
|
|
|
|
|
— |
|
|
|
|
|
1,671 |
|
|
|
|
|
4,112 |
|
|
Gain (loss) on disposal of discontinued operations |
|
|
— |
|
|
|
— |
|
|
|
|
|
— |
|
|
|
|
|
47,808 |
|
|
|
|
|
— |
|
|
Net income (loss) |
|
|
(15,843 |
) |
|
|
(116,884 |
) |
|
|
|
|
(21,539 |
) |
|
|
|
|
24,731 |
|
|
|
|
|
9,440 |
|
|
Income allocated to preferred shares |
|
|
(8,387 |
) |
|
|
(8,817 |
) |
|
|
|
|
(8,526 |
) |
|
|
|
|
(9,310 |
) |
|
|
|
|
(8,715 |
) |
|
(Income) loss allocated to noncontrolling interests |
|
|
- |
|
|
|
(56 |
) |
|
|
|
|
(20 |
) |
|
|
|
|
187 |
|
|
|
|
|
(729 |
) |
|
Net income (loss) available to common shares |
|
$ |
(24,230 |
) |
|
$ |
(125,757 |
) |
|
|
|
$ |
(30,085 |
) |
|
|
|
$ |
15,608 |
|
|
|
|
$ |
(4 |
) |
|
|
|
|
|
|
|
|
|
|
|
|
|
|
|
|
|
|
|
|
|
|
|
|
|
|
|
|
|
Amount attributable to common shares: |
|
|
|
|
|
|
|
|
|
|
|
|
|
|
|
|
|
|
|
|
|
|
|
|
|
|
|
Net income (loss) available to common shares from continuing operations |
|
$ |
(24,230 |
) |
|
$ |
(125,757 |
) |
|
|
|
$ |
(30,085 |
) |
|
|
|
$ |
(34,078 |
) |
|
|
|
$ |
(2,048 |
) |
|
Net income (loss) available to common shares from discontinued operations |
|
|
— |
|
|
|
- |
|
|
|
|
|
- |
|
|
|
|
|
49,686 |
|
|
|
|
|
2,044 |
|
|
Net income (loss) available to common shares |
|
$ |
(24,230 |
) |
|
$ |
(125,757 |
) |
|
|
|
$ |
(30,085 |
) |
|
|
|
$ |
15,608 |
|
|
|
|
$ |
(4 |
) |
|
|
|
|
|
|
|
|
|
|
|
|
|
|
|
|
|
|
|
|
|
|
|
|
|
|
|
|
|
EPS - Basic: |
|
|
|
|
|
|
|
|
|
|
|
|
|
|
|
|
|
|
|
|
|
|
|
|
|
|
|
Earnings (loss) per share from continuing operations |
|
$ |
(0.26 |
) |
|
$ |
(1.38 |
) |
|
|
|
$ |
(0.33 |
) |
|
|
|
$ |
(0.37 |
) |
|
|
|
$ |
(0.02 |
) |
|
Earnings (loss) per share from discontinued operations |
|
|
— |
|
|
|
- |
|
|
|
|
|
- |
|
|
|
|
|
0.54 |
|
|
|
|
|
0.02 |
|
|
Earnings Per Share - Basic |
|
$ |
(0.26 |
) |
|
$ |
(1.38 |
) |
|
|
|
$ |
(0.33 |
) |
|
|
|
$ |
0.17 |
|
|
|
|
$ |
- |
|
|
|
|
|
|
|
|
|
|
|
|
|
|
|
|
|
|
|
|
|
|
|
|
|
|
|
|
|
|
EPS - Diluted: |
|
|
|
|
|
|
|
|
|
|
|
|
|
|
|
|
|
|
|
|
|
|
|
|
|
|
|
Earnings (loss) per share from continuing operations |
|
$ |
(0.26 |
) |
|
$ |
(1.38 |
) |
|
|
|
$ |
(0.33 |
) |
|
|
|
$ |
(0.37 |
) |
|
|
|
$ |
(0.02 |
) |
|
Earnings (loss) per share from discontinued operations |
|
|
— |
|
|
|
- |
|
|
|
|
|
- |
|
|
|
|
|
0.54 |
|
|
|
|
|
0.02 |
|
|
Earnings Per Share - Diluted |
|
$ |
(0.26 |
) |
|
$ |
(1.38 |
) |
|
|
|
$ |
(0.33 |
) |
|
|
|
$ |
0.17 |
|
|
|
|
$ |
- |
|
|
|
|
|
|
|
|
|
|
|
|
|
|
|
|
|
|
|
|
|
|
|
|
|
|
|
|
|
|
Weighted-average shares outstanding - Basic |
|
|
91,559,636 |
|
|
|
91,453,415 |
|
|
|
|
|
91,300,812 |
|
|
|
|
|
91,203,955 |
|
|
|
|
|
91,201,784 |
|
|
Weighted-average shares outstanding - Diluted |
|
|
91,559,636 |
|
|
|
91,453,415 |
|
|
|
|
|
91,300,812 |
|
|
|
|
|
91,971,817 |
|
|
|
|
|
91,201,784 |
|
|
|
|
|
|
|
|
|
|
|
|
|
|
|
|
|
|
|
|
|
|
|
|
|
|
|
|
|
|
Funds From Operations (FFO): |
|
|
|
|
|
|
|
|
|
|
|
|
|
|
|
|
|
|
|
|
|
|
|
|
|
|
|
Net Income (loss) available to common shares |
|
$ |
(24,230 |
) |
|
$ |
(125,757 |
) |
|
|
|
$ |
(30,085 |
) |
|
|
|
$ |
15,608 |
|
|
|
|
$ |
(4 |
) |
|
Add-Back (Deduct): |
|
|
|
|
|
|
|
|
|
|
|
|
|
|
|
|
|
|
|
|
|
|
|
|
|
|
|
Depreciation |
|
|
4,657 |
|
|
|
5,630 |
|
|
|
|
|
6,884 |
|
|
|
|
|
7,031 |
|
|
|
|
|
8,884 |
|
|
(Gains) Losses on the sale of real estate |
|
|
(30 |
) |
|
|
(10,759 |
) |
|
|
|
|
(12,006 |
) |
|
|
|
|
(29,461 |
) |
|
|
|
|
(18,194 |
) |
|
Asset impairment |
|
|
3,121 |
|
|
|
81,445 |
|
|
|
|
|
7,424 |
|
|
|
|
|
11,127 |
|
|
|
|
|
18,872 |
|
|
Adjustments related to discontinued operations |
|
|
— |
|
|
|
— |
|
|
|
|
|
— |
|
|
|
|
|
65 |
|
|
|
|
|
1,195 |
|
|
FFO |
|
$ |
(16,482 |
) |
|
$ |
(49,441 |
) |
|
|
|
$ |
(27,783 |
) |
|
|
|
$ |
4,370 |
|
|
|
|
$ |
10,753 |
|
|
FFO per share |
|
$ |
(0.18 |
) |
|
$ |
(0.54 |
) |
|
|
|
$ |
(0.30 |
) |
|
|
|
$ |
0.05 |
|
|
|
|
$ |
0.12 |
|
|
Weighted average shares |
|
|
91,559,636 |
|
|
|
91,453,415 |
|
|
|
|
|
91,300,812 |
|
|
|
|
|
91,203,955 |
|
|
|
|
|
91,201,784 |
|
|
|
|
|
|
|
|
|
|
|
|
|
|
|
|
|
|
|
|
|
|
|
|
|
|
|
|
|
|
Cash Available for Distribution (CAD): |
|
|
|
|
|
|
|
|
|
|
|
|
|
|
|
|
|
|
|
|
|
|
|
|
|
|
|
Net Income (loss) available to common shares |
|
$ |
(24,230 |
) |
|
$ |
(125,757 |
) |
|
|
|
$ |
(30,085 |
) |
|
|
|
$ |
15,608 |
|
|
|
|
$ |
(4 |
) |
|
Add-Back (Deduct): |
|
|
|
|
|
|
|
|
|
|
|
|
|
|
|
|
|
|
|
|
|
|
|
|
|
|
|
Depreciation and amortization expense |
|
|
6,139 |
|
|
|
7,819 |
|
|
|
|
|
9,754 |
|
|
|
|
|
12,031 |
|
|
|
|
|
11,466 |
|
|
Change in fair value of financial instruments |
|
|
(4,753 |
) |
|
|
(3,093 |
) |
|
|
|
|
1,153 |
|
|
|
|
|
(1,109 |
) |
|
|
|
|
1,375 |
|
|
(Gains) losses on assets |
|
|
(30 |
) |
|
|
(10,759 |
) |
|
|
|
|
(12,006 |
) |
|
|
|
|
(29,461 |
) |
|
|
|
|
(18,194 |
) |
|
(Gain) loss on deconsolidation of properties |
|
|
4,035 |
|
|
|
— |
|
|
|
|
|
15,947 |
|
|
|
|
|
— |
|
|
|
|
|
— |
|
|
(Gain) loss on debt extinguishment |
|
|
644 |
|
|
|
1,598 |
|
|
|
|
|
(3,186 |
) |
|
|
|
|
(333 |
) |
|
|
|
|
6 |
|
|
Deferred income tax (benefit) provision |
|
|
— |
|
|
|
22 |
|
|
|
|
|
— |
|
|
|
|
|
20,303 |
|
|
|
|
|
(15,249 |
) |
|
Straight-line rental adjustments |
|
|
(463 |
) |
|
|
58 |
|
|
|
|
|
119 |
|
|
|
|
|
(187 |
) |
|
|
|
|
(622 |
) |
|
Equity based compensation |
|
|
779 |
|
|
|
710 |
|
|
|
|
|
344 |
|
|
|
|
|
555 |
|
|
|
|
|
819 |
|
|
Acquisition and integration expenses |
|
|
57 |
|
|
|
67 |
|
|
|
|
|
172 |
|
|
|
|
|
248 |
|
|
|
|
|
197 |
|
|
Origination fees and other deferred items |
|
|
6,490 |
|
|
|
8,476 |
|
|
|
|
|
11,688 |
|
|
|
|
|
12,686 |
|
|
|
|
|
8,535 |
|
|
Provision for loan losses |
|
|
5,516 |
|
|
|
20,863 |
|
|
|
|
|
1,535 |
|
|
|
|
|
3,848 |
|
|
|
|
|
1,533 |
|
|
IRT internalization and management transition expenses |
|
|
— |
|
|
|
- |
|
|
|
|
|
736 |
|
|
|
|
|
6,271 |
|
|
|
|
|
— |
|
|
Shareholder activism expenses |
|
|
155 |
|
|
|
1,615 |
|
|
|
|
|
694 |
|
|
|
|
|
— |
|
|
|
|
|
— |
|
|
Employee separation expenses |
|
|
575 |
|
|
|
— |
|
|
|
|
|
— |
|
|
|
|
|
— |
|
|
|
|
|
— |
|
|
Asset impairment |
|
|
3,121 |
|
|
|
85,809 |
|
|
|
|
|
7,424 |
|
|
|
|
|
11,127 |
|
|
|
|
|
18,872 |
|
|
Goodwill impairment |
|
|
- |
|
|
|
8,342 |
|
|
|
|
|
- |
|
|
|
|
|
- |
|
|
|
|
|
- |
|
|
Net expenses associated with deconsolidated properties |
|
|
689 |
|
|
|
- |
|
|
|
|
|
873 |
|
|
|
|
|
— |
|
|
|
|
|
— |
|
|
Discontinued operations and noncontrolling interest effect of certain adjustments |
|
|
— |
|
|
|
475 |
|
|
|
|
|
- |
|
|
|
|
|
(45,034 |
) |
|
|
|
|
1,885 |
|
|
CAD (a) |
|
$ |
(1,276 |
) |
|
$ |
(3,755 |
) |
|
|
|
$ |
5,162 |
|
|
|
|
$ |
6,553 |
|
|
|
|
$ |
10,619 |
|
|
CAD per share (a) |
|
$ |
(0.01 |
) |
|
$ |
(0.04 |
) |
|
|
|
$ |
0.06 |
|
|
|
|
$ |
0.07 |
|
|
|
|
$ |
0.12 |
|
|
Weighted average shares |
|
|
91,559,636 |
|
|
|
91,453,415 |
|
|
# |
|
|
91,300,812 |
|
|
# |
|
|
91,203,955 |
|
|
# |
|
|
91,201,784 |
|
|
|
(a) |
For the nine months ended September 30, 2017, CAD includes the non-cash effect of a $3,636 write-off of accrued interest receivable related to a loan that was determined to be impaired during the second quarter. For the nine months ended September 30, 2017, CAD would have been $3,767 or $0.04 per share, without the effect of this non-cash write-off. |
15
TRAILING 5 QUARTERS
|
($'s in 000's) |
|
Three Months Ended |
|
|
|
|
Nine Months Ended |
|
||||||||||||||||||||||
|
|
|
September 30, 2017 |
|
|
June 30, 2017 |
|
|
March 31, 2017 |
|
|
December 31, 2016 |
|
|
September 30, 2016 |
|
|
|
|
September 30, 2017 |
|
|
September 30, 2016 |
|
|||||||
|
|
|
|
|
|
|
|
|
|
|
|
|
|
|
|
|
|
|
|
|
|
|
|
|
|
|
|
|
|
|
|
|
CMBS income (a) |
|
$ |
25 |
|
|
$ |
5 |
|
|
$ |
16 |
|
|
$ |
20 |
|
|
$ |
305 |
|
|
|
|
$ |
46 |
|
|
$ |
216 |
|
|
Property management & leasing fees |
|
|
1,341 |
|
|
|
1,269 |
|
|
|
1,514 |
|
|
|
1,162 |
|
|
|
1,490 |
|
|
|
|
|
4,124 |
|
|
|
5,071 |
|
|
Property reimbursement income |
|
|
7 |
|
|
|
8 |
|
|
|
8 |
|
|
|
79 |
|
|
|
22 |
|
|
|
|
|
23 |
|
|
|
67 |
|
|
Other income |
|
|
339 |
|
|
|
249 |
|
|
|
123 |
|
|
|
139 |
|
|
|
129 |
|
|
|
|
|
711 |
|
|
|
620 |
|
|
Fee and other income, as reported |
|
|
1,712 |
|
|
|
1,531 |
|
|
|
1,661 |
|
|
|
1,400 |
|
|
|
1,946 |
|
|
|
|
|
4,904 |
|
|
|
5,974 |
|
|
Fee and other income, discontinued operations |
|
|
- |
|
|
|
- |
|
|
|
- |
|
|
|
3,424 |
|
|
|
661 |
|
|
|
|
|
- |
|
|
|
2,260 |
|
|
|
|
|
|
|
|
|
|
|
|
|
|
|
|
|
|
|
|
|
|
|
|
|
|
|
|
|
|
|
|
|
|
Add: Items eliminated in consolidation: |
|
|
|
|
|
|
|
|
|
|
|
|
|
|
|
|
|
|
|
|
|
|
|
|
|
|
|
|
|
|
|
IRT Property management fees (b) |
|
|
- |
|
|
|
- |
|
|
|
- |
|
|
|
66 |
|
|
|
1,219 |
|
|
|
|
|
- |
|
|
|
3,710 |
|
|
IRT advisory fees (b) |
|
|
- |
|
|
|
- |
|
|
|
- |
|
|
|
93 |
|
|
|
1,933 |
|
|
|
|
|
- |
|
|
|
5,491 |
|
|
Total fee and other income |
|
$ |
1,712 |
|
|
$ |
1,531 |
|
|
$ |
1,661 |
|
|
$ |
4,983 |
|
|
$ |
5,759 |
|
|
|
|
$ |
4,904 |
|
|
$ |
17,435 |
|
|
|
(a) |
Represent fees paid by IRT to RAIT affiliates for services rendered through the date IRT was consolidated by RAIT. IRT was deconsolidated on October 5, 2016. Fees earned from IRT from October 5, 2016 through December 31, 2016 are included in fee and other income, discontinued operations. Excludes property management fees from RAIT owned properties. |
|
|
(b) |
Represent fees paid by IRT to RAIT affiliates for services rendered. Fees are eliminated in the consolidation of IRT. As of March 31, 2017, RAIT owns 0.0% of the outstanding common shares of IRT. Excludes property management fees from RAIT owned properties. |
16
RECONCILIATION OF NET INCOME TO ADJUSTED EBITDA AND COVERAGE RATIOS
|
($'s in 000's) |
|
Three Months Ended |
|
|
|
Nine Months Ended |
|
||||||||||||||||||||||
|
|
|
September 30, 2017 |
|
|
June 30, 2017 |
|
|
March 31, 2017 |
|
|
December 31, 2016 |
|
|
September 30, 2016 |
|
|
|
September 30, 2017 |
|
|
September 30, 2016 |
|
|||||||
|
ADJUSTED EBITDA: |
|
|
|
|
|
|
|
|
|
|
|
|
|
|
|
|
|
|
|
|
|
|
|
|
|
|
|
|
|
|
Net income (loss) |
|
$ |
(15,843 |
) |
|
$ |
(116,884 |
) |
|
$ |
(21,539 |
) |
|
$ |
24,731 |
|
|
$ |
9,440 |
|
|
|
$ |
(154,266 |
) |
|
$ |
25,342 |
|
|
Add (deduct): |
|
|
|
|
|
|
|
|
|
|
|
|
|
|
|
|
|
|
|
|
|
|
|
|
|
|
|
|
|
|
Investment interest expense |
|
|
10,236 |
|
|
|
10,546 |
|
|
|
9,773 |
|
|
|
8,849 |
|
|
|
8,512 |
|
|
|
|
30,555 |
|
|
|
28,381 |
|
|
Interest expense |
|
|
8,656 |
|
|
|
8,883 |
|
|
|
10,143 |
|
|
|
11,914 |
|
|
|
13,298 |
|
|
|
|
27,682 |
|
|
|
41,711 |
|
|
Acquisition and integration expenses |
|
|
57 |
|
|
|
67 |
|
|
|
172 |
|
|
|
248 |
|
|
|
197 |
|
|
|
|
296 |
|
|
|
376 |
|
|
Depreciation and amortization |
|
|
6,139 |
|
|
|
7,819 |
|
|
|
9,754 |
|
|
|
12,031 |
|
|
|
11,466 |
|
|
|
|
23,712 |
|
|
|
39,273 |
|
|
Provision for loan losses |
|
|
5,516 |
|
|
|
20,863 |
|
|
|
1,535 |
|
|
|
3,848 |
|
|
|
1,533 |
|
|
|
|
27,914 |
|
|
|
4,202 |
|
|
IRT internalization and management transition expenses |
|
|
- |
|
|
|
- |
|
|
|
736 |
|
|
|
6,271 |
|
|
|
- |
|
|
|
|
736 |
|
|
|
- |
|
|
Shareholder activism expenses |
|
|
155 |
|
|
|
1,615 |
|
|
|
694 |
|
|
|
- |
|
|
|
- |
|
|
|
|
2,464 |
|
|
|
- |
|
|
Employee separation expenses |
|
|
575 |
|
|
|
- |
|
|
|
- |
|
|
|
- |
|
|
|
- |
|
|
|
|
575 |
|
|
|
- |
|
|
(Gains) losses on assets |
|
|
(30 |
) |
|
|
(10,759 |
) |
|
|
(12,006 |
) |
|
|
(29,461 |
) |
|
|
(18,194 |
) |
|
|
|
(22,795 |
) |
|
|
(23,811 |
) |
|
(Gain) loss on deconsolidation of properties |
|
|
4,035 |
|
|
|
- |
|
|
|
15,947 |
|
|
|
- |
|
|
|
- |
|
|
|
|
19,982 |
|
|
|
- |
|
|
Asset impairment |
|
|
3,121 |
|
|
|
85,809 |
|
|
|
7,424 |
|
|
|
11,127 |
|
|
|
18,872 |
|
|
|
|
96,354 |
|
|
|
26,658 |
|
|
Goodwill impairment |
|
|
- |
|
|
|
8,342 |
|
|
|
- |
|
|
|
- |
|
|
|
- |
|
|
|
|
8,342 |
|
|
|
- |
|
|
(Gain) loss on debt extinguishment |
|
|
644 |
|
|
|
1,598 |
|
|
|
(3,186 |
) |
|
|
(333 |
) |
|
|
6 |
|
|
|
|
(944 |
) |
|
|
(998 |
) |
|
Change in fair value of financial instruments |
|
|
(4,753 |
) |
|
|
(3,093 |
) |
|
|
1,153 |
|
|
|
(1,109 |
) |
|
|
1,375 |
|
|
|
|
(6,693 |
) |
|
|
7,055 |
|
|
Income tax (benefit) provision |
|
|
(34 |
) |
|
|
22 |
|
|
|
(249 |
) |
|
|
20,601 |
|
|
|
(15,302 |
) |
|
|
|
(261 |
) |
|
|
(18,051 |
) |
|
Net expenses associated with deconsolidated properties |
|
|
- |
|
|
|
475 |
|
|
|
873 |
|
|
|
- |
|
|
|
- |
|
|
|
|
1,348 |
|
|
|
- |
|
|
Additions (deductions) from discontinued operations |
|
|
- |
|
|
|
- |
|
|
|
- |
|
|
|
(44,794 |
) |
|
|
15,983 |
|
|
|
|
- |
|
|
|
22,114 |
|
|
Adjusted EBITDA (a) |
|
$ |
18,474 |
|
|
$ |
15,303 |
|
|
$ |
21,224 |
|
|
$ |
23,923 |
|
|
$ |
47,186 |
|
|
|
$ |
55,001 |
|
|
$ |
152,252 |
|
|
|
|
|
|
|
|
|
|
|
|
|
|
|
|
|
|
|
|
|
|
|
|
|
|
|
|
|
|
|
|
|
INTEREST COST: |
|
|
|
|
|
|
|
|
|
|
|
|
|
|
|
|
|
|
|
|
|
|
|
|
|
|
|
|
|
|
Investment interest expense |
|
$ |
10,236 |
|
|
$ |
10,546 |
|
|
$ |
9,773 |
|
|
$ |
8,849 |
|
|
$ |
8,512 |
|
|
|
|
30,555 |
|
|
|
28,381 |
|
|
Interest expense |
|
|
8,656 |
|
|
|
8,883 |
|
|
|
10,143 |
|
|
|
11,914 |
|
|
|
13,298 |
|
|
|
|
27,682 |
|
|
|
41,711 |
|
|
Interest expense - IRT |
|
|
- |
|
|
|
- |
|
|
|
- |
|
|
|
482 |
|
|
|
8,820 |
|
|
|
|
- |
|
|
|
27,455 |
|
|
Total Interest Expense |
|
|
18,892 |
|
|
|
19,429 |
|
|
|
19,916 |
|
|
|
21,245 |
|
|
|
30,630 |
|
|
|
|
58,237 |
|
|
|
97,547 |
|
|
Less: Amortization of deferred financing costs and debt discounts |
|
|
(3,537 |
) |
|
|
(3,508 |
) |
|
|
(4,018 |
) |
|
|
(4,181 |
) |
|
|
(5,131 |
) |
|
|
|
(11,063 |
) |
|
|
(16,202 |
) |
|
Interest Cost |
|
$ |
15,355 |
|
|
$ |
15,921 |
|
|
$ |
15,898 |
|
|
$ |
17,064 |
|
|
$ |
25,499 |
|
|
|
$ |
47,174 |
|
|
$ |
81,345 |
|
|
|
|
|
|
|
|
|
|
|
|
|
|
|
|
|
|
|
|
|
|
|
|
|
|
|
|
|
|
|
|
|
PREFERRED COST: |
|
|
|
|
|
|
|
|
|
|
|
|
|
|
|
|
|
|
|
|
|
|
|
|
|
|
|
|
|
|
Net income allocated to preferred shares |
|
$ |
8,387 |
|
|
$ |
8,817 |
|
|
$ |
8,526 |
|
|
$ |
9,310 |
|
|
$ |
8,715 |
|
|
|
|
25,730 |
|
|
|
17,430 |
|
|
Less: preferred share discount amortization |
|
|
(1,998 |
) |
|
|
(2,207 |
) |
|
|
(1,923 |
) |
|
|
(2,453 |
) |
|
|
(1,867 |
) |
|
|
|
(6,128 |
) |
|
|
(5,333 |
) |
|
Preferred cost |
|
$ |
6,389 |
|
|
$ |
6,610 |
|
|
$ |
6,603 |
|
|
$ |
6,857 |
|
|
$ |
6,848 |
|
|
|
$ |
19,602 |
|
|
$ |
12,097 |
|
|
|
|
|
|
|
|
|
|
|
|
|
|
|
|
|
|
|
|
|
|
|
|
|
|
|
|
|
|
|
|
|
INTEREST COVERAGE (b): |
|
|
1.20 |
x |
|
|
0.96 |
x |
|
|
1.34 |
x |
|
|
1.40 |
x |
|
|
1.85 |
x |
|
|
|
1.17 |
x |
|
|
1.87 |
x |
|
INTEREST + PREFERRED COVERAGE (c): |
|
|
0.85 |
x |
|
|
0.68 |
x |
|
|
0.94 |
x |
|
|
1.00 |
x |
|
|
1.46 |
x |
|
|
|
0.82 |
x |
|
|
1.63 |
x |
|
|
(a) |
For the three months ended June 30, 2017, Adjusted EBITDA includes the non-cash effect of a $3,636 write-off of accrued interest receivable related to a loan that was determined to be impaired during the period. Adjusted EBITDA would have been $18,939 without the effect of this non-cash write-off. For the nine months ended September 30, 2017, Adjusted EBITDA includes the non-cash effect of a $3,636 write-off of accrued interest receivable related to a loan that was determined to be impaired during the period. Adjusted EBITDA would have been $58,637 without the effect of this non-cash write-off. |
|
|
(b) |
For the three months ended June 30, 2017, Interest Coverage includes the non-cash effect of a $3,636 write-off of accrued interest receivable related to a loan that was determined to be impaired during the period. Interest Coverage would have been 1.19x without the effect of this non-cash write-off. For the nine months ended September 30, 2017, Interest Coverage includes the non-cash effect of a $3,636 write-off of accrued interest receivable related to a loan that was determined to be impaired during the period. Interest Coverage would have been 1.24x without the effect of this non-cash write-off |
|
|
(c) |
For the three months ended June 30, 2017, Interest + Preferred Coverage includes the non-cash effect of a $3,636 write-off of accrued interest receivable related to a loan that was determined to be impaired during the period. Interest + Preferred Coverage would have been 0.84x without the effect of this non-cash write-off. For the nine months ended September 30, 2017, Interest + Preferred Coverage includes the non-cash effect of a $3,636 write-off of accrued interest receivable related to a loan that was determined to be impaired during the period. Interest + Preferred Coverage would have been 0.88x without the effect of this non-cash write-off. |
17
|
Loan Portfolio Data, as of September 30, 2017 |
|
|
|
|
|
|
|
|
|
|
|
|
|
|
|
|
|
|
|
|
|
|
|
|||
|
($'s in 000's) |
|
|
|
|
|
|
|
|
|
|
|
|
|
|
|
|
|
|
|
|
|
|
|
|
|
|
|
Loan Type |
|
Unpaid Principal Balance |
|
|
Weighted Average Coupon |
|
|
Remaining Life, Years (weighted average) |
|
|
# of Loans |
|
|
|
|
|
|
|
|
|
|
|
||||
|
Bridge loans |
|
$ |
1,141,365 |
|
|
|
5.5 |
% |
|
|
1.7 |
|
|
|
90 |
|
|
|
|
|
|
|
|
|
|
|
|
Conduit loans |
|
|
16,725 |
|
|
|
4.8 |
% |
|
|
8.2 |
|
|
|
1 |
|
|
|
|
|
|
|
|
|
|
|
|
Mezzanine loans |
|
|
65,512 |
|
|
|
10.1 |
% |
|
|
3.6 |
|
|
|
16 |
|
|
|
|
|
|
|
|
|
|
|
|
Preferred equity investments |
|
|
40,327 |
|
|
|
8.7 |
% |
|
|
8.5 |
|
|
|
17 |
|
|
|
|
|
|
|
|
|
|
|
|
Total |
|
|
1,263,928 |
|
|
|
5.9 |
% |
|
|
3.0 |
|
|
|
124 |
|
|
|
|
|
|
|
|
|
|
|
|
Unamortized discounts, fees and costs |
|
|
(3,582 |
) |
|
|
|
|
|
|
|
|
|
|
|
|
|
|
|
|
|
|
|
|
|
|
|
Aggregate carrying amount |
|
$ |
1,260,346 |
|
|
|
|
|
|
|
|
|
|
|
|
|
|
|
|
|
|
|
|
|
|
|
|
|
|
|
|
|
|
|
|
|
|
|
|
|
|
|
|
|
|
|
|
|
|
|
|
|
|
|
|
|
|
|
|
|
|
|
|
|
|
|
|
|
|
|
|
|
|
|
|
|
|
|
|
|
|
|
|
Loan Portfolio Data Trends |
|
|
|
|
|
|
|
|
|
|
|
|
|
|
|
|
|
|
|
|
|
|
|
|
|
|
|
($'s on 000's) |
|
|
|
|
|
|
|
|
|
|
|
|
|
|
|
|
|
|
|
|
|
|
|
|
|
|
|
|
|
For the Three Months Ended |
|
|
|
|
|
|
|
|||||||||||||||||
|
|
|
September 30, 2017 |
|
|
June 30, 2017 |
|
|
March 31, 2017 |
|
|
December 31, 2016 |
|
|
September 30, 2016 |
|
|
|
|
|
|
|
|||||
|
Bridge First Mortgage loans: |
|
|
|
|
|
|
|
|
|
|
|
|
|
|
|
|
|
|
|
|
|
|
|
|
|
|
|
Origination volume |
|
$ |
100,585 |
|
|
$ |
154,675 |
|
|
$ |
120,040 |
|
|
$ |
67,540 |
|
|
$ |
25,550 |
|
|
|
|
|
|
|
|
# of loans originated |
|
|
9 |
|
|
|
12 |
|
|
|
5 |
|
|
|
6 |
|
|
|
2 |
|
|
|
|
|
|
|
|
Loan payoffs |
|
$ |
106,932 |
|
|
$ |
174,147 |
|
|
$ |
85,523 |
|
|
$ |
106,523 |
|
|
$ |
99,601 |
|
|
|
|
|
|
|
|
Unpaid principal balance (period end) |
|
$ |
1,141,365 |
|
|
$ |
1,141,703 |
|
|
$ |
1,169,558 |
|
|
$ |
1,142,052 |
|
|
$ |
1,187,277 |
|
|
|
|
|
|
|
|
Weighted average coupon (period end) |
|
|
5.5 |
% |
|
|
6.1 |
% |
|
|
5.9 |
% |
|
|
5.8 |
% |
|
|
5.7 |
% |
|
|
|
|
|
|
|
|
|
|
|
|
|
|
|
|
|
|
|
|
|
|
|
|
|
|
|
|
|
|
|
|
|
|
|
Conduit First Mortgage loans (for sale): |
|
|
|
|
|
|
|
|
|
|
|
|
|
|
|
|
|
|
|
|
|
|
|
|
|
|
|
Origination volume |
|
$ |
- |
|
|
$ |
- |
|
|
$ |
- |
|
|
$ |
- |
|
|
$ |
- |
|
|
|
|
|
|
|
|
# of loans originated |
|
|
- |
|
|
|
- |
|
|
|
- |
|
|
|
- |
|
|
|
- |
|
|
|
|
|
|
|
|
Loans sold to securitization |
|
$ |
- |
|
|
$ |
- |
|
|
$ |
- |
|
|
$ |
- |
|
|
$ |
13,800 |
|
|
|
|
|
|
|
|
CMBS income |
|
|
- |
|
|
|
- |
|
|
|
- |
|
|
|
20 |
|
|
|
305 |
|
|
|
|
|
|
|
|
Securitization profit % |
|
|
0 |
% |
|
|
0 |
% |
|
|
0.0 |
% |
|
|
0.0 |
% |
|
|
2.2 |
% |
|
|
|
|
|
|
|
Unpaid principal balance (period end) |
|
$ |
16,725 |
|
|
$ |
16,801 |
|
|
$ |
20,088 |
|
|
$ |
20,181 |
|
|
$ |
41,455 |
|
|
|
|
|
|
|
|
Weighted average coupon (period end) |
|
|
4.8 |
% |
|
|
4.8 |
% |
|
|
4.8 |
% |
|
|
4.8 |
% |
|
|
4.8 |
% |
|
|
|
|
|
|
|
|
|
|
|
|
|
|
|
|
|
|
|
|
|
|
|
|
|
|
|
|
|
|
|
|
|
|
|
Mezzanine and Preferred Equity Investments: |
|
|
|
|
|
|
|
|
|
|
|
|
|
|
|
|
|
|
|
|
|
|
|
|||
|
Origination volume |
|
$ |
— |
|
|
$ |
— |
|
|
$ |
— |
|
|
$ |
— |
|
|
$ |
— |
|
|
|
|
|
|
|
|
Loan payoffs |
|
$ |
3,019 |
|
|
$ |
10,229 |
|
|
$ |
4,242 |
|
|
$ |
2,960 |
|
|
$ |
33,635 |
|
|
|
|
|
|
|
|
Unpaid principal balance (period end) |
|
|
105,839 |
|
|
|
112,749 |
|
|
|
128,399 |
|
|
|
132,641 |
|
|
|
146,883 |
|
|
|
|
|
|
|
|
Weighted average coupon (period end) |
|
|
9.6 |
% |
|
|
9.5 |
% |
|
|
9.5 |
% |
|
|
9.4 |
% |
|
|
8.8 |
% |
|
|
|
|
|
|
|
|
|
|
|
|
|
|
|
|
|
|
|
|
|
|
|
|
|
|
|
|
|
|
|
|
|
|
|
Non-accrual loans (period end): |
|
|
|
|
|
|
|
|
|
|
|
|
|
|
|
|
|
|
|
|
|
|
|
|
|
|
|
Bridge loans |
|
$ |
98,474 |
|
|
$ |
104,723 |
|
|
$ |
106,737 |
|
|
$ |
113,509 |
|
|
$ |
92,035 |
|
|
|
|
|
|
|
|
Mezzanine and preferred equity |
|
|
18,660 |
|
|
|
17,331 |
|
|
|
9,029 |
|
|
|
7,529 |
|
|
|
17,433 |
|
|
|
|
|
|
|
|
Total non-accrual loans |
|
$ |
117,134 |
|
|
$ |
122,054 |
|
|
$ |
115,766 |
|
|
$ |
121,038 |
|
|
$ |
109,468 |
|
|
|
|
|
|
|
|
|
|
|
|
|
|
|
|
|
|
|
|
|
|
|
|
|
|
|
|
|
|
|
|
|
|
|
|
Credit status (period end): |
|
|
|
|
|
|
|
|
|
|
|
|
|
|
|
|
|
|
|
|
|
|
|
|
|
|
|
Satisfactory |
|
$ |
1,105,120 |
|
|
$ |
1,100,273 |
|
|
$ |
1,156,410 |
|
|
$ |
1,142,467 |
|
|
$ |
1,247,647 |
|
|
|
|
|
|
|
|
Watchlist -- expecting full recovery |
|
|
24,554 |
|
|
|
55,725 |
|
|
|
92,975 |
|
|
|
32,748 |
|
|
|
18,500 |
|
|
|
|
|
|
|
|
Watchlist -- with reserves |
|
|
134,254 |
|
|
|
115,255 |
|
|
|
68,660 |
|
|
|
119,659 |
|
|
|
109,468 |
|
|
|
|
|
|
|
|
Total |
|
$ |
1,263,928 |
|
|
$ |
1,271,253 |
|
|
$ |
1,318,045 |
|
|
$ |
1,294,874 |
|
|
$ |
1,375,615 |
|
|
|
|
|
|
|
|
|
|
|
|
|
|
|
|
|
|
|
|
|
|
|
|
|
|
|
|
|
|
|
|
|
|
|
|
Loan loss reserves: |
|
|
|
|
|
|
|
|
|
|
|
|
|
|
|
|
|
|
|
|
|
|
|
|
|
|
|
Beginning balance |
|
$ |
23,514 |
|
|
$ |
13,531 |
|
|
$ |
12,354 |
|
|
$ |
18,655 |
|
|
$ |
18,237 |
|
|
|
|
|
|
|
|
Provision |
|
|
5,516 |
|
|
|
20,863 |
|
|
|
1,535 |
|
|
|
3,848 |
|
|
|
1,533 |
|
|
|
|
|
|
|
|
Charge-offs, net of recoveries |
|
|
(3,890 |
) |
|
|
(10,880 |
) |
|
|
(358 |
) |
|
|
(10,149 |
) |
|
|
(1,115 |
) |
|
|
|
|
|
|
|
Ending balance |
|
$ |
25,140 |
|
|
$ |
23,514 |
|
|
$ |
13,531 |
|
|
$ |
12,354 |
|
|
$ |
18,655 |
|
|
|
|
|
|
|
|
|
|
|
|
|
|
|
|
|
|
|
|
|
|
|
|
|
|
|
|
|
|
|
|
|
|
|
|
Statistics as a % of Total Loans (period end): |
|
|
|
|
|
|
|
|
|
|
|
|
|
|
|
|
|
|
|
|
|
|
|
|||
|
Non-accrual loans |
|
|
9.3 |
% |
|
|
9.6 |
% |
|
|
8.8 |
% |
|
|
9.3 |
% |
|
|
8.0 |
% |
|
|
|
|
|
|
|
Watchlist -- expecting full recovery |
|
|
1.9 |
% |
|
|
4.4 |
% |
|
|
7.1 |
% |
|
|
2.5 |
% |
|
|
1.3 |
% |
|
|
|
|
|
|
|
Watchlist -- with reserves |
|
|
10.6 |
% |
|
|
9.0 |
% |
|
|
5.0 |
% |
|
|
9.2 |
% |
|
|
8.0 |
% |
|
|
|
|
|
|
|
Loan loss reserves |
|
|
2.0 |
% |
|
|
1.8 |
% |
|
|
1.0 |
% |
|
|
1.0 |
% |
|
|
1.4 |
% |
|
|
|
|
|
|
18
REAL ESTATE PORTFOLIO DATA
|
Real Estate Portfolio Summary, as of September 30, 2017 |
|
|
|
|
|
|
|
|
|
|
|
|
|
|
|
|
|
|
|
|||||||
|
($'s in 000's) |
|
|
|
|
|
|
|
|
|
|
|
|
|
|
|
|
|
|
|
|
|
|
|
|
|
|
|
Property Type |
|
Gross Cost |
|
|
# of Properties |
|
|
Units / Square Feet / Acres |
|
|
Weighted Average Occupancy |
|
|
Weighted Average Rental Rate |
|
|
|
|
|
|
|
|||||
|
Multifamily |
|
$ |
17,118 |
|
|
|
1 |
|
|
|
220 |
|
|
|
94.1 |
% |
|
$ |
899 |
|
|
per unit, per month |
||||
|
Office |
|
|
217,152 |
|
|
|
8 |
|
|
|
2,276,876 |
|
|
|
81.2 |
% |
|
$ |
20.90 |
|
|
per square foot, per year |
||||
|
Retail |
|
|
115,182 |
|
|
|
7 |
|
|
|
1,738,758 |
|
|
|
69.7 |
% |
|
$ |
14.65 |
|
|
per square foot, per year |
||||
|
Industrial |
|
|
14,816 |
|
|
|
2 |
|
|
|
328,044 |
|
|
|
100.0 |
% |
|
$ |
1.67 |
|
|
per square foot, per year |
||||
|
Land |
|
|
35,406 |
|
|
|
6 |
|
|
|
12.7 |
|
|
|
|
|
|
|
|
|
|
|
|
|
|
|
|
Total |
|
|
399,674 |
|
|
|
24 |
|
|
|
|
|
|
|
|
|
|
|
|
|
|
|
|
|
|
|
|
Accumulated depreciation |
|
|
(30,974 |
) |
|
|
|
|
|
|
|
|
|
|
|
|
|
|
|
|
|
|
|
|
|
|
|
Carrying Amount |
|
$ |
368,700 |
|
|
|
|
|
|
|
|
|
|
|
|
|
|
|
|
|
|
|
|
|
|
|
|
Real Estate Portfolio Summary, as of September 30, 2017 |
|
|||||||||||||||||||||||||||||||||
|
($'s in 000's) |
|
|
|
|
|
|
|
|
|
|
|
|
|
|
|
|
|
|
|
|
|
|
|
|
|
|
|
|
|
|
|
|
|
|
|
Property Type |
|
# of Properties |
|
|
Units/ Square Feet/ Acres |
|
|
Gross Cost |
|
|
Accumulated Depreciation |
|
|
|
|
Net Carrying Value |
|
|
Occupancy (Period End) |
|
|
Average Occupancy (a) |
|
|
Rental Rate (b) |
|
||||||||
|
|
|
|
|
|
|
|
|
|
|
|
|
|
|
|
|
|
|
|
|
|
|
|
|
|
|
|
|
|
|
|
|
|
|
|
|
HELD FOR DISPOSITION |
|
|||||||||||||||||||||||||||||||||
|
|
|
|
|
|
|
|
|
|
|
|
|
|
|
|
|
|
|
|
|
|
|
|
|
|
|
|
|
|
|
|
|
|
|
|
|
TOTAL MULTIFAMILY: |
|
|
1 |
|
|
|
220 |
|
|
$ |
17,118 |
|
|
$ |
(3,860 |
) |
|
|
|
$ |
13,258 |
|
|
|
95.9 |
% |
|
|
94.1 |
% |
|
$ |
899 |
|
|
|
|
|
|
|
|
|
|
|
|
|
|
|
|
|
|
|
|
|
|
|
|
|
|
|
|
|
|
|
|
|
|
|
|
|
|
TOTAL OFFICE: |
|
|
5 |
|
|
|
1,906,687 |
|
|
$ |
144,246 |
|
|
$ |
(2,125 |
) |
|
|
|
$ |
142,121 |
|
|
|
59.3 |
% |
|
|
59.6 |
% |
|
$ |
21.45 |
|
|
|
|
|
|
|
|
|
|
|
|
|
|
|
|
|
|
|
|
|
|
|
|
|
|
|
|
|
|
|
|
|
|
|
|
|
|
TOTAL INDUSTRIAL: |
|
|
2 |
|
|
|
328,044 |
|
|
$ |
14,816 |
|
|
$ |
(906 |
) |
|
|
|
$ |
13,910 |
|
|
|
100.0 |
% |
|
|
100.0 |
% |
|
$ |
1.94 |
|
|
|
|
|
|
|
|
|
|
|
|
|
|
|
|
|
|
|
|
|
|
|
|
|
|
|
|
|
|
|
|
|
|
|
|
|
|
TOTAL RETAIL: |
|
|
6 |
|
|
|
1,623,765 |
|
|
$ |
91,044 |
|
|
$ |
(5,611 |
) |
|
|
|
$ |
85,433 |
|
|
|
66.1 |
% |
|
|
65.7 |
% |
|
$ |
11.91 |
|
|
|
|
|
|
|
|
|
|
|
|
|
|
|
|
|
|
|
|
|
|
|
|
|
|
|
|
|
|
|
|
|
|
|
|
|
|
TOTAL LAND: |
|
|
4 |
|
|
|
11.7 |
|
|
$ |
34,792 |
|
|
$ |
- |
|
|
|
|
$ |
34,792 |
|
|
|
|
|
|
|
|
|
|
|
|
|
|
|
|
|
|
|
|
|
|
|
|
|
|
|
|
|
|
|
|
|
|
|
|
|
|
|
|
|
|
|
|
|
|
|
|
|
|
TOTAL HELD FOR DISPOSITION |
|
|
18 |
|
|
|
|
|
|
$ |
302,016 |
|
|
$ |
(12,502 |
) |
|
|
|
$ |
289,514 |
|
|
|
|
|
|
|
|
|
|
|
|
|
|
|
|
|
|
|
|
|
|
|
|
|
|
|
|
|
|
|
|
|
|
|
|
|
|
|
|
|
|
|
|
|
|
|
|
|
|
HELD FOR INVESTMENT |
|
|||||||||||||||||||||||||||||||||
|
|
|
|
|
|
|
|
|
|
|
|
|
|
|
|
|
|
|
|
|
|
|
|
|
|
|
|
|
|
|
|
|
|
|
|
|
TOTAL OFFICE: |
|
|
3 |
|
|
|
370,189 |
|
|
$ |
72,906 |
|
|
$ |
(18,291 |
) |
|
|
|
$ |
54,615 |
|
|
|
86.3 |
% |
|
|
86.9 |
% |
|
$ |
20.52 |
|
|
|
|
|
|
|
|
|
|
|
|
|
|
|
|
|
|
|
|
|
|
|
|
|
|
|
|
|
|
|
|
|
|
|
|
|
|
TOTAL RETAIL: |
|
|
1 |
|
|
|
114,993 |
|
|
$ |
24,138 |
|
|
$ |
(181 |
) |
|
|
|
$ |
23,957 |
|
|
|
58.9 |
% |
|
|
58.9 |
% |
|
$ |
25.06 |
|
|
|
|
|
|
|
|
|
|
|
|
|
|
|
|
|
|
|
|
|
|
|
|
|
|
|
|
|
|
|
|
|
|
|
|
|
|
TOTAL LAND: |
|
|
2 |
|
|
|
1.0 |
|
|
$ |
614 |
|
|
$ |
— |
|
|
|
|
$ |
614 |
|
|
|
|
|
|
|
|
|
|
|
|
|
|
|
|
|
|
|
|
|
|
|
|
|
|
|
|
|
|
|
|
|
|
|
|
|
|
|
|
|
|
|
|
|
|
|
|
|
|
TOTAL HELD FOR INVESTMENT |
|
6 |
|
|
|
|
|
|
$ |
97,658 |
|
|
$ |
(18,472 |
) |
|
|
|
$ |
79,186 |
|
|
|
|
|
|
|
|
|
|
|
|
|
|
|
|
|
|
|
|
|
|
|
|
|
|
|
|
|
|
|
|
|
|
|
|
|
|
|
|
|
|
|
|
|
|
|
|
|
|
|
TOTAL REAL ESTATE OWNED |
|
|
|
|
|
|
|
|
|
$ |
399,674 |
|
|
$ |
(30,974 |
) |
|
|
|
$ |
368,700 |
|
|
|
|
|
|
|
|
|
|
|
|
|
(a) Average occupancy represents the daily average occupancy for the three-month period ended September 30, 2017.
|
(b) |
Multifamily rental rate data is per unit, per month. Office, Industrial and Retail are per square foot, per year. |
19
CHANGES IN THE PORTFOLIO – YEAR-TO-DATE SEPTEMBER 30, 2017:
|
|
|
City & State |
|
Square Feet / Units/Acres |
|
|
Month Sold / Disposed / Acquired |
|
Transaction |
|
Value |
|
||
|
SALES: |
|
|
|
|
|
|
|
|
|
|
|
|
|
|
|
Office: |
|
|
|
|
|
|
|
|
|
|
|
|
|
|
|
Executive Center |
|
Milwaukee, WI |
|
|
102,017 |
|
|
March |
|
Sale |
|
|
10,600 |
|
|
Tiffany Square |
|
Colorado Springs, CO |
|
|
184,219 |
|
|
March |
|
Sale |
|
|
12,175 |
|
|
100 East Lancaster Avenue |
|
Downingtown, PA |
|
|
37,963 |
|
|
April |
|
Sale |
|
|
4,575 |
|
|
UBS Tower |
|
St. Paul, MN |
|
|
228,882 |
|
|
May |
|
Sale |
|
|
14,150 |
|
|
Rutherford |
|
Woodlawn, MD |
|
|
85,806 |
|
|
September |
|
Sale |
|
|
5,700 |
|
|
Total Office |
|
|
|
|
638,887 |
|
|
|
|
|
|
|
47,200 |
|
|
|
|
|
|
|
|
|
|
|
|
|
|
|
|
|
|
Multifamily: |
|
|
|
|
|
|
|
|
|
|
|
|
|
|
|
Tuscany Bay |
|
Orlando, FL |
|
|
396 |
|
|
January |
|
Sale |
|
|
36,650 |
|
|
Oyster Point |
|
Newport News, VA |
|
|
278 |
|
|
March |
|
Sale |
|
|
11,500 |
|
|
Emerald Bay |
|
Las Vegas, NV |
|
|
337 |
|
|
March |
|
Sale |
|
|
23,750 |
|
|
South Terrace |
|
Durham, NC |
|
|
328 |
|
|
June |
|
Sale |
|
|
42,950 |
|
|
Trails at Northpoint |
|
Jackson, MS |
|
|
144 |
|
|
July |
|
Sale |
|
|
6,450 |
|
|
Total Multifamily |
|
|
|
|
1,483 |
|
|
|
|
|
|
|
121,300 |
|
|
|
|
|
|
|
|
|
|
|
|
|
|
|
|
|
|
Retail: |
|
|
|
|
|
|
|
|
|
|
|
|
|
|
|
South Plaza (Parcel Sale) |
|
Nashville, TN |
|
|
284,697 |
|
|
May |
|
Parcel Sale |
|
|
11,478 |
|
|
South Plaza |
|
Nashville, TN |
|
|
- |
|
|
September |
|
Sale |
|
|
11,000 |
|
|
Total Retail |
|
|
|
|
284,697 |
|
|
|
|
|
|
|
22,478 |
|
|
|
|
|
|
|
|
|
|
|
|
|
|
|
|
|
|
Land: |
|
|
|
|
|
|
|
|
|
|
|
|
|
|
|
MGS Gift Shop |
|
Daytona Beach, FL |
|
|
1.0 |
|
|
March |
|
Sale |
|
|
300 |
|
|
Total Land |
|
|
|
|
1.0 |
|
|
|
|
|
|
|
300 |
|
|
|
|
|
|
|
|
|
|
|
|
|
|
|
|
|
|
Total Sales: |
|
|
|
|
|
|
|
|
|
|
|
$ |
191,278 |
|
|
|
|
|
|
|
|
|
|
|
|
|
|
|
|
|
|
OTHER DISPOSITIONS: |
|
|
|
|
|
|
|
|
|
|
|
|
|
|
|
Industrial |
|
|
|
|
|
|
|
|
|
|
|
|
|
|
|
East Glendale |
|
Sparks, NV |
|
|
31,976 |
|
|
February |
|
Deconsolidation |
|
|
1,091 |
|
|
Rex Boulevard |
|
Auburn Hills, MI |
|
|
151,200 |
|
|
February |
|
Deconsolidation |
|
|
7,209 |
|
|
Adams Aircraft |
|
Englewood, CO |
|
|
48,490 |
|
|
March |
|
Deconsolidation |
|
|
4,557 |
|
|
Perry Avenue |
|
Attleboro, MA |
|
|
456,000 |
|
|
March |
|
Deconsolidation |
|
|
25,529 |
|
|
Interstate Drive |
|
West Springfield, MA |
|
|
143,025 |
|
|
March |
|
Deconsolidation |
|
|
4,965 |
|
|
South Midco |
|
Marysville, OH |
|
|
130,044 |
|
|
August |
|
Deconsolidation |
|
|
3,480 |
|
|
Fondorf Drive |
|
Columbus, OH |
|
|
151,685 |
|
|
August |
|
Deconsolidation |
|
|
5,076 |
|
|
Kirby Circle |
|
Palm Bay, FL |
|
|
231,313 |
|
|
September |
|
Deconsolidation |
|
|
15,773 |
|
|
Lake Avenue |
|
Fort Wayne, IN |
|
|
25,200 |
|
|
September |
|
Deconsolidation |
|
|
2,876 |
|
|
Moreau Court |
|
South Bend, IN |
|
|
82,396 |
|
|
September |
|
Deconsolidation |
|
|
5,636 |
|
|
Total Industrial |
|
|
|
|
1,451,329 |
|
|
|
|
|
|
|
76,192 |
|
|
|
|
|
|
|
|
|
|
|
|
|
|
|
|
|
|
Office: |
|
|
|
|
|
|
|
|
|
|
|
|
|
|
|
Gettysburg Pke 6930 |
|
Fort Wayne, IN |
|
|
161,000 |
|
|
September |
|
Deconsolidation |
|
|
5,069 |
|
|
Gettysburg Pke 6932 |
|
Fort Wayne, IN |
|
|
63,804 |
|
|
September |
|
Deconsolidation |
|
|
2,200 |
|
|
Total Ofiice |
|
|
|
|
224,804 |
|
|
|
|
|
|
|
7,269 |
|
|
|
|
|
|
|
|
|
|
|
|
|
|
|
|
|
|
Total Other Dispositions: |
|
|
|
|
|
|
|
|
|
|
|
$ |
83,461 |
|
|
|
|
|
|
|
|
|
|
|
|
|
|
|
|
|
|
Total Sales and Other Dispositions |
|
|
|
|
|
|
|
|
|
|
|
$ |
274,739 |
|
|
|
|
|
|
|
|
|
|
|
|
|
|
|
|
|
|
ADDITIONS: |
|
|
|
|
|
|
|
|
|
|
|
|
|
|
|
Retail: |
|
|
|
|
|
|
|
|
|
|
|
|
|
|
|
Erieview Galleria |
|
Cleveland, OH |
|
|
93,663 |
|
|
March |
|
Loan Conversion |
|
|
1,636 |
|
|
Total Retail |
|
|
|
|
93,663 |
|
|
|
|
|
|
|
1,636 |
|
|
|
|
|
|
|
|
|
|
|
|
|
|
|
|
|
|
Total Additions: |
|
|
|
|
|
|
|
|
|
|
|
$ |
1,636 |
|
20
Indebtedness oVERVIEW
As of SEPTEMBER 30, 2017
|
|
|
As of December 31, 2016 |
|
|
As of September 30, 2017 |
||||||||||||||||||
|
($'S in 000's) |
|
Unpaid Principal |
|
|
Unpaid Principal |
|
|
Unamortized Discount and Debt Issuance Costs |
|
|
Carrying Amount |
|
|
Rate |
|
|
Maturity Date |
|
|||||
|
RAIT Indebtedness: |
|
|
|
|
|
|
|
|
|
|
|
|
|
|
|
|
|
|
|
|
|
|
|
|
Recourse debt |
|
|
|
|
|
|
|
|
|
|
|
|
|
|
|
|
|
|
|
|
|
|
|
|
7% convertible senior notes |
|
$ |
871 |
|
|
$ |
871 |
|
|
$ |
(38 |
) |
|
$ |
833 |
|
|
|
7.0 |
% |
|
04/2031 |
|
|
4% convertible senior notes |
|
|
126,098 |
|
|
|
120,748 |
|
|
|
(4,438 |
) |
|
|
116,310 |
|
|
|
4.0 |
% |
|
10/2033 |
(a) |
|
7.625% senior notes |
|
|
57,287 |
|
|
|
56,324 |
|
|
|
(1,515 |
) |
|
|
54,809 |
|
|
|
7.6 |
% |
|
04/2024 |
|
|
7.125% senior notes |
|
|
70,731 |
|
|
|
68,884 |
|
|
|
(1,081 |
) |
|
|
67,803 |
|
|
|
7.1 |
% |
|
08/2019 |
|
|
Senior secured notes |
|
|
62,000 |
|
|
|
13,500 |
|
|
|
(922 |
) |
|
|
12,578 |
|
|
|
7.2 |
% |
|
10/2018-04/2019 |
|
|
Lending warehouse facilities |
|
|
|
|
|
|
|
|
|
|
|
|
|
|
|
|
|
|
|
|
|
|
|
|
Conduit loans |
|
|
- |
|
|
|
- |
|
|
|
(209 |
) |
|
|
(209 |
) |
|
|
- |
|
|
11/2017-07/2018 |
|
|
Floating rate loans |
|
|
26,421 |
|
|
|
123,919 |
|
|
|
(355 |
) |
|
|
123,564 |
|
|
|
3.4 |
% |
|
12/2017-07/2018 |
(b) |
|
Total |
|
|
26,421 |
|
|
|
123,919 |
|
|
|
(564 |
) |
|
|
123,355 |
|
|
|
3.4 |
% |
|
|
|
|
Junior subordinated notes, at fair value |
|
|
18,671 |
|
|
|
18,671 |
|
|
|
(9,417 |
) |
|
|
9,254 |
|
|
|
5.3 |
% |
|
03/2035 |
|
|
Junior subordinated notes, at amortized cost |
|
|
25,100 |
|
|
|
25,100 |
|
|
|
- |
|
|
|
25,100 |
|
|
|
3.8 |
% |
|
04/2037 |
|
|
Total Recourse Debt |
|
|
387,179 |
|
|
|
428,017 |
|
|
|
(17,975 |
) |
|
|
410,042 |
|
|
|
5.0 |
% |
|
|
|
|
Non-Recourse debt |
|
|
|
|
|
|
|
|
|
|
|
|
|
|
|
|
|
|
|
|
|
|
|
|
Securitization notes payable: |
|
|
|
|
|
|
|
|
|
|
|
|
|
|
|
|
|
|
|
|
|
|
|
|
CRE CDO I |
|
|
376,089 |
|
|
|
283,384 |
|
|
|
(3,130 |
) |
|
|
280,254 |
|
|
|
1.7 |
% |
|
11/2046 |
|
|
CRE CDO II |
|
|
166,227 |
|
|
|
53,470 |
|
|
|
(1,710 |
) |
|
|
51,760 |
|
|
|
2.6 |
% |
|
06/2045 |
|
|
FL3 |
|
|
57,942 |
|
|
|
- |
|
|
|
- |
|
|
|
- |
|
|
|
0.0 |
% |
|
- |
|
|
FL4 |
|
|
107,998 |
|
|
|
- |
|
|
|
- |
|
|
|
- |
|
|
|
0.0 |
% |
|
- |
|
|
FL5 |
|
|
265,304 |
|
|
|
156,656 |
|
|
|
(424 |
) |
|
|
156,232 |
|
|
|
4.7 |
% |
|
01/2031 |
|
|
FL6 |
|
|
216,677 |
|
|
|
120,248 |
|
|
|
(1,654 |
) |
|
|
118,594 |
|
|
|
3.7 |
% |
|
11/2031 |
|
|
FL7 |
|
|
- |
|
|
|
276,881 |
|
|
|
(3,812 |
) |
|
|
273,069 |
|
|
|
2.7 |
% |
|
06/2037 |
|
|
Total securitization notes payable |
|
|
1,190,237 |
|
|
|
890,639 |
|
|
|
(10,730 |
) |
|
|
879,909 |
|
|
|
2.9 |
% |
|
|
|
|
Loans payable on real estate |
|
|
186,237 |
|
|
|
97,492 |
|
|
|
(405 |
) |
|
|
97,087 |
|
|
|
0.0 |
% |
|
06/2016-12/2021 |
(c) |
|
Total Non-recourse debt |
|
|
1,376,474 |
|
|
|
988,131 |
|
|
|
(11,135 |
) |
|
|
976,996 |
|
|
|
2.6 |
% |
|
|
|
|
Other Indebtedness |
|
|
24,321 |
|
|
|
40,830 |
|
|
|
79 |
|
|
|
40,909 |
|
|
|
- |
|
|
- |
|
|
Total RAIT Indebtedness |
|
$ |
1,787,974 |
|
|
$ |
1,456,978 |
|
|
$ |
(29,031 |
) |
|
$ |
1,427,947 |
|
|
|
0.0 |
% |
|
|
|
Recourse Non-recourse
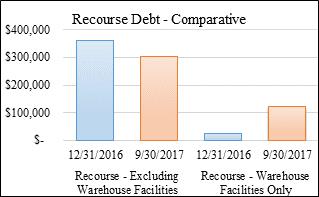

|
|
(a) |
Includes the $120,748 of 4% convertible senior notes that may be put in October 2018. |
|
|
(b) |
All current borrowings on warehouse facilities mature in 2018. |
|
|
(c) |
One loan payable on real estate had a maturity date of June 2016. This loan is in the process of being resolved with the lender. |
21
DEFINITIONS
Adjusted EBITDA
Adjusted Earnings before Interest, Taxes, Depreciation and Amortization, is a non-GAAP financial measure. We calculate Adjusted EBITDA as Net Income, before the effects of investment interest expense, interest expense, acquisition and integration expenses, depreciation and amortization, provision for loan losses (gains) losses on assets, asset impairments, (gains) losses on debt extinguishments, change in fair value of financial instruments, and income tax (benefit) provision as well as similar items and other non-recurring items such as (gains) losses on acquisitions related to discontinued operations. We believe Adjusted EBITDA provides useful information to investors to ascertain our interest coverage and interest plus preferred dividends coverage ratios.
Assets Under Management
Assets under management, or AUM, is an operating measure representing the total assets that we own or are managing for third parties. While not all AUM generates fee income, it is an important operating measure to gauge our asset growth, volume of originations, size and scale of our operations and our performance. AUM includes our total investment portfolio, assets associated with unconsolidated securitizations for which we derive asset management fees and real estate properties we manage on behalf of third parties.
Cash Available for Distribution
Cash available for distribution, or CAD, is a non-GAAP financial measure. We believe that CAD provides investors and management with a meaningful indicator of operating performance. Management also uses CAD, among other measures, to evaluate profitability and our board of trustees considers CAD in determining our quarterly cash distributions. We also believe that CAD is useful because it adjusts for a variety of noncash items (such as depreciation and amortization, equity-based compensation, provision for loan losses and non-cash interest income and expense items). In addition, the compensation committee of our board of trustees used CAD as a metric in establishing quantitative performance based awards for certain of our executive officers beginning in 2015.
We calculate CAD by subtracting from or adding to net income (loss) attributable to common shareholders the following items: depreciation and amortization items including depreciation and amortization expense, straight-line rental income or expense, amortization of deferred financing costs, and amortization of discounts on financings; origination fees; equity-based compensation; changes in the fair value of our financial instruments; realized gains (losses) on assets; provision for loan losses; asset impairments; acquisition gains or losses and transaction costs; deferred income tax benefit (provision); certain fee income eliminated in consolidation that is attributable to third parties; and one-time events pursuant to changes in U.S. GAAP and certain other non-routine items.
CAD should not be considered as an alternative to net income (loss) or cash generated from operating activities, determined in accordance with U.S. GAAP, as an indicator of operating performance. For example, CAD does not adjust for the accrual of income and expenses that may not be received or paid in cash during the associated periods. Please refer to our consolidated financial statements prepared in accordance with U.S. GAAP in our most recent report on Form 10-K or Form 10-Q filed with the Securities and Exchange Commission. In addition, our methodology for calculating CAD may differ from the methodologies used by other comparable companies, including other REITs, when calculating the same or similar supplemental financial measures and may not be comparable with these companies.
Funds from Operations
We believe that funds from operations, or FFO, which is a non-GAAP financial measure, is an additional appropriate measure of the operating performance of a REIT. We compute FFO in accordance with the standards established by the National Association of Real Estate Investment Trusts, or NAREIT, as net income or loss allocated to common shares (computed in accordance with GAAP), excluding real estate-related depreciation expense, gains or losses on sales of real estate, asset impairment and the cumulative effect of changes in accounting principles. Our management utilizes FFO as a measure of our operating performance. FFO is not an equivalent to net income or cash generated from operating activities determined in accordance with U.S. GAAP. Furthermore, FFO does not represent amounts available for management’s discretionary use because of needed capital replacement or expansion, debt service obligations or other commitments or uncertainties. FFO should not be considered as an alternative to net income as an indicator of our operating performance or as an alternative to cash flow from operating activities as a measure of our liquidity.
22
Gross real estate investments equal investments in real estate, net plus accumulated depreciation as it appears on the consolidated balance sheet. The following table provides a reconciliation of investments in real estate, net to total gross real estate investments.
|
|
As of |
|
|||||||||||||||||
|
|
September 30, 2017 |
|
|
June 30, 2017 |
|
|
March 31, 2017 |
|
|
December 31, 2016 |
|
|
September 30, 2016 |
|
|||||
|
Investments in real estate, net |
$ |
368,700 |
|
|
$ |
434,890 |
|
|
$ |
580,051 |
|
|
$ |
716,432 |
|
|
$ |
808,749 |
|
|
Plus: Accumulated depreciation |
|
30,974 |
|
|
|
35,359 |
|
|
|
114,179 |
|
|
|
138,214 |
|
|
|
156,613 |
|
|
Gross real estate investments |
$ |
399,674 |
|
|
$ |
470,249 |
|
|
$ |
694,230 |
|
|
$ |
854,646 |
|
|
$ |
965,362 |
|
Interest Coverage
Interest coverage is computed as Adjusted EBITDA divided by interest costs (excluding amortization of deferred financing costs and debt discounts)
Interest + Preferred Coverage
Interest + Preferred coverage is computed as Adjusted EBITDA divided by the sum of interest costs (excluding amortization of deferred financing costs and debt discounts) and preferred costs (excluding amortization of preferred share discounts).
Net Operating Income
Net Operating Income (“NOI”), a non-GAAP financial measure, is a useful measure of the operating performance of its real estate portfolio. NOI is defined as total property revenue less total property operating expenses, excluding depreciation and amortization and interest expense. Other REITs may use different methodologies for calculating NOI, and accordingly, our NOI may not be comparable to other REITs. We believe that this measure provides an operating perspective not immediately apparent from GAAP operating income or net income. We use NOI to evaluate our real estate portfolio performance on a same store and non-same store basis because NOI measures the core operations of property performance by excluding corporate level expenses and other items not related to property operating performance and captures trends in rental rates and property operating expenses. A reconciliation of our net operating income to net income is as follows for each of the periods presented below:
|
($'s in 000's) |
|
For the Three Months Ended |
|
|
|
|
For the Nine Months Ended |
|
||||||||||||||||||||||||||||
|
|
|
September 30, 2017 |
|
|
June 30, 2017 |
|
|
March 31, 2017 |
|
|
|
|
December 31, 2016 |
|
|
|
|
September 30, 2016 |
|
|
|
|
September 30, 2017 |
|
|
|
|
September 30, 2016 |
|
|||||||
|
Net operating income |
|
$ |
6,699 |
|
|
$ |
7,437 |
|
|
$ |
9,431 |
|
|
|
|
$ |
10,417 |
|
|
|
|
$ |
14,979 |
|
|
|
|
$ |
23,567 |
|
|
|
|
$ |
45,525 |
|
|
Net interest margin |
|
|
7,879 |
|
|
|
4,336 |
|
|
|
7,877 |
|
|
|
|
|
10,844 |
|
|
|
|
|
11,677 |
|
|
|
|
|
20,092 |
|
|
|
|
|
42,553 |
|
|
Fee and other income |
|
|
1,712 |
|
|
|
1,531 |
|
|
|
1,661 |
|
|
|
|
|
1,400 |
|
|
|
|
|
1,946 |
|
|
|
|
|
4,904 |
|
|
|
|
|
5,974 |
|
|
Interest expense |
|
|
(8,656 |
) |
|
|
(8,883 |
) |
|
|
(10,143 |
) |
|
|
|
|
(11,914 |
) |
|
|
|
|
(13,298 |
) |
|
|
|
|
(27,682 |
) |
|
|
|
|
(43,135 |
) |
|
Compensation expenses |
|
|
(3,194 |
) |
|
|
(3,529 |
) |
|
|
(3,487 |
) |
|
|
|
|
(6,275 |
) |
|
|
|
|
(4,675 |
) |
|
|
|
|
(10,210 |
) |
|
|
|
|
(12,162 |
) |
|
General and administrative expenses |
|
|
(3,233 |
) |
|
|
(2,689 |
) |
|
|
(2,705 |
) |
|
|
|
|
(3,300 |
) |
|
|
|
|
(3,052 |
) |
|
|
|
|
(8,627 |
) |
|
|
|
|
(9,973 |
) |
|
Property management expenses |
|
|
(1,908 |
) |
|
|
(2,651 |
) |
|
|
(2,213 |
) |
|
|
|
|
(2,240 |
) |
|
|
|
|
(2,226 |
) |
|
|
|
|
(6,772 |
) |
|
|
|
|
(7,239 |
) |
|
Acquisition and integration expenses |
|
|
(57 |
) |
|
|
(67 |
) |
|
|
(172 |
) |
|
|
|
|
(248 |
) |
|
|
|
|
(197 |
) |
|
|
|
|
(296 |
) |
|
|
|
|
(376 |
) |
|
Provision for loan losses |
|
|
(5,516 |
) |
|
|
(20,863 |
) |
|
|
(1,535 |
) |
|
|
|
|
(3,848 |
) |
|
|
|
|
(1,533 |
) |
|
|
|
|
(27,914 |
) |
|
|
|
|
(4,202 |
) |
|
Depreciation and amortization expense |
|
|
(6,139 |
) |
|
|
(7,819 |
) |
|
|
(9,754 |
) |
|
|
|
|
(12,031 |
) |
|
|
|
|
(11,466 |
) |
|
|
|
|
(23,712 |
) |
|
|
|
|
(39,273 |
) |
|
IRT internalization and management transition expenses |
|
|
- |
|
|
|
- |
|
|
|
(736 |
) |
|
|
|
|
(6,271 |
) |
|
|
|
|
- |
|
|
|
|
|
(736 |
) |
|
|
|
|
- |
|
|
Shareholder activism expenses |
|
|
(155 |
) |
|
|
(1,615 |
) |
|
|
(694 |
) |
|
|
|
|
- |
|
|
|
|
|
- |
|
|
|
|
|
(2,464 |
) |
|
|
|
|
- |
|
|
Employee separation expenses |
|
|
(575 |
) |
|
|
- |
|
|
|
- |
|
|
|
|
|
- |
|
|
|
|
|
- |
|
|
|
|
|
(575 |
) |
|
|
|
|
- |
|
|
Other income (expense) |
|
|
283 |
|
|
|
(153 |
) |
|
|
14 |
|
|
|
|
|
(457 |
) |
|
|
|
|
(70 |
) |
|
|
|
|
144 |
|
|
|
|
|
30 |
|
|
Gains (loss) on assets |
|
|
30 |
|
|
|
10,759 |
|
|
|
12,006 |
|
|
|
|
|
29,461 |
|
|
|
|
|
18,194 |
|
|
|
|
|
22,795 |
|
|
|
|
|
23,811 |
|
|
Gain (loss) on deconsolidation of properties |
|
|
(4,035 |
) |
|
|
- |
|
|
|
(15,947 |
) |
|
|
|
|
- |
|
|
|
|
|
- |
|
|
|
|
|
(19,982 |
) |
|
|
|
|
- |
|
|
Asset impairment |
|
|
(3,121 |
) |
|
|
(85,809 |
) |
|
|
(7,424 |
) |
|
|
|
|
(11,127 |
) |
|
|
|
|
(18,872 |
) |
|
|
|
|
(96,354 |
) |
|
|
|
|
(26,658 |
) |
|
Goodwill impairment |
|
|
- |
|
|
|
(8,342 |
) |
|
|
- |
|
|
|
|
|
- |
|
|
|
|
|
- |
|
|
|
|
|
(8,342 |
) |
|
|
|
|
- |
|
|
Gain (loss) on debt extinguishment |
|
|
(644 |
) |
|
|
(1,598 |
) |
|
|
3,186 |
|
|
|
|
|
333 |
|
|
|
|
|
(6 |
) |
|
|
|
|
944 |
|
|
|
|
|
998 |
|
|
Change in fair value of financial instruments |
|
|
4,753 |
|
|
|
3,093 |
|
|
|
(1,153 |
) |
|
|
|
|
1,109 |
|
|
|
|
|
(1,375 |
) |
|
|
|
|
6,693 |
|
|
|
|
|
(7,055 |
) |
|
Income tax benefit (provision) |
|
|
34 |
|
|
|
(22 |
) |
|
|
249 |
|
|
|
|
|
(20,601 |
) |
|
|
|
|
15,302 |
|
|
|
|
|
261 |
|
|
|
|
|
18,051 |
|
|
Income from discontinued operations |
|
|
- |
|
|
|
- |
|
|
|
- |
|
|
|
|
|
1,671 |
|
|
|
|
|
4,112 |
|
|
|
|
|
- |
|
|
|
|
|
38,473 |
|
|
Gain (loss) on disposal of discontinued operations |
|
|
- |
|
|
|
- |
|
|
|
- |
|
|
|
|
|
47,808 |
|
|
|
|
|
- |
|
|
|
|
|
- |
|
|
|
|
|
- |
|
|
Net income (loss) |
|
$ |
(15,843 |
) |
|
$ |
(116,884 |
) |
|
$ |
(21,539 |
) |
|
|
|
$ |
24,731 |
|
|
|
|
$ |
9,440 |
|
|
|
|
$ |
(154,266 |
) |
|
|
|
$ |
25,342 |
|
23
Total Gross Assets
Total gross assets equals total assets plus accumulated depreciation as these captions are reported on the consolidated balance sheet. The following table provides a reconciliation of total assets to total gross assets.
|
|
As of |
|
|||||||||||||||||
|
|
September 30, 2017 |
|
|
June 30, 2017 |
|
|
March 31, 2017 |
|
|
December 31, 2016 |
|
|
September 30, 2016 |
|
|||||
|
Total assets |
$ |
1,867,688 |
|
|
$ |
2,041,773 |
|
|
$ |
2,222,615 |
|
|
$ |
2,406,843 |
|
|
$ |
3,882,531 |
|
|
Plus: Accumulated depreciation (a) |
|
30,974 |
|
|
|
35,359 |
|
|
|
114,179 |
|
|
|
138,214 |
|
|
|
209,437 |
|
|
Plus: Accumulated amortization (b) (c) |
|
3,633 |
|
|
|
4,499 |
|
|
|
10,658 |
|
|
|
11,245 |
|
|
|
26,247 |
|
|
Total gross assets |
$ |
1,902,295 |
|
|
$ |
2,081,631 |
|
|
$ |
2,347,452 |
|
|
$ |
2,556,302 |
|
|
$ |
4,118,215 |
|
|
|
|
|
|
|
|
|
|
|
|
|
|
|
|
|
|
|
|
|
|
|
|
(a) |
Includes accumulated depreciation from discontinued operations. |
|
|
(b) |
Includes accumulated amortization from discontinued operations. |
|
|
(c) |
Represents accumulated amortization of real estate-related intangible assets and liabilities. |
24