Attached files
| file | filename |
|---|---|
| EX-32.2 - EX-32.2 - RAIT Financial Trust | ras-ex322_8.htm |
| EX-32.1 - EX-32.1 - RAIT Financial Trust | ras-ex321_12.htm |
| EX-31.2 - EX-31.2 - RAIT Financial Trust | ras-ex312_10.htm |
| EX-31.1 - EX-31.1 - RAIT Financial Trust | ras-ex311_13.htm |
| EX-12.1 - EX-12.1 - RAIT Financial Trust | ras-ex121_11.htm |
UNITED STATES
SECURITIES AND EXCHANGE COMMISSION
WASHINGTON, D.C. 20549
FORM 10-Q
(Mark One)
|
☒ |
Quarterly Report Pursuant to Section 13 or 15(d) of the Securities Exchange Act of 1934 |
For the quarterly period ended September 30, 2016
or
|
☐ |
Transition Report Pursuant to Section 13 or 15(d) of the Securities Exchange Act of 1934 |
For the transition period from to
Commission File Number 1-14760
RAIT FINANCIAL TRUST
(Exact name of registrant as specified in its charter)
|
Maryland |
23-2919819 |
|
(State or other jurisdiction of incorporation or organization) |
(I.R.S. Employer Identification No.) |
|
|
|
|
Two Logan Square, 100 N. 18th Street, 23rd Floor, Philadelphia, PA |
19103 |
|
(Address of principal executive offices) |
(Zip Code) |
(215) 207-2100
(Registrant’s telephone number, including area code)
N/A
(Former name, former address and former fiscal year, if changed since last report)
Indicate by check mark whether the registrant (1) has filed all reports required to be filed by Section 13 or 15(d) of the Securities Exchange Act of 1934 during the preceding 12 months (or for such shorter period that the registrant was required to file such reports), and (2) has been subject to such filing requirements for the past 90 days. ☒ Yes ☐ No
Indicate by check mark whether the registrant has submitted electronically and posted on its corporate Web site, if any, every Interactive Data File required to be submitted and posted pursuant to Rule 405 of Regulation S-T during the preceding 12 months (or for such shorter period that the registrant was required to submit and post such files). ☒ Yes ☐ No
Indicate by check mark whether the registrant is a large accelerated filer, an accelerated filer, a non-accelerated filer, or a smaller reporting company. See the definitions of “large accelerated filer”, “accelerated filer” and “smaller reporting company” in Rule 12b-2 of the Exchange Act.
|
Large accelerated filer |
☐ |
Accelerated filer |
☒ |
|
|
|
|
|
|
Non-accelerated filer |
☐ (Do not check if a smaller reporting company) |
Smaller reporting company |
☐ |
Indicate by check mark whether the registrant is a shell company (as defined in Rule 12b-2 of the Exchange Act). ☐ Yes ☒ No
A total of 92,177,079 common shares of beneficial interest, par value $0.03 per share, of the registrant were outstanding as of November 7, 2016.
TABLE OF CONTENTS
|
|
|
|
|
Page |
|
|
|
|
|
|
|
|
|
|
|
|
|
|
|
|
|
|
|
Item 1. |
|
|
1 |
|
|
|
|
|
|
|
|
|
|
Consolidated Balance Sheets as of September 30, 2016 and December 31, 2015 |
|
1 |
|
|
|
|
|
|
|
|
|
|
2 |
|
|
|
|
|
|
|
|
|
|
|
3 |
|
|
|
|
|
|
|
|
|
|
Consolidated Statement of Changes in Equity for the Nine Months Ended September 30, 2016 |
|
4 |
|
|
|
|
|
|
|
|
|
Consolidated Statements of Cash Flows for the Nine Months Ended September 30, 2016 and 2015 |
|
5 |
|
|
|
|
|
|
|
|
|
|
6 |
|
|
|
|
|
|
|
|
Item 2. |
|
Management’s Discussion and Analysis of Financial Condition and Results of Operations |
|
45 |
|
|
|
|
|
|
|
Item 3. |
|
|
63 |
|
|
|
|
|
|
|
|
Item 4. |
|
|
63 |
|
|
|
|
|
|
|
|
|
|
|
|
|
|
|
|
|
|
|
|
Item 1. |
|
|
64 |
|
|
|
|
|
|
|
|
Item 1A. |
|
|
64 |
|
|
|
|
|
|
|
|
Item 6. |
|
|
65 |
|
|
|
|
|
|
|
|
|
|
|
66 |
RAIT Financial Trust
(Unaudited and dollars in thousands, except share and per share information)
|
|
|
As of September 30, 2016 |
|
|
As of December 31, 2015 |
|
||
|
Assets |
|
|
|
|
|
|
|
|
|
Investment in mortgages and loans: |
|
|
|
|
|
|
|
|
|
Commercial mortgages, mezzanine loans, and preferred equity interests |
|
$ |
1,373,615 |
|
|
$ |
1,623,583 |
|
|
Allowance for loan losses |
|
|
(18,655 |
) |
|
|
(17,097 |
) |
|
Total investment in mortgages and loans, net (including $1,074,583 and $1,428,961 held by consolidated VIEs, respectively) |
|
|
1,354,960 |
|
|
|
1,606,486 |
|
|
Investments in real estate, net of accumulated depreciation of $156,613 and $158,688, respectively (including $192,765 and $252,376 held by consolidated VIEs, respectively) |
|
|
808,749 |
|
|
|
986,942 |
|
|
Cash and cash equivalents |
|
|
36,019 |
|
|
|
87,581 |
|
|
Restricted cash |
|
|
229,957 |
|
|
|
207,599 |
|
|
Accrued interest receivable |
|
|
41,603 |
|
|
|
47,343 |
|
|
Other assets |
|
|
81,546 |
|
|
|
67,566 |
|
|
Intangible assets, net of accumulated amortization of $19,308 and $13,234, respectively |
|
|
23,165 |
|
|
|
28,864 |
|
|
Assets of discontinued operations (See Note 16) |
|
|
1,306,532 |
|
|
|
1,383,547 |
|
|
Total assets |
|
$ |
3,882,531 |
|
|
$ |
4,415,928 |
|
|
Liabilities and Equity |
|
|
|
|
|
|
|
|
|
Indebtedness, net of unamortized discounts, premiums and deferred financing costs of $36,719 and $53,092, respectively (including $1,326,212 and $1,762,672 held by consolidated VIEs, respectively) |
|
|
1,975,863 |
|
|
$ |
2,399,475 |
|
|
Accrued interest payable |
|
|
10,464 |
|
|
|
8,595 |
|
|
Accounts payable and accrued expenses |
|
|
20,082 |
|
|
|
22,557 |
|
|
Derivative liabilities |
|
|
1,748 |
|
|
|
4,727 |
|
|
Deferred taxes, borrowers’ escrows and other liabilities |
|
|
168,692 |
|
|
|
197,908 |
|
|
Liabilities of discontinued operations (see Note 16) |
|
|
906,225 |
|
|
|
952,530 |
|
|
Total liabilities |
|
|
3,083,074 |
|
|
|
3,585,792 |
|
|
Series D cumulative redeemable preferred shares, $0.01 par value per share, 4,000,000 shares authorized, 4,000,000 and 4,000,000 shares issued and outstanding, respectively |
|
|
90,728 |
|
|
|
85,395 |
|
|
Equity: |
|
|
|
|
|
|
|
|
|
Shareholders’ equity: |
|
|
|
|
|
|
|
|
|
Preferred shares, $0.01 par value per share, 25,000,000 shares authorized; |
|
|
|
|
|
|
|
|
|
7.75% Series A cumulative redeemable preferred shares, liquidation preference $25.00 per share, 8,069,288 shares authorized, 5,344,353 and 5,306,084 shares issued and outstanding, respectively |
|
|
53 |
|
|
|
53 |
|
|
8.375% Series B cumulative redeemable preferred shares, liquidation preference $25.00 per share, 4,300,000 shares authorized, 2,340,969 and 2,340,969 shares issued and outstanding, respectively |
|
|
23 |
|
|
|
23 |
|
|
8.875% Series C cumulative redeemable preferred shares, liquidation preference $25.00 per share, 3,600,000 shares authorized, 1,640,425 and 1,640,425 shares issued and outstanding, respectively |
|
|
17 |
|
|
|
17 |
|
|
Series E cumulative redeemable preferred shares, $0.01 par value per share, 4,000,000 shares authorized |
|
|
— |
|
|
|
— |
|
|
Common shares, $0.03 par value per share, 200,000,000 shares authorized 92,174,644 and 91,586,767 issued and outstanding, respectively, including 960,795 and 742,764 unvested restricted common share awards, respectively |
|
|
2,766 |
|
|
|
2,748 |
|
|
Additional paid in capital |
|
|
2,090,210 |
|
|
|
2,087,137 |
|
|
Accumulated other comprehensive income (loss) |
|
|
(112 |
) |
|
|
(4,699 |
) |
|
Retained earnings (deficit) |
|
|
(1,731,141 |
) |
|
|
(1,680,751 |
) |
|
Total shareholders’ equity |
|
|
361,816 |
|
|
|
404,528 |
|
|
Noncontrolling interests - continuing operations |
|
|
5,386 |
|
|
|
3,948 |
|
|
Noncontrolling interests - discontinued operations |
|
|
341,527 |
|
|
|
336,265 |
|
|
Total noncontrolling interests |
|
|
346,913 |
|
|
|
340,213 |
|
|
Total equity |
|
|
708,729 |
|
|
|
744,741 |
|
|
Total liabilities and equity |
|
$ |
3,882,531 |
|
|
$ |
4,415,928 |
|
The accompanying notes are an integral part of these consolidated financial statements.
1
Consolidated Statements of Operations
(Unaudited and dollars in thousands, except share and per share information)
|
|
|
For the Three Months Ended September 30, |
|
|
For the Nine Months Ended September 30, |
|
||||||||||
|
|
|
2016 |
|
|
2015 |
|
|
2016 |
|
|
2015 |
|
||||
|
Revenue: |
|
|
|
|
|
|
|
|
|
|
|
|
|
|
|
|
|
Investment interest income |
|
$ |
20,189 |
|
|
$ |
24,468 |
|
|
$ |
69,510 |
|
|
$ |
71,823 |
|
|
Investment interest expense |
|
|
(8,512 |
) |
|
|
(8,021 |
) |
|
|
(26,957 |
) |
|
|
(22,517 |
) |
|
Net interest margin |
|
|
11,677 |
|
|
|
16,447 |
|
|
|
42,553 |
|
|
|
49,306 |
|
|
Property income |
|
|
29,614 |
|
|
|
29,968 |
|
|
|
89,335 |
|
|
|
94,401 |
|
|
Fee and other income |
|
|
1,946 |
|
|
|
2,537 |
|
|
|
5,974 |
|
|
|
14,760 |
|
|
Total revenue |
|
|
43,237 |
|
|
|
48,952 |
|
|
|
137,862 |
|
|
|
158,467 |
|
|
Expenses: |
|
|
|
|
|
|
|
|
|
|
|
|
|
|
|
|
|
Interest expense |
|
|
13,298 |
|
|
|
14,723 |
|
|
|
43,135 |
|
|
|
46,259 |
|
|
Real estate operating expense |
|
|
14,635 |
|
|
|
14,991 |
|
|
|
43,810 |
|
|
|
47,804 |
|
|
Compensation expense |
|
|
6,245 |
|
|
|
5,541 |
|
|
|
17,367 |
|
|
|
15,648 |
|
|
General and administrative expense |
|
|
3,708 |
|
|
|
3,769 |
|
|
|
12,007 |
|
|
|
12,762 |
|
|
Acquisition expense |
|
|
197 |
|
|
|
153 |
|
|
|
376 |
|
|
|
1,392 |
|
|
Provision for loan losses |
|
|
1,533 |
|
|
|
1,850 |
|
|
|
4,202 |
|
|
|
5,850 |
|
|
Depreciation and amortization expense |
|
|
11,466 |
|
|
|
10,482 |
|
|
|
39,273 |
|
|
|
34,622 |
|
|
Total expenses |
|
|
51,082 |
|
|
|
51,509 |
|
|
|
160,170 |
|
|
|
164,337 |
|
|
Operating (Loss) Income |
|
|
(7,845 |
) |
|
|
(2,557 |
) |
|
|
(22,308 |
) |
|
|
(5,870 |
) |
|
Interest and other income (expense), net |
|
|
(70 |
) |
|
|
(398 |
) |
|
|
30 |
|
|
|
(1,035 |
) |
|
Gains (losses) on assets |
|
|
18,194 |
|
|
|
7,430 |
|
|
|
23,811 |
|
|
|
24,711 |
|
|
Gains (losses) on extinguishments of debt |
|
|
(6 |
) |
|
|
- |
|
|
|
998 |
|
|
|
- |
|
|
Asset impairment |
|
|
(18,872 |
) |
|
|
(7,250 |
) |
|
|
(26,658 |
) |
|
|
(7,250 |
) |
|
Change in fair value of financial instruments |
|
|
(1,375 |
) |
|
|
620 |
|
|
|
(7,055 |
) |
|
|
13,466 |
|
|
Income (loss) before taxes |
|
|
(9,974 |
) |
|
|
(2,155 |
) |
|
|
(31,182 |
) |
|
|
24,022 |
|
|
Income tax benefit (provision) |
|
|
15,302 |
|
|
|
(23 |
) |
|
|
18,051 |
|
|
|
(1,320 |
) |
|
Income from continuing operations |
|
|
5,328 |
|
|
|
(2,178 |
) |
|
|
(13,131 |
) |
|
|
22,702 |
|
|
Discontinued operations: |
|
|
|
|
|
|
|
|
|
|
|
|
|
|
|
|
|
Income (loss) from discontinued operations |
|
|
4,112 |
|
|
|
27,004 |
|
|
|
38,473 |
|
|
|
28,831 |
|
|
Net income (loss) |
|
|
9,440 |
|
|
|
24,826 |
|
|
|
25,342 |
|
|
|
51,533 |
|
|
(Income) loss allocated to preferred shares |
|
|
(8,715 |
) |
|
|
(8,303 |
) |
|
|
(25,850 |
) |
|
|
(24,383 |
) |
|
(Income) loss allocated to noncontrolling interests |
|
|
(729 |
) |
|
|
(23,055 |
) |
|
|
(24,920 |
) |
|
|
(21,823 |
) |
|
Net income (loss) allocable to common shares |
|
$ |
(4 |
) |
|
$ |
(6,532 |
) |
|
$ |
(25,428 |
) |
|
$ |
5,327 |
|
|
Amount attributable to common shares |
|
|
|
|
|
|
|
|
|
|
|
|
|
|
|
|
|
Net income (loss) available to common shares from continuing operations |
|
$ |
(2,048 |
) |
|
$ |
(10,009 |
) |
|
$ |
(35,526 |
) |
|
$ |
24 |
|
|
Net income (loss) available to common shares from discontinued operations |
|
|
2,044 |
|
|
|
3,477 |
|
|
|
10,098 |
|
|
|
5,303 |
|
|
Net income (loss) |
|
$ |
(4 |
) |
|
$ |
(6,532 |
) |
|
$ |
(25,428 |
) |
|
$ |
5,327 |
|
|
Earnings (loss) per share-Basic: |
|
|
|
|
|
|
|
|
|
|
|
|
|
|
|
|
|
Earnings (loss) per share from continuing operations |
|
$ |
(0.02 |
) |
|
$ |
(0.11 |
) |
|
$ |
(0.39 |
) |
|
$ |
- |
|
|
Earnings (loss) per share from discontinued operations |
|
$ |
0.02 |
|
|
$ |
0.04 |
|
|
$ |
0.11 |
|
|
$ |
0.06 |
|
|
Earnings (loss) per share-Basic |
|
$ |
— |
|
|
$ |
(0.07 |
) |
|
$ |
(0.28 |
) |
|
$ |
0.06 |
|
|
Weighted-average shares outstanding-Basic |
|
|
91,201,784 |
|
|
|
87,110,958 |
|
|
|
91,137,041 |
|
|
|
83,799,244 |
|
|
Earnings (loss) per share-Diluted: |
|
|
|
|
|
|
|
|
|
|
|
|
|
|
|
|
|
Earnings (loss) per share from continuing operations |
|
$ |
(0.02 |
) |
|
$ |
(0.11 |
) |
|
$ |
(0.39 |
) |
|
$ |
- |
|
|
Earnings (loss) per share from discontinued operations |
|
$ |
0.02 |
|
|
$ |
0.04 |
|
|
$ |
0.11 |
|
|
$ |
0.06 |
|
|
Earnings (loss) per share-Diluted |
|
$ |
— |
|
|
$ |
(0.07 |
) |
|
$ |
(0.28 |
) |
|
$ |
0.06 |
|
|
Weighted average shares outstanding-Diluted |
|
|
91,201,784 |
|
|
|
87,110,958 |
|
|
|
91,137,041 |
|
|
|
85,645,609 |
|
The accompanying notes are an integral part of these consolidated financial statements.
2
Consolidated Statements of Comprehensive Income (Loss)
(Unaudited and dollars in thousands)
|
|
|
For the Three Months Ended September 30, |
|
|
For the Nine Months Ended September 30, |
|
||||||||||
|
|
|
2016 |
|
|
2015 |
|
|
2016 |
|
|
2015 |
|
||||
|
Net income (loss) |
|
$ |
9,440 |
|
|
$ |
24,826 |
|
|
$ |
25,342 |
|
|
$ |
51,533 |
|
|
Other comprehensive income (loss): |
|
|
|
|
|
|
|
|
|
|
|
|
|
|
|
|
|
Change in fair value of interest rate hedges |
|
|
3 |
|
|
|
(248 |
) |
|
|
(133 |
) |
|
|
(430 |
) |
|
Realized (gains) losses on interest rate hedges reclassified to earnings |
|
|
785 |
|
|
|
3,831 |
|
|
|
4,824 |
|
|
|
13,196 |
|
|
Total other comprehensive income from continuing operations |
|
|
788 |
|
|
|
3,583 |
|
|
|
4,691 |
|
|
|
12,766 |
|
|
Discontinued operations: |
|
|
|
|
|
|
|
|
|
|
|
|
|
|
|
|
|
Other comprehensive income (loss) from discontinued operations |
|
|
468 |
|
|
|
— |
|
|
|
(719 |
) |
|
|
— |
|
|
Total other comprehensive income |
|
|
1,256 |
|
|
|
3,583 |
|
|
|
3,972 |
|
|
|
12,766 |
|
|
Comprehensive income (loss) before allocation to noncontrolling interests |
|
|
10,696 |
|
|
|
28,409 |
|
|
|
29,314 |
|
|
|
64,299 |
|
|
Allocation to noncontrolling interests - net (income) loss |
|
|
(729 |
) |
|
|
(23,055 |
) |
|
|
(24,920 |
) |
|
|
(21,823 |
) |
|
Allocation to noncontrolling interests - other comprehensive (income) loss |
|
|
(396 |
) |
|
— |
|
|
|
615 |
|
|
— |
|
||
|
Comprehensive income (loss) |
|
$ |
9,571 |
|
|
$ |
5,354 |
|
|
$ |
5,009 |
|
|
$ |
42,476 |
|
The accompanying notes are an integral part of these consolidated financial statements.
3
Consolidated Statement of Changes in Equity
(Unaudited and dollars in thousands, except share information)
|
|
|
Preferred Shares— Series A |
|
|
Par Value Preferred Shares— Series A |
|
|
Preferred Shares— Series B |
|
|
Par Value Preferred Shares— Series B |
|
|
Preferred Shares— Series C |
|
|
Par Value Preferred Shares— Series C |
|
|
Common Shares |
|
|
Par Value Common Shares |
|
|
Additional Paid In Capital |
|
|
Accumulated Other Comprehensive Income (Loss) |
|
|
Retained Earnings (Deficit) |
|
|
Total Shareholders’ Equity |
|
|
Noncontrolling Interests |
|
|
Total Equity |
|
||||||||||||||
|
Balance, December 31, 2015 |
|
|
5,306,084 |
|
|
$ |
53 |
|
|
|
2,340,969 |
|
|
$ |
23 |
|
|
|
1,640,425 |
|
|
$ |
17 |
|
|
|
91,586,767 |
|
|
$ |
2,748 |
|
|
$ |
2,087,137 |
|
|
$ |
(4,699 |
) |
|
$ |
(1,680,751 |
) |
|
$ |
404,528 |
|
|
$ |
340,213 |
|
|
$ |
744,741 |
|
|
Net income (loss) |
|
— |
|
|
— |
|
|
— |
|
|
— |
|
|
— |
|
|
— |
|
|
— |
|
|
— |
|
|
— |
|
|
— |
|
|
|
422 |
|
|
|
422 |
|
|
|
24,920 |
|
|
|
25,342 |
|
||||||||||
|
Preferred shares issued, net |
|
|
38,269 |
|
|
— |
|
|
— |
|
|
— |
|
|
— |
|
|
— |
|
|
— |
|
|
— |
|
|
|
610 |
|
|
— |
|
|
— |
|
|
|
610 |
|
|
— |
|
|
|
610 |
|
||||||||||
|
Preferred dividends |
|
— |
|
|
— |
|
|
— |
|
|
— |
|
|
— |
|
|
— |
|
|
— |
|
|
— |
|
|
— |
|
|
— |
|
|
|
(20,517 |
) |
|
|
(20,517 |
) |
|
— |
|
|
|
(20,517 |
) |
|||||||||||
|
Preferred Series D discount amortization |
|
— |
|
|
— |
|
|
— |
|
|
— |
|
|
— |
|
|
— |
|
|
— |
|
|
— |
|
|
— |
|
|
— |
|
|
|
(5,333 |
) |
|
|
(5,333 |
) |
|
— |
|
|
|
(5,333 |
) |
|||||||||||
|
Common dividends declared |
|
— |
|
|
— |
|
|
— |
|
|
— |
|
|
— |
|
|
— |
|
|
— |
|
|
— |
|
|
— |
|
|
— |
|
|
|
(24,962 |
) |
|
|
(24,962 |
) |
|
— |
|
|
|
(24,962 |
) |
|||||||||||
|
Other comprehensive income (loss), net |
|
— |
|
|
— |
|
|
— |
|
|
— |
|
|
— |
|
|
— |
|
|
— |
|
|
— |
|
|
— |
|
|
|
4,587 |
|
|
— |
|
|
|
4,587 |
|
|
|
(615 |
) |
|
|
3,972 |
|
||||||||||
|
Share-based compensation |
|
— |
|
|
— |
|
|
— |
|
|
— |
|
|
— |
|
|
— |
|
|
|
877,814 |
|
|
|
26 |
|
|
|
2,841 |
|
|
— |
|
|
— |
|
|
|
2,867 |
|
|
— |
|
|
|
2,867 |
|
|||||||||
|
Issuance of noncontrolling interests |
|
— |
|
|
— |
|
|
— |
|
|
— |
|
|
— |
|
|
— |
|
|
— |
|
|
— |
|
|
— |
|
|
— |
|
|
— |
|
|
— |
|
|
|
689 |
|
|
|
689 |
|
||||||||||||
|
Distribution to noncontrolling interests |
|
— |
|
|
— |
|
|
— |
|
|
— |
|
|
— |
|
|
— |
|
|
— |
|
|
— |
|
|
|
— |
|
|
— |
|
|
— |
|
|
|
— |
|
|
|
(23,248 |
) |
|
|
(23,248 |
) |
||||||||||
|
Derecognition of noncontrolling interests |
|
— |
|
|
— |
|
|
— |
|
|
— |
|
|
— |
|
|
— |
|
|
— |
|
|
— |
|
|
|
— |
|
|
— |
|
|
— |
|
|
|
— |
|
|
|
4,954 |
|
|
|
4,954 |
|
||||||||||
|
Common shares activity related to equity compensation |
|
— |
|
|
— |
|
|
— |
|
|
— |
|
|
— |
|
|
— |
|
|
|
(296,745 |
) |
|
|
(8 |
) |
|
|
(378 |
) |
|
— |
|
|
— |
|
|
|
(386 |
) |
|
— |
|
|
|
(386 |
) |
|||||||||
|
Common shares issued, net |
|
— |
|
|
— |
|
|
— |
|
|
— |
|
|
— |
|
|
— |
|
|
|
6,808 |
|
|
|
— |
|
|
|
— |
|
|
— |
|
|
— |
|
|
|
— |
|
|
— |
|
|
|
— |
|
|||||||||
|
Balance, September 30, 2016 |
|
|
5,344,353 |
|
|
$ |
53 |
|
|
|
2,340,969 |
|
|
$ |
23 |
|
|
|
1,640,425 |
|
|
$ |
17 |
|
|
|
92,174,644 |
|
|
$ |
2,766 |
|
|
$ |
2,090,210 |
|
|
$ |
(112 |
) |
|
$ |
(1,731,141 |
) |
|
$ |
361,816 |
|
|
$ |
346,913 |
|
|
$ |
708,729 |
|
The accompanying notes are an integral part of these consolidated financial statements.
4
Consolidated Statements of Cash Flows
(Unaudited and dollars in thousands)
|
|
|
For the Nine Months Ended September 30, |
|
|||||
|
|
|
2016 |
|
|
2015 |
|
||
|
Operating activities: |
|
|
|
|
|
|
|
|
|
Net income (loss) |
|
$ |
25,342 |
|
|
$ |
51,533 |
|
|
Adjustments to reconcile net income (loss) to cash flow from operating activities: |
|
|
|
|
|
|
|
|
|
Provision for loan losses |
|
|
4,202 |
|
|
|
5,850 |
|
|
Share-based compensation expense |
|
|
3,673 |
|
|
|
3,553 |
|
|
Depreciation and amortization |
|
|
66,332 |
|
|
|
51,190 |
|
|
Amortization of deferred financing costs and debt discounts |
|
|
16,202 |
|
|
|
13,103 |
|
|
Deferral of loan origination costs, net |
|
|
(1,537 |
) |
|
|
(2,716 |
) |
|
Amortization of above/below market leases |
|
|
(1,336 |
) |
|
|
(44 |
) |
|
(Gains) losses on assets |
|
|
(56,074 |
) |
|
|
(24,711 |
) |
|
(Gains) losses on extinguishment of debt |
|
|
(440 |
) |
|
|
— |
|
|
TSRE financing extinguishment expenses |
|
|
— |
|
|
|
23,219 |
|
|
(Gains) on IRT merger with TSRE |
|
|
(732 |
) |
|
|
(64,012 |
) |
|
Asset impairment |
|
|
26,658 |
|
|
|
7,250 |
|
|
Change in fair value of financial instruments |
|
|
7,055 |
|
|
|
(13,466 |
) |
|
Provision (benefit) for deferred taxes |
|
|
(18,090 |
) |
|
|
851 |
|
|
Changes in assets and liabilities: |
|
|
|
|
|
|
|
|
|
Decrease (increase) in accrued interest receivable |
|
|
5,702 |
|
|
|
(2,305 |
) |
|
Decrease (increase) in other assets |
|
|
(4,567 |
) |
|
|
482 |
|
|
Increase in accrued interest payable |
|
|
3,300 |
|
|
|
3,409 |
|
|
(Decrease) increase in accounts payable and accrued expenses |
|
|
516 |
|
|
|
(19,453 |
) |
|
Increase in other liabilities |
|
|
1,415 |
|
|
|
3,660 |
|
|
Origination of conduit loans |
|
|
(13,800 |
) |
|
|
(317,154 |
) |
|
Sales of conduit loans |
|
|
35,177 |
|
|
|
339,542 |
|
|
Net conduit loans (originated) sold |
|
|
21,377 |
|
|
|
22,388 |
|
|
Cash flows provided by (used in) operating activities |
|
|
98,998 |
|
|
|
59,781 |
|
|
Investing activities: |
|
|
|
|
|
|
|
|
|
Proceeds from sales or repayments of other securities |
|
|
— |
|
|
|
31,241 |
|
|
Origination of loans for investment |
|
|
(82,416 |
) |
|
|
(362,574 |
) |
|
Principal repayments on loans |
|
|
308,254 |
|
|
|
169,611 |
|
|
Investments in real estate |
|
|
(23,613 |
) |
|
|
(44,079 |
) |
|
IRT's acquisition of TSRE, net of cash acquired |
|
|
— |
|
|
|
(137,094 |
) |
|
Proceeds from the disposition of real estate |
|
|
212,580 |
|
|
|
40,089 |
|
|
(Increase) decrease in restricted cash |
|
|
(56,882 |
) |
|
|
6,454 |
|
|
Cash flows provided by (used in) investing activities |
|
|
357,923 |
|
|
|
(296,352 |
) |
|
Financing activities: |
|
|
|
|
|
|
|
|
|
Repayments on secured credit facilities and loans payable on real estate |
|
|
(243,854 |
) |
|
|
(273,872 |
) |
|
Proceeds from secured credit facilities, term loans and loans payable on real estate |
|
|
199,480 |
|
|
|
488,725 |
|
|
Repayments and repurchase of CDO notes payable and floating rate transactions |
|
|
(465,622 |
) |
|
|
(222,955 |
) |
|
Proceeds from issuance of senior notes from floating rate CMBS transactions |
|
|
22,559 |
|
|
|
181,215 |
|
|
Repurchase of convertible notes and senior notes |
|
|
(47,614 |
) |
|
|
— |
|
|
Repayments of senior secured notes |
|
|
(6,000 |
) |
|
|
(6,000 |
) |
|
Net proceeds (repayments) related to conduit loan repurchase agreements |
|
|
(30,153 |
) |
|
|
(27,242 |
) |
|
Net proceeds (repayments) related to floating rate loan repurchase agreements |
|
|
102,635 |
|
|
|
126,389 |
|
|
Proceeds from issuance of joint venture interests accounted for as indebtedness |
|
|
24,796 |
|
|
|
— |
|
|
Distribution to noncontrolling interests |
|
|
(23,246 |
) |
|
|
(15,577 |
) |
|
Issuance of noncontrolling interests |
|
|
689 |
|
|
|
— |
|
|
TSRE financing extinguishment expenses |
|
|
— |
|
|
|
(23,219 |
) |
|
Payments for deferred costs and convertible senior note hedges |
|
|
(2,903 |
) |
|
|
(10,935 |
) |
|
Preferred share issuance, net of costs incurred |
|
|
610 |
|
|
|
13,061 |
|
|
Common share issuance, net of costs incurred |
|
|
(1,192 |
) |
|
|
41,657 |
|
|
Distributions paid to preferred shareholders |
|
|
(22,643 |
) |
|
|
(19,445 |
) |
|
Distributions paid to common shareholders |
|
|
(24,930 |
) |
|
|
(44,305 |
) |
|
Cash flows (used in) provided by financing activities |
|
|
(517,388 |
) |
|
|
207,497 |
|
|
Net change in cash and cash equivalents |
|
|
(60,467 |
) |
|
|
(29,074 |
) |
|
'Net change in cash and cash equivalents from discontinued operations |
|
|
(8,905 |
) |
|
|
2,181 |
|
|
'Net change in cash and cash equivalents from continuing operations |
|
|
(51,562 |
) |
|
|
(31,255 |
) |
|
Cash and cash equivalents at the beginning of the period |
|
|
87,581 |
|
|
|
106,963 |
|
|
Cash and cash equivalents at the end of the period |
|
$ |
36,019 |
|
|
$ |
75,708 |
|
5
The accompanying notes are an integral part of these consolidated financial statements.
6
Notes to Consolidated Financial Statements
As of September 30, 2016
(Unaudited and dollars in thousands, except share and per share amounts)
NOTE 1: THE COMPANY
RAIT Financial Trust is a multi-strategy commercial real estate company that is a self-managed and self-advised Maryland real estate investment trust, or REIT. References to “RAIT”, “we”, “us”, and “our” refer to RAIT Financial Trust and its subsidiaries, unless the context otherwise requires. We invest in and manage a portfolio of real estate-related assets, including direct ownership of real estate properties, and provide a comprehensive set of debt financing options to the real estate industry. We have used our vertically integrated platform to originate commercial real estate loans, acquire commercial real estate properties and invest in, manage and service commercial real estate assets.
We finance a substantial portion of our investments through borrowing and securitization strategies seeking to match the maturities and terms of our financings with the maturities and terms of those investments, and to mitigate interest rate risk through derivative instruments.
On September 27, 2016, we entered into a securities and asset purchase agreement, or the IRT internalization agreement, with one of our consolidated variable interest entities, Independence Realty Trust, Inc. or IRT, pursuant to which IRT will complete a management internalization, or the IRT management internalization, and separation from us. The IRT management internalization consists of two parts: (i) the acquisition of Independence Realty Advisors, LLC, or the IRT advisor, which is our subsidiary and IRT’s external advisor, and (ii) the acquisition of certain assets and the assumption of certain liabilities relating to our multifamily property management business which we refer to as RAIT Residential, including property management contracts relating to apartment properties owned by ourselves, IRT, and third parties. The purchase price to be paid by IRT for the IRT management internalization is $43.0 million, subject to certain pro rations at closing. The internalization agreement provides that the closing of the management internalization will occur no earlier than December 20, 2016. As part of the same agreement, we also agreed to sell up to all of the 7,269,719 shares of IRT’s common stock owned by certain of our subsidiaries, subject to market conditions. See Note 16: Discontinued Operations and Note 17: Subsequent Events for further information.
NOTE 2: SUMMARY OF SIGNIFICANT ACCOUNTING POLICIES
a. Basis of Presentation
The accompanying unaudited interim consolidated financial statements have been prepared by management in accordance with U.S. generally accepted accounting principles, or GAAP. Certain information and footnote disclosures normally included in annual consolidated financial statements prepared in accordance with GAAP have been condensed or omitted pursuant to such rules and regulations, although we believe that the included disclosures are adequate to make the information presented not misleading. The unaudited interim consolidated financial statements should be read in conjunction with our audited financial statements as of and for the year ended December 31, 2015 included in our Annual Report on Form 10-K. In the opinion of management, all adjustments, consisting only of normal recurring adjustments, necessary to present fairly our consolidated financial position and consolidated results of operations and cash flows are included. The results of operations for the interim periods presented are not necessarily indicative of the results for the full year.
The Consolidated Statement of Operations for the nine-month period ended September 30, 2016 includes the impact of correcting the reporting of certain activity that occurred in the three-month period ended March 31, 2016. Specifically, the correction adjusts a clerical error made in the determination of the amount of investment interest expense by increasing investment interest expense and decreasing interest expense by $1,424 for the three-month period ended March 31, 2016. This correction had no impact to any other periods. We will also correct this error in our Consolidated Statement of Operations for the three months ended March 31, 2016 when it is presented in our filing on Form 10-Q for the quarter ended March 31, 2017.
We evaluated this correction and determined, based on quantitative and qualitative factors, that the change was not material to the consolidated financial statements taken as a whole for any previously filed consolidated financial statements.
As of September 30, 2016, certain entities or distinguishable components of RAIT have been presented as discontinued operations. See Note 16: Discontinued Operations for further information.
6
RAIT Financial Trust
Notes to Consolidated Financial Statements
As of September 30, 2016
(Unaudited and dollars in thousands, except share and per share amounts)
b. Principles of Consolidation
The consolidated financial statements reflect our accounts and the accounts of our majority-owned and/or controlled subsidiaries. We also consolidate entities that are variable interest entities, or VIEs, where we have determined that we are the primary beneficiary of such entities. The portions of these entities that we do not own are presented as noncontrolling interests as of the dates and for the periods presented in the consolidated financial statements. All intercompany accounts and transactions have been eliminated in consolidation.
Under Financial Accounting Standards Board (FASB) Accounting Standards Codification (ASC) Topic 810, “Consolidation”, the determination of whether to consolidate a VIE is based on the power to direct the activities of the VIE that most significantly impact the VIE’s economic performance together with either the obligation to absorb losses or the right to receive benefits that could be significant to the VIE. We define the power to direct the activities that most significantly impact the VIE’s economic performance as the ability to buy, sell, refinance, or recapitalize assets or entities, and solely control other material operating events or items of the entity. For our commercial mortgages, mezzanine loans, and preferred equity investments, certain rights we hold are protective in nature and would preclude us from having the power to direct the activities that most significantly impact the VIE’s economic performance. Assuming both criteria are met, we would be considered the primary beneficiary and would consolidate the VIE. We will continually assess our involvement with VIEs and consolidate the VIEs when we are the primary beneficiary. During the second quarter of 2016, we began presenting our floating rate securitizations as VIEs and corrected the prior period disclosure. In addition, we began presenting assets and liabilities of consolidated VIEs in a parenthetical disclosure on the consolidated balance sheets. As of September 30, 2016, we corrected the parenthetical disclosure on the consolidated balance sheet as of December 31, 2015, as certain indebtedness that eliminated in consolidation was excluded from this disclosure. After adjusting for liabilities related to discontinued operations, this decreased the amount of liabilities held by variable interest entities by $481,865. See Note 8: Variable Interest Entities for additional disclosures pertaining to VIEs and Note 16: Discontinued Operations for additional disclosures pertaining to discontinued operations.
For entities that we do not consolidate, we account for our investment in them either under the equity method pursuant to ASC Topic 323, “Investments-Equity Method and Joint Ventures” or cost method pursuant to ASC Topic 325, “Investments – Other”. During the nine months ended September 30, 2016, we wrote off $864 of our retail property management subsidiary’s investment in an entity because it no longer held the investment. The charge was reported in asset impairment in the consolidated statements of operations.
c. Use of Estimates
The preparation of financial statements in conformity with GAAP requires management to make estimates and assumptions that affect the reported amounts of assets and liabilities, the disclosure of contingent assets and liabilities at the date of the financial statements and the reported amounts of revenue and expenses during the reporting periods. The items that include significant estimates are fair value of financial instruments and allowance for loan losses. Actual results could differ from those estimates.
7
RAIT Financial Trust
Notes to Consolidated Financial Statements
As of September 30, 2016
(Unaudited and dollars in thousands, except share and per share amounts)
Cash and cash equivalents include cash held in banks and highly liquid investments with maturities of three months or less when purchased. Cash, including amounts restricted, may at times exceed the Federal Deposit Insurance Corporation deposit insurance limit of $250 per institution. We mitigate credit risk by placing cash and cash equivalents with major financial institutions. To date, we have not experienced any losses on cash and cash equivalents.
e. Restricted Cash
Restricted cash consists primarily of tenant escrows and borrowers’ funds held by us to fund certain expenditures or to be released at our discretion upon the occurrence of certain pre-specified events, and to serve as additional collateral for borrowers’ loans. As of September 30, 2016 and December 31, 2015, we had $126,896 and $160,453, respectively, of tenant escrows and borrowers’ funds.
Restricted cash also includes proceeds from the issuance of securitization notes that are restricted for the purpose of funding additional investments in securities subsequent to the balance sheet date. As of September 30, 2016 and December 31, 2015, we had $103,061 and $47,146, respectively, of restricted cash held by securitizations.
f. Investments in Commercial Mortgage Loans, Mezzanine Loans and Preferred Equity Interests
We invest in commercial mortgage loans, mezzanine loans and preferred equity interests. We account for our investments in commercial mortgage loans, mezzanine loans and preferred equity interests at amortized cost. The carrying value of these investments is adjusted for origination discounts/premiums, nonrefundable fees and direct costs for originating loans which are amortized into income on a level yield basis over the terms of the loans.
g. Allowance for Loan Losses, Impaired Loans and Non-accrual Status
We maintain an allowance for loan losses on our investments in commercial mortgage loans, mezzanine loans and preferred equity interests. Management’s periodic evaluation of the adequacy of the allowance is based upon expected and inherent risks in the portfolio, the estimated value of underlying collateral, and current economic conditions. The credit quality of our loans is monitored via quantitative and qualitative metrics. Quantitatively we evaluate items such as the current debt service coverage ratio and annual net operating income of the underlying property. Qualitatively we evaluate items such as recent operating performance of the underlying property and history of the borrower’s ability to provide financial support. These items together are considered in developing our view of each loan’s risk rating which are categorized as either watchlist/impaired or satisfactory. Management reviews loans for impairment and establishes specific reserves when a loss is probable under the provisions of FASB ASC Topic 310, “Receivables.” A loan is impaired when it is probable that we may not collect all principal and interest payments according to the contractual terms. As part of the detailed loan review, we consider many factors about the specific loan, including payment history, asset performance, borrower’s financial capability and other characteristics. Management evaluates loans for non-accrual status each reporting period. A loan is placed on non-accrual status when the loan payment deficiencies exceed 90 days unless it is well secured and in the process of collection, or if the collection of principal and interest in full is not probable. Payments received for non-accrual loans are applied to accrued interest receivable. Past due interest is recognized on non-accrual loans when they are removed from non-accrual status and are making current interest payments. The allowance for loan losses is increased by the provision for loan losses and decreased by charge-offs (net of recoveries). We charge off a loan when we determine that all commercially reasonable means of recovering the loan balance have been exhausted. This may occur at a variety of times, including when we receive cash or other assets in a pre-foreclosure sale or take control of the underlying collateral in full satisfaction of the loan upon foreclosure. We consider circumstances such as these to indicate that the loan collection process has ceased and that a loan is uncollectible.
h. Investments in Real Estate
Investments in real estate are shown net of accumulated depreciation. We capitalize those costs that have been determined to improve the real property and depreciate those costs on a straight-line basis over the useful life of the asset. We depreciate real property using the following useful lives: buildings and improvements—30 to 40 years; furniture, fixtures, and equipment—5 to 10 years; and tenant improvements—shorter of the lease term or the life of the asset. Costs for ordinary maintenance and repairs are charged to expense as incurred.
8
RAIT Financial Trust
Notes to Consolidated Financial Statements
As of September 30, 2016
(Unaudited and dollars in thousands, except share and per share amounts)
Acquisitions of real estate assets and any related intangible assets are recorded initially at fair value under FASB ASC Topic 805, “Business Combinations.” Fair value is determined by management based on market conditions and inputs at the time the asset is acquired. The fair value of the real estate acquired is allocated to the acquired tangible assets, consisting of land, building and tenant improvements, and identified intangible assets and liabilities, consisting of the value of above-market and below-market leases for acquired in-place leases and the value of tenant relationships, based in each case on their fair values. Purchase accounting is applied to assets and liabilities associated with the real estate acquired. Transaction costs and fees incurred related to acquisitions are expensed as incurred.
Upon the acquisition of properties, we estimate the fair value of acquired tangible assets (consisting of land, building and improvements) and identified intangible assets and liabilities (consisting of above and below-market leases, in-place leases and tenant relationships), and assumed debt at the date of acquisition, based on the evaluation of information and estimates available at that date. In determining the fair value of the identified intangible assets and liabilities of an acquired property, above-market and below-market in-place lease values are recorded based on the present value (using an interest rate which reflects the risks associated with the leases acquired) of the differences between (i) the contractual amounts to be paid pursuant to the in-place leases and (ii) management’s estimate of fair market lease rates for the corresponding in-place leases, measured over a period equal to the remaining term of the lease. The capitalized above-market lease values and the capitalized below-market lease values are amortized as an adjustment to property income over the lease term.
The aggregate value of in-place leases is determined by evaluating various factors, including an estimate of carrying costs during the expected lease-up periods, current market conditions and similar leases. In estimating carrying costs, management includes real estate taxes, insurance and other operating expenses, and estimates of lost rental revenue during the expected lease-up periods based on current market demand. Management also estimates costs to execute similar leases including leasing commissions, legal and other related costs. The value assigned to this intangible asset is amortized over the assumed lease up period.
Management reviews our investments in real estate for impairment whenever events or changes in circumstances indicate that the carrying amount of an asset may not be recoverable. The review of recoverability is based on an estimate of the future undiscounted cash flows (excluding interest charges) expected to result from the long-lived asset’s use and eventual disposition. These cash flows consider factors such as expected future operating income, trends and prospects, as well as the effects of leasing demand, competition and other factors. If impairment exists due to the inability to recover the carrying value of a long-lived asset, an impairment loss is recorded to the extent that the carrying value exceeds the estimated fair value of the property.
i. Revenue Recognition
|
|
1) |
Interest income—We recognize interest income from investments in commercial mortgage loans, mezzanine loans, and preferred equity interests on a yield to maturity basis. Certain of our commercial mortgage loans, mezzanine loans and preferred equity interests provide for the accrual of interest at specified rates which differ from current payment terms. Interest income is recognized on such loans at the accrual rate subject to management’s determination that accrued interest and outstanding principal are ultimately collectible. Management will cease accruing interest on these loans when it determines that the interest income may not be collectible based on the ultimate value of the underlying collateral using discounted cash flow models and market based assumptions. The accrued interest receivable associated with these loans as of September 30, 2016 and December 31, 2015 was $28,782 and $34,132, respectively. These loans are considered to be impaired when the total amount owed exceeds the estimated value of the underlying collateral. None of these loans were considered to be impaired as of September 30, 2016 and December 31, 2015. |
Origination fees and direct loan origination costs on our investments in commercial mortgages, mezzanine loans and preferred equity interests are deferred and amortized to investment interest income, using the effective interest method, over the contractual life of the underlying loan security or loan, in accordance with FASB ASC Topic 310, “Receivables.”
9
RAIT Financial Trust
Notes to Consolidated Financial Statements
As of September 30, 2016
(Unaudited and dollars in thousands, except share and per share amounts)
|
|
tenant reimbursement of a portion of common area maintenance and other operating expenses to the extent that a tenant’s pro rata share of expenses exceeds a base year level set in the lease. |
|
|
3) |
Fee and other income—We generate fee and other income through our various subsidiaries by (a) funding conduit loans for sale into unaffiliated commercial mortgage-backed securities, or CMBS, securitizations, (b) providing or arranging to provide financing to our borrowers, (c) providing ongoing asset management services to investment portfolios under cancelable management agreements, and (d) providing property management services to third parties. We recognize revenue for these activities when the fees are fixed or determinable, are evidenced by an arrangement, collection is reasonably assured and the services under the arrangement have been provided. While we may receive asset management fees when they are earned, we eliminate earned asset management fee income from securitizations while such securitizations are consolidated. During the three and nine months ended September 30, 2016, we earned $340 and $1,118, respectively, of asset management fees, which were eliminated as they were associated with consolidated securitizations. During the three and nine months ended September 30, 2015, we earned $427 and $1,485, respectively, of asset management fees, which were eliminated as they were associated with consolidated securitizations. |
Also, during the three and nine months ended September 30, 2016 we earned $1,727 and $5,141 of asset management fees, respectively, and $206 and $350 of incentive fees, respectively, related to our advisory agreement with IRT. During the three and nine months ended September 30, 2015 we earned $1,259 and $3,306 of asset management fees, respectively, and $0 and $425 of incentive fees, respectively, related to our advisory agreement with IRT. During the three and nine months ended September 30, 2016 we also earned $1,219 and $3,710, respectively, of property management and leasing fees related to our property management agreements with IRT’s properties. During the three and nine months ended September 30, 2015 we also earned $861 and $2,381, respectively, of property management and leasing fees related to our property management agreements with IRT’s properties. As we consolidate IRT, these fees are eliminated in consolidation.
j. Fair Value of Financial Instruments
In accordance with FASB ASC Topic 820, “Fair Value Measurements and Disclosures”, fair value is the price that would be received to sell an asset or paid to transfer a liability in an orderly transaction between market participants at the measurement date. Where available, fair value is based on observable market prices or parameters or derived from such prices or parameters. Where observable prices or inputs are not available, valuation models are applied. These valuation techniques involve management estimation and judgment, the degree of which is dependent on the price transparency for the instruments or market and the instruments’ complexity for disclosure purposes. Assets and liabilities recorded at fair value in the consolidated balance sheets are categorized based upon the level of judgment associated with the inputs used to measure their value. Hierarchical levels, as defined in FASB ASC Topic 820, “Fair Value Measurements and Disclosures” and directly related to the amount of subjectivity associated with the inputs to fair valuations of these assets and liabilities, are as follows:
|
|
• |
Level 1: Valuations are based on unadjusted, quoted prices in active markets for identical assets or liabilities at the measurement date. The types of assets carried at Level 1 fair value generally are equity securities listed in active markets. As such, valuations of these investments do not entail a significant degree of judgment. |
|
|
• |
Level 2: Valuations are based on quoted prices for similar instruments in active markets or quoted prices for identical or similar instruments in markets that are not active or for which all significant inputs are observable, either directly or indirectly. |
|
|
• |
Level 3: Inputs are unobservable inputs for the asset or liability, and include situations where there is little, if any, market activity for the asset or liability. In certain cases, the inputs used to measure fair value may fall into different levels of the fair value hierarchy. In such cases, the level in the fair value hierarchy within which the fair value measurement in its entirety falls has been determined based on the lowest level input that is significant to the fair value measurement in its entirety. Our assessment of the significance of a particular input to the fair value measurement in its entirety requires judgment, and considers factors specific to the asset or liability. |
10
RAIT Financial Trust
Notes to Consolidated Financial Statements
As of September 30, 2016
(Unaudited and dollars in thousands, except share and per share amounts)
The availability of observable inputs can vary depending on the financial asset or liability and is affected by a wide variety of factors, including, for example, the type of investment, whether the investment is new, whether the investment is traded on an active exchange or in the secondary market, and the current market condition. To the extent that valuation is based on models or inputs that are less observable or unobservable in the market, the determination of fair value requires more judgment. Accordingly, the degree of judgment exercised by us in determining fair value is greatest for instruments categorized in Level 3.
Fair value is a market-based measure considered from the perspective of a market participant who holds the asset or owes the liability rather than an entity-specific measure. Therefore, even when market assumptions are not readily available, our own assumptions are set to reflect those that management believes market participants would use in pricing the asset or liability at the measurement date. We use prices and inputs that management believes are current as of the measurement
date, including during periods of market dislocation. In periods of market dislocation, the observability of prices and inputs may be reduced for many instruments. This condition could cause an instrument to be transferred from Level 1 to Level 2 or Level 2 to Level 3.
Many financial instruments have bid and ask prices that can be observed in the marketplace. Bid prices reflect the highest price that buyers in the market are willing to pay for an asset. Ask prices represent the lowest price that sellers in the market are willing to accept for an asset. For financial instruments whose inputs are based on bid-ask prices, we do not require that fair value always be a predetermined point in the bid-ask range. Our policy is to allow for mid-market pricing and adjusting to the point within the bid-ask range that results in our best estimate of fair value.
Fair value for certain of our Level 3 financial instruments is derived using internal valuation models. These internal valuation models include discounted cash flow analyses developed by management using current interest rates, estimates of the term of the particular instrument, specific issuer information and other market data for securities without an active market. In accordance with FASB ASC Topic 820, “Fair Value Measurements and Disclosures”, the impact of our own credit spreads is also considered when measuring the fair value of financial assets or liabilities, including derivative contracts. Where appropriate, valuation adjustments are made to account for various factors, including bid-ask spreads, credit quality and market liquidity. These adjustments are applied on a consistent basis and are based on observable inputs where available. Management’s estimate of fair value requires significant management judgment and is subject to a high degree of variability based upon market conditions, the availability of specific issuer information and management’s assumptions.
k. Investments in Securities
During the first quarter of 2015, we sold all our remaining investments in securities with an aggregate fair value of $31,412 and we had no investments in securities as of September 30, 2016 and December 31, 2015.
l. Transfers of Financial Assets
We account for transfers of financial assets under FASB ASC Topic 860, “Transfers and Servicing”, as either sales or financings. Transfers of financial assets that result in sales accounting are those in which (1) the transfer legally isolates the transferred assets from the transferor, (2) the transferee has the right to pledge or exchange the transferred assets and no condition both constrains the transferee’s right to pledge or exchange the assets and provides more than a trivial benefit to the transferor, and (3) the transferor does not maintain effective control over the transferred assets. If the transfer does not meet these criteria, the transfer is accounted for as a financing. Financial assets that are treated as sales are removed from our accounts with any realized gain (loss) reflected in earnings during the period of sale. Financial assets that are treated as financings are maintained on the balance sheet with proceeds received from the legal transfer reflected as securitized borrowings or security-related receivables.
m. Deferred Financing Costs
Costs incurred in connection with debt financing are deferred and classified within indebtedness and charged to interest expense over the terms of the related debt agreements, under the effective interest method.
11
RAIT Financial Trust
Notes to Consolidated Financial Statements
As of September 30, 2016
(Unaudited and dollars in thousands, except share and per share amounts)
Intangible assets on our consolidated balance sheets represent identifiable intangible assets acquired in business acquisitions. We amortize identified intangible assets to expense over their estimated lives using the straight-line method. We evaluate intangible assets for impairment as events and circumstances change, in accordance with FASB ASC Topic 360, “Property, Plant, and Equipment.” The gross carrying amount for our customer relationships was $14,997 and $19,149 as of September 30, 2016 and December 31, 2015, respectively. The gross carrying amount for our customer relationships has decreased as $4,151 of these assets became fully amortized during the nine months ended September 30, 2016, $2,552 of which was due to the acceleration of amortization as a result of the cancellation of two customer relationships. The gross carrying amount for our in-place leases, above market leases, and ground lease was $25,976 and $23,047 as of September 30, 2016 and December 31, 2015, respectively. The gross carrying amount for Urban Retail’s trade name was $1,500 as of September 30, 2016 and December 31, 2015. The accumulated amortization for our intangible assets was $19,308 and $13,234 as of September 30, 2016 and December 31, 2015, respectively. We recorded amortization expense of $2,333 and $1,700 for the three months ended September 30, 2016 and 2015, respectively, and $10,105 and $5,707 for the nine months ended September 30, 2016 and 2015, respectively. Based on the intangible assets identified above, we expect to record amortization expense of intangible assets of $2,045 for the remainder of 2016, $5,327 for 2017, $3,605 for 2018, $3,023 for 2019, $2,528 for 2020 and $6,638 thereafter.
o. Goodwill
Goodwill on our consolidated balance sheet represented the amounts paid in excess of the fair value of the net assets acquired from business acquisitions accounted for under FASB ASC Topic 805, “Business Combinations.” Pursuant to FASB ASC Topic 350, “Intangibles-Goodwill and Other”, goodwill is not amortized to expense but rather is analyzed for impairment. We evaluate goodwill for impairment on an annual basis and as events and circumstances change, in accordance with FASB ASC Topic 350. As of September 30, 2016 and December 31, 2015, we have $8,854 of goodwill that is included in Other Assets in the accompanying consolidated balance sheets.
p. Income Taxes
RAIT, Taberna Realty Finance Trust, or TRFT, and IRT have each elected to be taxed as a REIT and to comply with the related provisions of the Internal Revenue Code of 1986, as amended, or the Internal Revenue Code. Accordingly, we generally will not be subject to U.S. federal income tax to the extent of our dividends to shareholders and as long as certain asset, income and share ownership tests are met. If we were to fail to meet these requirements, we would be subject to U.S. federal income tax, which could have a material adverse impact on our results of operations and amounts available for dividends to our shareholders. Management believes that all of the criteria to maintain RAIT’s, TRFT’s, and IRT’s REIT qualification have been met for the applicable periods, but there can be no assurance that these criteria will continue to be met in subsequent periods.
We maintain various taxable REIT subsidiaries, or TRSs, which may be subject to U.S. federal, state and local income taxes and foreign taxes. Current and deferred taxes are provided on the portion of earnings (losses) recognized by us with respect to our interest in domestic TRSs. Deferred income tax assets and liabilities are computed based on temporary differences between our GAAP consolidated financial statements and the federal and state income tax basis of assets and liabilities as of the consolidated balance sheet date. We evaluate the realizability of our deferred tax assets (e.g., net operating loss and capital loss carryforwards) and recognize a valuation allowance if, based on the available evidence, it is more likely than not that some portion or all of our deferred tax assets will not be realized. When evaluating the realizability of our deferred tax assets, we consider estimates of expected future taxable income, existing and projected book/tax differences, tax planning strategies available, and the general and industry specific economic outlook. This realizability analysis is inherently subjective, as it requires management to forecast our business and general economic environment in future periods. Changes in estimate of deferred tax asset realizability, if any, are included in income tax expense on the consolidated statements of operations.
Our TRS entities generate taxable revenue from advisory fees for services provided to IRT and collateral management fees from consolidated securitizations. In consolidation, these fees are eliminated as IRT and securitizations are included in the consolidated group. Nonetheless, all income taxes are expensed and are paid by the TRSs in the year in which the revenue is received. These income taxes are not eliminated when the related revenue is eliminated in consolidation.
12
RAIT Financial Trust
Notes to Consolidated Financial Statements
As of September 30, 2016
(Unaudited and dollars in thousands, except share and per share amounts)
The TRS entities may be subject to tax laws that are complex and potentially subject to different interpretations by the taxpayer and the relevant governmental taxing authorities. In establishing a provision for income tax expense, we must make judgments and interpretations about the application of these inherently complex tax laws. Actual income taxes paid may vary from estimates depending upon changes in income tax laws, actual results of operations, and the final audit of tax returns by taxing authorities. Tax assessments may arise several years after tax returns have been filed. We review the tax balances of our TRS entities quarterly and, as new information becomes available, the balances are adjusted as appropriate.
During the three and nine months ended September 30, 2016, we recognized a deferred tax benefit of $15,302 related to the release of a valuation allowance on our deferred tax assets due to projected taxable income at our TRS entities emanating from the IRT internalization agreement described in Note 1: The Company. We expect to utilize this deferred tax benefit upon the closing of the IRT management internalization, which is expected to occur in December of 2016 as described in Note 16: Discontinued Operations.
q. Recent Accounting Pronouncements
Adopted within these Financial Statements
In February 2015, the FASB issued an accounting standard classified under FASB ASC Topic 810, “Consolidation”. This accounting standard amends the consolidation analysis required under GAAP and requires management to reevaluate all previous consolidation conclusions. This standard considers limited partnerships to be VIEs, unless the limited partners have either substantive kick-out or participating rights. The presumption that a general partner should consolidate a limited partnership has also been eliminated. The standard amends the effect that fees paid to a decision maker or service provider have on the consolidation analysis, as well as amends how variable interests held by a reporting entity’s related parties affect the consolidation conclusion. This standard also clarifies how to determine whether equity holders as a group have power over an entity. This standard was effective for interim and annual reporting periods beginning on or after December 15, 2015, with early adoption permitted. The adoption of this accounting standard did not have an impact on our previous conclusions with respect to the entities consolidated in our consolidated financial statements.
In April 2015, the FASB issued an accounting standard classified under FASB ASC Topic 835, “Interest”. This accounting standard amends existing guidance to change reporting requirements for debt issuance costs by requiring debt issuance costs to be presented on the balance sheet as a direct deduction from the debt liability. This standard was effective for interim and annual reporting periods beginning on or after December 15, 2015, with an early adoption permitted. Retrospective application to prior periods is required. The adoption of this accounting standard resulted in the reclassification of $31,368 of deferred costs, net of $33,769 of accumulated amortization, as of December 31, 2015 to total indebtedness on our consolidated balance sheet.
In September 2015, the FASB issued an accounting standard classified under FASB ASC Topic 805, “Business Combinations”. This accounting standard amends existing guidance related to measurement period adjustments by requiring the adjustments to be recognized prospectively with disclosure of the impact of the adjustments had they been applied previously. This standard was effective for interim and annual reporting periods beginning after December 15, 2015, with early adoption permitted. As this standard only applies to measurement period adjustments that occur after the effective date, this standard did not have a material impact on our consolidated financial statements.
Not Yet Adopted Within These Financial Statements
In May 2014, the FASB issued an accounting standard classified under FASB ASC Topic 606, “Revenue from Contracts with Customers”. This accounting standard generally replaces existing guidance by requiring an entity to recognize the amount of revenue to which it expects to be entitled for the transfer of promised goods or services to customers. This accounting standard applies to all contracts with customers, except those that are within the scope of other Topics in the FASB ASC. During 2016, the FASB issued three amendments to this accounting standard which provide further clarification to this accounting standard. These standards amending FASB ASC Topic 606 are currently effective for annual reporting periods beginning after December 15, 2017. Management is currently evaluating the impact that these standards may have on our consolidated financial statements.
In January 2016, the FASB issued an accounting standard classified under FASB ASC Topic 825, “Financial Instruments”. This accounting standard addresses certain aspects of recognition, measurement, presentation, and disclosure of financial instruments. Among other things, the amendment (i) eliminates certain disclosure requirements for financial instruments measured at amortized
13
RAIT Financial Trust
Notes to Consolidated Financial Statements
As of September 30, 2016
(Unaudited and dollars in thousands, except share and per share amounts)
cost; (ii) requires the use of the exit price notion when measuring the fair value of financial instruments for disclosure purposes; (iii) requires separate presentation, in other comprehensive income, of the change in fair value of a liability, when the fair value option has been elected, resulting from a change in the instrument-specific credit risk; and (iv) requires separate presentation of financial instruments by measurement category and form. This standard is effective for annual periods beginning after December 15, 2017, including interim periods within those fiscal years. Early adoption is permitted for the separate presentation of changes in fair value due to changes in instrument-specific credit risk. Management is currently evaluating the impact that this standard may have on our consolidated financial statements.
In February 2016, the FASB issued an accounting standard classified under FASB ASC Topic 842, “Leases”. This accounting standard amends lease accounting by requiring the recognition of lease assets and lease liabilities by lessees for those leases classified as operating leases on the balance sheet and disclosing key information about leasing arrangements. This standard is effective for annual periods beginning after December 15, 2018, including interim periods within those fiscal years. Early application of the amendments in this standard is permitted. Management is currently evaluating the impact that this standard may have on our consolidated financial statements.
In March 2016, the FASB issued an accounting standard classified under FASB ASC Topic 815, “Derivatives and Hedging”. This accounting standard clarifies that a change in the counterparty to a derivative instrument that has been designated as the hedging instrument under Topic 815 does not, in and of itself, require dedesignation of that hedging relationship provided that all other hedge accounting criteria continue to be met. This standard is effective for financial statements issued for annual periods beginning after December 15, 2016, and interim periods within those fiscal years. Early adoption is permitted, including adoption in an interim period. Management does not expect this standard to have a significant impact on our consolidated financial statements.
In March 2016, the FASB issued an accounting standard classified under FASB ASC Topic 815, “Derivatives and Hedging”. This accounting standard clarifies the requirements for assessing whether contingent call (put) options that can accelerate the payment of principal on debt instruments are clearly and closely related to their debt hosts. This accounting standard clarifies what steps are required when assessing whether the economic characteristics and risks of call (put) options are clearly and closely related to the economic characteristics and risks of their debt hosts, which is one of the criteria for bifurcating an embedded derivative. Consequently, when a call (put) option is contingently exercisable, an entity does not have to assess whether the event that triggers the ability to exercise a call (put) option is related to interest rates or credit risks. This standard is effective for financial statements issued for annual periods beginning after December 15, 2016, and interim periods within those fiscal years. Early adoption is permitted, including adoption in an interim period. Management does not expect this standard to have a significant impact on our consolidated financial statements.
In March 2016, the FASB issued an accounting standard classified under FASB ASC Topic 718, “Compensation – Stock Compensation”. This accounting standard simplifies several aspects of the accounting for share-based payment award transactions, including: (i) income tax consequences; (ii) classification of awards as either equity or liabilities; and (iii) classification on the statement of cash flows. This standard is effective for annual periods beginning after December 15, 2016, and interim period within those annual periods. Early adoption is permitted for any entity in any interim or annual period. Management is currently evaluating the impact that this standard may have on our consolidated financial statements.
In June 2016, the FASB issued an accounting standard classified under FASB ASC Topic 326, “Financial Instruments-Credit Losses”. The amendments in this standard provide an approach based on expected losses to estimate credit losses on certain types of financial instruments. The amendments also modify the impairment model for available for sale debt securities and provides for a simplified accounting model for purchased financial assets with credit deterioration since their origination. The amendments in this standard expand the disclosure requirements regarding an entity’s assumptions, models, and methods for estimating the allowance for loan and lease losses. In addition, public business entities will need to disclose the amortized cost balance for each class of financial asset by credit quality indicator, disaggregated by the year of origination. This standard is effective for fiscal years beginning after December 15, 2019, including interim periods within those fiscal years. Early application of the guidance will be permitted for all entities for fiscal years beginning after December 15, 2018, including interim periods within those fiscal years. Management is currently evaluating the impact that this standard will have on our consolidated financial statements.
In August 2016, the FASB issued an accounting standard classified under FASB ASC Topic 230, “Statement of Cash Flows”. This accounting standard provides guidance on eight specific cash flow issues; (i) debt prepayment or debt extinguishment costs; (ii) settlement of zero-coupon debt instruments or other debt instruments with coupon interest rates that are insignificant in relation to the
14
RAIT Financial Trust
Notes to Consolidated Financial Statements
As of September 30, 2016
(Unaudited and dollars in thousands, except share and per share amounts)
effective interest rate of the borrowing; (iii) contingent consideration payments made after a business combination; (iv) proceeds from the settlement of insurance claims; (v) proceeds from the settlement of corporate-owned life insurance policies; including bank-owned life insurance policies; (vi) distributions received from equity method investees; (vii) beneficial interests in securitization transactions; and (viii) separately identifiable cash flows and application of the predominance principle. The amendments are effective for fiscal years beginning after December 15, 2017, and interim periods within those fiscal years. Early adoption is permitted, including adoption in an interim period. Management is currently evaluating the impact that this standard may have on our consolidated statement of cash flows.
In October 2016, the FASB issued an accounting standard classified under FASB ASC Topic 740, “Income Taxes”. The amendments in this accounting standard provide that the current and deferred income tax consequences of an intra-entity transfer of an asset other than inventory should be recognized when the transfer occurs rather than when the asset has been sold to an outside party. Two common examples of assets included in the scope of this accounting standard are intellectual property and property, plant, and equipment. The amendments in this standard are effective for annual reporting periods beginning after December 15, 2017, including interim reporting periods within those annual reporting periods. Early adoption is permitted for all entities as of the beginning of an annual reporting period for which financial statements (interim or annual) have not been issued. The amendments in this accounting standard should be applied on a modified retrospective basis through a cumulative-effect adjustment directly to retained earnings as of the beginning of the period of adoption. Management is currently evaluating the impact that this standard may have on our consolidated financial statements.
In October 2016, the FASB issued an accounting standard classified under FASB ASC Topic 810, “Consolidation”. The amendments in this accounting standard provide guidance on how a reporting entity that is the single decision maker of a VIE should treat indirect interests in the entity held through related parties that are under common control with the reporting entity when determining whether it is the primary beneficiary of that VIE. The amendments in this accounting standard do not change the characteristics of a primary beneficiary in current GAAP. A primary beneficiary of a VIE has both of the following characteristics: (i) the power to direct the activities of a VIE that most significantly impact the VIE’s economic performance and (ii) the obligation to absorb losses of the VIE that could potentially be significant to the VIE or the right to receive benefits from the VIE that could potentially be significant to the VIE. If a reporting entity satisfies the first characteristic of a primary beneficiary (such that it is the single decision maker of a VIE), the amendments in this accounting standard require that the reporting entity, in determining whether it satisfies the second characteristic of a primary beneficiary, to include all of its direct variable interest in a VIE and, on a proportionate basis, its indirect variable interest in a VIE held through related parties, including related parties that are under common control with the reporting entity. If after performing that assessment, a reporting entity that is the single decision maker of a VIE concludes that it does not have the characteristics of a primary beneficiary, the amendments continue to require that the reporting entity evaluate whether it and one or more of its related parties under common control, as a group, have the characteristics of a primary beneficiary. The amendments in this accounting standard are effective for fiscal years beginning after December 15, 2016, including interim periods within those fiscal years. Early adoption is permitted, including adoption in an interim period. Management is currently evaluating the impact that this standard may have on our consolidated financial statements.
NOTE 3: INVESTMENTS IN LOANS
Investments in Commercial Mortgage Loans, Mezzanine Loans, and Preferred Equity Interests
The following table summarizes our investments in commercial mortgage loans, mezzanine loans and preferred equity interests as of September 30, 2016:
|
|
|
Unpaid Principal Balance |
|
|
Unamortized (Discounts) Premiums |
|
|
Carrying Amount |
|
|
Number of Loans |
|
|
Weighted- Average Coupon (1) |
|
|
Range of Maturity Dates (2) |
|||||
|
Commercial Real Estate (CRE) |
|
|
|
|
|
|
|
|
|
|
|
|
|
|
|
|
|
|
|
|
|
|
|
Commercial mortgage loans (3) |
|
$ |
1,228,732 |
|
|
$ |
(902 |
) |
|
$ |
1,227,830 |
|
|
|
100 |
|
|
|
5.7 |
% |
|
Oct. 2016 - Dec. 2025 |
|
Mezzanine loans |
|
|
110,055 |
|
|
|
(219 |
) |
|
|
109,836 |
|
|
|
34 |
|
|
|
9.3 |
% |
|
Oct. 2016 - Jun. 2027 |
|
Preferred equity interests |
|
|
36,828 |
|
|
|
(1 |
) |
|
|
36,827 |
|
|
|
14 |
|
|
|
7.2 |
% |
|
Jan. 2017 - Jan. 2029 |
|
Total CRE |
|
|
1,375,615 |
|
|
|
(1,122 |
) |
|
|
1,374,493 |
|
|
|
148 |
|
|
|
6.0 |
% |
|
|
|
Deferred fees, net |
|
|
(878 |
) |
|
|
- |
|
|
|
(878 |
) |
|
|
|
|
|
|
|
|
|
|
|
Total |
|
$ |
1,374,737 |
|
|
$ |
(1,122 |
) |
|
$ |
1,373,615 |
|
|
|
|
|
|
|
|
|
|
|
15
RAIT Financial Trust
Notes to Consolidated Financial Statements
As of September 30, 2016
(Unaudited and dollars in thousands, except share and per share amounts)
|
(1) |
Weighted-average coupon is calculated on the unpaid principal balance, which does not necessarily correspond to the carrying amount. |
|
(2) |
Does not include the maturity dates of four loans all of which had maturity dates prior to September 30, 2016 and have been identified as impaired. These loans are 90 days or more past due. |
|
(3) |
Commercial mortgage loans includes three conduit loans with an unpaid principal balance and carrying amount of $27,570, a weighted-average coupon of 4.8% and maturity dates ranging from June 2025 through December 2025. These commercial mortgage loans are accounted for as loans held for sale. |
The following table summarizes our investments in commercial mortgage loans, mezzanine loans and preferred equity interests as of December 31, 2015:
|
|
|
Unpaid Principal Balance |
|
|
Unamortized (Discounts) Premiums |
|
|
Carrying Amount |
|
|
Number of Loans |
|
|
Weighted- Average Coupon (1) |
|
|
Range of Maturity Dates (2) |
|||||
|
Commercial Real Estate (CRE) |
|
|
|
|
|
|
|
|
|
|
|
|
|
|
|
|
|
|
|
|
|
|
|
Commercial mortgage loans (3) |
|
$ |
1,427,328 |
|
|
$ |
(1,049 |
) |
|
$ |
1,426,279 |
|
|
|
124 |
|
|
|
5.2 |
% |
|
Mar. 2016 to Jan. 2029 |
|
Mezzanine loans |
|
|
169,556 |
|
|
|
(218 |
) |
|
|
169,338 |
|
|
|
57 |
|
|
|
10.0 |
% |
|
Jan. 2016 to May 2025 |
|
Preferred equity interests |
|
|
30,237 |
|
|
|
(1 |
) |
|
|
30,236 |
|
|
|
7 |
|
|
|
6.9 |
% |
|
Feb. 2016 to Aug. 2025 |
|
Total CRE |
|
|
1,627,121 |
|
|
|
(1,268 |
) |
|
|
1,625,853 |
|
|
|
188 |
|
|
|
6.1 |
% |
|
|
|
Deferred fees, net |
|
|
(2,270 |
) |
|
|
— |
|
|
|
(2,270 |
) |
|
|
|
|
|
|
|
|
|
|
|
Total |
|
$ |
1,624,851 |
|
|
$ |
(1,268 |
) |
|
$ |
1,623,583 |
|
|
|
|
|
|
|
|
|
|
|
|
(1) |
Weighted-average coupon is calculated on the unpaid principal balance, which does not necessarily correspond to the carrying amount. |
|
(2) |
Does not include the maturity dates of three mezzanine loans that were 90 days or more past due which had contractual maturity dates prior to December 31, 2015. |
|
(3) |
Commercial mortgage loans includes six conduit loans with an unpaid principal balance and carrying amount of $49,239, a weighted-average coupon of 4.8% and maturity dates ranging from December 2020 through January 2026. These commercial mortgage loans are accounted for as loans held for sale. |
The following table summarizes the delinquency statistics of our commercial real estate loans as of September 30, 2016 and December 31, 2015:
|
|
|
As of September 30, 2016 |
|
|||||||||||||||||||||||||
|
Delinquency Status |
|
Current |
|
|
30 to 59 days |
|
|
60 to 89 days |
|
|
90 days or more |
|
|
In foreclosure or bankruptcy proceedings |
|
|
Total |
|
|
Non-accrual (1) |
|
|||||||
|
Commercial mortgage loans |
|
$ |
1,153,931 |
|
|
$ |
— |
|
|
$ |
— |
|
|
|
74,800 |
|
|
$ |
— |
|
|
$ |
1,228,731 |
|
|
$ |
92,035 |
|
|
Mezzanine loans |
|
|
100,503 |
|
|
|
— |
|
|
|
— |
|
|
|
9,553 |
|
|
|
— |
|
|
|
110,056 |
|
|
$ |
9,553 |
|
|
Preferred equity interests |
|
|
36,828 |
|
|
|
— |
|
|
|
— |
|
|
|
— |
|
|
|
— |
|
|
|
36,828 |
|
|
$ |
7,880 |
|
|
Total |
|
$ |
1,291,262 |
|
|
$ |
— |
|
|
$ |
— |
|
|
$ |
84,353 |
|
|
$ |
— |
|
|
$ |
1,375,615 |
|
|
$ |
109,468 |
|
|
(1) |
Includes four loans that were current, but are on non-accrual due to uncertainty over whether we will fully collect principal and interest. |
16
RAIT Financial Trust
Notes to Consolidated Financial Statements
As of September 30, 2016
(Unaudited and dollars in thousands, except share and per share amounts)
|
|
|
As of December 31, 2015 |
|
|||||||||||||||||||||||||
|
Delinquency Status |
|
Current |
|
|
30 to 59 days |
|
|
60 to 89 days |
|
|
90 days or more |
|
|
In foreclosure or bankruptcy proceedings (1) |
|
|
Total |
|
|
Non-Accrual (2) |
|
|||||||
|
Commercial mortgage loans |
|
$ |
1,427,328 |
|
|
$ |
— |
|
|
$ |
— |
|
|
$ |
— |
|
|
$ |
— |
|
|
$ |
1,427,328 |
|
|
$ |
15,645 |
|
|
Mezzanine loans |
|
|
167,145 |
|
|
|
— |
|
|
|
— |
|
|
|
1,163 |
|
|
|
1,248 |
|
|
|
169,556 |
|
|
|
12,346 |
|
|
Preferred equity interests |
|
|
30,237 |
|
|
|
— |
|
|
|
— |
|
|
|
— |
|
|
|
— |
|
|
|
30,237 |
|
|
|
7,946 |
|
|
Total |
|
$ |
1,624,710 |
|
|
$ |
— |
|
|
$ |
— |
|
|
$ |
1,163 |
|
|
$ |
1,248 |
|
|
$ |
1,627,121 |
|
|
$ |
35,937 |
|
|
(1) |
These loans were on non-accrual due to uncertainty over whether we will fully collect principal and interest. |
|
(2) |
Includes six loans that were current in accordance with their terms, but are on non-accrual due to uncertainty over whether we will fully collect principal and interest. |
As of September 30, 2016 and December 31, 2015, all of our commercial mortgage loans, mezzanine loans and preferred equity interests that were 90 days or more past due or in foreclosure were on non-accrual status. As of September 30, 2016 and December 31, 2015, $109,468 and $35,937, respectively, of our commercial real estate loans were on non-accrual status and had a weighted-average interest rate of 5.4% and 4.6%, respectively. Also, as of September 30, 2016 and December 31, 2015, four and two loans, respectively, with an unpaid principal balance of $28,933 and $13,002, respectively, and a weighted average interest rate of 12.6% and 11.6%, respectively, were recognizing interest on the cash basis. Additionally, as of September 30, 2016 and December 31, 2015, one loan, with an unpaid principal balance of $18,500, which had previously been restructured in a troubled debt restructuring, or TDR, did not accrue interest in accordance with its restructured terms as it has the option to be prepaid at par.
We are in the process of completing a restructuring of a $74,800 loan, which was greater than 90 days past due as of September 30, 2016. This restructuring, which would be considered a TDR, involves separating the loan into seven individual loans that will be cross-collateralized, capitalizing past due interest and advances, extending the maturity date and reducing the contractual interest rate. The probable incurred losses of $1,933 related to this restructuring was recognized as provision for loan losses as of September 30, 2016.
Allowance For Loan Losses And Impaired Loans
We closely monitor our loans which require evaluation for loan loss in two categories: satisfactory and watchlist/impaired. Loans classified as watchlist/impaired are generally loans which have credit weaknesses or in which the credit quality of the collateral has deteriorated. This is determined by evaluating quantitative factors including debt service coverage ratios, net operating income of the underlying collateral and qualitative factors such as current performance of the underlying collateral. As of September 30, 2016 and December 31, 2015 we have classified our investment in loans by credit risk category as follows:
|
|
|
As of September 30, 2016 |
|
|||||||||||||
|
Credit Status |
|
Commercial Mortgage Loans |
|
|
Mezzanine Loans |
|
|
Preferred Equity |
|
|
Total |
|
||||
|
Satisfactory |
|
$ |
1,136,697 |
|
|
$ |
82,002 |
|
|
$ |
28,948 |
|
|
$ |
1,247,647 |
|
|
Watchlist / Impaired |
|
|
92,035 |
|
|
|
28,053 |
|
|
|
7,880 |
|
|
|
127,968 |
|
|
Total |
|
$ |
1,228,732 |
|
|
$ |
110,055 |
|
|
$ |
36,828 |
|
|
$ |
1,375,615 |
|
|
|
|
As of December 31, 2015 |
|
||||||||||||||||||
|
Credit Status |
|
Commercial Mortgage Loans |
|
|
Mezzanine Loans |
|
|
Preferred Equity |
|
|
Total |
|
|||||||||
|
Satisfactory |
|
$ |
1,336,883 |
|
|
$ |
135,710 |
|
|
$ |
22,291 |
|
|
$ |
1,494,884 |
|
|||||
|
Watchlist / Impaired |
|
|
90,445 |
|
|
|
33,846 |
|
|
|
7,946 |
|
|
|
132,237 |
|
|||||
|
Total |
|
$ |
1,427,328 |
|
|
$ |
169,556 |
|
|
$ |
30,237 |
|
|
$ |
1,627,121 |
|
|||||
17
RAIT Financial Trust
Notes to Consolidated Financial Statements
As of September 30, 2016
(Unaudited and dollars in thousands, except share and per share amounts)
The following tables provide roll-forwards of our allowance for loan losses for our commercial mortgage loans, mezzanine loans and preferred equity interests for the three months ended September 30, 2016 and 2015:
|
|
|
For the Three Months Ended September 30, 2016 |
|
|||||||||||||
|
|
|
Commercial Mortgage Loans |
|
|
Mezzanine Loans |
|
|
Preferred Equity |
|
|
Total |
|
||||
|
Beginning balance |
|
$ |
4,397 |
|
|
$ |
10,861 |
|
|
$ |
2,979 |
|
|
$ |
18,237 |
|
|
Provision for loan losses |
|
|
1,957 |
|
|
|
(394 |
) |
|
|
(30 |
) |
|
|
1,533 |
|
|
Charge-offs, net of recoveries |
|
|
(10 |
) |
|
|
(1,105 |
) |
|
|
— |
|
|
|
(1,115 |
) |
|
Ending balance |
|
$ |
6,344 |
|
|
$ |
9,362 |
|
|
$ |
2,949 |
|
|
$ |
18,655 |
|
|
|
|
For the Three Months Ended September 30, 2015 |
|
|||||||||||||
|
|
|
Commercial Mortgage Loans |
|
|
Mezzanine Loans |
|
|
Preferred Equity |
|
|
Total |
|
||||
|
Beginning balance |
|
$ |
— |
|
|
$ |
11,470 |
|
|
$ |
1,326 |
|
|
$ |
12,796 |
|
|
Provision for loan losses |
|
|
3,154 |
|
|
|
(1,255 |
) |
|
|
(49 |
) |
|
|
1,850 |
|
|
Charge-offs, net of recoveries |
|
|
— |
|
|
|
0 |
|
|
|
— |
|
|
|
- |
|
|
Ending balance |
|
$ |
3,154 |
|
|
$ |
10,215 |
|
|
$ |
1,277 |
|
|
$ |
14,646 |
|
The following tables provide roll-forwards of our allowance for loan losses for our commercial mortgages, mezzanine loans and preferred equity interests for the nine months ended September 30, 2016 and 2015:
|
|
|
For the Nine Months Ended September 30, 2016 |
|
|||||||||||||
|
|
|
Commercial Mortgage Loans |
|
|
Mezzanine Loans |
|
|
Preferred Equity |
|
|
Total |
|
||||
|
Beginning balance |
|
$ |
3,154 |
|
|
$ |
12,139 |
|
|
$ |
1,804 |
|
|
$ |
17,097 |
|
|
Provision for loan losses |
|
|
3,200 |
|
|
|
(143 |
) |
|
|
1,145 |
|
|
|
4,202 |
|
|
Charge-offs, net of recoveries |
|
|
(10 |
) |
|
|
(2,634 |
) |
|
|
— |
|
|
|
(2,644 |
) |
|
Ending balance |
|
$ |
6,344 |
|
|
$ |
9,362 |
|
|
$ |
2,949 |
|
|
$ |
18,655 |
|
|
|
|
For the Nine Months Ended September 30, 2015 |
|
|||||||||||||
|
|
|
Commercial Mortgage Loans |
|
|
Mezzanine Loans |
|
|
Preferred Equity |
|
|
Total |
|
||||
|
Beginning balance |
|
$ |
— |
|
|
$ |
7,892 |
|
|
$ |
1,326 |
|
|
$ |
9,218 |
|
|
Provision for loan losses |
|
|
3,154 |
|
|
|
2,745 |
|
|
|
(49 |
) |
|
|
5,850 |
|
|
Charge-offs, net of recoveries |
|
|
— |
|
|
|
(422 |
) |
|
|
— |
|
|
|
(422 |
) |
|
Ending balance |
|
$ |
3,154 |
|
|
$ |
10,215 |
|
|
$ |
1,277 |
|
|
$ |
14,646 |
|
Information related to those loans on our watchlist or considered to be impaired was as follows:
|
|
|
As of September 30, 2016 |
|
|||||||||||||
|
Watchlist/Impaired Loans |
|
Commercial Mortgage Loans |
|
|
Mezzanine Loans |
|
|
Preferred Equity |
|
|
Total |
|
||||
|
Watchlist/Impaired loans expecting full recovery |
|
$ |
— |
|
|
$ |
18,500 |
|
|
$ |
— |
|
|
$ |
18,500 |
|
|
Watchlist/Impaired loans with reserves |
|
|
92,035 |
|
|
|
9,553 |
|
|
|
7,880 |
|
|
|
109,468 |
|
|
Total Watchlist/Impaired Loans (1) |
|
$ |
92,035 |
|
|
$ |
28,053 |
|
|
$ |
7,880 |
|
|
$ |
127,968 |
|
|
Allowance for loan losses |
|
$ |
6,344 |
|
|
$ |
9,362 |
|
|
$ |
2,949 |
|
|
$ |
18,655 |
|
|
(1) |
As of September 30, 2016, there was no unpaid principal relating to previously identified TDRs that are on accrual status. |
18
RAIT Financial Trust
Notes to Consolidated Financial Statements
As of September 30, 2016
(Unaudited and dollars in thousands, except share and per share amounts)
|
|
|
As of December 31, 2015 |
|
|||||||||||||
|
Watchlist/Impaired Loans |
|
Commercial Mortgage Loans |
|
|
Mezzanine Loans |
|
|
Preferred Equity |
|
|
Total |
|
||||
|
Watchlist/Impaired loans expecting full recovery |
|
$ |
74,800 |
|
|
$ |
3,000 |
|
|
$ |
— |
|
|
$ |
77,800 |
|
|
Watchlist/Impaired loans with reserves |
|
|
15,645 |
|
|
|
30,846 |
|
|
|
7,946 |
|
|
|
54,437 |
|
|
Total Watchlist/Impaired Loans (1) |
|
$ |
90,445 |
|
|
$ |
33,846 |
|
|
$ |
7,946 |
|
|
$ |
132,237 |
|
|
Allowance for loan losses |
|
$ |
3,154 |
|
|
$ |
12,139 |
|
|
$ |
1,804 |
|
|
$ |
17,097 |
|
|
(1) |
As of December 31, 2015, there was no unpaid principal relating to previously identified TDRs that are on accrual status. |
The average unpaid principal balance and recorded investment of total watchlist/impaired loans was $128,485 and $78,680 during the three months ended September 30, 2016 and 2015, respectively, and $130,299 and $79,791 during the nine months ended September 30, 2016 and 2015, respectively. We recorded interest income of $193 and $1,129 on loans that were watchlist/impaired for the three months ended September 30, 2016 and 2015, respectively. We recorded interest income of $2,715 and $2,882 on loans that were watchlist/impaired for the nine months ended September 30, 2016 and 2015, respectively.
We have evaluated restructurings of our commercial real estate loans to determine if the restructuring constitutes a TDR under FASB ASC Topic 310, “Receivables”. During the nine months ended September 30, 2016, we have determined that a restructuring of one commercial real estate loan with an unpaid principal balance of $15,645 constituted a TDR as the interest payment rate was decreased, although interest will continue to accrue on the original contractual rate, subject to management’s determination that it is collectible, and will be owed upon maturity. During the nine months ended September 30, 2015, there were no restructurings of our commercial real estate loans that constituted a TDR. As of September 30, 2016, there were no TDRs that subsequently defaulted for restructurings that had been entered into within the previous 12 months.
Loan-to-Real Estate Conversion
During the three months ended September 30, 2016, we did not convert any commercial real estate loans to owned real estate property.
During the nine months ended September 30, 2016, we completed the conversion of one mezzanine loan with a carrying value of $332 to real estate owned property. The conversion resulted in approximately $18,380 of real estate-related assets and $17,696 of debt being reflected on our consolidated balance sheets. We recognized a charge-off of $1,203 upon conversion.
NOTE 4: INVESTMENTS IN REAL ESTATE
The table below summarizes our investments in real estate:
|
|
|
Book Value |
|
|||||
|
|
|
As of September 30, 2016 |
|
|
As of December 31, 2015 |
|
||
|
Multi-family real estate properties |
|
$ |
284,529 |
|
|
$ |
470,689 |
|
|
Office real estate properties |
|
|
401,989 |
|
|
|
395,224 |
|
|
Industrial real estate properties |
|
|
93,462 |
|
|
|
94,938 |
|
|
Retail real estate properties |
|
|
134,824 |
|
|
|
134,331 |
|
|
Parcels of land |
|
|
50,558 |
|
|
|
50,448 |
|
|
Subtotal |
|
|
965,362 |
|
|
|
1,145,630 |
|
|
Less: Accumulated depreciation and amortization |
|
|
(156,613 |
) |
|
|
(158,688 |
) |
|
Investments in real estate (1) |
|
$ |
808,749 |
|
|
$ |
986,942 |
|
|
(1) |
As of September 30, 2016, two of our multifamily properties, with a carrying amount of $34,450, and two of our parcels of land, with a carrying amount of $12,556, were considered held-for-sale. |
As of September 30, 2016 and December 31, 2015, our investments in real estate were comprised of land of $191,035 and $225,122, respectively, and buildings and improvements of $774,327 and $920,508, respectively.
19
RAIT Financial Trust
Notes to Consolidated Financial Statements
As of September 30, 2016
(Unaudited and dollars in thousands, except share and per share amounts)
As of September 30, 2016, our investments in real estate of $965,362 were financed through $230,679 of mortgage loans or other debt held by third parties and $760,182 of mortgage loans held by our RAIT I and RAIT II CDO securitizations. As of December 31, 2015, our investments in real estate of $1,145,630 were financed through $269,790 of mortgages held by third parties and $851,711 of mortgage loans held by our RAIT I and RAIT II CDO securitizations. Together, along with commercial real estate loans held by RAIT I and RAIT II, these mortgage loans serve as collateral for the CDO notes payable issued by the RAIT I and RAIT II CDO securitizations. All intercompany balances and interest charges are eliminated in consolidation.
Acquisitions:
During the first quarter of 2016, we received additional information regarding estimates we had made for certain assets including cash related to tenant security deposits related to our October 2015 acquisition of 10 industrial properties through our conversion of a mezzanine loan to real estate owned property. This information led to an increase in fair value of the net assets acquired of $437, which we recognized within interest income, as the converted loan was on non-accrual and the fair value of the net assets acquired exceeded the amount of the converted loan plus previously accrued interest.
During the first quarter of 2016, we received additional information regarding estimates we had made as part of the purchase price allocation related to our December 2015 acquisition of Erieview Tower & Parking. This information, which related to an allocation of the estimated costs required to stabilize this property and an adjacent property to which we have rights to as collateral secured by a first mortgage, led to an increase in fair value of the net assets acquired of $1,499. This was offset by a decrease of $1,499 to the previously discussed collateral which is reported within investment in mortgage loans, mezzanine loans and preferred equity interests on our consolidated balance sheets. The $1,499 increase in the net assets acquired was related to an increase in investments in real estate of $3,351, a decrease in intangible assets of $57 and an increase in intangible liabilities of $1,795. The cumulative catch up effect of the allocation (based on the different useful lives) was an increase to net income of $11.
As discussed in Note 3, we completed the conversion of one mezzanine loan with a carrying value of $332 to real estate owned property in April 2016. The conversion resulted in approximately $18,380 of real estate assets and $17,696 of debt being reflected on our consolidated balance sheets. We have performed fair value analyses for the assets acquired and liabilities assumed. We expect to complete the purchase accounting process as soon as practicable, but no later than one year from the date of acquisition.
The following table summarizes the aggregate estimated fair value of the assets and liabilities associated with the properties acquired during the nine months ended September 30, 2016, on the date of acquisition, for the real estate accounted for under FASB ASC Topic 805.
|
Description |
|
Fair Value of Assets Acquired During the Nine Months Ended September 30, 2016 |
|
|
|
Assets acquired: |
|
|
|
|
|
Investments in real estate |
|
$ |
16,652 |
|
|
Cash and cash equivalents |
|
|
66 |
|
|
Restricted cash |
|
|
221 |
|
|
Accounts receivable and other assets |
|
|
5 |
|
|
Intangible assets |
|
|
2,610 |
|
|
Total assets acquired |
|
|
19,554 |
|
|
Liabilities assumed: |
|
|
|
|
|
Indebtedness, net |
|
|
17,696 |
|
|
Accounts payable and accrued expenses |
|
|
448 |
|
|
Other liabilities |
|
|
1,068 |
|
|
Total liabilities assumed |
|
|
19,212 |
|
|
Estimated fair value of net assets acquired |
|
$ |
342 |
|
20
RAIT Financial Trust
Notes to Consolidated Financial Statements
As of September 30, 2016
(Unaudited and dollars in thousands, except share and per share amounts)
The following table summarizes the consideration transferred to acquire the real estate properties and the amounts of identified assets acquired and liabilities assumed at the respective acquisition date:
|
Description |
Total Estimated Fair Value |
|
|
|
Fair value of consideration transferred: |
|
|
|
|
Investments in loans, accrued interest receivable and other assets (net of allowance for loan losses of $1,213) |
$ |
332 |
|
|
Total |
$ |
332 |
|
The table below presents the revenue and net income (loss) for the properties acquired during the nine months ended September 30, 2016 as reported in our consolidated financial statements.
|
|
|
For the Three Months Ended September 30, 2016 |
|
|
For the Nine Months Ended September 30, 2016 |
|
||||||||||
|
Property |
|
Total Revenue |
|
|
Net income (loss) allocable to common shares |
|
|
Total Revenue |
|
|
Net income (loss) allocable to common shares |
|
||||
|
Indiana Portfolio |
|
$ |
731 |
|
|
$ |
(245 |
) |
|
$ |
1,277 |
|
|
$ |
(563 |
) |
|
Total |
|
$ |
731 |
|
|
$ |
(245 |
) |
|
$ |
1,277 |
|
|
$ |
(563 |
) |
The tables below present the revenue, net income and earnings per share effect of the acquired properties on a pro forma basis as if the acquisitions occurred on January 1, 2015. These pro forma results are not necessarily indicative of the results which actually would have occurred if the acquisition had occurred on the first day of the periods presented, nor does the pro forma financial information purport to represent the results of operations for future periods.
|
|
|
For the Three Months ended September 30, |
|
|
For the Nine Months ended September 30, |
|
||||||||||
|
Description |
|
2016 |
|
|
2015 |
|
|
2016 |
|
|
2015 |
|
||||
|
Pro forma total revenue (unaudited) |
|
$ |
43,237 |
|
|
$ |
49,579 |
|
|
$ |
138,439 |
|
|
$ |
160,349 |
|
|
Pro forma net income (loss) allocable to common shares (unaudited) |
|
|
(4 |
) |
|
|
(6,561 |
) |
|
|
(25,386 |
) |
|
|
5,241 |
|
|
Earnings (loss) per share attributable to common shareholders |
|
|
|
|
|
|
|
|
|
|
|
|
|
|
|
|
|
Basic-as pro forma (unaudited) |
|
|
(0.00 |
) |
|
|
(0.08 |
) |
|
|
(0.28 |
) |
|
|
0.06 |
|
|
Diluted-as pro forma (unaudited) |
|
|
(0.00 |
) |
|
|
(0.08 |
) |
|
|
(0.28 |
) |
|
|
0.06 |
|
21
RAIT Financial Trust
Notes to Consolidated Financial Statements
As of September 30, 2016
(Unaudited and dollars in thousands, except share and per share amounts)
During the nine months ended September 30, 2016, we disposed of ten multifamily real estate properties, one office property and one parcel of land. We also recognized $5 of loss on sale related to properties sold in the prior year as we settled remaining amounts with the buyers. The below table summarizes the current year dispositions and also presents each property’s contribution to net income (loss) allocable to common shares, excluding the impact of the gain (loss) on sale:
|
|
|
|
|
|
|
|
|
|
|
|
|
|
|
Net income (loss) allocable to common shares |
|
|||||
|
Property Name |
|
Property Type |
|
Date of Sale |
|
Sale Price |
|
|
Gain (loss) on sale |
|
|
For the Three Months Ended September 30, 2016 |
|
|
For the Nine Months Ended September 30, 2016 |
|
||||
|
Mineral/Lincoln |
|
Office |
|
03/25/2016 |
|
|
7,949 |
|
|
|
(374 |
) |
|
|
1 |
|
|
|
— |
|
|
Ventura |
|
Multifamily |
|
03/30/2016 |
|
|
8,750 |
|
|
|
115 |
|
|
|
9 |
|
|
|
45 |
|
|
Saxony |
|
Land |
|
04/06/2016 |
|
|
1,500 |
|
|
|
(12 |
) |
|
|
— |
|
|
|
(4 |
) |
|
Desert Wind (1) |
|
Multifamily |
|
05/18/2016 |
|
|
8,750 |
|
|
|
(2,032 |
) |
|
|
2 |
|
|
|
52 |
|
|
Las Vistas (1) |
|
Multifamily |
|
05/18/2016 |
|
|
10,500 |
|
|
|
(61 |
) |
|
|
9 |
|
|
|
122 |
|
|
Penny Lane (1) |
|
Multifamily |
|
05/18/2016 |
|
|
10,000 |
|
|
|
3,248 |
|
|
|
31 |
|
|
|
121 |
|
|
Sandal Ridge (1) |
|
Multifamily |
|
05/18/2016 |
|
|
12,250 |
|
|
|
3,482 |
|
|
|
29 |
|
|
|
162 |
|
|
Silversmith |
|
Multifamily |
|
06/03/2016 |
|
|
6,200 |
|
|
|
1,227 |
|
|
|
(3 |
) |
|
|
95 |
|
|
Coles Crossing (2) |
|
Multifamily |
|
09/20/2016 |
|
|
43,750 |
|
|
|
(3,965 |
) |
|
|
345 |
|
|
|
90 |
|
|
Eagle Ridge and Grand Terrace |
|
Multifamily |
|
09/21/2016 |
|
|
44,650 |
|
|
|
11,757 |
|
|
|
275 |
|
|
|
534 |
|
|
Augusta |
|
Multifamily |
|
09/28/2016 |
|
|
37,500 |
|
|
|
10,431 |
|
|
|
321 |
|
|
|
871 |
|
|
Total |
|
|
|
|
|
$ |
191,799 |
|
|
$ |
23,816 |
|
|
$ |
1,019 |
|
|
$ |
2,088 |
|
|
|
(1) |
These properties were disposed of as a group of assets in a portfolio sale on May 18, 2016. |
|
|
(2) |
The loss on sale related to this property primarily results from a defeasance premium of $1,318 and the write off of the noncontrolling interest of $2,518. |
In November of 2016, we sold two multifamily real estate properties for a combined sales price of $43,400. We expect to recognize gains on the sale of these assets.
Impairment:
During the three and nine months ended September 30, 2016, we recognized impairment of real estate assets of $16,442 and $21,661, respectively, as it was more likely than not we would dispose of the assets before the end of their previously estimated useful lives and a portion of our recorded investment in these assets was determined to not be recoverable. During the nine months ended September 30, 2016, we expensed tenant improvements and straight-line rent receivables aggregating $1,703 associated with tenants who vacated our properties early. We also recognized a loss on our retail property management subsidiary’s investment in an unconsolidated entity of $864.
22
RAIT Financial Trust
Notes to Consolidated Financial Statements
As of September 30, 2016
(Unaudited and dollars in thousands, except share and per share amounts)
We maintain various forms of short-term and long-term financing arrangements. Generally, these financing agreements are collateralized by assets within securitizations.
The following table summarizes our total recourse and non-recourse indebtedness as of September 30, 2016:
|
Description |
|
Unpaid Principal Balance |
|
|
Unamortized Discount/Premium and Deferred Financing Costs |
|
|
Carrying Amount |
|
|
Weighted- Average Interest Rate |
|
|
Contractual Maturity |
|
|||||
|
Recourse indebtedness: |
|
|
|
|
|
|
|
|
|
|
|
|
|
|
|
|
|
|
|
|
|
7.0% convertible senior notes (1) |
|
$ |
871 |
|
|
$ |
(27 |
) |
|
$ |
844 |
|
|
|
7.0 |
% |
|
Apr. 2031 |
|
|
|
4.0% convertible senior notes (2) |
|
|
126,098 |
|
|
|
(6,215 |
) |
|
|
119,883 |
|
|
|
4.0 |
% |
|
Oct. 2033 |
|
|
|
7.625% senior notes |
|
|
57,287 |
|
|
|
(1,747 |
) |
|
|
55,540 |
|
|
|
7.6 |
% |
|
Apr. 2024 |
|
|
|
7.125% senior notes |
|
|
70,731 |
|
|
|
(1,545 |
) |
|
|
69,186 |
|
|
|
7.1 |
% |
|
Aug. 2019 |
|
|
|
Senior secured notes |
|
|
64,000 |
|
|
|
(4,560 |
) |
|
|
59,440 |
|
|
|
7.0 |
% |
|
Apr. 2017 to Apr. 2019 |
|
|
|
Junior subordinated notes, at fair value (3) |
|
|
18,671 |
|
|
|
(7,147 |
) |
|
|
11,524 |
|
|
|
4.6 |
% |
|
Mar. 2035 |
|
|
|
Junior subordinated notes, at amortized cost |
|
|
25,100 |
|
|
|
(208 |
) |
|
|
24,892 |
|
|
|
3.3 |
% |
|
Apr. 2037 |
|
|
|
CMBS facilities |
|
|
169,550 |
|
|
|
(921 |
) |
|
|
168,629 |
|
|
|
2.8 |
% |
|
Nov. 2016 to Jul. 2018 |
|
|
|
Total recourse indebtedness |
|
|
532,308 |
|
|
|
(22,370 |
) |
|
|
509,938 |
|
|
|
4.8 |
% |
|
|
|
|
|
Non-recourse indebtedness: |
|
|
|
|
|
|
|
|
|
|
|
|
|
|
|
|
|
|
|
|
|
CDO notes payable, at amortized cost (4)(5) |
|
|
728,362 |
|
|
|
(9,165 |
) |
|
|
719,197 |
|
|
|
1.4 |
% |
|
2045 to 2046 |
|
|
|
CMBS securitizations (6) |
|
|
496,913 |
|
|
|
(4,420 |
) |
|
|
492,493 |
|
|
|
3.1 |
% |
|
Jan. 2031 to Dec. 2031 |
|
|
|
Loans payable on real estate (8) |
|
|
230,678 |
|
|
|
(858 |
) |
|
|
229,820 |
|
|
|
5.8 |
% |
|
June 2016 to April 2026 |
|
|
|
Total non-recourse indebtedness |
|
|
1,455,953 |
|
|
|
(14,443 |
) |
|
|
1,441,510 |
|
|
|
2.7 |
% |
|
|
|
|
|
Other indebtedness (7) |
|
|
24,321 |
|
|
|
94 |
|
|
|
24,415 |
|
|
|
— |
|
|
|
— |
|
|
Total indebtedness |
|
$ |
2,012,582 |
|
|
$ |
(36,719 |
) |
|
$ |
1,975,863 |
|
|
|
3.2 |
% |
|
|
|
|
|
(1) |
Our 7.0% convertible senior notes are redeemable at par, at the option of the holder, in April 2021, and April 2026. |
|
(2) |
Our 4.0% convertible senior notes are redeemable at par, at the option of the holder, in October 2018, October 2023, and October 2028. |
|
(3) |
Relates to liabilities which we elected to record at fair value under FASB ASC Topic 825. |
(4) Excludes CDO notes payable purchased by us which are eliminated in consolidation.
|
(5) |
Collateralized by $1,107,924 principal amount of commercial mortgage loans, mezzanine loans, other loans and preferred equity interests, $641,118 of which eliminates in consolidation. These obligations were issued by separate legal entities and consequently the assets of the special purpose entities that collateralize these obligations are not available to our creditors. |
|
(6) |
Collateralized by $618,494 principal amount of commercial mortgage loans and participation interests. These obligations were issued by separate legal entities and consequently the assets of the special purpose entities that collateralize these obligations are not available to our creditors. |
|
(7) |
Represents a 40% interest issued to an unaffiliated third party in a venture to which we contributed the junior notes and equity of a floating rate securitization. We retained a 60% interest in this venture, and, as a result of our controlling financial interest, we consolidated the venture. We received approximately $24,796 of proceeds as a result of issuing this 40% interest, which has an unpaid principal balance of $24,321. This 40% interest has no stated maturity date and does not provide for its mandatory redemption or any required return or interest payment. The venture interests allocate the distributions on such junior notes and equity when made between the parties to the venture. |
|
(8) |
Certain loans payable on real estate had maturity dates of June 2016. These loans payable on real estate are currently in the process of being refinanced with the lenders. |
23
RAIT Financial Trust
Notes to Consolidated Financial Statements
As of September 30, 2016
(Unaudited and dollars in thousands, except share and per share amounts)
The following table summarizes our total recourse and non-recourse indebtedness as of December 31, 2015:
|
Description |
|
Unpaid Principal Balance |
|
|
Unamortized Discount and Deferred Finance Costs |
|
|
Carrying Amount |
|
|
Weighted- Average Interest Rate |
|
|
Contractual Maturity |
||||
|
Recourse indebtedness: |
|
|
|
|
|
|
|
|
|
|
|
|
|
|
|
|
|
|
|
7.0% convertible senior notes (1) |
|
$ |
30,048 |
|
|
$ |
(1,180 |
) |
|
$ |
28,868 |
|
|
|
7.0 |
% |
|
Apr. 2031 |
|
4.0% convertible senior notes (2) |
|
|
141,750 |
|
|
|
(8,711 |
) |
|
|
133,039 |
|
|
|
4.0 |
% |
|
Oct. 2033 |
|
7.625% senior notes |
|
|
60,000 |
|
|
|
(2,048 |
) |
|
|
57,952 |
|
|
|
7.6 |
% |
|
Apr. 2024 |
|
7.125% senior notes |
|
|
71,905 |
|
|
|
(2,156 |
) |
|
|
69,749 |
|
|
|
7.1 |
% |
|
Aug. 2019 |
|
Senior secured notes |
|
|
70,000 |
|
|
|
(6,955 |
) |
|
|
63,045 |
|
|
|
7.0 |
% |
|
Apr. 2017 to Apr. 2019 |
|
Junior subordinated notes, at fair value (3) |
|
|
18,671 |
|
|
|
(8,167 |
) |
|
|
10,504 |
|
|
|
4.3 |
% |
|
Mar. 2035 |
|
Junior subordinated notes, at amortized cost |
|
|
25,100 |
|
|
|
(216 |
) |
|
|
24,884 |
|
|
|
2.7 |
% |
|
Apr. 2037 |
|
CMBS facilities |
|
|
97,067 |
|
|
|
(344 |
) |
|
|
96,723 |
|
|
|
2.4 |
% |
|
Jul. 2016 to Jan. 2018 |
|
Total recourse indebtedness |
|
|
514,541 |
|
|
|
(29,777 |
) |
|
|
484,764 |
|
|
|
5.1 |
% |
|
|
|
Non-recourse indebtedness: |
|
|
|
|
|
|
|
|
|
|
|
|
|
|
|
|
|
|
|
CDO notes payable, at amortized cost (4)(5) |
|
|
950,981 |
|
|
|
(13,412 |
) |
|
|
937,569 |
|
|
|
0.9 |
% |
|
Jun. 2045 to Nov. 2046 |
|
CMBS securitizations (6) |
|
|
717,255 |
|
|
|
(8,745 |
) |
|
|
708,510 |
|
|
|
2.4 |
% |
|
May 2031 to Dec. 2031 |
|
Loans payable on real estate |
|
|
269,790 |
|
|
|
(1,158 |
) |
|
|
268,632 |
|
|
|
5.6 |
% |
|
Apr. 2016 to Apr. 2026 |
|
Total non-recourse indebtedness |
|
|
1,938,026 |
|
|
|
(23,315 |
) |
|
|
1,914,711 |
|
|
|
2.1 |
% |
|
|
|
Total indebtedness |
|
$ |
2,452,567 |
|
|
$ |
(53,092 |
) |
|
$ |
2,399,475 |
|
|
|
2.7 |
% |
|
|
|
(1) |
Our 7.0% convertible senior notes are redeemable at par, at the option of the holder, in April 2016, April 2021, and April 2026. |
|
(2) |
Our 4.0% convertible senior notes are redeemable at par, at the option of the holder, in October 2018, October 2023, and October 2028. |
|
(3) |
Relates to liabilities which we elected to record at fair value under FASB ASC Topic 825. |
|
(4) |
Excludes CDO notes payable purchased by us which are eliminated in consolidation. |
|
(5) |
Collateralized by $1,388,194 principal amount of commercial mortgage loans, mezzanine loans, other loans and preferred equity interests, $815,745 of which eliminates in consolidation. These obligations were issued by separate legal entities and consequently the assets of the special purpose entities that collateralize these obligations are not available to our creditors. |
|
(6) |
Collateralized by 885,055 principal amount of commercial mortgage loans and participation interests. These obligations were issued by separate legal entities and consequently the assets of the special purpose entities that collateralize these obligations are not available to our creditors. |
Recourse indebtedness refers to indebtedness that is recourse to our general assets, including the loans payable on real estate that are guaranteed by us. Non-recourse indebtedness consists of indebtedness of consolidated VIEs (e.g., securitization vehicles) and loans payable on real estate which is recourse only to specific assets pledged as collateral to the lenders. The creditors of each consolidated VIE have no recourse to our general credit.
The current status or activity in our financing arrangements occurring as of or during the nine months ended September 30, 2016 is as follows:
Recourse Indebtedness
7.0% convertible senior notes. The 7.0% convertible senior notes are convertible at the option of the holder at a current conversion rate of 190.2627 common shares per $1 principal amount of 7.0% convertible senior notes (equivalent to a current conversion price of $5.26 per common share).
On April 1, 2016, we redeemed $29,177 of the 7.0% convertible senior notes at a redemption price equal to the principal amount
plus accrued and unpaid interest. As of September 30, 2016, $871 of the 7.0% convertible notes remain outstanding.
24
RAIT Financial Trust
Notes to Consolidated Financial Statements
As of September 30, 2016
(Unaudited and dollars in thousands, except share and per share amounts)
4.0% convertible senior notes. The 4.0% convertible senior notes are convertible at the option of the holder at a current conversion rate of 108.5803 common shares per $1 principal amount of 4.0% convertible senior notes (equivalent to a current conversion price of $9.21 per common share).
During the second quarter of 2016, we repurchased $15,652 in principal amount of the 4.0% convertible senior notes for $14,075. As of September 30, 2016, $126,098 of the 4.0% convertible senior notes remain outstanding.
7.625% senior notes. During the second quarter of 2016, we repurchased $2,713 in principal amount of the 7.625% senior notes for $2,172. As of September 30, 2016, $57,287 of the 7.625% senior notes remain outstanding.
7.125% senior notes. During the second quarter of 2016, we repurchased $1,174 in principal amount of the 7.125% senior notes for $1,081. As of September 30, 2016, $70,731 of the 7.125% senior notes remain outstanding.
Senior secured notes. During the nine months ended September 30, 2016, we prepaid $6,000 of the senior secured notes. As of September 30, 2016, we have $64,000 of outstanding senior secured notes.
Junior subordinated notes, at fair value. At issuance, we elected to record the current $18,671 junior subordinated note at fair value under FASB ASC Topic 825, with all subsequent changes in fair value recorded in earnings. As of September 30, 2016, the fair value of this indebtedness was $11,524.
Junior subordinated notes, at amortized cost. During the nine months ended September 30, 2016, there was no activity other than recurring interest during the current period.
CMBS facilities. As of September 30, 2016, we had $0 of outstanding CMBS borrowings and $77,264 of outstanding commercial mortgage borrowings under the amended and restated master repurchase agreement, or the Amended MRA. The Amended MRA had a capacity of $200,000 with a limit of $100,000 for floating rate loans. In July of 2016, this facility was amended decreasing the capacity to $150,000 and extending the maturity date to July of 2018. As of September 30, 2016, we were in compliance with all financial covenants contained in the Amended MRA.
As of September 30, 2016, we had $6,770 of outstanding borrowings under the $150,000 CMBS facility. As of September 30, 2016, we were in compliance with all financial covenants contained in the $150,000 CMBS facility.
As of September 30, 2016, we had $48,276 of outstanding borrowings under the $75,000 commercial mortgage facility. As of September 30, 2016, we were in compliance with all financial covenants contained in the $75,000 commercial mortgage facility.
As of September 30, 2016, we had $37,240 of outstanding borrowings under the $150,000 commercial mortgage facility. As of September 30, 2016, we were in compliance with all financial covenants contained in the $150,000 commercial mortgage facility.
Non-Recourse Indebtedness
CDO notes payable, at amortized cost. CDO notes payable at amortized cost represent notes issued by consolidated CDO securitizations which are used to finance the acquisition of commercial mortgage loans, mezzanine loans, and other loans in our commercial real estate portfolio. Generally, CDO notes payable are comprised of various classes of notes payable, with each class bearing interest at variable or fixed rates. Both RAIT I and RAIT II are meeting all of their over collateralization, or OC, and interest coverage, or IC, trigger tests as of September 30, 2016.
During the third quarter of 2016, we repurchased $5,880 in principal amount of the CDO notes payable. The aggregate purchase price was $4,988 and we recorded a gain on extinguishment of debt of $682.
CMBS securitizations. During the third quarter of 2016, RAIT exercised its right to unwind RAIT FL2, thereby repaying all of the outstanding notes. As a result, as of September 30, 2016, RAIT FL2 had $0 of total collateral at par value.
25
RAIT Financial Trust
Notes to Consolidated Financial Statements
As of September 30, 2016
(Unaudited and dollars in thousands, except share and per share amounts)
As of September 30, 2016, our subsidiary, RAIT 2014-FL3 Trust, or RAIT FL3, had $115,878 of total collateral at par value, none of which is defaulted. RAIT FL3 had classes of investment grade senior notes with an aggregate principal balance outstanding of approximately $78,491 to investors. We currently own the unrated classes of junior notes, including a class with an aggregate principal balance of $37,387, and the equity, or the retained interests, of RAIT FL3. RAIT FL3 does not have OC triggers or IC triggers.
As of September 30, 2016, our subsidiary, RAIT 2015-FL4 Trust, or RAIT FL4, had $173,888 of total collateral at par value, none of which is defaulted. This includes $18,000 of collateral repayments which were passed through to investors subsequent to September 30, 2016. RAIT FL4 had classes of investment grade senior notes with an aggregate principal balance outstanding of approximately $132,498 to investors. We currently own the unrated classes of junior notes, including a class with an aggregate principal balance of $41,390, and the equity, or the retained interests, of RAIT FL4. RAIT FL4 does not have OC triggers or IC triggers.
As of September 30, 2016, our subsidiary, RAIT 2015-FL5 Trust, or RAIT FL5, has $346,728 of total collateral at par value, none of which is defaulted. RAIT FL5 had classes of investment grade senior notes with an aggregate principal balance outstanding of approximately $285,924 to investors. Upon closing, we retained $23,019 of investment grade notes and all of the unrated classes of junior notes and equity. In February 2016, we contributed the unrated classes of junior notes and equity of RAIT FL5 to a venture. We retained a 60% interest in the venture, and, as a result of our controlling financial interest, we consolidated the venture. We received approximately $24,796 of proceeds as a result of this contribution. RAIT FL5 does not have OC triggers or IC triggers. In April 2016, we sold the $23,019 of investment grade notes that we retained upon closing.
Loans payable on real estate. As of September 30, 2016 and December 31, 2015, we had $230,678 and $269,790, respectively, of other indebtedness outstanding relating to loans payable on consolidated real estate. These loans are secured by specific consolidated real estate and commercial loans included in our consolidated balance sheets.
During the nine months ended September 30, 2016, we repaid $55,441 of mortgage indebtedness as part of four property dispositions.
During the nine months ended September 30, 2016, we assumed a first mortgage on our investments in real estate related to the acquisition of the Indiana portfolio that had a total principal balance of $17,987.
Maturity of Indebtedness
Generally, the majority of our indebtedness is payable in full upon the maturity or termination date of the underlying indebtedness. The following table displays the aggregate contractual maturities of our indebtedness on or before December 31 by year:
|
|
|
Recourse indebtedness |
|
|
Non-recourse indebtedness |
|
||
|
2016 |
|
$ |
44,010 |
|
|
$ |
90,479 |
|
|
2017 |
|
|
32,000 |
|
|
|
33,439 |
|
|
2018 |
|
|
141,540 |
|
|
|
16,453 |
|
|
2019 |
|
|
86,731 |
|
|
|
1,512 |
|
|
2020 |
|
|
- |
|
|
|
10,236 |
|
|
Thereafter (1) |
|
|
228,027 |
|
|
|
1,303,834 |
|
|
Total |
|
$ |
532,308 |
|
|
$ |
1,455,953 |
|
|
(1) |
Includes $871 of our 7.0% convertible senior notes which are redeemable at par at the option of the holders in April 2021, and April 2026. Includes $126,098 of our 4.0% convertible senior notes which are redeemable at par at the option of the holders in October 2018, October 2023, and October 2028. |
26
RAIT Financial Trust
Notes to Consolidated Financial Statements
As of September 30, 2016
(Unaudited and dollars in thousands, except share and per share amounts)
NOTE 6: DERIVATIVE FINANCIAL INSTRUMENTS
We may use derivative financial instruments to hedge all or a portion of the interest rate risk associated with our borrowings. The principal objective of such arrangements is to minimize the risks and/or costs associated with our operating and financial structure as well as to hedge specific anticipated transactions. While these instruments may impact our periodic cash flows, they benefit us by minimizing the risks and/or costs previously described. The counterparties to these contractual arrangements are major financial institutions with which we and our affiliates may also have other financial relationships. In the event of nonperformance by the counterparties, we are potentially exposed to credit loss. However, because of the high credit ratings of the counterparties, we do not anticipate that any of the counterparties will fail to meet their obligations.
Interest Rate Swaps and Caps
We have entered into various interest rate swap contracts to hedge interest rate exposure on floating rate indebtedness.
We designate interest rate hedge agreements at inception and determine whether or not the interest rate hedge agreement is highly effective in offsetting interest rate fluctuations associated with the identified indebtedness. At designation, certain of these interest rate swaps had a fair value not equal to zero. However, we concluded, at designation, that these hedging arrangements were highly effective during their term using regression analysis and determined that the hypothetical derivative method would be used in measuring any ineffectiveness. At each reporting period, we update our regression analysis and, we concluded that these hedging arrangements were highly effective during their remaining term and used the hypothetical derivative method in measuring the ineffective portions of these hedging arrangements. As of September 30, 2016, all of our cash flow hedge interest rate swaps had reached maturity.
The following table summarizes the aggregate notional amount and estimated net fair value of our derivative instruments as of September 30, 2016 and December 31, 2015:
|
|
|
As of September 30, 2016 |
|
|
As of December 31, 2015 |
|
||||||||||||||||||
|
|
|
Notional |
|
|
Fair Value of Assets |
|
|
Fair Value of Liabilities |
|
|
Notional |
|
|
Fair Value of Assets |
|
|
Fair Value of Liabilities |
|
||||||
|
Cash flow hedges: |
|
|
|
|
|
|
|
|
|
|
|
|
|
|
|
|
|
|
|
|
|
|
|
|
|
Interest rate swaps |
|
$ |
- |
|
|
$ |
- |
|
|
$ |
- |
|
|
$ |
243,816 |
|
|
$ |
- |
|
|
$ |
(4,672 |
) |
|
Interest rate cap |
|
|
- |
|
|
|
- |
|
|
|
- |
|
|
|
- |
|
|
|
- |
|
|
|
- |
|
|
Other interest rate swaps & caps |
|
|
60,235 |
|
|
|
52 |
|
|
|
(1,748 |
) |
|
|
37,325 |
|
|
|
182 |
|
|
|
(55 |
) |
|
Net fair value |
|
$ |
60,235 |
|
|
$ |
52 |
|
|
$ |
(1,748 |
) |
|
$ |
281,141 |
|
|
$ |
182 |
|
|
$ |
(4,727 |
) |
Effective interest rate swaps and caps are reported in accumulated other comprehensive income and the fair value of these hedge agreements is included in other assets or derivative liabilities.
For interest rate swaps and caps that are considered effective hedges, we reclassified realized losses of $785 and $3,831, respectively, to interest expense for the three months ended September 30, 2016 and 2015 and $4,824 and $13,196 for the nine months ended September 30, 2016 and 2015.
Changes in the fair value of our other interest rate swaps and caps are reported in change in fair value of financial instruments in the Consolidated Statements of Operations.
NOTE 7: FAIR VALUE OF FINANCIAL INSTRUMENTS
Fair Value of Financial Instruments
FASB ASC Topic 825, “Financial Instruments” requires disclosure of the fair value of financial instruments for which it is practicable to estimate that value. The fair value of investments in mortgages and loans, investments in securities, CDO notes payable, convertible senior notes, junior subordinated notes, warrants and investor share appreciation rights, or SARs and derivative assets and liabilities is based on significant observable and unobservable inputs. The fair value of cash and cash equivalents, restricted cash, secured credit facilities, CMBS facilities, commercial mortgage facilities and other indebtedness approximates cost due to the nature of these instruments.
27
RAIT Financial Trust
Notes to Consolidated Financial Statements
As of September 30, 2016
(Unaudited and dollars in thousands, except share and per share amounts)
The following table summarizes the carrying amount and the fair value of our financial instruments as of September 30, 2016:
|
Financial Instrument |
|
Carrying Amount |
|
|
Estimated Fair Value |
|
||
|
Assets |
|
|
|
|
|
|
|
|
|
Total investment in mortgages and loans, net |
|
$ |
1,354,960 |
|
|
$ |
1,321,940 |
|
|
Cash and cash equivalents |
|
|
36,019 |
|
|
|
36,019 |
|
|
Restricted cash |
|
|
229,957 |
|
|
|
229,957 |
|
|
Derivative assets |
|
|
52 |
|
|
|
52 |
|
|
|
|
|
|
|
|
|
|
|
|
Liabilities |
|
|
|
|
|
|
|
|
|
Recourse indebtedness: |
|
|
|
|
|
|
|
|
|
7.0% convertible senior notes |
|
|
844 |
|
|
|
951 |
|
|
4.0% convertible senior notes |
|
|
119,883 |
|
|
|
117,271 |
|
|
7.625% senior notes |
|
|
55,540 |
|
|
|
51,329 |
|
|
7.125% senior notes |
|
|
69,186 |
|
|
|
69,062 |
|
|
Senior secured notes |
|
|
59,440 |
|
|
|
64,596 |
|
|
Junior subordinated notes, at fair value |
|
|
11,524 |
|
|
|
11,524 |
|
|
Junior subordinated notes, at amortized cost |
|
|
24,892 |
|
|
|
12,262 |
|
|
CMBS facilities |
|
|
168,629 |
|
|
|
169,550 |
|
|
Non-recourse indebtedness: |
|
|
|
|
|
|
|
|
|
CDO notes payable, at amortized cost |
|
|
719,197 |
|
|
|
639,060 |
|
|
CMBS securitizations |
|
|
492,493 |
|
|
|
494,264 |
|
|
Loans payable on real estate |
|
|
229,820 |
|
|
|
238,856 |
|
|
Other indebtedness |
|
|
24,415 |
|
|
|
24,321 |
|
|
Derivative liabilities |
|
|
1,748 |
|
|
|
1,748 |
|
|
Warrants and investor SARs |
|
|
30,100 |
|
|
|
30,100 |
|
28
RAIT Financial Trust
Notes to Consolidated Financial Statements
As of September 30, 2016
(Unaudited and dollars in thousands, except share and per share amounts)
The following table summarizes the carrying amount and the fair value of our financial instruments as of December 31, 2015:
|
Financial Instrument |
|
Carrying Amount |
|
|
Estimated Fair Value |
|
||
|
Assets |
|
|
|
|
|
|
|
|
|
Total investment in mortgages and loans, net |
|
$ |
1,606,486 |
|
|
$ |
1,537,086 |
|
|
Cash and cash equivalents |
|
|
125,886 |
|
|
|
125,886 |
|
|
Restricted cash |
|
|
213,012 |
|
|
|
213,012 |
|
|
Derivative assets |
|
|
206 |
|
|
|
206 |
|
|
Liabilities |
|
|
|
|
|
|
|
|
|
Recourse indebtedness: |
|
|
|
|
|
|
|
|
|
7.0% convertible senior notes |
|
|
28,868 |
|
|
|
27,795 |
|
|
4.0% convertible senior notes |
|
|
133,039 |
|
|
|
104,184 |
|
|
7.625% senior notes |
|
|
57,952 |
|
|
|
46,560 |
|
|
7.125% senior notes |
|
|
69,749 |
|
|
|
62,471 |
|
|
Senior secured notes |
|
|
63,045 |
|
|
|
66,725 |
|
|
Junior subordinated notes, at fair value |
|
|
10,504 |
|
|
|
10,504 |
|
|
Junior subordinated notes, at amortized cost |
|
|
24,884 |
|
|
|
11,221 |
|
|
CMBS facilities |
|
|
96,723 |
|
|
|
97,067 |
|
|
Non-recourse indebtedness: |
|
|
|
|
|
|
|
|
|
CDO notes payable, at amortized cost |
|
|
937,569 |
|
|
|
801,289 |
|
|
CMBS securitizations |
|
|
708,510 |
|
|
|
709,001 |
|
|
Loans payable on real estate |
|
|
268,632 |
|
|
|
281,840 |
|
|
Derivative liabilities |
|
|
4,727 |
|
|
|
4,727 |
|
|
Warrants and investor SARs |
|
|
26,200 |
|
|
|
26,200 |
|
Fair Value Measurements
The following tables summarize information about our assets and liabilities measured at fair value on a recurring basis as of September 30, 2016, and indicate the fair value hierarchy of the valuation techniques utilized to determine such fair value:
|
Assets: |
|
Quoted Prices in Active Markets for Identical Assets (Level 1) (a) |
|
|
Significant Other Observable Inputs (Level 2) (a) |
|
|
Significant Unobservable Inputs (Level 3) (a) |
|
|
Balance as of September 30, 2016 |
|
||||
|
Derivative assets |
|
$ |
— |
|
|
$ |
52 |
|
|
$ |
— |
|
|
$ |
52 |
|
|
Total assets |
|
$ |
— |
|
|
$ |
52 |
|
|
$ |
— |
|
|
$ |
52 |
|
|
Liabilities: |
|
Quoted Prices in Active Markets for Identical Assets (Level 1) (a) |
|
|
Significant Other Observable Inputs (Level 2) (a) |
|
|
Significant Unobservable Inputs (Level 3) (a) |
|
|
Balance as of September 30, 2016 |
|
||||
|
Junior subordinated notes, at fair value |
|
$ |
— |
|
|
$ |
— |
|
|
$ |
11,524 |
|
|
$ |
11,524 |
|
|
Derivative liabilities |
|
|
— |
|
|
|
1,748 |
|
|
|
— |
|
|
|
1,748 |
|
|
Warrants and investor SARs |
|
|
— |
|
|
|
— |
|
|
|
30,100 |
|
|
|
30,100 |
|
|
Total liabilities |
|
$ |
— |
|
|
$ |
1,748 |
|
|
$ |
41,624 |
|
|
$ |
43,372 |
|
|
(a) |
During the nine months ended September 30, 2016, there were no transfers between Level 1 and Level 2, and there were no transfers into and/or out of Level 3. |
29
RAIT Financial Trust
Notes to Consolidated Financial Statements
As of September 30, 2016
(Unaudited and dollars in thousands, except share and per share amounts)
The following tables summarize information about our assets and liabilities measured at fair value on a recurring basis as of December 31, 2015, and indicate the fair value hierarchy of the valuation techniques utilized to determine such fair value:
|
Assets: |
|
Quoted Prices in Active Markets for Identical Assets (Level 1) (a) |
|
|
Significant Other Observable Inputs (Level 2) (a) |
|
|
Significant Unobservable Inputs (Level 3) (a) |
|
|
Balance as of December 31, 2015 |
|
||||
|
Derivative assets |
|
$ |
— |
|
|
$ |
206 |
|
|
$ |
— |
|
|
$ |
206 |
|
|
Total assets |
|
$ |
— |
|
|
$ |
206 |
|
|
$ |
— |
|
|
$ |
206 |
|
|
Liabilities: |
|
Quoted Prices in Active Markets for Identical Assets (Level 1) (a) |
|
|
Significant Other Observable Inputs (Level 2) (a) |
|
|
Significant Unobservable Inputs (Level 3) (a) |
|
|
Balance as of December 31, 2015 |
|
||||
|
Junior subordinated notes, at fair value |
|
$ |
— |
|
|
$ |
— |
|
|
$ |
10,504 |
|
|
$ |
10,504 |
|
|
Derivative liabilities |
|
|
— |
|
|
|
4,727 |
|
|
|
— |
|
|
|
4,727 |
|
|
Warrants and investor SARs |
|
|
— |
|
|
|
— |
|
|
|
26,200 |
|
|
|
26,200 |
|
|
Total liabilities |
|
$ |
— |
|
|
$ |
4,727 |
|
|
$ |
36,704 |
|
|
$ |
41,431 |
|
|
(a) |
During the year ended December 31, 2015, there were no transfers between Level 1 and Level 2, and there were no transfers into and/or out of Level 3. |
When estimating the fair value of our Level 3 financial instruments, management uses various observable and unobservable inputs. These inputs include yields, credit spreads, duration, effective dollar prices and overall market conditions on not only the exact financial instrument for which management is estimating the fair value, but also financial instruments that are similar or issued by the same issuer when such inputs are unavailable. Generally, an increase in the yields, credit spreads or estimated duration will decrease the fair value of our financial instruments. Due to the inherent uncertainty of determining the fair value of investments that do not have a readily available market value, the fair value, as determined by management, may fluctuate from period to period and any ultimate liquidation or sale of the investment may result in proceeds that may be significantly different than fair value.
For the fair value of our junior subordinated notes, at fair value, and warrant and investor SARs classified as Level 3 liabilities, we estimate the fair value of these financial instruments using significant unobservable inputs. For the junior subordinated notes, at fair value, we use a discounted cash flow model as the valuation technique and the significant unobservable inputs as of December 31, 2015 include discount rates ranging from 12.9% to 13.3% and as of September 30, 2016 include discount rates ranging from 10.8% to 11.1%. For the warrants and investor SARs, we utilized a third party valuation firm who used a binomial model as the valuation technique and the significant unobservable inputs as of September 30, 2016 and December 31, 2015 include 52.0% and 61.0%, respectively, for the annual volatility of our common shares of beneficial interest over the term of the warrants and investor SARs, 10.0% and 12.0%, respectively, for the credit adjusted discount rate on our unsecured debt issued that may be issued in satisfaction of the warrants and investor SARs, and 9.80% and 10.6%, respectively, for the dividend rate and future dividend rate on our common shares of beneficial interest.
The following table summarizes additional information about assets and liabilities that are measured at fair value on a recurring basis for which we have utilized level 3 inputs to determine fair value for the nine months ended September 30, 2016:
|
Liabilities |
|
Warrants and investor SARS |
|
|
Junior Subordinated Notes, at Fair Value |
|
|
Total Level 3 Liabilities |
|
|||
|
Balance, as of December 31, 2015 |
|
$ |
26,200 |
|
|
$ |
10,504 |
|
|
$ |
36,704 |
|
|
Change in fair value of financial instruments |
|
|
3,900 |
|
|
|
1,020 |
|
|
|
4,920 |
|
|
Purchases |
|
|
— |
|
|
|
— |
|
|
|
— |
|
|
Principal Repayments |
|
|
— |
|
|
|
— |
|
|
|
— |
|
|
Balance, as of September 30, 2016 |
|
$ |
30,100 |
|
|
$ |
11,524 |
|
|
$ |
41,624 |
|
30
RAIT Financial Trust
Notes to Consolidated Financial Statements
As of September 30, 2016
(Unaudited and dollars in thousands, except share and per share amounts)
The following table summarizes additional information about assets and liabilities that are measured at fair value on a recurring basis for which we have utilized level 3 inputs to determine fair value for the three months ended September 30, 2016:
|
Liabilities |
|
Warrants and investor SARS |
|
|
Junior Subordinated Notes, at Fair Value |
|
|
Total Level 3 Liabilities |
|
|||
|
Balance, as of June 30, 2016 |
|
$ |
29,300 |
|
|
$ |
10,789 |
|
|
$ |
40,089 |
|
|
Change in fair value of financial instruments |
|
|
800 |
|
|
|
735 |
|
|
|
1,535 |
|
|
Purchases |
|
|
— |
|
|
|
— |
|
|
|
— |
|
|
Principal Repayments |
|
|
— |
|
|
|
— |
|
|
|
— |
|
|
Balance, as of September 30, 2016 |
|
$ |
30,100 |
|
|
$ |
11,524 |
|
|
$ |
41,624 |
|
Non-Recurring Fair Value Measurements
As of March 31, 2016, we measured a real estate asset at a fair value of $6,386 in our consolidated balance sheets as it was impaired. The fair value was based on an executed letter of intent to sell the real estate asset and was classified within Level 2 of the fair value hierarchy. The significant input was the purchase price derived by the potential buyer.
As of June 30, 2016, we measured a real estate asset at a fair value of $43,313 in our consolidated balance sheets as it was impaired. The fair value was based on an executed purchase and sale agreement and was classified within Level 2 of the fair value hierarchy. The significant input was the purchase price included in the purchase and sale agreement.
As of September 30, 2016, we measured three of our multifamily real estate assets at a fair value of $41,615 in our consolidated balance sheets as they were impaired. The fair values were based on an executed purchase and sale agreement, bids, and an executed letter of intent to sell the real estate asset and were classified within Level 2 of the fair value hierarchy. The significant inputs were the purchase price derived by the potential buyers and the purchase price included in the purchase and sale agreement.
As of September 30, 2016, we measured ten of our industrial real estate assets at a fair value of $83,973 in our consolidated balance sheets as they were impaired. The valuation technique was discounted cash flows and was classified in Level 3 of the fair value hierarchy. The terminal capitalization rates and discount rates are the significant inputs to the valuations and ranged from 8.2% to 11.0% and 8.3% to 11.5%, respectively.
Our other non-recurring fair value measurements relate primarily to our commercial real estate loans that are considered impaired and for which we maintain an allowance for loss. In determining the allowance for losses, we estimate the fair value of the respective commercial real estate loan and compare that fair value to our total investment in the loan. When estimating the fair value of the commercial real estate loan, management uses discounted cash flow analyses and capitalization rates on the underlying property’s net operating income. The discounted cash flow analyses and capitalization rates are based on market information and comparable sales of similar properties. These methodologies are classified in Level 3 of the fair value hierarchy.
31
RAIT Financial Trust
Notes to Consolidated Financial Statements
As of September 30, 2016
(Unaudited and dollars in thousands, except share and per share amounts)
The following tables summarize the valuation technique and the level of the fair value hierarchy for financial instruments that are not fair valued in the accompanying consolidated balance sheets but for which fair value is required to be disclosed. The fair value of cash and cash equivalents, restricted cash, secured credit facilities, CMBS facilities, commercial mortgage facilities and other indebtedness approximates cost due to the nature of these instruments and are not included in the tables below.
|
|
|
|
|
|
|
|
|
|
|
|
|
|
|
|
|
Carrying Amount as of September 30, 2016 |
|
|
Estimated Fair Value as of September 30, 2016 |
|
|
Valuation Technique |
|
Level in Fair Value Hierarchy |
||
|
Total investment in mortgages and loans, net |
|
$ |
1,354,960 |
|
|
$ |
1,321,940 |
|
|
Discounted cash flows |
|
Three |
|
7.0% convertible senior notes |
|
|
844 |
|
|
|
951 |
|
|
Trading price |
|
One |
|
4.0% convertible senior notes |
|
|
119,883 |
|
|
|
117,271 |
|
|
Trading price |
|
One |
|
7.625% senior notes |
|
|
55,540 |
|
|
|
51,329 |
|
|
Trading price |
|
One |
|
7.125% senior notes |
|
|
69,186 |
|
|
|
69,062 |
|
|
Trading price |
|
One |
|
Senior secured notes |
|
|
59,440 |
|
|
|
64,596 |
|
|
Discounted cash flows |
|
Three |
|
Junior subordinated notes, at amortized cost |
|
|
24,892 |
|
|
|
12,262 |
|
|
Discounted cash flows |
|
Three |
|
CDO notes payable, at amortized cost |
|
|
719,197 |
|
|
|
639,060 |
|
|
Discounted cash flows |
|
Three |
|
CMBS securitizations |
|
|
492,493 |
|
|
|
494,264 |
|
|
Discounted cash flows |
|
Three |
|
Loans payable on real estate |
|
|
229,820 |
|
|
|
238,856 |
|
|
Discounted cash flows |
|
Three |
|
|
|
|
|
|
|
|
|
|
|
|
|
|
|
|
|
Carrying Amount as of December 31, 2015 |
|
|
Estimated Fair Value as of December 31, 2015 |
|
|
Valuation Technique |
|
Level in Fair Value Hierarchy |
||
|
Total investment in mortgages and loans, net |
|
$ |
1,606,486 |
|
|
$ |
1,537,086 |
|
|
Discounted cash flows |
|
Three |
|
7.0% convertible senior notes |
|
|
28,868 |
|
|
|
27,795 |
|
|
Trading price |
|
One |
|
4.0% convertible senior notes |
|
|
133,039 |
|
|
|
104,184 |
|
|
Trading price |
|
One |
|
7.625% senior notes |
|
|
57,952 |
|
|
|
46,560 |
|
|
Trading price |
|
One |
|
7.125% senior notes |
|
|
69,749 |
|
|
|
62,471 |
|
|
Trading price |
|
One |
|
Senior secured notes |
|
|
63,045 |
|
|
|
66,725 |
|
|
Discounted cash flows |
|
Three |
|
Junior subordinated notes, at amortized cost |
|
|
24,884 |
|
|
|
11,221 |
|
|
Discounted cash flows |
|
Three |
|
CDO notes payable, at amortized cost |
|
|
937,569 |
|
|
|
801,289 |
|
|
Discounted cash flows |
|
Three |
|
CMBS securitization |
|
|
708,510 |
|
|
|
709,001 |
|
|
Discounted cash flows |
|
Three |
|
Loans payable on real estate |
|
|
268,632 |
|
|
|
281,840 |
|
|
Discounted cash flows |
|
Three |
Change in Fair Value of Financial Instruments
The following table summarizes realized and unrealized gains and losses on assets and liabilities for which we elected the fair value option of FASB ASC Topic 825, “Financial Instruments” and derivatives as reported in change in fair value of financial instruments in the accompanying consolidated statements of operations:
|
|
|
For the Three Months Ended September 30, |
|
|
For the Nine Months Ended September 30, |
|
||||||||||
|
Description |
|
2016 |
|
|
2015 |
|
|
2016 |
|
|
2015 |
|
||||
|
Change in fair value of trading securities and security-related receivables |
|
$ |
— |
|
|
$ |
— |
|
|
$ |
— |
|
|
$ |
(173 |
) |
|
Change in fair value of junior subordinated notes |
|
|
(735 |
) |
|
|
1,673 |
|
|
|
(1,020 |
) |
|
|
1,909 |
|
|
Change in fair value of derivatives |
|
|
160 |
|
|
|
(644 |
) |
|
|
(2,135 |
) |
|
|
(1,064 |
) |
|
Change in fair value of warrants and investors SARs |
|
|
(800 |
) |
|
|
(409 |
) |
|
|
(3,900 |
) |
|
|
12,794 |
|
|
Change in fair value of financial instruments |
|
$ |
(1,375 |
) |
|
$ |
620 |
|
|
$ |
(7,055 |
) |
|
$ |
13,466 |
|
32
RAIT Financial Trust
Notes to Consolidated Financial Statements
As of September 30, 2016
(Unaudited and dollars in thousands, except share and per share amounts)
The changes in the fair value for the trading securities and security-related receivables, and junior subordinated notes for which the fair value option was elected for the three and nine months ended September 30, 2016 and 2015 was primarily attributable to changes in instrument specific credit risks. The changes in the fair value of derivatives for which the fair value option was elected for the three and nine months ended September 30, 2016 and 2015 were mainly due to changes in interest rates. The changes in fair value of the warrants and investor SARs for the three and nine months ended September 30, 2016 and 2015 were due to changes in the reference stock price and volatility.
NOTE 8: VARIABLE INTEREST ENTITIES
The determination of when to consolidate a VIE is based on the power to direct the activities of the VIE that most significantly impact the VIE’s economic performance together with either the obligation to absorb losses or the right to receive benefits that could be significant to the VIE. On January 1, 2016, we adopted a new accounting standard related to consolidation. Refer to NOTE 2: Summary of Significant Accounting Policies for further information. We evaluated our investments and determined that, as of September 30, 2016, our consolidated VIEs were: RAIT I, RAIT II, our floating rate securitizations, IRT, RAIT VIE Properties (Willow Grove, Cherry Hill, South Terrace, McDowell, and our ten industrial properties) and the venture described in Note 5: Indebtedness (RAIT Venture VIE). As of December 31, 2015, our consolidated VIEs were: RAIT I, RAIT II, our floating rate securitizations, IRT, and RAIT VIE Properties (Willow Grove, Cherry Hill, South Terrace, Cole’s Crossing, McDowell, and our ten industrial properties). Previously, we had not disclosed our floating rate securitizations as VIEs and have corrected the prior period disclosure.
We consolidate the securitizations that we sponsor as we have retained interests in these entities and control the significant decisions regarding the collateral in these entities, such as the approval of loan workouts. As of September 30, 2016, we consolidate IRT as we own 15.4% of IRT’s common stock and control the significant decisions of IRT through our advisory agreement. As of September 30, 2016, we consolidate the VIE properties as we own a majority of these entities and control the significant capital and operating decisions regarding the properties. As of September 30, 2016, we consolidate the Venture VIE (which consolidates a floating rate securitization) as we own a majority of this entity and control a majority of the significant decisions regarding the collateral in this entity, such as the approval of loan workouts.
33
RAIT Financial Trust
Notes to Consolidated Financial Statements
As of September 30, 2016
(Unaudited and dollars in thousands, except share and per share amounts)
The following tables present the assets and liabilities of our consolidated VIEs as of each respective date. Certain amounts included in the tables below are eliminated upon consolidation with our other subsidiaries that maintain investments in the debt or equity securities issued by these entities.
|
|
|
As of September 30, 2016 |
|
|||||||||||||||||
|
|
|
RAIT Securitizations |
|
|
IRT |
|
|
RAIT VIE Properties |
|
|
RAIT Joint Venture VIE |
|
|
Total |
|
|||||
|
Assets |
|
|
|
|
|
|
|
|
|
|
|
|
|
|
|
|
|
|
|
|
|
Investments in mortgages and loans, at amortized cost: |
|
|
|
|
|
|
|
|
|
|
|
|
|
|
|
|
|
|
|
|
|
Commercial mortgages, mezzanine loans, other loans and preferred equity interests |
|
$ |
1,352,591 |
|
|
$ |
— |
|
|
$ |
— |
|
|
$ |
345,843 |
|
|
$ |
1,698,434 |
|
|
Allowance for losses |
|
|
— |
|
|
|
— |
|
|
|
— |
|
|
|
— |
|
|
|
0 |
|
|
Total investments in mortgages and loans |
|
|
1,352,591 |
|
|
|
— |
|
|
|
— |
|
|
|
345,843 |
|
|
|
1,698,434 |
|
|
Investments in real estate |
|
|
|
|
|
|
|
|
|
|
|
|
|
|
|
|
|
|
|
|
|
Investments in real estate |
|
|
— |
|
|
|
— |
|
|
|
222,535 |
|
|
|
— |
|
|
|
222,535 |
|
|
Accumulated depreciation |
|
|
— |
|
|
|
— |
|
|
|
(29,770 |
) |
|
|
— |
|
|
|
(29,770 |
) |
|
Total investments in real estate |
|
|
— |
|
|
|
— |
|
|
|
192,765 |
|
|
|
— |
|
|
|
192,765 |
|
|
Cash and cash equivalents |
|
|
— |
|
|
|
— |
|
|
|
2,788 |
|
|
|
1 |
|
|
|
2,789 |
|
|
Restricted cash |
|
|
10,309 |
|
|
|
— |
|
|
|
1,770 |
|
|
|
4 |
|
|
|
12,083 |
|
|
Accrued interest receivable |
|
|
69,315 |
|
|
|
— |
|
|
|
— |
|
|
|
1,516 |
|
|
|
70,831 |
|
|
Other assets |
|
|
513 |
|
|
|
— |
|
|
|
11,218 |
|
|
|
— |
|
|
|
11,731 |
|
|
Intangible assets |
|
|
|
|
|
|
|
|
|
|
|
|
|
|
|
|
|
|
|
|
|
Intangible assets |
|
|
— |
|
|
|
— |
|
|
|
5,616 |
|
|
|
— |
|
|
|
5,616 |
|
|
Accumulated amortization |
|
|
— |
|
|
|
— |
|
|
|
(3,304 |
) |
|
|
— |
|
|
|
(3,304 |
) |
|
Total intangible assets |
|
|
— |
|
|
|
— |
|
|
|
2,312 |
|
|
|
— |
|
|
|
2,312 |
|
|
Assets of discontinued operations |
|
|
— |
|
|
|
1,306,242 |
|
|
|
— |
|
|
|
— |
|
|
|
1,306,242 |
|
|
Total assets |
|
$ |
1,432,728 |
|
|
$ |
1,306,242 |
|
|
$ |
210,853 |
|
|
$ |
347,364 |
|
|
$ |
3,297,187 |
|
|
Liabilities and Equity |
|
|
|
|
|
|
|
|
|
|
|
|
|
|
|
|
|
|
|
|
|
Indebtedness, net |
|
$ |
1,220,413 |
|
|
$ |
— |
|
|
$ |
231,744 |
|
|
$ |
343,970 |
|
|
$ |
1,796,127 |
|
|
Accrued interest payable |
|
|
975 |
|
|
$ |
— |
|
|
|
13,602 |
|
|
|
827 |
|
|
|
15,404 |
|
|
Accounts payable and accrued expenses |
|
|
2 |
|
|
|
— |
|
|
|
5,991 |
|
|
|
— |
|
|
|
5,993 |
|
|
Derivative liabilities |
|
|
— |
|
|
|
— |
|
|
|
— |
|
|
|
— |
|
|
|
— |
|
|
Deferred taxes, borrowers’ escrows and other liabilities |
|
|
— |
|
|
|
— |
|
|
|
2,339 |
|
|
|
— |
|
|
|
2,339 |
|
|
Liabilities of discontinued operations |
|
|
— |
|
|
|
906,103 |
|
|
|
— |
|
|
|
— |
|
|
|
906,103 |
|
|
Total liabilities |
|
|
1,221,390 |
|
|
|
906,103 |
|
|
|
253,676 |
|
|
|
344,797 |
|
|
|
1,819,863 |
|
|
Equity: |
|
|
|
|
|
|
|
|
|
|
|
|
|
|
|
|
|
|
|
|
|
Shareholders’ equity: |
|
|
|
|
|
|
|
|
|
|
|
|
|
|
|
|
|
|
|
|
|
Accumulated other comprehensive income (loss) |
|
|
— |
|
|
|
— |
|
|
|
— |
|
|
|
— |
|
|
|
— |
|
|
RAIT investment |
|
|
36,079 |
|
|
|
55,271 |
|
|
|
39,398 |
|
|
|
2,869 |
|
|
|
133,617 |
|
|
Retained earnings (deficit) |
|
|
175,259 |
|
|
|
— |
|
|
|
(84,080 |
) |
|
|
(302 |
) |
|
|
90,877 |
|
|
Total shareholders’ equity |
|
|
211,338 |
|
|
|
55,271 |
|
|
|
(44,682 |
) |
|
|
2,567 |
|
|
|
224,494 |
|
|
Noncontrolling Interests |
|
|
— |
|
|
|
344,868 |
|
|
|
1,859 |
|
|
|
— |
|
|
|
346,727 |
|
|
Total liabilities and equity |
|
$ |
1,432,728 |
|
|
$ |
1,306,242 |
|
|
$ |
210,853 |
|
|
$ |
347,364 |
|
|
$ |
3,297,187 |
|
34
RAIT Financial Trust
Notes to Consolidated Financial Statements
As of September 30, 2016
(Unaudited and dollars in thousands, except share and per share amounts)
|
|
|
As of December 31, 2015 |
|
|||||||||||||
|
|
|
RAIT Securitizations |
|
|
IRT |
|
|
RAIT VIE Properties |
|
|
Total |
|
||||
|
Assets |
|
|
|
|
|
|
|
|
|
|
|
|
|
|
|
|
|
Investments in mortgages and loans, at amortized cost: |
|
|
|
|
|
|
|
|
|
|
|
|
|
|
|
|
|
Commercial mortgages, mezzanine loans, other loans and preferred equity interests |
|
$ |
2,242,416 |
|
|
$ |
— |
|
|
$ |
— |
|
|
$ |
2,242,416 |
|
|
Allowance for losses |
|
|
— |
|
|
|
— |
|
|
|
— |
|
|
|
— |
|
|
Total investments in mortgages and loans |
|
|
2,242,416 |
|
|
|
— |
|
|
|
— |
|
|
|
2,242,416 |
|
|
Investments in real estate |
|
|
|
|
|
|
|
|
|
|
|
|
|
|
|
|
|
Investments in real estate |
|
|
— |
|
|
|
— |
|
|
|
278,774 |
|
|
|
278,774 |
|
|
Accumulated depreciation |
|
|
— |
|
|
|
— |
|
|
|
(26,398 |
) |
|
|
(26,398 |
) |
|
Total investments in real estate |
|
|
— |
|
|
|
— |
|
|
|
252,376 |
|
|
|
252,376 |
|
|
Cash and cash equivalents |
|
|
— |
|
|
|
— |
|
|
|
1,589 |
|
|
|
1,589 |
|
|
Restricted cash |
|
|
14,944 |
|
|
|
— |
|
|
|
2,859 |
|
|
|
17,803 |
|
|
Accrued interest receivable |
|
|
77,130 |
|
|
|
— |
|
|
|
— |
|
|
|
77,130 |
|
|
Other assets |
|
|
479 |
|
|
|
— |
|
|
|
13,740 |
|
|
|
14,219 |
|
|
Intangible assets |
|
|
|
|
|
|
|
|
|
|
|
|
|
|
|
|
|
Intangible assets |
|
|
— |
|
|
|
— |
|
|
|
5,245 |
|
|
|
5,245 |
|
|
Accumulated amortization |
|
|
— |
|
|
|
— |
|
|
|
(1,446 |
) |
|
|
(1,446 |
) |
|
Total intangible assets |
|
|
— |
|
|
|
— |
|
|
|
3,799 |
|
|
|
3,799 |
|
|
Assets of discontinued operations |
|
|
|
|
|
|
1,383,188 |
|
|
|
|
|
|
|
1,383,188 |
|
|
Total assets |
|
$ |
2,334,969 |
|
|
$ |
1,383,188 |
|
|
$ |
274,363 |
|
|
$ |
3,992,520 |
|
|
Liabilities and Equity |
|
|
|
|
|
|
|
|
|
|
|
|
|
|
|
|
|
Indebtedness, net |
|
$ |
2,058,739 |
|
|
$ |
— |
|
|
$ |
273,766 |
|
|
$ |
2,332,505 |
|
|
Accrued interest payable |
|
|
2,207 |
|
|
|
— |
|
|
|
13,997 |
|
|
|
16,204 |
|
|
Accounts payable and accrued expenses |
|
|
8 |
|
|
|
— |
|
|
|
6,000 |
|
|
|
6,008 |
|
|
Derivative liabilities |
|
|
4,672 |
|
|
|
— |
|
|
|
— |
|
|
|
4,672 |
|
|
Deferred taxes, borrowers’ escrows and other liabilities |
|
|
176 |
|
|
|
— |
|
|
|
3,842 |
|
|
|
4,018 |
|
|
Liabilities of discontinued operations |
|
|
— |
|
|
|
952,406 |
|
|
|
— |
|
|
|
952,406 |
|
|
Total liabilities |
|
|
2,065,802 |
|
|
|
952,406 |
|
|
|
297,605 |
|
|
|
3,315,813 |
|
|
Equity: |
|
|
|
|
|
|
|
|
|
|
|
|
|
|
|
|
|
Shareholders’ equity: |
|
|
|
|
|
|
|
|
|
|
|
|
|
|
|
|
|
Accumulated other comprehensive income (loss) |
|
|
(4,691 |
) |
|
|
— |
|
|
|
— |
|
|
|
(4,691 |
) |
|
RAIT investment |
|
|
118,174 |
|
|
|
54,389 |
|
|
|
35,792 |
|
|
|
208,355 |
|
|
Retained earnings (deficit) |
|
|
155,684 |
|
|
|
— |
|
|
|
(59,454 |
) |
|
|
96,230 |
|
|
Total shareholders’ equity |
|
|
269,167 |
|
|
|
54,389 |
|
|
|
(23,662 |
) |
|
|
299,894 |
|
|
Noncontrolling Interests |
|
|
— |
|
|
|
376,393 |
|
|
|
420 |
|
|
|
376,813 |
|
|
Total liabilities and equity |
|
$ |
2,334,969 |
|
|
$ |
1,383,188 |
|
|
$ |
274,363 |
|
|
$ |
3,992,520 |
|
The assets of the VIEs can only be used to settle obligations of the VIEs and are not available to our creditors. The amounts that eliminate in consolidation include $623,851 of total investments in mortgage loans and $469,915 of indebtedness as of September 30, 2016 and $813,455 of total investments in mortgage loans, $569,833 of indebtedness and $38,075 of liabilities of discontinued operations as of December 31, 2015. As of September 30, 2016, we corrected this December 31, 2015 disclosure as it excluded certain indebtedness that eliminated in consolidation. We do not have any contractual obligation to provide the VIEs listed above with any financial support. We have not and do not intend to provide financial support to these VIEs that we were not previously contractually required to provide.
35
RAIT Financial Trust
Notes to Consolidated Financial Statements
As of September 30, 2016
(Unaudited and dollars in thousands, except share and per share amounts)
NOTE 9: SERIES D PREFERRED SHARES
On October 1, 2012, we entered into a Securities Purchase Agreement, or the purchase agreement, with ARS VI Investor I, LLC, or the investor, an affiliate of Almanac Realty Investors, LLC, or Almanac. During the period from the effective date of the purchase agreement through September 30, 2016, we sold to the investor on a private placement basis in four sales between October 2012 and March 2014 for an aggregate purchase price of $100,000, or the total commitment, the following securities: (i) 4,000,000 Series D Cumulative Redeemable Preferred Shares of Beneficial Interest, par value $0.01 per share, of us, or the Series D Preferred Shares, (ii) common share purchase warrants, or the warrants, exercisable for 9,931,000 of our common shares, or the common shares (which have subsequently adjusted to 11,035,875 shares), and (iii) common share appreciation rights, or the investor SARs, with respect to up to 6,735,667 common shares (which have subsequently adjusted to 7,485,045 shares).
In September 2015, we amended the Securities Purchase Agreement with Almanac related to the Series D Preferred Shares. This amendment changed two of the covenants therein. As consideration for this amendment, we paid Almanac $450. We accounted for this amendment as a modification of the Series D Preferred Shares.
The warrants and investor SARs had an initial strike price of $6.00 per common share, subject to adjustment. As of the filing of this report, the strike price has adjusted to $5.40.
The warrants and investor SARs were both determined to be classified as liabilities and had a combined fair value of $30,100 as of September 30, 2016. The initial fair value of the warrants and investor SARs are recorded as a liability and re-measured at each reporting period until the warrants and investor SARs are settled. Changes in fair value will be recorded in earnings as a component of the change in fair value of financial instruments in the consolidated statement of operations.
The following table summarizes the sales activity of the Series D Preferred Shares from the effective date of the agreement through September 30, 2016:
|
Aggregate purchase price |
|
|
|
|
|
$ |
100,000 |
|
|
Initial value of warrants and investor SARs issued to-date |
|
|
(21,805 |
) |
|
|
|
|
|
Costs incurred |
|
|
(6,834 |
) |
|
|
|
|
|
Total discount |
|
|
|
|
|
|
(28,639 |
) |
|
Discount amortization to-date |
|
|
|
|
|
|
19,367 |
|
|
Carrying amount of Series D Preferred Shares |
|
|
|
|
|
$ |
90,728 |
|
36
RAIT Financial Trust
Notes to Consolidated Financial Statements
As of September 30, 2016
(Unaudited and dollars in thousands, except share and per share amounts)
Preferred Shares
Dividends:
The following table summarizes the dividends we declared and paid on the preferred shares for the nine months ended September 30, 2016:
|
|
|
March 31, 2016 |
|
|
June 30, 2016 |
|
|
September 30, 2016 |
|
|||
|
Series A Preferred Shares |
|
|
|
|
|
|
|
|
|
|
|
|
|
Date declared |
|
2/16/2016 |
|
|
5/19/2016 |
|
|
7/27/2016 |
|
|||
|
Record date |
|
3/1/2016 |
|
|
6/1/2016 |
|
|
9/1/2016 |
|
|||
|
Date paid |
|
3/31/2016 |
|
|
6/30/2016 |
|
|
9/30/2016 |
|
|||
|
Total dividend amount |
|
$ |
2,570 |
|
|
$ |
2,570 |
|
|
$ |
2,589 |
|
|
Series B Preferred Shares |
|
|
|
|
|
|
|
|
|
|
|
|
|
Date declared |
|
2/16/2016 |
|
|
5/19/2016 |
|
|
7/27/2016 |
|
|||
|
Record date |
|
3/1/2016 |
|
|
6/1/2016 |
|
|
9/1/2016 |
|
|||
|
Date paid |
|
3/31/2016 |
|
|
6/30/2016 |
|
|
9/30/2016 |
|
|||
|
Total dividend amount |
|
$ |
1,225 |
|
|
$ |
1,225 |
|
|
$ |
1,225 |
|
|
Series C Preferred Shares |
|
|
|
|
|
|
|
|
|
|
|
|
|
Date declared |
|
2/16/2016 |
|
|
5/19/2016 |
|
|
7/27/2016 |
|
|||
|
Record date |
|
3/1/2016 |
|
|
6/1/2016 |
|
|
9/1/2016 |
|
|||
|
Date paid |
|
3/31/2016 |
|
|
6/30/2016 |
|
|
9/30/2016 |
|
|||
|
Total dividend amount |
|
$ |
910 |
|
|
$ |
910 |
|
|
$ |
910 |
|
|
Series D Preferred Shares |
|
|
|
|
|
|
|
|
|
|
|
|
|
Date declared |
|
2/16/2016 |
|
|
5/19/2016 |
|
|
7/27/2016 |
|
|||
|
Record date |
|
3/1/2016 |
|
|
6/1/2016 |
|
|
9/1/2016 |
|
|||
|
Date paid |
|
3/31/2016 |
|
|
6/30/2016 |
|
|
9/30/2016 |
|
|||
|
Total dividend amount |
|
$ |
2,125 |
|
|
$ |
2,125 |
|
|
$ |
2,125 |
|
At Market Issuance Sales Agreement (ATM):
On June 13, 2014, we entered into an At Market Issuance Sales Agreement, or the 2014 Preferred ATM agreement, with MLV & Co. LLC, or MLV, providing that, from time to time during the term of the 2014 Preferred ATM agreement, on the terms and subject to the conditions set forth therein, we may issue and sell through MLV up to $150,000 aggregate amount of preferred shares.
With respect to each series of preferred shares, the maximum amount issuable is as follows: 4,000,000 Series A Preferred Shares, 1,000,000 Series B Preferred Shares, and 1,000,000 Series C Preferred Shares. Unless the 2014 Preferred ATM agreement is earlier terminated by MLV or us, the 2014 Preferred ATM agreement automatically terminates upon the issuance and sale of all of the Series A Preferred Shares, Series B Preferred Shares, and Series C Preferred Shares.
During the three and nine months ended September 30, 2016, we issued a total of 38,269 Series A Preferred Shares pursuant to the ATM agreement at a weighted average price of $20.94 and we received $777 of net proceeds.
As of September 30, 2016, 2,724,935 Series A Preferred Shares, 947,496 Series B Preferred Shares, and 999,675 Series C Preferred Shares remain available for issuance under the 2014 Preferred ATM agreement.
Common Shares
Dividends:
On March 14, 2016, the board of trustees declared a $0.09 dividend on our common shares to holders of record as of April 8, 2016. The dividend was paid on April 29, 2016 and totaled $8,200. During the three months ended March 31, 2016, we also paid $348 of dividends on restricted common share awards that vested in this period.
37
RAIT Financial Trust
Notes to Consolidated Financial Statements
As of September 30, 2016
(Unaudited and dollars in thousands, except share and per share amounts)
On June 15, 2016, the board of trustees declared a $0.09 dividend on our common shares to holders of record as of July 8, 2016. The dividend was paid on July 29, 2016 and totaled $8,202. During the nine months ended September 30, 2016, we also paid $10 of dividends on restricted common share awards that vested as of March 31, 2016.
On September 19, 2016, the board of trustees declared a $0.09 dividend on our common shares to holders of record as of October 7, 2016. The dividend was paid on October 31, 2016 and totaled $8,202.
Equity Compensation:
On February 23, 2016, the compensation committee awarded 168,776 common shares, valued at $400 using our closing stock price of $2.37, to the board’s non-management trustees. These awards vested immediately. On February 22, 2016, the compensation committee awarded 367,000 restricted common shares, valued at $873 using our closing stock price of $2.38, to our non-executive officer employees. These awards generally vest over a three-year period.
On February 22, 2016, the compensation committee awarded 895,000 SARs, valued at $206 based on a Black-Scholes option pricing model at the date of grant, to our non-executive officer employees. The SARs vest over a three-year period and may be exercised between the date of vesting and February 22, 2021, the expiration date of the SARs.
On March 31, 2015, the compensation committee adopted a 2015 Long Term Incentive Plan, or the LTIP, and made awards, or the 2015 awards, to the eligible officers setting forth the basis on which the eligible officers could earn equity compensation for the years 2015 through 2018. Pursuant to the LTIP, each eligible officer was granted an initial long term equity award, consisting of both a performance share unit award for a three year performance period and an annual restricted share award vesting over a four year period. See Note 13 to the consolidated financial statements in the 2015 Annual Report on Form 10-K for further details regarding these awards. For the three and nine months ended September 30, 2016, we recorded $122 and $366, respectively, of compensation expense related to the LTIP.
On April 22, 2016, the compensation committee made awards, or the 2016 awards, to the eligible executives pursuant to the LTIP. The LTIP awards consist of both a performance share unit award for a three year performance period commencing January 1, 2016 and ending December 31, 2018 and an annual restricted share award vesting over a four year period. Three components of the performance share unit award have market conditions and had grant date fair values of $1.55, $1.44 and $1.07 per share. Both the annual cash bonus plan and the LTIP were adopted pursuant to our 2012 Incentive Award Plan. For the three and nine months ended September 30, 2016, we recorded $120 and $240, respectively, of compensation expense related to the LTIP plan.
For 2016, compensation awarded under the LTIP is based on predefined performance for 75% of the awards. Performance measures and weighting for the performance component of the 2016 through 2018 awards are based on the following objective performance measures relating to our total shareholder return, or TSR, as compared to a peer group of public companies over the same period for 40% of the award, TSR as compared to the TSR for the NAREIT Mortgage Index for 30% of the award, and our absolute TSR for 30% of the award. The remaining 25% of the compensation award is time-based vesting over four years.
On May 23, 2016, the compensation committee awarded 161,290 common share awards, valued at $500, using our closing stock price of $3.10, to our President, under the terms of the 2012 Incentive Award Plan. The common shares subject to the award vest 25% on the date of grant and 25% per year on the first three anniversaries of the date of grant and also vest upon the President’s separation from service for “Good Reason” as defined in the award.
Dividend Reinvestment and Share Purchase Plan (DRSPP):
We have a dividend reinvestment and share purchase plan, or DRSPP, under which we registered and reserved for issuance, in the aggregate, 10,500,000 common shares. During the nine months ended September 30, 2016, we issued a total of 6,808 common shares pursuant to the DRSPP at a weighted-average price of $2.94 per share and we received $20 of net proceeds. As of September 30, 2016, 7,754,914 common shares, in the aggregate, remain available for issuance under the DRSPP.
38
RAIT Financial Trust
Notes to Consolidated Financial Statements
As of September 30, 2016
(Unaudited and dollars in thousands, except share and per share amounts)
Capital on Demand™ Sales Agreement (COD):
On November 21, 2012, we entered into a Capital on Demand™ Sales Agreement, or the COD sales agreement, with JonesTrading Institutional Services LLC, or JonesTrading, pursuant to which we may issue and sell up to 10,000,000 of our common shares from time to time through JonesTrading acting as agent and/or principal, subject to the terms and conditions of the COD sales agreement. Unless the COD sales agreement is earlier terminated by JonesTrading or us, the COD sales agreement automatically terminates upon the issuance and sale of all of the common shares subject to the COD sales agreement. During the nine months ended September 30, 2016, we did not issue any common shares pursuant to this agreement. As of September 30, 2016, 7,918,919 common shares, in the aggregate, remain available for issuance under the COD sales agreement.
Noncontrolling Interests
During the three months ended September 30, 2016, we derecognized the noncontrolling interest of $2,518 related to Cole’s Crossing as the property was sold. During the three months ended September 30, 2016, we derecognized the noncontrolling interest of $2,436 related to ten of our industrial properties as they were impaired. See Note 4: Investments in Real Estate for further discussion regarding impairment on our real estate assets.
As of September 30, 2016 and December 31, 2015, we held 7,269,719 shares of IRT common stock representing 15.4% and 15.5%, respectively, of the outstanding shares of IRT common stock. We consolidate IRT as it is a VIE and we are the primary beneficiary. See Note 8 for additional disclosures pertaining to VIEs.
On October 5, 2016, IRT repurchased all 7,269,719 shares of IRT common stock that were owned by us at a purchase price of $8.55 per share. See Note 16: Discontinued Operations for further information regarding the impact of this transaction and Note 17: Subsequent Events for further information regarding activities that occurred after September 30, 2016.
39
RAIT Financial Trust
Notes to Consolidated Financial Statements
As of September 30, 2016
(Unaudited and dollars in thousands, except share and per share amounts)
NOTE 11: EARNINGS (LOSS) PER SHARE
The following table presents a reconciliation of basic and diluted earnings (loss) per share for the three and nine months ended September 30, 2016 and 2015:
|
|
|
|
|
|
|
|
|
|
|
|
|
|||||
|
|
|
For the Three Months Ended September 30, |
|
|
For the Nine Months Ended September 30, |
|
||||||||||
|
|
|
2016 |
|
|
2015 |
|
|
2016 |
|
|
2015 |
|
||||
|
Income (loss) from continuing operations |
|
$ |
5,328 |
|
|
$ |
(2,178 |
) |
|
$ |
(13,131 |
) |
|
$ |
22,702 |
|
|
(Income) loss allocated to preferred shares |
|
|
(8,715 |
) |
|
|
(8,303 |
) |
|
|
(25,850 |
) |
|
|
(24,383 |
) |
|
(Income) loss allocated to noncontrolling interests |
|
|
1,339 |
|
|
|
472 |
|
|
|
3,455 |
|
|
|
1,705 |
|
|
Income (loss) from continuing operations allocable to common shares |
|
|
(2,048 |
) |
|
|
(10,009 |
) |
|
|
(35,526 |
) |
|
|
24 |
|
|
Income (loss) from discontinued operations |
|
|
4,112 |
|
|
|
27,004 |
|
|
|
38,473 |
|
|
|
28,831 |
|
|
(Income) loss from discontinued operations allocated to noncontrolling interests |
|
|
(2,068 |
) |
|
|
(23,527 |
) |
|
|
(28,375 |
) |
|
|
(23,528 |
) |
|
Income (loss) from discontinued operations allocable to common shares |
|
|
2,044 |
|
|
|
3,477 |
|
|
|
10,098 |
|
|
|
5,303 |
|
|
Net income (loss) allocable to common shares |
|
$ |
(4 |
) |
|
$ |
(6,532 |
) |
|
$ |
(25,428 |
) |
|
$ |
5,327 |
|
|
Weighted-average shares outstanding—Basic |
|
|
91,201,784 |
|
|
|
87,110,958 |
|
|
|
91,137,041 |
|
|
|
83,799,244 |
|
|
Dilutive securities |
|
|
— |
|
|
|
— |
|
|
|
— |
|
|
|
1,846,365 |
|
|
Weighted-average shares outstanding—Diluted |
|
|
91,201,784 |
|
|
|
87,110,958 |
|
|
|
91,137,041 |
|
|
|
85,645,609 |
|
|
Earnings (loss) per share—Basic: |
|
|
|
|
|
|
|
|
|
|
|
|
|
|
|
|
|
Continuing operations |
|
$ |
(0.02 |
) |
|
$ |
(0.11 |
) |
|
$ |
(0.39 |
) |
|
$ |
- |
|
|
Discontinued operations |
|
|
0.02 |
|
|
|
0.04 |
|
|
|
0.11 |
|
|
|
0.06 |
|
|
Earnings (loss) per share—Basic |
|
$ |
— |
|
|
$ |
(0.07 |
) |
|
$ |
(0.28 |
) |
|
$ |
0.06 |
|
|
Earnings (loss) per share—Diluted: |
|
|
|
|
|
|
|
|
|
|
|
|
|
|
|
|
|
Continuing operations |
|
$ |
(0.02 |
) |
|
$ |
(0.11 |
) |
|
$ |
(0.39 |
) |
|
$ |
- |
|
|
Discontinued operations |
|
|
0.02 |
|
|
|
0.04 |
|
|
|
0.11 |
|
|
|
0.06 |
|
|
Earnings (loss) per share—Diluted |
|
$ |
— |
|
|
$ |
(0.07 |
) |
|
$ |
(0.28 |
) |
|
$ |
0.06 |
|
For the three and nine months ended September 30, 2016, securities convertible into 26,648,284 and 26,449,861 common shares, respectively, were excluded from the earnings (loss) per share computations because their effect would have been anti-dilutive. For the three and nine months ended September 30, 2015, securities convertible into 21,143,824 and 20,720,300 common shares, respectively, were excluded from the earnings (loss) per share computations because their effect would have been anti-dilutive.
NOTE 12: RELATED PARTY TRANSACTIONS
In the ordinary course of our business operations, we have ongoing relationships and have engaged in transactions with the related entities described below. All of these relationships and transactions were approved or ratified by our audit committee as being on terms comparable to those available on an arm’s-length basis from an unaffiliated third party or otherwise not creating a conflict of interest.
Andrew M. Silberstein serves as a trustee on our board of trustees, as designated pursuant to the purchase agreement. Mr. Silberstein is an equity owner of Almanac and an officer of the investor and holds indirect equity interests in the investor. The transactions pursuant to the purchase agreement are described above in Note 9.
As discussed in Note 17: Subsequent Events, we deconsolidated IRT from our consolidated financial statements as of October 5, 2016. As a result, the IRT management internalization as described in Note 1: The Company, which will occur no earlier than December 20, 2016 will be a related party transaction.
40
RAIT Financial Trust
Notes to Consolidated Financial Statements
As of September 30, 2016
(Unaudited and dollars in thousands, except share and per share amounts)
NOTE 13: SUPPLEMENTAL DISCLOSURE TO STATEMENT OF CASH FLOWS
The following are supplemental disclosures to the statements of cash flows for the nine months ended September 30, 2016 and 2015:
|
|
|
For the Nine Months Ended September 30, |
|
|||||
|
|
|
2016 |
|
|
2015 |
|
||
|
Cash paid for interest |
|
$ |
79,848 |
|
|
$ |
51,839 |
|
|
Cash paid (refunds received) for taxes |
|
|
311 |
|
|
|
283 |
|
|
Non-cash increase (decrease) in investments in real estate, intangible assets and other liabilities from conversion of loans |
|
|
(1,499 |
) |
|
|
— |
|
|
Non-cash increase (decrease) in indebtedness from the assumption of debt from property acquisitions |
|
|
— |
|
|
|
121,885 |
|
For a discussion of the non-cash decrease in investments in real estate, intangible assets and other liabilities that occurred during the nine months ended September 30, 2016, see Note 4.
NOTE 14: SEGMENT REPORTING
As a group, our executive officers act as the Chief Operating Decision Maker (“CODM”). The CODM reviews operating results of our reportable segments to make decisions about investments and resources and to assess performance for each of these reportable segments.
Historically, we have conducted our business through the following reportable segments:
|
|
• |
Our real estate lending, owning and managing segment concentrates on lending, owning and managing commercial real estate assets throughout the United States. The form of our investment may range from first mortgage loans to equity ownership of a commercial real estate property. We manage our investments internally through our asset management and property management professionals. |
|
|
• |
Our IRT segment concentrates on the ownership of apartment properties in opportunistic markets throughout the United States. |
As discussed in Note 16: Discontinued Operations, as of September 30, 2016, IRT is a discontinued operation. As a result, we only have one reportable segment that relates to our continuing operations.
NOTE 15: COMMITMENTS AND CONTINGENCIES
We are involved from time to time in litigation on various matters, including disputes with tenants of owned properties, disputes arising out of agreements to purchase or sell properties and disputes arising out of our loan portfolio. Given the nature of our business activities, these lawsuits are considered routine to the conduct of our business. The result of any particular lawsuit cannot be predicted, because of the very nature of litigation, the litigation process and its adversarial nature, and the jury system. We do not expect that the liabilities, if any, that may ultimately result from such routine legal actions will have a material adverse effect on our consolidated financial position, results of operations or cash flows.
On November 23, 2015, a shareholders’ derivative action, or the action, captioned Lobins v. Brown, et al., was filed in the Court of Common Pleas of Philadelphia County, or the court, (Civil Case No. 151103347) naming RAIT, as nominal defendant, and certain of our current and former executive officers and trustees as defendants, or the individual defendants. The complaint in the action alleged that the individual defendants breached their fiduciary duties in connection with certain restructuring fees paid to TCM. These restructuring fees were the subject of the investigation by the staff of the SEC, the settlement of which was concluded on September 3, 2015. The parties reached a settlement in the action consisting of our adoption of additions to our Trust Governance Guidelines and the creation of a Board-level Risk Management Committee. On June 29, 2016, the court entered an order granting final approval of the settlement, which resolves the issues raised in the action and dismisses the action.
NOTE 16: DISCONTINUED OPERATIONS
41
RAIT Financial Trust
Notes to Consolidated Financial Statements
As of September 30, 2016
(Unaudited and dollars in thousands, except share and per share amounts)
As discussed in Note 1: The Company, the IRT internalization agreement was entered into on September 27, 2016 which provides for us to sell: i) the IRT advisor, which is a subsidiary of ours; ii) certain assets and the assumption of certain liabilities relating to our multifamily property management business; and iii) up to all of the 7,269,719 shares of IRT’s common stock that we own. The closing of the IRT management internalization is expected to occur in December of 2016, subject to the condition of the internalization agreement that it will occur no earlier than December 20, 2016.
As the IRT internalization agreement results in our probable disposal of our investment in IRT, our advisory agreement with IRT and our multifamily property management business as well as a strategic shift in our operations and financial results, we determined that these entities or distinguishable components of RAIT should be reported as discontinued operations as of September 30, 2016. As discussed in Note 14: Segment Reporting, IRT was part of our IRT segment. The IRT advisor and our multifamily property management business were parts of our real estate lending, owning and managing segment.
The table below presents the total assets and the total liabilities of these entities or distinguishable components of RAIT that are discontinued operations as of September 30, 2016 and December 31, 2015:
|
|
|
As of September 30, 2016 |
|
|
As of December 31, 2015 |
|
|
||
|
Assets |
|
|
|
|
|
|
|
|
|
|
Investments in real estate, net |
|
$ |
1,263,901 |
|
|
$ |
1,332,377 |
|
|
|
Cash and cash equivalents |
|
|
29,400 |
|
|
|
38,305 |
|
|
|
Restricted cash |
|
|
8,028 |
|
|
|
5,413 |
|
|
|
Other assets |
|
|
5,203 |
|
|
|
3,641 |
|
|
|
Intangible assets, net |
|
|
- |
|
|
|
3,811 |
|
|
|
Total assets of discontinued operations |
|
$ |
1,306,532 |
|
|
$ |
1,383,547 |
|
|
|
Liabilities |
|
|
|
|
|
|
|
|
|
|
Indebtedness, net |
|
$ |
880,643 |
|
|
$ |
928,607 |
|
|
|
Accrued interest payable |
|
|
830 |
|
|
|
1,239 |
|
|
|
Accounts payable and accrued expenses |
|
|
18,627 |
|
|
|
17,115 |
|
|
|
Derivative liabilities |
|
|
696 |
|
|
|
— |
|
|
|
Deferred taxes, borrowers’ escrows and other liabilities |
|
|
5,429 |
|
|
|
5,569 |
|
|
|
Total liabilities of discontinued operations |
|
$ |
906,225 |
|
|
$ |
952,530 |
|
|
42
RAIT Financial Trust
Notes to Consolidated Financial Statements
As of September 30, 2016
(Unaudited and dollars in thousands, except share and per share amounts)
The table below presents the statements of operations of these entities or distinguishable components of RAIT that are discontinued operations for the three and nine months ended September 30, 2016 and 2015:
|
|
|
For the Three Months Ended September 30, |
|
|
For the Nine Months Ended September 30, |
|
|
||||||||||
|
|
|
2016 |
|
|
2015 |
|
|
2016 |
|
|
2015 |
|
|
||||
|
Revenue: |
|
|
|
|
|
|
|
|
|
|
|
|
|
|
|
|
|
|
Property income |
|
|
38,353 |
|
|
|
25,491 |
|
|
|
115,252 |
|
|
|
69,866 |
|
|
|
Fee and other income |
|
|
661 |
|
|
|
768 |
|
|
|
2,260 |
|
|
|
1,768 |
|
|
|
Total revenue |
|
|
39,014 |
|
|
|
26,259 |
|
|
|
117,512 |
|
|
|
71,634 |
|
|
|
Expenses: |
|
|
|
|
|
|
|
|
|
|
|
|
|
|
|
|
|
|
Interest expense |
|
|
8,820 |
|
|
|
4,851 |
|
|
|
27,454 |
|
|
|
12,671 |
|
|
|
Real estate operating expense |
|
|
16,107 |
|
|
|
11,090 |
|
|
|
47,588 |
|
|
|
30,184 |
|
|
|
Compensation expense |
|
|
1,861 |
|
|
|
1,820 |
|
|
|
6,037 |
|
|
|
4,892 |
|
|
|
General and administrative expense |
|
|
949 |
|
|
|
721 |
|
|
|
3,298 |
|
|
|
2,192 |
|
|
|
Acquisition expense |
|
|
19 |
|
|
|
12,523 |
|
|
|
37 |
|
|
|
12,724 |
|
|
|
Depreciation and amortization expense |
|
|
7,784 |
|
|
|
4,772 |
|
|
|
27,059 |
|
|
|
16,663 |
|
|
|
Total expenses |
|
|
35,540 |
|
|
|
35,777 |
|
|
|
111,473 |
|
|
|
79,326 |
|
|
|
Operating (Loss) Income |
|
|
3,474 |
|
|
|
(9,518 |
) |
|
|
6,039 |
|
|
|
(7,692 |
) |
|
|
Interest and other income (expense), net |
|
|
(2 |
) |
|
|
18 |
|
|
|
(2 |
) |
|
|
19 |
|
|
|
Gains (losses) on assets |
|
|
(1 |
) |
|
|
— |
|
|
|
32,262 |
|
|
|
— |
|
|
|
Gain (loss) on IRT merger with TSRE |
|
|
641 |
|
|
|
64,012 |
|
|
|
732 |
|
|
|
64,012 |
|
|
|
TSRE financing extinguishment and employee separation expenses |
|
|
— |
|
|
|
(27,508 |
) |
|
|
— |
|
|
|
(27,508 |
) |
|
|
Gains (losses) on extinguishments of debt |
|
|
— |
|
|
|
— |
|
|
|
(558 |
) |
|
|
— |
|
|
|
Net income (loss) from discontinued operations |
|
$ |
4,112 |
|
|
$ |
27,004 |
|
|
$ |
38,473 |
|
|
$ |
28,831 |
|
|
The table below summarizes the cash flows provided by operating, financing and investing activities of these entities or distinguishable components of RAIT that are discontinued operations for the nine months ended September 30, 2016 and 2015
|
|
|
For the Nine Months Ended September 30, |
|
|||||
|
|
|
2016 |
|
|
2015 |
|
||
|
Cash flow from operating activities from discontinued operations |
|
$ |
32,993 |
|
|
$ |
4,972 |
|
|
Cash flow from investing activities from discontinued operations |
|
|
29,522 |
|
|
|
(169,605 |
) |
|
Cash flow from financing activities from discontinued operations |
|
|
(71,420 |
) |
|
|
166,814 |
|
|
Net change in cash and cash equivalents from discontinued operations |
|
|
(8,905 |
) |
|
|
2,181 |
|
|
Cash and cash equivalents at beginning of period - discontinued operations |
|
|
38,305 |
|
|
|
14,763 |
|
|
Cash and cash equivalents at end of period - discontinued operations |
|
$ |
29,400 |
|
|
$ |
16,944 |
|
43
RAIT Financial Trust
Notes to Consolidated Financial Statements
As of September 30, 2016
(Unaudited and dollars in thousands, except share and per share amounts)
NOTE 17: SUBSEQUENT EVENTS
On October 5, 2016, the IRT stock repurchase closed and we sold 7,269,719 shares of IRT’s common stock to IRT at a price of $8.55 per share. This price was equal to the price to the public in IRT’s October 2016 public offering of its common stock less underwriting discounts or commissions. These shares represented all of the IRT common stock we owned. We received $62,156 of proceeds from the IRT stock repurchase.
On October 5, 2016, we used $43,703 of the proceeds of the IRT stock repurchase to repay indebtedness which was collateralized by the IRT shares.
As a result of the IRT stock repurchase on October 5, 2016, we no longer held any variable interests in IRT. As a result, we concluded that we were not the primary beneficiary of IRT and deconsolidated IRT from our consolidated financial statements as of October 5, 2016.
44
Forward-Looking Statements
In addition to historical information, this discussion and analysis contains forward-looking statements. These statements can be identified by the use of forward-looking terminology including “may,” “believe,” “will,” “expect,” “anticipate,” “estimate,” “seek,” “continue” or similar words. These forward-looking statements are subject to risks and uncertainties that could cause actual results to differ materially from those projected in the forward-looking statements. These risks and uncertainties include, without limitation, those set forth in our filings with the Securities and Exchange Commission, including those described in the “Forward Looking Statements” and “Risk Factors” sections of our Annual Report on Form 10-K for the year ended December 31, 2015 and in this quarterly report on Form 10-Q; that we cannot assure you that we will be able to successfully implement the property sales program or achieve the expected results described in the Overview below; and whether we will be able to sell any of the properties identified as marketed for sale or as part of our previously disclosed capital recycling and debt reduction plan and what the terms and effects of any such sales will be referenced in the Securitization Summary below. Readers are cautioned not to place undue reliance on these forward-looking statements, which reflect management’s analysis only as of the date hereof. We undertake no obligation to publicly revise or update these forward-looking statements to reflect events or circumstances that arise after the date of this report, except as may be required by applicable law.
Overview
We are a multi-strategy commercial real estate company that is a self-managed and self-advised Maryland real estate investment trust, or REIT. We have used our vertically integrated platform to originate commercial real estate loans, acquire commercial real estate properties and invest in, manage and service commercial real estate assets. As described below, we are seeking to simplify our platform to focus on our higher-yielding lending business, which offers a comprehensive set of debt financing options to the commercial real estate industry. While we implement this simplification, we continue to own and manage a portfolio of commercial real estate properties and manage real estate assets for third parties which blends the higher-yielding lending business with the stability and recurring income stream from owning and managing properties.
In order to take advantage of market opportunities in the future, and to maximize shareholder value over time, we will continue to focus on:
|
|
• |
simplifying our platform to focus on our higher-yielding lending business; |
|
|
• |
identifying opportunities to generate gains and liquidity through the sale of commercial real estate properties; |
|
|
• |
maintaining and expanding our sources of liquidity; and |
|
|
• |
managing our leverage to seek to provide attractive risk-adjusted returns for our shareholders. |
During the quarter ended September 30, 2016, we continued taking steps to simplify our business through the sale of non-core assets to focus on our commercial real estate lending platform. One significant step we took was entering into the IRT internalization agreement which will monetize RAIT’s investment in IRT, enabling us to deconsolidate IRT from our financial statements and allows IRT to internalize its management. As described below under “Independence Realty Trust, Inc.,” we expect the steps and transactions contemplated by the IRT internalization to result in changes in our management and may affect our GAAP and Non-GAAP financial measures and operating metrics. As described below, on October 5, 2016, IRT repurchased all of our shares of IRT common stock pursuant to the IRT internalization agreement and we received gross proceeds of approximately $62.2 million and used approximately $43.7 million of those proceeds to repay indebtedness which had been collateralized by our shares of IRT common stock. The IRT stock repurchase also resulted in the deconsolidation of IRT as of October 5, 2016. We expect to complete the IRT internalization transferring the IRT advisor and identified assets of RAIT Residential to IRT for a purchase price of $43.0 million in December 2016, subject to the terms and conditions of the IRT internalization agreement. As a result of the IRT internalization, IRT, the IRT advisor and the property management business of RAIT Residential were presented as discontinued operations in our financial statements as of September 30, 2016. We expect to recognize a gain upon the closing of the IRT internalization as the consideration received is expected to exceed the net assets recognized on our balance sheet that will be transferred. We expect to redeploy the net proceeds from the internalization into our core commercial real estate lending activities with the goal of expanding those activities and taking advantage of opportunities to strengthen and reinforce our market positions and balance sheet.
We also continue to simplify our business through opportunistic property sales and expense reductions. We expect that, in the near term, selling assets may have a negative impact on our net income and CAD as we de-lever the balance sheet, right-size the company and take time to reinvest capital. With respect to property sales during the nine months ended September 30, 2016, we have sold 12 properties totaling $192 million generating $24 million of GAAP gains and net proceeds of $15.1 million after repaying indebtedness associated with these properties. In addition, we have identified 12 properties for sale which have an aggregate carrying value of $192.9 million. These properties are under contract and we expect to sell them during the fourth quarter of 2016 which
45
should generate approximately $40 million of GAAP gains and $24 million of net proceeds after repaying indebtedness associated with these properties. We also incurred $18.9 million of asset impairments in the quarter ended September 30, 2016, including $8.9 million of asset impairments on three real estate assets that we expect to sell in the fourth quarter of 2016 and $10.0 million associated with a portfolio of ten of our industrial properties. Our exposure to this industrial portfolio began with a mezzanine loan originated in 2006 which we converted to real estate owned in late 2015. During the quarter ended September 30, 2016, we decided not to invest additional capital that would not meet our return objectives into this portfolio and initiated steps to dispose of the portfolio. Overall, we believe our performance with respect to our owned real estate business in the third quarter of 2016 reflected successful implementation of strategies to improve the operating results of our owned properties while we have continued to implement our strategy of recycling capital and reducing leverage by selling appropriate properties.
With respect to our commercial real estate lending business, we are on track to complete our sixth floating rate securitization by the end of 2016. We are seeing an increase in floating rate volume on terms that meet our lending criteria. With respect to our conduit lending business, in response to near term regulatory risk retention requirements and market changes, we are waiting for more stability in the commercial mortgage backed securities, or CMBS, market before committing additional capital to the origination of conduit loans.
Our commercial real estate loans continued to see elevated repayments in the third quarter of 2016 as compared to the third quarter of 2015. Accordingly, our net interest margin, or NIM, from our investments in loans decreased $4.8 million in the third quarter of 2016 from the third quarter of 2015. From a credit perspective, substantially all of our loans originated after the last economic recession continue to perform as expected. However, our non-accrual loans increased by $74.0 million during the quarter ended September 30, 2016, all attributable to a single pre-recession loan to a single borrower. We are in the process of separating the loan into seven individual loans that we believe will provide easier access to the underlying collateral and a structure that incentivizes the borrower to either sell or refinance the properties as expeditiously as possible. We have reserved approximately $2.0 million as of quarter end to cover potential shortfalls related to these loans.
Implementing the strategies described above has contributed to our liquidity and capital resources and reduced our indebtedness. In 2016, we have reduced our indebtedness by $440 million using proceeds from real estate sales and loans repayments. This includes the repayment of $58.6 million of our recourse debt. During the fourth quarter of 2016, we expect to generate $85.3 million of cash from property sales and monetizing our investment in IRT.
Investors should read Management’s Discussion and Analysis of Financial Condition and Results of Operations in our Annual Report on Form 10-K for the fiscal year ended December 31, 2015, or the Annual Report, for a detailed discussion of the following items:
|
|
• |
Trends relating to capital markets. |
|
|
• |
Trends relating to originating and financing conduit loans and bridge loans. |
|
|
• |
Trends relating to investments in real estate. |
|
|
• |
Interest rate environment. |
|
|
• |
Prepayment rates. |
|
|
• |
Commercial real estate performance. |
Our Investment Portfolio
Our consolidated investment portfolio is currently comprised of the following asset classes:
Commercial mortgage loans, mezzanine loans, and preferred equity interests. We originate and own senior long-term conduit mortgage loans, short-term bridge loans, subordinated, or “mezzanine,” financing and preferred equity interests. These assets are in most cases “non-recourse” or limited recourse loans secured by commercial real estate assets or real estate entities. This means that we look primarily to the assets securing the loan for repayment, subject to certain standard exceptions. We originate loans that are eligible to be sold to securitizations issuing CMBS, which we refer to as conduit loans. We may from time to time acquire existing commercial real estate loans from third parties who have originated such loans, including banks, other institutional lenders or third-party investors. Where possible, we seek to maintain direct lending relationships with borrowers, as opposed to investing in loans controlled by third party lenders.
46
The tables below describe certain characteristics of our commercial mortgage loans, mezzanine loans, and preferred equity interests as of September 30, 2016 (dollars in thousands):
|
|
|
Carrying Value |
|
|
Weighted- Average Coupon |
|
|
Range of Maturities |
|
Number of Loans |
|
|||
|
Commercial Real Estate (CRE) Loans |
|
|
|
|
|
|
|
|
|
|
|
|
|
|
|
Commercial mortgage loans |
|
$ |
1,227,830 |
|
|
|
5.7% |
|
|
Oct. 2016 - Dec. 2025 |
|
|
100 |
|
|
Mezzanine loans |
|
|
109,836 |
|
|
|
9.3% |
|
|
Oct. 2016 - Jun. 2027 (1) |
|
|
34 |
|
|
Preferred equity interests |
|
|
36,827 |
|
|
|
7.2% |
|
|
Jan. 2017 - Jan. 2029 |
|
|
14 |
|
|
Total investments in loans |
|
$ |
1,374,493 |
|
|
|
6.0% |
|
|
|
|
|
148 |
|
|
(1) |
Does not include the maturity dates of four loans all of which had maturity dates prior to September 30, 2016 and have been identified as impaired. These loans are 90 days or more past due. |
During the nine months ended September 30, 2016, we originated $89.2 million of CRE loans and received CRE loan repayments of $308.3 million, contributing to a net reduction in our loan portfolio of $251.5 million. We finance our consolidated CRE loans on a long-term basis through securitizations.
The charts below describe the property types and the geographic breakdown of our commercial mortgage loans, mezzanine loans, other loans, and preferred equity interests as of September 30, 2016:
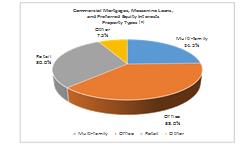
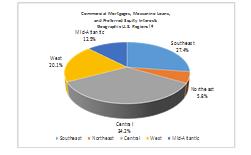
|
(a) |
Based on carrying amount. |
Investments in real estate. We invest in real estate properties, primarily multi-family properties, throughout the United States. We manage substantially all of our properties through our property management subsidiaries. The table below describes certain characteristics of our investments in real estate as of September 30, 2016 (dollars in thousands):
|
|
|
Investments in Real Estate (a) |
|
|
Average Physical Occupancy |
|
|
Units/ Square Feet/ Acres |
|
|
Number of Properties |
|
||||
|
RAIT Multi-family real estate properties |
|
$ |
284,529 |
|
|
|
92.3% |
|
|
|
3,221 |
|
|
|
12 |
|
|
Office real estate properties |
|
|
333,337 |
|
|
|
78.5% |
|
|
|
2,253,564 |
|
|
|
14 |
|
|
Industrial real estate properties |
|
|
93,462 |
|
|
|
70.5% |
|
|
|
1,840,577 |
|
|
|
12 |
|
|
Retail real estate properties |
|
|
123,434 |
|
|
|
72.4% |
|
|
|
1,378,171 |
|
|
|
5 |
|
|
Redevelopment real estate properties |
|
|
80,042 |
|
|
|
39.8% |
|
|
|
1,206,514 |
|
|
|
2 |
|
|
Parcels of land |
|
|
50,558 |
|
|
N/A |
|
|
|
13.7 |
|
|
|
7 |
|
|
|
Total |
|
$ |
965,362 |
|
|
|
— |
|
|
|
|
|
|
|
52 |
|
|
(a) |
Based on properties owned as of September 30, 2016. |
47
The charts below describe the property types and the geographic breakdown of our investments in real estate as of September 30, 2016:
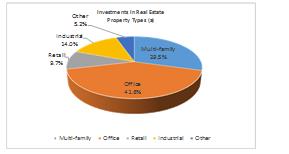
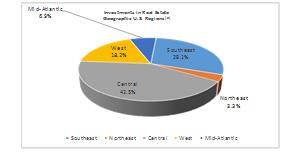
|
(a) |
Based on book value. |
Securitization Summary
Overview. We have used securitizations to match fund the interest rates and maturities of our assets with the interest rates and maturities of the related financing. This strategy has helped us reduce interest rate and funding risks on our loan portfolios for the long-term. A securitization is a structure in which multiple classes of debt and equity are issued by a special purpose entity to finance a portfolio of assets. Cash flow from the portfolio of assets is used to repay the securitization liabilities sequentially, in order of seniority. The most senior classes of debt typically have credit ratings of “AAA” through “BBB–” and therefore can be issued at yields that are lower than the average yield of the loans collateralizing the securitization. The debt tranches are typically rated based on portfolio quality, diversification and structural subordination. The equity securities issued by the securitization are the “first loss” piece of the capital structure, but they are entitled to all residual amounts available for payment after the obligations to the debt holders have been satisfied. Our retained interests described below included in our investments in our consolidated securitizations are typically in such “first loss” position. Historically, the stated maturity of the debt issued by a securitization we have sponsored and consolidated has been between 15 and 17 years. However, we expect the weighted average life of such debt to be shorter than the stated maturity due to the financial condition of the borrowers on the underlying loans and the characteristics of such loans, including the existence and frequency of exercise of any permitted prepayment, the prevailing level of interest rates, the actual default rate and the actual level of any recoveries on any defaulted loans. Debt issued by these securitizations is non-recourse to us and payable solely from the payments by the borrowers on the loans collateralizing these securitizations. These assets are in most cases “non-recourse” or limited recourse loans secured by commercial real estate assets or real estate entities. This means that we look primarily to the assets securing the loan for repayment, subject to certain standard exceptions.
As of September 30, 2016, we have sponsored five securitizations with varying amounts of retained or residual interests held by us which we consolidate in our financial statements as follows: RAIT I, RAIT II, RAIT 2014-FL3 Trust, or RAIT FL3, RAIT 2014-FL4 Trust, or RAIT FL4, and RAIT 2015-FL5, or RAIT FL5. We refer to RAIT FL2, RAIT FL3 and RAIT FL4 and RAIT FL5 as the FL securitizations. We exercised our rights and unwound a sixth and seventh securitization we had sponsored, RAIT 2013-FL1 Trust, or RAIT FL1, in 2015 and RAIT 2014-FL2 Trust, or RAIT FL2, in the third quarter of 2016. The assets and liabilities of these securitizations are presented at amortized cost in our consolidated financial statements. We originated substantially all of the loans collateralizing RAIT I, RAIT II and the FL securitizations. We serve as the collateral manager, servicer and special servicer on RAIT I and RAIT II and as servicer and special servicer for each of the FL securitizations.
Over time, our returns on and cash flows from our retained interests in our securitizations generally decrease as the senior classes of debt bearing relatively lower interest rates are paid down by collateral pool payments and other proceeds leaving more junior classes of debt bearing relatively higher interest rates on the smaller collateral pool. As a result, we continue to evaluate strategies to manage the returns on our capital allocated to our retained interests in each of our securitizations consistent with our rights and obligations under our securitizations and relevant market conditions, which may include, without limitation, unwinding a securitization and rolling the remaining collateral over to a new securitization and may involve, where applicable, selling our properties securing loans included in the collateral pool and repaying such loans.
Securitization Performance. RAIT I and RAIT II contain interest coverage triggers, or IC triggers, and over collateralization triggers, or OC triggers, which must be met in order for us to receive our subordinated management fees and our lower-rated debt or residual equity returns. If the IC triggers or OC triggers are not met in a given period, then the cash flows are redirected from lower rated tranches and used to repay the principal amounts to the senior tranches of CDO notes payable. These conditions and the re-direction of cash flow continue until the triggers are met by curing the underlying payment defaults, paying down the CDO notes
48
payable or other actions permitted under the relevant securitization indenture. As of the most recent payment information, all applicable IC triggers and OC triggers are being met for our two commercial real estate securitizations, RAIT I and RAIT II, and we continue to receive all of our management fees, interest and residual returns from these securitizations. The FL securitizations do not have IC triggers and OC triggers.
Repayment of the loans collateralizing RAIT I and RAIT II outside their contractual maturities have increased during 2016, and we expect it to continue to increase in the remainder of 2016 through 2019. In addition, we are currently marketing twelve properties for sale with an aggregate net book value of $192.9 million at September 30, 2016. The related indebtedness of these properties is expected to be repaid with the proceeds of any sales, which primarily includes paying down the most senior notes outstanding issued by RAIT I and RAIT II, as applicable. We continue to evaluate our real estate portfolio with regards to identifying other possible properties to sell as part of our previously disclosed capital recycling and debt reduction plan. Because we own properties that are financed, in part, by loans collateralizing RAIT I and RAIT II, sales of our properties could result in a significant reduction of our securitization notes payable. These repayments have reduced our returns from these securitizations and we expect future repayments to continue to reduce these returns. We continue to evaluate alternative strategies seeking to replace these returns.
If the CDO notes issued by RAIT I and RAIT II have not been redeemed in full prior to the distribution date occurring in February 2017, in the case of RAIT I, and June 2017, in the case of RAIT II, then an auction of the collateral assets of RAIT I or RAIT II, as relevant, will be conducted by the relevant trustee periodically thereafter and, if certain conditions set forth in the relevant indenture are satisfied, such collateral assets will be sold at the auction and the relevant CDO notes will be redeemed, in whole, but not in part, on such distribution date. The initial auction for RAIT I was held in November 2016 but no sale occurred as no bids were received.
A summary of the investments in our consolidated securitizations as of the most recent payment information is as follows:
|
|
• |
RAIT I—RAIT I has $676.2 million of total collateral at par value, of which $52.4 million is defaulted. The current overcollateralization, or OC, test is passing at 132.0% with an OC trigger of 116.2%. We currently own $46.1 million of the securities that were originally rated investment grade and $200.0 million of the non-investment grade securities issued by this securitization. We are currently receiving all distributions required by the terms of our retained interests in this securitization and are receiving all of our collateral management fees. We pledged $28.4 million of the securities we own issued by RAIT I as collateral for a senior secured note we issued. |
|
|
• |
RAIT II—RAIT II has $509.0 million of total collateral at par value, of which $19.5 million is defaulted. The current OC test is passing at 128.2% with an OC trigger of 111.7%. We currently own $92.8 million of the securities that were originally rated investment grade and $140.7 million of the non-investment grade securities issued by this securitization. We are currently receiving all distributions required by the terms of our retained interests in this securitization and are receiving all of our collateral management fees. We pledged $51.1 million of the securities we own issued by RAIT II as collateral for a senior secured note we issued. |
|
|
• |
RAIT FL2—During the third quarter of 2016, RAIT exercised its right to unwind RAIT 2014-FL2 Trust, or RAIT FL2, and repaid the outstanding notes. We refinanced the $100 million of remaining loans through our warehouse financing arrangement. Loan repayments in RAIT FL2 decreased the efficiency of the securitization and by unwinding this securitization, we increased our returns on our remaining assets. We are evaluating whether to re-securitize the remaining loans in our future FL securitizations. |
|
|
• |
RAIT FL3—RAIT FL3 has $115.9 million of total collateral at par value, of which there is no collateral that is in default. RAIT FL3 does not have OC triggers or IC triggers. RAIT FL3, has classes of investment grade senior notes with an aggregate principal balance outstanding of approximately $78.5 million to investors. We currently own the unrated classes of junior notes, including a class with an aggregate principal balance of $37.4 million, and the equity, or the retained interests, of RAIT FL3. |
|
|
• |
RAIT FL4—RAIT FL4 has $155.9 million of total collateral at par value, of which there is no collateral that is in default. RAIT FL4 does not have OC triggers or IC triggers. RAIT FL4, has classes of investment grade senior notes with an aggregate principal balance outstanding of approximately $114.5 million to investors. We currently own the unrated classes of junior notes, including a class with an aggregate principal balance of $41.4 million, and the equity, or the retained interests, of RAIT FL4. |
|
|
• |
RAIT FL5—RAIT FL5 has $346.7 million of total collateral at par value, of which there is no collateral that is in default. RAIT FL5 does not have OC triggers or IC triggers. RAIT FL5, has classes of investment grade senior notes with an aggregate principal balance outstanding of approximately $285.9 million to investors. A venture, in which we have retained a 60% interest, owns the unrated classes of junior notes and the equity, or the retained interests, of RAIT FL5. The unrated classes of junior notes have an aggregate principal balance of $60.8 million. |
49
Independence Realty Trust, Inc.
As of September 30, 2016, we held 7,269,719 shares of IRT common stock, representing 15.4% percent of the outstanding shares of IRT common stock and we externally advised IRT through our subsidiary, the IRT advisor. We consolidated IRT in our financial results as of September 30, 2016. For the nine months ended September 30, 2016, we earned $5.5 million of fees from IRT under the advisory agreement with IRT and received $3.9 million of distributions declared on our IRT common stock, both of which are eliminated in consolidation.
As described below under “IRT Management Internalization,” we sold all 7,269,719 shares to IRT on October 5, 2016 in connection with the IRT management internalization. As a result of the IRT stock repurchase, we deconsolidated IRT as of October 5, 2016 and we presented IRT as a discontinued operation in our financial statements as of September 30, 2016.
IRT Management Internalization
On September 27, 2016, we entered into a securities and asset purchase agreement, or the IRT internalization agreement, with IRT, pursuant to which IRT will complete a management internalization and separation from us. The IRT management internalization consists of two parts: (i) the acquisition of Independence Realty Advisors, LLC, or the IRT advisor, which is our subsidiary and IRT’s external advisor, and (ii) the acquisition of certain assets and the assumption of certain liabilities relating to our multifamily property management business which we refer to as RAIT Residential, including property management contracts relating to apartment properties owned by ourselves, IRT, and third parties. The purchase price to be paid by IRT for the IRT management internalization is $43.0 million, subject to certain pro rations at closing. The IRT internalization agreement also provided for IRT to repurchase all of the 7,269,719 shares of IRT’s common stock, or the IRT purchased shares, owned by certain of our subsidiaries.
On October 5, 2016, IRT used approximately $62.2 million of the proceeds from an underwritten offering, or the IRT October 2016 offering, of IRT common stock to repurchase the IRT purchased shares, from certain of RAIT’s subsidiaries at a purchase price of $8.55 per share. This price was equal to the price to the public in the IRT October 2016 offering less underwriting discounts or commissions. The IRT purchased shares represented all of the shares of IRT common stock owned by RAIT and its subsidiaries. As a result of the IRT stock repurchase, RAIT determined that it no longer is the primary beneficiary of IRT, and as a result, RAIT deconsolidated IRT as of October 5, 2016. RAIT used approximately $43.7 million of the proceeds of the IRT stock repurchase to repay indebtedness which was collateralized by the IRT purchased shares.
The IRT internalization agreement provides that the IRT management internalization will occur, subject to the terms and conditions contained therein, no earlier than December 20, 2016 and we expect it to occur by December 31, 2016. As required by the IRT internalization agreement, IRT reported that it reserved $43.0 million in net proceeds from the IRT October 2016 offering to consummate this transaction.
RAIT Management Changes Resulting From IRT Management Internalization
Upon closing of the IRT management internalization, Scott F. Schaeffer, RAIT’s chief executive officer, or CEO, is expected to terminate his employment with RAIT and enter into an employment agreement with IRT. Scott L. N. Davidson, currently RAIT’s president, is expected to be elevated to the office of CEO of RAIT upon the closing of the IRT management internalization. James J. Sebra, RAIT’s chief financial officer, or CFO, is expected to enter into an employment agreement with IRT upon the closing of the IRT management internalization. Mr. Sebra is also expected to remain RAIT’s CFO until the later to occur of March 31, 2017 or the filing of RAIT’s Form 10-K for the fiscal year ending December 31, 2016 with the SEC. In addition, more than 400 current employees of RAIT and RAIT Residential are expected to become employees of IRT. The IRT management internalization is conditioned upon, among other things, customary closing conditions including obtaining identified third party consents.
RAIT has entered into memorandums of understanding, or MOUs, with each of Mr. Schaeffer and Mr. Sebra setting forth the terms of each executive’s expected resignation from RAIT and an employment agreement with Mr. Davidson setting forth the terms of his expected employment as RAIT’s CEO. The obligations set forth in each MOU are contingent upon the second closing under the IRT management internalization agreement.
Pursuant to the terms of Mr. Schaeffer’s MOU, as discussed above, as of the closing of the IRT management internalization, he will resign from his position as CEO. Mr. Schaeffer will receive a cash payment of $500,000 and a share award under the 2012 plan of 150,000 shares of RAIT’s common shares of beneficial interest, or common shares. The share award may be granted in one or more separate awards in amounts to be determined by RAIT’s compensation committee of the board of trustees, or the compensation committee. Half of the shares granted to Mr. Schaeffer pursuant to this award will vest six months after the date of grant. The remaining half of the shares will vest one year after the date of grant. Upon his resignation, Mr. Schaeffer will enter into a one year consulting agreement with RAIT. Mr. Schaeffer’s incentive compensation award for 2016, if any, will be determined and awarded by the compensation committee in a manner consistent with RAIT’s past practices for granting such awards. All equity awards that Mr. Schaeffer currently holds will continue to vest in accordance with the vesting schedule applicable to each award. Mr. Schaeffer and RAIT will also sign a mutual release of claims releasing each other from their obligations under his existing employment agreement,
50
and releasing each other from any and all claims arising out of or with respect to his employment by RAIT or the termination thereof. Effective October 18, 2016, Mr. Schaeffer resigned from his position as chairman of the board of trustees and will remain a trustee until this closing when he will resign from the board of trustees. Michael M. Malter, an independent trustee already serving on the board of trustees, was elected to replace Mr. Schaeffer as chairman of the board.
Pursuant to the terms of Mr. Davidson’s MOU, as discussed above, as of the closing of the IRT management internalization, he will be elevated to the position of CEO of RAIT and will join the board of trustees. Mr. Davidson also entered into a new employment agreement on November 1, 2016 which will govern his employment as RAIT’s CEO and take effect at the closing of the IRT management internalization. Mr. Davidson will receive a one-time cash payment of $1,350,000 and a share award under the 2012 plan of an aggregate of 600,000 shares of RAIT’s common shares of beneficial interest, or the SD share award. The SD share award may be granted in one or more separate awards in amounts to be determined by the compensation committee order to comply with the terms and conditions of the 2012 plan, provided that in no event shall the total number of shares awarded exceed 600,000. Fifty percent of the shares granted pursuant to the SD share award will vest on the second anniversary of the closing of the IRT management internalization, regardless of the date granted. The remaining fifty percent of the shares granted pursuant to the SD share award will vest on the third anniversary of the closing of the IRT management internalization, regardless of the date granted. Further, Mr. Davidson’s MOU provides that the board of trustees expects that Mr. Davidson’s discretionary performance compensation for 2016 will be paid at the maximum target level. In addition, for the purpose of determining Mr. Davidson’s 2017 performance compensation award, cash available for distribution goals for 2017, as established by the compensation committee, shall be adjusted to account for payments made to Mr. Schaeffer and Mr. Sebra as part of the terms of their separation from RAIT as a result of the IRT management internalization.
Pursuant to the terms of Mr. Sebra’s MOU, as discussed above, he will remain in his current position as CFO of RAIT until the later to occur of March 31, 2017 or the filing of RAIT’s Form 10-K for the fiscal year ending December 31, 2016 with the SEC (the “Resignation Date”), at which time Mr. Sebra will resign from his position as CFO of RAIT. In the event the Company hires a new CFO, Mr. Sebra may resign prior to the Resignation Date, provided, however, that any early resignation shall be at the option and in the sole discretion of the Company. Mr. Sebra’s incentive compensation award for 2016, if any, will be determined and awarded by the compensation committee in a manner consistent with RAIT’s past practices for granting such awards. Should Mr. Sebra remain employed by RAIT after December 31, 2016, he will continue to be paid his current base salary. He will also receive a fixed cash bonus equal to the portion of his 2016 cash bonus, if any, prorated based on the period that he was employed by the Company during 2017. All equity awards that Mr. Sebra currently holds will continue to vest in accordance with the vesting schedule applicable to each award. Mr. Sebra and RAIT will also sign a mutual release of claims releasing each other from their obligations under his existing employment agreement, and releasing each other from any and all claims arising out of or with respect to his employment by RAIT or the termination thereof.
Pursuant to the terms of the IRT internalization agreement, by the second closing of the IRT management internalization, RAIT and IRT will enter into a shared services agreement, pursuant to which RAIT and IRT will share office space and provide each other certain transitional services such as information technology, human resources, insurance, investor relations, legal, tax and accounting for a six-month transition period after the closing.
Assets Under Management
Assets under management, or AUM, is an operating measure representing the total assets that we own or are managing for third parties. While not all AUM generates fee income, it is an important operating measure to gauge our asset growth, volume of originations, size and scale of our operations and our performance. AUM includes our total investment portfolio and assets associated with unconsolidated securitizations for which we derive asset management fees.
The table below summarizes our AUM as of September 30, 2016 and December 31, 2015 (dollars in thousands):
|
|
|
AUM as of September 30, 2016 |
|
|
AUM as of December 31, 2015 |
|
||
|
Commercial real estate loan portfolio (1) |
|
$ |
2,338,977 |
|
|
$ |
2,772,750 |
|
|
IRT (2) |
|
|
1,316,725 |
|
|
|
1,372,015 |
|
|
Property management (3) |
|
|
1,472,399 |
|
|
|
1,778,836 |
|
|
Total |
|
$ |
5,128,101 |
|
|
$ |
5,923,601 |
|
51
|
commercial real estate portfolio was also comprised of $618.5 million and $885.1 million, respectively, of assets collateralizing our floating rate securitizations. |
|
(2) |
The IRT management internalization, which is expected to occur in December of 2016, will decrease our AUM as IRT will become the manager of its real estate assets as well as our multifamily real estate assets, which is included within the commercial real estate portfolio in the table above. |
|
(3) |
Urban Retail manages 74 properties with 17,397,355 square feet in 28 states as of September 30, 2016. RAIT Residential provides property management services to multifamily properties, including IRT’s properties. |
Results of Operations
Three Months Ended September 30, 2016 Compared to the Three Months Ended September 30, 2015
The following table sets forth information regarding our consolidated results of operations for the three months ended September 30, 2016 and 2015.
|
|
|
For the Three Months Ended September 30, |
|
|||||||||||||
|
|
|
2016 |
|
|
2015 |
|
|
$ Variance |
|
|
% Variance |
|
||||
|
Revenue: |
|
|
|
|
|
|
|
|
|
|
|
|
|
|
|
|
|
Investment interest income |
|
$ |
20,189 |
|
|
$ |
24,468 |
|
|
$ |
(4,279 |
) |
|
|
-17 |
% |
|
Investment interest expense |
|
|
(8,512 |
) |
|
|
(8,021 |
) |
|
|
(491 |
) |
|
|
6 |
% |
|
Net interest margin |
|
|
11,677 |
|
|
|
16,447 |
|
|
|
(4,770 |
) |
|
|
-29 |
% |
|
Property income |
|
|
29,614 |
|
|
|
29,968 |
|
|
|
(354 |
) |
|
|
-1 |
% |
|
Fee and other income |
|
|
1,946 |
|
|
|
2,537 |
|
|
|
(591 |
) |
|
|
-23 |
% |
|
Total revenue |
|
|
43,237 |
|
|
|
48,952 |
|
|
|
(5,715 |
) |
|
|
-12 |
% |
|
Expenses: |
|
|
|
|
|
|
|
|
|
|
|
|
|
|
|
|
|
Interest expense |
|
|
13,298 |
|
|
|
14,723 |
|
|
|
(1,425 |
) |
|
|
-10 |
% |
|
Real estate operating expense |
|
|
14,635 |
|
|
|
14,991 |
|
|
|
(356 |
) |
|
|
-2 |
% |
|
Compensation expense |
|
|
6,245 |
|
|
|
5,541 |
|
|
|
704 |
|
|
|
13 |
% |
|
General and administrative expense |
|
|
3,708 |
|
|
|
3,769 |
|
|
|
(61 |
) |
|
|
-2 |
% |
|
Acquisition expense |
|
|
197 |
|
|
|
153 |
|
|
|
44 |
|
|
|
29 |
% |
|
Provision for loan losses |
|
|
1,533 |
|
|
|
1,850 |
|
|
|
(317 |
) |
|
|
-17 |
% |
|
Depreciation and amortization expense |
|
|
11,466 |
|
|
|
10,482 |
|
|
|
984 |
|
|
|
9 |
% |
|
Total expenses |
|
|
51,082 |
|
|
|
51,509 |
|
|
|
(427 |
) |
|
|
-1 |
% |
|
Operating (Loss) Income |
|
|
(7,845 |
) |
|
|
(2,557 |
) |
|
|
(5,288 |
) |
|
|
207 |
% |
|
Interest and other income (expense), net |
|
|
(70 |
) |
|
|
(398 |
) |
|
|
328 |
|
|
|
-82 |
% |
|
Gains (losses) on assets |
|
|
18,194 |
|
|
|
7,430 |
|
|
|
10,764 |
|
|
|
145 |
% |
|
Gains (losses) on extinguishments of debt |
|
|
(6 |
) |
|
|
- |
|
|
|
(6 |
) |
|
N/M* |
|
|
|
Asset impairment |
|
|
(18,872 |
) |
|
|
(7,250 |
) |
|
|
(11,622 |
) |
|
|
160 |
% |
|
Change in fair value of financial instruments |
|
|
(1,375 |
) |
|
|
620 |
|
|
|
(1,995 |
) |
|
|
-322 |
% |
|
Income (loss) before taxes |
|
|
(9,974 |
) |
|
|
(2,155 |
) |
|
|
(7,819 |
) |
|
|
363 |
% |
|
Income tax benefit (provision) |
|
|
15,302 |
|
|
|
(23 |
) |
|
|
15,325 |
|
|
|
-66630 |
% |
|
Income from continuing operations |
|
|
5,328 |
|
|
|
(2,178 |
) |
|
|
7,506 |
|
|
|
-345 |
% |
|
Discontinued operations: |
|
|
|
|
|
|
|
|
|
|
|
|
|
|
|
|
|
Income (loss) from discontinued operations |
|
|
4,112 |
|
|
|
27,004 |
|
|
|
(22,892 |
) |
|
|
-85 |
% |
|
Net income (loss) |
|
|
9,440 |
|
|
|
24,826 |
|
|
|
(15,386 |
) |
|
|
-62 |
% |
|
(Income) loss allocated to preferred shares |
|
|
(8,715 |
) |
|
|
(8,303 |
) |
|
|
(412 |
) |
|
|
5 |
% |
|
(Income) loss allocated to noncontrolling interests |
|
|
(729 |
) |
|
|
(23,055 |
) |
|
|
22,326 |
|
|
|
-97 |
% |
|
Net income (loss) allocable to common shares |
|
$ |
(4 |
) |
|
$ |
(6,532 |
) |
|
$ |
6,528 |
|
|
|
-100 |
% |
*N/M – Not Meaningful
Revenue
Net interest margin. Net interest margin decreased $4.8 million, or 29%, to $11.7 million for the three months ended September 30, 2016 from $16.5 million for the three months ended September 30, 2015. Investment interest income decreased due to two transactions during the three months ended September 30, 2015 that resulted in $2.8 million of interest income being recognized in that period as well as loan repayments that have occurred since October 1, 2015. Investment interest expense increased $0.5 million
52
due to the RAIT FL5 securitization issued in December 2015 and increases in LIBOR partially offset by a decrease in interest expense due to a reduction in securitization-related indebtedness due to repayments of the underlying loans.
Property income. Property income decreased $0.4 million to $29.6 million for the three months ended September 30, 2016 from $30.0 million for the three months ended September 30, 2015. The decrease is attributable to $5.8 million of property income related to 18 properties disposed of or deconsolidated in or after the three months ended September 30, 2015. The decrease was partially offset by $4.6 million of property income from 15 new properties acquired or consolidated since September 30, 2015, and $0.8 million of property income from improved occupancy and rental rates in 2016 as compared to 2015 in the remaining properties.
Fee and other income. Fee and other income decreased $0.6 million to $1.9 million for the three months ended September 30, 2016 from $2.5 million for the three months ended September 30, 2015. The decrease is primarily attributable to a decrease of $0.6 million of property management fee income due to the timing of leasing commissions and $0.2 million of reduced application fee income from our lending business.
Expenses
Interest expense. Interest expense decreased $1.4 million, or 10%, to $13.3 million for the three months ended September 30, 2016 from $14.7 million for the three months ended September 30, 2015. The decrease is attributable to reductions in recourse debt including $29.2 million of 7% convertible senior notes that were redeemed and $19.6 million of senior notes that was repurchased during the three months ended June 30, 2016.
Real estate operating expense. Real estate operating expense decreased $0.4 million to $14.6 million for the three months ended September 30, 2016 from $15.0 million for the three months ended September 30, 2015. The decrease is attributable to $3.2 million of real estate operating expense related to 18 properties disposed of or deconsolidated in or after the three months ended September 30, 2015. The decrease was partially offset by a $3.0 million increase of real estate operating expenses from 15 properties acquired since September 30, 2015.
Compensation expense. Compensation expense increased $0.7 million to $6.2 million for the three months ended September 30, 2016 from $5.5 million for the three months ended September 30, 2015. This is primarily due to less compensation expense being deferred as direct loan origination costs due to a lower volume of loan originations during 2016. This increase was partially offset by a decrease in stock compensation expense for the three months ended September 30, 2016 as compared to the same period in 2015.
General and administrative expense. General and administrative expense remained consistent for the three months ended September 30, 2016 and for the three months ended September 30, 2015.
Acquisition expense. Acquisition expense remained consistent for the three months ended September 30, 2016 and for the three months ended September 30, 2015.
Provision for loan losses. Provision for loan losses decreased $0.3 million to $1.5 million for the three months ended September 30, 2016 from $1.8 million for the three months ended September 30, 2015.
Depreciation and amortization expense. Depreciation and amortization expense increased $1.0 million to $11.5 million for the three months ended September 30, 2016 from $10.5 million for the three months ended September 30, 2015. The increase is attributable to $2.6 million of depreciation and amortization expense from 15 new properties acquired or consolidated since September 30, 2015. The increase was partially offset by a decrease of $2.2 million of depreciation and amortization expense related to 18 properties disposed or deconsolidated in or after the three months ended September 30, 2015.
Other income (expense)
Gains (losses) on assets. During the three months ended September 30, 2016, four multi-family properties were sold resulting in gains of $18.2 million.
Asset impairment. During the three months ended September 30, 2016, we recognized impairment of $8.9 million on three multi-family properties that are expected to be sold. We also recognized impairment of $10.0 million on ten of our industrial properties because they are expected to be disposed of at a loss before the end of their useful lives. Our exposure to this industrial portfolio began with a mezzanine loan originated in 2006 which we converted to real estate owned in late 2015.
53
Change in fair value of financial instruments. During the three months ended September 30, 2016, the change in fair value of financial instruments decreased our net income by $1.4 million. The fair value adjustments we recorded were as follows (dollars in thousands):
|
Description |
|
For the Three Months Ended September 30, 2016 |
|
|
For the Three Months Ended September 30, 2015 |
|
||
|
Change in fair value of junior subordinated notes |
|
$ |
(735 |
) |
|
$ |
1,673 |
|
|
Change in fair value of derivatives |
|
|
160 |
|
|
|
(644 |
) |
|
Change in fair value of warrants and investor SARs |
|
|
(800 |
) |
|
|
(409 |
) |
|
Change in fair value of financial instruments |
|
$ |
(1,375 |
) |
|
$ |
620 |
|
The changes in the fair value for the CDO notes payable and other liabilities for which the fair value option was elected for the three months ended September 30, 2015 was primarily attributable to changes in instrument specific credit risks. The changes in the fair value of derivatives for the three months ended September 30, 2016 and 2015 was mainly due to changes in interest rates. The change in fair value of the warrants and investor SARs was due to changes in the reference stock price and volatility.
Income tax benefit (provision). During the three months ended September 30, 2016, the income tax benefit was driven by the partial release of a valuation allowance against our net deferred tax assets as a result of expected taxable income from the IRT internalization. Conversely, during the three months ended September 30, 2015, the income tax (provision) was driven by gains on CMBS loan sales and the related taxable income at that taxable REIT subsidiary.
Income (loss) from discontinued operations. During the three months ended September 30, 2016, income (loss) from discontinued operations reflected recurring activity from our discontinued operations. During the three months ended September 30, 2015, income (loss) from discontinued operations reflected recurring activity from our discontinued operations as well as IRT’s gain on the TSRE merger, net of acquisition expenses and other expenses related to the TSRE merger.
54
Nine Months Ended September 30, 2016 Compared to the Nine Months Ended September 30, 2015
The following table sets forth information regarding our consolidated results of operations for the nine months ended September 30, 2016 and 2015.
|
|
|
For the Nine Months Ended September 30, |
|
|||||||||||||
|
|
|
2016 |
|
|
2015 |
|
|
$ Variance |
|
|
% Variance |
|
||||
|
Revenue: |
|
|
|
|
|
|
|
|
|
|
|
|
|
|
|
|
|
Investment interest income |
|
$ |
69,510 |
|
|
$ |
71,823 |
|
|
$ |
(2,313 |
) |
|
|
-3 |
% |
|
Investment interest expense |
|
|
(26,957 |
) |
|
|
(22,517 |
) |
|
|
(4,440 |
) |
|
|
20 |
% |
|
Net interest margin |
|
|
42,553 |
|
|
|
49,306 |
|
|
|
(6,753 |
) |
|
|
-14 |
% |
|
Property income |
|
|
89,335 |
|
|
|
94,401 |
|
|
|
(5,066 |
) |
|
|
-5 |
% |
|
Fee and other income |
|
|
5,974 |
|
|
|
14,760 |
|
|
|
(8,786 |
) |
|
|
-60 |
% |
|
Total revenue |
|
|
137,862 |
|
|
|
158,467 |
|
|
|
(20,605 |
) |
|
|
-13 |
% |
|
Expenses: |
|
|
|
|
|
|
|
|
|
|
|
|
|
|
|
|
|
Interest expense |
|
|
43,135 |
|
|
|
46,259 |
|
|
|
(3,124 |
) |
|
|
-7 |
% |
|
Real estate operating expense |
|
|
43,810 |
|
|
|
47,804 |
|
|
|
(3,994 |
) |
|
|
-8 |
% |
|
Compensation expense |
|
|
17,367 |
|
|
|
15,648 |
|
|
|
1,719 |
|
|
|
11 |
% |
|
General and administrative expense |
|
|
12,007 |
|
|
|
12,762 |
|
|
|
(755 |
) |
|
|
-6 |
% |
|
Acquisition expense |
|
|
376 |
|
|
|
1,392 |
|
|
|
(1,016 |
) |
|
|
-73 |
% |
|
Provision for loan losses |
|
|
4,202 |
|
|
|
5,850 |
|
|
|
(1,648 |
) |
|
|
-28 |
% |
|
Depreciation and amortization expense |
|
|
39,273 |
|
|
|
34,622 |
|
|
|
4,651 |
|
|
|
13 |
% |
|
Total expenses |
|
|
160,170 |
|
|
|
164,337 |
|
|
|
(4,167 |
) |
|
|
-3 |
% |
|
Operating (Loss) Income |
|
|
(22,308 |
) |
|
|
(5,870 |
) |
|
|
(16,438 |
) |
|
|
280 |
% |
|
Interest and other income (expense), net |
|
|
30 |
|
|
|
(1,035 |
) |
|
|
1,065 |
|
|
|
-103 |
% |
|
Gains (losses) on assets |
|
|
23,811 |
|
|
|
24,711 |
|
|
|
(900 |
) |
|
|
-4 |
% |
|
Gains (losses) on extinguishments of debt |
|
|
998 |
|
|
|
- |
|
|
|
998 |
|
|
N/M* |
|
|
|
Asset impairment |
|
|
(26,658 |
) |
|
|
(7,250 |
) |
|
|
(19,408 |
) |
|
|
268 |
% |
|
Change in fair value of financial instruments |
|
|
(7,055 |
) |
|
|
13,466 |
|
|
|
(20,521 |
) |
|
|
-152 |
% |
|
Income (loss) before taxes |
|
|
(31,182 |
) |
|
|
24,022 |
|
|
|
(55,204 |
) |
|
|
-230 |
% |
|
Income tax benefit (provision) |
|
|
18,051 |
|
|
|
(1,320 |
) |
|
|
19,371 |
|
|
|
-1468 |
% |
|
Income from continuing operations |
|
|
(13,131 |
) |
|
|
22,702 |
|
|
|
(35,833 |
) |
|
|
-158 |
% |
|
Discontinued operations: |
|
|
|
|
|
|
|
|
|
|
|
|
|
|
|
|
|
Income (loss) from discontinued operations |
|
|
38,473 |
|
|
|
28,831 |
|
|
|
9,642 |
|
|
|
33 |
% |
|
Net income (loss) |
|
|
25,342 |
|
|
|
51,533 |
|
|
|
(26,191 |
) |
|
|
-51 |
% |
|
(Income) loss allocated to preferred shares |
|
|
(25,850 |
) |
|
|
(24,383 |
) |
|
|
(1,467 |
) |
|
|
6 |
% |
|
(Income) loss allocated to noncontrolling interests |
|
|
(24,920 |
) |
|
|
(21,823 |
) |
|
|
(3,097 |
) |
|
|
14 |
% |
|
Net income (loss) allocable to common shares |
|
$ |
(25,428 |
) |
|
$ |
5,327 |
|
|
$ |
(30,755 |
) |
|
|
-577 |
% |
*N/M – Not Meaningful
Revenue
Net interest margin. Net interest margin decreased $6.8 million, or 14%, to $42.5 million for the nine months ended September 30, 2016 from $49.3 million for the nine months ended September 30, 2015. Investment interest income decreased $2.3 million driven by lower mezzanine loan interest income from loan payoffs. Investment interest expense increased $4.4 million due to the RAIT FL5 securitization issued in December 2015 and increases in LIBOR partially offset by a decrease in interest expense due to a reduction in securitization-related indebtedness due to repayments of the underlying loans.
Property income. Property income decreased $5.1 million to $89.3 million for the nine months ended September 30, 2016 from $94.4 million for the nine months ended September 30, 2015. The decrease is attributable to $19.2 million of property income related to 24 properties disposed of or deconsolidated after December 31, 2014. The decrease was partially offset by $12.8 million of property income from 15 new properties acquired or consolidated since September 30, 2015 and $1.3 million of property income from improved occupancy and rental rates in 2016 as compared to 2015 in the remaining properties.
Fee and other income. Fee and other income decreased $8.8 million to $6.0 million for the nine months ended September 30, 2016 from $14.8 million for the nine months ended September 30, 2015. The decrease is primarily attributable to a decrease of $2.9
55
million of property management fee income primarily due to the timing of leasing commissions, a decrease in CMBS income of $5.2 million, and $0.7 million of reduced application fee income from our lending business during the nine months ended September 30, 2016 as compared to the same period in 2015.
Expenses
Interest expense. Interest expense decreased $3.1 million, or 7%, to $43.2 million for the nine months ended September 30, 2016 from $46.3 million for the nine months ended September 30, 2015. This decrease is primarily attributable to a $2.1 million decrease in interest expense and a $0.8 million decrease in loan discount amortization primarily driven by the 7% convertible notes that were redeemed during the three months ended June 30, 2016.
Real estate operating expense. Real estate operating expense decreased $4.0 million to $43.8 million for the nine months ended September 30, 2016 from $47.8 million for the nine months ended September 30, 2015. The decrease is attributable to $11.1 million of real estate operating expenses related to 24 properties disposed of or deconsolidated after December 31, 2014. The increase was partially offset by $7.2 million of real estate operating expenses from 15 properties acquired since September 30, 2015.
Compensation expense. Compensation expense increased $1.7 million to $17.4 million for the nine months ended September 30, 2016 from $15.7 million for the nine months ended September 30, 2015. This is primarily due to less compensation expense being deferred as direct loan origination costs due to a lower volume of loan originations during 2016.
General and administrative expense. General and administrative expense decreased $0.8 million to $12.0 million for the nine months ended September 30, 2016 from $12.8 million for the nine months ended September 30, 2015. This decrease is primarily due to a $0.3 million decrease in legal expenses and a $0.5 million decrease in professional fees related to loan originations due to a lower volume of loan originations during 2016.
Acquisition expense. Acquisition expense decreased $1.0 million to $0.4 million for the nine months ended September 30, 2016 from $1.4 million for the nine months ended September 30, 2015. This decrease was primarily attributable to a $1.0 million decrease in dead deal costs for the nine months ended September 30, 2016 as compared to the same period in 2015.
Provision for loan losses. Provision for loan losses decreased $1.6 million to $4.2 million for the nine months ended September 30, 2016 from $5.8 million for the nine months ended September 30, 2015.
Depreciation and amortization expense. Depreciation and amortization expense increased $4.7 million to $39.3 million for the nine months ended September 30, 2016 from $34.6 million for the nine months ended September 30, 2015. The increase is attributable to $8.5 million of depreciation and amortization expense from 15 new properties acquired or consolidated since September 30, 2015 and $2.6 million of accelerated amortization expense on our customer relationships intangible assets. The increase was partially offset by a decrease of $6.8 million of depreciation and amortization expense related to 24 properties that were disposed of or deconsolidated after December 31, 2014.
Other income (expense)
Gains (losses) on assets. During the nine months ended September 30, 2016, ten multi-family properties, one office building and one parcel of land were sold resulting in a gain of $23.8 million.
Gain on extinguishment of debt. During the nine months ended September 30, 2016, we recognized a gain on extinguishment of debt of $1.0 million. This includes a $2.3 million gain on the extinguishment of the mortgage indebtedness on three of our multi-family properties upon their sale as they were sold for less than their outstanding indebtedness and the outstanding indebtedness has been satisfied. This was offset by a loss on the extinguishment of debt of $1.3 million related to repurchases and redemptions of our indebtedness, primarily driven by the write-off of the unamortized deferred financing costs associated with the indebtedness.
Asset impairment. During the nine months ended September 30, 2016, we recognized impairment of $14.1 million on one office building and four multi-family properties that are expected to be sold. We also expensed tenant improvements and straight-line rent receivables aggregating $1.7 million associated with tenants that vacated our properties early. We also recognized a loss on our retail property management subsidiary’s investment in an unconsolidated entity of $0.9 million and recognized impairment of $10.0 million on ten of our industrial properties because they are expected to be disposed of at a loss before the end of their useful lives. Our exposure to this industrial portfolio began with a mezzanine loan originated in 2006 which we converted to real estate owned in late 2015.
56
Change in fair value of financial instruments. During the nine months ended September 30, 2016, the change in fair value of financial instruments decreased our net income by $7.1 million. The fair value adjustments we recorded were as follows (dollars in thousands):
|
Description |
|
For the Nine Months Ended September 30, 2016 |
|
|
For the Nine Months Ended September 30, 2015 |
|
||
|
Change in fair value of trading securities and security-related receivables |
|
$ |
— |
|
|
$ |
(173 |
) |
|
Change in fair value of junior subordinated notes |
|
|
(1,020 |
) |
|
|
1,909 |
|
|
Change in fair value of derivatives |
|
|
(2,135 |
) |
|
|
(1,064 |
) |
|
Change in fair value of warrants and investor SARs |
|
|
(3,900 |
) |
|
|
12,794 |
|
|
Change in fair value of financial instruments |
|
$ |
(7,055 |
) |
|
$ |
13,466 |
|
The changes in the fair value for the trading securities and security-related receivables, CDO notes payable, and other liabilities for which the fair value option was elected for the nine months ended September 30, 2015 was primarily attributable to changes in instrument specific credit risks. The changes in the fair value of derivatives for the nine months ended September 30, 2016 and 2015 was mainly due to changes in interest rates. The change in fair value of the warrants and investor SARs was due to changes in the reference stock price and volatility.
Income tax benefit (provision). During the nine months ended September 30, 2016, the income tax benefit was driven by the partial release of a valuation allowance against our net deferred tax assets as a result of expected taxable income from the IRT internalization. Conversely, during the nine months ended September 30, 2015, the income tax (provision) was driven by gains on CMBS loan sales and the related taxable income at that taxable REIT subsidiary.
Income (loss) from discontinued operations. During the nine months ended September 30, 2016, income (loss) from discontinued operations reflected recurring activity from our discontinued operations as well as IRT’s gains on the sales of three of its real estate assets. During the nine months ended September 30, 2015, income (loss) from discontinued operations reflected recurring activity from our discontinued operations as well as IRT’s gain on the TSRE merger, net of acquisition expenses and other expenses related to the TSRE merger.
Non-GAAP Financial Measures
Cash Available for Distribution
Cash available for distribution, or CAD, is a non-GAAP financial measure. We believe that CAD provides investors and management with a meaningful indicator of operating performance. Management also uses CAD, among other measures, to evaluate profitability and our board of trustees considers CAD in determining our quarterly cash distributions. The compensation committee used CAD as a performance metric in establishing performance-based compensation awards for 2015 for some of our executive officers. We also believe that CAD is useful because it adjusts for a variety of noncash items (such as depreciation and amortization, equity-based compensation, realized gain (loss) on assets, provision for loan losses and non-cash interest income and expense items).
We calculate CAD by subtracting from or adding to net income (loss) attributable to common shareholders the following items: depreciation and amortization items including depreciation and amortization, straight-line rental income or expense, amortization of in place leases, amortization of deferred financing costs, amortization of discount on financings and equity-based compensation; changes in the fair value of our financial instruments; realized gains (losses) on assets; provision for loan losses; asset impairments; acquisition gains or losses and transaction costs; certain fee income eliminated in consolidation that is attributable to third parties; and one-time events pursuant to changes in GAAP and certain other non-recurring items.
In the quarter ended March 31, 2016, we changed our method of calculating CAD to exclude the impact of real property sales from CAD. We made this change in response to investor feedback to focus CAD on our core business activities. In addition, we provide guidance regarding our expected CAD in future periods and this change removes variability resulting from the ultimate timing of future property sales. We have amended our comparable prior period disclosures to conform with the current period presentation for this change.
CAD should not be considered as an alternative to net income (loss) or cash generated from operating activities, determined in accordance with GAAP, as an indicator of operating performance. For example, CAD does not adjust for the accrual of income and expenses that may not be received or paid in cash during the associated periods. Please refer to our consolidated financial statements prepared in accordance with GAAP in Part I, Item 1. In addition, our methodology for calculating CAD may differ from the
57
methodologies used by other comparable companies, including other REITs, when calculating the same or similar supplemental financial measures and may not be comparable with these companies.
Set forth below is a reconciliation of CAD to net income (loss) allocable to common shares for the three months ended September 30, 2016 and 2015 (dollars in thousands, except share information):
|
|
|
For the Three Months Ended September 30, 2016 |
|
|
For the Three Months Ended September 30, 2015 |
|
||||||||||
|
|
|
Amount |
|
|
Per Share (1) |
|
|
Amount |
|
|
Per Share (2) |
|
||||
|
Cash Available for Distribution: |
|
|
|
|
|
|
|
|
|
|
|
|
|
|
|
|
|
Net income (loss) allocable to common shares |
|
$ |
(4 |
) |
|
$ |
— |
|
|
$ |
(6,532 |
) |
|
$ |
(0.07 |
) |
|
Adjustments: |
|
|
|
|
|
|
|
|
|
|
|
|
|
|
|
|
|
Depreciation and amortization expense |
|
|
11,466 |
|
|
|
0.13 |
|
|
|
10,482 |
|
|
|
0.12 |
|
|
Change in fair value of financial instruments |
|
|
1,375 |
|
|
|
0.02 |
|
|
|
(620 |
) |
|
|
(0.01 |
) |
|
(Gains) losses on assets |
|
|
(18,194 |
) |
|
|
(0.20 |
) |
|
|
(7,430 |
) |
|
|
(0.09 |
) |
|
(Gains) losses on extinguishment of debt |
|
|
6 |
|
|
|
— |
|
|
|
— |
|
|
|
— |
|
|
Deferred income tax (benefit) provision |
|
|
(15,249 |
) |
|
|
(0.17 |
) |
|
|
— |
|
|
|
— |
|
|
Straight-line rental adjustments |
|
|
(622 |
) |
|
|
(0.01 |
) |
|
|
(78 |
) |
|
|
— |
|
|
Share-based compensation |
|
|
819 |
|
|
|
0.01 |
|
|
|
941 |
|
|
|
0.01 |
|
|
Acquisition and integration expenses |
|
|
197 |
|
|
|
— |
|
|
|
153 |
|
|
|
- |
|
|
Origination fees and other deferred items |
|
|
8,536 |
|
|
|
0.09 |
|
|
|
10,353 |
|
|
|
0.12 |
|
|
Provision for losses |
|
|
1,533 |
|
|
|
0.02 |
|
|
|
1,850 |
|
|
|
0.02 |
|
|
Asset impairment |
|
|
18,872 |
|
|
|
0.21 |
|
|
|
7,250 |
|
|
|
0.08 |
|
|
Discontinued operations and noncontrolling interest effect of certain adjustments |
|
|
1,885 |
|
|
|
0.02 |
|
|
|
1,017 |
|
|
|
0.02 |
|
|
Cash Available for Distribution |
|
$ |
10,619 |
|
|
$ |
0.12 |
|
|
$ |
17,386 |
|
|
|
0.20 |
|
|
(1) |
Based on 91,201,784 weighted-average shares outstanding for the three months ended September 30, 2016. |
|
(2) |
Based on 87,110,958 weighted-average shares outstanding for the three months ended September 30, 2015. |
Set forth below is a reconciliation of CAD to net income (loss) allocable to common shares for the nine months ended September 30, 2016 and 2015 (dollars in thousands, except share information):
|
|
|
For the Nine Months Ended September 30, 2016 |
|
|
For the Nine Months Ended September 30, 2015 |
|
||||||||||
|
|
|
Amount |
|
|
Per Share (1) |
|
|
Amount |
|
|
Per Share (2) |
|
||||
|
Cash Available for Distribution: |
|
|
|
|
|
|
|
|
|
|
|
|
|
|
|
|
|
Net income (loss) allocable to common shares |
|
$ |
(25,428 |
) |
|
$ |
(0.28 |
) |
|
$ |
5,327 |
|
|
$ |
0.06 |
|
|
Adjustments: |
|
|
|
|
|
|
|
|
|
|
|
|
|
|
|
|
|
Depreciation and amortization expense |
|
|
39,273 |
|
|
|
0.43 |
|
|
|
34,622 |
|
|
|
0.41 |
|
|
Change in fair value of financial instruments |
|
|
7,055 |
|
|
|
0.08 |
|
|
|
(13,466 |
) |
|
|
(0.16 |
) |
|
(Gains) losses on assets |
|
|
(23,811 |
) |
|
|
(0.26 |
) |
|
|
(24,711 |
) |
|
|
(0.29 |
) |
|
(Gains) losses on extinguishment of debt |
|
|
(998 |
) |
|
|
(0.01 |
) |
|
|
— |
|
|
|
— |
|
|
Deferred income tax (benefit) provision |
|
|
(18,090 |
) |
|
|
(0.20 |
) |
|
|
— |
|
|
|
— |
|
|
Straight-line rental adjustments |
|
|
(1,182 |
) |
|
|
(0.01 |
) |
|
|
(53 |
) |
|
|
— |
|
|
Share-based compensation |
|
|
2,841 |
|
|
|
0.03 |
|
|
|
3,256 |
|
|
|
0.04 |
|
|
Acquisition Expenses |
|
|
376 |
|
|
|
- |
|
|
|
1,392 |
|
|
|
0.02 |
|
|
Origination fees and other deferred items |
|
|
21,377 |
|
|
|
0.23 |
|
|
|
25,360 |
|
|
|
0.30 |
|
|
Provision for losses |
|
|
4,202 |
|
|
|
0.05 |
|
|
|
5,850 |
|
|
|
0.07 |
|
|
Asset impairment |
|
|
26,658 |
|
|
|
0.29 |
|
|
|
7,250 |
|
|
|
0.09 |
|
|
Discontinued operations and noncontrolling interest effect of certain adjustments |
|
|
1,762 |
|
|
|
0.02 |
|
|
|
4,242 |
|
|
|
0.05 |
|
|
Cash Available for Distribution |
|
$ |
34,035 |
|
|
$ |
0.37 |
|
|
$ |
49,070 |
|
|
$ |
0.59 |
|
|
(1) |
Based on 91,137,041 weighted-average shares outstanding for the nine months ended September 30, 2016. |
|
(2) |
Based on 83,799,244 weighted-average shares outstanding for the nine months ended September 30, 2015. |
58
As stated above, we changed our method of calculating CAD in the quarter ended March 31, 2016 to exclude the impact of real property sales. Set forth below is our reconciliation of CAD to net income (loss) allocable to common shares for the years ended December 31, 2015, 2014 and 2013 below (dollars in thousands, except share information) which reflects such new method and is intended to supersede the corresponding chart previously reported in our annual report:
|
|
|
For the Year Ended December 31, 2015 |
|
|
For the Year Ended December 31, 2014 |
|
|
For the Year Ended December 31, 2013 |
|
|||||||||||||||
|
|
|
Amount |
|
|
Per Share (1) |
|
|
Amount |
|
|
Per Share (2) |
|
|
Amount |
|
|
Per Share (3) |
|
||||||
|
Cash Available for Distribution: |
|
|
|
|
|
|
|
|
|
|
|
|
|
|
|
|
|
|
|
|
|
|
|
|
|
Net income (loss) allocable to common shares |
|
$ |
7,158 |
|
|
$ |
0.08 |
|
|
$ |
(318,504 |
) |
|
$ |
(3.92 |
) |
|
$ |
(308,008 |
) |
|
$ |
(4.54 |
) |
|
Adjustments: |
|
|
|
|
|
|
|
|
|
|
|
|
|
|
|
|
|
|
|
|
|
|
|
|
|
Depreciation and amortization expense |
|
|
73,868 |
|
|
|
0.87 |
|
|
|
56,784 |
|
|
|
0.70 |
|
|
|
36,093 |
|
|
|
0.53 |
|
|
Change in fair value of financial instruments |
|
|
(11,638 |
) |
|
|
(0.14 |
) |
|
|
98,752 |
|
|
|
1.21 |
|
|
|
344,426 |
|
|
|
5.09 |
|
|
(Gains) losses on assets |
|
|
(43,514 |
) |
|
|
(0.51 |
) |
|
|
5,370 |
|
|
|
0.07 |
|
|
|
2,266 |
|
|
|
0.03 |
|
|
TSRE financing extinguishment and employee separation expenses |
|
|
27,508 |
|
|
|
0.32 |
|
|
|
— |
|
|
|
— |
|
|
|
— |
|
|
|
— |
|
|
(Gain) loss on IRT merger with TSRE |
|
|
(64,604 |
) |
|
|
(0.76 |
) |
|
|
— |
|
|
|
— |
|
|
|
— |
|
|
|
— |
|
|
(Gains) losses on deconsolidation of VIEs |
|
|
— |
|
|
|
— |
|
|
|
215,804 |
|
|
|
2.66 |
|
|
|
— |
|
|
|
— |
|
|
(Gains) losses on extinguishment of debt |
|
|
— |
|
|
|
— |
|
|
|
(2,421 |
) |
|
|
(0.03 |
) |
|
|
1,275 |
|
|
|
0.02 |
|
|
T8 and T9 securitizations, net effect |
|
|
— |
|
|
|
— |
|
|
|
(26,931 |
) |
|
|
(0.33 |
) |
|
|
(33,268 |
) |
|
|
(0.49 |
) |
|
Straight-line rental adjustments |
|
|
95 |
|
|
|
— |
|
|
|
1,111 |
|
|
|
0.01 |
|
|
|
(1,322 |
) |
|
|
(0.02 |
) |
|
Share-based compensation |
|
|
4,466 |
|
|
|
0.05 |
|
|
|
4,407 |
|
|
|
0.05 |
|
|
|
3,441 |
|
|
|
0.05 |
|
|
Acquisition and integration expenses |
|
|
16,527 |
|
|
|
0.19 |
|
|
|
— |
|
|
|
— |
|
|
|
— |
|
|
|
— |
|
|
Origination fees and other deferred items |
|
|
34,834 |
|
|
|
0.41 |
|
|
|
21,954 |
|
|
|
0.27 |
|
|
|
10,475 |
|
|
|
0.15 |
|
|
Provision for losses |
|
|
8,300 |
|
|
|
0.10 |
|
|
|
5,500 |
|
|
|
0.07 |
|
|
|
3,000 |
|
|
|
0.04 |
|
|
Asset impairment |
|
|
8,179 |
|
|
|
0.10 |
|
|
|
— |
|
|
|
— |
|
|
|
— |
|
|
|
— |
|
|
Noncontrolling interest effect of certain adjustments |
|
|
4,967 |
|
|
|
0.06 |
|
|
|
(4,302 |
) |
|
|
(0.05 |
) |
|
|
(940 |
) |
|
|
(0.01 |
) |
|
Cash Available for Distribution |
|
$ |
66,146 |
|
|
$ |
0.77 |
|
|
$ |
57,524 |
|
|
$ |
0.71 |
|
|
$ |
57,438 |
|
|
$ |
0.85 |
|
|
(1) |
Based on 85,524,073 weighted-average shares outstanding for the year ended December 31, 2015. |
|
(2) |
Based on 81,328,129 weighted-average shares outstanding for the year ended December 31, 2014. |
|
(3) |
Based on 67,814,316 weighted-average shares outstanding for the year ended December 31, 2013. |
Funds from Operations
We believe that funds from operations, or FFO, which is a non-GAAP measure, is an additional appropriate measure of the operating performance of a REIT. We compute FFO in accordance with the standards established by the National Association of Real Estate Investment Trusts, or NAREIT, as net income or loss allocated to common shares (computed in accordance with GAAP), excluding real estate-related depreciation and amortization expense, gains or losses on sales of real estate and the cumulative effect of changes in accounting principles. Our management utilizes FFO as a measure of our operating performance. FFO is not an equivalent to net income or cash generated from operating activities determined in accordance with GAAP. Furthermore, FFO does not represent amounts available for management’s discretionary use because of needed capital replacement or expansion, debt service obligations or other commitments or uncertainties. FFO should not be considered as an alternative to net income as an indicator of our operating performance or as an alternative to cash flow from operating activities as a measure of our liquidity.
In the quarter ended September 30, 2016, we changed our method of calculating FFO to exclude the impact of asset impairment. We have amended our comparable prior period disclosures to conform with the current period presentation for this change.
59
Set forth below is a reconciliation of FFO to net income (loss) allocable to common shares for the three months ended September 30, 2016 and 2015 (dollars in thousands, except share information):
|
|
|
For the Three Months Ended September 30, 2016 |
|
|
For the Three Months Ended September 30, 2015 |
|
||||||||||
|
|
|
Amount |
|
|
Per Share (1) |
|
|
Amount |
|
|
Per Share (2) |
|
||||
|
Funds From Operations: |
|
|
|
|
|
|
|
|
|
|
|
|
|
|
|
|
|
Net income (loss) allocable to common shares |
|
$ |
(4 |
) |
|
$ |
— |
|
|
$ |
(6,532 |
) |
|
$ |
(0.07 |
) |
|
Adjustments: |
|
|
|
|
|
|
|
|
|
|
|
|
|
|
|
|
|
Real estate depreciation and amortization |
|
|
8,884 |
|
|
|
0.10 |
|
|
|
8,712 |
|
|
|
0.10 |
|
|
(Gains) losses on the sale of real estate |
|
|
(18,194 |
) |
|
|
(0.20 |
) |
|
|
(7,430 |
) |
|
|
(0.09 |
) |
|
Asset impairment |
|
|
18,872 |
|
|
0.21 |
|
|
|
7,250 |
|
|
|
0.08 |
|
|
|
Adjustments related to discontinued operations |
|
|
1,195 |
|
|
0.01 |
|
|
|
909 |
|
|
|
0.01 |
|
|
|
Funds From Operations allocable to common shares |
|
$ |
10,753 |
|
|
$ |
0.12 |
|
|
$ |
2,909 |
|
|
$ |
0.03 |
|
|
(1) |
Based on 91,201,784 weighted-average shares outstanding for the three months ended September 30, 2016. |
|
(2) |
Based on 87,110,958 weighted-average shares outstanding for the three months ended September 30, 2015. |
Set forth below is a reconciliation of FFO to income (loss) allocable to common shares for the nine months ended September 30, 2016 and 2015 (dollars in thousands, except share information):
|
|
|
For the Nine Months Ended September 30, 2016 |
|
|
For the Nine Months Ended September 30, 2015 |
|
||||||||||
|
|
|
Amount |
|
|
Per Share (1) |
|
|
Amount |
|
|
Per Share (2) |
|
||||
|
Funds From Operations: |
|
|
|
|
|
|
|
|
|
|
|
|
|
|
|
|
|
Net income (loss) allocable to common shares |
|
$ |
(25,428 |
) |
|
$ |
(0.28 |
) |
|
$ |
5,327 |
|
|
$ |
0.06 |
|
|
Adjustments: |
|
|
|
|
|
|
|
|
|
|
|
|
|
|
|
|
|
Real estate depreciation and amortization |
|
$ |
28,539 |
|
|
|
0.32 |
|
|
|
28,228 |
|
|
|
0.34 |
|
|
(Gains) losses on the sale of real estate |
|
$ |
(24,301 |
) |
|
|
(0.27 |
) |
|
|
(24,711 |
) |
|
|
(0.29 |
) |
|
Asset impairment |
|
$ |
26,658 |
|
|
0.29 |
|
|
|
7,250 |
|
|
|
0.09 |
|
|
|
Adjustments related to discontinued operations |
|
$ |
(1,322 |
) |
|
|
(0.01 |
) |
|
|
2,847 |
|
|
|
0.03 |
|
|
Funds From Operations allocable to common shares |
|
$ |
4,146 |
|
|
$ |
0.05 |
|
|
$ |
18,941 |
|
|
$ |
0.23 |
|
|
(1) |
Based on 91,137,041 weighted-average shares outstanding for the nine months ended September 30, 2016. |
|
(2) |
Based on 83,799,244 weighted-average shares outstanding for the nine months ended September 30, 2015. |
As stated above, we changed our method of calculating FFO in the quarter ended September 30, 2016 to exclude the impact of asset impairment. Set forth below is our reconciliation of FFO to net income (loss) allocable to common shares for the years ended December 31, 2015, 2014, and 2013 (dollars in thousands, except share information) which reflects such new method and is intended to supersede the corresponding chart previously reported in our annual report.
|
|
|
For the Year Ended December 31, 2015 |
|
|
For the Year Ended December 31, 2014 |
|
|
For the Year Ended December 31, 2013 |
|
|||||||||||||||
|
|
|
Amount |
|
|
Per Share (1) |
|
|
Amount |
|
|
Per Share (2) |
|
|
Amount |
|
|
Per Share (2) |
|
||||||
|
Funds From Operations: |
|
|
|
|
|
|
|
|
|
|
|
|
|
|
|
|
|
|
|
|
|
|
|
|
|
Net income (loss) allocable to common shares |
|
$ |
7,158 |
|
|
$ |
0.08 |
|
|
$ |
(318,504 |
) |
|
$ |
(3.92 |
) |
|
$ |
(308,008 |
) |
|
$ |
(4.54 |
) |
|
Adjustments: |
|
|
|
|
|
|
|
|
|
|
|
|
|
|
|
|
|
|
|
|
|
|
|
|
|
Real estate depreciation and amortization |
|
|
41,096 |
|
|
|
0.48 |
|
|
|
38,620 |
|
|
|
0.48 |
|
|
|
33,538 |
|
|
|
0.50 |
|
|
(Gains) losses on the sale of real estate |
|
|
(43,514 |
) |
|
|
(0.51 |
) |
|
|
319 |
|
|
|
— |
|
|
|
3,724 |
|
|
|
0.05 |
|
|
Asset impairment |
|
|
8,179 |
|
|
|
0.10 |
|
|
|
— |
|
|
|
— |
|
|
|
— |
|
|
|
— |
|
|
Funds From Operations allocable to common shares |
|
$ |
12,919 |
|
|
$ |
0.15 |
|
|
$ |
(279,565 |
) |
|
$ |
(3.44 |
) |
|
$ |
(270,746 |
) |
|
$ |
(3.99 |
) |
60
|
(1) |
Based on 85,524,073 weighted-average shares outstanding for the year ended December 31, 2015. |
|
(2) |
Based on 81,328,129 weighted-average shares outstanding for the year ended December 31, 2014. |
|
(3) |
Based on 67,814,316 weighted-average shares outstanding for the year ended December 31, 2013. |
Liquidity and Capital Resources
Liquidity is a measure of our ability to meet potential cash requirements, including ongoing commitments to repay borrowings, fund and maintain investments, pay dividends and other general business needs.
We believe our available cash and restricted cash balances, other financing arrangements, and cash flows from operations will be sufficient to fund our liquidity requirements for the next 12 months and the foreseeable future. Due to volatility in the capital markets referenced above in “Overview,” we expect our ability to raise capital in the public markets through sales of our equity and debt securities to be limited this year. We expect to rely to a greater degree on the other sources of liquidity identified below.
Our primary cash requirements are as follows:
|
|
• |
to make investments and fund the associated costs; |
|
|
• |
to repay, repurchase or redeem our indebtedness; |
|
|
• |
to pay our expenses, including compensation to our employees; |
|
|
• |
to pay U.S. federal, state, and local taxes of our taxable REIT subsidiaries; and |
|
|
• |
to distribute a minimum of 90% of our REIT taxable income and to make investments in a manner that enables us to maintain our qualification as a REIT. |
We intend to meet these liquidity requirements primarily through the following:
|
|
• |
the use of our cash and cash equivalent balances of $36.0 million as of September 30, 2016; |
|
|
• |
cash generated from operating activities, including net investment income from our investment portfolio, and fee income generated by our commercial real estate platform; |
|
|
• |
proceeds from the sales of assets, including property sales and proceeds we receive as a result of the IRT stock repurchase and the IRT management internalization transactions; |
|
|
• |
proceeds from future borrowings, including our CMBS facilities and loan participations; |
|
|
• |
proceeds from alternative sources of financing, such as joint ventures or sales of our retained interests in securitizations we sponsor; and |
|
|
• |
proceeds from future offerings of our securities, including those through our DRSPP and ATM programs. |
In the quarter ended September 30, 2016, we redeemed the current aggregate principal balance outstanding of the investment grade senior notes issued by RAIT FL2 in accordance with their terms. Also, we continue to monitor market conditions to make opportunistic repurchases on the open market from time to time of our outstanding recourse indebtedness. In this regard, we repurchased $19.5 million aggregate principal amount of our outstanding debt for an aggregate purchase price of $17.3 million during the nine months ended September 30, 2016. We also redeemed $33.2 million of our recourse indebtedness during the nine months ended September 30, 2016.
During the fourth quarter of 2016, we expect to generate approximately $85.3 million of cash from property sales, the IRT stock repurchase and the IRT management internalization transactions.
61
As of September 30, 2016 and 2015, we maintained cash and cash equivalents of approximately $36.0 million and $92.7 million, respectively. Our cash and cash equivalents were generated from the following activities (dollars in thousands):
|
|
|
For the Nine Months Ended September 30, |
|
|||||
|
|
|
2016 |
|
|
2015 |
|
||
|
Cash flow from operating activities |
|
$ |
98,998 |
|
|
$ |
59,781 |
|
|
Cash flow from investing activities |
|
|
357,923 |
|
|
|
(296,352 |
) |
|
Cash flow from financing activities |
|
|
(517,388 |
) |
|
|
207,497 |
|
|
Net change in cash and cash equivalents |
|
|
(60,467 |
) |
|
|
(29,074 |
) |
|
Net change in cash and cash equivalents from discontinuing operations |
|
|
8,905 |
|
|
|
(2,181 |
) |
|
Cash and cash equivalents at beginning of period |
|
|
87,581 |
|
|
|
106,963 |
|
|
Cash and cash equivalents at end of period |
|
$ |
36,019 |
|
|
$ |
75,708 |
|
Cash flow from operating activities for the nine months ended September 30, 2016, as compared to the same period in 2015, increased $39.2 million primarily due to the timing of payments for various accounts payable, accrued expenses and other liabilities, and a decrease in accrued interest receivable that related to the payoff of loans whose accrual of interest accrual terms differed from their current payment terms. The remaining increase in cash flow from operating activities was primarily related to IRT’s growth in its real estate investments.
The cash inflow for investing activities for the nine months ended September 30, 2016 was substantially due to proceeds from property dispositions of $212.6 million as well as loan repayments of $308.3 million outpacing new investments in loans of $82.4 million. The cash outflow for investing activities for the nine months ended September 30, 2015 was substantially due to new investments in loans of $362.3 million which exceeded loan repayments of $169.6 million and IRT’s acquisition of TSRE of $137.1 million.
The cash outflow from our financing activities during the nine months ended September 30, 2016 was primarily due to repayments and repurchases of indebtedness of $763.1 million and distributions to shareholders and noncontrolling interests of $70.8 million exceeding proceeds from the issuance of indebtedness of $246.8 million. The cash inflow from our financing activities during the nine months ended September 30, 2015 was primarily due to proceeds from debt issuance of $670.0 million exceeding repayments of indebtedness of $502.8 million and distributions to shareholders and noncontrolling interests of $79.3 million.
As a REIT, we evaluate our dividend coverage based on our cash flow from operating activities, excluding acquisition and integration expenses, the origination and sale of conduit loans, and changes in assets and liabilities. During the nine months ended September 30, 2016, we paid distributions to our preferred shareholders, common shareholders, and non-controlling interests of $70.8 million and generated cash flows from operating activities, before acquisition expenses, origination and sale of conduit loans, and changes in assets and liabilities of $71.6 million.
Capitalization
Refer to Note 5: Indebtedness, Note 9: Series D Preferred Shares, and Note 10: Shareholders’ Equity in the Notes to Consolidated Financial Statements, for information regarding our capitalization.
Off-Balance Sheet Arrangements and Commitments
There have been no material changes in off-balance sheet arrangements or commitments during the nine months ended September 30, 2016 from the disclosures included in our Annual Report on Form 10-K for the year ended December 31, 2015.
Critical Accounting Estimates and Policies
Our Annual Report on Form 10-K for the year ended December 31, 2015 contains a discussion of our critical accounting policies. On January 1, 2016 we adopted three new accounting pronouncements and revised our accounting policies. See Note 2 in the Notes to Consolidated Financial Statements. Management discusses our critical accounting policies and management’s judgments and estimates with the audit committee of our board of trustees.
62
There have been no material changes in quantitative and qualitative market risks during the nine months ended September 30, 2016 from the disclosures included in our Annual Report on Form 10-K for the year ended December 31, 2015.
Disclosure Controls and Procedures
We maintain disclosure controls and procedures that are designed to ensure that information required to be disclosed in our reports under the Securities Exchange Act of 1934, as amended, or the Exchange Act, is recorded, processed, summarized, and reported within the time periods specified in the SEC’s rules and forms, and that such information is accumulated and communicated to our management, including our chief executive officer and our chief financial officer, as appropriate, to allow timely decisions regarding required disclosure. In designing and evaluating the disclosure controls and procedures, our management recognized that any controls and procedures, no matter how well designed and operated, can provide only reasonable assurance of achieving the desired control objectives, and our management necessarily was required to apply its judgment in evaluating the cost-benefit relationship of possible controls and procedures.
Under the supervision of our chief executive officer and chief financial officer and with the participation of our disclosure committee, we have carried out an evaluation of the effectiveness of our disclosure controls and procedures as of the end of the period covered by this report. Based upon that evaluation, our chief executive officer and chief financial officer concluded that our disclosure controls and procedures are effective at the reasonable assurance level.
Changes in Internal Control Over Financial Reporting
There has been no change in our internal control over financial reporting or in other factors during the quarter ended September 30, 2016, that have materially affected, or were reasonably likely to materially affect, our internal control over financial reporting.
63
General
We are involved from time to time in litigation on various matters, including disputes with tenants of owned properties, disputes arising out of agreements to purchase or sell properties and disputes arising out of our loan portfolio. Given the nature of our business activities, these lawsuits are considered routine to the conduct of our business. The result of any particular lawsuit cannot be predicted, because of the very nature of litigation, the litigation process and its adversarial nature, and the jury system. We do not expect that the liabilities, if any, that may ultimately result from such routine legal actions will have a material adverse effect on our consolidated financial position, results of operations or cash flows.
There have not been any material changes from the risk factors previously disclosed in Item 1A—“Risk Factors” in our Annual Report on Form 10-K for the fiscal year ended December 31, 2015 except as noted below.
We cannot assure you that we will be able to complete the IRT Management Internalization, which could materially adversely affect our business, financial condition and results of operations.
We cannot assure you that we will be able to close on the IRT management internalization pursuant to the IRT management internalization agreement. The IRT management internalization is subject to the satisfaction of closing conditions, including obtaining third party consents. There can be no guarantee that any of these closing conditions will be satisfied and the transactions consummated. Failure to complete the transactions could materially adversely delay our strategy of simplifying our business and focus on our core strategy, commercial real estate lending, and adversely affect our liquidity because we would not receive the expected proceeds of the IRT management internalization. These consequences could materially adversely affect our business, financial condition and results of operations.
If the IRT management internalization occurs, we expect to make substantial changes to our management and incur significant expenses related thereto which could materially adversely affect our business, financial condition and results of operations.
The IRT management internalization contemplates the following changes to our management: Scott F. Schaeffer is expected to resign as our CEO. Scott L. N. Davidson, currently RAIT’s President, is expected to be elevated to the office of our CEO. James J. Sebra, our CFO, is expected to resign from such position upon the later to occur of March 31, 2017 or the filing of RAIT’s Form 10-K for the fiscal year ending December 31, 2016 with the SEC. We may not successfully implement these changes, which would adversely affect RAIT’s performance and stock price. Our stock price may be adversely affected by market uncertainty concerning our management transition. We may incur substantial severance and recruitment costs. We will be required to provide and receive services under a shared services agreement with IRT and may be adversely affected if we do not provide or receive services at the levels required. Our general and administrative expenses after the IRT management internalization could be higher than our current expectations. Any of these foregoing risks could materially adversely affect our business, financial condition and results of operations.
We expect the IRT management internalization and IRT Stock Repurchase to have significant impact on our GAAP and Non-GAAP financial measures and operating metrics which may materially adversely affect our business, financial condition and results of operations.
If the IRT management internalization occurs, we expect it to have a significant impact on our GAAP and Non-GAAP financial measures and operating metrics. We deconsolidated IRT in connection with the IRT stock repurchase. This resulted in removing the contribution of IRT to our operating results which have historically been disclosed in the IRT segment disclosure in our financial statements and significantly reduce our assets and liabilities consolidated from IRT which have historically been disclosed in the supplemental information packages we furnish to the SEC with our earnings releases. We expect our leverage to increase from historical levels because IRT’s historical leverage was lower than RAIT’s and the net effect on RAIT may not be offset entirely by debt repayments RAIT made from the proceeds of the IRT stock repurchase. Our cash available for distribution, or CAD, may be reduced from historic levels by the amount of IRT’s contribution to CAD. We expect our assets under management to be significantly reduced by IRT’s assets and the value of RAIT’s multifamily properties managed by the property management business transferred to IRT in the IRT management internalization.
64
We may not manage the IRT management internalization effectively or realize its anticipated benefits.
We intend for the IRT management internalization to be part of our long term strategy of focusing on our core strategy of commercial real estate lending and reallocating capital to the higher yielding lending business and reducing leverage. We may not be able to identify suitable investments for a period of time which may reduce our operating performance. We may not manage the IRT management internalization effectively. The IRT management internalization could be a time-consuming and costly process. Following the IRT management internalization, we expect to be reliant on IRT for certain transitional services such as CFO and identified legal services for a period of time after the closing. If we are unable to internalize or find other providers for these services within a reasonable time period, we may not achieve all of the expected benefits of the IRT management internalization. The failure to manage the IRT management internalization effectively, including failure to smoothly transition services or retain employees, could result in the anticipated benefits of the IRT management internalization not being realized in the timeframe currently anticipated or at all or may require incurring higher expenses than we currently anticipate.
The IRT management internalization was negotiated between a special committee of the board of trustees comprised solely of independent trustees, or the special committee, and a special committee of the IRT board of directors comprised solely of independent directors, or the IRT special committee, to address potential conflicts of interest among executive officers shared by RAIT and IRT.
The IRT management internalization was negotiated by the special committee on behalf of RAIT with the IRT special committee on behalf of IRT in order for RAIT and IRT to address potential conflicts of interest among executive officers shared by RAIT and IRT, including the following: (i) Mr. Schaeffer’s service as CEO of both RAIT and IRT and as chairman of the board of the board of trustees and as chairman of the IRT board of directors; and (ii) Mr. Sebra’s service as CFO and treasurer of both RAIT and IRT. As a result, the affiliated officers may have had different interests than we do with respect to the IRT management internalization and the future conduct of the businesses of the companies. While the special committee was responsible for negotiating on behalf of RAIT to address potential conflicts of interest related to the IRT management internalization, including those of the affiliated officers, these potential conflicts would not exist in the case of a transaction negotiated with unaffiliated third parties.
The representations, warranties, covenants and indemnities in the IRT internalization agreement and related agreements are subject to limitations and qualifiers, which may limit our ability to enforce any remedy under these agreements.
The representations, warranties, covenants and indemnities in the IRT internalization agreement, the related shared services agreement and other agreements related to the IRT management internalization are subject to limitations and qualifiers, which may limit our ability to enforce any remedy under these agreements. These include, without limitation, limitations on liability and materiality qualifiers on certain representations and covenants.
Actions of activist shareholders with respect to RAIT could be disruptive and potentially costly and the possibility that activist shareholders may contest, or seek changes that conflict with, our strategic direction could cause uncertainty about the strategic direction of our business.
Activist shareholders may from time to time attempt to effect changes in our strategic direction and, in furtherance thereof, may seek changes in how RAIT is governed. While our Board of Trustees and management team strive to maintain constructive, ongoing communications with all of RAIT’s shareholders, including activist shareholders, and welcomes their views and opinions with the goal of working together constructively to enhance value for all shareholders, activist campaigns that contest, or conflict with, our strategic direction could have an adverse effect on us because: (i) responding to actions by activist shareholders can disrupt our operations, be costly and time-consuming, and divert the attention of our Board and senior management from the pursuit of business strategies, which could adversely affect our results of operations and financial condition; (ii) perceived uncertainties as to our future direction may lead to the perception of a change in the direction of the business, instability or lack of continuity which may be exploited by our competitors, cause concern to our current or potential customers, may result in the loss of potential business opportunities and make it more difficult to attract and retain qualified personnel and business partners; and (iii) these types of actions could cause significant fluctuations in our stock price based on temporary or speculative market perceptions or other factors that do not necessarily reflect the underlying fundamentals and prospects of our business.
|
(a) |
Exhibits |
The exhibits filed as part of this quarterly report on Form 10-Q are identified in the exhibit index immediately following the signature page of this Report. Such Exhibit Index is incorporated herein by reference.
65
Pursuant to the requirements of the Securities Exchange Act of 1934, the registrant has duly caused this report to be signed on its behalf by the undersigned thereunto duly authorized.
|
|
|
RAIT FINANCIAL TRUST (Registrant) |
|
|
|
|
|
|
|
Date: November 9, 2016 |
|
By: |
/s/ Scott F. Schaeffer |
|
|
|
|
Scott F. Schaeffer, Chief Executive Officer |
|
|
|
|
(On behalf of the registrant and as its Principal Executive Officer) |
|
|
|
|
|
|
Date: November 9, 2016 |
|
By: |
/s/ James J. Sebra |
|
|
|
|
James J. Sebra, Chief Financial Officer and Treasurer |
|
|
|
|
(On behalf of the registrant and as its Principal Financial Officer) |
|
Date: November 9, 2016 |
|
By: |
/s/ Alfred J. Dilmore |
|
|
|
|
Alfred J. Dilmore, Chief Accounting Officer |
|
|
|
|
(On behalf of the registrant and as its Principal Accounting Officer) |
66
|
Exhibit Number |
|
Description of Documents |
|
|
|
|
|
3.1.1 |
|
Amended and Restated Declaration of Trust of RAIT Financial Trust (“RAIT”). Incorporated by reference to RAIT’s Registration Statement on Form S-11 (Registration No. 333-35077). |
|
|
|
|
|
3.1.2 |
|
Articles of Amendment to Amended and Restated Declaration of Trust of RAIT. Incorporated by reference to RAIT’s Registration Statement on Form S-11 (Registration No. 333-53067). |
|
|
|
|
|
3.1.3 |
|
Articles of Amendment to Amended and Restated Declaration of Trust of RAIT. Incorporated by reference to RAIT’s Registration Statement on Form S-2 (Registration No. 333-55518). |
|
|
|
|
|
3.1.4 |
|
Certificate of Correction to the Amended and Restated Declaration of Trust of RAIT. Incorporated by reference to RAIT’s Form 10-Q for the Quarterly Period ended March 31, 2002 (File No. 1-14760). |
|
|
|
|
|
3.1.5 |
|
Articles of Amendment to Amended and Restated Declaration of Trust of RAIT. Incorporated by reference to RAIT’s Form 8-K as filed with the Securities and Exchange Commission (“SEC”) on December 15, 2006 (File No. 1-14760). |
|
|
|
|
|
3.1.6 |
|
Articles of Amendment to Amended and Restated Declaration of Trust of RAIT. Incorporated by reference to RAIT’s Form 8-K as filed with the SEC on July, 1 2011 (File No. 1-14760). |
|
|
|
|
|
3.1.7 |
|
Articles Supplementary (the “Series A Articles Supplementary”) relating to the 7.75% Series A Cumulative Redeemable Preferred Shares of Beneficial Interest (the “Series A Preferred Shares”) of RAIT. Incorporated by reference to RAIT’s Form 8-K as filed with the SEC on March 18, 2004 (File No. 1-14760). |
|
|
|
|
|
3.1.8 |
|
Certificate of Correction to the Series A Articles Supplementary. Incorporated by reference to RAIT’s Form 8-K as filed with the SEC on March 18, 2004 (File No. 1-14760). |
|
|
|
|
|
3.1.9 |
|
Articles Supplementary relating to the 8.375% Series B Cumulative Redeemable Preferred Shares of Beneficial Interest, (the “Series B Preferred Shares”) of RAIT. Incorporated by reference to RAIT’s Form 8-K as filed with the SEC on October 1, 2004 (File No. 1-14760). |
|
|
|
|
|
3.1.10 |
|
Articles Supplementary relating to the 8.875% Series C Cumulative Redeemable Preferred Shares of Beneficial Interest, (the “Series C Preferred Shares”) of RAIT. Incorporated by reference to RAIT’s Form 8-A as filed with the SEC on June 29, 2007 (File No. 1-14760). |
|
|
|
|
|
3.1.11 |
|
Articles Supplementary relating to Series A Preferred Shares, Series B Preferred Shares and Series C Preferred Shares. Incorporated by reference to RAIT’s Form 8-K as filed with the SEC on May 25, 2012 (File No. 1-14760). |
|
|
|
|
|
3.1.12 |
|
Certificate of Correction relating to Series A Preferred Shares, Series B Preferred Shares and Series C Preferred Shares. Incorporated by reference to RAIT’s Form 10-Q for the quarterly period ended June 30, 2012 (File No. 1-14760). |
|
|
|
|
|
3.1.13 |
|
Articles Supplementary (the “Series D Articles Supplementary”) relating to the Series D Cumulative Redeemable Preferred Shares of Beneficial Interest (the “Series D Preferred Shares”) of RAIT. Incorporated by reference to RAIT’s Form 8-K as filed with the SEC on October 4, 2012 (File No. 1-14760). |
|
|
|
|
|
3.1.14 |
|
Articles Supplementary relating to the Series E Cumulative Redeemable Preferred Shares of Beneficial Interest (the “Series E Preferred Shares”) of RAIT. Incorporated by reference to RAIT’s Form 8-K as filed with the SEC on December 4, 2012 (File No.1-14760). |
|
|
|
|
|
3.1.15 |
|
Amendment dated November 30, 2012 to the Series D Articles Supplementary. Incorporated by reference to RAIT’s Form 8-K as filed with the SEC on December 4, 2012 (File No.1-14760). |
|
|
|
|
|
3.1.16 |
|
Articles Supplementary relating to the Series A Preferred Shares. Incorporated by reference to RAIT’s Form 8-K as filed with the SEC on June 13, 2014 (File No. 1-14760). |
|
|
|
|
|
3.2.1 |
|
By-laws of RAIT. Incorporated by reference to RAIT’s Form 8-K as filed with the SEC on October 19, 2009 (File No. 1-14760). |
|
|
|
|
|
3.2.2 |
|
First Amendment to the Bylaws of RAIT. Incorporated by reference to RAIT’s Form 8-K as filed with the SEC on April 6, 2015 (File No. 1-14760). |
|
|
|
|
|
4.1.1 |
|
Form of Certificate for Common Shares of Beneficial Interest. Incorporated by reference to RAIT’s Form 8-K as filed with the SEC on July 1, 2011 (File No. 1-14760). |
67
|
Exhibit Number |
|
Description of Documents |
|
|
|
|
|
4.1.2 |
|
Form of Certificate for the Series A Preferred Shares. Incorporated by reference to RAIT’s Form 8-K as filed with the SEC on March 22, 2004 (File No. 1-14760). |
|
|
|
|
|
4.1.3 |
|
Form of Certificate for the Series B Preferred Shares. Incorporated by reference to RAIT’s Form 8-K as filed with the SEC on October 1, 2004 (File No. 1-14760). |
|
|
|
|
|
4.1.4 |
|
Form of Certificate for the Series C Preferred Shares. Incorporated by reference to RAIT’s Form 8-A as filed with the SEC on June 29, 2007 (File No. 1-14760). |
|
|
|
|
|
4.1.5 |
|
Form of Certificate for the Series D Preferred Shares. Incorporated by reference to RAIT’s Form 8-K as filed with the SEC on October 23, 2012 (File No. 1-14760). |
|
|
|
|
|
4.1.6 |
|
Form of Certificate for the Series E Preferred Shares. Incorporated by reference to RAIT’s Form 8-K as filed with the SEC on October 23, 2012 (File No. 1-14760). |
|
|
|
|
|
4.2.1 |
|
Base Indenture dated as of December 10, 2013 between RAIT, as issuer, and Wells Fargo Bank, National Association., as trustee. Incorporated by reference to RAIT’s Form 8-K as filed with the SEC on December 13, 2013 (File No. 1-14760). |
|
|
|
|
|
4.2.2 |
|
Supplemental Indenture dated as of December 10, 2013 between RAIT, as issuer, and Wells Fargo Bank, National Association., as trustee. Incorporated by reference to RAIT’s Form 8-K as filed with the SEC on December 13, 2013 (File No. 1-14760). |
|
|
|
|
|
4.2.3 |
|
Form of RAIT 4.00% Convertible Senior Note due 2033 (included in Exhibit 4.2.2). Incorporated by reference to RAIT’s Form 8-K as filed with the SEC on December 13, 2013 (File No. 1-14760). |
|
|
|
|
|
4.3.1 |
|
Base Indenture dated as of March 21, 2011 between RAIT, as issuer, and Wells Fargo Bank, National Association., as trustee. Incorporated by reference to RAIT’s Form 8-K as filed with the SEC on March 22, 2011 (File No. 1-14760). |
|
|
|
|
|
4.3.2 |
|
Supplemental Indenture dated as of March 21, 2011 between RAIT, as issuer, and Wells Fargo Bank, National Association., as trustee. Incorporated by reference to RAIT’s Form 8-K as filed with the SEC on March 22, 2011 (File No. 1-14760). |
|
|
|
|
|
4.4 |
|
Indenture dated as of October 5, 2011 between RAIT and Wilmington Trust, National Association, as trustee. Incorporated by reference to RAIT’s Form 10-Q for the quarterly period ended September 30, 2011 (File No. 1-14760). |
|
|
|
|
|
4.5.1 |
|
Registration Rights Agreement dated as of October 1, 2012 by and among RAIT and ARS VI Investor I, LLC (“ARS VI”). Incorporated by reference to RAIT’s Form 8-K as filed with the SEC on October 4, 2012 (File No. 1-14760). |
|
|
|
|
|
4.5.2 |
|
Amendment No. 1 to Registration Rights Agreement dated as of April 25, 2014 by and among RAIT and ARS VI. Incorporated by reference to RAIT’s Registration Statement on Form S-3 (Registration No. 333-195547). |
|
|
|
|
|
4.5.3 |
|
Common Share Purchase Warrant No.1 dated October 17, 2012 issued by RAIT to ARS VI. Incorporated by reference to RAIT’s Form 8-K as filed with the SEC on October 23, 2012 (File No. 1-14760). |
|
|
|
|
|
4.5.4 |
|
Common Share Appreciation Right No.1 dated October 17, 2012 issued by RAIT to ARS VI. Incorporated by reference to RAIT’s Form 8-K as filed with the SEC on October 23, 2012 (File No. 1-14760). |
|
|
|
|
|
4.5.5 |
|
Common Share Purchase Warrant No. 2 dated November 15, 2012 issued by RAIT to ARS VI. Incorporated by reference to RAIT’s Form 8-K as filed with the SEC on November 21, 2012 (File No.1-14760). |
|
|
|
|
|
4.5.6 |
|
Common Share Appreciation Right No. 2 dated November 15, 2012 issued by RAIT to ARS VI. Incorporated by reference to RAIT’s Form 8-K as filed with the SEC on November 21, 2012 (File No.1-14760). |
|
|
|
|
|
4.5.7 |
|
Common Share Purchase Warrant No. 3 dated December 18, 2012 issued by RAIT to ARS VI. Incorporated by reference to RAIT’s Form 8-K as filed with the SEC on December 18, 2012 (File No.1-14760). |
|
|
|
|
|
4.5.8 |
|
Common Share Appreciation Right No. 3 dated December 18, 2012 issued by RAIT to ARS VI. Incorporated by reference to RAIT’s Form 8-K as filed with the SEC on December 18, 2012 (File No.1-14760). |
|
|
|
|
|
4.5.9 |
|
Common Share Purchase Warrant No. 4 dated March 27, 2014 issued by RAIT Financial Trust to ARS VI. Incorporated by reference to RAIT’s Form 8-K as filed with the SEC on March 27, 2014 (File No. 1-14760). |
|
|
|
|
|
4.5.10 |
|
Common Share Appreciation Right No. 4 dated March 27, 2014 issued by RAIT Financial Trust to ARS VI. Incorporated by reference to RAIT’s Form 8-K as filed with the SEC on March 27, 2014 (File No. 1-14760). |
68
|
Exhibit Number |
|
Description of Documents |
|
|
|
|
|
4.6.1 |
|
Base Indenture dated as of December 10, 2013 between RAIT, as issuer, and Wells Fargo Bank, National Association., as trustee. Incorporated by reference to RAIT’s Form 8-K as filed with the SEC on December 13, 2013 (File No. 1-14760). |
|
|
|
|
|
4.6.2 |
|
Supplemental Indenture dated as of December 10, 2013 between RAIT, as issuer, and Wells Fargo Bank, National Association., as trustee. Incorporated by reference to RAIT’s Form 8-K as filed with the SEC on December 13, 2013 (File No. 1-14760). |
|
|
|
|
|
4.6.3 |
|
Form of RAIT 4.00% Convertible Senior Note due 2033 (included in Exhibit 4.6.2). Incorporated by reference to RAIT’s Form 8-K as filed with the SEC on December 13, 2013 (File No. 1-14760). |
|
|
|
|
|
4.6.4 |
|
Second Supplemental Indenture, dated as of April 14, 2014, between RAIT Financial Trust, as issuer, and Wells Fargo Bank, National Association, as trustee. Incorporated by reference to RAIT’s Form 8-A as filed with the SEC on April 14, 2014. (File No. 1-14760). |
|
|
|
|
|
4.6.5 |
|
Form of 7.625% Senior Notes due 2024 (included as Exhibit A to Exhibit 4.6.4 hereto). |
|
|
|
|
|
4.6.6 |
|
Third Supplemental Indenture, dated as of August 14, 2014, between RAIT, as Issuer, and Wells Fargo Bank, National Association, as trustee. Incorporated by reference to RAIT’s Form 8-A as filed with the SEC on August 14, 2014. |
|
|
|
|
|
4.6.7 |
|
Form of 7.125% Senior Notes due 2019 (included as Exhibit A to Exhibit 4.6.6 hereto). |
|
|
|
|
|
|
|
Certain Instruments defining the rights of holders of long-term debt securities of the Registrant and its subsidiaries are omitted pursuant to Item 601(b)(4)(iii) of Regulation S-K. The Registrant hereby undertakes to furnish to the SEC, upon request, copies of any such instruments. |
|
|
|
|
|
10.1 |
|
Terms of 2015 Annual Incentive Compensation Plan (the “2015 AICP”) and the 2015 Long Term Incentive Plan (the “2015 LTIP”) and the 2015 awards made thereunder adopted under the RAIT 2012 Incentive Award Plan (“IAP”). Incorporated by reference to RAIT’s Form 8-K as filed with the SEC on April 6, 2016 (File No. 1-14760). |
|
|
|
|
|
10.2 |
|
Terms of the 2015 AICP and the 2015 LTIP and the 2016 LTIP and the 2016 awards made thereunder adopted under the IAP. Incorporated by reference to RAIT’s Form 8-K as filed with the SEC on April 28, 2016 (File No. 1-14760). |
|
|
|
|
|
10.3 |
|
RAIT 2016 Annual Incentive Compensation Plan Form of Target Cash Bonus Award Grant Agreement adopted under the RAIT 2012 Incentive Award Plan (“IAP”). Incorporated by reference to RAIT’s Form 10-Q for the quarterly period ended June 30, 2016 (File No. 1-14760). |
|
|
|
|
|
10.4 |
|
RAIT 2016 Long Term Incentive Plan Form of Performance Share Unit Award Grant Agreement adopted under the IAP. Incorporated by reference to RAIT’s Form 10-Q for the quarterly period ended June 30, 2016 (File No. 1-14760). |
|
|
|
|
|
10.5 |
|
Amendment 2016-1 to RAIT 2015 Long Term Incentive Plan Form of Performance Share Unit Award Grant Agreement adopted under the IAP. Incorporated by reference to RAIT’s Form 10-Q for the quarterly period ended June 30, 2016 (File No. 1-14760). |
|
|
|
|
|
10.6 |
|
Share Award Grant Agreement dated as of May 23, 2016 from RAIT Financial Trust to Scott L.N. Davidson under the terms of the RAIT Financial Trust 2012 Incentive Award Plan. Incorporated by reference to RAIT’s Form 8-K as filed with the SEC on May 25, 2016. |
|
|
|
|
|
10.7 |
|
Second Amendment dated as of July 28, 2016 among RAIT CMBS Conduit I, LLC (“Seller I”) and RAIT CRE Conduit III, LLC (“Seller III”), RAIT Financial Trust (to reaffirm its guaranty of the Citi MRA (defined below)) and Citibank, N.A. (“Citibank”) to the Amended and Restated Master Repurchase Agreement, dated as of July 28, 2014 among Seller I, Seller III and Citibank (the “Citi MRA”). Incorporated by reference to RAIT’s Form 8-K as filed with the SEC on July 29, 2016 |
|
|
|
|
|
10.8 |
|
Securities and Asset Purchase Agreement among RAIT Financial Trust, Jupiter Communities, LLC, RAIT TRS, LLC, the RAIT selling stockholders named therein, IRT and IROP dated September 27, 2016. Incorporated by reference to RAIT’s Form 8-K as filed with the SEC on September 27, 2016. |
|
|
|
|
|
10.9 |
|
Binding Memorandum of Understanding, dated September 26, 2016, by and between RAIT Financial Trust and Scott F. Schaeffer. Incorporated by reference to RAIT’s Form 8-K as filed with the SEC on September 27, 2016. |
|
|
|
|
|
10.10 |
|
Binding Memorandum of Understanding, dated September 26, 2016, by and between RAIT Financial Trust and Scott L.N. Davidson. Incorporated by reference to RAIT’s Form 8-K as filed with the SEC on September 27, 2016. |
|
|
|
|
|
10.11 |
|
Binding Memorandum of Understanding, dated September 26, 2016, by and between RAIT Financial Trust and James J. Sebra. Incorporated by reference to RAIT’s Form 8-K as filed with the SEC on September 27, 2016. |
69
|
Exhibit Number |
|
Description of Documents |
|
|
|
|
|
10.12 |
|
Assignment and Amendment No. 6 to Master Repurchase Agreement and Assignment and Amendment No. 4 to Pricing Letter, dated October 20, 2016 among RAIT CRE Conduit II, LLC, as seller, UBS Real Estate Securities Inc., as assignor, UBS AG, as assignee, and RAIT Financial Trust, as guarantor. Incorporated by reference to RAIT’s Form 8-K as filed with the SEC on October 24, 2016. |
|
|
|
|
|
10.13 |
|
Assignment and Reaffirmation of Guaranty, dated October 20, 2016 among UBS Real Estate Securities Inc., as assignor, UBS AG, as assignee, and RAIT Financial Trust, as guarantor. Incorporated by reference to RAIT’s Form 8-K as filed with the SEC on October 24, 2016.
|
|
10.14 |
|
Employment Agreement dated November 1, 2016 between RAIT Financial Trust and Scott L.N. Davidson. Incorporated by reference to RAIT’s Form 8-K as filed with the SEC on November 7, 2016. |
|
|
|
|
|
12.1 |
|
Statements regarding computation of ratios as of September 30, 2016, filed herewith. |
|
|
|
|
|
31.1 |
|
Rule 13a-14(a) Certification by the Chief Executive Officer of RAIT, filed herewith. |
|
|
|
|
|
31.2 |
|
Rule 13a-14(a) Certification by the Chief Financial Officer of RAIT, filed herewith. |
|
|
|
|
|
32.1 |
|
Section 1350 Certification by the Chief Executive Officer of RAIT, filed herewith. |
|
|
|
|
|
32.2 |
|
Section 1350 Certification by the Chief Financial Officer of RAIT, filed herewith. |
|
|
|
|
|
99.1 |
|
Material U.S. Federal Income Tax Considerations. Incorporated by reference to RAIT’s Form 8-K as filed with the SEC on July 29, 2016. |
|
|
|
|
|
101 |
|
Pursuant to Rule 405 of Regulation S-T, the following financial information from RAIT’s Quarterly Report on Form 10-Q for the period ended September 30, 2016 is formatted in XBRL interactive data files: (i) Consolidated Statements of Operations for the three and nine months ended September 30, 2016 and 2015; (ii) Consolidated Balance Sheets as of September 30, 2016 and December 31, 2015; (iii) Consolidated Statements of Comprehensive Income (Loss) for the three and nine months ended September 30, 2016 and 2015; (iv) Consolidated Statement of Changes in Equity for the nine months ended September 30, 2016; (v) Consolidated Statements of Cash Flows for the nine months ended September 30, 2016 and 2015; and (vi) Notes to Unaudited Consolidated Financial Statements, filed herewith. |
70