Attached files
| file | filename |
|---|---|
| EX-31.2 - EX-31.2 - RAIT Financial Trust | d791093dex312.htm |
| EX-32.2 - EX-32.2 - RAIT Financial Trust | d791093dex322.htm |
| EX-32.1 - EX-32.1 - RAIT Financial Trust | d791093dex321.htm |
| EX-31.1 - EX-31.1 - RAIT Financial Trust | d791093dex311.htm |
| EX-12.1 - EX-12.1 - RAIT Financial Trust | d791093dex121.htm |
| EXCEL - IDEA: XBRL DOCUMENT - RAIT Financial Trust | Financial_Report.xls |
Table of Contents
UNITED STATES
SECURITIES AND EXCHANGE COMMISSION
WASHINGTON, D.C. 20549
FORM 10-Q
(Mark One)
| x | Quarterly Report Pursuant to Section 13 or 15(d) of the Securities Exchange Act of 1934 |
For the quarterly period ended September 30, 2014
or
| ¨ | Transition Report Pursuant to Section 13 or 15(d) of the Securities Exchange Act of 1934 |
For the transition period from to
Commission File Number 1-14760
RAIT FINANCIAL TRUST
(Exact name of registrant as specified in its charter)
| Maryland | 23-2919819 | |
| (State or other jurisdiction of incorporation or organization) |
(I.R.S. Employer Identification No.) | |
| 2929 Arch Street, 17th Floor, Philadelphia, PA | 19104 | |
| (Address of principal executive offices) | (Zip Code) | |
(215) 243-9000
(Registrant’s telephone number, including area code)
Indicate by check mark whether the registrant (1) has filed all reports required to be filed by Section 13 or 15(d) of the Securities Exchange Act of 1934 during the preceding 12 months (or for such shorter period that the registrant was required to file such reports), and (2) has been subject to such filing requirements for the past 90 days. x Yes ¨ No
Indicate by check mark whether the registrant has submitted electronically and posted on its corporate Web site, if any, every Interactive Data File required to be submitted and posted pursuant to Rule 405 of Regulation S-T during the preceding 12 months (or for such shorter period that the registrant was required to submit and post such files). x Yes ¨ No
Indicate by check mark whether the registrant is a large accelerated filer, an accelerated filer, a non-accelerated filer, or a smaller reporting company. See the definitions of “large accelerated filer”, “accelerated filer” and “smaller reporting company” in Rule 12b-2 of the Exchange Act.
| Large accelerated filer | ¨ | Accelerated filer | x | |||
| Non-accelerated filer | ¨ (Do not check if a smaller reporting company) | Smaller reporting company | ¨ | |||
Indicate by check mark whether the registrant is a shell company (as defined in Rule 12b-2 of the Exchange Act). ¨ Yes x No
A total of 82,511,313 common shares of beneficial interest, par value $0.03 per share, of the registrant were outstanding as of November 6, 2014.
Table of Contents
RAIT FINANCIAL TRUST
Table of Contents
PART I—FINANCIAL INFORMATION
| Item 1. | Financial Statements |
RAIT Financial Trust
(Unaudited and dollars in thousands, except share and per share information)
| As of September 30, 2014 |
As of December 31, 2013 |
|||||||
| Assets |
||||||||
| Investment in mortgages and loans, at amortized cost: |
||||||||
| Commercial mortgages, mezzanine loans, other loans and preferred equity interests |
$ | 1,369,782 | $ | 1,122,377 | ||||
| Allowance for losses |
(15,662 | ) | (22,955 | ) | ||||
|
|
|
|
|
|||||
| Total investment in mortgages and loans |
$ | 1,354,120 | 1,099,422 | |||||
| Investments in real estate, net of accumulated depreciation of $155,815 and $127,745, respectively |
1,400,715 | 1,004,186 | ||||||
| Investments in securities and security-related receivables, at fair value |
568,279 | 567,302 | ||||||
| Cash and cash equivalents |
116,767 | 88,847 | ||||||
| Restricted cash |
133,374 | 121,589 | ||||||
| Accrued interest receivable |
54,929 | 48,324 | ||||||
| Other assets |
78,948 | 57,081 | ||||||
| Deferred financing costs, net of accumulated amortization of $23,829 and $17,768, respectively |
25,141 | 18,932 | ||||||
| Intangible assets, net of accumulated amortization of $10,941 and $4,564, respectively |
23,944 | 21,554 | ||||||
|
|
|
|
|
|||||
| Total assets |
$ | 3,756,217 | $ | 3,027,237 | ||||
|
|
|
|
|
|||||
| Liabilities and Equity |
||||||||
| Indebtedness ($444,190 and $389,146 at fair value, respectively) |
$ | 2,613,317 | $ | 2,086,401 | ||||
| Accrued interest payable |
34,164 | 26,936 | ||||||
| Accounts payable and accrued expenses |
58,579 | 32,447 | ||||||
| Derivative liabilities |
81,998 | 113,331 | ||||||
| Deferred taxes, borrowers’ escrows and other liabilities |
132,200 | 79,462 | ||||||
|
|
|
|
|
|||||
| Total liabilities |
2,920,258 | 2,338,577 | ||||||
| Series D cumulative redeemable preferred shares, $0.01 par value per share, 4,000,000 shares authorized, 4,000,000 and 2,600,000 shares issued and outstanding, respectively |
76,176 | 52,970 | ||||||
| Equity: |
||||||||
| Shareholders’ equity: |
||||||||
| Preferred shares, $0.01 par value per share, 25,000,000 shares authorized; |
||||||||
| 7.75% Series A cumulative redeemable preferred shares, liquidation preference $25.00 per share, 8,069,288 and 4,760,000 shares authorized, respectively, 4,075,569 and 4,069,288 shares issued and outstanding |
41 | 41 | ||||||
| 8.375% Series B cumulative redeemable preferred shares, liquidation preference $25.00 per share, 4,300,000 shares authorized, 2,288,465 shares issued and outstanding |
23 | 23 | ||||||
| 8.875% Series C cumulative redeemable preferred shares, liquidation preference $25.00 per share, 3,600,000 shares authorized, 1,640,100 shares issued and outstanding |
17 | 17 | ||||||
| Series E cumulative redeemable preferred shares, $0.01 par value per share, 4,000,000 shares authorized |
— | — | ||||||
| Common shares, $0.03 par value per share, 200,000,000 shares authorized, 82,509,635 and 71,447,437 issued and outstanding, respectively, including 541,575 and 369,500 unvested restricted common share awards, respectively |
2,474 | 2,143 | ||||||
| Additional paid in capital |
2,008,814 | 1,920,455 | ||||||
| Accumulated other comprehensive income (loss) |
(43,039 | ) | (63,810 | ) | ||||
| Retained earnings (deficit) |
(1,364,168 | ) | (1,257,306 | ) | ||||
|
|
|
|
|
|||||
| Total shareholders’ equity |
604,162 | 601,563 | ||||||
| Noncontrolling interests |
155,621 | 34,127 | ||||||
|
|
|
|
|
|||||
| Total equity |
759,783 | 635,690 | ||||||
|
|
|
|
|
|||||
| Total liabilities and equity |
$ | 3,756,217 | $ | 3,027,237 | ||||
|
|
|
|
|
|||||
The accompanying notes are an integral part of these consolidated financial statements.
1
Table of Contents
RAIT Financial Trust
Consolidated Statements of Operations
(Unaudited and dollars in thousands, except share and per share information)
| For the Three-Month Periods Ended September 30 |
For the Nine-Month Periods Ended September 30 |
|||||||||||||||
| 2014 | 2013 | 2014 | 2013 | |||||||||||||
| Revenue: |
||||||||||||||||
| Investment interest income |
$ | 33,273 | $ | 32,730 | $ | 102,882 | $ | 95,266 | ||||||||
| Investment interest expense |
(7,636 | ) | (8,235 | ) | (22,342 | ) | (22,996 | ) | ||||||||
|
|
|
|
|
|
|
|
|
|||||||||
| Net interest margin |
25,637 | 24,495 | 80,540 | 72,270 | ||||||||||||
| Rental income |
41,814 | 29,233 | 116,204 | 84,260 | ||||||||||||
| Fee and other income |
7,842 | 8,667 | 19,113 | 22,738 | ||||||||||||
|
|
|
|
|
|
|
|
|
|||||||||
| Total revenue |
75,293 | 62,395 | 215,857 | 179,268 | ||||||||||||
| Expenses: |
||||||||||||||||
| Interest expense |
13,910 | 10,052 | 38,756 | 29,696 | ||||||||||||
| Real estate operating expense |
20,882 | 15,521 | 58,655 | 44,842 | ||||||||||||
| Compensation expense |
7,187 | 6,565 | 23,118 | 19,849 | ||||||||||||
| General and administrative expense |
4,756 | 3,046 | 13,239 | 10,384 | ||||||||||||
| Acquisition expense |
816 | 199 | 1,408 | 199 | ||||||||||||
| Provision for losses |
1,500 | 500 | 3,500 | 1,500 | ||||||||||||
| Depreciation and amortization expense |
13,236 | 8,784 | 38,719 | 25,972 | ||||||||||||
|
|
|
|
|
|
|
|
|
|||||||||
| Total expenses |
62,287 | 44,667 | 177,395 | 132,442 | ||||||||||||
|
|
|
|
|
|
|
|
|
|||||||||
| Operating Income |
13,006 | 17,728 | 38,462 | 46,826 | ||||||||||||
| Other income (expense) |
(21,464 | ) | (3,849 | ) | (21,449 | ) | (3,704 | ) | ||||||||
| Gain (losses) on assets |
25 | (191 | ) | (5,350 | ) | 30 | ||||||||||
| Gain (losses) on extinguishment of debt |
— | — | 2,421 | — | ||||||||||||
| Change in fair value of financial instruments |
(10,223 | ) | (24,659 | ) | (59,433 | ) | (200,436 | ) | ||||||||
|
|
|
|
|
|
|
|
|
|||||||||
| Income (loss) before taxes |
(18,656 | ) | (10,971 | ) | (45,349 | ) | (157,284 | ) | ||||||||
| Income tax benefit (provision) |
2,194 | (164 | ) | 2,454 | 470 | |||||||||||
|
|
|
|
|
|
|
|
|
|||||||||
| Net income (loss) |
(16,462 | ) | (11,135 | ) | (42,895 | ) | (156,814 | ) | ||||||||
| (Income) loss allocated to preferred shares |
(7,407 | ) | (6,024 | ) | (20,628 | ) | (16,831 | ) | ||||||||
| (Income) loss allocated to noncontrolling interests |
603 | 53 | 20 | 130 | ||||||||||||
|
|
|
|
|
|
|
|
|
|||||||||
| Net income (loss) allocable to common shares |
$ | (23,266 | ) | $ | (17,106 | ) | $ | (63,503 | ) | $ | (173,515 | ) | ||||
|
|
|
|
|
|
|
|
|
|||||||||
| Earnings (loss) per share-Basic: |
||||||||||||||||
| Earnings (loss) per share-Basic |
$ | (0.28 | ) | $ | (0.24 | ) | $ | (0.78 | ) | $ | (2.60 | ) | ||||
|
|
|
|
|
|
|
|
|
|||||||||
| Weighted-average shares outstanding-Basic |
81,967,806 | 70,192,918 | 81,111,796 | 66,807,299 | ||||||||||||
|
|
|
|
|
|
|
|
|
|||||||||
| Earnings (loss) per share-Diluted: |
||||||||||||||||
| Earnings (loss) per share-Diluted |
$ | (0.28 | ) | $ | (0.24 | ) | $ | (0.78 | ) | $ | (2.60 | ) | ||||
|
|
|
|
|
|
|
|
|
|||||||||
| Weighted average shares outstanding-Diluted |
81,967,806 | 70,192,918 | 81,111,796 | 66,807,299 | ||||||||||||
|
|
|
|
|
|
|
|
|
|||||||||
The accompanying notes are an integral part of these consolidated financial statements.
2
Table of Contents
RAIT Financial Trust
Consolidated Statements of Comprehensive Income (Loss)
(Unaudited and dollars in thousands)
| For the Three-Month Periods Ended September 30 |
For the Nine-Month Periods Ended September 30 |
|||||||||||||||
| 2014 | 2013 | 2014 | 2013 | |||||||||||||
| Net income (loss) |
$ | (16,462 | ) | $ | (11,135 | ) | $ | (42,895 | ) | $ | (156,814 | ) | ||||
| Other comprehensive income (loss): |
||||||||||||||||
| Change in fair value of interest rate hedges |
221 | (1,641 | ) | (975 | ) | (379 | ) | |||||||||
| Realized (gains) losses on interest rate hedges reclassified to earnings |
6,966 | 7,946 | 21,746 | 24,330 | ||||||||||||
| Change in fair value of available-for-sale securities |
— | 93 | — | 93 | ||||||||||||
|
|
|
|
|
|
|
|
|
|||||||||
| Total other comprehensive income (loss) |
7,187 | 6,398 | 20,771 | 24,044 | ||||||||||||
|
|
|
|
|
|
|
|
|
|||||||||
| Comprehensive income (loss) before allocation to noncontrolling interests |
(9,275 | ) | (4,737 | ) | (22,124 | ) | (132,770 | ) | ||||||||
| Allocation to noncontrolling interests |
603 | 53 | 20 | 130 | ||||||||||||
|
|
|
|
|
|
|
|
|
|||||||||
| Comprehensive income (loss) |
$ | (8,672 | ) | $ | (4,684 | ) | $ | (22,104 | ) | $ | (132,640 | ) | ||||
|
|
|
|
|
|
|
|
|
|||||||||
The accompanying notes are an integral part of these consolidated financial statements.
3
Table of Contents
RAIT Financial Trust
Consolidated Statement of Changes in Equity
(Unaudited and dollars in thousands, except share information)
| Preferred Shares— Series A |
Par Value Preferred Shares— Series A |
Preferred Shares— Series B |
Par Value Preferred Shares— Series B |
Preferred Shares— Series C |
Par Value Preferred Shares— Series C |
Common Shares |
Par Value Common Shares |
Additional Paid In Capital |
Accumulated Other Comprehensive Income (Loss) |
Retained Earnings (Deficit) |
Total Shareholders’ Equity |
Noncontrolling Interests |
Total Equity |
|||||||||||||||||||||||||||||||||||||||||||
| Balance, January 1, 2014 |
4,069,288 | $ | 41 | 2,288,465 | $ | 23 | 1,640,100 | $ | 17 | 71,447,437 | $ | 2,143 | $ | 1,920,455 | $ | (63,810 | ) | $ | (1,257,306 | ) | $ | 601,563 | $ | 34,127 | $ | 635,690 | ||||||||||||||||||||||||||||||
| Net income (loss) |
0 | 0 | 0 | 0 | 0 | 0 | 0 | 0 | 0 | 0 | (42,875 | ) | (42,875 | ) | (20 | ) | (42,895 | ) | ||||||||||||||||||||||||||||||||||||||
| Preferred dividends |
0 | 0 | 0 | 0 | 0 | 0 | 0 | 0 | 0 | 0 | (20,628 | ) | (20,628 | ) | 0 | (20,628 | ) | |||||||||||||||||||||||||||||||||||||||
| Common dividends declared |
0 | 0 | 0 | 0 | 0 | 0 | 0 | 0 | 0 | 0 | (43,359 | ) | (43,359 | ) | 0 | (43,359 | ) | |||||||||||||||||||||||||||||||||||||||
| Other comprehensive income (loss), net |
0 | 0 | 0 | 0 | 0 | 0 | 0 | 0 | 0 | 20,771 | 0 | 20,771 | 0 | 20,771 | ||||||||||||||||||||||||||||||||||||||||||
| Share-based compensation |
0 | 0 | 0 | 0 | 0 | 0 | 0 | 0 | (642 | ) | 0 | 0 | (642 | ) | 0 | (642 | ) | |||||||||||||||||||||||||||||||||||||||
| Issuance of noncontrolling interests |
0 | 0 | 0 | 0 | 0 | 0 | 0 | 0 | 0 | 0 | 0 | 0 | 128,851 | 128,851 | ||||||||||||||||||||||||||||||||||||||||||
| Distribution to noncontrolling interests |
0 | 0 | 0 | 0 | 0 | 0 | 0 | 0 | 0 | 0 | 0 | 0 | (7,337 | ) | (7,337 | ) | ||||||||||||||||||||||||||||||||||||||||
| Preferred shares issued, net |
6,281 | 0 | 0 | 0 | 0 | 0 | 0 | 0 | 85 | 0 | 0 | 85 | 0 | 85 | ||||||||||||||||||||||||||||||||||||||||||
| Common shares issued for equity compensation |
0 | 0 | 0 | 0 | 0 | 0 | 415,456 | 12 | 1,021 | 0 | 0 | 1,033 | 0 | 1,033 | ||||||||||||||||||||||||||||||||||||||||||
| Common shares issued, net |
0 | 0 | 0 | 0 | 0 | 0 | 10,646,742 | 319 | 88,194 | 0 | 0 | 88,513 | 0 | 88,513 | ||||||||||||||||||||||||||||||||||||||||||
| 4.0% convertible senior notes embedded conversion option |
0 | 0 | 0 | 0 | 0 | 0 | 0 | 0 | 1,182 | 0 | 0 | 1,182 | 0 | 1,182 | ||||||||||||||||||||||||||||||||||||||||||
| 4.0% convertible senior notes capped call |
0 | 0 | 0 | 0 | 0 | 0 | 0 | 0 | (1,481 | ) | 0 | 0 | (1,481 | ) | 0 | (1,481 | ) | |||||||||||||||||||||||||||||||||||||||
|
|
|
|
|
|
|
|
|
|
|
|
|
|
|
|
|
|
|
|
|
|
|
|
|
|
|
|
|
|||||||||||||||||||||||||||||
| Balance, September 30, 2014 |
4,075,569 | $ | 41 | 2,288,465 | $ | 23 | 1,640,100 | $ | 17 | 82,509,635 | $ | 2,474 | $ | 2,008,814 | $ | (43,039 | ) | $ | (1,364,168 | ) | $ | 604,162 | $ | 155,621 | $ | 759,783 | ||||||||||||||||||||||||||||||
|
|
|
|
|
|
|
|
|
|
|
|
|
|
|
|
|
|
|
|
|
|
|
|
|
|
|
|
|
|||||||||||||||||||||||||||||
The accompanying notes are an integral part of these consolidated financial statements.
4
Table of Contents
RAIT Financial Trust
Consolidated Statements of Cash Flows
(Unaudited and dollars in thousands)
| For the Nine-Month Periods Ended September 30 |
||||||||
| 2014 | 2013 | |||||||
| Operating activities: |
||||||||
| Net income (loss) |
$ | (42,895 | ) | $ | (156,814 | ) | ||
| Adjustments to reconcile net income (loss) to cash flow from operating activities: |
||||||||
| Provision for losses |
3,500 | 1,500 | ||||||
| Share-based compensation expense |
3,777 | 2,562 | ||||||
| Depreciation and amortization |
38,719 | 25,972 | ||||||
| Amortization of deferred financing costs and debt discounts |
7,728 | 5,860 | ||||||
| Accretion of discounts on investments |
(4,719 | ) | (5,666 | ) | ||||
| (Gains) losses on assets |
5,350 | (30 | ) | |||||
| (Gains) losses on extinguishment of debt |
(2,421 | ) | — | |||||
| Change in fair value of financial instruments |
59,433 | 200,436 | ||||||
| Provision (benefit) for deferred taxes |
(2,634 | ) | — | |||||
| Changes in assets and liabilities: |
||||||||
| Accrued interest receivable |
(7,882 | ) | (4,311 | ) | ||||
| Other assets |
(15,626 | ) | (7,038 | ) | ||||
| Accrued interest payable |
(14,580 | ) | (20,998 | ) | ||||
| Accounts payable and accrued expenses |
21,611 | 8,118 | ||||||
| Deferred taxes, borrowers’ escrows and other liabilities |
14,918 | (4,920 | ) | |||||
|
|
|
|
|
|||||
| Cash flow from operating activities |
64,279 | 44,671 | ||||||
| Investing activities: |
||||||||
| Proceeds from sales of other securities |
8,973 | 96,991 | ||||||
| Purchase and origination of loans for investment |
(695,919 | ) | (419,661 | ) | ||||
| Principal repayments on loans |
134,521 | 50,851 | ||||||
| Sales of conduit loans |
238,988 | 281,959 | ||||||
| Investments in real estate |
(238,648 | ) | (46,725 | ) | ||||
| Proceeds from the disposition of real estate |
3,821 | 3,139 | ||||||
| (Increase) Decrease in restricted cash |
19,627 | (60,662 | ) | |||||
|
|
|
|
|
|||||
| Cash flow from investing activities |
(528,637 | ) | (94,108 | ) | ||||
| Financing activities: |
||||||||
| Repayments on secured credit facilities and loans payable on real estate |
(25,589 | ) | (9,268 | ) | ||||
| Proceeds from secured credit facilities and loans payable on real estate |
102,318 | — | ||||||
| Repayments and repurchase of CDO notes payable |
(174,397 | ) | (135,947 | ) | ||||
| Proceeds from issuance of senior notes from CMBS transaction |
155,001 | 101,250 | ||||||
| Proceeds from issuance of 4.0% convertible senior notes |
16,750 | — | ||||||
| Proceeds from issuance of senior unsecured notes |
131,905 | — | ||||||
| Proceeds from repurchase agreements |
357,550 | 156,781 | ||||||
| Repayments of repurchase agreements |
(236,129 | ) | (138,780 | ) | ||||
| Issuance (acquisition) of noncontrolling interests |
115,728 | 29,322 | ||||||
| Payments for deferred costs and convertible senior note hedges |
(12,313 | ) | (1,864 | ) | ||||
| Preferred share issuance, net of costs incurred |
33,639 | 21,879 | ||||||
| Common share issuance, net of costs incurred |
85,037 | 78,873 | ||||||
| Distributions paid to preferred shareholders |
(17,244 | ) | (12,843 | ) | ||||
| Distributions paid to common shareholders |
(39,978 | ) | (23,384 | ) | ||||
|
|
|
|
|
|||||
| Cash flow from financing activities |
492,278 | 66,019 | ||||||
|
|
|
|
|
|||||
| Net change in cash and cash equivalents |
27,920 | 16,582 | ||||||
| Cash and cash equivalents at the beginning of the period |
88,847 | 100,041 | ||||||
|
|
|
|
|
|||||
| Cash and cash equivalents at the end of the period |
$ | 116,767 | $ | 116,623 | ||||
|
|
|
|
|
|||||
| Supplemental cash flow information: |
||||||||
| Cash paid for interest |
$ | 29,129 | $ | 26,494 | ||||
| Cash paid (refunds received) for taxes |
191 | 509 | ||||||
| Non-cash increase in investments in real estate from conversion of loans |
35,180 | 51,974 | ||||||
| Non-cash increase in non-controlling interests from property acquisition |
3,362 | 1,618 | ||||||
| Non-cash decrease in indebtedness from debt extinguishments |
(2,421 | ) | — | |||||
| Non-cash increase in indebtedness from the assumption of debt from property acquisitions |
129,660 | — | ||||||
| Non-cash increase in other assets from business combination |
7,302 | — | ||||||
The accompanying notes are an integral part of these consolidated financial statements.
5
Table of Contents
RAIT Financial Trust
Notes to Consolidated Financial Statements
As of September 30, 2014
(Unaudited and dollars in thousands, except share and per share amounts)
NOTE 1: THE COMPANY
RAIT Financial Trust invests in and manages a portfolio of real-estate related assets, including direct ownership of real estate properties, and provides a comprehensive set of debt financing options to the real estate industry. References to “RAIT”, “we”, “us”, and “our” refer to RAIT Financial Trust and its subsidiaries, unless the context otherwise requires. RAIT is a self-managed and self-advised Maryland real estate investment trust, or REIT.
We finance a substantial portion of our investments through borrowing and securitization strategies seeking to match the maturities and terms of our financings with the maturities and terms of those investments, and to mitigate interest rate risk through derivative instruments.
NOTE 2: SUMMARY OF SIGNIFICANT ACCOUNTING POLICIES
a. Basis of Presentation
The accompanying unaudited interim consolidated financial statements have been prepared by management in accordance with U.S. generally accepted accounting principles, or GAAP. Certain information and footnote disclosures normally included in annual consolidated financial statements prepared in accordance with GAAP have been condensed or omitted pursuant to such rules and regulations, although we believe that the included disclosures are adequate to make the information presented not misleading. The unaudited interim consolidated financial statements should be read in conjunction with our audited financial statements as of and for the year ended December 31, 2013 included in our Annual Report on Form 10-K. In the opinion of management, all adjustments, consisting only of normal recurring adjustments, necessary to present fairly our consolidated financial position and consolidated results of operations and cash flows are included. The results of operations for the interim periods presented are not necessarily indicative of the results for the full year.
For the nine-month period ended September 30, 2014, gains (losses) on assets in the accompanying consolidated statement of operations includes the write-off of assets totaling $3,001 that were associated with property transactions completed in a prior period.
b. Principles of Consolidation
The consolidated financial statements reflect our accounts and the accounts of our majority-owned and/or controlled subsidiaries. We also consolidate entities that are variable interest entities, or VIEs, where we have determined that we are the primary beneficiary of such entities. The portions of these entities that we do not own are presented as noncontrolling interests as of the dates and for the periods presented in the consolidated financial statements. All intercompany accounts and transactions have been eliminated in consolidation.
We expanded our third party property management platform and own a retail property management firm, which managed 62 properties representing 18,614,490 square feet in 26 states as of September 30, 2014. Upon acquisition in the fourth quarter of 2013, we recorded goodwill with a balance of $14,752 and identifiable intangible assets of $19,050.
Under Financial Accounting Standards Board (FASB) Accounting Standards Codification (ASC) Topic 810, “Consolidation”, the determination of whether to consolidate a VIE is based on the power to direct the activities of the VIE that most significantly impact the VIE’s economic performance together with either the obligation to absorb losses or the right to receive benefits that could be significant to the VIE. We define the power to direct the activities that most significantly impact the VIE’s economic performance as the ability to buy, sell, refinance, or recapitalize assets or entities, and solely control other material operating events or items of the respective entity. For our commercial mortgages, mezzanine loans, and preferred equity investments, certain rights we hold are protective in nature and would preclude us from having the power to direct the activities that most significantly impact the VIE’s economic performance. Assuming both criteria are met, we would be considered the primary beneficiary and would consolidate the VIE. We will continually assess our involvement with VIEs and consolidate the VIEs when we are the primary beneficiary. See Note 9 for additional disclosures pertaining to VIEs.
6
Table of Contents
RAIT Financial Trust
Notes to Consolidated Financial Statements
As of September 30, 2014
(Unaudited and dollars in thousands, except share and per share amounts)
c. Use of Estimates
The preparation of financial statements in conformity with GAAP requires management to make estimates and assumptions that affect the reported amounts of assets and liabilities, the disclosure of contingent assets and liabilities at the date of the financial statements and the reported amounts of revenue and expenses during the reporting periods. The items that include significant estimates are fair value of financial instruments and allowance for losses. Actual results could differ from those estimates.
d. Investments in Loans
We invest in commercial mortgages, mezzanine loans, preferred equity interests, debt securities and other loans. We account for our investments in commercial mortgages, mezzanine loans, preferred equity interests and other loans at amortized cost. The carrying value of these investments is adjusted for origination discounts/premiums, nonrefundable fees and direct costs for originating loans which are amortized into income on a level yield basis over the terms of the loans.
e. Allowance for Losses, Impaired Loans and Non-accrual Status
We maintain an allowance for losses on our investments in commercial mortgages, mezzanine loans and other loans. Management’s periodic evaluation of the adequacy of the allowance is based upon expected and inherent risks in the portfolio, the estimated value of underlying collateral, and current economic conditions. Management reviews loans for impairment and establishes specific reserves when a loss is probable under the provisions of FASB ASC Topic 310, “Receivables.” A loan is impaired when it is probable that we may not collect all principal and interest payments according to the contractual terms. As part of the detailed loan review, we consider many factors about the specific loan, including payment history, asset performance, borrower’s financial capability and other characteristics. If any trends or characteristics indicate that it is probable that other loans, with similar characteristics to those of impaired loans, have incurred a loss, we consider whether an allowance for loss is needed pursuant to FASB ASC Topic 450, “Contingencies.” Management evaluates loans for non-accrual status each reporting period. A loan is placed on non-accrual status when the loan payment deficiencies exceed 90 days. Payments received for non-accrual or impaired loans are applied to principal until the loan is removed from non-accrual status or no longer impaired. Past due interest is recognized on non-accrual loans when they are removed from non-accrual status and are making current interest payments. The allowance for losses is increased by charges to operations and decreased by charge-offs (net of recoveries). Management charges off loans when the investment is no longer realizable and legally discharged.
f. Investments in Real Estate
Investments in real estate are shown net of accumulated depreciation. We capitalize those costs that have been evaluated to improve the real property and depreciate those costs on a straight-line basis over the useful life of the asset. We depreciate real property using the following useful lives: buildings and improvements—30 to 40 years; furniture, fixtures, and equipment—5 to 10 years; and tenant improvements—shorter of the lease term or the life of the asset. Costs for ordinary maintenance and repairs are charged to expense as incurred.
Acquisitions of real estate assets and any related intangible assets are recorded initially at fair value under FASB ASC Topic 805, “Business Combinations.” Fair value is determined by appraisals obtained or by management based on market conditions and inputs at the time the asset is acquired. All expenses incurred to acquire a real estate asset are expensed as incurred.
Management reviews our investments in real estate for impairment whenever events or changes in circumstances indicate that the carrying amount of an asset may not be fully recoverable. The review of recoverability is based on an estimate of the future undiscounted cash flows (excluding interest charges) expected to result from the long-lived asset’s use and eventual disposition. These cash flows consider factors such as expected future operating income, trends and prospects, as well as the effects of leasing demand, competition and other factors. If impairment exists due to the inability to recover the carrying value of a long-lived asset, an impairment loss is recorded to the extent that the carrying value exceeds the estimated fair value of the property.
g. Investments in Securities
We account for our investments in securities under FASB ASC Topic 320, “Investments—Debt and Equity Securities”, and designate each investment security as a trading security, an available-for-sale security, or a held-to-maturity security based on our intent at the time of acquisition. Trading securities are recorded at their fair value each reporting period with fluctuations in fair value reported as a component of earnings. Available-for-sale securities are recorded at fair value with changes in fair value reported as a component of other comprehensive income (loss). We classify certain available-for-sale securities as trading securities when we elect to record them under the fair value option in accordance with FASB ASC Topic 825, “Financial Instruments.” See “m. Fair Value of Financial Instruments.” Upon the sale of an available-for-sale security, the realized gain or loss on the sale will be recorded as a component of earnings in the respective period. Held-to-maturity investments are carried at amortized cost at each reporting period.
7
Table of Contents
RAIT Financial Trust
Notes to Consolidated Financial Statements
As of September 30, 2014
(Unaudited and dollars in thousands, except share and per share amounts)
We account for investments in securities where the transfer meets the criteria as a financing under FASB ASC Topic 860, “Transfers and Servicing”, at fair value. Our investments in security-related receivables represent securities that were transferred to issuers of collateralized debt obligations, or CDOs, in which the transferors maintained some level of continuing involvement. We use our judgment to determine whether an investment in securities has sustained an other-than-temporary decline in value. If management determines that an available-for-sale security has sustained an other-than-temporary decline in its value, the investment is written down to its fair value by a charge to earnings, and we establish a new cost basis for the investment. Our evaluation of an other-than-temporary decline is dependent on the specific facts and circumstances. Factors that we consider in determining whether an other-than-temporary decline in value has occurred include: the estimated fair value of the investment in relation to our cost basis; the financial condition of the related entity; and the intent and ability to retain the investment for a sufficient period of time to allow for recovery of the fair value of the investment.
h. Revenue Recognition
| 1) | Interest income—We recognize interest income from investments in commercial mortgages, mezzanine loans, and other securities on a yield to maturity basis. Upon the acquisition of a loan at a discount, we assess the portions of the discount that constitute accretable yields and non-accretable differences. The accretable yield represents the excess of our expected cash flows from the loan over the amount we paid for the loan. That amount, the accretable yield, is accreted to interest income over the remaining life of the loan. Many of our commercial mortgages and mezzanine loans provide for the accrual of interest at specified rates which differ from current payment terms. Interest income is recognized on such loans at the accrual rate subject to management’s determination that accrued interest and outstanding principal are ultimately collectible. |
For investments that we did not elect to record at fair value under FASB ASC Topic 825, “Financial Instruments”, origination fees and direct loan origination costs are deferred and amortized to net investment income, using the effective interest method, over the contractual life of the underlying loan security or loan, in accordance with FASB ASC Topic 310, “Receivables.”
For investments that we elected to record at fair value under FASB ASC Topic 825, origination fees and direct loan costs are recorded in income and are not deferred.
We recognize interest income from interests in certain securitized financial assets on an estimated effective yield to maturity basis. Management estimates the current yield on the amortized cost of the investment based on estimated cash flows after considering prepayment and credit loss experience.
| 2) | Rental income—We generate rental income from tenant rent and other tenant-related activities at our consolidated real estate properties. For multi-family real estate properties, rental income is recorded when due from residents and recognized monthly as it is earned and realizable, under lease terms which are generally for periods of one year or less. For retail and office real estate properties, rental income is recognized on a straight-line basis from the later of the date of the commencement of the lease or the date of acquisition of the property subject to existing leases, which averages minimum rents over the terms of the leases. Leases also typically provide for tenant reimbursement of a portion of common area maintenance and other operating expenses to the extent that a tenant’s pro rata share of expenses exceeds a base year level set in the lease. |
| 3) | Fee and other income—We generate fee and other income through our various subsidiaries by (a) funding conduit loans for sale into unaffiliated CMBS securitizations, (b) providing or arranging to provide financing to our borrowers, (c) providing ongoing asset management services to investment portfolios under cancelable management agreements, and (d) providing property management services to third parties. We recognize revenue for these activities when the fees are fixed or determinable, are evidenced by an arrangement, collection is reasonably assured and the services under the arrangement have been provided. While we may receive asset management fees when they are earned, we eliminate earned asset management fee income from securitizations while such securitizations are consolidated. |
During the three-month periods ended September 30, 2014 and 2013, we received $681 and $1,143, respectively, of earned asset management fees, of which we eliminated $360 and $867, respectively, of management fee income associated with consolidated securitizations.
During the nine-month periods ended September 30, 2014 and 2013, we received $3,325 and $3,582, respectively, of earned asset management fees, of which we eliminated $2,381 and $2,612, respectively, of management fee income associated with consolidated CDOs.
8
Table of Contents
RAIT Financial Trust
Notes to Consolidated Financial Statements
As of September 30, 2014
(Unaudited and dollars in thousands, except share and per share amounts)
i. Fair Value of Financial Instruments
In accordance with FASB ASC Topic 820, “Fair Value Measurements and Disclosures”, fair value is the price that would be received to sell an asset or paid to transfer a liability in an orderly transaction between market participants at the measurement date. Where available, fair value is based on observable market prices or parameters or derived from such prices or parameters. Where observable prices or inputs are not available, valuation models are applied. These valuation techniques involve management estimation and judgment, the degree of which is dependent on the price transparency for the instruments or market and the instruments’ complexity for disclosure purposes. Assets and liabilities recorded at fair value in the consolidated balance sheets are categorized based upon the level of judgment associated with the inputs used to measure their value. Hierarchical levels, as defined in FASB ASC Topic 820, “Fair Value Measurements and Disclosures” and directly related to the amount of subjectivity associated with the inputs to fair valuations of these assets and liabilities, are as follows:
| • | Level 1: Valuations are based on unadjusted, quoted prices in active markets for identical assets or liabilities at the measurement date. The types of assets carried at level 1 fair value generally are equity securities listed in active markets. As such, valuations of these investments do not entail a significant degree of judgment. |
| • | Level 2: Valuations are based on quoted prices for similar instruments in active markets or quoted prices for identical or similar instruments in markets that are not active or for which all significant inputs are observable, either directly or indirectly. |
Fair value assets and liabilities that are generally included in this category are unsecured REIT note receivables, CMBS receivables and certain financial instruments classified as derivatives where the fair value is based primarily on observable market inputs.
| • | Level 3: Inputs are unobservable inputs for the asset or liability, and include situations where there is little, if any, market activity for the asset or liability. In certain cases, the inputs used to measure fair value may fall into different levels of the fair value hierarchy. In such cases, the level in the fair value hierarchy within which the fair value measurement in its entirety falls has been determined based on the lowest level input that is significant to the fair value measurement in its entirety. Our assessment of the significance of a particular input to the fair value measurement in its entirety requires judgment, and considers factors specific to the asset. Generally, assets and liabilities carried at fair value and included in this category are trust preferred securities, or TruPS, and subordinated debentures, trust preferred obligations and CDO notes payable where significant observable market inputs do not exist. |
The availability of observable inputs can vary depending on the financial asset or liability and is affected by a wide variety of factors, including, for example, the type of investment, whether the investment is new, whether the investment is traded on an active exchange or in the secondary market, and the current market condition. To the extent that valuation is based on models or inputs that are less observable or unobservable in the market, the determination of fair value requires more judgment. Accordingly, the degree of judgment exercised by us in determining fair value is greatest for instruments categorized in level 3.
Fair value is a market-based measure considered from the perspective of a market participant who holds the asset or owes the liability rather than an entity-specific measure. Therefore, even when market assumptions are not readily available, our own assumptions are set to reflect those that management believes market participants would use in pricing the asset or liability at the measurement date. We use prices and inputs that management believes are current as of the measurement date, including during periods of market dislocation. In periods of market dislocation, the observability of prices and inputs may be reduced for many instruments. This condition could cause an instrument to be transferred from Level 1 to Level 2 or Level 2 to Level 3.
Many financial instruments have bid and ask prices that can be observed in the marketplace. Bid prices reflect the highest price that buyers in the market are willing to pay for an asset. Ask prices represent the lowest price that sellers in the market are willing to accept for an asset. For financial instruments whose inputs are based on bid-ask prices, we do not require that fair value always be a predetermined point in the bid-ask range. Our policy is to allow for mid-market pricing and adjusting to the point within the bid-ask range that results in our best estimate of fair value.
9
Table of Contents
RAIT Financial Trust
Notes to Consolidated Financial Statements
As of September 30, 2014
(Unaudited and dollars in thousands, except share and per share amounts)
Fair value for certain of our Level 3 financial instruments is derived using internal valuation models. These internal valuation models include discounted cash flow analyses developed by management using current interest rates, estimates of the term of the particular instrument, specific issuer information and other market data for securities without an active market. In accordance with FASB ASC Topic 820, “Fair Value Measurements and Disclosures”, the impact of our own credit spreads is also considered when measuring the fair value of financial assets or liabilities, including derivative contracts. Where appropriate, valuation adjustments are made to account for various factors, including bid-ask spreads, credit quality and market liquidity. These adjustments are applied on a consistent basis and are based on observable inputs where available. Management’s estimate of fair value requires significant management judgment and is subject to a high degree of variability based upon market conditions, the availability of specific issuer information and management’s assumptions.
j. Deferred Financing Costs and Intangible Assets
Costs incurred in connection with debt financing are capitalized as deferred financing costs and charged to interest expense over the terms of the related debt agreements, under the effective interest method.
Intangible assets on our consolidated balance sheets represent identifiable intangible assets acquired in business acquisitions. We amortize identified intangible assets to expense over their estimated lives using the straight-line method. We evaluate intangible assets for impairment as events and circumstances change, in accordance with FASB ASC Topic 360, “Property, Plant, and Equipment.” The gross carrying amount for our customer relationships was $21,726 as of September 30, 2014 and December 31, 2013. The gross carrying amount for our in-place leases was $11,659 and $2,892 as of September 30, 2014 and December 31, 2013, respectively. The gross carrying amount for our trade name was $1,500 as of September 30, 2014 and December 31, 2013, respectively. The accumulated amortization for our intangible assets was $10,941 and $4,564 as of September 30, 2014 and December 31, 2013, respectively. We recorded amortization expense of $1,980 and $228 for the three-month periods ended September 30, 2014 and 2013, respectively, and $6,376 and $1,318 for the nine-month periods ended September 30, 2014 and 2013, respectively. Based on the intangible assets identified above, we expect to record amortization expense of intangible assets of $1,758 for the remainder of 2014, $4,326 for 2015, $3,520 for 2016, $2,522 for 2017, $2,031 for 2018 and $9,788 thereafter.
k. Recent Accounting Pronouncements
In April 2014, the FASB issued an accounting standard classified under FASB ASC Topic 205, “Presentation of Financial Statements”. This accounting standard amends existing guidance to change reporting requirements for discontinued operations by requiring the disposal of an entity to be reported in discontinued operations if the disposal represents a strategic shift that has or will have a major effect on an entity’s operations and financial results. This standard is effective for interim and annual reporting periods beginning on or after December 15, 2014. Management is currently evaluating the impact that this standard may have on our consolidated financial statements.
In May 2014, the FASB issued an accounting standard classified under FASB ASC Topic 606, “Revenue from Contracts with Customers”. This accounting standard generally replaces existing guidance by requiring an entity to recognize the amount of revenue to which it expects to be entitled for the transfer of promised goods or services to customers. This standard is effective for annual reporting periods beginning after December 15, 2016. Management is currently evaluating the impact that this standard may have on our consolidated financial statements.
10
Table of Contents
RAIT Financial Trust
Notes to Consolidated Financial Statements
As of September 30, 2014
(Unaudited and dollars in thousands, except share and per share amounts)
NOTE 3: INVESTMENTS IN LOANS
Investments in Commercial Mortgages, Mezzanine Loans, Other Loans and Preferred Equity Interests
The following table summarizes our investments in commercial mortgages, mezzanine loans, other loans and preferred equity interests as of September 30, 2014:
| Unpaid Principal Balance |
Unamortized (Discounts) Premiums |
Carrying Amount |
Number of Loans |
Weighted- Average Coupon (1) |
Range of Maturity Dates | |||||||||||||||||
| Commercial Real Estate (CRE) Loans |
||||||||||||||||||||||
| Commercial mortgages (2) |
$ | 1,068,977 | $ | (15,787 | ) | $ | 1,053,190 | 86 | 5.9 | % | Dec. 2014 to Jul. 2044 | |||||||||||
| Mezzanine loans |
257,553 | (2,576 | ) | 254,977 | 77 | 9.4 | % | Dec. 2014 to Jan. 2029 | ||||||||||||||
| Preferred equity interests |
42,608 | 0 | 42,608 | 10 | 7.7 | % | May 2015 to Aug. 2025 | |||||||||||||||
|
|
|
|
|
|
|
|
|
|
|
|||||||||||||
| Total CRE Loans |
1,369,138 | (18,363 | ) | 1,350,775 | 173 | 6.6 | % | |||||||||||||||
| Other loans |
20,138 | 53 | 20,191 | 1 | 2.8 | % | Oct. 2016 | |||||||||||||||
|
|
|
|
|
|
|
|
|
|
|
|||||||||||||
| Total Loans |
$ | 1,389,276 | $ | (18,310 | ) | $ | 1,370,966 | 174 | 6.6 | % | ||||||||||||
|
|
|
|
|
|||||||||||||||||||
| Deferred fees |
(1,184 | ) | 0 | (1,184 | ) | |||||||||||||||||
|
|
|
|
|
|
|
|||||||||||||||||
| Total investments in loans |
$ | 1,388,092 | $ | (18,310 | ) | $ | 1,369,782 | |||||||||||||||
|
|
|
|
|
|
|
|||||||||||||||||
| (1) | Weighted-average coupon is calculated on the unpaid principal amount of the underlying instruments, which does not necessarily correspond to the carrying amount. |
| (2) | Commercial mortgages includes 11 conduit loans with an unpaid principal balance and carrying amount of $107,164, a weighted-average coupon of 4.6% and maturity dates ranging from September 2021 through July 2044. These commercial mortgages are classified as loans held for sale. |
The following table summarizes our investments in commercial mortgages, mezzanine loans, other loans and preferred equity interests as of December 31, 2013:
| Unpaid Principal Balance |
Unamortized (Discounts) Premiums |
Carrying Amount |
Number of Loans |
Weighted- Average Coupon (1) |
Range of Maturity Dates | |||||||||||||||||
| Commercial Real Estate (CRE) Loans |
||||||||||||||||||||||
| Commercial mortgages (2) |
$ | 792,526 | $ | (19,257 | ) | $ | 773,269 | 59 | 6.4 | % | Mar. 2014 to Jan. 2029 | |||||||||||
| Mezzanine loans |
269,034 | (3,273 | ) | 265,761 | 81 | 9.6 | % | Mar. 2014 to Jan. 2029 | ||||||||||||||
| Preferred equity interests |
54,389 | (939 | ) | 53,450 | 11 | 8.6 | % | May 2015 to Aug. 2025 | ||||||||||||||
|
|
|
|
|
|
|
|
|
|
|
|||||||||||||
| Total CRE Loans |
1,115,949 | (23,469 | ) | 1,092,480 | 151 | 7.3 | % | |||||||||||||||
| Other loans |
30,625 | 72 | 30,697 | 2 | 4.3 | % | Mar. 2014 to Oct. 2016 | |||||||||||||||
|
|
|
|
|
|
|
|
|
|
|
|||||||||||||
| Total Loans |
1,146,574 | (23,397 | ) | 1,123,177 | 153 | 7.2 | % | |||||||||||||||
|
|
|
|
|
|||||||||||||||||||
| Deferred fees |
(800 | ) | 0 | (800 | ) | |||||||||||||||||
|
|
|
|
|
|
|
|||||||||||||||||
| Total investments in loans |
$ | 1,145,774 | $ | (23,397 | ) | $ | 1,122,377 | |||||||||||||||
|
|
|
|
|
|
|
|||||||||||||||||
| (1) | Weighted-average coupon is calculated on the unpaid principal amount of the underlying instruments, which does not necessarily correspond to the carrying amount. |
| (2) | Commercial mortgages includes six conduit loans with an unpaid principal balance and carrying amount of $61,825, a weighted-average coupon of 5.3% and maturity dates ranging from January 2024 through January 2029. These commercial mortgages are classified as loans held for sale. |
11
Table of Contents
RAIT Financial Trust
Notes to Consolidated Financial Statements
As of September 30, 2014
(Unaudited and dollars in thousands, except share and per share amounts)
During the nine-month period ended September 30, 2014, we completed the conversion of two commercial real estate loans with a carrying value of $35,404 to real estate owned property. We recorded a gain on asset of $136 on one property as the value of the real estate exceeded the carrying amount of the converted loan and charged off $360 to the allowance for losses as the carrying amount of the other loan exceeded the fair value of the real estate property. During the nine-month period ended September 30, 2013, we did not convert any commercial real estate loans to owned real estate property.
In June 2014, we sold all of the remaining interests, held by Taberna VIII and Taberna IX, in one of our other investments with an unpaid principal balance of $10,488 for $2,850. We recorded a loss on sale of asset of $7,638 due to the illiquid nature of the investment.
The following table summarizes the delinquency statistics of our commercial real estate loans as of September 30, 2014 and December 31, 2013:
| Delinquency Status |
As of September 30, 2014 |
As of December 31, 2013 |
||||||
| 30 to 59 days |
$ | 0 | $ | 0 | ||||
| 60 to 89 days |
0 | 6,441 | ||||||
| 90 days or more |
32,811 | 13,603 | ||||||
| In foreclosure or bankruptcy proceedings |
7,930 | 23,470 | ||||||
|
|
|
|
|
|||||
| Total |
$ | 40,741 | $ | 43,514 | ||||
|
|
|
|
|
|||||
As of September 30, 2014 and December 31, 2013, approximately $40,741 and $37,073, respectively, of our commercial real estate loans were on non-accrual status and had a weighted-average interest rate of 7.3% and 6.3%, respectively.
During the nine-month period ended September 30, 2014, we removed a loan with an unpaid principal balance of $5,500 from non-accrual status. The carrying amount of this loan is $4,330 as it was acquired at a discount. We recorded $882 of accrued interest which represents the interest during the time the loan was on non-accrual status. Management believes the entire unpaid principal balance and all accrued interest is collectible.
Allowance For Losses And Impaired Loans
The following table provides a roll-forward of our allowance for losses for our commercial mortgages, mezzanine loans and other loans for the three-month periods ended September 30, 2014 and 2013:
| For the Three-Month Period Ended September 30, 2014 |
For the Three-Month Period Ended September 30, 2013 |
|||||||
| Beginning balance |
$ | 15,336 | $ | 24,222 | ||||
| Provision |
1,500 | 500 | ||||||
| Charge-offs, net of recoveries |
(1,174 | ) | (1,405 | ) | ||||
|
|
|
|
|
|||||
| Ending balance |
$ | 15,662 | $ | 23,317 | ||||
|
|
|
|
|
|||||
The following table provides a roll-forward of our allowance for losses for our commercial mortgages, mezzanine loans and other loans for the nine-month periods ended September 30, 2014 and 2013:
| For the Nine-Month Period Ended September 30, 2014 |
For the Nine-Month Period Ended September 30, 2013 |
|||||||
| Beginning balance |
$ | 22,955 | $ | 30,400 | ||||
| Provision |
3,500 | 1,500 | ||||||
| Charge-offs, net of recoveries |
(10,793 | ) | (8,583 | ) | ||||
|
|
|
|
|
|||||
| Ending balance |
$ | 15,662 | $ | 23,317 | ||||
|
|
|
|
|
|||||
12
Table of Contents
RAIT Financial Trust
Notes to Consolidated Financial Statements
As of September 30, 2014
(Unaudited and dollars in thousands, except share and per share amounts)
As of September 30, 2014 and December 31, 2013, we identified 14 commercial mortgages and mezzanine loans with unpaid principal balances and recorded investment of $64,741 and $55,573, respectively, as impaired.
The average unpaid principal balance and recorded investment of total impaired loans was $65,129 and $65,199 during the three-month periods ended September 30, 2014 and 2013, respectively, and $58,088 and $67,315 during the nine-month periods ended September 30, 2014 and 2013, respectively. As of September 30, 2014, there are four impaired loans with unpaid principal balances of $20,180 for which there is no allowance. We recorded interest income from impaired loans of $53 and $23 for the three-month periods ended September 30, 2014 and 2013, respectively. We recorded interest income from impaired loans of $938 and $229 for the nine-month periods ended September 30, 2014 and 2013, respectively.
We have evaluated modifications to our commercial real estate loans to determine if the modification constitutes a troubled debt restructuring (TDR) under FASB ASC Topic 310, “Receivables”. During the nine-month period ended September 30, 2014, we have determined that a modification to one commercial real estate loan constituted a TDR as the borrower was experiencing financial difficulties and we, as the lender, granted a concession to the borrower by deferring principal payments to future periods. The outstanding recorded investment was $11,140 both before and after the modification. As of September 30, 2014, there were no TDRs that subsequently defaulted for modifications within the previous 12 months.
NOTE 4: INVESTMENTS IN SECURITIES
Our investments in securities and security-related receivables are accounted for at fair value. The following table summarizes our investments in securities as of September 30, 2014:
| Investment Description |
Amortized Cost |
Gross Unrealized Gains |
Gross Unrealized Losses |
Estimated Fair Value |
Weighted Average Coupon (1) |
Weighted Average Years to Maturity |
||||||||||||||||||
| Trading securities |
||||||||||||||||||||||||
| TruPS and subordinated debentures |
$ | 602,376 | $ | 0 | $ | (112,438 | ) | $ | 489,938 | 3.8 | % | 20.2 | ||||||||||||
| Other securities |
12,604 | 0 | (12,604 | ) | 0 | 4.7 | % | 38.1 | ||||||||||||||||
|
|
|
|
|
|
|
|
|
|
|
|
|
|||||||||||||
| Total trading securities |
614,980 | 0 | (125,042 | ) | 489,938 | 3.8 | % | 20.5 | ||||||||||||||||
| Available-for-sale securities |
3,600 | 0 | (2,970 | ) | 630 | 2.0 | % | 28.1 | ||||||||||||||||
| Security-related receivables |
||||||||||||||||||||||||
| TruPS and subordinated debenture receivables |
32,900 | 0 | (25,217 | ) | 7,683 | 3.4 | % | 17.5 | ||||||||||||||||
| Unsecured REIT note receivables |
30,000 | 2,532 | 0 | 32,532 | 6.7 | % | 2.4 | |||||||||||||||||
| CMBS receivables (2) |
53,383 | 1,656 | (18,604 | ) | 36,435 | 5.8 | % | 32.0 | ||||||||||||||||
| Other securities |
28,328 | 0 | (27,267 | ) | 1,061 | 2.3 | % | 35.6 | ||||||||||||||||
|
|
|
|
|
|
|
|
|
|
|
|
|
|||||||||||||
| Total security-related receivables |
144,611 | 4,188 | (71,088 | ) | 77,711 | 4.7 | % | 23.3 | ||||||||||||||||
|
|
|
|
|
|
|
|
|
|
|
|
|
|||||||||||||
| Total investments in securities |
$ | 763,191 | $ | 4,188 | $ | (199,100 | ) | $ | 568,279 | 4.0 | % | 21.2 | ||||||||||||
|
|
|
|
|
|
|
|
|
|
|
|
|
|||||||||||||
| (1) | Weighted-average coupon is calculated on the unpaid principal amount of the underlying instruments, which does not necessarily correspond to the carrying amount. |
| (2) | CMBS receivables include securities with a fair value totaling $12,122 that are rated between “AAA” and “A-” by Standard & Poor’s, securities with a fair value totaling $22,667 that are rated “BBB+” and “B-” by Standard & Poor’s and securities with a fair value totaling $1,646 that are rated “D” by Standard & Poor’s. |
All of our gross unrealized losses at September 30, 2014 were greater than 12 months.
13
Table of Contents
RAIT Financial Trust
Notes to Consolidated Financial Statements
As of September 30, 2014
(Unaudited and dollars in thousands, except share and per share amounts)
The following table summarizes our investments in securities as of December 31, 2013:
| Investment Description |
Amortized Cost |
Gross Unrealized Gains |
Gross Unrealized Losses |
Estimated Fair Value |
Weighted Average Coupon (1) |
Weighted Average Years to Maturity |
||||||||||||||||||
| Trading securities |
||||||||||||||||||||||||
| TruPS and subordinated debentures |
$ | 620,376 | $ | 0 | $ | (139,531 | ) | $ | 480,845 | 3.7 | % | 20.4 | ||||||||||||
| Other securities |
12,312 | 0 | (12,312 | ) | 0 | 4.7 | % | 38.9 | ||||||||||||||||
|
|
|
|
|
|
|
|
|
|
|
|
|
|||||||||||||
| Total trading securities |
632,688 | 0 | (151,843 | ) | 480,845 | 3.8 | % | 20.8 | ||||||||||||||||
| Available-for-sale securities |
3,600 | 0 | (3,598 | ) | 2 | 2.0 | % | 28.9 | ||||||||||||||||
| Security-related receivables |
||||||||||||||||||||||||
| TruPS and subordinated debenture receivables |
32,900 | 0 | (24,689 | ) | 8,211 | 3.4 | % | 18.3 | ||||||||||||||||
| Unsecured REIT note receivables |
30,000 | 3,046 | 0 | 33,046 | 6.7 | % | 3.1 | |||||||||||||||||
| CMBS receivables (2) |
69,905 | 1,722 | (27,509 | ) | 44,118 | 5.6 | % | 30.6 | ||||||||||||||||
| Other securities |
33,144 | 0 | (32,064 | ) | 1,080 | 2.2 | % | 36.5 | ||||||||||||||||
|
|
|
|
|
|
|
|
|
|
|
|
|
|||||||||||||
| Total security-related receivables |
165,949 | 4,768 | (84,262 | ) | 86,455 | 4.7 | % | 24.4 | ||||||||||||||||
|
|
|
|
|
|
|
|
|
|
|
|
|
|||||||||||||
| Total investments in securities |
$ | 802,237 | $ | 4,768 | $ | (239,703 | ) | $ | 567,302 | 3.9 | % | 21.7 | ||||||||||||
|
|
|
|
|
|
|
|
|
|
|
|
|
|||||||||||||
| (1) | Weighted-average coupon is calculated on the unpaid principal amount of the underlying instruments, which does not necessarily correspond to the carrying amount. |
| (2) | CMBS receivables include securities with a fair value totaling $8,228 that are rated between “AAA” and “A-” by Standard & Poor’s, securities with a fair value totaling $26,594 that are rated between “BBB+” and “B-” by Standard & Poor’s, securities with a fair value totaling $8,164 that are rated “CCC” by Standard & Poor’s, and securities with a fair value totaling $1,132 that are rated “D” by Standard & Poor’s. |
All of our gross unrealized losses at December 31, 2013 were greater than 12 months.
TruPS included above as trading securities include (a) investments in TruPS issued by VIEs of which we are not the primary beneficiary and which we do not consolidate and (b) transfers of investments in TruPS securities to us that were accounted for as a sale pursuant to FASB ASC Topic 860, “Transfers and Servicing.”
The following table summarizes the non-accrual status of our investments in securities:
| As of September 30, 2014 | As of December 31, 2013 | |||||||||||||||||||||||
| Principal /Par Amount on Non-accrual |
Weighted Average Coupon |
Fair Value | Principal /Par Amount on Non-accrual |
Weighted Average Coupon |
Fair Value | |||||||||||||||||||
| TruPS and TruPS receivables |
$ | 65,557 | 2.0 | % | $ | 650 | $ | 83,557 | 1.8 | % | $ | 5,678 | ||||||||||||
| Other securities |
36,842 | 3.2 | % | 630 | 41,019 | 3.1 | % | 11 | ||||||||||||||||
| CMBS receivables |
15,250 | 5.9 | % | 328 | 22,772 | 5.9 | % | 447 | ||||||||||||||||
The assets of our consolidated CDOs collateralize the debt of such entities and are not available to our creditors. As of September 30, 2014 and December 31, 2013, investment in securities of $635,276 and $653,276, respectively, in principal amount of TruPS and subordinated debentures, and $78,383 and $91,383, respectively, in principal amount of unsecured REIT note receivables and CMBS receivables, collateralized the consolidated CDO notes payable of such entities.
14
Table of Contents
RAIT Financial Trust
Notes to Consolidated Financial Statements
As of September 30, 2014
(Unaudited and dollars in thousands, except share and per share amounts)
NOTE 5: INVESTMENTS IN REAL ESTATE
The table below summarizes our investments in real estate:
| As of September 30, 2014 | As of December 31, 2013 | |||||||||||||||
| Book Value | Number of Properties |
Book Value | Number of Properties |
|||||||||||||
| Multi-family real estate properties (a) |
$ | 1,040,808 | 50 | $ | 716,708 | 37 | ||||||||||
| Office real estate properties |
330,725 | 14 | 282,371 | 11 | ||||||||||||
| Retail real estate properties |
134,341 | 6 | 83,653 | 4 | ||||||||||||
| Parcels of land |
50,656 | 10 | 49,199 | 10 | ||||||||||||
|
|
|
|
|
|
|
|
|
|||||||||
| Subtotal |
1,556,530 | 80 | 1,131,931 | 62 | ||||||||||||
| Less: Accumulated depreciation and amortization (a) |
(155,815 | ) | (127,745 | ) | ||||||||||||
|
|
|
|
|
|||||||||||||
| Investments in real estate |
$ | 1,400,715 | $ | 1,004,186 | ||||||||||||
|
|
|
|
|
|||||||||||||
| (a) | As of September 30, 2014, includes 22 apartment properties owned by Independence Realty Trust, Inc., with 6,470 units and a book value of $444,050 and accumulated depreciation of $20,848. As of December 31, 2013, includes 10 apartment properties owned by Independence Realty Trust, Inc., with 2,790 units and a book value of $190,096 and accumulated depreciation of $15,775. |
As of September 30, 2014, our investments in real estate of $1,400,715 were financed through $379,242 of mortgages held by third parties and $944,662 of mortgages held by our RAIT I and RAIT II CDO securitizations. As of December 31, 2013, our investments in real estate of $1,004,186 were financed through $171,223 of mortgages held by third parties and $864,689 of mortgages held by our RAIT I and RAIT II CDO securitizations. Together, along with commercial real estate loans held by RAIT I and RAIT II, these mortgages serve as collateral for the CDO notes payable issued by the RAIT I and RAIT II CDO securitizations. All intercompany balances and interest charges are eliminated in consolidation.
Acquisitions:
During the nine-month period ended September 30, 2014, we acquired 14 multi-family properties, two retail properties and three office properties with a combined purchase price of $421,879. We assumed first mortgages on some of these properties. Upon acquisition, we recorded the investment in real estate, including any related working capital and intangible assets, at fair value of $427,194 and recorded a gain on assets of $5,675. Of these acquisitions, Independence Realty Trust, Inc., or IRT, acquired 12 multi-family properties at a fair value of $255,831. We consolidate IRT as it is a VIE and we are the primary beneficiary. See Note 9 for additional disclosures pertaining to VIEs.
15
Table of Contents
RAIT Financial Trust
Notes to Consolidated Financial Statements
As of September 30, 2014
(Unaudited and dollars in thousands, except share and per share amounts)
The following table summarizes the aggregate estimated fair value of the assets and liabilities associated with the 19 properties acquired during the nine-month period ended September 30, 2014, on the respective date of each acquisition, for the real estate accounted for under FASB ASC Topic 805.
| Description |
Estimated Fair Value |
|||
| Assets acquired: |
||||
| Investments in real estate |
$ | 418,427 | ||
| Cash and cash equivalents |
308 | |||
| Restricted cash |
3,094 | |||
| Other assets |
2,590 | |||
| Deferred financing costs |
993 | |||
| Intangible assets |
8,767 | |||
|
|
|
|||
| Total assets acquired |
434,179 | |||
| Liabilities assumed: |
||||
| Loans payable on real estate |
127,755 | |||
| Accounts payable and accrued expenses |
5,480 | |||
| Other liabilities |
710 | |||
|
|
|
|||
| Total liabilities assumed |
133,945 | |||
| Noncontrolling interests assumed: |
3,000 | |||
|
|
|
|||
| Estimated fair value of net assets acquired |
$ | 297,234 | ||
|
|
|
|||
The following table summarizes the consideration transferred to acquire the real estate properties and the amounts of identified assets acquired and liabilities assumed at the respective conversion date:
| Description |
Estimated Fair Value |
|||
| Fair value of consideration transferred: |
||||
| Commercial real estate loans and cash |
$ | 297,407 | ||
| Other considerations |
(173 | ) | ||
|
|
|
|||
| Total fair value of consideration transferred |
$ | 297,234 | ||
|
|
|
|||
During the nine-month period ended September 30, 2014, these investments contributed revenue of $22,042 and a net income allocable to common shares of $1,813. During the nine-month period ended September 30, 2014, we incurred $1,127 of third-party acquisition-related costs, which is included in general and administrative expense in the accompanying consolidated statements of operations.
16
Table of Contents
RAIT Financial Trust
Notes to Consolidated Financial Statements
As of September 30, 2014
(Unaudited and dollars in thousands, except share and per share amounts)
The tables below present the revenue, net income and earnings per share effect of the acquired properties, as reported in our consolidated financial statements and on a pro forma basis as if the acquisitions occurred on January 1, 2013. These pro forma results are not necessarily indicative of the results which actually would have occurred if the acquisition had occurred on the first day of the periods presented, nor does the pro forma financial information purport to represent the results of operations for future periods.
| Description |
For the Three-Month Period Ended September 30, 2014 |
For the Three-Month Period Ended September 30, 2013 |
||||||
| Total revenue of real estate properties acquired, as reported |
$ | 10,039 | $ | 0 | ||||
| Pro forma rental income |
45,347 | 42,260 | ||||||
| Net income (loss) allocable to common shares of real estate properties acquired, as reported |
846 | 0 | ||||||
| Pro forma net income (loss) allocable to common shares |
(22,393 | ) | (14,912 | ) | ||||
| Earnings (loss) per share attributable to common shareholders of real estate properties acquired |
||||||||
| Basic and diluted—as reported |
0.01 | 0.00 | ||||||
| Basic and diluted—as pro forma |
(0.27 | ) | (0.21 | ) | ||||
| Description |
For the Nine-Month Period Ended September 30, 2014 |
For the Nine-Month Period Ended September 30, 2013 |
||||||
| Total revenue of real estate properties acquired, as reported |
$ | 22,042 | $ | 0 | ||||
| Pro forma rental income |
133,861 | 122,776 | ||||||
| Net income (loss) allocable to common shares of real estate properties acquired, as reported |
1,813 | 0 | ||||||
| Pro forma net income (loss) allocable to common shares |
(59,458 | ) | (166,797 | ) | ||||
| Earnings (loss) per share attributable to common shareholders of real estate properties acquired |
||||||||
| Basic and diluted—as reported |
0.02 | 0.00 | ||||||
| Basic and diluted—as pro forma |
(0.73 | ) | (2.50 | ) | ||||
We have not yet completed the process of estimating the fair value of assets acquired and liabilities assumed. Accordingly, our preliminary estimates and the allocation of the purchase price to the assets acquired and liabilities assumed may change as we complete the process. In accordance with FASB ASC Topic 805, changes, if any, to the preliminary estimates and allocation will be reported in our financial statements retrospectively. During the nine-month period ended September 30, 2014, we have not recorded any adjustments for prior period real estate acquisitions.
Dispositions:
During the nine-month period ended September 30, 2014, we disposed of one multi-family real estate property for a total sale price of $4,250. We recorded a loss on the sale of this asset of $2,526, of which $319 is included in the accompanying consolidated statements of operations during the nine-month period ended September 30, 2014.
17
Table of Contents
RAIT Financial Trust
Notes to Consolidated Financial Statements
As of September 30, 2014
(Unaudited and dollars in thousands, except share and per share amounts)
NOTE 6: INDEBTEDNESS
We maintain various forms of short-term and long-term financing arrangements. Generally, these financing agreements are collateralized by assets within securitizations. The following table summarizes our total recourse and non-recourse indebtedness as of September 30, 2014:
| Description |
Unpaid Principal Balance |
Carrying Amount |
Weighted- Average Interest Rate |
Contractual Maturity | ||||||||||
| Recourse indebtedness: |
||||||||||||||
| 7.0% convertible senior notes (1) |
$ | 34,066 | $ | 33,297 | 7.0 | % | Apr. 2031 | |||||||
| 4.0% convertible senior notes (2) |
141,750 | 133,752 | 4.0 | % | Oct. 2033 | |||||||||
| 7.625% senior notes |
60,000 | 60,000 | 7.6 | % | Apr. 2024 | |||||||||
| 7.125% senior notes |
71,905 | 71,905 | 7.1 | % | Aug. 2019 | |||||||||
| Secured credit facilities |
5,000 | 5,000 | 2.7 | % | Oct. 2016 | |||||||||
| Junior subordinated notes, at fair value (3) |
18,671 | 13,048 | 0.5 | % | Mar. 2035 | |||||||||
| Junior subordinated notes, at amortized cost |
25,100 | 25,100 | 2.7 | % | Apr. 2037 | |||||||||
| CMBS facilities |
159,171 | 159,171 | 2.4 | % | Nov. 2014 to Jul. 2016 | |||||||||
|
|
|
|
|
|
|
|||||||||
| Total recourse indebtedness (4) |
515,663 | 501,273 | 4.4 | % | ||||||||||
| Non-recourse indebtedness: |
||||||||||||||
| CDO notes payable, at amortized |
1,086,038 | 1,084,289 | 0.6 | % | 2045 to 2046 | |||||||||
| CDO notes payable, at fair value (3)(5)(7) |
846,941 | 431,142 | 1.0 | % | 2037 to 2038 | |||||||||
| CMBS securitizations (8) |
215,518 | 215,518 | 1.9 | % | Jan. 2029 to May 2031 | |||||||||
| Loans payable on real estate (9) |
379,259 | 381,095 | 4.7 | % | Sep. 2015 to Aug. 2024 | |||||||||
|
|
|
|
|
|
|
|||||||||
| Total non-recourse indebtedness |
2,527,756 | 2,112,044 | 1.4 | % | ||||||||||
|
|
|
|
|
|
|
|||||||||
| Total indebtedness |
$ | 3,043,419 | $ | 2,613,317 | 1.9 | % | ||||||||
|
|
|
|
|
|
|
|||||||||
| (1) | Our 7.0% convertible senior notes are redeemable at par, at the option of the holder, in April 2016, April 2021, and April 2026. |
| (2) | Our 4.0% convertible senior notes are redeemable at par, at the option of the holder, in October 2018, October 2023, and October 2028. |
| (3) | Relates to liabilities which we elected to record at fair value under FASB ASC Topic 825. |
| (4) | Excludes senior secured notes issued by us with an aggregate principal amount equal to $80,000 with a weighted average coupon of 7.0%, which are eliminated in consolidation. |
| (5) | Excludes CDO notes payable purchased by us which are eliminated in consolidation. |
| (6) | Collateralized by $1,573,559 principal amount of commercial mortgages, mezzanine loans, other loans and preferred equity interests. These obligations were issued by separate legal entities and consequently the assets of the special purpose entities that collateralize these obligations are not available to our creditors. |
| (7) | Collateralized by $959,310 principal amount of investments in securities and security-related receivables and loans, before fair value adjustments. The fair value of these investments as of September 30, 2014 was $731,911. These obligations were issued by separate legal entities and consequently the assets of the special purpose entities that collateralize these obligations are not available to our creditors. |
| (8) | Excludes the FL1 junior notes and the FL2 junior notes purchased by us which are eliminated in consolidation. Collateralized by $289,470 principal amount of commercial mortgages loans and participation interests. These obligations were issued by separate legal entities and consequently the assets of the special purpose entities that collateralize these obligations are not available to our creditors. |
| (9) | Includes $246,997 of unpaid principal balance with a carrying amount of $248,833 of mortgage indebtedness that encumbers properties owned by IRT. The weighted-average interest rate is 3.7% and has a range of maturity dates from April 2016 to August 2024. |
18
Table of Contents
RAIT Financial Trust
Notes to Consolidated Financial Statements
As of September 30, 2014
(Unaudited and dollars in thousands, except share and per share amounts)
The following table summarizes our total recourse and non-recourse indebtedness as of December 31, 2013:
| Description |
Unpaid Principal Balance |
Carrying Amount |
Weighted- Average Interest Rate |
Contractual Maturity | ||||||||||
| Recourse indebtedness: |
||||||||||||||
| 7.0% convertible senior notes (1) |
$ | 34,066 | $ | 32,938 | 7.0 | % | Apr. 2031 | |||||||
| 4.0% convertible senior notes (2) |
125,000 | 116,184 | 4.0 | % | Oct. 2033 | |||||||||
| Secured credit facilities |
11,129 | 11,129 | 3.2 | % | Oct. 2016 to Dec. 2016 | |||||||||
| Junior subordinated notes, at fair value (3) |
18,671 | 11,911 | 0.5 | % | Mar. 2035 | |||||||||
| Junior subordinated notes, at amortized cost |
25,100 | 25,100 | 2.7 | % | Apr. 2037 | |||||||||
| CMBS facilities |
37,749 | 37,749 | 2.7 | % | Nov. 2014 to Oct. 2015 | |||||||||
|
|
|
|
|
|
|
|||||||||
| Total recourse indebtedness (4) |
251,715 | 235,011 | 3.8 | % | ||||||||||
| Non-recourse indebtedness: |
||||||||||||||
| CDO notes payable, at amortized |
1,204,117 | 1,202,772 | 0.6 | % | 2045 to 2046 | |||||||||
| CDO notes payable, at fair value (3)(5)(7) |
865,199 | 377,235 | 0.9 | % | 2037 to 2038 | |||||||||
| CMBS securitization (8) |
100,139 | 100,139 | 2.1 | % | Jan. 2029 | |||||||||
| Loans payable on real estate (9) |
171,244 | 171,244 | 5.3 | % | Sep. 2015 to Dec. 2023 | |||||||||
|
|
|
|
|
|
|
|||||||||
| Total non-recourse indebtedness |
2,340,699 | 1,851,390 | 1.1 | % | ||||||||||
|
|
|
|
|
|
|
|||||||||
| Total indebtedness |
$ | 2,592,414 | $ | 2,086,401 | 1.4 | % | ||||||||
|
|
|
|
|
|
|
|||||||||
| (1) | Our 7.0% convertible senior notes are redeemable at par, at the option of the holder, in April 2016, April 2021, and April 2026. |
| (2) | Our 4.0% convertible senior notes are redeemable at par, at the option of the holder, in October 2018, October 2023, and October 2028. |
| (3) | Relates to liabilities which we elected to record at fair value under FASB ASC Topic 825. |
| (4) | Excludes senior secured notes issued by us with an aggregate principal amount equal to $86,000 with a weighted average coupon of 7.0%, which are eliminated in consolidation. |
| (5) | Excludes CDO notes payable purchased by us which are eliminated in consolidation. |
| (6) | Collateralized by $1,662,537 principal amount of commercial mortgages, mezzanine loans, other loans and preferred equity interests. These obligations were issued by separate legal entities and consequently the assets of the special purpose entities that collateralize these obligations are not available to our creditors. |
| (7) | Collateralized by $989,781 principal amount of investments in securities and security-related receivables and loans, before fair value adjustments. The fair value of these investments as of December 31, 2013 was $746,939. These obligations were issued by separate legal entities and consequently the assets of the special purpose entities that collateralize these obligations are not available to our creditors. |
| (8) | Excludes the FL1 junior notes purchased by us which are eliminated in consolidation. Collateralized by $131,843 principal amount of commercial mortgages loans and participation interests. These obligations were issued by separate legal entities and consequently the assets of the special purpose entities that collateralize these obligations are not available to our creditors. |
| (9) | Includes $100,803 of unpaid principal balance and carrying amount of mortgage indebtedness that encumbers properties owned by IRT. The weighted-average interest rate is 3.8% and has a range of maturity dates from January 2019 to November 2022. |
Recourse indebtedness refers to indebtedness that is recourse to our general assets, including the loans payable on real estate that are guaranteed by us. Non-recourse indebtedness consists of indebtedness of consolidated VIEs (i.e. securitization vehicles) and loans payable on real estate which is recourse only to specific assets pledged as collateral to the lenders. The creditors of each consolidated VIE have no recourse to our general credit.
19
Table of Contents
RAIT Financial Trust
Notes to Consolidated Financial Statements
As of September 30, 2014
(Unaudited and dollars in thousands, except share and per share amounts)
The current status or activity in our financing arrangements occurring as of or during the nine-month period ended September 30, 2014 is as follows:
Recourse Indebtedness
7.0% convertible senior notes. The 7.0% Convertible Senior Notes due 2031, or the 7.0% convertible senior notes, are convertible at the option of the holder at a current conversion rate of 156.8716 common shares per $1 principal amount of 7.0% convertible senior notes (equivalent to a current conversion price of $6.37 per common share). Upon conversion of 7.0% convertible senior notes by a holder, the holder will receive cash, our common shares or a combination of cash and our common shares, at our election. We include the 7.0% convertible senior notes in diluted earnings per share using the if-converted method if the conversion value in excess of the par amount is considered in the money during the respective periods. Holders of 7.0% convertible senior notes may require us to repurchase all or a portion of the 7.0% convertible senior notes at a purchase price equal to the principal amount plus accrued and unpaid interest on April 1, 2016, April 1, 2021, and April 1, 2026, or upon the occurrence of certain defined fundamental changes.
4.0% convertible senior notes. The 4.0% Convertible Senior Notes due 2033, or the 4.0% convertible senior notes, are convertible at the option of the holder at a current conversion rate of 105.8429 common shares per $1 principal amount of 4.0% convertible senior notes (equivalent to a current conversion price of $9.45 per common share). Upon conversion of 4.0% convertible senior notes by a holder, the holder will receive cash, our common shares or a combination of cash and our common shares, at our election. We include the 4.0% convertible senior notes in diluted earnings per share using the if-converted method if the conversion value in excess of the par amount is considered in the money during the respective periods. Holders of 4.0% convertible senior notes may require us to repurchase all or a portion of the 4.0% convertible senior notes at a purchase price equal to the principal amount plus accrued and unpaid interest on October 1, 2018, October 1, 2023, and October 1, 2028, or upon the occurrence of certain defined fundamental changes.
In January 2014, the underwriters exercised the overallotment option with respect to an additional $16,750 aggregate principal amount of the 4.0% convertible senior notes and we received total net proceeds of $16,300 after deducting underwriting fees and adjusting for accrued interim interest. In the aggregate, we issued $141,750 aggregate principal amount of the 4.0% convertible senior notes in the offering and raised total net proceeds of approximately $137,238 after deducting underwriting fees and offering expenses.
According to FASB ASC Topic 470, “Debt”, we recorded a discount on our issued and outstanding 4.0% convertible senior notes of $1,182. This discount reflects the fair value of the embedded conversion option within the 4.0% convertible senior notes and was recorded as an increase to additional paid in capital. The fair value was calculated by discounting the cash flows required in the indenture relating to the 4.0% convertible senior notes agreement by a discount rate that represents management’s estimate of our senior, unsecured, non-convertible debt borrowing rate at the time when the 4.0% convertible senior notes were issued. The discount will be amortized to interest expense through October 1, 2018, the date at which holders of our 4.0% convertible senior notes could require repayment.
We entered into a second capped call transaction with an affiliate of the underwriter of the 4.0% convertible senior notes to reduce the potential dilution to holders of our common shares upon conversion of the 4.0% convertible senior notes. The second capped call transaction has a cap price of $11.91, which is subject to certain adjustments, and an initial strike price of $9.57, which is subject to certain adjustments and is equivalent to the conversion price of the 4.0% convertible senior notes. The strike price and the cap price of the second capped call transaction are identical to those in the first capped call transaction. The capped calls expire on various dates ranging from June 2018 to October 2018. The capped call transaction is a separate transaction and is not part of the terms of the 4.0% convertible senior notes and will not affect the holders’ rights under the 4.0% convertible senior notes. The capped call transaction meets the criteria for equity classification and was recorded as a reduction to additional paid in capital. The capped call transaction is excluded from the dilutive EPS calculation as their effect would be anti-dilutive.
20
Table of Contents
RAIT Financial Trust
Notes to Consolidated Financial Statements
As of September 30, 2014
(Unaudited and dollars in thousands, except share and per share amounts)
7.625% senior notes. On April 14, 2014, we issued and sold in a public offering $60,000 aggregate principal amount of our 7.625% Senior Notes due 2024, or the 7.625% senior notes. After deducting the underwriting discount and the estimated offering costs, we received approximately $57,500 of net proceeds. Interest on the 7.625% senior notes is paid quarterly with a maturity date of April 15, 2024. The 7.625% senior notes are subject to redemption at our option, in whole or in part, at any time on or after April 15, 2017, at a redemption price equal to 100% of the principal amount of the notes to be redeemed, plus accrued and unpaid interest to, but excluding, the redemption date and are subject to repurchase by us at the option of the holders following a defined fundamental change, at a repurchase price equal to 101% of the principal amount of the notes to be repurchased, plus accrued and unpaid interest to, but excluding, the fundamental change repurchase date. The senior notes are not convertible into equity securities of RAIT. They contain financial covenants that are consistent with our other debt agreements.
7.125% senior notes. In August 2014, we issued and sold in a public offering $71,905 aggregate principal amount of our 7.125% Senior Notes due 2019, or the 7.125% senior notes. After deducting the underwriting discount and the estimated offering costs, we received approximately $69,209 of net proceeds. Interest on the 7.125% senior notes is paid quarterly with a maturity date of August 30, 2019. The 7.125% senior notes are subject to redemption at our option, in whole or in part, at any time on or after August 30, 2017, at a redemption price equal to 100% of the principal amount of the notes to be redeemed, plus accrued and unpaid interest to, but excluding, the redemption date and are subject to repurchase by us at the option of the holders following a defined fundamental change, at a repurchase price equal to 101% of the principal amount of the notes to be repurchased, plus accrued and unpaid interest to, but excluding, the fundamental change repurchase date. The senior notes are not convertible into equity securities of RAIT. They contain financial covenants that are consistent with our other debt agreements.
Secured credit facilities. As of September 30, 2014, we have $5,000 outstanding under the Independence Realty Operating Partnership, LP, or IROP, credit agreement. The IROP credit agreement has a 3-year term, bears interest at LIBOR plus 2.50% and contains customary financial covenants for this type of revolving credit agreement.
On September 9, 2014, we entered into an amendment under the IROP credit agreement that modified certain terms within the agreement, including, but not limited to, an increase to the lender’s maximum commitment under the credit agreement from $20,000 to $30,000, a change in the LIBOR interest rate from 2.75% to 2.50% and amendments to certain financial covenants.
In January 2014, we repaid the outstanding $6,143 under our other secured credit facility, including any accrued interest.
CMBS facilities. We maintain various CMBS facilities with investment banks with total borrowing capacity of $575,000. The CMBS facilities are repurchase agreements that provide for margin calls in the event the commercial mortgage loans financed by the facilities change in value. As of September 30, 2014, we had $159,171 of outstanding borrowings under the CMBS facilities. As of September 30, 2014, $415,829 in aggregate principal amount remained available under the CMBS facilities. As of September 30, 2014, we were in compliance with all financial covenants contained in all CMBS facilities.
On July 28, 2014, we entered into an amended and restated master repurchase agreement, or the Amended MRA, with the investment bank for one of our CMBS facilities. The Amended MRA added defined floating-rate whole loans and senior interests in whole loans as eligible purchased assets which we could sell to the investment bank and later repurchase. All eligible purchased assets must be acceptable to the investment bank in its sole discretion. The Amended MRA increased the aggregate principal amount available under the facility to $200,000 from $100,000 provided that the aggregate outstanding purchase price under the Amended MRA at any time for all floating rate loans cannot exceed $100,000. Fixed rate loans incur interest at LIBOR plus 250 basis points and floating rate loans incur interest at LIBOR plus 200 basis points. The Amended MRA contains standard margin call provisions and financial covenants. The expiration date of the Amended MRA is July 28, 2016.
On January 27, 2014, we entered into a two year $75,000 commercial mortgage facility, or the $75,000 commercial mortgage facility, pursuant to which we may sell, and later repurchase, commercial mortgage loans and other assets meeting defined eligibility criteria which are approved by the purchaser in its sole discretion. The aggregate principal amount of the $75,000 commercial mortgage facility is $75,000 and incurs interest at LIBOR plus 200 basis points. The $75,000 commercial mortgage facility contains standard margin call provisions and financial covenants.
Non-Recourse Indebtedness
CDO notes payable, at amortized cost. CDO notes payable at amortized cost represent notes issued by consolidated CDO entities which are used to finance the acquisition of unsecured REIT notes, CMBS securities, commercial mortgages, mezzanine loans, and
21
Table of Contents
RAIT Financial Trust
Notes to Consolidated Financial Statements
As of September 30, 2014
(Unaudited and dollars in thousands, except share and per share amounts)
other loans in our commercial real estate portfolio. Generally, CDO notes payable are comprised of various classes of notes payable, with each class bearing interest at variable or fixed rates. Two of our consolidated securitizations collateralized primarily by commercial real estate loans, RAIT I and RAIT II, are meeting all of their over collateralization, or OC, and interest coverage, or IC, trigger tests as of September 30, 2014.
During the nine-month period ended September 30, 2014, we repurchased, from the market, a total of $5,800 in aggregate principal amount of CDO notes payable issued by RAIT I. The aggregate purchase price was $3,379 and we recorded a gain on extinguishment of debt of $2,421.
CDO notes payable, at fair value. Both of our consolidated securitizations collateralized primarily by TruPS, Taberna VIII and Taberna IX, are failing OC trigger tests which cause a change to the priority of payments to the debt and equity holders of the respective securitizations. Upon the failure of an OC test, the indenture of each CDO requires cash flows that would otherwise have been distributed to us as equity distributions, or in some cases interest payments on our retained CDO notes payable, be used to pay down sequentially the outstanding principal balance of the most senior note holders. The OC test failures are due to defaulted collateral assets and credit risk securities. During the nine-month period ended September 30, 2014, $18,255 of cash flows, which is comprised of $4,125 that was re-directed from our retained interests in these securitizations and $14,130 that was from principal collections on the underlying collateral, were used to repay the most senior holders of our CDO notes payable.
CMBS securitizations. During the nine-month period ended September 30, 2014, $40,482 that was from principal collections on the underlying collateral were used to repay the investment grade senior notes issued by RAIT FL1.
On April 29, 2014, we closed a CMBS securitization transaction, or RAIT FL2, structured to be collateralized by $196,052 of floating rate commercial mortgage loans and participation interests, or the FL2 collateral, that we originated. The CMBS securitization transaction is intended to finance the FL2 collateral on a non-recourse basis. In connection with the CMBS securitization transaction, our subsidiaries made certain customary representations, warranties and covenants. RAIT FL2 does not have OC triggers or IC triggers.
On the closing date, our subsidiary, RAIT 2014-FL2 Trust, or the FL2 issuer, issued classes of investment grade senior notes, or the FL2 senior notes, with an aggregate principal balance of approximately $155,861 to investors, representing an advance rate of approximately 79.5%. A RAIT subsidiary received the unrated classes of junior notes, or the FL2 junior notes, including a class with an aggregate principal balance of $40,191, and the equity, or the retained interests, of the FL2 issuer. The FL2 senior notes bear interest at a weighted average rate equal to LIBOR plus 1.79%. The stated maturity of the FL2 notes is May 2031, unless redeemed or repaid prior thereto. Subject to certain conditions, beginning in April 2016 or upon defined tax events, the FL2 issuer may redeem the FL2 senior notes, in whole but not in part, at the direction of holders of FL2 junior notes that we hold.
Loans payable on real estate. As of September 30, 2014 and December 31, 2013, we had $381,095 and $171,244, respectively, of other indebtedness outstanding relating to loans payable on consolidated real estate. These loans are secured by specific consolidated real estate and commercial loans included in our consolidated balance sheets.
During the nine-month period ended September 30, 2014, we obtained or assumed 11 first mortgages on our investments in real estate from third party lenders that have a total aggregate principal balance of $210,483, maturity dates ranging from April 2016 to August 2024, and interest rates ranging from 3.4% to 5.6%.
Subsequent to September 30, 2014, we obtained one first mortgage on our investments in real estate from a third party lender that has a total aggregate principal balance of $15,991, a maturity date of November 2021, and an interest rate of 3.7%.
22
Table of Contents
RAIT Financial Trust
Notes to Consolidated Financial Statements
As of September 30, 2014
(Unaudited and dollars in thousands, except share and per share amounts)
NOTE 7: DERIVATIVE FINANCIAL INSTRUMENTS
We may use derivative financial instruments to hedge all or a portion of the interest rate risk associated with our borrowings. The principal objective of such arrangements is to minimize the risks and/or costs associated with our operating and financial structure as well as to hedge specific anticipated transactions. The counterparties to these contractual arrangements are major financial institutions with which we and our affiliates may also have other financial relationships. In the event of nonperformance by the counterparties, we are potentially exposed to credit loss. However, because of the high credit ratings of the counterparties, we do not anticipate that any of the counterparties will fail to meet their obligations.
Interest Rate Swaps and Caps
We have entered into various interest rate swap and cap contracts to hedge interest rate exposure on floating rate indebtedness. We designate interest rate hedge agreements at inception and determine whether or not the interest rate hedge agreement is highly effective in offsetting interest rate fluctuations associated with the identified indebtedness. At designation, certain of these interest rate swaps had a fair value not equal to zero. However, we concluded, at designation, that these hedging arrangements were highly effective during their term using regression analysis and determined that the hypothetical derivative method would be used in measuring any ineffectiveness. At each reporting period, we update our regression analysis and, as of September 30, 2014, we concluded that these hedging arrangements were highly effective during their remaining term and used the hypothetical derivative method in measuring the ineffective portions of these hedging arrangements.
The following table summarizes the aggregate notional amount and estimated net fair value of our derivative instruments as of September 30, 2014 and December 31, 2013:
| As of September 30, 2014 | As of December 31, 2013 | |||||||||||||||||||||||
| Notional | Fair Value of Assets |
Fair Value of Liabilities |
Notional | Fair Value of Assets |
Fair Value of Liabilities |
|||||||||||||||||||
| Cash flow hedges: |
||||||||||||||||||||||||
| Interest rate swaps |
$ | 1,072,409 | $ | 46 | $ | (81,998 | ) | $ | 1,071,447 | $ | 183 | $ | (113,331 | ) | ||||||||||
| Interest rate caps |
36,000 | 686 | 0 | 36,000 | 1,122 | 0 | ||||||||||||||||||
|
|
|
|
|
|
|
|
|
|
|
|
|
|||||||||||||
| Net fair value |
$ | 1,108,409 | $ | 732 | $ | (81,998 | ) | $ | 1,107,447 | $ | 1,305 | $ | (113,331 | ) | ||||||||||
|
|
|
|
|
|
|
|
|
|
|
|
|
|||||||||||||
During the period October 1, 2014 through December 31, 2014, interest rate swap agreements relating to RAIT I and RAIT II with a notional amount of $22,400 and a weighted average strike rate of 5.25% as of September 30, 2014, will terminate in accordance with their terms.
For interest rate swaps that are considered effective hedges, we reclassified realized losses of $6,966 and $7,946, respectively, to earnings for the three-month periods ended September 30, 2014 and 2013 and $21,746 and $24,330 for the nine-month periods ended September 30, 2014 and 2013.
On January 1, 2008, we adopted the fair value option, which has been classified under FASB ASC Topic 825, “Financial Instruments”, for certain of our CDO notes payable. Upon the adoption of this standard, hedge accounting for any previously designated interest rate swaps associated with these CDO notes payable was discontinued and amounts were reclassified from accumulated other comprehensive income to earnings over the remaining life of the interest rate swaps. As of September 30, 2014, the notional value associated with these interest rate swaps where hedge accounting was discontinued was $561,151 and had a liability balance with a fair value of $53,900. See Note 8: “Fair Value of Financial Instruments” for the changes in value of these hedges during the three-month and nine-month periods ended September 30, 2014 and 2013. The change in value of these hedges was recorded as a component of the change in fair value of financial instruments in our consolidated statement of operations.
Effective interest rate swaps are reported in accumulated other comprehensive income and the fair value of these hedge agreements is included in other assets or derivative liabilities.
23
Table of Contents
RAIT Financial Trust
Notes to Consolidated Financial Statements
As of September 30, 2014
(Unaudited and dollars in thousands, except share and per share amounts)
NOTE 8: FAIR VALUE OF FINANCIAL INSTRUMENTS
Fair Value of Financial Instruments
FASB ASC Topic 825, “Financial Instruments” requires disclosure of the fair value of financial instruments for which it is practicable to estimate that value. The fair value of investments in mortgages and loans, investments in securities, CDO notes payable, convertible senior notes, junior subordinated notes and derivative assets and liabilities is based on significant observable and unobservable inputs. The fair value of cash and cash equivalents, restricted cash, secured credit facilities and CMBS facilities approximates cost due to the nature of these instruments.
The following table summarizes the carrying amount and the fair value of our financial instruments as of September 30, 2014:
| Financial Instrument |
Carrying Amount |
Estimated Fair Value |
||||||
| Assets |
||||||||
| Commercial mortgages, mezzanine loans, other loans and preferred equity interests, net |
$ | 1,354,120 | $ | 1,283,719 | ||||
| Investments in securities and security-related receivables |
568,279 | 568,279 | ||||||
| Cash and cash equivalents |
116,767 | 116,767 | ||||||
| Restricted cash |
133,374 | 133,374 | ||||||
| Derivative assets |
732 | 732 | ||||||
| Liabilities |
||||||||
| Recourse indebtedness: |
||||||||
| 7.0% convertible senior notes |
33,297 | 40,062 | ||||||
| 4.0% convertible senior notes |
133,752 | 134,308 | ||||||
| 7.625% senior notes |
60,000 | 57,624 | ||||||
| 7.125% senior notes |
71,905 | 71,013 | ||||||
| Secured credit facilities |
5,000 | 5,000 | ||||||
| Junior subordinated notes, at fair value |
13,048 | 13,048 | ||||||
| Junior subordinated notes, at amortized cost |
25,100 | 14,648 | ||||||
| CMBS facilities |
159,171 | 159,171 | ||||||
| Non-recourse indebtedness: |
||||||||
| CDO notes payable, at amortized cost |
1,084,289 | 919,924 | ||||||
| CDO notes payable, at fair value |
431,142 | 431,142 | ||||||
| CMBS securitizations |
215,518 | 215,527 | ||||||
| Loans payable on real estate |
381,095 | 398,517 | ||||||
| Derivative liabilities |
81,998 | 81,998 | ||||||
| Warrants and investor SARs |
29,731 | 29,731 | ||||||
24
Table of Contents
RAIT Financial Trust
Notes to Consolidated Financial Statements
As of September 30, 2014
(Unaudited and dollars in thousands, except share and per share amounts)
The following table summarizes the carrying amount and the fair value of our financial instruments as of December 31, 2013:
| Financial Instrument |
Carrying Amount |
Estimated Fair Value |
||||||
| Assets |
||||||||
| Commercial mortgages, mezzanine loans, other loans and preferred equity interests |
$ | 1,122,377 | $ | 1,083,118 | ||||
| Investments in securities and security-related receivables |
567,302 | 567,302 | ||||||
| Cash and cash equivalents |
88,847 | 88,847 | ||||||
| Restricted cash |
121,589 | 121,589 | ||||||
| Derivative assets |
1,305 | 1,305 | ||||||
| Liabilities |
||||||||
| Recourse indebtedness: |
||||||||
| 7.0% convertible senior notes |
32,938 | 47,778 | ||||||
| 4.0% convertible senior notes |
116,184 | 124,063 | ||||||
| Secured credit facilities |
11,129 | 11,129 | ||||||
| Junior subordinated notes, at fair value |
11,911 | 11,911 | ||||||
| Junior subordinated notes, at amortized cost |
25,100 | 14,007 | ||||||
| CMBS facilities |
37,749 | 37,749 | ||||||
| Non-recourse indebtedness: |
||||||||
| CDO notes payable, at amortized cost |
1,202,772 | 724,885 | ||||||
| CDO notes payable, at fair value |
377,235 | 377,235 | ||||||
| CMBS securitization |
100,139 | 100,214 | ||||||
| Loans payable on real estate |
171,244 | 176,979 | ||||||
| Derivative liabilities |
113,331 | 113,331 | ||||||
| Warrants and investor SARs |
31,304 | 31,304 | ||||||
Fair Value Measurements
The following tables summarize information about our assets and liabilities measured at fair value on a recurring basis as of September 30, 2014, and indicate the fair value hierarchy of the valuation techniques utilized to determine such fair value:
| Assets: |
Quoted Prices in Active Markets for Identical Assets (Level 1) (a) |
Significant Other Observable Inputs (Level 2) (a) |
Significant Unobservable Inputs (Level 3) (a) |
Balance as of September 30, 2014 |
||||||||||||
| Trading securities |
||||||||||||||||
| TruPS |
$ | 0 | $ | 0 | $ | 489,938 | $ | 489,938 | ||||||||
| Other securities |
0 | 0 | 0 | 0 | ||||||||||||
| Available-for-sale securities |
0 | 630 | 0 | 630 | ||||||||||||
| Security-related receivables |
||||||||||||||||
| TruPS receivables |
0 | 0 | 7,683 | 7,683 | ||||||||||||
| Unsecured REIT note receivables |
0 | 32,532 | 0 | 32,532 | ||||||||||||
| CMBS receivables |
0 | 36,435 | 0 | 36,435 | ||||||||||||
| Other securities |
0 | 1,061 | 0 | 1,061 | ||||||||||||
| Derivative assets |
0 | 732 | 0 | 732 | ||||||||||||
|
|
|
|
|
|
|
|
|
|||||||||
| Total assets |
$ | 0 | $ | 71,390 | $ | 497,621 | $ | 569,011 | ||||||||
|
|
|
|
|
|
|
|
|
|||||||||
25
Table of Contents
RAIT Financial Trust
Notes to Consolidated Financial Statements
As of September 30, 2014
(Unaudited and dollars in thousands, except share and per share amounts)
| Liabilities: |
Quoted Prices in Active Markets for Identical Assets (Level 1) (a) |
Significant Other Observable Inputs (Level 2) (a) |
Significant Unobservable Inputs (Level 3) (a) |
Balance as of September 30, 2014 |
||||||||||||
| Junior subordinated notes, at fair value |
$ | 0 | $ | 0 | $ | 13,048 | $ | 13,048 | ||||||||
| CDO notes payable, at fair value |
0 | 0 | 431,142 | 431,142 | ||||||||||||
| Derivative liabilities |
0 | 28,098 | 53,900 | 81,998 | ||||||||||||
| Warrants and investor SARs |
0 | 0 | 29,731 | 29,731 | ||||||||||||
|
|
|
|
|
|
|
|
|
|||||||||
| Total liabilities |
$ | 0 | $ | 28,098 | $ | 527,821 | $ | 555,919 | ||||||||
|
|
|
|
|
|
|
|
|
|||||||||
| (a) | During the nine-month period ended September 30, 2014, there were no transfers between Level 1 and Level 2, as well as, there were no transfers into and out of Level 3. |
The following tables summarize information about our assets and liabilities measured at fair value on a recurring basis as of December 31, 2013, and indicate the fair value hierarchy of the valuation techniques utilized to determine such fair value:
| Assets: |
Quoted Prices in Active Markets for Identical Assets (Level 1) (a) |
Significant Other Observable Inputs (Level 2) (a) |
Significant Unobservable Inputs (Level 3) (a) |
Balance as of December 31, 2013 |
||||||||||||
| Trading securities |
||||||||||||||||
| TruPS |
$ | 0 | $ | 0 | $ | 480,845 | $ | 480,845 | ||||||||
| Other securities |
0 | 0 | 0 | 0 | ||||||||||||
| Available-for-sale securities |
0 | 2 | 0 | 2 | ||||||||||||
| Security-related receivables |
||||||||||||||||
| TruPS receivables |
0 | 0 | 8,211 | 8,211 | ||||||||||||
| Unsecured REIT note receivables |
0 | 33,046 | 0 | 33,046 | ||||||||||||
| CMBS receivables |
0 | 44,118 | 0 | 44,118 | ||||||||||||
| Other securities |
0 | 1,080 | 0 | 1,080 | ||||||||||||
| Derivative assets |
0 | 1,305 | 0 | 1,305 | ||||||||||||
|
|
|
|
|
|
|
|
|
|||||||||
| Total assets |
$ | 0 | $ | 79,551 | $ | 489,056 | $ | 568,607 | ||||||||
|
|
|
|
|
|
|
|
|
|||||||||
| Liabilities: |
Quoted Prices in Active Markets for Identical Assets (Level 1) (a) |
Significant Other Observable Inputs (Level 2) (a) |
Significant Unobservable Inputs (Level 3) (a) |
Balance as of December 31, 2013 |
||||||||||||
| Junior subordinated notes, at fair value |
$ | 0 | $ | 0 | $ | 11,911 | $ | 11,911 | ||||||||
| CDO notes payable, at fair value |
0 | 0 | 377,235 | 377,235 | ||||||||||||
| Derivative liabilities |
0 | 45,926 | 67,405 | 113,331 | ||||||||||||
| Warrants and investor SARs |
0 | 0 | 31,304 | 31,304 | ||||||||||||
|
|
|
|
|
|
|
|
|
|||||||||
| Total liabilities |
$ | 0 | $ | 45,926 | $ | 487,855 | $ | 533,781 | ||||||||
|
|
|
|
|
|
|
|
|
|||||||||
| (a) | During the year ended December 31, 2013, there were no transfers between Level 1 and Level 2, as well as, there were no transfers into and out of Level 3. |
26
Table of Contents
RAIT Financial Trust
Notes to Consolidated Financial Statements
As of September 30, 2014
(Unaudited and dollars in thousands, except share and per share amounts)
When estimating the fair value of our Level 3 financial instruments, management uses various observable and unobservable inputs. These inputs include yields, credit spreads, duration, effective dollar prices and overall market conditions on not only the exact financial instrument for which management is estimating the fair value, but also financial instruments that are similar or issued by the same issuer when such inputs are unavailable. Generally, an increase in the yields, credit spreads or estimated duration will decrease the fair value of our financial instruments. Due to the inherent uncertainty of determining the fair value of investments that do not have a readily available market value, the fair value, as determined by management, may fluctuate from period to period and any ultimate liquidation or sale of the investment may result in proceeds that may be significantly different than fair value. The weighted average effective dollar price of our TruPS and TruPS receivables as of September 30, 2014 and December 31, 2013 was 76 and 75, respectively.
The following tables summarize additional information about assets and liabilities that are measured at fair value on a recurring basis for which we have utilized level 3 inputs to determine fair value for the nine-month period ended September 30, 2014:
| Assets |
Trading Securities—TruPS and Subordinated Debentures |
Security-Related Receivables—TruPS and Subordinated Debenture Receivables |
Total Level 3 Assets |
|||||||||
| Balance, as of December 31, 2013 |
$ | 480,845 | $ | 8,211 | $ | 489,056 | ||||||
| Change in fair value of financial instruments |
9,093 | (528 | ) | 8,565 | ||||||||
| Purchases |
0 | 0 | 0 | |||||||||
| Principal Repayments |
0 | 0 | 0 | |||||||||
|
|
|
|
|
|
|
|||||||
| Balance, as of September 30, 2014 |
$ | 489,938 | $ | 7,683 | $ | 497,621 | ||||||
|
|
|
|
|
|
|
|||||||
| Liabilities |
Derivative Liabilities |
Warrants and investor SARs |
CDO Notes Payable, at Fair Value |
Junior Subordinated Notes, at Fair Value |
Total Level 3 Liabilities |
|||||||||||||||
| Balance, as of December 31, 2013 |
$ | 67,405 | $ | 31,304 | $ | 377,235 | $ | 11,911 | $ | 487,855 | ||||||||||
| Change in fair value of financial instruments |
(13,505 | ) | (15,314 | ) | 72,162 | 1,137 | 44,480 | |||||||||||||
| Purchases |
0 | 13,741 | 0 | 0 | 13,741 | |||||||||||||||
| Sales |
0 | 0 | 0 | 0 | 0 | |||||||||||||||
| Principal repayments |
0 | 0 | (18,255 | ) | 0 | (18,255 | ) | |||||||||||||
|
|
|
|
|
|
|
|
|
|
|
|||||||||||
| Balance, as of September 30, 2014 |
$ | 53,900 | $ | 29,731 | $ | 431,142 | $ | 13,048 | $ | 527,821 | ||||||||||
|
|
|
|
|
|
|
|
|
|
|
|||||||||||
Our non-recurring fair value measurements relate primarily to our commercial real estate loans that are considered impaired and for which we maintain an allowance for loss. In determining the allowance for losses, we estimate the fair value of the respective commercial real estate loan and compare that fair value to our total investment in the loan. When estimating the fair value of the commercial real estate loan, management uses discounted cash flow analyses and capitalization rates on the underlying property’s net operating income. The discounted cash flow analyses and capitalization rates are based on market information and comparable sales of similar properties.
27
Table of Contents
RAIT Financial Trust
Notes to Consolidated Financial Statements
As of September 30, 2014
(Unaudited and dollars in thousands, except share and per share amounts)
The following tables summarize the valuation technique and the level of the fair value hierarchy for financial instruments that are not fair valued in the accompanying consolidated balance sheets but for which fair value is required to be disclosed. The fair value of cash and cash equivalents, restricted cash, secured credit facilities and CMBS facilities approximates cost due to the nature of these instruments and are not included in the tables below.
| Fair Value Measurement | ||||||||||||||||||||||
| Carrying Amount as of September 30, 2014 |
Estimated Fair Value as of September 30, 2014 |
Valuation Technique |
Quoted Prices in Active Markets for Identical Assets (Level 1) |
Significant Other Observable Inputs (Level 2) |
Significant Unobservable Inputs (Level 3) |
|||||||||||||||||
| Commercial mortgages, mezzanine loans and other loans, net |
$ | 1,354,120 | $ | 1,283,719 | Discounted cash flows | $ | 0 | $ | 0 | $ | 1,283,719 | |||||||||||
| 7.0% convertible senior notes |
33,297 | 40,062 | Trading price | 40,062 | 0 | 0 | ||||||||||||||||
| 4.0% convertible senior notes |
133,752 | 134,308 | Trading price | 134,308 | 0 | 0 | ||||||||||||||||
| 7.625% senior notes |
60,000 | 57,624 | Trading price | 57,624 | 0 | 0 | ||||||||||||||||
| 7.125% senior notes |
71,905 | 71,013 | Trading price | 71,013 | 0 | 0 | ||||||||||||||||
| Junior subordinated notes, at amortized cost |
25,100 | 14,648 | Discounted cash flows | 0 | 0 | 14,648 | ||||||||||||||||
| CDO notes payable, at amortized cost |
1,084,289 | 919,924 | Discounted cash flows | 0 | 0 | 919,924 | ||||||||||||||||
| CMBS securitizations |
215,518 | 215,527 | Discounted cash flows | 0 | 0 | 215,527 | ||||||||||||||||
| Loans payable on real estate |
381,095 | 398,517 | Discounted cash flows | 0 | 0 | 398,517 | ||||||||||||||||
| Fair Value Measurement | ||||||||||||||||||||||
| Carrying Amount as of December 31, 2013 |
Estimated Fair Value as of December 31, 2013 |
Valuation Technique |
Quoted Prices in Active Markets for Identical Assets (Level 1) |
Significant Other Observable Inputs (Level 2) |
Significant Unobservable Inputs (Level 3) |
|||||||||||||||||
| Commercial mortgages, mezzanine loans and other loans |
$ | 1,122,377 | $ | 1,083,118 | Discounted cash flows | $ | 0 | $ | 0 | $ | 1,083,118 | |||||||||||
| 7.0% convertible senior notes |
32,938 | 47,778 | Trading price | 47,778 | 0 | 0 | ||||||||||||||||
| 4.0% convertible senior notes |
116,184 | 124,063 | Trading price | 124,063 | 0 | 0 | ||||||||||||||||
| Junior subordinated notes, at amortized cost |
25,100 | 14,007 | Discounted cash flows | 0 | 0 | 14,007 | ||||||||||||||||
| CDO notes payable, at amortized cost |
1,202,772 | 724,885 | Discounted cash flows | 0 | 0 | 724,885 | ||||||||||||||||
| CMBS securitization |
100,139 | 100,214 | Discounted cash flows | 0 | 0 | 100,214 | ||||||||||||||||
| Loans payable on real estate |
171,244 | 176,979 | Discounted cash flows | 0 | 0 | 176,979 | ||||||||||||||||
28
Table of Contents
RAIT Financial Trust
Notes to Consolidated Financial Statements
As of September 30, 2014
(Unaudited and dollars in thousands, except share and per share amounts)
Change in Fair Value of Financial Instruments
The following table summarizes realized and unrealized gains and losses on assets and liabilities for which we elected the fair value option of FASB ASC Topic 825, “Financial Instruments” and derivatives as reported in change in fair value of financial instruments in the accompanying consolidated statements of operations:
| For the Three-Month Periods Ended September 30 |
For the Nine-Month Periods Ended September 30 |
|||||||||||||||
| Description |
2014 | 2013 | 2014 | 2013 | ||||||||||||
| Change in fair value of trading securities and security-related receivables |
$ | 2,386 | $ | (2,107 | ) | $ | 10,960 | $ | 16,059 | |||||||
| Change in fair value of CDO notes payable and trust preferred obligations |
(23,961 | ) | (17,524 | ) | (73,294 | ) | (203,149 | ) | ||||||||
| Change in fair value of derivatives |
(702 | ) | (8,076 | ) | (12,413 | ) | (11,752 | ) | ||||||||
| Change in fair value of warrants and investors SARs |
12,054 | 3,048 | 15,314 | (1,594 | ) | |||||||||||
|
|
|
|
|
|
|
|
|
|||||||||
| Change in fair value of financial instruments |
$ | (10,223 | ) | $ | (24,659 | ) | $ | (59,433 | ) | $ | (200,436 | ) | ||||
|
|
|
|
|
|
|
|
|
|||||||||
The changes in the fair value for the trading securities and security-related receivables, CDO notes payable, and other liabilities for which the fair value option was elected for the three-month and nine-month periods ended September 30, 2014 and 2013 was primarily attributable to changes in instrument specific credit risks. The changes in the fair value of the CDO notes payable for which the fair value option was elected was due to repayments at par because of OC failures when the CDO notes have a fair value of less than par. The changes in the fair value of derivatives for which the fair value option was elected for the three-month and nine-month periods ended September 30, 2014 and 2013 was mainly due to changes in interest rates.
29
Table of Contents
RAIT Financial Trust
Notes to Consolidated Financial Statements
As of September 30, 2014
(Unaudited and dollars in thousands, except share and per share amounts)
NOTE 9: VARIABLE INTEREST ENTITIES
The following table presents the assets and liabilities of our consolidated VIEs as of each respective date. As of September 30, 2014 and December 31, 2013, our consolidated VIEs were: Taberna VIII, Taberna IX, RAIT I, RAIT II, Independence Realty Trust, Inc., Willow Grove and Cherry Hill.
| As of September 30, 2014 |
As of December 31, 2013 |
|||||||
| Assets |
||||||||
| Investments in mortgages and loans, at amortized cost: |
||||||||
| Commercial mortgages, mezzanine loans, other loans and preferred equity interests |
$ | 1,718,528 | $ | 1,816,507 | ||||
| Allowance for losses |
(16,205 | ) | (17,250 | ) | ||||
|
|
|
|
|
|||||
| Total investments in mortgages and loans |
1,702,323 | 1,799,257 | ||||||
| Investments in real estate, net of accumulated depreciation of $24,290 and 18,538, respectively |
443,428 | 194,648 | ||||||
| Investments in securities and security-related receivables, at fair value |
566,330 | 566,577 | ||||||
| Cash and cash equivalents |
35,051 | 3,599 | ||||||
| Restricted cash |
30,898 | 40,793 | ||||||
| Accrued interest receivable |
80,240 | 68,456 | ||||||
| Deferred financing costs, net of accumulated amortization of $19,993 and $17,107, respectively |
8,857 | 10,263 | ||||||
| Intangible assets, net of accumulated amortization of $3,495 and $568, respectively |
1,327 | 517 | ||||||
|
|
|
|
|
|||||
| Total assets |
$ | 2,868,454 | $ | 2,684,110 | ||||
|
|
|
|
|
|||||
| Liabilities and Equity |
||||||||
| Indebtedness (including $431,142 and $377,235 at fair value, respectively) |
$ | 2,044,328 | $ | 1,946,536 | ||||
| Accrued interest payable |
83,059 | 73,122 | ||||||
| Accounts payable and accrued expenses |
10,767 | 5,771 | ||||||
| Derivative liabilities |
81,653 | 113,323 | ||||||
| Deferred taxes, borrowers’ escrows and other liabilities |
8,634 | 5,805 | ||||||
|
|
|
|
|
|||||
| Total liabilities |
2,228,441 | 2,144,557 | ||||||
| Equity: |
||||||||
| Shareholders’ equity: |
||||||||
| Accumulated other comprehensive income (loss) |
(38,912 | ) | (59,684 | ) | ||||
| RAIT investment |
340,609 | 311,635 | ||||||
| Retained earnings (deficit) |
188,809 | 258,270 | ||||||
|
|
|
|
|
|||||
| Total shareholders’ equity |
490,506 | 510,221 | ||||||
| Noncontrolling interests |
149,507 | 29,332 | ||||||
|
|
|
|
|
|||||
| Total liabilities and equity |
$ | 2,868,454 | $ | 2,684,110 | ||||
|
|
|
|
|
|||||
The assets of the VIEs can only be used to settle obligations of the VIEs and are not available to our creditors. Certain amounts included in the table above are eliminated upon consolidation with our other subsidiaries that maintain investments in the debt or equity securities issued by these entities. We do not have any contractual obligation to provide the VIEs listed above with any financial support. We have not and do not intend to provide financial support to these VIEs that we were not previously contractually required to provide.
30
Table of Contents
RAIT Financial Trust
Notes to Consolidated Financial Statements
As of September 30, 2014
(Unaudited and dollars in thousands, except share and per share amounts)
NOTE 10: SERIES D PREFERRED SHARES
On October 1, 2012, we entered into a Securities Purchase Agreement, or the purchase agreement, with ARS VI Investor I, LLC, or the investor, an affiliate of Almanac Realty Investors, LLC, or Almanac. Under the purchase agreement, we are required to issue and sell to the investor on a private placement basis from time to time in a period up to two years, and the investor will be obligated to purchase from us, for an aggregate purchase price of $100,000, or the total commitment, the following securities, in the aggregate: (i) 4,000,000 Series D Cumulative Redeemable Preferred Shares of Beneficial Interest, par value $0.01 per share, of RAIT, or the Series D Preferred Shares, (ii) common share purchase warrants, or the warrants, exercisable for 9,931,000 of our common shares, or the common shares, and (iii) common share appreciation rights, or the investor SARs, with respect to up to 6,735,667 common shares. These securities will be issued on a pro rata basis based on the percentage of the total commitment drawn down at the relevant closing under the purchase agreement.
The warrants and investor SARs had an initial strike price of $6.00 per common share, subject to adjustment. As of the filing of this report, the strike price has adjusted to $5.69.
The warrants and investor SARs were both determined to be classified as liabilities and had a combined fair value of $29,731 as of September 30, 2014. The initial fair value of the warrants and investor SARs are recorded as a liability and re-measured at each reporting period until the warrants and investor SARs are settled. Changes in fair value will be recorded in earnings as a component of the change in fair value of financial instruments in the consolidated statement of operations.
During the period from the effective date of the purchase agreement through September 30, 2014, we sold the following securities to the investor for an aggregate purchase price of $100.0 million: (i) 4,000,000 Series D Preferred Shares, (ii) warrants exercisable for 9,931,000 common shares (which have subsequently adjusted to 10,479,889 shares as of the date of filing this report); and (iii) investor SARs exercisable with respect to 6,735,667 common shares (which have subsequently adjusted to 7,107,948.84 shares as of the date of filing this report). The following table summarizes the sales activity of the Series D Preferred Shares from the effective date of the agreement through September 30, 2014:
| Aggregate purchase price |
$ | 100,000 | ||||||
| Initial value of warrants and investor SARs issued to-date |
(22,874 | ) | ||||||
| Costs incurred |
(6,384 | ) | ||||||
|
|
|
|||||||
| Total discount |
(29,258 | ) | ||||||
| Discount amortization to-date |
5,434 | |||||||
|
|
|
|||||||
| Carrying amount of Series D Preferred Shares |
$ | 76,176 | ||||||
|
|
|
NOTE 11: SHAREHOLDERS’ EQUITY
Preferred Shares
Dividends:
On January 29, 2014, our board of trustees declared a first quarter 2014 cash dividend of $0.484375 per share on our 7.75% Series A Preferred Shares, $0.5234375 per share on our 8.375% Series B Preferred Shares, $0.5546875 per share on our 8.875% Series C Preferred Shares and $0.4687500 per share on our Series D Preferred Shares. The dividends were paid on March 31, 2014 to holders of record on March 3, 2014 and totaled $5,329.
On May 13, 2014, our board of trustees declared a second quarter 2014 cash dividend of $0.484375 per share on our 7.75% Series A Preferred Shares, $0.5234375 per share on our 8.375% Series B Preferred Shares, $0.5546875 per share on our 8.875% Series C Preferred Shares and $0.4687500 per share on our Series D Preferred Shares. The dividends were paid on June 30, 2014 to holders of record on June 2, 2014 and totaled $5,962.
31
Table of Contents
RAIT Financial Trust
Notes to Consolidated Financial Statements
As of September 30, 2014
(Unaudited and dollars in thousands, except share and per share amounts)
On July 29, 2014, our board of trustees declared a third quarter 2014 cash dividend of $0.484375 per share on our 7.75% Series A Preferred Shares, $0.5234375 per share on our 8.375% Series B Preferred Shares, $0.5546875 per share on our 8.875% Series C Preferred Shares and $0.4687500 per share on our Series D Preferred Shares. The dividends were paid on September 30, 2014 to holders of record on September 2, 2014 and totaled $5,953.
On October 28, 2014, our board of trustees declared a fourth quarter 2014 cash dividend of $0.484375 per share on our 7.75% Series A Preferred Shares, $0.5234375 per share on our 8.375% Series B Preferred Shares, $0.5546875 per share on our 8.875% Series C Preferred Shares and $0.4687500 per share on our Series D Preferred Shares. The dividends will be paid on December 31, 2014 to holders of record on December 1, 2014.
At Market Issuance Sales Agreement (ATM):
On June 13, 2014, we entered into an At Market Issuance Sales Agreement, or the Preferred ATM agreement, with MLV & Co. LLC, or MLV, providing that, from time to time during the term of the Preferred ATM agreement, on the terms and subject to the conditions set forth therein, we may issue and sell through MLV, up to $150,000 aggregate amount of preferred shares. With respect to each series of preferred shares, the maximum amount issuable is as follows: 4,000,000 Series A Preferred Shares, 1,000,000 Series B Preferred Shares, and 1,000,000 Series C Preferred Shares. Unless the Preferred ATM agreement is earlier terminated by MLV or us, the Preferred ATM agreement automatically terminates upon the issuance and sale of all of the Series A Preferred Shares, Series B Preferred Shares, and Series C Preferred Shares subject to the Preferred ATM agreement. From the effective date of the Preferred ATM Agreement through September 30, 2014, we issued a total of 6,281 Series A Preferred Shares pursuant to this agreement at a weighted-average price of $24.57 and we received $150 of proceeds. From the effective date of the Preferred ATM Agreement through September 30, 2014, we did not issue any Series B Preferred Shares or Series C Preferred Shares. As of September 30, 2014, 3,993,719, 1,000,000, and 1,000,000 Series A Preferred Shares, Series B Preferred Shares, and Series C Preferred Shares, respectively, remain available for issuance under the Preferred ATM agreement.
On June 13, 2014, we amended our declaration of trust to reclassify and designate an additional 3,309,288 of our unclassified preferred shares of beneficial interest, par value $0.01 per share, as 3,309,288 Series A Preferred Shares. This reclassification increased the number of shares classified as Series A Preferred Shares from 4,760,000 shares to 8,069,288 shares. This reclassification decreased the number of unclassified preferred shares from 4,340,000 shares to 1,030,712 shares. We engaged in this reclassification in order to authorize additional Series A Preferred Shares issuable under the Preferred ATM Agreement.
Common Shares
Dividends:
On March 18, 2014, the board of trustees declared a $0.17 dividend on our common shares to holders of record as of April 4, 2014. The dividend was paid on April 30, 2014 and totaled $13,914.
On June 12, 2014, the board of trustees declared a $0.18 dividend on our common shares to holders of record as of July 11, 2014. The dividend was paid on July 31, 2014 and totaled $14,729.
On September 15, 2014, the board of trustees declared a $0.18 dividend on our common shares to holders of record as of October 7, 2014. The dividend was paid on October 31, 2014 and totaled $14,716.
Equity Compensation:
During the nine-month period ended September 30, 2014, 20,530 phantom unit awards were redeemed for common shares, a portion of which was withheld in order to satisfy the applicable withholding taxes. These phantom units were fully vested at the time of redemption.
On January 29, 2014, the compensation committee awarded 42,217 common share awards, valued at $350 using our closing stock price of $8.29, to the board’s non-management trustees. These awards vested immediately. On January 29, 2014, the compensation committee awarded 293,700 restricted common share awards, valued at $2,435 using our closing stock price of $8.29, to our executive officers and non-executive officer employees. These awards generally vest over three-year periods.
32
Table of Contents
RAIT Financial Trust
Notes to Consolidated Financial Statements
As of September 30, 2014
(Unaudited and dollars in thousands, except share and per share amounts)
On January 29, 2014, the compensation committee awarded 891,600 stock appreciation rights, or SARs, valued at $1,178 based on a Black-Scholes option pricing model at the date of grant, to our executive officers and non-executive officer employees. The SARs vest over a three-year period and may be exercised between the date of vesting and January 29, 2019, the expiration date of the SARs.
Dividend Reinvestment and Share Purchase Plan (DRSPP):
We have a dividend reinvestment and share purchase plan, or DRSPP, under which we registered and reserved for issuance, in the aggregate, 10,500,000 common shares. During the nine-month period ended September 30, 2014, we issued a total of 5,603 common shares pursuant to the DRSPP at a weighted-average price of $8.09 per share and we received $45 of net proceeds. As of September 30, 2014, 7,772,217 common shares, in the aggregate, remain available for issuance under the DRSPP.
Capital on Demand™ Sales Agreement (COD):
On November 21, 2012, we entered into a Capital on Demand™ Sales Agreement, or the COD sales agreement, with JonesTrading Institutional Services LLC, or JonesTrading, pursuant to which we may issue and sell up to 10,000,000 of our common shares from time to time through JonesTrading acting as agent and/or principal, subject to the terms and conditions of the COD sales agreement. Unless the COD sales agreement is earlier terminated by JonesTrading or us, the COD sales agreement automatically terminates upon the issuance and sale of all of the common shares subject to the COD sales agreement. During the nine-month period ended September 30, 2014, we issued a total of 641,139 common shares pursuant to this agreement at a weighted-average price of $8.26 per share and we received $5,164 of net proceeds. As of September 30, 2014, 7,918,819 common shares, in the aggregate, remain available for issuance under the COD sales agreement.
Common Share Public Offering:
In January 2014, we issued 10,000,000 common shares in an underwritten public offering. The public offering price was $8.52 per share and we received $82,570 of proceeds.
Noncontrolling Interests
On January 29, 2014, Independence Realty Trust, Inc., or IRT, completed an underwritten public offering selling 8,050,000 shares of IRT common stock for $8.30 per share raising net proceeds of $62,984. We purchased 1,204,819 shares of common stock in the offering, at the public offering price, for which no underwriting discounts and commissions were paid to the underwriters. On July 21, 2014, IRT completed an underwritten public offering selling 8,050,000 shares of IRT common stock for $9.50 per share raising net proceeds of $72,426. We purchased 300,000 shares of common stock in the offering, at the public offering price, for which no underwriting discounts and commissions will be paid to the underwriters. As of September 30, 2014 and December 31, 2013, we held 7,269,719 and 5,764,900 shares, respectively, of IRT common stock representing 28.2% and 59.7%, respectively, of the outstanding shares of IRT common stock. We consolidate IRT as it is a VIE and we are the primary beneficiary. See Note 9 for additional disclosures pertaining to VIEs.
33
Table of Contents
RAIT Financial Trust
Notes to Consolidated Financial Statements
As of September 30, 2014
(Unaudited and dollars in thousands, except share and per share amounts)
NOTE 12: EARNINGS (LOSS) PER SHARE
The following table presents a reconciliation of basic and diluted earnings (loss) per share for the three-month and nine-month periods ended September 30, 2014 and 2013:
| For the Three-Month Periods Ended September 30 |
For the Nine-Month Periods Ended September 30 |
|||||||||||||||
| 2014 | 2013 | 2014 | 2013 | |||||||||||||
| Net income (loss) |
$ | (16,462 | ) | $ | (11,135 | ) | $ | (42,895 | ) | $ | (156,814 | ) | ||||
| (Income) loss allocated to preferred shares |
(7,407 | ) | (6,024 | ) | (20,628 | ) | (16,831 | ) | ||||||||
| (Income) loss allocated to noncontrolling interests |
603 | 53 | 20 | 130 | ||||||||||||
|
|
|
|
|
|
|
|
|
|||||||||
| Net income (loss) allocable to common shares |
$ | (23,266 | ) | $ | (17,106 | ) | $ | (63,503 | ) | $ | (173,515 | ) | ||||
|
|
|
|
|
|
|
|
|
|||||||||
| Weighted-average shares outstanding—Basic |
81,967,806 | 70,192,918 | 81,111,796 | 66,807,299 | ||||||||||||
| Dilutive securities under the treasury stock method |
0 | 0 | 0 | 0 | ||||||||||||
|
|
|
|
|
|
|
|
|
|||||||||
| Weighted-average shares outstanding—Diluted |
81,967,806 | 70,192,918 | 81,111,796 | 66,807,299 | ||||||||||||
|
|
|
|
|
|
|
|
|
|||||||||
| Earnings (loss) per share—Basic: |
||||||||||||||||
| Earnings (loss) per share—Basic |
$ | (0.28 | ) | $ | (0.24 | ) | $ | (0.78 | ) | $ | (2.60 | ) | ||||
|
|
|
|
|
|
|
|
|
|||||||||
| Earnings (loss) per share—Diluted: |
||||||||||||||||
| Earnings (loss) per share—Diluted |
$ | (0.28 | ) | $ | (0.24 | ) | $ | (0.78 | ) | $ | (2.60 | ) | ||||
|
|
|
|
|
|
|
|
|
|||||||||
For the three-month and nine-month periods ended September 30, 2014, securities convertible into 31,456,338 and 31,539,962 common shares, respectively, were excluded from the earnings (loss) per share computations because their effect would have been anti-dilutive. For the three-month and nine-month periods ended September 30, 2013, securities convertible into 16,434,324 common shares, respectively, were excluded from the earnings (loss) per share computations because their effect would have been anti-dilutive.
NOTE 13: RELATED PARTY TRANSACTIONS
In the ordinary course of our business operations, we have ongoing relationships and have engaged in transactions with the related entities described below. All of these relationships and transactions were approved or ratified by our audit committee as being on terms comparable to those available on an arm’s-length basis from an unaffiliated third party or otherwise not creating a conflict of interest.
Andrew M. Silberstein serves as a trustee on our board of trustees, as designated pursuant to the purchase agreement with ARS VI Investor I, LLC. Mr. Silberstein is an equity owner of Almanac and an officer of the investor and holds indirect equity interests in the investor. The transactions pursuant to the purchase agreement are described above in Note 10. Also, Almanac receives fees in connection with its investments made pursuant to the purchase agreement. In addition, our subsidiary receives fees for managing a securitization collateralized, in part, by $25,000 of trust preferred securities issued by Advance Realty Group. An affiliate of Almanac owns an interest in Advance Realty Group and Almanac receives fees in connection with this interest.
34
Table of Contents
RAIT Financial Trust
Notes to Consolidated Financial Statements
As of September 30, 2014
(Unaudited and dollars in thousands, except share and per share amounts)
NOTE 14: COMMITMENTS AND CONTINGENCIES
We are involved from time to time in litigation on various matters, including disputes with tenants of owned properties, disputes arising out of agreements to purchase or sell properties and disputes arising out of our loan portfolio. Given the nature of our business activities, these lawsuits are considered routine to the conduct of our business. The result of any particular lawsuit cannot be predicted, because of the very nature of litigation, the litigation process and its adversarial nature, and the jury system. We do not expect that the liabilities, if any, that may ultimately result from such routine legal actions will have a material adverse effect on our consolidated financial position, results of operations or cash flows.
On March 13, 2012, the staff of the SEC notified us that they had initiated a non-public investigation concerning our investment advisory subsidiary, Taberna Capital Management, LLC, or TCM. The investigation relates to TCM’s receipt of approximately $15,000 of restructuring fees from issuers of securities collateralizing Taberna securitizations for which TCM served as collateral manager in connection with certain exchange transactions involving these securities and securitizations. TCM participated in these exchange transactions between March 2, 2009 and November 28, 2012 and has not subsequently participated in any exchange transactions in which it has collected a fee. The SEC staff has issued administrative subpoenas seeking testimony and information from us in connection with this matter, and we are cooperating fully in providing such information.
On September 16, 2014, an agreement in principle with SEC staff was reached to resolve this investigation which remains subject to final documentation and approval by the SEC. The settlement will be entered into by TCM without admitting or denying the allegations and will resolve all violations alleged by the SEC relating to this investigation against TCM under the Investment Advisers Act of 1940, or the Investment Advisers Act, and the Securities Exchange Act of 1934, or the Exchange Act. Under the terms of the agreement in principle, among other things, TCM will pay $21,500 and RAIT will guarantee this payment obligation. This non-recurring settlement charge is included as a component of other liabilities in the accompanying consolidated balance sheet as of September 30, 2014 and other income (expense) in the accompanying consolidated statements of operations for the three-month and nine-month periods ended September 30, 2014. We cannot assure you that the settlement with the SEC will be finalized and/or approved or that any final settlement will not have different or additional material terms.
On October 8, 2014, two executive officers and one former employee of RAIT each received a written “Wells Notice” from the SEC staff. A Wells Notice is neither a formal allegation of wrongdoing nor a finding that any of the recipients violated any law. Rather, it provides a recipient an opportunity to respond to issues raised by the SEC staff and to present any reasons of law, policy or fact why the SEC staff should not recommend that the SEC initiate an enforcement action prior to the SEC staff making such a recommendation. The Wells Notices in this matter indicate the SEC staff has made a preliminary determination to recommend to the SEC that the SEC file an action against each of the named individuals relating to the individuals’ activities on behalf of TCM in connection with the matters that were the subject of the investigation described above. One of these executive officers is our Managing Director-Business Development, General Counsel and Secretary and the other of these executive officers is our Executive Vice President-Portfolio and Risk Management. The former employee left RAIT in 2010.
NOTE 15: SUBSEQUENT EVENTS
On October 20, 2014, IRT entered into five purchase and sale agreements to acquire an apartment residential portfolio with a total of 1,549 units located in Louisville, KY. Pursuant to the terms and conditions of the purchase and sale agreements, the aggregate purchase price is $162,500. The closing is subject to customary terms and conditions and IRT may terminate any of the purchase agreements with or without cause prior to the expiration of the due diligence period.
On October 29, 2014, we closed a CMBS securitization transaction, or RAIT FL3, structured to be collateralized by $219,378 of floating rate commercial mortgage loans and participation interests, or the FL3 collateral, that we originated. The CMBS securitization transaction is intended to finance the FL3 collateral on a non-recourse basis. In connection with the CMBS securitization transaction, our subsidiaries made certain customary representations, warranties and covenants. RAIT FL3 does not have OC triggers or IC triggers.
On the closing date, our subsidiary, RAIT 2014-FL3 Trust, or the FL3 issuer, issued classes of investment grade senior notes, or the FL3 senior notes, with an aggregate principal balance of approximately $181,261 to investors, representing an advance rate of approximately 82.6%. A RAIT subsidiary received the unrated classes of junior notes, or the FL3 junior notes, including a class with an aggregate principal balance of $38,117, and the equity, or the retained interests, of the FL3 issuer. The FL3 senior notes bear interest at a weighted average rate equal to LIBOR plus 1.75%. The stated maturity of the FL3 notes is December 2031, unless redeemed or repaid prior thereto. Subject to certain conditions, beginning in October 2016 or upon defined tax events, the FL3 issuer may redeem the FL3 senior notes, in whole but not in part, at the direction of holders of FL3 junior notes that we hold.
35
Table of Contents
| Item 2. | Management’s Discussion and Analysis of Financial Condition and Results of Operations |
Forward-Looking Statements
In addition to historical information, this discussion and analysis contains forward-looking statements. These statements can be identified by the use of forward-looking terminology including “may,” “believe,” “will,” “expect,” “anticipate,” “estimate,” “continue” or similar words. These forward-looking statements are subject to risks and uncertainties, as more particularly set forth in our filings with the Securities and Exchange Commission, including those described in the “Forward Looking Statements” and “Risk Factors” sections of our Annual Report on Form 10-K for the year ended December 31, 2013, that could cause actual results to differ materially from those projected in the forward-looking statements. Readers are cautioned not to place undue reliance on these forward-looking statements, which reflect management’s analysis only as of the date hereof. We undertake no obligation to publicly revise or update these forward-looking statements to reflect events or circumstances that arise after the date of this report, except as may be required by applicable law.
Overview
We are a multi-strategy commercial real estate company. Our vertically integrated platform originates commercial real estate loans, acquires commercial real estate properties and invests in, manages, services and advises on commercial real estate-related assets. We offer a comprehensive set of debt financing options to the commercial real estate industry along with asset and property management services. We also own and manage a portfolio of commercial real estate properties and manage real estate-related assets for third parties. We are positioning RAIT for future growth in the area of its historical core competency, commercial real estate lending and direct ownership of real estate, while diversifying the revenue generated from our commercial real estate loans and properties and reducing or removing other non-core assets and activities.
In order to take advantage of market opportunities in the future, and to maximize shareholder value over time, we will continue to focus on:
| • | expanding RAIT’s commercial real estate revenue by investing in commercial real estate-related assets, managing and servicing investments for our own account or for others, and providing property management services; |
| • | creating value through investing in our commercial real estate properties and implementing cost savings programs to help maximize property value over time; |
| • | maintaining and expanding our sources of liquidity; |
| • | managing our leverage to provide risk-adjusted returns for our shareholders; and |
| • | managing our investment portfolios to reposition under-performing assets, increase our cash flows and ultimately recover the value of our assets over time. |
We continue to have success in implementing these strategies as demonstrated by our revenue growth and stable credit performance. Our net interest margin grew as we originated more loans, particularly floating rate bridge loans, and reduced expenses associated with hedges that expired. During the nine-month period ended September 30, 2014, we originated $726.5 million of commercial real estate loans, had conduit loan sales of $239.0 million and CRE loan repayments of $142.2 million, resulting in net loan growth of $345.3 million. Our rental income increased due to the acquisition of 20 properties since September 30, 2013 and improving occupancy and rental rates in our historical portfolio. Rental income includes $32.8 million related to rental income associated with IRT. Due to the impact of the previously announced $21.5 million non-recurring settlement charge relating to an agreement in principle, or the settlement agreement, among the SEC staff and TCM and us to resolve a non-public investigation (see Part II. Other Information—Item 1. Legal Proceedings), our cash available for distribution, or CAD, per share for the three-month period ended September 30, 2014 was $0.00. Excluding the impact of this charge, our asset growth and asset performance would have resulted in growth in our CAD, to $36.6 million during the nine-month period September 30, 2014 from $38.7 million during the nine-month period ended September 30, 2013.
While we generated a GAAP net loss allocable to common shares of $63.5 million, or $0.78 per common share-diluted, during the nine-month period ended September 30, 2014, we attribute this loss to the $21.5 million SEC settlement charge relating to the settlement agreement and the continued non-cash negative changes in the fair value of various financial instruments. For the nine-month period ended September 30, 2014, the net change in fair value of financial instruments decreased net income by $59.4 million. This is comprised of the change in fair value of financial instruments of $85.7 million associated with an increase in the fair value of non-recourse debt, CDO Notes payable issued by Taberna VIII and Taberna IX and the associated interest rate hedges. This non-cash mark-to-market reduction to earnings was partially offset by $11.0 million of non-cash mark-to-market increases in the fair value of trading securities and security related receivables.
We are undertaking to exit our Taberna business, including TCM’s management of our two consolidated Taberna securitizations, Taberna VIII and Taberna IX by December 31, 2014. We expect such exit will result, at the appropriate time, in a one-time, non-cash charge to GAAP earnings of approximately $227.1 million and a one-time reduction to total GAAP equity of $214.0 million, resulting from our deconsolidation of these securitizations. This charge equals the adjustment for the net effect of the Taberna VIII and Taberna IX securitizations included in our calculation of adjusted book value as of September 30, 2014. This deconsolidation will not have a material impact on our adjusted book value or our CAD. In addition, we expect such deconsolidation to remove a source of volatility from our earnings because we carry the Taberna securitizations’ assets and liabilities at their fair market value which has had substantial fluctuations historically resulting in negative charges to our earnings. See “Securitization Summary” below for further information about the potential impact of any such exit.
36
Table of Contents
Key Statistics
Set forth below are key statistics relating to our business through September 30, 2014 (dollars in thousands, except per share data):
| As of or For the Three-Month Periods Ended | ||||||||||||||||||||
| September 30, | June 30, | March 31, | December 31, | September 30, | ||||||||||||||||
| 2014 | 2014 | 2014 | 2013 | 2013 | ||||||||||||||||
| Financial Statistics: |
||||||||||||||||||||
| Total revenue |
$ | 75,293 | $ | 73,256 | $ | 67,308 | $ | 67,607 | $ | 62,395 | ||||||||||
| Earnings (loss) per share, diluted |
$ | (0.28 | ) | $ | (0.31 | ) | $ | (0.18 | ) | $ | (1.90 | ) | $ | (0.24 | ) | |||||
| Cash available for distribution per share, diluted |
$ | 0.00 | (a) | $ | 0.24 | $ | 0.22 | $ | 0.27 | $ | 0.23 | |||||||||
| Common dividend declared per share |
$ | 0.18 | $ | 0.18 | $ | 0.17 | $ | 0.16 | $ | 0.15 | ||||||||||
| Assets under management |
$ | 5,417,579 | $ | 5,266,296 | $ | 5,119,805 | $ | 3,595,530 | $ | 3,567,675 | ||||||||||
| Funds from operations per share, diluted |
$ | (0.17 | ) | $ | (0.20 | ) | $ | 0.07 | $ | (1.74 | ) | $ | (0.12 | ) | ||||||
| Commercial Real Estate (“CRE”) Loan Portfolio (b): |
||||||||||||||||||||
| Reported CRE Loans—unpaid principal |
$ | 1,369,138 | $ | 1,325,748 | $ | 1,228,452 | $ | 1,115,949 | $ | 1,103,272 | ||||||||||
| Non-accrual loans—unpaid principal |
$ | 40,741 | $ | 30,269 | $ | 28,019 | $ | 37,073 | $ | 45,337 | ||||||||||
| Non-accrual loans as a % of reported loans |
3.0 | % | 2.3 | % | 2.3 | % | 3.3 | % | 4.1 | % | ||||||||||
| Reserve for losses |
$ | 15,662 | $ | 15,336 | $ | 14,279 | $ | 22,955 | $ | 23,317 | ||||||||||
| Reserves as a % of non-accrual loans |
38.4 | % | 50.7 | % | 51.0 | % | 61.9 | % | 51.4 | % | ||||||||||
| Provision for losses |
$ | 1,500 | $ | 1,000 | $ | 1,000 | $ | 1,500 | $ | 500 | ||||||||||
| CRE Property Portfolio: |
||||||||||||||||||||
| Reported investments in real estate, net (c) |
$ | 1,400,715 | $ | 1,268,769 | $ | 1,205,995 | $ | 1,004,186 | $ | 986,296 | ||||||||||
| Net operating income |
$ | 20,932 | $ | 19,524 | $ | 17,093 | $ | 13,919 | $ | 13,712 | ||||||||||
| Number of properties owned (c) |
80 | 74 | 71 | 62 | 61 | |||||||||||||||
| Multifamily units owned (c) |
13,516 | 12,388 | 12,014 | 9,372 | 8,940 | |||||||||||||||
| Office square feet owned |
2,286,284 | 2,248,321 | 2,097,022 | 2,009,852 | 2,015,524 | |||||||||||||||
| Retail square feet owned |
1,790,969 | 1,420,909 | 1,420,909 | 1,421,059 | 1,421,059 | |||||||||||||||
| Acres of land owned |
21.92 | 21.92 | 21.92 | 21.92 | 21.92 | |||||||||||||||
| Average physical occupancy data: |
||||||||||||||||||||
| Multifamily properties |
92.7 | % | 92.8 | % | 93.3 | % | 92.2 | % | 92.5 | % | ||||||||||
| Office properties |
75.0 | % | 74.3 | % | 74.8 | % | 75.6 | % | 74.1 | % | ||||||||||
| Retail properties |
73.3 | % | 67.5 | % | 66.6 | % | 69.0 | % | 68.9 | % | ||||||||||
| Average effective rent per unit/square foot (d) |
||||||||||||||||||||
| Multifamily (e) |
$ | 811 | $ | 799 | $ | 767 | $ | 763 | $ | 761 | ||||||||||
| Office (f) |
$ | 19.64 | $ | 20.10 | $ | 18.70 | $ | 18.40 | $ | 19.45 | ||||||||||
| Retail (f) |
$ | 12.68 | $ | 12.50 | $ | 12.44 | $ | 12.11 | $ | 12.05 | ||||||||||
| (a) | Includes $21.5 million, or $0.26 per share, of the previously announced non-recurring settlement charge relating to the settlement agreement (see Part II. Other Information—Item 1. Legal Proceedings). |
| (b) | CRE Loan Portfolio includes commercial mortgages, mezzanine loans, and preferred equity interests only and does not include other loans. See Note 3-“Investments in Loans” in the Notes to Consolidated Financial Statements for information relating to all loans held by RAIT. |
| (c) | Includes 22 apartment properties owned by IRT with 6,470 units and a book value of $423.2 million as of September 30, 2014. |
| (d) | Based on properties owned as of September 30, 2014. |
| (e) | Average effective rent is rent per unit per month. |
| (f) | Average effective rent is rent per square foot per year. |
37
Table of Contents
Investors should read Management’s Discussion and Analysis of Financial Condition and Results of Operations in our Annual Report on Form 10-K for the fiscal year ended December 31, 2013, or the Annual Report, for a detailed discussion of the following items:
| • | Credit, capital markets and liquidity risk. |
| • | Interest rate environment. |
| • | Prepayment rates. |
| • | Commercial real estate performance. |
Our Investment Portfolio
Our consolidated investment portfolio is currently comprised of the following asset classes:
Commercial mortgages, mezzanine loans, other loans and preferred equity interests. We originate and own commercial senior long-term mortgage loans, including conduit loans, short-term bridge loans, subordinated, or “mezzanine,” financing and preferred equity interests. These assets are in most cases “non-recourse” or limited recourse loans secured by commercial real estate assets or real estate entities. This means that we look primarily to the assets securing the loan for repayment, subject to certain standard exceptions. We originate loans that are eligible to be sold to securitizations issuing commercial mortgage backed securities, or CMBS, which we refer to as conduit loans. We may from time to time acquire existing commercial real estate loans from third parties who have originated such loans, including banks, other institutional lenders or third-party investors. Where possible, we seek to maintain direct lending relationships with borrowers, as opposed to investing in loans controlled by third party lenders.
The tables below describe certain characteristics of our commercial mortgages, mezzanine loans, other loans and preferred equity interests as of September 30, 2014 (dollars in thousands):
| Book Value | Weighted- Average Coupon |
Range of Maturities | Number of Loans |
|||||||||||
| Commercial Real Estate (CRE) Loans |
||||||||||||||
| Commercial mortgages |
$ | 1,053,190 | 5.9 | % | Dec. 2014 to Jul. 2044 | 86 | ||||||||
| Mezzanine loans |
254,977 | 9.4 | % | Dec. 2014 to Jan. 2029 | 77 | |||||||||
| Preferred equity interests |
42,608 | 7.7 | % | May 2015 to Aug. 2025 | 10 | |||||||||
|
|
|
|
|
|
|
|||||||||
| Total CRE Loans |
1,350,775 | 6.6 | % | 173 | ||||||||||
| Other loans |
20,191 | 2.8 | % | Oct. 2016 | 1 | |||||||||
|
|
|
|
|
|
|
|||||||||
| Total investments in loans |
$ | 1,370,966 | 6.6 | % | 174 | |||||||||
|
|
|
|
|
|
|
|||||||||
During the nine-month period ended September 30, 2014, we originated $726.5 million of new loans and had conduit loan sales of $239.0 million and CRE loan repayments of $142.2 million, resulting in net loan growth of $345.3 million.
The charts below describe the property types and the geographic breakdown of our commercial mortgages, mezzanine loans, other loans, and preferred equity interests as of September 30, 2014:
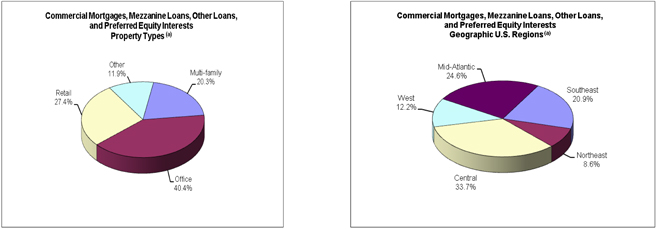
| (a) | Based on book value. |
38
Table of Contents
Investments in real estate. We invest in real estate properties, primarily multi-family properties, throughout the United States. The table below describes certain characteristics of our investments in real estate as of September 30, 2014 (dollars in thousands, except average effective rent):
| Investments in Real Estate (a) |
Average Physical Occupancy |
Units/ Square Feet/ Acres |
Number of Properties |
Average Effective Rent (a) |
||||||||||||||||
| Multi-family real estate properties (b)(c) |
$ | 1,040,808 | 92.7 | % | 13,516 | 50 | $ | 811 | ||||||||||||
| Office real estate properties (d) |
330,725 | 75.0 | % | 2,286,284 | 14 | 19.64 | ||||||||||||||
| Retail real estate properties (d) |
134,341 | 73.3 | % | 1,790,969 | 6 | 12.68 | ||||||||||||||
| Parcels of land |
50,656 | N/A | 21.9 | 10 | N/A | |||||||||||||||
|
|
|
|
|
|||||||||||||||||
| Total |
$ | 1,556,530 | 80 | |||||||||||||||||
|
|
|
|
|
|||||||||||||||||
| (a) | Based on properties owned as of September 30, 2014. |
| (b) | Includes 22 apartment properties owned by IRT with 6,470 units and a book value of $423.2 million as of September 30, 2014. |
| (c) | Average effective rent is rent per unit per month. |
| (d) | Average effective rent is rent per square foot per year. |
The charts below describe the property types and the geographic breakdown of our investments in real estate as of September 30, 2014:
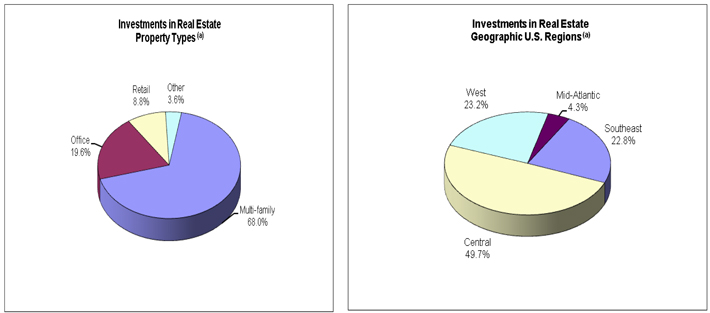
| (a) | Based on book value. |
Investment in debt securities—TruPS and Subordinated Debentures. Historically, we provided REITs and real estate operating companies the ability to raise subordinated debt capital through TruPS and subordinated debentures. TruPS are long-term instruments, with maturities ranging from 5 to 30 years, which are priced based on short-term variable rates, such as the three-month London Inter-Bank Offered Rate, or LIBOR. TruPS are unsecured and generally contain minimal financial and operating covenants. We financed most of our debt securities portfolio in a series of non-recourse securitizations which provided long-dated, interest-only, match funded financing to the TruPS and subordinated debenture investments. As of September 30, 2014, we retained a controlling interest in two such securitizations—Taberna VIII and Taberna IX, which are consolidated entities. We present all of the collateral assets for the debt securities and the related non-recourse securitization financing obligations at fair value in our consolidated financial statements. During the nine-month period ended September 30, 2014, due to the credit performance of the underlying collateral, we received only our senior collateral management fees from these two securitizations. We do not expect to add investments in this asset category for the foreseeable future due to market conditions and previously announced our undertaking to exit these securitizations.
39
Table of Contents
The table below describes our investment in TruPS and subordinated debentures as included in our consolidated financial statements as of September 30, 2014 (dollars in thousands):
| Issuer Statistics | ||||||||||||||||
| Industry Sector |
Estimated Fair Value |
Weighted- Average Coupon |
Weighted Average Ratio of Debt to Total Capitalization |
Weighted Average Interest Coverage Ratio |
||||||||||||
| Commercial Mortgage |
$ | 106,592 | 1.5 | % | 34.0 | % | 8.7x | |||||||||
| Office |
132,058 | 6.7 | % | 61.2 | % | 3.2x | ||||||||||
| Residential Mortgage |
51,477 | 2.5 | % | 76.4 | % | 1.7x | ||||||||||
| Specialty Finance |
86,935 | 4.3 | % | 79.9 | % | 1.4x | ||||||||||
| Homebuilders |
18,750 | 8.0 | % | 87.5 | % | 1.9x | ||||||||||
| Retail |
77,098 | 2.3 | % | 61.5 | % | 3.0x | ||||||||||
| Hospitality |
24,711 | 8.7 | % | 144.3 | % | 0.8x | ||||||||||
|
|
|
|
|
|
|
|
|
|||||||||
| Total |
$ | 497,621 | 3.7 | % | 65.4 | % | 3.7x | |||||||||
|
|
|
|
|
|
|
|
|
|||||||||
The chart below describes the equity capitalization of our investment in TruPS and subordinated debentures as included in our consolidated financial statements as of September 30, 2014:
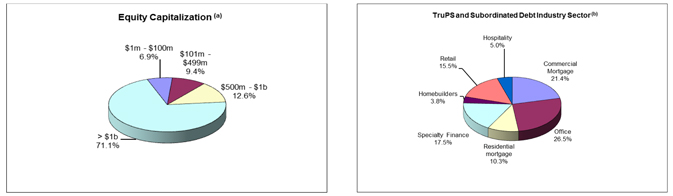
| (a) | Based on the most recent information available to management as provided by our TruPS issuers or through public filings. |
| (b) | Based on estimated fair value. |
Investment in debt securities—Other Real Estate Related Debt Securities. We have invested, and expect to continue to invest, in CMBS, unsecured REIT notes and other real estate-related debt securities.
Unsecured REIT notes are publicly traded debentures issued by large public reporting REITs and other real estate companies. These debentures generally pay interest semi-annually.
CMBS generally are multi-class debt or pass-through certificates issued by CMBS securitizations secured or backed by single loans or pools of mortgage loans on commercial real estate properties. Our CMBS investments may include loans and securities that are rated investment grade by one or more nationally-recognized rating agencies, as well as both unrated and non-investment grade loans and securities.
40
Table of Contents
The table and the chart below describe certain characteristics of our real estate-related debt securities as of September 30, 2014 (dollars in thousands):
| Investment Description |
Estimated Fair Value |
Weighted- Average Coupon |
Weighted- Average Years to Maturity |
Amortized Cost | ||||||||||||
| Unsecured REIT note receivables |
$ | 32,532 | 6.7 | % | 2.4 | $ | 30,000 | |||||||||
| CMBS receivables |
36,435 | 5.8 | % | 32.0 | 53,383 | |||||||||||
| Other securities |
1,691 | 2.7 | % | 33.8 | 44,532 | |||||||||||
|
|
|
|
|
|
|
|
|
|||||||||
| Total |
$ | 70,658 | 4.7 | % | 26.5 | $ | 127,915 | |||||||||
|
|
|
|
|
|
|
|
|
|||||||||
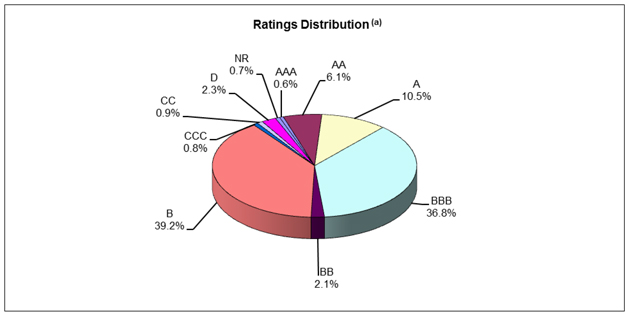
| (a) | S&P Ratings as of September 30, 2014. |
Securitization Summary
Overview. We have used securitizations to match fund the interest rates and maturities of our assets with the interest rates and maturities of the related financing. This strategy has helped us reduce interest rate and funding risks on our portfolios for the long term. A securitization is a structure in which multiple classes of debt and equity are issued by a special purpose entity to finance a portfolio of assets. Cash flow from the portfolio of assets is used to repay the securitization liabilities sequentially, in order of seniority. The most senior classes of debt typically have credit ratings of “AAA” through “BBB–” and therefore can be issued at yields that are lower than the average yield of the securities backing the securitization. The debt tranches are typically rated based on portfolio quality, diversification and structural subordination. The equity securities issued by the securitization are the “first loss” piece of the capital structure, but they are entitled to all residual amounts available for payment after the obligations to the debt holders have been satisfied.
Performance. Most of our securitizations listed below contain interest coverage triggers, or IC triggers, and overcollateralization triggers, or OC triggers, that must be met in order for us to receive our subordinated management fees and our lower-rated debt or residual equity returns. If the IC triggers or OC triggers are not met in a given period, then the cash flows are redirected from lower rated tranches and used to repay the principal amounts to the senior tranches of CDO notes payable. These conditions and the re-direction of cash flow continue until the triggers are met by curing the underlying payment defaults, paying down the CDO notes payable or other actions permitted under the relevant securitization indenture.
As of the most recent payment information, the Taberna I, Taberna VIII and Taberna IX securitizations that we manage were not passing all of their required IC triggers or OC triggers and we received only senior asset management fees. All applicable IC triggers and OC triggers continue to be met for our two commercial real estate securitizations, RAIT I and RAIT II, and we continue to receive all of our management fees, interest and residual returns from these securitizations.
41
Table of Contents
A summary of the investments in our consolidated securitizations as of the most recent payment information is as follows:
| • | RAIT I—RAIT I has $888.0 million of total collateral at par value, of which $18.4 million is defaulted. The current overcollateralization, or OC, test is passing at 127.5% with an OC trigger of 116.2%. We currently own $67.0 million of the securities that were originally rated investment grade and $200.0 million of the non-investment grade securities issued by this securitization. We are currently receiving all distributions required by the terms of our retained interests in this securitization and are receiving all of our collateral management fees. We pledged $35.1 million of the securities we own issued by RAIT I as collateral for a senior secured note we issued. |
| • | RAIT II—RAIT II has $720.5 million of total collateral at par value, of which $19.9 million is defaulted. The current OC test is passing at 120.8% with an OC trigger of 111.7%. We currently own $108.5 million of the securities that were originally rated investment grade and $140.7 million of the non-investment grade securities issued by this securitization. We are currently receiving all distributions required by the terms of our retained interests in this securitization and are receiving all of our collateral management fees. We pledged $83.5 million of the securities we own issued by RAIT II as collateral for a senior secured note we issued. |
| • | RAIT FL1—RAIT FL1 has $93.4 million of total collateral at par value, of which there is no collateral that is in default. RAIT FL1 does not have OC triggers or IC triggers. RAIT FL1, has issued classes of investment grade senior notes with an aggregate principal balance of approximately $59.7 million to investors. We currently own the unrated classes of junior notes, including a class with an aggregate principal balance of $33.7 million, and the equity, or the retained interests, of RAIT FL1. |
| • | RAIT FL2—RAIT FL2 has $196.1 million of total collateral at par value, of which there is no collateral that is in default. RAIT FL2 does not have OC triggers or IC triggers. RAIT FL2, has issued classes of investment grade senior notes with an aggregate principal balance of approximately $155.9 million to investors. We currently own the unrated classes of junior notes, including a class with an aggregate principal balance of $40.2 million, and the equity, or the retained interests, of RAIT FL2. |
| • | Taberna VIII—Taberna VIII has $464.1 million of total collateral at par value, of which $39.9 million is defaulted. The current OC test is failing at 80.1% with an OC trigger of 103.5%. We currently own $40.0 million of the securities that were originally rated investment grade and $93.0 million of the non-investment grade securities issued by this securitization. We do not expect to receive any distributions from this securitization other than our senior management fees for the foreseeable future. |
| • | Taberna IX—Taberna IX has $487.7 million of total collateral at par value, of which $102.6 million is defaulted. The current OC test is failing at 66.6% with an OC trigger of 105.4%. We currently own $89.0 million of the securities that were originally rated investment grade and $97.5 million of the non-investment grade securities issued by this securitization. We do not expect to receive any distributions from this securitization other than our senior management fees for the foreseeable future. |
RAIT 2014-FL3 Securitization
On October 29, 2014, we closed a CMBS securitization transaction, or RAIT FL3, structured to be collateralized by $219.4 million of floating rate commercial mortgage loans and participation interests, or the FL3 collateral, that we originated. The CMBS securitization transaction is intended to finance the FL3 collateral on a non-recourse basis. In connection with the CMBS securitization transaction, our subsidiaries made certain customary representations, warranties and covenants. RAIT FL3 does not have OC triggers or IC triggers.
On the closing date, our subsidiary, RAIT 2014-FL3 Trust, or the FL3 issuer, issued classes of investment grade senior notes, or the FL3 senior notes, with an aggregate principal balance of approximately $181.3 million to investors, representing an advance rate of approximately 82.6%. A RAIT subsidiary received the unrated classes of junior notes, or the FL3 junior notes, including a class with an aggregate principal balance of $38.1 million, and the equity, or the retained interests, of the FL3 issuer. The FL3 senior notes bear interest at a weighted average rate equal to LIBOR plus 1.75%. The stated maturity of the FL3 notes is December 2031, unless redeemed or repaid prior thereto. Subject to certain conditions, beginning in October 2016 or upon defined tax events, the FL3 issuer may redeem the FL3 senior notes, in whole but not in part, at the direction of holders of FL3 junior notes that we hold.
Taberna Exit
Our undertaking to exit the Taberna business referenced above in “Overview” may include, without limitation, any or all of the following: the assignment or delegation of TCM’s rights and obligations under the collateral management agreements to which it is party, TCM’s resignation as collateral manager, the termination of TCM’s advisory business and/or our sale or transfer of any securities issued by Taberna securitizations that we own. We cannot assure you that we will be able to commit to or complete exiting the Taberna business. The actual impact on RAIT’s financial results, CAD, or adjusted book value of any such exit may be materially different from what we have projected, depending on market conditions for similar securitizations and securities generally and the timing and actual terms and circumstances of any such exit.
42
Table of Contents
The following table represents the pro-forma summarized consolidated balance sheet information as of September 30, 2014 assuming the deconsolidation of the Taberna securitizations occurred on September 30, 2014.
Pro-Forma Consolidated Balance Sheet
(Unaudited, in thousands except shares and per share data)
| As of September 30, 2014 | ||||||||||||
| Historical | Adjustments (a) | Pro Forma | ||||||||||
| Assets |
||||||||||||
| Total investments in mortgages and loans, net |
$ | 1,354,120 | $ | (42,694 | ) | $ | 1,311,426 | |||||
| Investments in real estate, net |
1,400,715 | — | 1,400,715 | |||||||||
| Investments in securities, at fair value |
568,279 | (530,312 | ) | 37,967 | ||||||||
| Cash and cash equivalents |
116,767 | — | 116,767 | |||||||||
| Restricted cash |
133,374 | (11,147 | ) | 122,227 | ||||||||
| Accrued interest receivable |
54,929 | (6,310 | ) | 48,619 | ||||||||
| Other assets |
78,948 | (630 | ) | 78,318 | ||||||||
| Deferred financing costs, net |
25,141 | — | 25,141 | |||||||||
| Intangible assets, net |
23,944 | — | 23,944 | |||||||||
|
|
|
|
|
|
|
|||||||
| Total assets |
$ | 3,756,217 | $ | (591,093 | ) | $ | 3,165,124 | |||||
|
|
|
|
|
|
|
|||||||
| Liabilities and Equity |
||||||||||||
| Indebtedness |
$ | 2,613,317 | $ | (297,251 | ) | $ | 2,316,066 | |||||
| Accrued interest payable |
34,164 | (23,226 | ) | 10,938 | ||||||||
| Accounts payable and accrued expenses |
58,579 | (81 | ) | 58,498 | ||||||||
| Derivative liabilities |
81,998 | (56,526 | ) | 25,472 | ||||||||
| Deferred taxes, borrowers’ escrows and other liabilities |
132,200 | — | 132,200 | |||||||||
|
|
|
|
|
|
|
|||||||
| Total liabilities |
2,920,258 | (377,084 | ) | 2,543,174 | ||||||||
| Series D cumulative redeemable preferred shares |
76,176 | — | 76,176 | |||||||||
| Total shareholders’ equity |
604,162 | (214,009 | ) | 390,153 | ||||||||
| Total equity |
759,783 | (214,009 | ) | 545,774 | ||||||||
|
|
|
|
|
|
|
|||||||
| Total liabilities and equity |
$ | 3,756,217 | $ | (591,093 | ) | $ | 3,165,124 | |||||
|
|
|
|
|
|
|
|||||||
| (a) | RAIT is undertaking to exit the Taberna business. RAIT expects that any such exit will require RAIT to deconsolidate the assets, liabilities and impact on shareholders’ equity of RAIT’s consolidated Taberna securitizations: Taberna VIII and IX. These adjustments reflect the removal of these items from our consolidated balance sheet as of September 30, 2014. These adjustments do not assume the sale or other transfer of the collateral management agreements associated with any Taberna securitizations or the receipt of any proceeds for such sale or other transfer. |
43
Table of Contents
The following tables represent the pro-forma summarized consolidated statements of operations for the nine-month period ended September 30, 2014 and for the year ended December 31, 2013 assuming the deconsolidation of the Taberna securitizations occurred on January 1 of each period.
Pro-Forma Consolidated Statement of Operations
(Unaudited, in thousands except shares and per share data)
| For the Nine-Month Period Ended September 30, 2014 |
||||||||||||
| Historical | Adjustments (a) | Pro Forma | ||||||||||
| Revenue: |
||||||||||||
| Net interest margin |
$ | 80,540 | $ | (15,297 | ) | $ | 65,243 | |||||
| Rental income |
116,204 | — | 116,204 | |||||||||
| Fee and other income |
19,113 | 967 | 20,080 | |||||||||
|
|
|
|
|
|
|
|||||||
| Total revenue |
215,857 | (14,330 | ) | 201,527 | ||||||||
| Expenses: |
||||||||||||
| Interest expense |
38,756 | 9,570 | 48,326 | |||||||||
| Real estate operating expense |
58,655 | — | 58,655 | |||||||||
| Compensation expense |
23,118 | — | 23,118 | |||||||||
| General and administrative expense |
13,239 | (596 | ) | 12,643 | ||||||||
| Acquisition expenses |
1,408 | — | 1,408 | |||||||||
| Provision for losses |
3,500 | — | 3,500 | |||||||||
| Depreciation and amortization expense |
38,719 | — | 38,719 | |||||||||
|
|
|
|
|
|
|
|||||||
| Total expenses |
177,395 | 8,974 | 186,369 | |||||||||
|
|
|
|
|
|
|
|||||||
| Operating income (loss) |
38,462 | (23,304 | ) | 15,158 | ||||||||
| Other income (expense) |
(21,449 | ) | — | (21,449 | ) | |||||||
| Gains (losses) on assets |
(5,350 | ) | 7,712 | 2,362 | ||||||||
| Gains (losses) on extinguishment of debt |
2,421 | — | 2,421 | |||||||||
| Change in fair value of financial instruments |
(59,433 | ) | 75,379 | 15,946 | ||||||||
|
|
|
|
|
|
|
|||||||
| Income (loss) before taxes |
(45,349 | ) | 59,787 | 14,438 | ||||||||
| Income tax benefit (provision) |
2,454 | — | 2,454 | |||||||||
|
|
|
|
|
|
|
|||||||
| Net income (loss) |
(42,895 | ) | 59,787 | 16,892 | ||||||||
| (Income) loss allocated to preferred shares |
(20,628 | ) | — | (20,628 | ) | |||||||
| (Income) loss allocated to noncontrolling interests |
20 | — | 20 | |||||||||
|
|
|
|
|
|
|
|||||||
| Net income (loss) available to common shares |
$ | (63,503 | ) | $ | 59,787 | $ | (3,716 | ) | ||||
|
|
|
|
|
|
|
|||||||
| Earnings (loss) per share - Basic: |
||||||||||||
| Earnings (loss) per share - Basic |
$ | (0.78 | ) | $ | 0.73 | $ | (0.05 | ) | ||||
|
|
|
|
|
|
|
|||||||
| Weighted-average shares outstanding - Basic |
81,111,796 | 81,111,796 | 81,111,796 | |||||||||
|
|
|
|
|
|
|
|||||||
| Earnings (loss) per share - Diluted: |
||||||||||||
| Earnings (loss) per share - Diluted |
$ | (0.78 | ) | $ | 0.73 | $ | (0.05 | ) | ||||
|
|
|
|
|
|
|
|||||||
| Weighted-average shares outstanding - Diluted |
81,111,796 | 81,111,796 | 81,111,796 | |||||||||
|
|
|
|
|
|
|
|||||||
| (a) | RAIT is undertaking to exit the Taberna business. RAIT expects that any such exit will require RAIT to deconsolidate the assets, liabilities and impact on shareholders’ equity of RAIT’s consolidated Taberna securitizations: Taberna VIII and IX. These adjustments reflect the removal of the revenue, expenses, gains and losses and changes in fair value derived from these items from our results of operations for the nine-month period ended September 30, 2014. These adjustments reflect the collateral management fees for the consolidated Taberna securitizations previously eliminated in consolidation and do not assume the sale or other transfer of the collateral management agreements associated with any Taberna securitizations or the receipt of any proceeds for such sale or other transfer. |
44
Table of Contents
Pro-Forma Consolidated Statement of Operations
(Unaudited, in thousands except shares and per share data)
| For the Year Ended December 31, 2013 | ||||||||||||
| Historical | Adjustments (a) | Pro Forma | ||||||||||
| Revenue: |
||||||||||||
| Net interest margin |
$ | 103,852 | $ | (24,820 | ) | $ | 79,032 | |||||
| Rental income |
114,224 | — | 114,224 | |||||||||
| Fee and other income |
28,799 | 1,200 | 29,999 | |||||||||
|
|
|
|
|
|
|
|||||||
| Total revenue |
246,875 | (23,620 | ) | 223,255 | ||||||||
| Expenses: |
||||||||||||
| Interest expense |
40,297 | 13,712 | 54,009 | |||||||||
| Real estate operating expense |
60,887 | — | 60,887 | |||||||||
| Compensation expense |
26,802 | — | 26,802 | |||||||||
| General and administrative expense |
14,496 | (737 | ) | 13,759 | ||||||||
| Acquisition expense |
397 | — | 397 | |||||||||
| Provision for losses |
3,000 | — | 3,000 | |||||||||
| Depreciation and amortization expense |
36,093 | — | 36,093 | |||||||||
|
|
|
|
|
|
|
|||||||
| Total expenses |
181,972 | 12,975 | 194,947 | |||||||||
|
|
|
|
|
|
|
|||||||
| Operating income (loss) |
64,903 | (36,595 | ) | 28,308 | ||||||||
| Other income (expense) |
(5,233 | ) | — | (5,233 | ) | |||||||
| Gains (losses) on assets |
(2,266 | ) | 90 | (2,176 | ) | |||||||
| Gains (losses) on extinguishment of debt |
(1,275 | ) | — | (1,275 | ) | |||||||
| Change in fair value of financial instruments |
(344,426 | ) | 323,938 | (20,488 | ) | |||||||
|
|
|
|
|
|
|
|||||||
| Income (loss) before taxes |
(288,297 | ) | 287,433 | (864 | ) | |||||||
| Income tax benefit (provision) |
2,933 | — | 2,933 | |||||||||
|
|
|
|
|
|
|
|||||||
| Net income (loss) |
(285,364 | ) | 287,433 | 2,069 | ||||||||
| (Income) loss allocated to preferred shares |
(22,616 | ) | — | (22,616 | ) | |||||||
| (Income) loss allocated to noncontrolling interests |
(28 | ) | — | (28 | ) | |||||||
|
|
|
|
|
|
|
|||||||
| Net income (loss) allocable to common shares |
$ | (308,008 | ) | $ | 287,433 | $ | (20,575 | ) | ||||
|
|
|
|
|
|
|
|||||||
| Earnings (loss) per share - Basic: |
||||||||||||
| Earnings (loss) per share - Basic |
$ | (4.54 | ) | $ | 4.24 | $ | (0.30 | ) | ||||
|
|
|
|
|
|
|
|||||||
| Weighted-average shares outstanding - Basic |
67,814,316 | 67,814,316 | 67,814,316 | |||||||||
|
|
|
|
|
|
|
|||||||
| Earnings (loss) per share - Diluted: |
||||||||||||
| Earnings (loss) per share - Diluted |
$ | (4.54 | ) | $ | 4.24 | $ | (0.30 | ) | ||||
|
|
|
|
|
|
|
|||||||
| Weighted-average shares outstanding - Diluted |
67,814,316 | 67,814,316 | 67,814,316 | |||||||||
|
|
|
|
|
|
|
|||||||
| (a) | RAIT is undertaking to exit the Taberna business. RAIT expects that any such exit will require RAIT to deconsolidate the assets, liabilities and impact on shareholders’ equity of RAIT’s consolidated Taberna securitizations: Taberna VIII and IX. These adjustments reflect the removal of the revenue, expenses, gains and losses and changes in fair value derived from these items from our results of operations for the year ended December 31, 2013. These adjustments reflect the collateral management fees for the consolidated Taberna securitizations previously eliminated in consolidation and do not assume the sale or other transfer of the collateral management agreements associated with any Taberna securitizations or the receipt of any proceeds for such sale or other transfer. |
45
Table of Contents
The following table represents the pro-forma adjusted book value information as of September 30, 2014 assuming the deconsolidation of the Taberna securitizations occurred on September 30, 2014.
Pro-Forma Adjusted Book Value (a)
(Unaudited, in thousands except shares and per share data)
| As of September 30, 2014 | ||||||||
| Pro-Forma Amount | Pro Forma Per Share (b) | |||||||
| Pro-forma total shareholders’ equity (c) |
$ | 390,153 | $ | 4.73 | ||||
| Liquidation value of preferred shares characterized as equity (d) |
(200,103 | ) | (2.42 | ) | ||||
|
|
|
|
|
|||||
| Book value |
190,050 | 2.31 | ||||||
| Adjustments: |
||||||||
| RAIT I and RAIT II derivative liabilities |
25,127 | 0.30 | ||||||
| Change in fair value for warrants and investor SARs |
6,766 | 0.08 | ||||||
| Accumulated depreciation and amortization |
198,901 | 2.41 | ||||||
| Valuation of recurring collateral, property management fees and other items (e) |
88,827 | 1.08 | ||||||
|
|
|
|
|
|||||
| Total adjustments |
319,621 | 3.87 | ||||||
|
|
|
|
|
|||||
| Adjusted book value |
$ | 509,671 | $ | 6.18 | ||||
|
|
|
|
|
|||||
| (a) | Management views adjusted book value as a useful and appropriate supplement to shareholders’ equity and book value per share. The measure serves as an additional measure of our value because it facilitates evaluation of us without the effects of various items that we are required to record in accordance with GAAP but which have limited economic impact on our business. Those adjustments primarily reflect the effect of consolidated securitizations where we do not currently receive cash flows on our retained interests, accumulated depreciation and amortization, the valuation of long-term derivative instruments and a valuation of our recurring collateral and property management fees. Adjusted book value is a non-GAAP financial measurement, and does not purport to be an alternative to reported shareholders’ equity, determined in accordance with GAAP, as a measure of book value. Adjusted book value should be reviewed in connection with shareholders’ equity as set forth in our consolidated balance sheets, to help analyze our value to investors. Adjusted book value may be defined in various ways throughout the REIT industry. Investors should consider these differences when comparing our adjusted book value to that of other REITs. |
| (b) | Based on 82,509,635 common shares outstanding as of September 30, 2014. |
| (c) | RAIT is undertaking to exit the Taberna business. RAIT expects that any such exit will require RAIT to deconsolidate the assets, liabilities and impact on shareholders’ equity of RAIT’s consolidated Taberna securitizations: Taberna VIII and IX. Does not assume the sale or other transfer of the collateral management agreements associated with any Taberna securitizations or the receipt of any proceeds for such sale or other transfer. |
| (d) | Based on 4,075,569 Series A preferred shares, 2,288,465 Series B preferred shares, and 1,640,100 Series C preferred shares outstanding as of September 30, 2014, all of which have a liquidation preference of $25.00 per share. |
| (e) | Includes the estimated value of the (1) property management and collateral management fees to be received by RAIT as of September 30, 2014 from RAIT Residential and Urban Retail, and the Taberna I, Taberna VIII, Taberna IX, RAIT I and RAIT II securitizations and (2) advisory fees to be received by RAIT from IRT as of September 30, 2014 assuming the full deployment of IRT’s July 2014 common stock offering. The other item included is the incremental market value of RAIT’s ownership of 7.3 million shares of IRT common stock over RAIT’s book value for these shares at September 30, 2014. |
46
Table of Contents
The following table represents the pro-forma cash available for distribution information for the nine-month period ended September 30, 2014 assuming the deconsolidation of the Taberna securitizations occurred on January 1, 2014.
Pro-Forma Cash Available for Distribution (a)
(Unaudited, in thousands except shares and per share data)
| For the Nine-Month Period Ended September 30, 2014 |
||||||||
| Pro-Forma Amount (b) | Pro-Forma Per Share (c) | |||||||
| Cash Available for Distribution: |
||||||||
| Net income (loss) allocable to common shares |
$ | (3,716 | ) | $ | (0.05 | ) | ||
| Adjustments: |
||||||||
| Depreciation and amortization expense |
38,719 | 0.48 | ||||||
| Change in fair value of financial instruments |
(15,946 | ) | (0.20 | ) | ||||
| Gains (losses) on assets |
(2,362 | ) | (0.03 | ) | ||||
| Gains (losses) on extinguishment of debt |
(2,421 | ) | (0.03 | ) | ||||
| Straight-line rental adjustments |
(329 | ) | — | |||||
| Share-based compensation |
3,777 | 0.05 | ||||||
| Origination fees and other deferred items |
17,691 | 0.22 | ||||||
| Provision for losses |
3,500 | 0.04 | ||||||
| Noncontrolling interest effect from certain adjustments |
(2,351 | ) | (0.03 | ) | ||||
|
|
|
|
|
|||||
| Cash Available for Distribution |
$ | 36,562 | $ | 0.45 | ||||
|
|
|
|
|
|||||
| (a) | Cash available for distribution, or CAD, is a non-GAAP financial measure. We believe that CAD provides investors and management with a meaningful indicator of operating performance. Management also uses CAD, among other measures, to evaluate profitability and our board of trustees considers CAD in determining our quarterly cash distributions. We also believe that CAD is useful because it adjusts for a variety of non-cash items (such as depreciation and amortization, equity-based compensation, realized gain (loss) on assets, provision for loan losses and non-cash interest income and expense items). Furthermore, CAD removes the effect from our consolidation of the legacy Taberna securitizations. We calculate CAD by subtracting from or adding to net income (loss) attributable to common shareholders the following items: depreciation and amortization items including, depreciation and amortization, straight-line rental income or expense, amortization of in-place leases, amortization of deferred financing costs, amortization of discount on financings and equity-based compensation; changes in the fair value of our financial instruments, including such changes reflected in our consolidated Taberna securitizations; net interest income from consolidated Taberna securitizations; realized gain (loss) on assets and other; provision for loan losses; impairment on depreciable property; acquisition gains or losses and transaction costs; certain fee income eliminated in consolidation that is attributable to third parties; and one-time events pursuant to changes in U.S. GAAP and certain other non-recurring items. CAD should not be considered as an alternative to net income (loss), determined in accordance with U.S. GAAP, as an indicator of operating performance. In addition, our methodology for calculating CAD may differ from the methodologies used by other comparable companies, including other REITs, when calculating the same or similar supplemental financial measures and may not be comparable with these companies. |
| (b) | RAIT is undertaking to exit the Taberna business. These pro-forma adjustments remove the effect of the assets, liabilities and impact on shareholders’ equity of RAIT’s consolidated securitizations; Taberna VIII and IX. This pro-forma CAD does not assume the sale or other transfer of the collateral management contracts for RAIT’s managed Taberna securitizations: Taberna I, VIII and IX or the receipt of any proceeds for such sale or other transfer. |
| (c) | Based 81,111,796 weighted-average shares outstanding-diluted for the nine-month period ended September 30, 2014. |
Independence Realty Trust, Inc.
The IRT common stock trades on the NYSE MKT under the symbol “IRT” with a closing price of $9.57 as of November 6, 2014. We currently hold 7,269,719 shares of IRT common stock representing 28.2% percent of the outstanding shares of IRT common stock as of November 6, 2014. We continue to consolidate IRT in our financial results as of September 30, 2014. For the nine-month period ended September 30, 2014, we reflected IRT’s operating results in our financial results, including $2.7 million of net income. As of September 30, 2014, IRT owned 22 multi-family properties with 6,470 units and a book value of $423.2 million were reflected on our balance sheet. As of December 31, 2013, IRT owned 10 multi-family properties with 2,790 units and a book value of $174.3 million were reflected on our balance sheet. For the nine-month period ended September 30, 2014, we earned $1.1 million for fees from IRT under our advisory agreement with IRT and received $3.8 million for distributions declared on our IRT common stock, both of which are eliminated in consolidation. On July 21, 2014, IRT completed an underwritten public offering selling 8,050,000 shares of IRT common stock for $9.50 per share raising net proceeds of $72.4 million. We purchased 300,000 shares of common stock in the offering, at the public offering price, for which no underwriting discounts and commissions will be paid to the underwriters.
On October 20, 2014, IRT entered into five purchase and sale agreements to acquire an apartment residential portfolio with a total of 1,549 units located in Louisville, KY. Pursuant to the terms and conditions of the purchase and sale agreements, the aggregate purchase price is $162,500. The closing is subject to customary terms and conditions and IRT may terminate any of the purchase agreements with or without cause prior to the expiration of the due diligence period.
47
Table of Contents
Assets Under Management
Assets under management, or AUM, is an operating measure representing the total assets that we own or are managing for third parties. While not all AUM generates fee income, it is an important operating measure to gauge our asset growth, volume of originations, size and scale of our operations and our performance. AUM includes our total investment portfolio and assets associated with unconsolidated securitizations for which we derive asset management fees.
The table below summarizes our AUM as of September 30, 2014 and December 31, 2013 (dollars in thousands):
| AUM as of September 30, 2014 |
AUM as of December 31, 2013 |
|||||||
| Commercial real estate portfolio (1) |
$ | 2,737,620 | $ | 2,092,810 | ||||
| U.S. TruPS portfolio (2) |
1,446,307 | 1,502,720 | ||||||
| Property management (3) |
1,233,652 | 0 | ||||||
|
|
|
|
|
|||||
| Total |
$ | 5,417,579 | $ | 3,595,530 | ||||
|
|
|
|
|
|||||
| (1) | As of September 30, 2014 and December 31, 2013, our commercial real estate portfolio was comprised of $681.0 million and $798.8 million of assets collateralizing RAIT I and RAIT II, $1.4 billion and $1.0 billion, respectively, of investments in real estate and $366.4 million and $158.0 million, respectively, of commercial mortgages, mezzanine loans and preferred equity interests that were not securitized. As of September 30, 2014 and December 31, 2013, our commercial real estate portfolio was also comprised of $93.4 million and $131.8 million, respectively, of assets collateralizing RAIT 2013-FL1. As of September 30, 2014, our commercial real estate portfolio was also comprised of $196.1 million of assets collateralizing RAIT 2014-FL2. |
| (2) | Our U.S. TruPS portfolio is comprised of assets collateralizing Taberna I, Taberna VIII, and Taberna IX, and includes TruPS and subordinated debentures, unsecured REIT note receivables, CMBS receivables, other securities, commercial mortgages and mezzanine loans. We are undertaking to exit our Taberna business by December 31, 2014, including TCM’s management of our two consolidated Taberna securitizations, Taberna VIII and Taberna IX, and also TCM’s management of Taberna I which we do not consolidate. See “Securitization Summary” for further information about the potential impact of any such exit. |
| (3) | In the fourth quarter of 2013, we exercised our rights under a preferred equity investment we had made in Urban Retail Properties, LLC, or Urban, a retail focused property manager, to assume control of Urban. We completed our acquisition of the equity of Urban in March 2014. Urban manages 62 properties representing 18,614,490 square feet in 26 states as of September 30, 2014. |
Non-GAAP Financial Measures
Cash Available for Distribution
Cash available for distribution, or CAD, is a non-GAAP financial measure. We believe that CAD provides investors and management with a meaningful indicator of operating performance. Management also uses CAD, among other measures, to evaluate profitability and our board of trustees considers CAD in determining our quarterly cash distributions. We also believe that CAD is useful because it adjusts for a variety of noncash items (such as depreciation and amortization, equity-based compensation, realized gain (loss) on assets, provision for loan losses and non-cash interest income and expense items). Furthermore, CAD removes the effect from our consolidation of the legacy Taberna securitizations.
We calculate CAD by subtracting from or adding to net income (loss) attributable to common shareholders the following items: depreciation and amortization items including, depreciation and amortization, straight-line rental income or expense, amortization of in place leases, amortization of deferred financing costs, amortization of discount on financings and equity-based compensation; changes in the fair value of our financial instruments, including such changes reflected in our consolidated Taberna securitizations; net interest income from consolidated Taberna securitizations; realized gain (loss) on assets and other; provision for loan losses; impairment on depreciable property; acquisition gains or losses and transaction costs; certain fee income eliminated in consolidation that is attributable to third parties; and one-time events pursuant to changes in U.S. GAAP and certain other non-recurring items.
CAD should not be considered as an alternative to net income (loss), determined in accordance with U.S. GAAP, as an indicator of operating performance. In addition, our methodology for calculating CAD may differ from the methodologies used by other comparable companies, including other REITs, when calculating the same or similar supplemental financial measures and may not be comparable with these companies.
48
Table of Contents
Set forth below is a reconciliation of CAD to net income (loss) allocable to common shares for the three-month periods ended September 30, 2014 and 2013 (dollars in thousands, except share information):
| For the Three-Month Period Ended September 30, 2014 |
For the Three-Month Period Ended September 30, 2013 |
|||||||||||||||
| Amount | Per Share (1) | Amount | Per Share (2) | |||||||||||||
| Cash Available for Distribution: |
||||||||||||||||
| Net income (loss) allocable to common shares |
$ | (23,266 | ) | $ | (0.28 | ) | $ | (17,106 | ) | $ | (0.24 | ) | ||||
| Adjustments: |
||||||||||||||||
| Depreciation and amortization expense |
13,236 | 0.16 | 8,784 | 0.13 | ||||||||||||
| Change in fair value of financial instruments |
10,223 | 0.13 | 24,659 | 0.35 | ||||||||||||
| (Gains) losses on assets |
(25 | ) | 0.00 | 191 | 0.00 | |||||||||||
| (Gains) losses on extinguishment of debt |
0 | 0.00 | 0 | 0.00 | ||||||||||||
| Taberna VIII and Taberna IX securitizations, net effect |
(6,975 | ) | (0.09 | ) | (8,176 | ) | (0.12 | ) | ||||||||
| Straight-line rental adjustments |
(238 | ) | 0.00 | (428 | ) | (0.01 | ) | |||||||||
| Share-based compensation |
1,148 | 0.01 | 1,096 | 0.02 | ||||||||||||
| Origination fees and other deferred items |
5,718 | 0.07 | 6,807 | 0.10 | ||||||||||||
| Provision for losses |
1,500 | 0.02 | 500 | 0.01 | ||||||||||||
| Noncontrolling interest effect of certain adjustments |
(1,716 | ) | (0.02 | ) | (405 | ) | (0.01 | ) | ||||||||
|
|
|
|
|
|
|
|
|
|||||||||
| Cash Available for Distribution (3) |
$ | (395 | ) | $ | 0.00 | $ | 15,922 | $ | 0.23 | |||||||
|
|
|
|
|
|
|
|
|
|||||||||
| (1) | Based on 81,967,806 weighted-average shares outstanding-diluted for the three-month period ended September 30, 2014. |
| (2) | Based on 70,192,918 weighted-average shares outstanding-diluted for the three-month period ended September 30, 2013. |
| (3) | Includes $21.5 million, or $0.26 per share, of the previously announced non-recurring settlement charge relating to the settlement agreement (see Part II. Other Information—Item 1. Legal Proceedings). |
Set forth below is a reconciliation of CAD to net income (loss) allocable to common shares for the nine-month periods ended September 30, 2014 and 2013 (dollars in thousands, except share information):
| For the Nine-Month Period Ended September 30, 2014 |
For the Nine-Month Period Ended September 30, 2013 |
|||||||||||||||
| Amount | Per Share (1) | Amount | Per Share (2) | |||||||||||||
| Cash Available for Distribution: |
||||||||||||||||
| Net income (loss) allocable to common shares |
$ | (63,503 | ) | $ | (0.78 | ) | $ | (173,515 | ) | $ | (2.60 | ) | ||||
| Adjustments: |
||||||||||||||||
| Depreciation and amortization expense |
38,719 | 0.47 | 25,972 | 0.39 | ||||||||||||
| Change in fair value of financial instruments |
59,433 | 0.73 | 200,436 | 3.00 | ||||||||||||
| (Gains) losses on assets |
5,350 | 0.07 | (30 | ) | 0.00 | |||||||||||
| (Gains) losses on extinguishment of debt |
(2,421 | ) | (0.03 | ) | 0 | 0.00 | ||||||||||
| Taberna VIII and Taberna IX securitizations, net effect |
(21,063 | ) | (0.26 | ) | (26,178 | ) | (0.39 | ) | ||||||||
| Straight-line rental adjustments |
(329 | ) | 0.00 | (1,394 | ) | (0.02 | ) | |||||||||
| Share-based compensation |
3,777 | 0.05 | 2,562 | 0.04 | ||||||||||||
| Origination fees and other deferred items |
15,450 | 0.19 | 9,785 | 0.15 | ||||||||||||
| Provision for losses |
3,500 | 0.04 | 1,500 | 0.02 | ||||||||||||
| Noncontrolling interest effect of certain adjustments |
(2,351 | ) | (0.03 | ) | (414 | ) | (0.01 | ) | ||||||||
|
|
|
|
|
|
|
|
|
|||||||||
| Cash Available for Distribution (3) |
$ | 36,562 | $ | 0.45 | $ | 38,724 | $ | 0.58 | ||||||||
|
|
|
|
|
|
|
|
|
|||||||||
| (1) | Based on 81,111,796 weighted-average shares outstanding-diluted for the nine-month period ended September 30, 2014. |
| (2) | Based on 66,807,299 weighted-average shares outstanding-diluted for the nine-month period ended September 30, 2013. |
| (3) | Includes $21.5 million, or $0.26 per share, of the previously announced non-recurring settlement charge relating to the settlement agreement (see Part II. Other Information—Item 1. Legal Proceedings). |
49
Table of Contents
Funds from Operations and Adjusted Funds from Operations
We believe that funds from operations, or FFO, and adjusted funds from operations, or AFFO, each of which is a non-GAAP measure, are additional appropriate measures of the operating performance of a REIT and us in particular. We compute FFO in accordance with the standards established by the National Association of Real Estate Investment Trusts, or NAREIT, as net income or loss allocated to common shares (computed in accordance with GAAP), excluding real estate-related depreciation and amortization expense, gains or losses on sales of real estate and the cumulative effect of changes in accounting principles.
AFFO is a computation made by analysts and investors to measure a real estate company’s cash flow generated by operations. We calculate AFFO by adding to or subtracting from FFO: change in fair value of financial instruments; gains or losses on debt extinguishment; capital expenditures, net of any direct financing associated with those capital expenditures; straight-line rental effects; amortization of various deferred items and intangible assets; and share-based compensation.
Our calculation of AFFO differs from the methodology used for calculating AFFO by certain other REITs and, accordingly, our AFFO may not be comparable to AFFO reported by other REITs. Our management utilizes FFO and AFFO as measures of our operating performance, and believes they are also useful to investors, because they facilitate an understanding of our operating performance after adjustment for certain non-cash items, such as changes in fair value of financial instruments, real estate depreciation, share-based compensation and various other items required by GAAP that may not necessarily be indicative of current operating performance and that may not accurately compare our operating performance between periods. Furthermore, although FFO, AFFO and other supplemental performance measures are defined in various ways throughout the REIT industry, we also believe that FFO and AFFO may provide us and our investors with an additional useful measure to compare our financial performance to certain other REITs.
Neither FFO nor AFFO is equivalent to net income or cash generated from operating activities determined in accordance with U.S. GAAP. Furthermore, FFO and AFFO do not represent amounts available for management’s discretionary use because of needed capital replacement or expansion, debt service obligations or other commitments or uncertainties. Neither FFO nor AFFO should be considered as an alternative to net income as an indicator of our operating performance or as an alternative to cash flow from operating activities as a measure of our liquidity.
Set forth below is a reconciliation of FFO and AFFO to net income (loss) allocable to common shares for the three-month periods ended September 30, 2014 and 2013 (dollars in thousands, except share information):
| For the Three-Month Period Ended September 30, 2014 |
For the Three-Month Period Ended September 30, 2013 |
|||||||||||||||
| Amount | Per Share (1) | Amount | Per Share (2) | |||||||||||||
| Funds From Operations: |
||||||||||||||||
| Net income (loss) allocable to common shares |
$ | (23,266 | ) | $ | (0.28 | ) | $ | (17,106 | ) | $ | (0.24 | ) | ||||
| Adjustments: |
||||||||||||||||
| Real estate depreciation and amortization |
9,116 | 0.11 | 8,517 | 0.12 | ||||||||||||
| (Gains) losses on the sale of real estate |
(2 | ) | 0.00 | 191 | 0.00 | |||||||||||
|
|
|
|
|
|
|
|
|
|||||||||
| Funds From Operations |
$ | (14,152 | ) | $ | (0.17 | ) | $ | (8,398 | ) | $ | (0.12 | ) | ||||
|
|
|
|
|
|
|
|
|
|||||||||
| Adjusted Funds From Operations: |
||||||||||||||||
| Funds From Operations |
$ | (14,152 | ) | $ | (0.17 | ) | $ | (8,398 | ) | $ | (0.12 | ) | ||||
| Adjustments: |
||||||||||||||||
| Change in fair value of financial instruments |
10,223 | 0.12 | 24,659 | 0.35 | ||||||||||||
| (Gains) losses on debt extinguishment |
0 | 0.00 | 0 | 0.00 | ||||||||||||
| Capital expenditures, net of direct financing |
(1,754 | ) | (0.02 | ) | (889 | ) | (0.01 | ) | ||||||||
| Straight-line rental adjustments |
(238 | ) | 0.00 | (428 | ) | (0.01 | ) | |||||||||
| Amortization of deferred items and intangible assets |
7,394 | 0.09 | 6,912 | 0.10 | ||||||||||||
| Share-based compensation |
1,148 | 0.01 | 1,096 | 0.02 | ||||||||||||
|
|
|
|
|
|
|
|
|
|||||||||
| Adjusted Funds From Operations |
$ | 2,621 | $ | 0.03 | $ | 22,952 | $ | 0.33 | ||||||||
|
|
|
|
|
|
|
|
|
|||||||||
| (1) | Based on 81,967,806 weighted-average shares outstanding-diluted for the three-month period ended September 30, 2014. |
| (2) | Based on 70,192,918 weighted-average shares outstanding-diluted for the three-month period ended September 30, 2013. |
50
Table of Contents
Set forth below is a reconciliation of FFO and AFFO to net income (loss) allocable to common shares for the nine-month periods ended September 30, 2014 and 2013 (dollars in thousands, except share information):
| For the Nine-Month Period Ended September 30, 2014 |
For the Nine-Month Period Ended September 30, 2013 |
|||||||||||||||
| Amount | Per Share (1) | Amount | Per Share (2) | |||||||||||||
| Funds From Operations: |
||||||||||||||||
| Net income (loss) allocable to common shares |
$ | (63,503 | ) | $ | (0.78 | ) | $ | (173,515 | ) | $ | (2.60 | ) | ||||
| Adjustments: |
||||||||||||||||
| Real estate depreciation and amortization |
27,250 | 0.34 | 24,540 | 0.37 | ||||||||||||
| (Gains) losses on the sale of real estate |
319 | 0.00 | 1,517 | 0.02 | ||||||||||||
|
|
|
|
|
|
|
|
|
|||||||||
| Funds From Operations |
$ | (35,934 | ) | $ | (0.44 | ) | $ | (147,458 | ) | $ | (2.21 | ) | ||||
|
|
|
|
|
|
|
|
|
|||||||||
| Adjusted Funds From Operations: |
||||||||||||||||
| Funds From Operations |
$ | (35,934 | ) | $ | (0.44 | ) | $ | (147,458 | ) | $ | (2.21 | ) | ||||
| Adjustments: |
||||||||||||||||
| Change in fair value of financial instruments |
59,433 | 0.73 | 200,436 | 3.00 | ||||||||||||
| (Gains) losses on debt extinguishment |
(2,421 | ) | (0.03 | ) | 0 | 0.00 | ||||||||||
| Capital expenditures, net of direct financing |
(3,696 | ) | (0.05 | ) | (1,858 | ) | (0.03 | ) | ||||||||
| Straight-line rental adjustments |
(329 | ) | 0.00 | (1,394 | ) | (0.02 | ) | |||||||||
| Amortization of deferred items and intangible assets |
21,225 | 0.26 | 11,312 | 0.17 | ||||||||||||
| Share-based compensation |
3,777 | 0.05 | 2,562 | 0.04 | ||||||||||||
|
|
|
|
|
|
|
|
|
|||||||||
| Adjusted Funds From Operations |
$ | 42,055 | $ | 0.52 | $ | 63,600 | $ | 0.95 | ||||||||
|
|
|
|
|
|
|
|
|
|||||||||
| (1) | Based on 81,111,796 weighted-average shares outstanding-diluted for the nine-month period ended September 30, 2014. |
| (2) | Based on 66,807,299 weighted-average shares outstanding-diluted for the nine-month period ended September 30, 2013. |
Adjusted Book Value
Management views adjusted book value as a useful and appropriate supplement to shareholders’ equity and book value. The measure serves as an additional performance measure of our value because it facilitates evaluation of us without the effects of various items that we are required to record in accordance with GAAP but which have limited economic impact on our business. Those adjustments primarily reflect the effect of consolidated securitizations where we do not currently receive cash flows on our retained interests, accumulated depreciation and amortization, the valuation of long-term derivative instruments and a valuation of our recurring collateral and property management fees. Adjusted book value is a non-GAAP financial measurement, and does not purport to be an alternative to reported shareholders’ equity, determined in accordance with GAAP, as a measure of book value. Adjusted book value should be reviewed in connection with shareholders’ equity as set forth in our consolidated balance sheets, to help analyze our value to investors. Adjusted book value may be defined in various ways throughout the REIT industry. Investors should consider these differences when comparing our adjusted book value to that of other REITs.
51
Table of Contents
Set forth below is a reconciliation of adjusted book value to shareholders’ equity as of September 30, 2014 (dollars in thousands, except share information):
| As of September 30, 2014 | ||||||||
| Amount | Per Share (1) | |||||||
| Total shareholders’ equity |
$ | 604,162 | $ | 7.32 | ||||
| Liquidation value of preferred shares characterized as equity(2) |
(200,103 | ) | (2.42 | ) | ||||
|
|
|
|
|
|||||
| Book value |
404,059 | 4.90 | ||||||
| Adjustments: |
||||||||
| Taberna VIII and Taberna IX securitizations, net effect |
(214,101 | ) | (2.59 | ) | ||||
| RAIT I and RAIT II derivative liabilities |
25,127 | 0.30 | ||||||
| Change in fair value for warrants and investor SARs |
6,766 | 0.08 | ||||||
| Accumulated depreciation and amortization |
198,901 | 2.41 | ||||||
| Valuation of recurring collateral, property management fees and other items |
88,827 | 1.08 | ||||||
|
|
|
|
|
|||||
| Total adjustments |
105,520 | 1.28 | ||||||
|
|
|
|
|
|||||
| Adjusted book value |
$ | 509,579 | $ | 6.18 | ||||
|
|
|
|
|
|||||
| (1) | Based on 82,509,635 common shares outstanding as of September 30, 2014. |
| (2) | Based on 4,075,569 Series A preferred shares, 2,288,465 Series B preferred shares, and 1,640,100 Series C preferred shares outstanding as of September 30, 2014, all of which have a liquidation preference of $25.00 per share. |
| (3) | Includes the estimated value of the (1) property management and collateral management fees to be received by RAIT as of September 30, 2014 from RAIT Residential and Urban Retail, and the Taberna I, Taberna VIII, Taberna IX, RAIT I and RAIT II securitizations and (2) advisory fees to be received by RAIT from IRT as of September 30, 2014 assuming the full deployment of IRT’s July 2014 common stock offering. The other item included is the incremental market value of RAIT’s ownership of 7.3 million shares of IRT common stock over RAIT’s book value for these shares at September 30, 2014. |
Results of Operations
Three-Month Period Ended September 30, 2014 Compared to the Three-Month Period Ended September 30, 2013
Revenue
Net interest margin. Net interest margin increased $1.2 million, or 4.9%, to $25.7 million for the three-month period ended September 30, 2014 from $24.5 million for the three-month period ended September 30, 2013. Investment interest income has increased, when compared to the three-month period ended September 30, 2013, as a result of an increase in our average investments in loans and securities. This increase was primarily caused by the origination of new loans since September 30, 2013. From October 1, 2013 through September 30, 2014, we originated $896.3 million of commercial real estate loans, had conduit loan sales of $344.9 million and loan repayments of $189.9 million, resulting in net loan growth of $361.4 million. In addition, investment interest expense decreased for the three-month period ended September 30, 2014 as compared to the three-month period ended September 30, 2013 primarily attributable to $0.9 million of reduced interest rate hedging costs from the expiration of interest rate swap agreements associated with our consolidated RAIT I and RAIT II securitizations since September 30, 2013, $0.4 million of reduced interest expense from repurchases and repayments of our CDO notes payable and $0.5 million from decreased activity in our warehouse facilities as compared to 2013. This was partially offset by $1.3 million of increased investment interest expense from the RAIT 2013-FL1 securitization issued in July 2013 and the RAIT 2014-FL2 securitization issued in April 2014.
Rental income. Rental income increased $12.6 million to $41.8 million for the three-month period ended September 30, 2014 from $29.2 million for the three-month period ended September 30, 2013. The increase is attributable to $11.0 million of rental income from 20 new properties acquired or consolidated since September 30, 2013, $0.8 million of rental income from two properties acquired during the three-month period ended September 30, 2013 present for a full quarter of operations in 2014 and $1.1 million of rental income from improved occupancy and rental rates in 2014 as compared to 2013 in the remaining properties. The increase was partially offset by a $0.3 million decrease of rental income related to one property that was disposed of after September 30, 2013.
Fee and other income. Fee and other income decreased $0.9 million to $7.8 million for the three-month period ended September 30, 2014 from $8.7 million for the three-month period ended September 30, 2013. The decrease is attributable to a decrease of $3.6 million in conduit fee income due to reduced CMBS profitability during the three-month period ended September 30, 2014 as compared to the same period in 2013 and a $0.5 million decrease in property reimbursement income as there was a reduction in our property management agreements during the three-month period ended September 30, 2014 as compared to the same period in 2013. This was partially offset by a $3.0 million increase in property management fees related to the retail property management firm acquired in the fourth quarter of 2013.
52
Table of Contents
Expenses
Interest expense. Interest expense increased $3.8 million, or 37.6%, to $13.9 million for the three-month period ended September 30, 2014 from $10.1 million for the three-month period ended September 30, 2013. The increase is primarily attributable to $2.2 million of interest expense from the increase in our loans payable on real estate, $1.1 million from the 7.625% senior notes issued in April 2014 and $0.7 million from the 7.125% senior notes issued in August 2014.
Real estate operating expense. Real estate operating expense increased $5.4 million to $20.9 million for the three-month period ended September 30, 2014 from $15.5 million for the three-month period ended September 30, 2013. The increase is attributable to $4.9 million of real estate operating expenses from 20 properties acquired or consolidated since September 30, 2013 and $0.5 million from two properties acquired during the three-month period ended September 30, 2013 present for a full quarter of operations in 2014.
Compensation expense. Compensation expense increased $0.6 million, or 9.1%, to $7.2 million for the three-month period ended September 30, 2014 from $6.6 million for the three-month period ended September 30, 2013. This increase was primarily attributable to salary and benefits for new employees hired since September 30, 2013.
General and administrative expense. General and administrative expense increased $1.8 million, or 60.0%, to $4.8 million for the three-month period ended September 30, 2014 from $3.0 million for the three-month period ended September 30, 2013. This increase was primarily attributable to $0.6 million of expenses related to the retail property management firm acquired in November 2013 and an increase of $1.0 million in professional service fees in the three-month period ended September 30, 2014 as compared to the same period in 2013.
Acquisition expense. Acquisition expense increased $0.6 million to $0.8 million for the three-month period ended September 30, 2014 from $0.2 million for the three-month period ended September 30, 2013. This increase was primarily attributable to five properties acquired in the three-month period ended September 30, 2014 as there were three properties acquired in the three-month period ended September 30, 2013.
Depreciation and amortization expense. Depreciation and amortization expense increased $4.4 million to $13.2 million for the three-month period ended September 30, 2014 from $8.8 million for the three-month period ended September 30, 2013. The increase is attributable to $3.3 million of depreciation and amortization expense from 20 new properties acquired or consolidated since September 30, 2013, $0.2 million from two properties acquired during the three-month period ended September 30, 2013 present for a full quarter of operations in 2014, $0.5 million from our other consolidated properties and an increase in corporate depreciation and amortization of $0.5 million. The increase was partially offset by $0.1 million of depreciation expense related to one property that was disposed of after September 30, 2013.
Other income (expense)
Other income (expense). During the three-month period ended September 30, 2014, other income (expense) included a $21.5 million settlement charge relating to the settlement agreement. See Part II. Other Information—Item 1. Legal Proceedings.
Change in fair value of financial instruments. During the three-month period ended September 30, 2014, the change in fair value of financial instruments reduced our net income by $10.2 million. The fair value adjustments we recorded were as follows (dollars in thousands):
| Description |
For the Three- Month Period Ended September 30, 2014 |
For the Three- Month Period Ended September 30, 2013 |
||||||
| Change in fair value of trading securities and security-related receivables |
$ | 2,386 | $ | (2,107 | ) | |||
| Change in fair value of CDO notes payable and trust preferred obligations |
(23,961 | ) | (17,524 | ) | ||||
| Change in fair value of derivatives |
(702 | ) | (8,076 | ) | ||||
| Change in fair value of warrants and investor SARs |
12,054 | 3,048 | ||||||
|
|
|
|
|
|||||
| Change in fair value of financial instruments |
$ | (10,223 | ) | $ | (24,659 | ) | ||
|
|
|
|
|
|||||
Changes in the fair value of our financial instruments occur when market conditions change, including interest rates and/or the credit profile of the underlying issuers change. In addition, a change in fair value of a financial instrument will occur when principal repayments occur where the carrying amount of the financial instrument, prior to the principal repayment, did not equal the principal
53
Table of Contents
amount repaid. We have had and expect to continue to have changes in the fair value of our financial instruments as market conditions change and as principal repayments occur in either the securities or liabilities that are subject to fair value accounting under FASB ASC Topic 825, “Financial Instruments.”
Income tax benefit (provision). Income tax benefit (provision) increased as we expect the taxable REIT subsidiary that conducts our conduit loan operations to have taxable income for the foreseeable future and we removed the valuation allowance against a portion of its net operating loss carryforwards.
Nine-Month Period Ended September 30, 2014 Compared to the Nine-Month Period Ended September 30, 2013
Revenue
Net interest margin. Net interest margin increased $8.3 million, or 11.5%, to $80.6 million for the nine-month period ended September 30, 2014 from $72.3 million for the nine-month period ended September 30, 2013. Investment interest income has increased, when compared to the nine-month period ended September 30, 2013, as a result of an increase in our average investments in loans and securities. This increase was primarily caused by the origination of new loans since September 30, 2013. From October 1, 2013 through September 30, 2014, we originated $896.3 million of commercial real estate loans, had conduit loan sales of $344.9 million and loan repayments of $189.9 million, resulting in net loan growth of $361.4 million. In addition, investment interest expense decreased for the nine-month period ended September 30, 2014 as compared to the nine-month period ended September 30, 2013 primarily attributable to $2.7 million of reduced interest rate hedging costs from the expiration of interest rate swap agreements associated with our consolidated RAIT I and RAIT II securitizations since September 30, 2013 and $1.4 million of reduced interest expense from repurchases and repayments of our CDO notes payable. This was partially offset by $3.6 million of increased investment interest expense from the RAIT 2013-FL1 securitization issued in July 2013, the RAIT 2014-FL2 securitization issued in April 2014 and from increased activity in our warehouse facilities as compared to 2013.
Rental income. Rental income increased $31.9 million to $116.2 million for the nine-month period ended September 30, 2014 from $84.3 million for the nine-month period ended September 30, 2013. The increase is attributable to $24.9 million of rental income from 20 new properties acquired or consolidated since September 30, 2013, $5.8 million from three properties acquired during the nine-month period ended September 30, 2013 present for a full three quarters of operations in 2014 and $2.5 million from improved occupancy and rental rates in 2014 as compared to 2013 in the remaining properties. The increase was partially offset by $0.6 million of rental income related to one property that was disposed of after September 30, 2013 and $0.7 million of rental income related to one property that was disposed of during the nine-month period ended September 30, 2013.
Fee and other income. Fee and other income decreased $3.6 million to $19.1 million for the nine-month period ended September 30, 2014 from $22.7 million for the nine-month period ended September 30, 2013. The decrease is attributable to $8.3 million of less conduit fee income generated during the nine-month period ended September 30, 2014 as compared to the same period in 2013, a decrease of $2.7 million in other income associated with legal settlements received during the nine-month period ended September 30, 2013 and a $1.2 million decrease in property reimbursement income as there was a reduction in our property management agreements during the nine-month period ended September 30, 2014 as compared to the same period in 2013. This was partially offset by an $8.7 million increase in property management fees related to the retail property management firm acquired in the fourth quarter of 2013.
Expenses
Interest expense. Interest expense increased $9.1 million, or 30.6%, to $38.8 million for the nine-month period ended September 30, 2014 from $29.7 million for the nine-month period ended September 30, 2013. The increase is primarily attributable to $5.2 million of interest expense from the increase in our loans payable on real estate, $2.1 million from the 7.625% senior notes issued in April 2014, $0.7 million from the 7.125% senior notes issued in August 2014 and $0.9 million from the interest expense related to the retail property management firm acquired in November 2013.
Real estate operating expense. Real estate operating expense increased $13.9 million to $58.7 million for the nine-month period ended September 30, 2014 from $44.8 million for the nine-month period ended September 30, 2013. Operating expenses increased $11.3 million primarily due to 20 properties acquired or consolidated since September 30, 2013 and $2.8 million from three properties acquired during the nine-month period ended September 30, 2013 present for a full three quarters of operations in 2014. In our existing portfolio, operating expenses increased $1.2 million primarily due to real estate tax increases and increased utilities and other severe winter weather related expenses that occurred during the nine-month period ended September 30, 2014. The increase was partially offset by $0.7 million of real estate operating expenses related to one property that was disposed of after September 30, 2013 and $0.7 million of real estate operating expenses related to one property that was disposed of during the nine-month period ended September 30, 2013.
54
Table of Contents
Compensation expense. Compensation expense increased $3.3 million, or 16.7%, to $23.1 million for the nine-month period ended September 30, 2014 from $19.8 million for the nine-month period ended September 30, 2013. This increase was primarily attributable to a $1.2 million increase in stock-based compensation and a $3.3 million increase in salary and benefits for new employees hired since September 30, 2013. This increase was partially offset by a decrease in severance of $1.1 million during the nine-month period ended September 30, 2013.
General and administrative expense. General and administrative expense increased $2.8 million, or 26.9%, to $13.2 million for the nine-month period ended September 30, 2014 from $10.4 million for the nine-month period ended September 30, 2013. This increase was primarily attributable to $1.8 million of expense related to the retail property management firm acquired in November 2013 and an increase of $1.2 million in professional service fees in the nine-month period ended September 30, 2014 as compared to the same period in 2013.
Acquisition expense. Acquisition expense increased $1.2 million to $1.4 million for the nine-month period ended September 30, 2014 from $0.2 million for the nine-month period ended September 30, 2013. This increase was primarily attributable to 17 properties acquired in the nine-month period ended September 30, 2014 as compared to three properties acquired in the nine-month period ended September 30, 2013.
Depreciation and amortization expense. Depreciation and amortization expense increased $12.7 million to $38.7 million for the nine-month period ended September 30, 2014 from $26.0 million for the nine-month period ended September 30, 2013. The increase is attributable to $8.4 million of depreciation and amortization expense from 20 new properties acquired or consolidated since September 30, 2013, $1.6 million from three properties acquired during the nine-month period ended September 30, 2013 present for a full three quarters of operations in 2014, $1.7 million from our other consolidated properties and an increase in corporate depreciation and amortization of $1.4 million. The increase was partially offset by $0.2 million of depreciation expense related to one property that was disposed of after September 30, 2013 and $0.2 million of depreciation expense related to one property that was disposed of during the nine-month period ended September 30, 2013.
Other income (expense)
Other income (expense). During the nine-month period ended September 30, 2014, other income (expense) included a $21.5 million settlement charge relating to the settlement agreement. See Part II. Other Information – Item 1. Legal Proceedings.
Gains (losses) on assets. During the nine-month period ended September 30, 2014, gains (losses) on assets included a $7.7 million loss on sale of asset held by Taberna VIII and Taberna IX which resulted from the illiquid nature of the investment, a $3.0 million charge off for certain assets that were disposed of and a $0.3 million loss related to the disposition of a real estate property. This was partially offset by a $5.7 million gain on property acquisitions as the fair value of the properties acquired exceeded the purchase price.
Gains (losses) on extinguishment of debt. During the nine-month period ended September 30, 2014, gains (losses) on extinguishment of debt is due to the repurchase of $5.8 million principal amount of RAIT I debt notes from the market for $3.4 million of cash.
Change in fair value of financial instruments. During the nine-month period ended September 30, 2014, the change in fair value of financial instruments reduced our net income by $59.4 million. The fair value adjustments we recorded were as follows (dollars in thousands):
| Description |
For the Nine- Month Period Ended September 30, 2014 |
For the Nine- Month Period Ended September 30, 2013 |
||||||
| Change in fair value of trading securities and security-related receivables |
$ | 10,960 | $ | 16,059 | ||||
| Change in fair value of CDO notes payable and trust preferred obligations |
(73,294 | ) | (203,149 | ) | ||||
| Change in fair value of derivatives |
(12,413 | ) | (11,752 | ) | ||||
| Change in fair value of warrants and investor SARs |
15,314 | (1,594 | ) | |||||
|
|
|
|
|
|||||
| Change in fair value of financial instruments |
$ | (59,433 | ) | $ | (200,436 | ) | ||
|
|
|
|
|
|||||
55
Table of Contents
Changes in the fair value of our financial instruments occur when market conditions change, including interest rates and/or the credit profile of the underlying issuers change. In addition, a change in fair value of a financial instrument will occur when principal repayments occur where the carrying amount of the financial instrument, prior to the principal repayment, did not equal the principal amount repaid. We have had and expect to continue to have changes in the fair value of our financial instruments as market conditions change and as principal repayments occur in either the securities or liabilities that are subject to fair value accounting under FASB ASC Topic 825, “Financial Instruments.”
Income tax benefit (provision). Income tax benefit (provision) increased as we expect the taxable REIT subsidiary that conducts our conduit loan operations to have taxable income for the foreseeable future and we removed the valuation allowance against a portion of its net operating loss carryforwards.
Liquidity and Capital Resources
Liquidity is a measure of our ability to meet potential cash requirements, including ongoing commitments to repay borrowings, fund and maintain investments, pay dividends and other general business needs. We are seeking to expand our sales of our securities, sales of conduit loans to CMBS securitizations, short term financing and secured lines of credit while developing other financing resources that will permit us to originate or acquire new investments to generate attractive returns while preserving our capital, such as loan participations and joint venture financing arrangements.
We believe our available cash and restricted cash balances, other financing arrangements, and cash flows from operations will be sufficient to fund our liquidity requirements for the next 12 months.
Our primary cash requirements are as follows:
| • | to make investments and fund the associated costs; |
| • | to repay our indebtedness, including repurchasing, redeeming or retiring our debt before it becomes due; |
| • | to pay our expenses, including compensation to our employees; |
| • | to pay U.S. federal, state, and local taxes of our taxable REIT subsidiary, or TRSs; and |
| • | to distribute a minimum of 90% of our REIT taxable income and to make investments in a manner that enables us to maintain our qualification as a REIT. |
We intend to meet these liquidity requirements primarily through the following:
| • | the use of our cash and cash equivalent balances of $116.8 million as of September 30, 2014; |
| • | cash generated from operating activities, including net investment income from our investment portfolio, and fee income generated by our commercial real estate platform; |
| • | proceeds from the sales of assets; |
| • | proceeds from future borrowings, including our CMBS facilities and loan participations; and |
| • | proceeds from future offerings of our securities, including DRSPP and ATM. |
During the period October 1, 2014 through December 31, 2014, interest rate swap agreements relating to RAIT I and RAIT II with a notional amount of $22.4 million and a weighted average strike rate of 5.25% as of September 30, 2014, will terminate in accordance with their terms. We expect this will result in increased cash flow to us of $1.1 million during the remainder of 2014.
The timing and amounts of payments under the settlement agreement (see Part II. Other Information—Item 1. Legal Proceedings) are being negotiated and are uncertain at this time. Any payments we make pursuant to the settlement agreement will reduce our liquidity at the relevant time.
56
Table of Contents
Cash Flows
As of September 30, 2014 and 2013, we maintained cash and cash equivalents of approximately $116.8 million and $116.6 million, respectively. Our cash and cash equivalents were generated from the following activities (dollars in thousands):
| For the Nine-Month Periods Ended September 30 |
||||||||
| 2014 | 2013 | |||||||
| Cash flow from operating activities |
$ | 64,279 | $ | 44,671 | ||||
| Cash flow from investing activities |
(528,637 | ) | (94,108 | ) | ||||
| Cash flow from financing activities |
492,278 | 66,019 | ||||||
|
|
|
|
|
|||||
| Net change in cash and cash equivalents |
27,920 | 16,582 | ||||||
| Cash and cash equivalents at beginning of period |
88,847 | 100,041 | ||||||
|
|
|
|
|
|||||
| Cash and cash equivalents at end of period |
$ | 116,767 | $ | 116,623 | ||||
|
|
|
|
|
|||||
The cash outflow for investing activities for the nine-month period ended September 30, 2014 is substantially due to new investments in loans of $726.5 million which exceeded loan repayments and conduit loan sales of $381.2 million. We also had cash outflows of $237.2 million due to the acquisition of real estate properties and capital expenditures in our owned real estate assets. The cash outflow for investing activities for the nine-month period ended September 30, 2013 is substantially due to new investments in loans of $419.7 million which exceeded loan repayments and conduit loan sales of $332.8 million. These cash outflows were partially offset by payoffs we received for our investment in securities totaling $97.0 million for the nine-month period ended September 30, 2013.
Cash flow from operating activities for the nine-month period ended September 30, 2014, as compared to the same period in 2013, has increased due to reduced interest expense and the timing of payments for various accounts payable and accrued liabilities. This was partially offset by an increase in other assets, including prepaid expenses for insurance and real estate taxes, as the size of our portfolio of real estate properties has grown.
The cash inflow from our financing activities during the nine-month period ended September 30, 2014 is primarily due to the issuance of our preferred shares and common shares, proceeds from our repurchase agreements, the issuance of our 4.0% convertible senior notes, the issuance of senior notes related to the RAIT FL2 securitization, the issuance of our 7.625% senior notes, and the issuance of our 7.125% senior notes. These cash inflows were partially offset by the outflows from the repayments and repurchases of our CDO notes payable and the repayments of our repurchase agreements during the nine-month period ended September 30, 2014.
As a REIT, we evaluate our dividend coverage based on our cash flow from operating activities before changes in assets and liabilities. During the nine-month period ended September 30, 2014, we paid distributions to our preferred and common shareholders of $57.2 million and generated cash flows from operating activities, before changes in assets and liabilities, of $65.8 million. The cash flow from operating activities of $64.3 million during nine-month period ended September 30, 2014 exceeded these distributions paid to our shareholders by $7.1 million. The source of funds used to pay these distributions was cash flows from operations before changes in assets and liabilities, as mentioned above.
57
Table of Contents
Capitalization
We maintain various forms of short-term and long-term financing arrangements. Generally, these financing agreements are collateralized by assets within securitizations. The following table summarizes our total recourse and non-recourse indebtedness as of September 30, 2014: (dollars in thousands)
| Description |
Unpaid Principal Balance |
Carrying Amount |
Weighted- Average Interest Rate |
Contractual Maturity | ||||||||||
| Recourse indebtedness: |
||||||||||||||
| 7.0% convertible senior notes (1) |
$ | 34,066 | $ | 33,297 | 7.0 | % | Apr. 2031 | |||||||
| 4.0% convertible senior notes (2) |
141,750 | 133,752 | 4.0 | % | Oct. 2033 | |||||||||
| 7.625% senior notes |
60,000 | 60,000 | 7.6 | % | Apr. 2024 | |||||||||
| 7.125% senior notes |
71,905 | 71,905 | 7.1 | % | Aug. 2019 | |||||||||
| Secured credit facilities |
5,000 | 5,000 | 2.7 | % | Oct. 2016 | |||||||||
| Junior subordinated notes, at fair value (3) |
18,671 | 13,048 | 0.5 | % | Mar. 2035 | |||||||||
| Junior subordinated notes, at amortized cost |
25,100 | 25,100 | 2.7 | % | Apr. 2037 | |||||||||
| CMBS facilities |
159,171 | 159,171 | 2.4 | % | Nov. 2014 to Jul. 2016 | |||||||||
|
|
|
|
|
|
|
|||||||||
| Total recourse indebtedness (4) |
515,663 | 501,273 | 4.4 | % | ||||||||||
| Non-recourse indebtedness: |
||||||||||||||
| CDO notes payable, at amortized |
1,086,038 | 1,084,289 | 0.6 | % | 2045 to 2046 | |||||||||
| CDO notes payable, at fair value (3)(5)(7) |
846,941 | 431,142 | 1.0 | % | 2037 to 2038 | |||||||||
| CMBS securitizations (8) |
215,518 | 215,518 | 1.9 | % | Jan. 2029 to May 2031 | |||||||||
| Loans payable on real estate (9) |
379,259 | 381,095 | 4.7 | % | Sep. 2015 to Aug. 2024 | |||||||||
|
|
|
|
|
|
|
|||||||||
| Total non-recourse indebtedness |
2,527,756 | 2,112,044 | 1.4 | % | ||||||||||
|
|
|
|
|
|
|
|||||||||
| Total indebtedness |
$ | 3,043,419 | $ | 2,613,317 | 1.9 | % | ||||||||
|
|
|
|
|
|
|
|||||||||
| (1) | Our 7.0% convertible senior notes are redeemable at par, at the option of the holder, in April 2016, April 2021, and April 2026. |
| (2) | Our 4.0% convertible senior notes are redeemable at par, at the option of the holder, in October 2018, October 2023, and October 2028. |
| (3) | Relates to liabilities which we elected to record at fair value under FASB ASC Topic 825. |
| (4) | Excludes senior secured notes issued by us with an aggregate principal amount equal to $80.0 million with a weighted average coupon of 7.0%, which are eliminated in consolidation. |
| (5) | Excludes CDO notes payable purchased by us which are eliminated in consolidation. |
| (6) | Collateralized by $1.6 billion principal amount of commercial mortgages, mezzanine loans, other loans and preferred equity interests. These obligations were issued by separate legal entities and consequently the assets of the special purpose entities that collateralize these obligations are not available to our creditors. |
| (7) | Collateralized by $959.3 million principal amount of investments in securities and security-related receivables and loans, before fair value adjustments. The fair value of these investments as of September 30, 2014 was $731.9 million. These obligations were issued by separate legal entities and consequently the assets of the special purpose entities that collateralize these obligations are not available to our creditors. |
| (8) | Excludes the FL1 junior notes and the FL2 junior notes purchased by us which are eliminated in consolidation. Collateralized by $289.5 million principal amount of commercial mortgages loans and participation interests. These obligations were issued by separate legal entities and consequently the assets of the special purpose entities that collateralize these obligations are not available to our creditors. |
| (9) | Includes $247.0 million of unpaid principal balance with a carrying amount of $248.8 million of mortgage indebtedness that encumbers properties owned by IRT. The weighted-average interest rate is 3.7% and has a range of maturity dates from April 2016 to August 2024. |
58
Table of Contents
The following table summarizes our total recourse and non-recourse indebtedness as of December 31, 2013: (dollars in thousands)
| Description |
Unpaid Principal Balance |
Carrying Amount |
Weighted- Average Interest Rate |
Contractual Maturity | ||||||||||
| Recourse indebtedness: |
||||||||||||||
| 7.0% convertible senior notes (1) |
$ | 34,066 | $ | 32,938 | 7.0 | % | Apr. 2031 | |||||||
| 4.0% convertible senior notes (2) |
125,000 | 116,184 | 4.0 | % | Oct. 2033 | |||||||||
| Secured credit facilities |
11,129 | 11,129 | 3.2 | % | Oct. 2016 to Dec. 2016 | |||||||||
| Junior subordinated notes, at fair value (3) |
18,671 | 11,911 | 0.5 | % | Mar. 2035 | |||||||||
| Junior subordinated notes, at amortized cost |
25,100 | 25,100 | 2.7 | % | Apr. 2037 | |||||||||
| CMBS facilities |
37,749 | 37,749 | 2.7 | % | Nov. 2014 to Oct. 2015 | |||||||||
|
|
|
|
|
|
|
|||||||||
| Total recourse indebtedness (4) |
251,715 | 235,011 | 3.8 | % | ||||||||||
| Non-recourse indebtedness: |
||||||||||||||
| CDO notes payable, at amortized |
1,204,117 | 1,202,772 | 0.6 | % | 2045 to 2046 | |||||||||
| CDO notes payable, at fair value (3)(5)(7) |
865,199 | 377,235 | 0.9 | % | 2037 to 2038 | |||||||||
| CMBS securitization (8) |
100,139 | 100,139 | 2.1 | % | Jan. 2029 | |||||||||
| Loans payable on real estate (9) |
171,244 | 171,244 | 5.3 | % | Sep. 2015 to Dec. 2023 | |||||||||
|
|
|
|
|
|
|
|||||||||
| Total non-recourse indebtedness |
2,340,699 | 1,851,390 | 1.1 | % | ||||||||||
|
|
|
|
|
|
|
|||||||||
| Total indebtedness |
$ | 2,592,414 | $ | 2,086,401 | 1.4 | % | ||||||||
|
|
|
|
|
|
|
|||||||||
| (1) | Our 7.0% convertible senior notes are redeemable at par, at the option of the holder, in April 2016, April 2021, and April 2026. |
| (2) | Our 4.0% convertible senior notes are redeemable at par, at the option of the holder, in October 2018, October 2023, and October 2028. |
| (3) | Relates to liabilities which we elected to record at fair value under FASB ASC Topic 825. |
| (4) | Excludes senior secured notes issued by us with an aggregate principal amount equal to $86.0 million with a weighted average coupon of 7.0%, which are eliminated in consolidation. |
| (5) | Excludes CDO notes payable purchased by us which are eliminated in consolidation. |
| (6) | Collateralized by $1.7 billion principal amount of commercial mortgages, mezzanine loans, other loans and preferred equity interests. These obligations were issued by separate legal entities and consequently the assets of the special purpose entities that collateralize these obligations are not available to our creditors. |
| (7) | Collateralized by $989.8 million principal amount of investments in securities and security-related receivables and loans, before fair value adjustments. The fair value of these investments as of December 31, 2013 was $746.9 million. These obligations were issued by separate legal entities and consequently the assets of the special purpose entities that collateralize these obligations are not available to our creditors. |
| (8) | Excludes the FL1 junior notes purchased by us which are eliminated in consolidation. Collateralized by $131.8 million principal amount of commercial mortgages loans and participation interests. These obligations were issued by separate legal entities and consequently the assets of the special purpose entities that collateralize these obligations are not available to our creditors. |
| (9) | Includes $100.8 million of unpaid principal balance and carrying amount of mortgage indebtedness that encumbers properties owned by IRT. The weighted- average interest rate is 3.8% and has a range of maturity dates from January 2019 to November 2022. |
Recourse indebtedness refers to indebtedness that is recourse to our general assets, including the loans payable on real estate that are guaranteed by us. Non-recourse indebtedness consists of indebtedness of consolidated VIEs (i.e. securitization vehicles) and loans payable on real estate which is recourse only to specific assets pledged as collateral to the lenders. The creditors of each consolidated VIE have no recourse to our general credit.
59
Table of Contents
The current status or activity in our financing arrangements occurring as of or during the nine-month period ended September 30, 2014 is as follows:
Recourse Indebtedness
Recourse Indebtedness
7.0% convertible senior notes. The 7.0% Convertible Senior Notes due 2031, or the 7.0% convertible senior notes, are convertible at the option of the holder at a current conversion rate of 156.8716 common shares per $1,000 principal amount of 7.0% convertible senior notes (equivalent to a current conversion price of $6.37 per common share). Upon conversion of 7.0% convertible senior notes by a holder, the holder will receive cash, our common shares or a combination of cash and our common shares, at our election. We include the 7.0% convertible senior notes in diluted earnings per share using the if-converted method if the conversion value in excess of the par amount is considered in the money during the respective periods. Holders of 7.0% convertible senior notes may require us to repurchase all or a portion of the 7.0% convertible senior notes at a purchase price equal to the principal amount plus accrued and unpaid interest on April 1, 2016, April 1, 2021, and April 1, 2026, or upon the occurrence of certain defined fundamental changes.
4.0% convertible senior notes. The 4.0% Convertible Senior Notes due 2033, or the 4.0% convertible senior notes, are convertible at the option of the holder at a current conversion rate of 105.8429 common shares per $1,000 principal amount of 4.0% convertible senior notes (equivalent to a current conversion price of $9.45 per common share). Upon conversion of 4.0% convertible senior notes by a holder, the holder will receive cash, our common shares or a combination of cash and our common shares, at our election. We include the 4.0% convertible senior notes in diluted earnings per share using the if-converted method if the conversion value in excess of the par amount is considered in the money during the respective periods. Holders of 4.0% convertible senior notes may require us to repurchase all or a portion of the 4.0% convertible senior notes at a purchase price equal to the principal amount plus accrued and unpaid interest on October 1, 2018, October 1, 2023, and October 1, 2028, or upon the occurrence of certain defined fundamental changes.
In January 2014, the underwriters exercised the overallotment option with respect to an additional $16.8 million aggregate principal amount of the 4.0% convertible senior notes and we received total net proceeds of $16.3 million after deducting underwriting fees and adjusting for accrued interim interest. In the aggregate, we issued $141.8 million aggregate principal amount of the 4.0% convertible senior notes in the offering and raised total net proceeds of approximately $137.2 million after deducting underwriting fees and offering expenses.
According to FASB ASC Topic 470, “Debt”, we recorded a discount on our issued and outstanding 4.0% convertible senior notes of $1.2 million. This discount reflects the fair value of the embedded conversion option within the 4.0% convertible senior notes and was recorded as an increase to additional paid in capital. The fair value was calculated by discounting the cash flows required in the indenture relating to the 4.0% convertible senior notes agreement by a discount rate that represents management’s estimate of our senior, unsecured, non-convertible debt borrowing rate at the time when the 4.0% convertible senior notes were issued. The discount will be amortized to interest expense through October 1, 2018, the date at which holders of our 4.0% convertible senior notes could require repayment.
We entered into a second capped call transaction with an affiliate of the underwriter of the 4.0% convertible senior notes to reduce the potential dilution to holders of our common shares upon conversion of the 4.0% convertible senior notes. The second capped call transaction has a cap price of $11.91, which is subject to certain adjustments, and an initial strike price of $9.57, which is subject to certain adjustments and is equivalent to the conversion price of the 4.0% convertible senior notes. The strike price and the cap price of the second capped call transaction are identical to those in the first capped call transaction. The capped calls expire on various dates ranging from June 2018 to October 2018. The capped call transaction is a separate transaction and is not part of the terms of the 4.0% convertible senior notes and will not affect the holders’ rights under the 4.0% convertible senior notes. The capped call transaction meets the criteria for equity classification and was recorded as a reduction to additional paid in capital. The capped call transaction is excluded from the dilutive EPS calculation as their effect would be anti-dilutive.
60
Table of Contents
7.625% senior notes. On April 14, 2014, we issued and sold in a public offering $60.0 million aggregate principal amount of our 7.625% Senior Notes due 2024, or the 7.625% senior notes. After deducting the underwriting discount and the estimated offering costs, we received approximately $57.5 million of net proceeds. Interest on the 7.625% senior notes is paid quarterly with a maturity date of April 15, 2024. The 7.625% senior notes are subject to redemption at our option, in whole or in part, at any time on or after April 15, 2017, at a redemption price equal to 100% of the principal amount of the notes to be redeemed, plus accrued and unpaid interest to, but excluding, the redemption date and are subject to repurchase by us at the option of the holders following a defined fundamental change, at a repurchase price equal to 101% of the principal amount of the notes to be repurchased, plus accrued and unpaid interest to, but excluding, the fundamental change repurchase date. The senior notes are not convertible into equity securities of RAIT. They contain financial covenants that are consistent with our other debt agreements.
7.125% senior notes. In August 2014, we issued and sold in a public offering $71.9 million aggregate principal amount of our 7.125% Senior Notes due 2019, or the 7.125% senior notes. After deducting the underwriting discount and the estimated offering costs, we received approximately $69.2 million of net proceeds. Interest on the 7.125% senior notes is paid quarterly with a maturity date of August 30, 2019. The 7.125% senior notes are subject to redemption at our option, in whole or in part, at any time on or after August 30, 2017, at a redemption price equal to 100% of the principal amount of the notes to be redeemed, plus accrued and unpaid interest to, but excluding, the redemption date and are subject to repurchase by us at the option of the holders following a defined fundamental change, at a repurchase price equal to 101% of the principal amount of the notes to be repurchased, plus accrued and unpaid interest to, but excluding, the fundamental change repurchase date. The senior notes are not convertible into equity securities of RAIT. They contain financial covenants that are consistent with our other debt agreements.
Secured credit facilities. As of September 30, 2014, we have $5.0 million outstanding under the Independence Realty Operating Partnership, LP, or IROP, credit agreement. The IROP credit agreement has a 3-year term, bears interest at LIBOR plus 2.50% and contains customary financial covenants for this type of revolving credit agreement.
On September 9, 2014, we entered into an amendment under the IROP credit agreement that modified certain terms within the agreement, including, but not limited to, an increase to the lender’s maximum commitment under the credit agreement from $20.0 million to $30.0 million, a change in the LIBOR interest rate from 2.75% to 2.50% and amendments to certain financial covenants.
In January 2014, we repaid the outstanding $6.1 million under our other secured credit facility, including any accrued interest.
CMBS facilities. We maintain various CMBS facilities with investment banks with total borrowing capacity of $575.0 million. The CMBS facilities are repurchase agreements that provide for margin calls in the event the commercial mortgage loans financed by the facilities change in value. As of September 30, 2014, we had $159.2 million of outstanding borrowings under the CMBS facilities. As of September 30, 2014, $415.8 million in aggregate principal amount remained available under the CMBS facilities. As of September 30, 2014, we were in compliance with all financial covenants contained in all CMBS facilities.
On July 28, 2014, we entered into an amended and restated master repurchase agreement, or the Amended MRA, with the investment bank for one of our CMBS facilities. The Amended MRA added defined floating-rate whole loans and senior interests in whole loans as eligible purchased assets which we could sell to the investment bank and later repurchase. All eligible purchased assets must be acceptable to the investment bank in its sole discretion. The Amended MRA increased the aggregate principal amount available under the facility to $200.0 million from $100.0 million provided that the aggregate outstanding purchase price under the Amended MRA at any time for all floating rate loans cannot exceed $100.0 million. Fixed rate loans incur interest at LIBOR plus 250 basis points and floating rate loans incur interest at LIBOR plus 200 basis points. The Amended MRA contains standard margin call provisions and financial covenants. The expiration date of the Amended MRA is July 28, 2016.
On January 27, 2014, we entered into a two year $75.0 million commercial mortgage facility, or the $75.0 million commercial mortgage facility, pursuant to which we may sell, and later repurchase, commercial mortgage loans and other assets meeting defined eligibility criteria which are approved by the purchaser in its sole discretion. The aggregate principal amount of the $75.0 million commercial mortgage facility is $75.0 million and incurs interest at LIBOR plus 200 basis points. The $75.0 million commercial mortgage facility contains standard margin call provisions and financial covenants.
61
Table of Contents
Non-Recourse Indebtedness
CDO notes payable, at amortized cost. CDO notes payable at amortized cost represent notes issued by consolidated CDO entities which are used to finance the acquisition of unsecured REIT notes, CMBS securities, commercial mortgages, mezzanine loans, and other loans in our commercial real estate portfolio. Generally, CDO notes payable are comprised of various classes of notes payable, with each class bearing interest at variable or fixed rates. Two of our consolidated securitizations collateralized primarily by commercial real estate loans, RAIT I and RAIT II, are meeting all of their over collateralization, or OC, and interest coverage, or IC, trigger tests as of September 30, 2014.
During the nine-month period ended September 30, 2014, we repurchased, from the market, a total of $5.8 million in aggregate principal amount of CDO notes payable issued by RAIT I. The aggregate purchase price was $3.4 million and we recorded a gain on extinguishment of debt of $2.4 million.
CDO notes payable, at fair value. Both of our consolidated securitizations collateralized primarily by TruPS, Taberna VIII and Taberna IX, are failing OC trigger tests which cause a change to the priority of payments to the debt and equity holders of the respective securitizations. Upon the failure of an OC test, the indenture of each CDO requires cash flows that would otherwise have been distributed to us as equity distributions, or in some cases interest payments on our retained CDO notes payable, be used to pay down sequentially the outstanding principal balance of the most senior note holders. The OC test failures are due to defaulted collateral assets and credit risk securities. During the nine-month period ended September 30, 2014, $18.3 million of cash flows, which is comprised of $4.1 million that was re-directed from our retained interests in these securitizations and $14.1 million that was from principal collections on the underlying collateral, were used to repay the most senior holders of our CDO notes payable.
CMBS securitizations. During the nine-month period ended September 30, 2014, $40.5 million that was from principal collections on the underlying collateral were used to repay the investment grade senior notes issued by RAIT FL1.
On April 29, 2014, we closed a CMBS securitization transaction, or RAIT FL2, structured to be collateralized by $196.1 million of floating rate commercial mortgage loans and participation interests, or the FL2 collateral, that we originated. The CMBS securitization transaction is intended to finance the FL2 collateral on a non-recourse basis. In connection with the CMBS securitization transaction, our subsidiaries made certain customary representations, warranties and covenants. RAIT FL2 does not have OC triggers or IC triggers.
On the closing date, our subsidiary, RAIT 2014-FL2 Trust, or the FL2 issuer, issued classes of investment grade senior notes, or the FL2 senior notes, with an aggregate principal balance of approximately $155.9 million to investors, representing an advance rate of approximately 79.5%. A RAIT subsidiary received the unrated classes of junior notes, or the FL2 junior notes, including a class with an aggregate principal balance of $40.2 million, and the equity, or the retained interests, of the FL2 issuer. The FL2 senior notes bear interest at a weighted average rate equal to LIBOR plus 1.79%. The stated maturity of the FL2 notes is May 2031, unless redeemed or repaid prior thereto. Subject to certain conditions, beginning in April 2016 or upon defined tax events, the FL2 issuer may redeem the FL2 senior notes, in whole but not in part, at the direction of holders of FL2 junior notes that we hold.
Loans payable on real estate. As of September 30, 2014 and December 31, 2013, we had $381.1 million and $171.2 million, respectively, of other indebtedness outstanding relating to loans payable on consolidated real estate. These loans are secured by specific consolidated real estate and commercial loans included in our consolidated balance sheets.
During the nine-month period ended September 30, 2014, we obtained or assumed 11 first mortgages on our investments in real estate from third party lenders that have a total aggregate principal balance of $210.5 million, maturity dates ranging from April 2016 to August 2024, and interest rates ranging from 3.4% to 5.6%.
Subsequent to September 30, 2014, we obtained one first mortgage on our investments in real estate from a third party lender that has a total aggregate principal balance of $16.0 million, a maturity date of November 2021, and an interest rate of 3.7%.
62
Table of Contents
Series D Preferred Shares
On October 1, 2012, we entered into a Securities Purchase Agreement, or the purchase agreement, with ARS VI Investor I, LLC, or the investor, an affiliate of Almanac Realty Investors, LLC, or Almanac. Under the purchase agreement, we are required to issue and sell to the investor on a private placement basis from time to time in a period up to two years, and the investor will be obligated to purchase from us, for an aggregate purchase price of $100.0 million, or the total commitment, the following securities, in the aggregate: (i) 4,000,000 Series D Cumulative Redeemable Preferred Shares of Beneficial Interest, par value $0.01 per share, of RAIT, or the Series D Preferred Shares, (ii) common share purchase warrants, or the warrants, exercisable for 9,931,000 of our common shares, or the common shares, and (iii) common share appreciation rights, or the investor SARs, with respect to up to 6,735,667 common shares. These securities will be issued on a pro rata basis based on the percentage of the total commitment drawn down at the relevant closing under the purchase agreement.
The warrants and investor SARs had an initial strike price of $6.00 per common share, subject to adjustment. As of the filing of this report, the strike price has adjusted to $5.69.
The warrants and investor SARs were both determined to be classified as liabilities and had a combined fair value of $29.7 million as of September 30, 2014. The initial fair value of the warrants and investor SARs are recorded as a liability and re-measured at each reporting period until the warrants and investor SARs are settled. Changes in fair value will be recorded in earnings as a component of the change in fair value of financial instruments in the consolidated statement of operations.
During the period from the effective date of the purchase agreement through September 30, 2014, we sold the following securities to the investor for an aggregate purchase price of $100.0 million: (i) 4,000,000 Series D Preferred Shares, (ii) warrants exercisable for 9,931,000 common shares (which have subsequently adjusted to 10,479,889 shares as of the date of filing this report); and (iii) investor SARs exercisable with respect to 6,735,667 common shares (which have subsequently adjusted to 7,107,948.84 shares as of the date of filing this report). The following table summarizes the sales activity of the Series D Preferred Shares from the effective date of the agreement through September 30, 2014: (dollars in thousands)
| Aggregate purchase price |
$ | 100,000 | ||||||
| Initial value of warrants and investor SARs issued to-date |
(22,874 | ) | ||||||
| Costs incurred |
(6,384 | ) | ||||||
|
|
|
|||||||
| Total discount |
(29,258 | ) | ||||||
| Discount amortization to-date |
5,434 | |||||||
|
|
|
|||||||
| Carrying amount of Series D Preferred Shares |
$ | 76,176 | ||||||
|
|
|
Preferred Shares
Dividends:
On January 29, 2014, our board of trustees declared a first quarter 2014 cash dividend of $0.484375 per share on our 7.75% Series A Preferred Shares, $0.5234375 per share on our 8.375% Series B Preferred Shares, $0.5546875 per share on our 8.875% Series C Preferred Shares and $0.4687500 per share on our Series D Preferred Shares. The dividends were paid on March 31, 2014 to holders of record on March 3, 2014 and totaled $5.3 million.
On May 13, 2014, our board of trustees declared a second quarter 2014 cash dividend of $0.484375 per share on our 7.75% Series A Preferred Shares, $0.5234375 per share on our 8.375% Series B Preferred Shares, $0.5546875 per share on our 8.875% Series C Preferred Shares and $0.4687500 per share on our Series D Preferred Shares. The dividends were paid on June 30, 2014 to holders of record on June 2, 2014 and totaled $6.0 million.
On July 29, 2014, our board of trustees declared a third quarter 2014 cash dividend of $0.484375 per share on our 7.75% Series A Preferred Shares, $0.5234375 per share on our 8.375% Series B Preferred Shares, $0.5546875 per share on our 8.875% Series C Preferred Shares and $0.4687500 per share on our Series D Preferred Shares. The dividends were paid on September 30, 2014 to holders of record on September 2, 2014 and totaled $6.0 million.
On October 28, 2014, our board of trustees declared a fourth quarter 2014 cash dividend of $0.484375 per share on our 7.75% Series A Preferred Shares, $0.5234375 per share on our 8.375% Series B Preferred Shares, $0.5546875 per share on our 8.875% Series C Preferred Shares and $0.4687500 per share on our Series D Preferred Shares. The dividends will be paid on December 31, 2014 to holders of record on December 1, 2014.
63
Table of Contents
At Market Issuance Sales Agreement (ATM):
On June 13, 2014, we entered into an At Market Issuance Sales Agreement, or the Preferred ATM agreement, with MLV & Co. LLC, or MLV, providing that, from time to time during the term of the Preferred ATM agreement, on the terms and subject to the conditions set forth therein, we may issue and sell through MLV, up to $150.0 million aggregate amount of preferred shares. With respect to each series of preferred shares, the maximum amount issuable is as follows: 4,000,000 Series A Preferred Shares, 1,000,000 Series B Preferred Shares, and 1,000,000 Series C Preferred Shares. Unless the Preferred ATM agreement is earlier terminated by MLV or us, the Preferred ATM agreement automatically terminates upon the issuance and sale of all of the Series A Preferred Shares, Series B Preferred Shares, and Series C Preferred Shares subject to the Preferred ATM agreement. From the effective date of the Preferred ATM Agreement through September 30, 2014, we issued a total of 6,281 Series A Preferred Shares pursuant to this agreement at a weighted-average price of $24.57 and we received $0.1 million of proceeds. From the effective date of the Preferred ATM Agreement through September 30, 2014, we did not issue any Series B Preferred Shares or Series C Preferred Shares. As of September 30, 2014, 3,993,719, 1,000,000, and 1,000,000 Series A Preferred Shares, Series B Preferred Shares, and Series C Preferred Shares, respectively, remain available for issuance under the Preferred ATM agreement.
On June 13, 2014, we amended our declaration of trust to reclassify and designate an additional 3,309,288 of our unclassified preferred shares of beneficial interest, par value $0.01 per share, as 3,309,288 Series A Preferred Shares. This reclassification increased the number of shares classified as Series A Preferred Shares from 4,760,000 shares to 8,069,288 shares. This reclassification decreased the number of unclassified preferred shares from 4,340,000 shares to 1,030,712 shares. We engaged in this reclassification in order to authorize additional Series A Preferred Shares issuable under the Preferred ATM Agreement.
Common Shares
Dividends:
On March 18, 2014, the board of trustees declared a $0.17 dividend on our common shares to holders of record as of April 4, 2014. The dividend was paid on April 30, 2014 and totaled $13.9 million.
On June 12, 2014, the board of trustees declared a $0.18 dividend on our common shares to holders of record as of July 11, 2014. The dividend was paid on July 31, 2014 and totaled $14.7 million.
On September 15, 2014, the board of trustees declared a $0.18 dividend on our common shares to holders of record as of October 7, 2014. The dividend was paid on October 31, 2014 and totaled $14.7 million.
Equity Compensation:
During the nine-month period ended September 30, 2014, 20,530 phantom unit awards were redeemed for common shares, a portion of which was withheld in order to satisfy the applicable withholding taxes. These phantom units were fully vested at the time of redemption.
On January 29, 2014, the compensation committee awarded 42,217 common share awards, valued at $0.4 million using our closing stock price of $8.29, to the board’s non-management trustees. These awards vested immediately. On January 29, 2014, the compensation committee awarded 293,700 restricted common share awards, valued at $2.4 million using our closing stock price of $8.29, to our executive officers and non-executive officer employees. These awards generally vest over three-year periods.
On January 29, 2014, the compensation committee awarded 891,600 stock appreciation rights, or SARs, valued at $1.2 million based on a Black-Scholes option pricing model at the date of grant, to our executive officers and non-executive officer employees. The SARs vest over a three-year period and may be exercised between the date of vesting and January 29, 2019, the expiration date of the SARs.
Dividend Reinvestment and Share Purchase Plan (DRSPP):
We have a dividend reinvestment and share purchase plan, or DRSPP, under which we registered and reserved for issuance, in the aggregate, 10,500,000 common shares. During the nine-month period ended September 30, 2014, we issued a total of 5,603 common shares pursuant to the DRSPP at a weighted-average price of $8.09 per share and we received $0.1 million of net proceeds. As of September 30, 2014, 7,772,217 common shares, in the aggregate, remain available for issuance under the DRSPP.
64
Table of Contents
Capital on Demand™ Sales Agreement (COD):
On November 21, 2012, we entered into a Capital on Demand™ Sales Agreement, or the COD sales agreement, with JonesTrading Institutional Services LLC, or JonesTrading, pursuant to which we may issue and sell up to 10,000,000 of our common shares from time to time through JonesTrading acting as agent and/or principal, subject to the terms and conditions of the COD sales agreement. Unless the COD sales agreement is earlier terminated by JonesTrading or us, the COD sales agreement automatically terminates upon the issuance and sale of all of the common shares subject to the COD sales agreement. During the nine-month period ended September 30, 2014, we issued a total of 641,139 common shares pursuant to this agreement at a weighted-average price of $8.26 per share and we received $5.2 million of net proceeds. As of September 30, 2014, 7,918,919 common shares, in the aggregate, remain available for issuance under the COD sales agreement.
Common Share Public Offering:
In January 2014, we issued 10,000,000 common shares in an underwritten public offering. The public offering price was $8.52 per share and we received $82.6 million of proceeds.
Off-Balance Sheet Arrangements and Commitments
There have been no material changes in off-balance sheet arrangements or commitments during the nine-month period ended September 30, 2014 from the disclosures included in our Annual Report on Form 10-K for the year ended December 31, 2013. Reference is made to Item 7 included in our Annual Report on Form 10-K for the year ended December 31, 2013.
Critical Accounting Estimates and Policies
Our Annual Report on Form 10-K for the year ended December 31, 2013 contains a discussion of our critical accounting policies. On January 1, 2013 we adopted a new accounting pronouncement and revised our accounting policies as described below. See Note 2 in our unaudited consolidated financial statements as set forth herein. Management discusses our critical accounting policies and management’s judgments and estimates with the audit committee of our board of trustees.
Recent Accounting Pronouncements
In April 2014, the FASB issued an accounting standard classified under FASB ASC Topic 205, “Presentation of Financial Statements”. This accounting standard amends existing guidance to change reporting requirements for discontinued operations by requiring the disposal of an entity to be reported in discontinued operations if the disposal represents a strategic shift that has or will have a major effect on an entity’s operations and financial results. This standard is effective for interim and annual reporting periods beginning on or after December 15, 2014. Management is currently evaluating the impact that this standard may have on our consolidated financial statements.
In May 2014, the FASB issued an accounting standard classified under FASB ASC Topic 606, “Revenue from Contracts with Customers”. This accounting standard generally replaces existing guidance by requiring an entity to recognize the amount of revenue to which it expects to be entitled for the transfer of promised goods or services to customers. This standard is effective for annual reporting periods beginning after December 15, 2016. Management is currently evaluating the impact that this standard may have on our consolidated financial statements.
| Item 3. | Quantitative and Qualitative Disclosures about Market Risk |
There have been no material changes in quantitative and qualitative market risks during the nine-month period ended September 30, 2014 from the disclosures included in our Annual Report on Form 10-K for the year ended December 31, 2013. Reference is made to Item 7A included in our Annual Report on Form 10-K for the year ended December 31, 2013.
65
Table of Contents
| Item 4. | Controls and Procedures |
Disclosure Controls and Procedures
We maintain disclosure controls and procedures that are designed to ensure that information required to be disclosed in our reports under the Securities Exchange Act of 1934, as amended, or the Exchange Act, is recorded, processed, summarized, and reported within the time periods specified in the SEC’s rules and forms, and that such information is accumulated and communicated to our management, including our chief executive officer and our chief financial officer, as appropriate, to allow timely decisions regarding required disclosure. In designing and evaluating the disclosure controls and procedures, our management recognized that any controls and procedures, no matter how well designed and operated, can provide only reasonable assurance of achieving the desired control objectives, and our management necessarily was required to apply its judgment in evaluating the cost-benefit relationship of possible controls and procedures.
Under the supervision of our chief executive officer and chief financial officer and with the participation of our disclosure committee, we have carried out an evaluation of the effectiveness of our disclosure controls and procedures as of the end of the period covered by this report. Based upon that evaluation, our chief executive officer and chief financial officer concluded that our disclosure controls and procedures are effective at the reasonable assurance level.
Changes in Internal Control Over Financial Reporting
There has been no change in our internal control over financial reporting that occurred during the three-month period ended September 30, 2014 that has materially affected, or is reasonably likely to materially affect, our internal control over financial reporting.
Part II. OTHER INFORMATION
| Item 1. | Legal Proceedings |
We are involved from time to time in litigation on various matters, including disputes with tenants of owned properties, disputes arising out of agreements to purchase or sell properties and disputes arising out of our loan portfolio. Given the nature of our business activities, these lawsuits are considered routine to the conduct of our business. The result of any particular lawsuit cannot be predicted, because of the very nature of litigation, the litigation process and its adversarial nature, and the jury system. We do not expect that the liabilities, if any, that may ultimately result from such routine legal actions will have a material adverse effect on our consolidated financial position, results of operations or cash flows.
On March 13, 2012, the staff of the SEC notified us that they had initiated a non-public investigation concerning our investment advisory subsidiary, Taberna Capital Management, LLC, or TCM. The investigation relates to TCM’s receipt of approximately $15 million of restructuring fees from issuers of securities collateralizing Taberna securitizations for which TCM served as collateral manager in connection with certain exchange transactions involving these securities and securitizations. TCM participated in these exchange transactions between March 2, 2009 and November 28, 2012 and has not subsequently participated in any exchange transactions in which it has collected a fee. The SEC staff has issued administrative subpoenas seeking testimony and information from us in connection with this matter, and we are cooperating fully in providing such information.
On September 16, 2014, an agreement in principle with SEC staff was reached to resolve this investigation which remains subject to final documentation and approval by the SEC. The settlement will be entered into by TCM without admitting or denying the allegations and will resolve all violations alleged by the SEC relating to this investigation against TCM under the Investment Advisers Act and the Exchange Act. Under the terms of the agreement in principle, among other things, TCM will pay $21.5 million and RAIT will guarantee this payment obligation. We cannot assure you that the settlement with the SEC will be finalized and/or approved or that any final settlement will not have different or additional material terms.
On October 8, 2014, two executive officers and one former employee of RAIT each received a written “Wells Notice” from the SEC staff. A Wells Notice is neither a formal allegation of wrongdoing nor a finding that any of the recipients violated any law. Rather, it provides a recipient an opportunity to respond to issues raised by the SEC staff and to present any reasons of law, policy or fact why the SEC staff should not recommend that the SEC initiate an enforcement action prior to the SEC staff making such a recommendation. The Wells Notices in this matter indicate the SEC staff has made a preliminary determination to recommend to the SEC that the SEC file an action against each of the named individuals relating to the individuals’ activities on behalf of TCM in connection with the matters that were the subject of the investigation described above. One of these executive officers is our Managing Director-Business Development, General Counsel and Secretary and the other of these executive officers is our Executive Vice President-Portfolio and Risk Management. The former employee left RAIT in 2010.
| Item 1A. | Risk Factors |
There have not been any material changes from the risk factors previously disclosed in Item 1A—“Risk Factors” in our Annual Report on Form 10-K for the fiscal year ended December 31, 2013.
| Item 6. | Exhibits |
| (a) | Exhibits |
The exhibits filed as part of this quarterly report on Form 10-Q are identified in the exhibit index immediately following the signature page of this Report. Such Exhibit Index is incorporated herein by reference.
66
Table of Contents
Pursuant to the requirements of the Securities Exchange Act of 1934, the registrant has duly caused this report to be signed on its behalf by the undersigned thereunto duly authorized.
| RAIT FINANCIAL TRUST (Registrant) | ||||||
| Date: November 7, 2014 | By: | /s/ Scott F. Schaeffer | ||||
| Scott F. Schaeffer, Chairman of the Board and Chief Executive Officer | ||||||
| (On behalf of the registrant and as its Principal Executive Officer) | ||||||
| Date: November 7, 2014 | By: | /s/ James J. Sebra | ||||
| James J. Sebra, Chief Financial Officer and Treasurer | ||||||
| (On behalf of the registrant and as its Principal Financial Officer and Principal Accounting Officer) | ||||||
67
Table of Contents
EXHIBIT INDEX
| Exhibit Number |
Description of Documents | |
| 3.1.1 | Amended and Restated Declaration of Trust of RAIT Financial Trust (“RAIT”). (1) | |
| 3.1.2 | Articles of Amendment to Amended and Restated Declaration of Trust of RAIT. (2) | |
| 3.1.3 | Articles of Amendment to Amended and Restated Declaration of Trust of RAIT. (3) | |
| 3.1.4 | Certificate of Correction to the Amended and Restated Declaration of RAIT. (4) | |
| 3.1.5 | Articles of Amendment to Amended and Restated Declaration of RAIT. (5) | |
| 3.1.6 | Articles of Amendment to Amended and Restated Declaration of RAIT. (6) | |
| 3.1.7 | Articles Supplementary (the “Series A Articles Supplementary”) relating to the 7.75% Series A Cumulative Redeemable Preferred Shares of Beneficial Interest (the “Series A Preferred Shares”) of RAIT. (7) | |
| 3.1.8 | Certificate of Correction to the Series A Articles Supplementary. (7) | |
| 3.1.9 | Articles Supplementary relating to the 8.375% Series B Cumulative Redeemable Preferred Shares of Beneficial Interest, (the “Series B Preferred Shares”) of RAIT. (8) | |
| 3.1.10 | Articles Supplementary relating to the 8.875% Series C Cumulative Redeemable Preferred Shares of Beneficial Interest, (the “Series C Preferred Shares”) of RAIT. (9) | |
| 3.1.11 | Articles Supplementary relating to Series A Preferred Shares, Series B Preferred Shares and Series C Preferred Shares. (10) | |
| 3.1.12 | Certificate of Correction relating to Series A Preferred Shares, Series B Preferred Shares and Series C Preferred Shares. (11) | |
| 3.1.13 | Articles Supplementary (the “Series D Articles Supplementary”) relating to the Series D Cumulative Redeemable Preferred Shares of Beneficial Interest (the “Series D Preferred Shares”) of RAIT. (12) | |
| 3.1.14 | Articles Supplementary relating to the Series E Cumulative Redeemable Preferred Shares of Beneficial Interest (the “Series E Preferred Shares”) of RAIT. (13) | |
| 3.1.15 | Amendment dated November 30, 2012 to the Series D Articles Supplementary. (13) | |
| 3.1.16 | Articles Supplementary, dated June 13, 2014. (14) | |
| 3.2 | By-laws of RAIT. (15). | |
| 4.1.1 | Form of Certificate for Common Shares of Beneficial Interest. (6) | |
| 4.1.2 | Form of Certificate for the Series A Preferred Shares. (16) | |
| 4.1.3 | Form of Certificate for the Series B Preferred Shares. (8) | |
| 4.1.4 | Form of Certificate for the Series C Preferred Shares. (9) | |
| 4.1.5 | Form of Certificate for Series D Preferred Shares. (17) | |
| 4.1.6 | Form of Certificate for Series E Preferred Shares. (17) | |
| 4.2.1 | Base Indenture dated as of December 10, 2013 between RAIT, as issuer, and Wells Fargo Bank, National Association., as trustee. (18) | |
| 4.2.2 | Supplemental Indenture dated as of December 10, 2013 between RAIT, as issuer, and Wells Fargo Bank, National Association., as trustee. (18) | |
| 4.2.3 | Form of RAIT 4.00% Convertible Senior Note due 2033 (included in Exhibit 4.2.2). | |
| 4.3.1 | Base Indenture dated as of March 21, 2011 between RAIT, as issuer, and Wells Fargo Bank, National Association., as trustee. (19) | |
| 4.3.2 | Supplemental Indenture dated as of March 21, 2011 between RAIT, as issuer, and Wells Fargo Bank, National Association., as trustee. (19) | |
68
Table of Contents
| Exhibit Number |
Description of Documents | |
| 4.4 | Indenture dated as of October 5, 2011 between RAIT and Wilmington Trust, National Association, as trustee. (20) | |
| 4.5.1 | Registration Rights Agreement dated as of October 1, 2012 by and among RAIT and ARS VI Investor I, LP (f/k/a ARS VI Investor I, LLC) (“ARS VI”). (12) | |
| 4.5.2 | Amendment No. 1 to Registration Rights Agreement dated as of April 25, 2014 by and among RAIT and ARS VI. (21) | |
| 4.5.3 | Common Share Purchase Warrant No. 1 dated October 17, 2012 issued by RAIT to ARS VI. (17) | |
| 4.5.4 | Common Share Appreciation Right No. 1 dated October 17, 2012 issued by RAIT to ARS VI. (17) | |
| 4.5.5 | Common Share Purchase Warrant No. 2 dated November 15, 2012 issued by RAIT to ARS VI. (22) | |
| 4.5.6 | Common Share Appreciation Right No. 2 dated November 15, 2012 issued by RAIT to ARS VI. (22) | |
| 4.5.7 | Common Share Purchase Warrant No. 3 dated December 18, 2012 issued by RAIT to ARS VI. (23) | |
| 4.5.8 | Common Share Appreciation Right No. 3 dated December 18, 2012 issued by RAIT to ARS VI. (23) | |
| 4.5.9 | Common Share Purchase Warrant No. 4 dated March 27, 2014 issued by RAIT to ARS VI. (24) | |
| 4.5.10 | Common Share Appreciation Right No. 4 dated March 27, 2014 issued by RAIT to ARS VI. (24). | |
| 4.6.1 | Base Indenture dated as of December 10, 2013 between RAIT, as issuer, and Wells Fargo Bank, National Association., as trustee. (25) | |
| 4.6.2 | Supplemental Indenture dated as of December 10, 2013 between RAIT, as issuer, and Wells Fargo Bank, National Association., as trustee. (25) | |
| 4.6.3 | Form of RAIT 4.00% Convertible Senior Note due 2033 (included in Exhibit 4.6.2). (25) | |
| 4.6.4 | Second Supplemental Indenture, dated as of April 14, 2014, between RAIT, as issuer, and Wells Fargo Bank, National Association, as trustee. (26) | |
| 4.6.5 | Form of 7.625% Senior Notes due 2024 (included as Exhibit A to Exhibit 4.6.4 hereto). | |
| 4.6.6 | Third Supplemental Indenture, dated as of August 14, 2014, between RAIT, as Issuer, and Wells Fargo Bank, National Association, as trustee. (27) | |
| 4.6.7 | Form of 7.125% Senior Notes due 2019 (included as Exhibit A to Exhibit 4.6.6 hereto). | |
| Certain Instruments defining the rights of holders of long-term debt securities of the Registrant and its subsidiaries are omitted pursuant to Item 601(b)(4)(iii) of Regulation S-K. The Registrant hereby undertakes to furnish to the SEC, upon request, copies of any such instruments. | ||
| 10.1 | Master Repurchase Agreement dated as of January 24, 2014 among RAIT CRE Conduit II, LLC, as seller, RAIT, as guarantor, and UBS Real Estate Securities Inc., as buyer. (28) | |
| 10.2 | Guaranty Agreement, dated as of January 24, 2014, of RAIT in favor of UBS Real Estate Securities Inc. (28) | |
| 10.3 | Employment Agreement dated as of January 29, 2014 between RAIT and Scott L.N. Davidson. (29) | |
| 10.4 | IAP Form of Share Award Grant Agreement for non-management trustees adopted January 29, 2014.9(30) | |
| 10.5.1 | Capped Call Confirmation dated February 28, 2014 between RAIT and Barclays Bank PLC (“Barclays”). Portions of this exhibit have been omitted pursuant to a grant of confidential treatment. The omitted portions have been filed with the Securities and Exchange Commission. (31) | |
| 10.5.2 | Amendment Agreement dated February 28, 2014 between RAIT and Barclays to the Capped Call Confirmation dated December 4, 2013 between RAIT and Barclays. (32) | |
| 10.6.1 | First Amendment to Master Repurchase Agreement and other transaction documents dated as of June 30, 2013 among RAIT CMBS Conduit I, LLC (“RAIT CMBS I”), Citibank N.A., (“Citibank”) and RAIT. (32) | |
| 10.6.2 | Third Amendment to Master Repurchase Agreement dated as of December 9, 2013 among RAIT CMBS I, Citibank and RAIT. (32) | |
| 10.6.3 | Amended and Restated Master Repurchase Agreement dated as of July 28, 2014 by and among RAIT CMBS Conduit I, LLC, RAIT CRE Conduit III, LLC, collectively as seller, and Citibank, N.A., as buyer. (33) | |
| 10.6.4 | Guaranty dated July 28, 2014 by RAIT, as guarantor, for the benefit of Citibank, N.A. (33) | |
| 10.7.1 | First Amendment to Master Repurchase Agreement dated as of December 27, 2011 between Barclays and RAIT CMBS Conduit II, LLC (“RAIT CMBS II”). (32) | |
69
Table of Contents
| Exhibit Number |
Description of Documents | |
| 10.7.2 | Second Amendment to Master Repurchase Agreement dated as of February 16, 2012 between Barclays and RAIT CMBS II. (32) | |
| 10.8 | Amendment No. 1 to Master Repurchase Agreement dated as of March 20, 2014 among Column Financial, Inc. (“Column”) and RAIT CRE Conduit I, LLC (“RAIT CRE I”) and RAIT. (32) | |
| 10.9.1 | Amendment No. 1 to Master Repurchase Agreement dated as of March 17, 2014 among UBS Real Estate Securities Inc. (“UBS”), RAIT CRE CONDUIT II, LLC (“RAIT CRE II”) and RAIT. (32) | |
| 10.9.2 | Amendment No. 2 to Master Repurchase Agreement dated as of March 27, 2014 among UBS, RAIT CRE II and RAIT. (32) | |
| 10.10 | Amendment 2014-1 dated May 8, 2014 and effective January 29, 2014 to the Third Amended and Restated Employment Agreement dated as of August 4, 2011 between RAIT and Scott F. Schaeffer. (32) | |
| 10.11 | Amendment 2014-1 dated May 13, 2014 to the Employment Agreement between RAIT and Raphael Licht. (34) | |
| 10.12 | At the Market Issuance Sales Agreement, dated June 13, 2014, by and between RAIT and MLV & Co. LLC. (14) | |
| 12.1 | Statements regarding computation of ratios as of September 30, 2014. * | |
| 31.1 | Rule 13a-14(a) Certification by the Chief Executive Officer of RAIT. * | |
| 31.2 | Rule 13a-14(a) Certification by the Chief Financial Officer of RAIT. * | |
| 32.1 | Section 1350 Certification by the Chief Executive Officer of RAIT. * | |
| 32.2 | Section 1350 Certification by the Chief Financial Officer of RAIT. * | |
| 101 | Pursuant to Rule 405 of Regulation S-T, the following financial information from RAIT’s Quarterly Report on Form 10-Q for the period ended September 30, 2014 is formatted in XBRL interactive data files: (i) Consolidated Statements of Operations for the three month and nine month periods ended September 30, 2014 and 2013; (ii) Consolidated Balance Sheets as of September 30, 2014 and December 31, 2013; (iii) Consolidated Statements of Comprehensive Income (Loss) for the three month and nine month periods ended September 30, 2014 and 2013; (iv) Consolidated Statement of Changes in Equity for the nine month period ended September 30, 2014; (v) Consolidated Statements of Cash Flows for the nine month periods ended September 30, 2014 and 2013; and (vi) Notes to Unaudited Consolidated Financial Statements. * | |
| * | Filed herewith |
| (1) | Incorporated by reference to RAIT’s Registration Statement on Form S-11 (Registration No. 333-35077). |
| (2) | Incorporated by reference to RAIT’s Registration Statement on Form S-11 (Registration No. 333-53067). |
| (3) | Incorporated by reference to RAIT’s Registration Statement on Form S-2 (Registration No. 333-55518). |
| (4) | Incorporated by reference to RAIT’s Form 10-Q for the Quarterly Period ended March 31, 2002 (File No. 1-14760). |
| (5) | Incorporated by reference to RAIT’s Form 8-K as filed with the SEC on December 15, 2006 (File No. 1-14760). |
| (6) | Incorporated by reference to RAIT’s Form 8-K as filed with the SEC on July, 1 2011 (File No. 1-14760). |
| (7) | Incorporated by reference to RAIT’s Form 8-K as filed with the SEC on March 18, 2004 (File No. 1-14760). |
| (8) | Incorporated by reference to RAIT’s Form 8-K as filed with the SEC on October 1, 2004 (File No. 1-14760). |
| (9) | Incorporated by reference to RAIT’s Form 8-A as filed with the SEC on June 29, 2007 (File No. 1-14760). |
| (10) | Incorporated by reference to RAIT’s Form 8-K as filed with the SEC on May 25, 2012 (File No. 1-14760). |
| (11) | Incorporated by reference to RAIT’s Form 10-Q for the Quarterly Period ended June 30, 2012 (File No. 1-14760). |
| (12) | Incorporated by reference to RAIT’s Form 8-K as filed with the SEC on October 4, 2012 (File No. 1-14760). |
| (13) | Incorporated by reference to RAIT’s Form 8-K as filed with the SEC on December 4, 2012 (File No. 1-14760). |
| (14) | Incorporated by reference to RAIT’s Form 8-K as filed with the SEC on June 13, 2014 (File No. 1-14760). |
| (15) | Incorporated by reference to RAIT’s Form 8-K as filed with the SEC on October 19, 2009 (File No. 1-14760). |
| (16) | Incorporated by reference to RAIT’s Form 8-K as filed with the SEC on March 22, 2004 (File No. 1-14760). |
| (17) | Incorporated by reference to RAIT’s Form 8-K as filed with the SEC on October 23, 2012 (File No. 1-14760). |
| (18) | Incorporated by reference to RAIT’s Form 8-K as filed with the SEC on December 13, 2013 (File No. 1-14760). |
| (19) | Incorporated by reference to RAIT’s Form 8-K as filed with the SEC on March 22, 2011 (File No. 1-14760). |
| (20) | Incorporated by reference to RAIT’s Form 8-K as filed with the SEC on March 22, 2011 (File No. 1-14760). |
| (21) | Incorporated by reference to RAIT’s Registration Statement on Form S-3 (Registration No. 333-195547). |
| (22) | Incorporated by reference to RAIT’s Form 8-K as filed with the SEC on November 21, 2012 (File No. 1-14760). |
| (23) | Incorporated by reference to RAIT’s Form 8-K as filed with the SEC on December 18, 2012 (File No. 1-14760). |
70
Table of Contents
| (24) | Incorporated by reference to RAIT’s Form 8-K as filed with the SEC on March 27, 2014 (File No. 1-14760). |
| (25) | Incorporated by reference to RAIT’s Form 8-K as filed with the SEC on December 13, 2013 (File No. 1-14760). |
| (26) | Incorporated by reference to RAIT’s Form 8-A as filed with the SEC on April 14, 2014. (File No. 1-14760). |
| (27) | Incorporated by reference to RAIT’s Form 8-A as filed with the SEC on August 14, 2014. |
| (28) | Incorporated by reference to RAIT’s Form 8-K as filed with the SEC on January 31, 2014 (File No. 1-14760). |
| (29) | Incorporated by reference to RAIT’s Form 8-K as filed with the SEC on February 4, 2014 (File No. 1-14760). |
| (30) | Incorporated by reference to RAIT’s Form 10-K for the fiscal year ended December 31, 2013 (File No. 1-14760). |
| (31) | Incorporated by reference to RAIT’s Form 8-K as filed with the SEC on February 28, 2014 (File No. 1-14760). |
| (32) | Incorporated by reference to RAIT’s Form 10-Q for the Quarterly Period ended March 31, 2014 (File No. 1-14760). |
| (33) | Incorporated by reference to RAIT’s Form 8-K as filed with the SEC on August 1, 2014 (File No. 1-14760). |
| (34) | Incorporated by reference to RAIT’s Form 8-K as filed with the SEC on May 16, 2014 (File No. 1-14760). |
71