Attached files
| file | filename |
|---|---|
| EX-99.2 - EXHIBIT 99.2 - Education Realty Trust, Inc. | ex99220172018preleasingsta.htm |
| 8-K - 8-K - Education Realty Trust, Inc. | a8-k2017reitweek.htm |

1

2
Key Themes
Stable Industry With Significant Growth Potential
Superior Historical Shareholder Returns
Investment Strategy for Value Creation
Capital Structure to Support Growth
Best-in-Class Portfolio
Deep Experienced Management Team

3
Superior Historical Shareholder Return
Superior Historical Shareholder Return
Note: Period starting from the date Randy Churchey, Chairman and CEO and new management team was put in place.
Source: KeyBanc Leaderboard. Other REIT sector TSRs; self-storage 293%, industrial 218%, triple net 205%, mall 173%, shopping
ctr 149%, healthcare 120%, lodging 115% and office 102%.
275%
241% 217%
170% 145% 132%
EdR MFG
Housing
Data
Centers
MF RMZ ACC
TSR – January 2010 to December 2016
EdR TSR 12th
of 120 REITS.
Top 10%

4
Deep Experienced Management Team
Deep Experienced Management Team
Executives
Randy Churchey CEO & Chairman 7
Tom Trubiana President 28
Chris Richards COO 16
Bill Brewer CFO 3
Operations
Matt Fulton SVP 19
Frank Witt Regional VP 25
14 Other VPs and Regional Directors 10
Years of Tenure At EdR
Senior Development / Acq 10
Senior Finance and Other 8
Board of Directors (6) – Includes 3 current/former public REIT CEOs, former
CEO of public hospitality company, a former “big 4” audit partner and former head of
HR for a publicly traded company

5
6
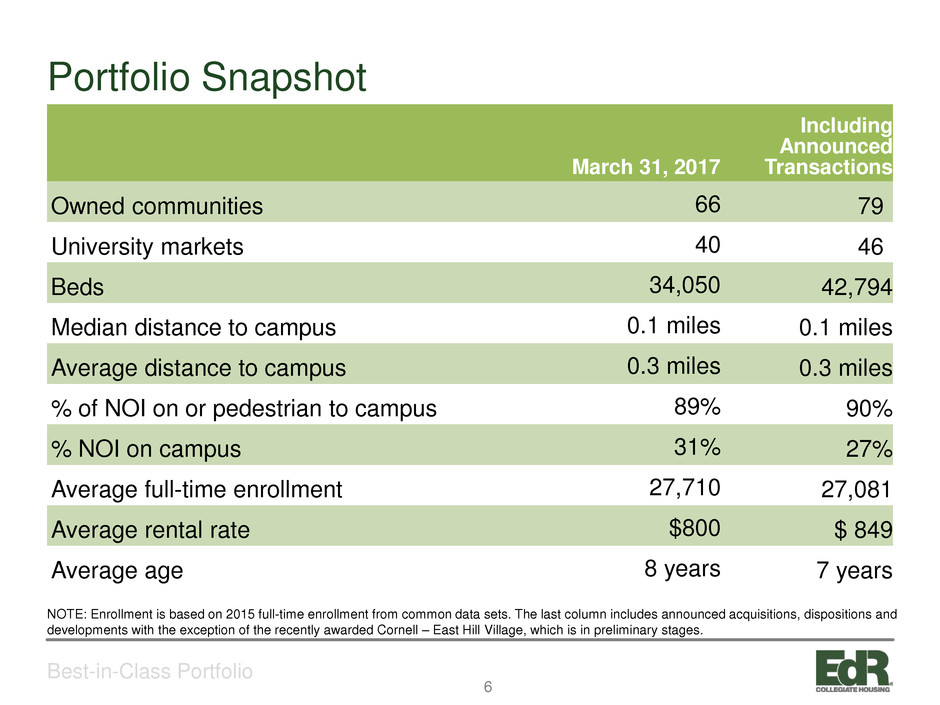
Portfolio Snapshot
Best-in-Class Portfolio
March 31, 2017
Including
Announced
Transactions
Owned communities 66 79
University markets 40 46
Beds 34,050 42,794
Median distance to campus 0.1 miles 0.1 miles
Average distance to campus 0.3 miles 0.3 miles
% of NOI on or pedestrian to campus 89% 90%
% NOI on campus 31% 27%
Average full-time enrollment 27,710 27,081
Average rental rate $800 $ 849
Average age 8 years 7 years
NOTE: Enrollment is based on 2015 full-time enrollment from common data sets. The last column includes announced acquisitions, dispositions and
developments with the exception of the recently awarded Cornell – East Hill Village, which is in preliminary stages.

7
Portfolio Characteristics
Best-in-Class Portfolio
HIGH DEMAND
UNIVERSITIES
1.8x
APPLICATION
TO ADMITTANCE
RATIO
(1) Represents our communities’ relative position in their respective market, based on a comparison of average rents to local
competitors.
82%
OF BEDS SERVE
UNIVERSITIES
WITH >20,000
ENROLLMENT
12%
56%
33%
R
en
ts
R
el
at
iv
e
to
C
om
ps
.
Well Positioned(1)
Low End Average
High End
25%
6%
47%
22%
Diverse Product
Garden Cottage
Mid-Rise High-Rise

8
Strong Operating Performance
Best-in-Class Portfolio
Source: Respective financial supplements.
$397
$745
2010 2016
Same-Community NAR
per Occupied Bed
51%
59%
2010 2016
Same-Community
Margins

9
Market Leading Internal Growth
Best-in-Class Portfolio
Source: Respective company’s disclosures. EdR’s proprietary leasing system, PILOT, which tracks market trends and
leasing velocity by unit type, gives EdR the tools to produce consistent and market leading leasing results.
Market-Leading
Leasing Results in
4 of Last 6
Years
3.6%
3.8%
2.8%
3.1%
Revenue NOI
EdR ACC
Same-Community Growth
Six-Year CAGR Through 2016

10

11
Stable Demand
Stable Industry With Significant Growth Potential
Projected Full-Time Enrollment Growth
Projected Average % Growth 2016-2024 = 1.4%
Sources: National Center for Education Statistics (NCES) report titled “Projections of Education Statistics to 2024, Forty-first edition" (Sept 2016), Pew
Research - Social & Demographic Trends: The Rising Cost of Not Going to College, February 11, 2014, Moody’s Investors Service, Special
Comment: More US Colleges Face Stagnating Enrollment and Tuition Revenue, According to Moody’s Survey, Jan. 10, 2013.
Enrollment Drivers
• Earnings gap between high school and college
graduates has stretched to its widest level in nearly a
half century
• US high school graduates will increase by an
average annual rate of 0.2% between 2016 and 2020
• Students seek the highest value education
• There is a correlation between university size and
enrollment trends, with the highest median
enrollment growth experienced at large, program-
diversified universities.
• Enrollment at public four-year institutions has out
performed four-year private and for-profit institutions
as well as two-year institutions
1.3%
2.2%
1.8%
1.2% 1.0%
1.3% 1.4% 1.6%
1.1%
2016 2017 2018 2019 2020 2021 2022 2023 2024
12
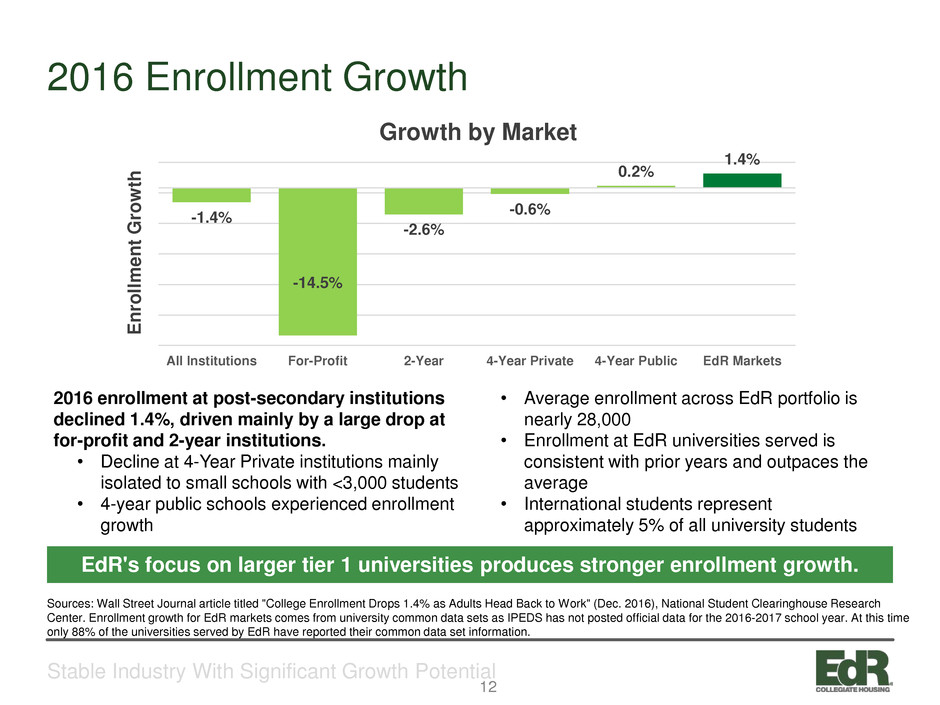
2016 Enrollment Growth
Stable Industry With Significant Growth Potential
2016 enrollment at post-secondary institutions
declined 1.4%, driven mainly by a large drop at
for-profit and 2-year institutions.
• Decline at 4-Year Private institutions mainly
isolated to small schools with <3,000 students
• 4-year public schools experienced enrollment
growth
Sources: Wall Street Journal article titled "College Enrollment Drops 1.4% as Adults Head Back to Work" (Dec. 2016), National Student Clearinghouse Research
Center. Enrollment growth for EdR markets comes from university common data sets as IPEDS has not posted official data for the 2016-2017 school year. At this time
only 88% of the universities served by EdR have reported their common data set information.
• Average enrollment across EdR portfolio is
nearly 28,000
• Enrollment at EdR universities served is
consistent with prior years and outpaces the
average
• International students represent
approximately 5% of all university students
EdR's focus on larger tier 1 universities produces stronger enrollment growth.
-1.4%
-14.5%
-2.6%
-0.6%
0.2%
1.4%
All Institutions For-Profit 2-Year 4-Year Private 4-Year Public EdR Markets
E
nr
ol
lm
en
t G
ro
w
th
Growth by Market
13
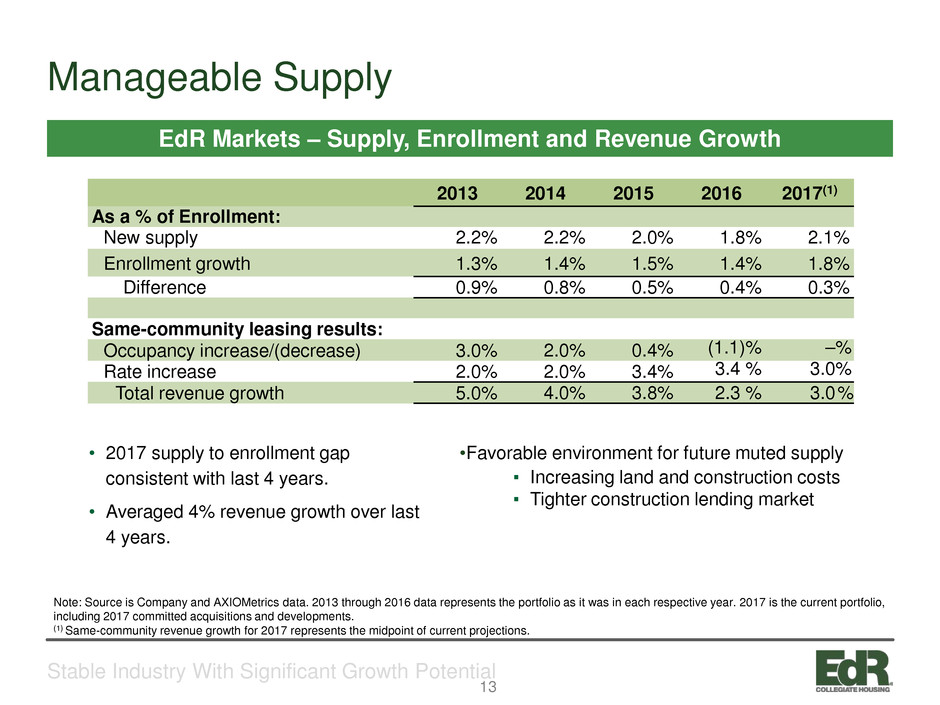
Manageable Supply
Stable Industry With Significant Growth Potential
EdR Markets – Supply, Enrollment and Revenue Growth
Note: Source is Company and AXIOMetrics data. 2013 through 2016 data represents the portfolio as it was in each respective year. 2017 is the current portfolio,
including 2017 committed acquisitions and developments.
(1) Same-community revenue growth for 2017 represents the midpoint of current projections.
(14%) (23%) (22%)
2013 2014 2015 2016 2017(1)
As a % of Enrollment:
New supply 2.2% 2.2% 2.0% 1.8% 2.1%
Enrollment growth 1.3% 1.4% 1.5% 1.4% 1.8%
Difference 0.9% 0.8% 0.5% 0.4% 0.3%
Same-community leasing results:
Occupancy increase/(decrease) 3.0% 2.0% 0.4% (1.1)% –%
Rate increase 2.0% 2.0% 3.4% 3.4 % 3.0%
Total revenue growth 5.0% 4.0% 3.8% 2.3 % 3.0%
• 2017 supply to enrollment gap
consistent with last 4 years.
• Averaged 4% revenue growth over last
4 years.
•Favorable environment for future muted supply
▪ Increasing land and construction costs
▪ Tighter construction lending market

14
Modernization
Stable Industry With Significant Growth Potential
Modernization is in full swing with new purpose-built housing
supply replacing older duplexes, single-family homes, etc.
Source: Company and AXIOMetrics data. Represents EdR’s markets
Other Housing
47%
On-Campus
Housing 27%
Off-Campus
Purpose Built
26%
15
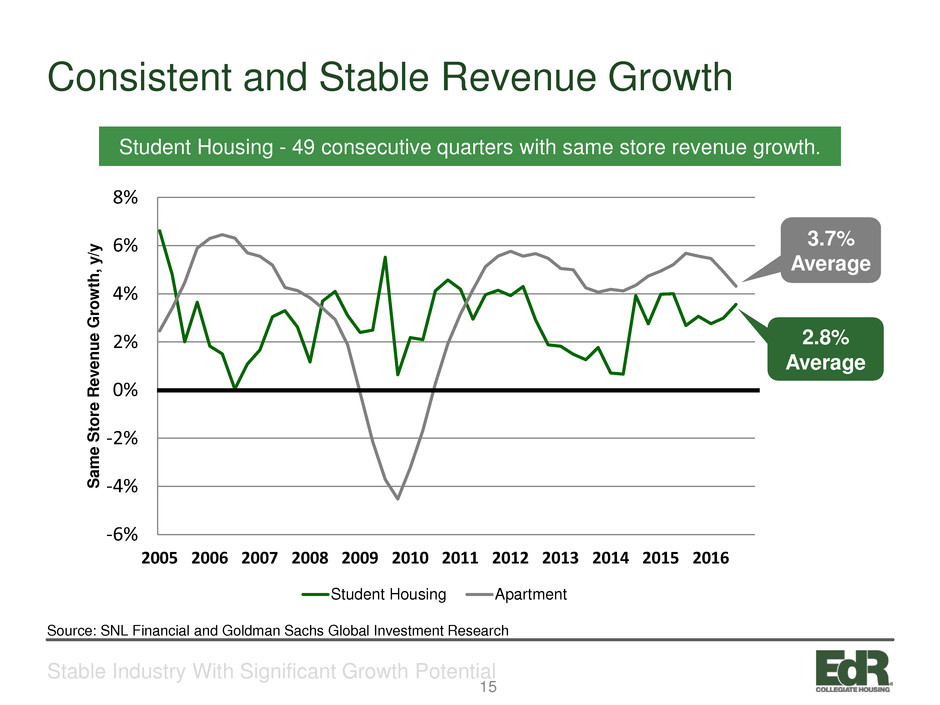
Consistent and Stable Revenue Growth
Stable Industry With Significant Growth Potential
Student Housing - 49 consecutive quarters with same store revenue growth.
Source: SNL Financial and Goldman Sachs Global Investment Research
2.8%
Average
-6%
-4%
-2%
0%
2%
4%
6%
8%
2005 2006 2007 2008 2009 2010 2011 2012 2013 2014 2015 2016
S
am
e
S
to
re
R
ev
en
ue
G
ro
w
th
, y
/y
Student Housing Apartment
3.7%
Average

16
17
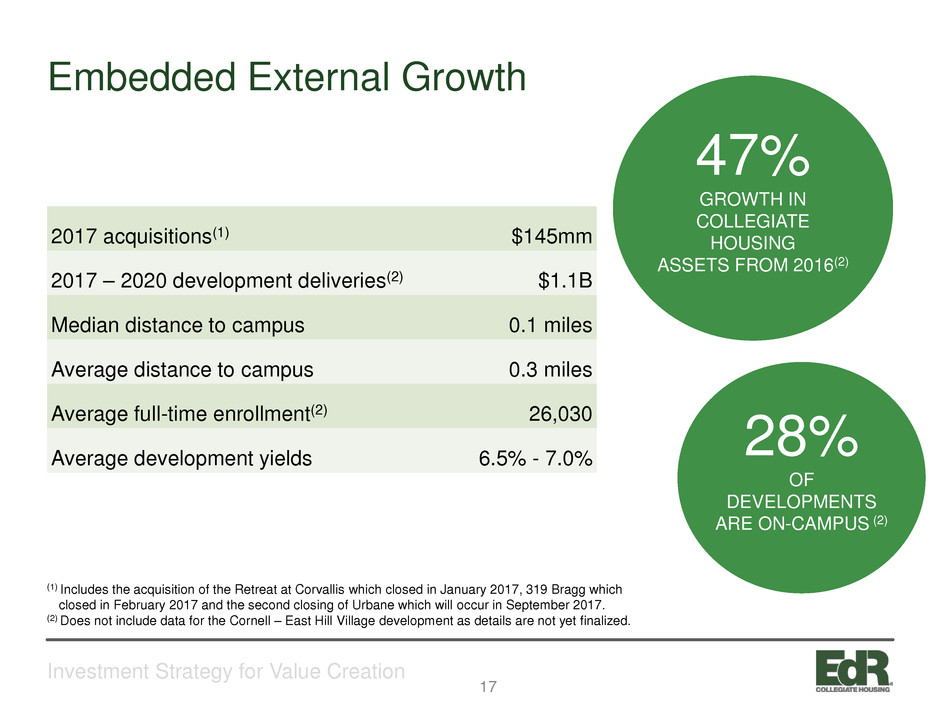
2017 acquisitions(1) $145mm
2017 – 2020 development deliveries(2) $1.1B
Median distance to campus 0.1 miles
Average distance to campus 0.3 miles
Average full-time enrollment(2) 26,030
Average development yields 6.5% - 7.0%
47%
GROWTH IN
COLLEGIATE
HOUSING
ASSETS FROM 2016(2)
28%
OF
DEVELOPMENTS
ARE ON-CAMPUS (2)
Embedded External Growth
Investment Strategy for Value Creation
(1) Includes the acquisition of the Retreat at Corvallis which closed in January 2017, 319 Bragg which
closed in February 2017 and the second closing of Urbane which will occur in September 2017.
(2) Does not include data for the Cornell – East Hill Village development as details are not yet finalized.
18
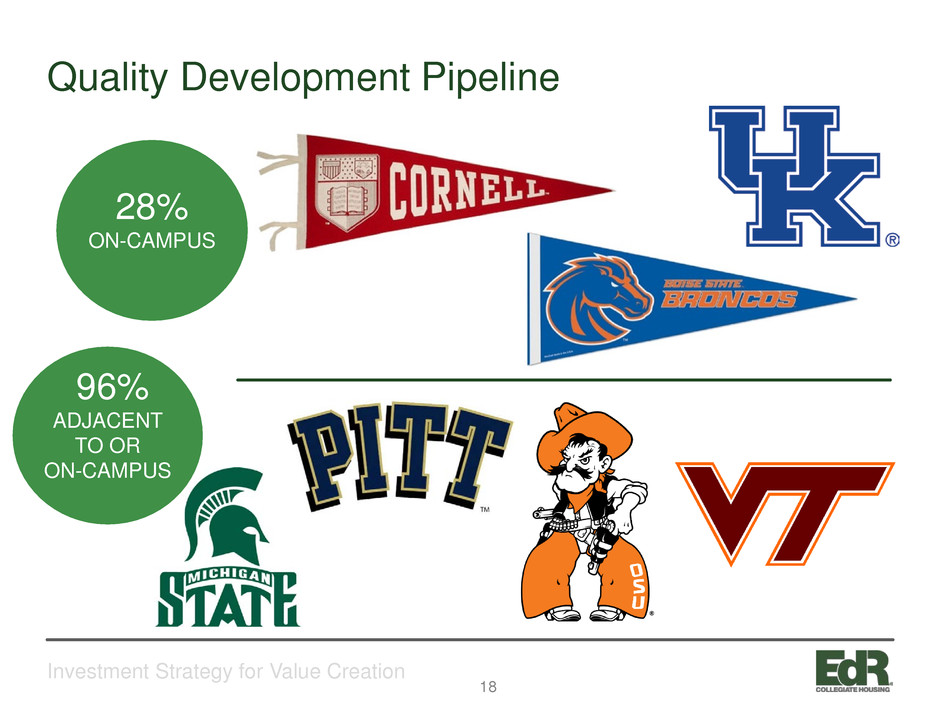
Quality Development Pipeline
Investment Strategy for Value Creation
28%
ON-CAMPUS
96%
ADJACENT
TO OR
ON-CAMPUS

19
5.25%
5.25%
1.25% - 1.75%
0.00% 1.00% 2.00% 3.00% 4.00% 5.00% 6.00% 7.00%
Development Yields
Market Cap Rates
Acquisition Cap Rates Development Premium
Development Premiums Drive Growth
Investment Strategy for Value Creation
Yield Premium For Low-Risk Developments(1)
(1) Current market cap rates for adjacent to campus assets in EdR type markets range from 5.0 to 5.5%.
30% Premium

20
Development Year
Percentage
On-Campus
Total
Cost
EdR’s
Economic
Ownership
Cost
Market
Value(1)
Additional
AV Creation
Incremental
NAV per
Share(2)
2017 Deliveries 56% $338 $315 $424 $109 $1.11
2018 Deliveries 18% $617 $502 $660 $158 $1.61
2019 Deliveries 0% $110 $99 $127 $28 $0.29
Total Active
Developments 28% $1,065 $916 $1,211 $295 $3.01
Value Creation from Announced Developments
Investment Strategy for Value Creation
(1) Based on a 6.75% average project yield and cap rates of 4.75% for on-campus and 5.25% for off-campus developments.
(2) Based on 73.6 million shares outstanding as of December 31, 2016.
in Millions, except
per share data
32% Value
Creation
21
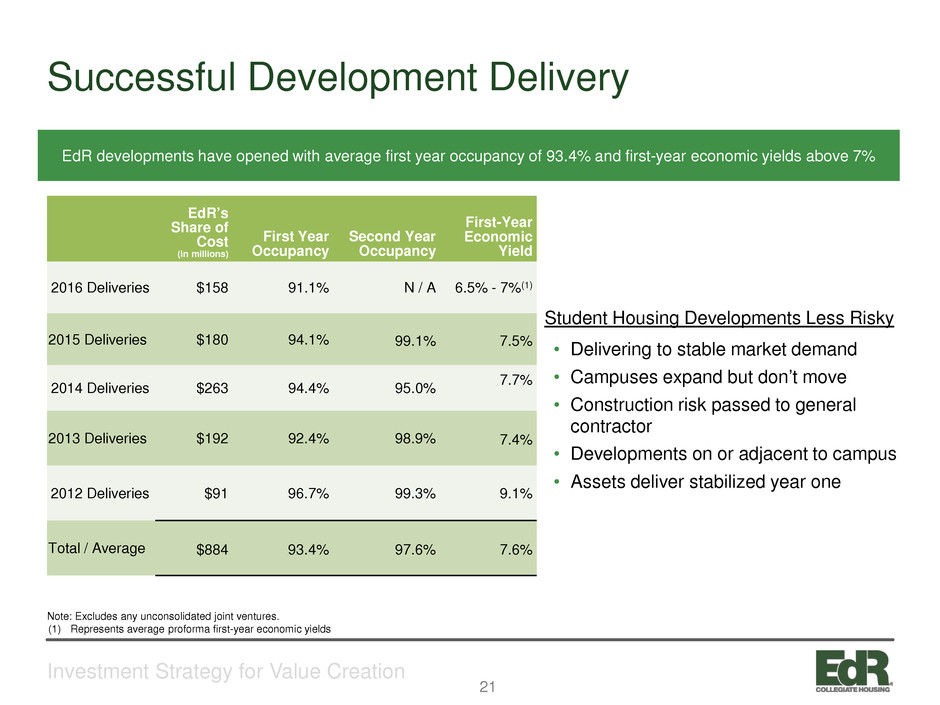
EdR’s
Share of
Cost
(in millions)
First Year
Occupancy
Second Year
Occupancy
First-Year
Economic
Yield
2016 Deliveries $158 91.1% N / A 6.5% - 7%(1)
2015 Deliveries $180 94.1% 99.1% 7.5%
2014 Deliveries $263 94.4% 95.0% 7.7%
2013 Deliveries $192 92.4% 98.9% 7.4%
2012 Deliveries $91 96.7% 99.3% 9.1%
Total / Average $884 93.4% 97.6% 7.6%
Note: Excludes any unconsolidated joint ventures.
(1) Represents average proforma first-year economic yields
EdR developments have opened with average first year occupancy of 93.4% and first-year economic yields above 7%
Student Housing Developments Less Risky
• Delivering to stable market demand
• Campuses expand but don’t move
• Construction risk passed to general
contractor
• Developments on or adjacent to campus
• Assets deliver stabilized year one
Successful Development Delivery
Investment Strategy for Value Creation

22
Investment Strategy for Value Creation
23
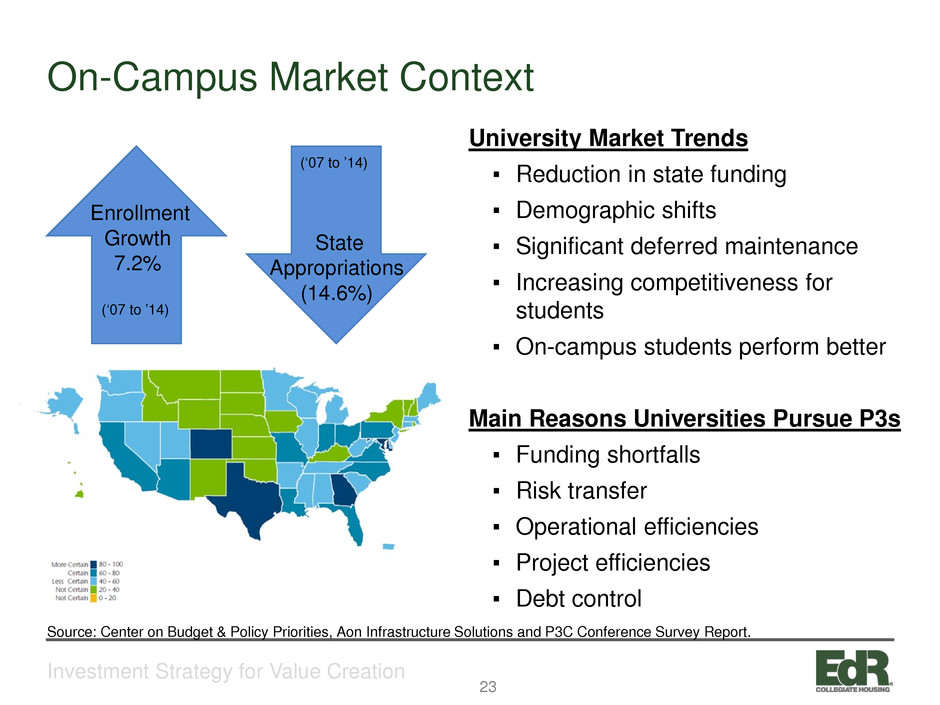
On-Campus Market Context
Investment Strategy for Value Creation
University Market Trends
▪ Reduction in state funding
▪ Demographic shifts
▪ Significant deferred maintenance
▪ Increasing competitiveness for
students
▪ On-campus students perform better
Main Reasons Universities Pursue P3s
▪ Funding shortfalls
▪ Risk transfer
▪ Operational efficiencies
▪ Project efficiencies
▪ Debt control
Enrollment
Growth
7.2%
State
Appropriations
(14.6%)
Source: Center on Budget & Policy Priorities, Aon Infrastructure Solutions and P3C Conference Survey Report.
(‘07 to ’14)
(‘07 to ’14)

24
Public REITs Dominate Equity P3s
Investment Strategy for Value Creation
NOTE: Combined public company results from company financial supplements.
$0.3
Billion
$1.6
Billion
2009 2016
Delivered On-Campus
Equity Developments
Significant Competitive Advantages
Proven on-campus development and
management expertise
Well-capitalized balance sheet
Size and depth of resources
Public company transparency
Long-term owner of assets
25
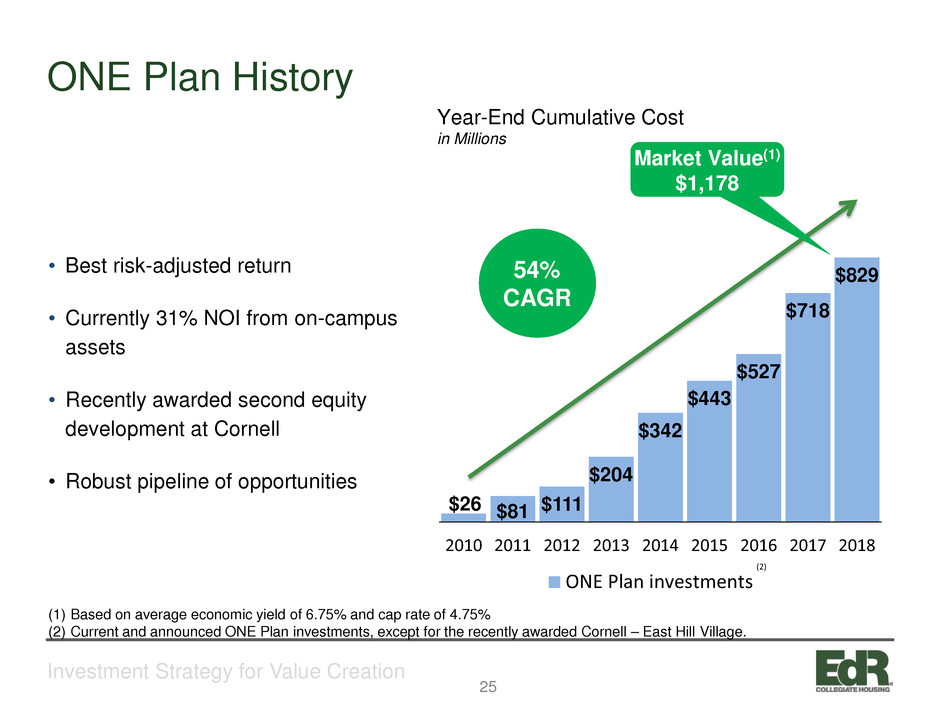
ONE Plan History
Investment Strategy for Value Creation
• Best risk-adjusted return
• Currently 31% NOI from on-campus
assets
• Recently awarded second equity
development at Cornell
• Robust pipeline of opportunities
(1) Based on average economic yield of 6.75% and cap rate of 4.75%
(2) Current and announced ONE Plan investments, except for the recently awarded Cornell – East Hill Village.
$26 $81 $111
$204
$342
$443
$527
$718
$829
2010 2011 2012 2013 2014 2015 2016 2017 2018
ONE Plan investments
Market Value(1)
$1,178
Year-End Cumulative Cost
in Millions
(2)
54%
CAGR
26
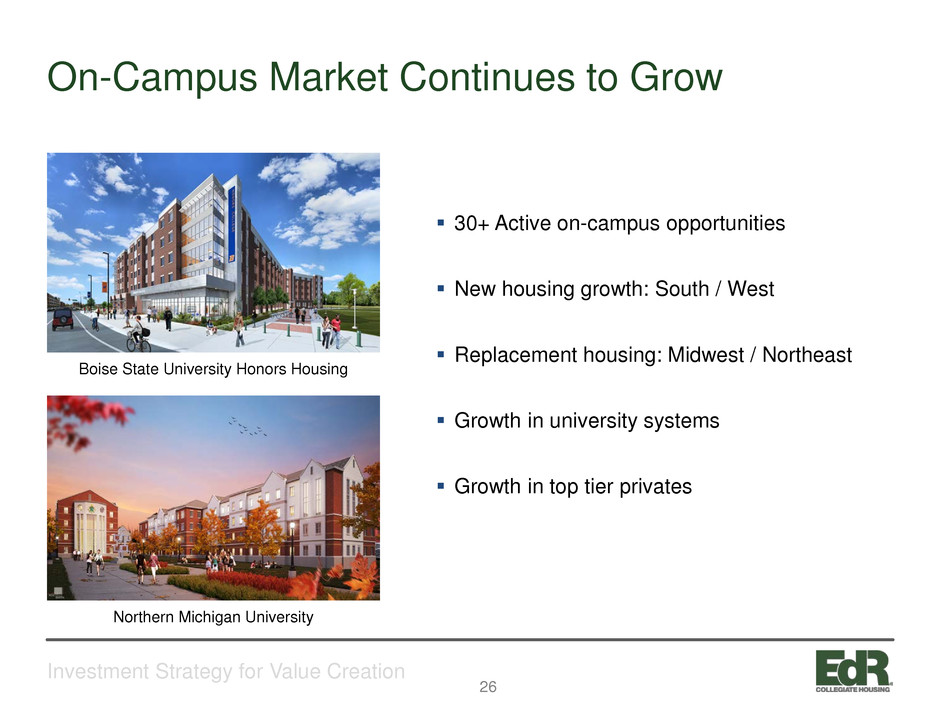
On-Campus Market Continues to Grow
Investment Strategy for Value Creation
Boise State University Honors Housing
Northern Michigan University
30+ Active on-campus opportunities
New housing growth: South / West
Replacement housing: Midwest / Northeast
Growth in university systems
Growth in top tier privates

27
28
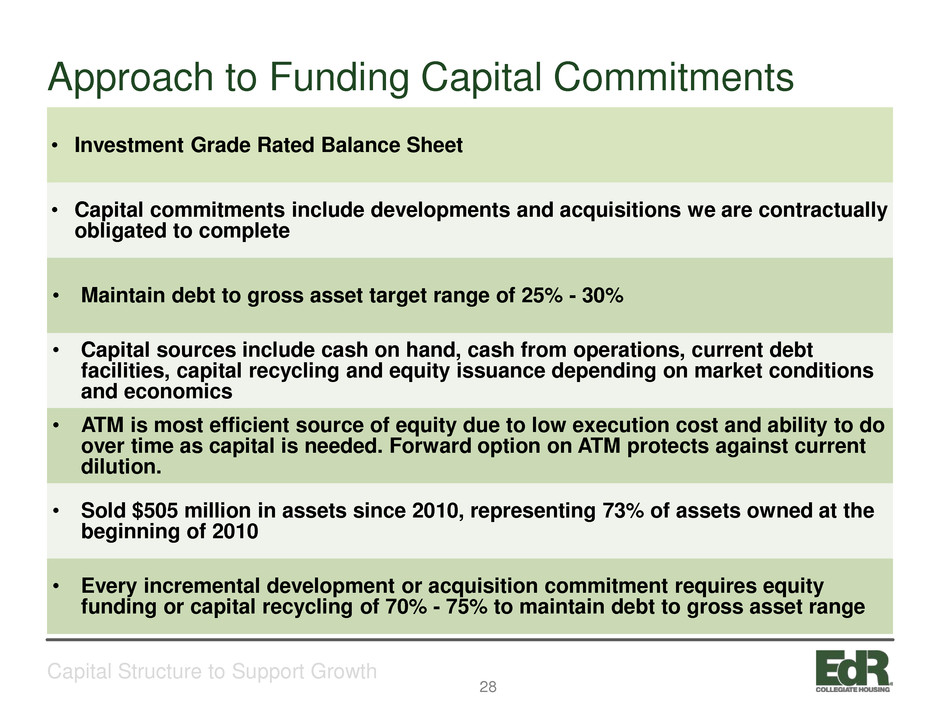
Approach to Funding Capital Commitments
Capital Structure to Support Growth
• Investment Grade Rated Balance Sheet
• Capital commitments include developments and acquisitions we are contractually
obligated to complete
• Maintain debt to gross asset target range of 25% - 30%
• Capital sources include cash on hand, cash from operations, current debt
facilities, capital recycling and equity issuance depending on market conditions
and economics
• ATM is most efficient source of equity due to low execution cost and ability to do
over time as capital is needed. Forward option on ATM protects against current
dilution.
• Sold $505 million in assets since 2010, representing 73% of assets owned at the
beginning of 2010
• Every incremental development or acquisition commitment requires equity
funding or capital recycling of 70% - 75% to maintain debt to gross asset range

29
Capital Commitments and Funding
Capital Structure to Support Growth
Estimated Capital Commitments:
Total Project
Development
Cost
Acquisition or
Development Costs
funded by EdR
(Excludes Partner
Contributions)
Cost Incurred to
Date
Remaining Capital
Needs
2017 Announced acquisitions $ 16 $ 16 $ — $ 16
2017 Development deliveries 339 333 234 99
2018 Development deliveries 617 583 69 514
2019 Development deliveries 109 106 23 83
Total Capital Commitments $ 1,081 $ 1,038 $ 326 $ 712
Estimated Capital Funding: 2017 Thereafter Capital Sources
Cash on hand at 3/31/2017 $ 35 $ — $ 35
Equity proceeds Available from ATM
Forward Sales 288 23 311
Additional debt, including draws on Line of
Credit 89 277 366
Total Capital Funding $ 412 $ 300 $ 712
3/31/2017
Pro Forma for
Funding Needs
Through
12/31/2017
Pro Forma
Assuming All
Funding Completed
Debt to Gross Assets(1) 24% 24% 29%
Note: Capital Commitments include announced and pending acquisitions and EdR’s share of announced and active developments. See the First Quarter 2017 Supplemental Package
for further details.
(1) Debt to gross assets is defined as total debt, excluding the unamortized debt premium and deferred financing costs, divided by gross assets, or total assets excluding accumulated
depreciation on real estate assets.

30
Leverage Target and Philosophy
Capital Structure to Support Growth
• Target - 25% to 30% debt to gross assets
• Philosophy - run our balance sheet such that we can fund current commitments with
cash on hand, cash from operations and current debt facilities and stay within target
debt to gross asset range
• Results in balance sheet capacity and flexibility to take advantage of opportunities
(1) Reflects funding all announced developments and recently completed acquisitions with cash on hand, proceeds from completed ATM forward sales and draws on
EdR’s revolving credit facility without any additional equity.
(2) Net debt to gross assets is defined as total debt, excluding the unamortized debt premium and deferred financing costs, less cash, divided by gross assets, or
total assets excluding accumulated depreciation on real estate assets.
42%
35%
27%
17%
24% 24%
2013 2014 2015 2016 Q1 2017 2017 F (1)
N
et
D
eb
t t
o
G
ro
ss
A
ss
et
s(
2)
November '15 new debt to gross
asset target range established.
31
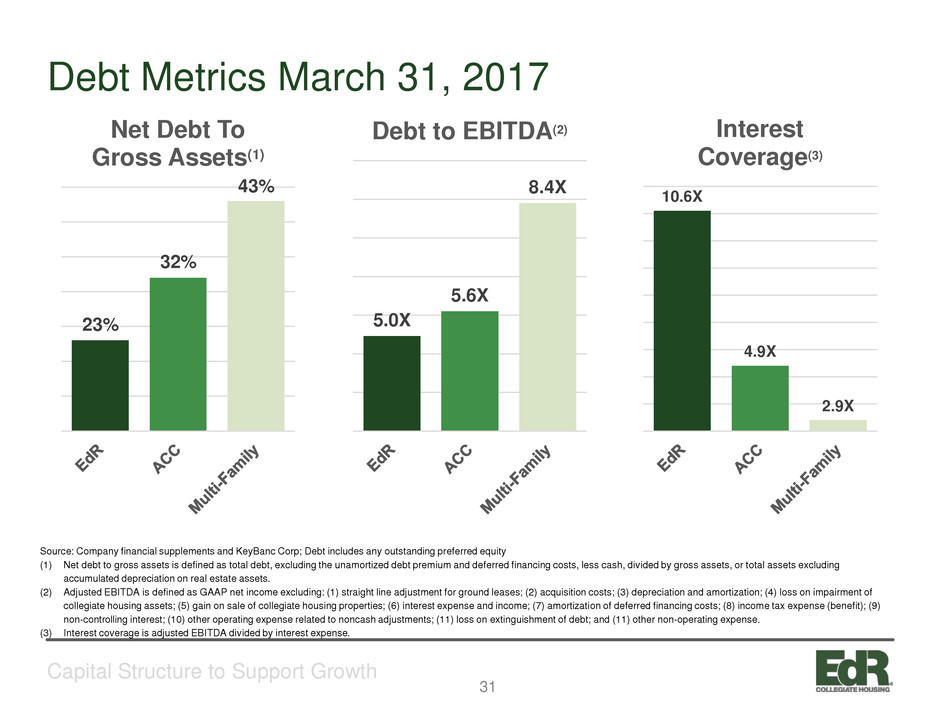
Debt Metrics March 31, 2017
Capital Structure to Support Growth
Source: Company financial supplements and KeyBanc Corp; Debt includes any outstanding preferred equity
(1) Net debt to gross assets is defined as total debt, excluding the unamortized debt premium and deferred financing costs, less cash, divided by gross assets, or total assets excluding
accumulated depreciation on real estate assets.
(2) Adjusted EBITDA is defined as GAAP net income excluding: (1) straight line adjustment for ground leases; (2) acquisition costs; (3) depreciation and amortization; (4) loss on impairment of
collegiate housing assets; (5) gain on sale of collegiate housing properties; (6) interest expense and income; (7) amortization of deferred financing costs; (8) income tax expense (benefit); (9)
non-controlling interest; (10) other operating expense related to noncash adjustments; (11) loss on extinguishment of debt; and (11) other non-operating expense.
(3) Interest coverage is adjusted EBITDA divided by interest expense.
23%
32%
43%
Net Debt To
Gross Assets(1)
5.0X
5.6X
8.4X
Debt to EBITDA(2)
10.6X
4.9X
2.9X
Interest
Coverage(3)

32
Current Capital Structure
Capital Structure to Support Growth
• Conservative Leverage Levels
• Net Debt to Gross Assets: 23%
• Net Debt to Adjusted EBITDA: 2.3x
• Secured Debt to Gross Assets: 1%
• Variable Rate Debt to Total Debt: 40%
• Strong Coverage Levels
• Interest Coverage Ratio: 10.6x
• Well-staggered debt maturities
• $500 million unsecured Credit Facility
expandable to $1 billion(1)
• $311 million equity proceeds available
from completed and settled ATM forward
sales
• Attractive and well covered dividend(2)
• Dividend Yield: 3.7%
(1) The unsecured revolving credit facility has an initial maturity in November 2018 and has a one-year extension option that may be exercised if certain conditions are met. The
Company has locked rates on $150 million of unsecured private placement notes with an average interest rate of 4.26%. The notes are evenly split between a 12-year and 15-
year term, are expected to close in the second quarter of 2017 and a portion of the proceeds is expected to be used to pay down the revolver. The current commitments have
customary contingencies and closing of the transaction is not guaranteed.
(2) Based on current annual dividend of $1.52 and stock price of $40.85 on March 31, 2017.
$30
$123
65
$250 $260
2017 2018 2019 2020 2021 2022 2023 2024
Debt Maturities as of March 31, 2017
(in Millions)
Unsecured revolving credit facility
Unsecured Senior Notes
Unsecured Term Loan - Fixed Rate
Construction Loans - Variable Rate


34
Safe Harbor Statement
Statements about the Company’s business that are not historical facts are “forward-looking
statements,” which relate to expectations, beliefs, projections, future plans and strategies,
anticipated events or trends, and similar expressions. In some cases, you can identify forward-
looking statements by the use of forward-looking terminology such as “may,” “will,” “should,”
“expects,” “intends,” “plans,” “anticipates,” “believes,” “estimates,” “predicts,” “potential,” or the
negative of these words and phrases or similar words or phrases which are predictions of or
indicate future events or trends and which do not relate solely to historical matters. Forward-
looking statements are based on current expectations. You should not rely on our forward-looking
statements because the matters that they describe are subject to known and unknown risks and
uncertainties that could cause the Company’s business, financial condition, liquidity, results of
operations, Core FFO, FFO and prospects to differ materially from those expressed or implied by
such statements. Such risks are set forth under the captions “Risk Factors,” “Forward-Looking
Statements” and “Management’s Discussion and Analysis of Financial Condition and Results of
Operations” (or similar captions) in our most recent Annual Report on Form 10-K and our quarterly
reports on Form 10-Q, and as described in our other filings with the Securities and Exchange
Commission. Forward-looking statements speak only as of the date on which they are made, and,
except as otherwise may be required by law, the Company undertakes no obligation to update
publicly or revise any guidance or other forward-looking statement, whether as a result of new
information, future developments, or otherwise, except as required by law.
