Attached files
| file | filename |
|---|---|
| EX-32.1 - EXHIBIT 32.1 - China Health Industries Holdings, Inc. | exhibit32-1.htm |
| EX-31.2 - EXHIBIT 31.2 - China Health Industries Holdings, Inc. | exhibit31-2.htm |
| EX-31.1 - EXHIBIT 31.1 - China Health Industries Holdings, Inc. | exhibit31-1.htm |
UNITED STATES
SECURITIES AND EXCHANGE COMMISSION
WASHINGTON,
D.C. 20549
FORM 10-Q
(Mark One)
[X] QUARTERLY REPORT PURSUANT TO SECTION 13 or 15(d) OF THE SECURITIES EXCHANGE ACT OF 1934.
For the quarterly period ended March 31, 2017
[ ] TRANSITION REPORT PURSUANT TO SECTION 13 OR 15(d) OF THE SECURITIES EXCHANGE ACT OF 1934.
For the transition period from ____________to ____________
Commission File Number: 000-51060
CHINA HEALTH INDUSTRIES HOLDINGS,
INC.
(Exact name of registrant as specified in
its charter)
| Delaware | 86-0827216 |
| (State or other jurisdiction of | (IRS Employer |
| incorporation or organization) | Identification No.) |
168 Binbei Street, Songbei District
Harbin City,
Heilongjiang Province
People’s Republic of China 150028
(Address of principal executive offices) (Zip Code)
86-451-88100688
(Issuer's telephone number,
including area code)
Not Applicable
(Former name, former address and
former fiscal year, if changed since last report)
Indicate by check mark whether the issuer (1) filed all reports
required to be filed by Section 13 or 15(d) of the Securities Exchange Act of
1934 during the preceding 12 months (or for such shorter period that the
registrant was required to file such reports), and (2) has been subject to such
filing requirements for the past 90 days.
Yes [X]
No [ ]
Indicate by check mark whether the registrant has submitted
electronically and posted on its corporate Web site, if any, every Interactive
Data File required to be submitted and posted pursuant to Rule 405 of Regulation
S-T (§232.405 of this chapter) during the preceding 12 months (or for such
shorter period that the registrant was required to submit and post such files).
Yes [X] No [ ]
Indicate by check mark whether the registrant is a large accelerated filer, an accelerated filer, a non-accelerated filer, a smaller reporting company or an emerging growth company. See the definitions of “large accelerated filer,” “accelerated filer,” “smaller reporting company” and “emerging growth company” in Rule 12b-2 of the Exchange Act.
| Large accelerated filer [ ] | Accelerated filer [ ] |
| Non-accelerated filer [ ] | Smaller reporting company [X] |
| ( Do not check if a smaller reporting company ) | |
| Emerging growth company [ ] |
1
If an emerging growth company, indicate by check mark if the registrant has elected not to use the extended transition period for complying with any new or revised financial accounting standards provided pursuant to Section 13(a) of the Exchange Act. [ ]
Indicate by check mark whether the registrant is a shell
company (as defined in Rule 12b-2 of the Exchange Act).
Yes [
] No [X]
APPLICABLE ONLY TO CORPORATE ISSUERS:
As of May 5, 2017, there were 65,539,737 shares of common stock, $0.0001 par value per share, issued and outstanding.
TABLE OF CONTENTS
| Page | ||
| PART I |
FINANCIAL INFORMATION |
|
| Item 1. |
Financial Statements (Unaudited) |
3 |
| Condensed Consolidated Balance Sheets As of March 31, 2017 and June 30, 2016 (Unaudited) | 3 | |
|
Condensed Consolidated Statements of Operations and Comprehensive Income For the Three and Nine Months Ended March 31, 2017 and 2016 (Unaudited) |
4 | |
|
Condensed Consolidated Statements of Cash Flows For the Nine Months Ended March 31, 2017 and 2016 (Unaudited) Notes to Condensed Consolidated Financial Statements As of March 31, 2017 (Unaudited) |
5 | |
| Item 2. |
Management’s Discussion and Analysis of Financial Condition and Results of Operations |
26 |
| Item 3. |
Quantitative and Qualitative Disclosures About Market Risk |
36 |
| Item 4. |
Controls and Procedures |
36 |
| PART II |
OTHER INFORMATION |
38 |
| Item 6. |
Exhibits |
38 |
| Signatures | 38 | |
| Exhibits/Certifications | 39 | |
2
PART I - FINANCIAL INFORMATION
| Item 1. | Financial Statements |
CHINA HEALTH INDUSTRIES HOLDINGS, INC. AND SUBSIDIARIES
CONDENSED CONSOLIDATED BALANCE SHEETS
(UNAUDITED)
| March 31, 2017 | June 30, 2016 | |||||
| ASSETS | ||||||
| Current assets | ||||||
| Cash and cash equivalents | $ | 20,799,235 | $ | 29,783,152 | ||
| Short term investments | 8,716,876 | - | ||||
| Interest receivable | 653,766 | - | ||||
| Accounts receivable, net | 1,371,337 | 1,145,131 | ||||
| Inventory | 463,700 | 414,784 | ||||
| Other receivables, net | 33,780 | 35,484 | ||||
| Advances to suppliers | 484,194 | 154,430 | ||||
| Current assets held for discontinued operations | - | 14,339 | ||||
| Prepayments | 125,030 | - | ||||
| Total current assets | 32,647,918 | 31,547,320 | ||||
| Property, plants and equipment, net | 3,542,009 | 3,866,765 | ||||
| Intangible assets, net | 3,704,617 | 4,191,059 | ||||
| Construction in progress | 694,847 | 670,051 | ||||
| Other assets held for discontinued operations | - | 3,602 | ||||
| Prepayments – Non-Current |
53,270
|
-
|
||||
| Total assets | $ | 40,642,661 | $ |
40,278,797
|
||
| LIABILITIES AND EQUITY | ||||||
| Current liabilities | ||||||
| Short-term loans | $ | 1,452,813 | $ | 1,504,687 | ||
| Accounts payable and accrued expenses | 440,873 | 487,172 | ||||
| Other payables | 54,023 | 37,036 | ||||
| Advances from customers | 166,138 | 164,122 | ||||
| Related party debts | 3,420,506 | 2,713,406 | ||||
| Wages payable | 192,459 | 173,004 | ||||
| Taxes payable | 823,985 | 467,674 | ||||
| Current liabilities held for discontinued operations | - | 482,013 | ||||
| Total current liabilities | 6,550,797 | 6,029,114 | ||||
| Equity | ||||||
| Common stock, ($0.0001 par value per share, 300,000,000 shares authorized, 65,539,737 and 65,839,737 shares issued and outstanding as of March 31, 2017 and June 30, 2016, respectively) | 6,554 | 6,554 | ||||
| Additional paid-in capital | 521,987 | 521,987 | ||||
| Accumulated other comprehensive income | (612,367 | 784,045 | ||||
| Statutory reserves | 38,679 | 38,679 | ||||
| Retained earnings | 34,137,011 | 32,898,244 | ||||
| Total stockholders' equity |
34,091,864
|
34,249,509
|
||||
| Non-controlling interests |
-
|
174
|
||||
| Total equity |
34,091,864
|
34,249,683
|
||||
| Total liabilities and equity | $ |
40,642,661
|
$ |
40,278,797
|
The accompanying notes are an integral part of these condensed consolidated financial statements.
3
CHINA HEALTH INDUSTRIES HOLDINGS, INC. AND
SUBSIDIARIES
CONDENSED CONSOLIDATED STATEMENTS OF OPERATIONS AND
COMPREHENSIVE INCOME (LOSS)
(UNAUDITED)
| For the Three Months Ended | For the Nine Months Ended | |||||||||||
| March 31, 2017 | March 31, 2016 | March 31, 2017 | March 31, 2016 | |||||||||
| REVENUE | $ | 1,338,886 | $ | 1,677,273 | $ | 4,410,550 | $ | 6,358,992 | ||||
| COST OF GOODS SOLD | 866,806 | 1,175,123 | 2,801,128 | 4,594,285 | ||||||||
| GROSS PROFIT | 472,080 | 502,150 | 1,609,422 | 1,764,707 | ||||||||
| OPERATING EXPENSES | ||||||||||||
| Selling, general and administrative expenses | 486,427 | 439,203 | 1,243,782 | 1,439,223 | ||||||||
| Depreciation and amortization expenses | 64,317 | 147,790 | 456,651 | 480,209 | ||||||||
| Total operating expenses | 550,744 | 586,993 | 1,700,433 | 1,919,432 | ||||||||
| INCOME (LOSS) FROM OPERATIONS | (78,664 | ) | (84,843 | ) | (91,011 | ) | (154,725 | ) | ||||
| OTHER INCOME/(EXPENSES) | ||||||||||||
| Interest income | 17,626 | 17,667 | 55,114 | 53,191 | ||||||||
| Interest expenses | (22,130 | ) | (21,720 | ) | (64,867 | ) | 80,199 | ) | ||||
| Investment income | 217,867 | - | 662,595 | - | ||||||||
| Other income/(expenses), net | 7,454 | 9,148 | 210,816 | 30,523 | ||||||||
| Bank charges | (315 | ) | - | (1,017 | ) | - | ||||||
| Gain on disposal of subsidiaries | (6,927 | ) | - | 1,150,663 | - | |||||||
| Total other income (expenses), net | 213,575 | 5,095 | 2,013,304 | 3,515 | ||||||||
| INCOME/(LOSS) BEFORE INCOME TAXES | 134,911 | (79,748 | ) | 1,922,293 | (151,210 | ) | ||||||
| Provision for income taxes | 189,876 | 35,077 | 683,526 | 105,960 | ||||||||
| NET INCOME (LOSS) FROM CONTINUING OPERATIONS | (54,965 | ) | (114,825 | ) | 1,238,767 | (257,170 | ) | |||||
| NET LOSS FROM DISCONTINUED OPERATIONS | - | - | - | - | ||||||||
| NET INCOME (LOSS) | (54,965 | ) | (114,825 | ) | 1,238,767 | (257,170 | ) | |||||
| Less: net loss attributable to non-controlling interests | - | (2 | ) | - | (6 | ) | ||||||
| NET INCOME (LOSS) ATTRIBUTABLE TO CHINA HEALTH INDUSTRIES HOLDINGS | (54,965 | ) | (114,823 | ) | 1,238,767 | (257,164 | ) | |||||
| NET INCOME (LOSS) FROM CONTINUING OPERATIONS | (54,965 | ) | (114,823 | ) | 1,238,767 | (257,164 | ) | |||||
| NET LOSS FROM DISCONTINUED OPERATIONS | - | - | - | - | ||||||||
| OTHER COMPREHENSIVE LOSS | ||||||||||||
| Foreign currency translation income (loss) | 306,716 | 162,205 |
(614,505
|
) |
(1,413,191
|
) | ||||||
| COMPREHENSIVE INCOME (LOSS) | 251,751 | 47,380 | 624,262 | (1,670,361 | ) | |||||||
| Less: comprehensive loss attributable to non-controlling interests | 2 | (1 | ) | (6 | ) | (14 | ) | |||||
| COMPREHENSIVE LOSS ATTRIBUTABLE TO CHINA HEALTH INDUSTRIES HOLDINGS | $ | 251,749 | $ | 47,381 | $ | 624,268 | $ | (1,670,347 | ) | |||
| Net income (loss) attributable to China Health Industries Holdings' shareholders per share are: | ||||||||||||
| Basic & diluted income (loss) per share | $ | 0.0008 | $ | (0.002 | ) | $ | 0.0188 | $ | (0.004 | ) | ||
| Weighted average shares outstanding: | ||||||||||||
| Basic & diluted weighted average shares outstanding | 65,539,737 | 65,559,092 | 65,722,584 | 65,546,330 | ||||||||
The accompanying notes are an integral part of these condensed consolidated financial statements.
CHINA HEALTH INDUSTRIES HOLDINGS, INC. AND SUBSIDIARIES
CONDENSED CONSOLIDATED STATEMENTS OF CASH FLOWS
(UNAUDITED)
| For the Nine Months Ended | ||||||
| March 31, | March 31, | |||||
| 2017 | 2016 | |||||
| Cash Flows from Operating Activities | ||||||
| Net income (loss) available to China Health Industries Holdings | $ | 1,238,767 | $ | (257,164 | ) | |
| Net loss from discontinued operations | - | - | ||||
| Net income (loss) from continuing operations | 1,238,767 | (257,164 | ) | |||
| Adjustments to reconcile net income (loss) to net cash provided by operating activities: | ||||||
| Depreciation and amortization expenses | 487,913 | 608,903 | ||||
| Provisions for doubtful accounts | - | 754 | ||||
| Non-controlling interests | - | (6 | ) | |||
| Short term investment income | (662,595 | ) | - | |||
| Share-based compensation | - | 225,000 | ||||
| Gain on disposal of subsidiaries | (1,150,663 | ) | - | |||
| Changes in operating assets and liabilities, | ||||||
| Accounts receivable | 6,244 | 20,290 | ||||
| Other receivables | 1,704 | (181 | ) | |||
| Inventory | (48,916 | ) | 187,148 | |||
| Advances to suppliers and prepaid expenses | (454,794 | ) | (134,560 | ) | ||
| Interest receivable | (653,766 | ) | - | |||
| Accounts payables and accrued expenses | (46,299 | ) | (1,572 | ) | ||
| Advances from customers and other payables | (462,497 | ) | (59,389 | ) | ||
| Amounts due to related parties | 610,392 | - | ||||
| Wages payable | 19,455 | 25,782 | ||||
| Taxes payable | 356,311 | 86,850 | ||||
| Net cash (used in) provided by operating activities from continuing operations | (758,744 | ) | 701,855 | |||
| Net cash (used in) provided by operating activities from discontinued operations | 17,254 | - | ||||
| Net cash provided by operating activities | (741,490 | ) | 701,855 | |||
| Cash Flows from Investing Activities | ||||||
| Expenditures in short term investments | (8,054,281 | ) | - | |||
| Notes receivable | - | 1,460 | ||||
| Purchases of property, plants and equipment | (39,968 | ) | (83,093 | ) | ||
| Expenditures in construction in progress | (47,896 | ) | (60,059 | ) | ||
| Proceeds from disposal of subsidiaries | 929,800 | - | ||||
| Net cash provided by (used in) investing activities from continuing operations | (7,212,345 | ) | (141,692 | ) | ||
| Net cash provided by (used in) investing activities from discontinued operations | - | - | ||||
| Net cash used in investing activities | (7,212,345 | ) | (141,692 | ) | ||
| Cash Flows from Financing Activities | ||||||
| Proceeds from related party debts | 85,085 | 357,277 | ||||
| Payment of short term loans | (51,874 | ) | (45,245 | ) | ||
| Net cash provided by financing activities from continuing operations | 33,211 | 312,032 | ||||
| Net cash provided by financing activities from discontinued operations | - | - | ||||
| Net cash provided by financing activities | 33,211 | 312,032 | ||||
| Effect of exchange rate changes on cash and cash equivalents from continuing operations | (1,046,039 | ) | (817,182 | ) | ||
| Effect of exchange rate changes on cash and cash equivalents from discontinued operations | (25,832 | ) | (354 | ) | ||
| Net increase/(decrease) in cash and cash equivalents from continuing operations | (8,983,917 | ) | 55,013 | |||
| Net increase/(decrease) in cash and cash equivalents from discontinued operations | (8,578 | ) | (354 | ) | ||
| Cash and cash equivalents, beginning balance from continuing operations | 29,783,152 | 21,113,832 | ||||
| Cash and cash equivalents, beginning balance from discontinued operations | 8,578 | 9,195 | ||||
| Cash and cash equivalents, ending balance from continuing operations | $ | 20,799,235 | $ | 21,168,845 | ||
| Cash and cash equivalents, ending balance from discontinued operations | $ | - | $ | 8,841 | ||
| Supplemental cash flow information | ||||||
| Cash paid for income taxes | $ | 945,796 | $ | 346,183 | ||
| Cash paid for interest expenses | $ | 64,866 | $ | 80,199 | ||
| Non-cash activities: | ||||||
| Loan from related party for the construction of a facility | $ | 449,092 | $ | 475,849 | ||
The accompanying notes are an integral part of these condensed consolidated financial statements.
CHINA HEALTH INDUSTRIES HOLDINGS, INC. AND
SUBSIDIARIES
NOTES TO CONSOLIDATED FINANCIAL STATEMENTS
Note 1 - ORGANIZATION AND BUSINESS BACKGROUND
China Health Industries Holdings, Inc. (“China Health US”) was incorporated in the State of Arizona on July 11, 1996, and is the successor to the business known as Arizona Mist, Inc., which was incorporated in 1989. On May 9, 2005, China Health US entered into a stock purchase agreement and share exchange (effecting a reverse merger) with Edmonds 6, Inc., a Delaware corporation (“Edmonds 6”), and changed its name to Universal Fog, Inc. Pursuant to this agreement, Universal Fog, Inc. (which has been in continuous operation since 1996) became a wholly-owned subsidiary of Edmonds 6.
China Health Industries Holdings Limited (“China Health HK”) was incorporated on July 20, 2007, in Hong Kong, under the Companies Ordinance as a limited liability company. China Health HK was formed for the purpose of seeking and consummating a merger or acquisition with a business entity organized as a private corporation, partnership, or sole proprietorship, as defined by Financial Accounting Standards Board (“FASB”) ACS Topic 915.
Harbin Humankind Biology Technology Co., Limited (“Humankind”) was incorporated in Harbin City, Heilongjiang Province, the People’s Republic of China (the “PRC”), on December 14, 2003, as a limited liability company under the PRC Company Law. Humankind is engaged in the manufacturing and sale of health products.
On August 20, 2007, the sole shareholder of China Health HK entered into a share purchase agreement (the “Share Purchase Agreement”) with the owners of Humankind. Pursuant to the Share Purchase Agreement, China Health HK purchased 100% of the equity interests in Humankind for cash consideration of $60,408 (the “Share Purchase”). Subsequent to the completion of the Share Purchase, Humankind became a wholly-owned subsidiary of China Health HK. Because the owner of Humankind owned a majority of the outstanding shares of China Health HK’s common stock immediately following the execution of the Share Purchase Agreement, it was deemed to be the acquirer in the reverse merger and the Share Purchase was accounted for as a “reverse merger.” Consequently, the assets and liabilities and the historical operations that were reflected in the financial statements for periods prior to the Share Purchase are those of Humankind and have been recorded at historical cost basis. After the completion of the Share Purchase, China Health HK’s consolidated financial statements include the assets and liabilities of both China Health HK and Humankind, the historical operations of Humankind, and the operations of China Health HK and its subsidiaries from the closing date of the Share Purchase.
On October 14, 2008, Humankind formed a 99% owned subsidiary, Harbin Huimeijia Medicine Company (“Huimeijia”) in the PRC. Huimeijia’s primary business is the manufacture and distribution of pharmaceuticals. Mr. Xin Sun, the majority owner of China Health US, owns 1% of Huimeijia. Huimeijia is consolidated in the consolidated financial statements of China Health HK.
On December 31, 2008, China Health HK entered into a reverse merger with Universal Fog, Inc. (the “Transaction”). China Health HK was the acquirer in the Transaction, and the Transaction has been treated as a recapitalization of China Health US. Following the Transaction and a subsequent 20:1 reverse stock split, Mr. Xin Sun owned 61,203,088 shares of common stock of China Health US, representing 98.3% of the 62,234,737 total outstanding shares of common stock. On April 7, 2009, Mr. Sun transferred 28,200,000 shares of common stock to 296 individuals, leaving him with 33,003,088 shares of common stock of China Health US, or approximately 53.03% of the total outstanding shares of common stock. Universal Fog, Inc. changed its name to China Health Industries Holdings, Inc. on February 19, 2009.
On November 22, 2013, Humankind completed the acquisition of Heilongjiang Huimeijia Pharmaceutical Co., Ltd. (“HLJ Huimeijia”) for a total purchase price of $16,339,869 (RMB100,000,000). HLJ Huimeijia was formed on October 30, 2003, in the PRC, and is engaged in the manufacturing and distribution of tinctures, ointments, rub-in therapeutic pastes, topical solutions, suppositories, liniments (including traditional Chinese medicine extractions), enemas and orally-administered liquids. HLJ Huimeijia’s predecessor is Heilongjiang Xue Du Pharmaceutical Co., Ltd., which established its brand by supplying high quality medical products. HLJ Huimeijia is categorized as a “high and new technology” enterprise by the Science Technology Department of Heilongjiang Province. HLJ Huimeijia has 21 products which have been approved by, and have received approval numbers issued by, the China State Food and Drug Administration (the “CFDA”). In addition, HLJ Huimeijia is the holder of one patent for a utility model, five patents for external design and three trademarks in the PRC, including the Chinese brand name “Xue Du”, which has an established reputation among customers in the northeastern PRC.
6
On December 24, 2014, Humankind entered into a stock transfer agreement (the “Original Agreement”) with Xiuzheng Pharmaceutical Group Co., Ltd. a company incorporated under the laws of the PRC and located in Jilin province (“Xiuzheng Pharmacy” or the “Buyer”), Mr. Xin Sun, the CEO of the Company, and Huimeijia, 99% owned by Humankind and 1% owned by Mr. Xin Sun. Pursuant to the Original Agreement, Humankind and Mr. Xin Sun (the “Equity Holders”), would sell their respective equity interests in Huimeijia to Xiuzheng Pharmacy. On February 9, 2015, the four parties entered into a supplementary agreement (the “Supplementary Agreement”) to modify the terms of the Original Agreement, pursuant to which, the Equity Holders and Huimeijia (collectively the “Asset Transferors”) would only sell 19 drug approval numbers (the “Assets”) to Xiuzheng Pharmacy. The Equity Holders would have retained their equity interests in Huimeijia, but would have pledged such equity interests to Xiuzheng Pharmacy until the Assets were transferred. On October 12, 2016, the four parties agreed to rescind the Supplementary Agreement and entered into a new supplementary agreement, pursuant to which the parties agreed to execute the transfer of the equity interests based on the Original Agreement and the Equity Holders sold their respective equity interests in Huimeijia to Xiuzheng Pharmacy for total cash consideration of RMB 8,000,000 (approximately $1,306,186, the “Purchase Price”) to the Equity Holders. As of the date of this report, 80% of the Purchase Price has been paid, Huimeijia has completed changes in its business registration, and Xiuzheng Pharmacy has obtained a new business license issued by the local State Administration of Industry and Commerce in Harbin (“Harbin SAIC”) for Huimeijia, in which Huimeijia’s ownership is recorded as held by Xiuzheng Pharmacy with Harbin SAIC, and the legal representative (a person that is authorized to take most of corporate actions on behalf of a company under PRC corporate laws) of Huimeijia has been appointed by the Buyer. The transfers of the Assets to the Buyer and the remainder of the Purchase Price to the Equity Holders are pending (See Note 3). The gain on the disposal of Huimeijia was $1,157,590.
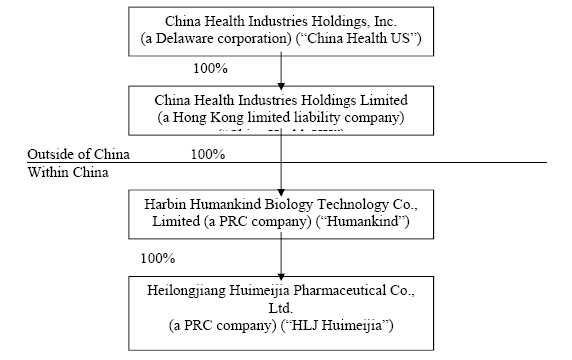
China Health US, China Health HK, Humankind, Huimeijia and HLJ Huimeijia are collectively referred herein to as the “Company.”
As of March 31, 2017, the Company’s corporate structure was as follows:
7
Note 2 - SIGNIFICANT ACCOUNTING POLICIES
Basis of Presentation
This summary of the Company’s significant accounting policies is presented to assist in understanding the Company’s financial statements. The financial statements and notes are representations of the Company’s management, which is responsible for their integrity and objectivity. These accounting policies conform to generally accepted accounting principles in the United States ("US GAAP") and have been consistently applied in the preparation of the unaudited condensed consolidated financial statements.
The accompanying unaudited condensed consolidated financial statements have been prepared by Company without audit pursuant to the rules and regulations of the U.S. Securities and Exchange Commission (“SEC”). Certain information and disclosures normally included in financial statements prepared in accordance with US GAAP have been condensed or omitted as allowed by such rules and regulations, and management believes that the disclosures are sufficient so that the information presented is not misleading. These unaudited condensed consolidated financial statements should be read in conjunction with the audited financial statements and notes thereto included in the Company’s Annual Report on Form 10-K for the year ended June 30, 2016. These unaudited condensed consolidated financial statements include all adjustments which in the opinion of management are necessary for a fair presentation of financial position and results of operations. All such adjustments are of a normal and recurring nature. The results of operations for the nine months ended March 31, 2017, may not be indicative of results that may be expected for the year ended June 30, 2017.
Principles of Consolidation
The accompanying unaudited condensed consolidated financial statements include China Health US and its four subsidiary companies, including China Health HK, Humankind, Huimeijia, and HLJ Huimeijia. All significant intercompany balances and transactions have been eliminated in consolidation and combination.
On November 22, 2013, China Health US, through its wholly owned subsidiary Humankind, completed the acquisition of HLJ Huimeijia. HLJ Huimeijia and Humankind were and are under the common control of Mr. Xin Sun, the CEO of China Health US, before and after the date of transfer. Humankind’s accounting policy adopted the guidance in ASC 805-50-05-5 for the transfer of net assets between entities under common control to apply an accounting method similar to the pooling-of-interests method. Under this method, the financial statements of Humankind shall report results of operations for the period in which the transfer occurs as though the transfer of net assets had occurred at the beginning of the period. Results of operations for that period will thus comprise both those of the previously separate entities combined from the beginning of the period to the date the transfer is completed and those of the combined operations from that date to the end of the period. Similarly, Humankind shall present statements of financial position and other financial information as of the beginning of the period as though the assets and liabilities had been transferred at that date. Financial statements and financial information of Humankind presented for prior years shall also be retrospectively adjusted to furnish comparative information.
Reclassifications
Certain prior year balances were reclassified to conform to the current period's presentation in order to reflect Huimeijia’s business as discontinued operations. None of these reclassifications had an impact on reported financial position or cash flows for any of the periods presented.
8
Segment Reporting
FASB Accounting Standard Codification (“ASC”) Topic 280, “Segment Reporting,” established standards for reporting information about operating segments on a basis consistent with a company's internal organizational structure as well as information about geographical areas, business segments and major customers in financial statements for details on the Company's business segments. The Company has three reportable operating segments: Humankind, HLJ Huimeijia and “Others”. The segments are grouped based on the types of products provided.
Fair Value of Financial Instruments
The provisions of FASB ASC Topic 820 accounting guidance that apply to the Company require all entities to disclose the fair value of financial instruments, both assets and liabilities recognized and not recognized on balance sheets, for which it is practicable to estimate fair value, and defines the fair value of a financial instrument as the amount at which the instrument could be exchanged in a current transaction between willing parties.
Fair Value Measurements
FASB ASC Topic 820, “Fair Value Measurements and Disclosures,” clarifies the definition of fair value for financial reporting, establishes a framework for measuring fair value, and requires additional disclosures about the use of fair value measurements.
Various inputs are considered when determining the fair value of the Company’s debt. The inputs or methodologies used for valuing securities are not necessarily an indication of the risk associated with investing in these securities. These inputs are summarized in the three broad levels listed below.
Level 1 – observable market inputs that are unadjusted quoted prices for identical assets or liabilities in active markets.
Level 2 – other significant observable inputs (including quoted prices for similar securities, interest rates, credit risk, etc.).
Level 3 – significant unobservable inputs (including the Company’s own assumptions in determining the fair value of investments).
The carrying value of financial assets and liabilities recorded at fair value is measured on a recurring or nonrecurring basis. Financial assets and liabilities measured on a non-recurring basis are those that are adjusted to fair value when a significant event occurs. The Company had no financial assets or liabilities carried and measured on a nonrecurring basis during the reporting periods. Financial assets and liabilities measured on a recurring basis are those that are adjusted to fair value each time a financial statement is prepared. The Company had no financial assets or liabilities carried and measured on a recurring basis during the reporting periods.
The availability of inputs observable in the market varies from instrument to instrument and depends on a variety of factors including the type of instrument, whether the instrument is actively traded, and other characteristics particular to the transaction. For many financial instruments, pricing inputs are readily observable in the market, the valuation methodology used is widely accepted by market participants, and the valuation does not require significant management discretion. For other financial instruments, pricing inputs are less observable in the market and may require management judgment.
Translation of Foreign Currencies
Humankind, Huimeijia and HLJ Huimeijia maintain their books and accounting records in the PRC currency “Renminbi” (“RMB”), which has been determined to be the Company’s functional currency. Transactions denominated in currencies other than RMB are translated into RMB at the exchange rates prevailing on the dates of the transactions, as quoted by the Federal Reserve Board. Foreign currency exchange gains and losses resulting from these transactions are included in operations.
9
Humankind, Huimeijia and HLJ Huimeijia’s financial statements are translated into the reporting currency, the United States Dollar (“USD”). Assets and liabilities of the above entities are translated at the prevailing exchange rate at each reporting period end date. Contributed capital accounts are translated using the historical rate of exchange when capital is injected. Income and expense accounts are translated at the average rate of exchange during the reporting period. Translation adjustments resulting from the translation of these financial statements are reflected as accumulated other comprehensive income in shareholders’ equity and non-controlling interests.
Statement of Cash Flows
In accordance with Statement FASB ASC Topic 230, “Statement of Cash Flows,” cash flow from the Company's operations is calculated based upon the local currencies and translated to the reporting currency using an average foreign exchange rate for the reporting period. As a result, amounts related to assets and liabilities reported in the statement of cash flows will not necessarily agree with changes in the corresponding balances on the balance sheet.
Use of Estimates and Assumptions
The preparation of financial statements in conformity with US GAAP requires management to make estimates and judgments that affect the reported amounts of assets and liabilities, disclosure of contingent assets and liabilities on the date of the financial statements and the reported amounts of revenues and expenses during the reporting period. The Company bases its estimates and judgments on historical experience and on various other assumptions and information that are believed to be reasonable under the circumstances. Estimates and assumptions of future events and their effects cannot be perceived with certainty and, accordingly, these estimates may change as new events occur, as more experience is acquired, as additional information is obtained and as the Company’s operating environment changes. Significant estimates and assumptions by management include, among others; useful lives of long-lived assets and intangible assets, valuation of inventory, accounts receivable and notes receivable, impairment analysis of long-lived assets, construction in progress, intangible assets and deferred taxes. While the Company believes that the estimates and assumptions used in the preparation of the financial statements are appropriate, actual results could differ from those estimates. Estimates and assumptions are periodically reviewed and the effects of revisions are reflected in the financial statements in the period they are determined to be necessary.
Cash and Cash Equivalents
Cash and cash equivalents include cash on hand, deposits in banks with maturities of three months or less, and all highly liquid investments which are unrestricted as to withdrawal or use, and which have original maturities of three months or less at the time of purchase.
As of March 31, 2017 and June 30, 2016, the Company’s uninsured bank balances were mainly maintained at financial institutions located in the PRC and Hong Kong. The uninsured bank balances of continuing operations were $20,799,235 and $29,783,152 as of March 31, 2017 and June 30, 2016, respectively. The uninsured bank balances of discontinued operations were $0 and $8,578 as of March 31, 2017 and June 30, 2016, respectively. The Company had no insured bank balances as of March 31, 2017 and June 30, 2016, respectively.
Short-term investments, held-to-maturity investments
The Company’s held-to-maturity investments consist of financial products purchased from investment guarantee corporations. The Company’s short term held-to-maturity investments are classified as short-term investments on the consolidated balance sheets based on their contractual maturity dates which are less than one year and are stated at their amortized costs.
The Company reviews its investments for other-than-temporary impairment (“OTTI”) based on the specific identification method. The Company considers available quantitative and qualitative evidence in evaluating potential impairment of its investments. If the cost of an investment exceeds the investment’s fair value, the Company considers, among other factors, general market conditions, expected future performance of the investees, the duration and the extent to which the fair value of the investment is less than the cost, and the Company’s intent and ability to hold the investment. OTTI is recognized as a loss in the income statement.
10
Accounts Receivable
Accounts receivable are recorded at the invoiced amount and do not bear interest. The Company extends unsecured credit to its customers in the ordinary course of business but mitigates the associated risks by performing credit checks and actively pursuing past due accounts. An allowance for doubtful accounts is established and determined based on management’s assessment of known requirements, aging of receivables, payment and bad debt history, the customer’s current credit worthiness, changes in customer payment patterns and the economic environment. From November 1, 2013, the Company changed its credit policy by offering ninety (90) day payment terms for sales agents, whereas the payment terms for sales agents before November 1, 2013 were thirty (30) days. As of March 31, 2017 and June 30, 2016, the balances of accounts receivable from the continuing operations of the Company were $1,420,465 and $1,197,260, respectively. As of March 31, 2017 and June 30, 2016, the balances of accounts receivable from discontinued operations were both nil. The Company determines the allowance based on aging data, historical collection experience, customer specific facts and economic conditions. Account balances are charged off against the allowance after all means of collection have been exhausted and the potential for recovery is considered remote. The Company evaluated the nature of all accounts receivable then provided allowance for doubtful accounts. The Company has determined that an allowance of $49,128 and $52,129 from the continuing operations of the Company was appropriate as of March 31, 2017 and June 30, 2016, respectively. The Company has determined that an allowance of nil from discontinued operations was appropriate as of March 31, 2017 and June 30, 2016.
Advances to Suppliers
The Company periodically makes advances to certain vendors for purchases of raw materials, or to service providers for services relating to construction plans for its plants, equipment and production lines for GMP upgrading, and records these payments as advances to suppliers. As of March 31, 2017 and June 30, 2016, advances to suppliers held for continuing operations amounted to $484,194 and $154,430, respectively. As of March 31, 2017 and June 30, 2016, advance to suppliers held for discontinued operations amounted to $0 and $558, respectively.
Inventory
Inventory consists of raw materials, work in progress, and finished goods or manufactured products.
Inventory is stated at lower of cost or market and consists of materials, labor and overhead. HLJ Huimeijia uses the weighted average method for inventory valuation. The other subsidiaries of the Company use the first-in, first-out (“FIFO”) method for inventory valuation. Overhead costs included in finished goods include direct labor costs and other costs directly applicable to the manufacturing process. The Company evaluates inventory for excess, slow moving, and obsolete inventory as well as inventory the value of which is in excess of its net realizable value. This evaluation includes analysis of sales levels by product and projections of future demand. If future demand or market conditions are less favorable than the Company’s projections, a write-down of inventory may be required, and would be reflected in cost of goods sold in the period the revision is made. There was no inventory allowance held for continuing operations and discontinued operations provided for the nine months ended March 31, 2017 and 2016, respectively.
Impairment of Long-Lived Assets
The Company’s long-lived assets and other assets are reviewed for impairment in accordance with the guidance of the FASB ASC Topic 360-10, “Property, Plant, and Equipment,” and FASB ASC Topic 205, “Presentation of Financial Statements.” The Company tests for impairment losses on long-lived assets used in operations whenever events or changes in circumstances indicate that the carrying amount of the asset may not be recoverable. Recoverability of an asset to be held and used is measured by a comparison of the carrying amount of the asset to the future undiscounted cash flows expected to be generated by the asset. If such asset is considered to be impaired, the impairment to be recognized is measured by the amount by which the carrying amount of the asset exceeds its fair value. Impairment evaluations involve management’s estimates on asset useful lives and future cash flows. Actual useful lives and cash flows could be different from those estimated by management which could have a material effect on the Company’s reporting results and financial position. Fair value is determined through various valuation techniques including discounted cash flow models, quoted market values and third-party independent appraisals, as considered necessary. As of March 31, 2017 and June 30, 2016, the Company had not experienced impairment losses on its long-lived assets for either continuing or discontinued operations. However, there can be no assurances that demand for the Company’s products or services will continue, which could result in an impairment of long-lived assets in the future.
11
Property, Plants and Equipment
Property, plants and equipment are carried at the lower of cost or fair value. Maintenance, repairs and minor renewals are expensed as incurred, and major renewals and improvements that extend the lives or increase the capacity of plant assets are capitalized.
When assets are retired or disposed of, the cost and accumulated depreciation are removed from the accounts, and any resulting gains or losses are included in the results of operations in the reporting period of disposition.
Depreciation is calculated on a straight-line basis over the estimated useful life of the assets. The depreciable lives applied are:
| Buildings, Warehouses and Improvements | 20 to 30 years | |||
| Office Equipment | 3 to 7 years | |||
| Vehicles | 5 to15 years | |||
| Machinery and Equipment | 7 to 15 years |
Intangible Assets
The Company evaluates intangible assets in accordance with FASB ASC Topic 350, “Intangibles — Goodwill and Other.” Intangible assets deemed to have indefinite lives are not amortized, but are subject to annual impairment tests. If the assumptions and estimates used to allocate the purchase price are not correct, or if business conditions change, purchase price adjustments or future asset impairment charges could be required. The value of the Company’s intangible assets could be impacted by future adverse changes such as: (i) any future declines in the Company’s operating results, (ii) a decline in the valuation of technology, including the valuation of the Company’s common stock, (iii) a significant slowdown in the worldwide economy, or (iv) any failure to meet the performance projections included in the Company’s forecasts of future operating results. In accordance with FASB ASC Topic 350, the Company tests intangible assets for impairment on an annual basis or more frequently if the Company believes indicators of impairment exist. Impairment evaluations involve management estimates of asset useful lives and future cash flows. Significant management judgment is required in the forecasts of future operating results that are used in the evaluations. It is possible, however, that the plans and estimates used may be incorrect. If the Company’s actual results, or the plans and estimates used in future impairment analysis, are lower than the original estimates used to assess the recoverability of these assets, we could incur additional impairment charges in a future period. Based on such evaluations, there was no impairment recorded for intangible assets, held for both the continuing and discontinued operations, for the nine months ended March 31, 2017 and 2016, respectively.
Construction in Progress
Construction in progress represents the costs incurred in connection with the construction of buildings or new additions to the Company’s plant facilities. Costs classified as construction in progress include all costs of obtaining the asset and bringing it to the location and condition necessary for its intended use. No depreciation is provided for construction in progress until such time as the assets are completed and are placed into service.
12
The Company reviews the carrying value of construction in progress for impairment whenever events and circumstances indicate that the carrying value of an asset may not be recoverable from the estimated future cash flows expected to result from its use and eventual disposition. In cases where undiscounted expected future cash flows are less than the carrying value of the assets, an impairment loss is recognized equal to an amount by which the carrying value exceeds the fair value of the assets. The factors considered by management in performing this assessment include current operating results, trends and prospects, the manner in which the property is used, and the effects of obsolescence, demand, competition and other economic factors. Based on this assessment, there was no impairments recorded for construction in progress, for both continuing and discontinued operations, for the nine months ended March 31, 2017 and 2016, respectively.
Revenue Recognition
The Company recognizes revenue when it is both earned and realized or realizable. The Company’s policy is to recognize revenue when title to the product, ownership and risk of loss have transferred to the customer, persuasive evidence of an arrangement exists and collection of the sales proceeds is reasonably assured, all of which generally occur upon shipment of goods to customers. The majority of the Company’s revenue relates to the sale of inventory to customers, and revenue is recognized when title and the risks and rewards of ownership pass to the customer. Given the nature of the Company’s business and the applicable rules guiding revenue recognition, the Company’s revenue recognition practices do not contain estimates that materially affect the results of operations. The Company records revenue at the discounted selling price and allows its customers to return products for exchange or credit subject to certain limitations. A provision for such returns is recorded based upon historical experience. There has been no provision recorded for returns based upon historical experience, for both continuing and discontinued operations, for the nine months ended March 31, 2017 and 2016, respectively.
Cost of Goods Sold
Cost of goods sold consists primarily of the costs of raw materials, freight charges, direct labor, depreciation of plants and machinery, warehousing and overhead costs associated with the manufacturing process and commission expenses.
Income Taxes
The Company has adopted FASB ASC Topic 740, “Income Taxes,” which requires the recognition of deferred tax assets and liabilities for the expected future tax consequences of events that have been included in the financial statements or tax returns. Under this method, deferred income taxes are recognized for the tax consequences in future years of differences between the tax bases of assets and liabilities and their financial reporting amounts at each period end based on enacted tax laws and statutory tax rates applicable to the periods in which the differences are expected to affect taxable income. Valuation allowances are established when necessary to reduce deferred tax assets to the amount expected to be realized.
In July 2006, the FASB issued FIN 48(ASC 740-10), “Accounting for Uncertainty in Income Taxes — An Interpretation of FASB Statement No. 109 (ASC 740),” which requires income tax positions to meet a more-likely-than-not recognition threshold to be recognized in the financial statements. Under FIN 48(ASC 740-10), tax positions that previously failed to meet the more-likely-than-not threshold should be recognized in the first subsequent financial reporting period in which that threshold is met. Previously recognized tax positions that no longer meet the more-likely-than-not threshold should be derecognized in the first subsequent financial reporting period in which that threshold is no longer met.
As a result of the implementation of FIN 48 (ASC 740-10), the Company undertook a comprehensive review of its portfolio of tax positions in accordance with recognition standards established by FIN 48 (ASC 740-10). The Company recognized no material adjustments to liabilities or stockholders’ equity as a result of the implementation. The adoption of FIN 48 did not have a material impact on the Company’s financial statements.
13
The application of tax laws and regulations is subject to legal and factual interpretation, judgment and uncertainty. Tax laws and regulations themselves are subject to change as a result of changes in fiscal policy, changes in legislation, the evolution of regulations and court rulings. Therefore, the actual liability may be materially different from the Company’s estimates, which could result in the need to record additional tax liabilities or potentially reverse previously recorded tax liabilities or deferred tax asset valuation allowance.
Enterprise Income Tax
Under the Provisional Regulations of the PRC Concerning Income Tax on Enterprises promulgated by the PRC (the “EIT Law”), income tax is payable by enterprises at a rate of 25% of their taxable income.
Value Added Tax
The Provisional Regulations of the PRC Concerning Value Added Tax promulgated by the State Council came into effect on January 1, 1994. Under these regulations and the Implementing Rules of the Provisional Regulations of the PRC Concerning Value Added Tax, value added tax (“VAT”) is imposed on goods sold in, or imported into, the PRC and on processing, repair and replacement services provided within the PRC.
VAT payable in the PRC is charged on an aggregated basis at a rate of 13% or 17% (depending on the type of goods involved) on the full price collected for the goods sold or, in the case of taxable services provided, at a rate of 17% on the charges for the taxable services provided, but excluding, in respect of both goods and services, any amount paid in respect of VAT included in the price or charges, and less any deductible VAT already paid by the taxpayer on purchases of goods and services in the same financial year. As of March 31, 2017 and June 30, 2016, VAT payables from continuing operations of the Company were $201,088 and $183,813, respectively. As of March 31, 2017 and June 30, 2016, VAT payables were both nil for discontinued operations.
Sales-Related Taxes
Pursuant to the tax law and regulations of the PRC, the Company is obligated to pay 7% and 5% of the annual aggregate VAT paid by the Company as taxes for the purposes of maintaining and building cities and educational facilities, which fees are included as sales-related taxes. Sales-related taxes are recorded when sales revenue is recognized. Sales-related taxes from the continuing operations of the Company were $117,839 and $116,259 for the nine months ended March 31, 2017 and 2016, respectively. Sales-related taxes from the discontinued operations were both nil for the nine months ended March 31, 2017 and 2016.
Concentrations of Business and Credit Risks
All of the Company’s manufacturing takes place in the PRC. There can be no assurance that the Company will be able to successfully continue to manufacture its products and failure to do so would have a material adverse effect on the Company’s financial position, results of operations and cash flows. Also, the success of the Company’s operations is subject to numerous contingencies, some of which are beyond management’s control. These contingencies include general economic conditions, prices of raw materials, competition, governmental and political conditions, and changes in regulations. Since the Company is dependent on trade in the PRC, the Company is subject to various additional political, economic and other uncertainties. Among other risks, the Company’s operations will be subject to the risks of restrictions on transfer of funds, domestic customs, changing taxation policies, foreign exchange restrictions, and political and governmental regulations.
The Company operates in the PRC, which may give rise to significant foreign currency risks from fluctuations and the degree of volatility of foreign exchange rates between U.S. dollars and RMB. The results of operations denominated in foreign currency are translated at the average rate of exchange during the reporting periods.
14
Earnings Per Share
Basic earnings per common share are computed by dividing net earnings applicable to common shareholders by the weighted-average number of common shares outstanding during the period. When applicable, diluted earnings per common share is determined using the weighted-average number of common shares outstanding during the period, adjusted for the dilutive effect of common stock equivalents, consisting of shares that might be issued upon exercise of common stock options and warrants. For the nine months ended March 31, 2017 and 2016, the Company had no potential dilutive common stock equivalents outstanding.
Potential common shares issued are calculated using the treasury stock method, which recognizes the use of proceeds that could be obtained upon the exercise of options and warrants in computing diluted earnings per share. It assumes that any proceeds would be used to purchase common stock at the average market price of the common stock during the period.
FASB ASC Topic 260, “Earnings Per Share,” requires a reconciliation of the numerator and denominator of the basic and diluted earnings per share (EPS) computations.
Recent Accounting Pronouncements
In May 2014, the FASB issued Accounting Standards Update No. 2014-09, Revenue from Contracts with Customers: Topic 606 (ASU 2014-09), to supersede nearly all existing revenue recognition guidance under U.S. GAAP. The core principle of ASU 2014-09 is to recognize revenues when promised goods or services are transferred to customers in an amount that reflects the consideration that is expected to be received for those goods or services. ASU 2014-09 defines a five step process to achieve this core principle and, in doing so, it is possible more judgment and estimates may be required within the revenue recognition process than are required under existing U.S. GAAP, including identifying performance obligations in the contract, estimating the amount of variable consideration to include in the transaction price and allocating the transaction price to each separate performance obligation. ASU 2014-09 is effective for us in our first quarter of fiscal 2018 using either of two methods: (i) retrospective to each prior reporting period presented with the option to elect certain practical expedients as defined within ASU 2014-09 (full retrospective method); or (ii) retrospective with the cumulative effect of initially applying ASU 2014-09 recognized at the date of initial application and providing certain additional disclosures as defined per ASU 2014-09 (modified retrospective method). We are currently assessing the materiality of the impact to our consolidated financial statements, and have not yet selected a transition approach.
In August 2016, the FASB issued ASU No. 2016-15, Statement of Cash Flows (Topic 230): “Classification of Certain Cash Receipts and Cash Payments”, to address diversity in how certain cash receipts and cash payments are presented and classified in the statement of cash flows. The amendments provide guidance on the following nine specific cash flow issues: (1) Debt Prepayment or Debt Extinguishment Costs; (2) Settlement of Zero-Coupon Debt Instruments or Other Debt Instruments with Coupon Interest Rates That Are Insignificant in Relation to the Effective Interest Rate of the Borrowing; (3) Contingent Consideration Payments Made after a Business Combination; (4)Proceeds from the Settlement of Insurance Claims; (5) Proceeds from the Settlement of Corporate-Owned Life Insurance Policies, including Bank-Owned; (6) Life Insurance Policies; (7) Distributions Received from Equity Method Investees; (8) Beneficial Interests in Securitization Transactions; and (9) Separately Identifiable Cash Flows and Application of the Predominance Principle. The amendments are effective for public business entities for fiscal years beginning after December 15, 2017, and interim periods within those fiscal years. For all other entities, the amendments are effective for fiscal years beginning after December 15, 2018, and interim periods within fiscal years beginning after December 15, 2019. Early adoption is permitted, including adoption in an interim period. The amendments should be applied using a retrospective transition method to each period presented. If it is impracticable to apply the amendments retrospectively for some of the issues, the amendments for those issues would be applied prospectively as of the earliest date practicable. The Company is currently evaluating the impact of this new standard on its consolidated financial statements and related disclosures.
15
In October 2016, the FASB issued ASU No. 2016-16, Income Taxes (Topic 740): “Intra-Entity Transfers of Assets Other Than Inventory”. The amendments require an entity to recognize the income tax consequences of an intra-entity transfer of an asset other than inventory when the transfer occurs and remove the exception to postpone recognition until the asset has been sold to an outside party. The amendments are effective for public business entities for annual reporting periods beginning after December 15, 2017, including interim reporting periods within those annual reporting periods. For all other entities, the amendments are effective for annual reporting periods beginning after December 15, 2018, and interim reporting periods within annual reporting periods beginning after December 15, 2019. Early adoption is permitted. The Company is currently evaluating the impact of this new standard on its consolidated financial statements and related disclosures.
Also in October 2016, the FASB issued ASU No. 2016-17, Consolidation (Topic 810): “Interest Held through Related Parties That Are under Common Control”, to provide guidance on the evaluation of whether a reporting entity is the primary beneficiary of a variable interest entity, or VIE by amending how a reporting entity, that is a single decision maker of a VIE, treats indirect interests in that entity held through related parties that are under common control. The amendments are effective for public business entities for fiscal years beginning after December 15, 2016, including interim periods within those fiscal years. For all other entities, the amendments are effective for fiscal years beginning after December 15, 2016, and interim periods within fiscal years beginning after December 15, 2017. Early adoption is permitted, including adoption in an interim period. The Company is currently evaluating the impact of this new standard on its consolidated financial statements and related disclosures.
In November 2016, the FASB issued ASU No. 2016-18, Statement of Cash Flows (Topic 230): “Restricted Cash”(“ASU 2016-18”). ASU 2016-18 requires that a statement of cash flows explain the change during the period in the total of cash, cash equivalents, and amounts generally described as restricted cash or restricted cash equivalents. ASU 2016-18 will become effective for us beginning April 1, 2018, or fiscal 2019. ASU 2016-18 is required to be applied retrospectively. Upon adoption, amounts described as restricted cash will be included with cash and cash equivalents when reconciling the beginning-of-period and end-of-period amounts shown on the statements of cash flows.
In January 2017, the FASB issued Accounting Standards Update No. 2017-01, Business Combinations (Topic 805): Clarifying the Definition of a Business (ASU 2017-01), which revises the definition of a business and provides new guidance in evaluating when a set of transferred assets and activities is a business. This guidance will be effective for us in the first quarter of 2018 on a prospective basis, and early adoption is permitted. We do not expect the standard to have a material impact on our consolidated financial statements.
NOTE 3 - ASSETS SALE
On December 24, 2014, Humankind entered into a stock transfer agreement (the “Original Agreement”) with Xiuzheng Pharmaceutical Group Co., Ltd. a company incorporated under the laws of the PRC and located in Jilin province (“Xiuzheng Pharmacy” or the “Buyer”), Mr. Xin Sun, the CEO of Humankind, and Huimeijia. Pursuant to the Original Agreement, Humankind and Mr. Xin Sun (the “Equity Holders”) would sell their respective equity interests in Huimeijia to Xiuzheng Pharmacy. The transfer of 100% of the equity interests of Huimeijia to the Buyer was in exchange for total cash consideration of RMB 8,000,000 (approximately $1,306,186) to the Equity Holders.
On February 9, 2015, the four parties entered into a supplementary agreement (the “Supplementary Agreement”) to modify the terms of the Original Agreement, pursuant to which the Equity Holders and Huimeijia (collectively the “Asset Transferors”) would sell only the 19 drug approval numbers (including the tablet, capsule, powder, mixture, oral liquid, syrup and oral solution under the 19 approval numbers; licenses including the original copies of Business License, Organization Code Certificate, Tax Registration Certificate, Drug Production Permit and GMP Certificate, and other documents and original copies related to the production and operation of the 19 drugs) (the “Assets”) to Xiuzheng Pharmacy. The Equity Holders would have retained their equity interests in Huimeijia, but would have pledged such equity interests to Xiuzheng Pharmacy until the Assets were transferred, at which time the cash consideration would have been paid by the Buyer. Total cash consideration would have been the same as under the Original Agreement, i.e., RMB 8,000,000 (approximately $1,306,186) to the Asset Transferors. In the event that the Assets had failed to be transferred to the Buyer due to the fault of the Asset Transferors, the paid consideration would have been returned to the Buyer with interest accrued. If the failure of the transfer of the Assets were a result of changes in government policy or force majeure, the paid cash consideration would have been returned to the Buyer but without any interest.
16
On October 12, 2016, the four parties agreed to rescind the Supplementary Agreement and entered into a new supplementary agreement (the “Agreement”), pursuant to which the four parties agreed to execute the transfer of the equity interests based on the Original Agreement and the Equity Holders agreed to sell their respective equity interests in Huimeijia to Xiuzheng Pharmacy. The transfer of 100% of the equity interests of Huimeijia to the Buyer was for total cash consideration of RMB 8,000,000 (approximately $1,306,186) (the “Purchase Price”) to the Equity Holders. 40% of the Purchase Price was due within 10 business days after the signing of the Agreement; 40% of the Purchase Price was due within 10 business days after the completion of the changes in business registration described in the Original Agreement and Xiuzheng Pharmacy obtaining documents evidencing its ownership on Huimeijia; 15% of the Purchase Price is due within 10 business days after the transfer of all of the Assets is approved by Heilongjiang FDA; and 5% of the Purchase Price is due within 10 business days after all of the Drugs have been transferred to Xiuzheng Pharmacy or its designee and Humankind and Mr. Xin Sun have instructed Xiuzheng Pharmacy to complete three-batches production of all forms of the drugs included in the Drugs. As of the date of this report, 80% of the Purchase Price has been paid, the Company has completed changes in its business registration, and Xiuzheng Pharmacy has obtained a business license issued by the local State Administration of Industry and Commerce in Harbin (“Harbin SAIC”) to Huimeijia, in which the ownership of Huimeijia has been recorded as held by Xiuzheng Pharmacy, with Harbin SAIC and the legal representative (a person that is authorized to take most of the corporate actions on behalf of a company under the corporate laws in China) of Huimeijia now persons appointed by the Buyer. The transfer of all the drug licenses to the Buyer and the payments of the remainder of the Purchase Price to the Equity Holders are pending.
The gain on the disposal of Huimeijia was $1,157,590.
NOTE 4 – SHORT TERM INVESTMENTS
Short term investments consist of held-to-maturity investments.
Held-to-maturity investments
Held-to-maturity investments consist of various financial products purchased from Harbin Hongxiang Investment Guarantee Co., Ltd., which are classified as held-to-maturity investments because the Company has the intent and ability to hold the investments to maturity. The maturity of these financial products is one year, with contractual maturity date of July 19, 2017, and estimated annual interest rates of approximately 10%. They are classified as short term investments on the consolidated balance sheets because their contractual maturity dates are less than one year. The repayments of principal of the financial products are not guaranteed by the Hongxiang Investment Guarantee Co., Ltd. from which the financial products were purchased. Historically, the Company has received principal and interest in full upon maturity of these investments. Harbin Hongxiang Investment Guarantee Co., Ltd., the financial institution that handled the Company’s short term investment with is a related party of the Company.
While these financial products are not publicly traded, the Company estimated that their fair value approximates their amortized costs considering their short term maturities and high credit quality. No OTTI loss was recognized for the periods ended March 31, 2017 and June 30, 2016.
NOTE 5 - ACCOUNTS RECEIVABLE
The Company’s accounts receivable held for continuing operations, were $1,371,337 and $1,145,131, net of allowances for doubtful accounts amounting to $49,128 and $52,129, as of March 31, 2017 and June 30, 2016, respectively. The Company’s accounts receivable held for discontinued operations were both nil, net of allowances for doubtful accounts amounting to nil as of March 31, 2017 and June 30, 2016, respectively.
17
NOTE 6 - INVENTORY
Inventory from the continuing operations of the Company consisted of following:
| March 31, | June 30, | |||||
| 2017 | 2016 | |||||
| Raw Materials | $ | 150,124 | $ | 122,569 | ||
| Supplies and Packing Materials | 140,002 | 130,472 | ||||
| Work-in-Progress | 133,597 | 118,233 | ||||
| Finished Goods | 39,977 | 48,713 | ||||
| Total | 463,700 | 419,987 | ||||
| Less: Inventory Held for Discontinued Operations | - | 5,203 | ||||
| Inventory Held for Continuing Operations | $ | 463,700 | $ | 414,784 |
For the nine months ended March 31, 2017 and 2016, the Company has not made provision for inventory from continued and discontinued operations in regards to excessive, slow moving or obsolete items.
NOTE 7 - CONSTRUCTION IN PROGRESS
Construction in progress from the continuing operations of the Company consisted of the following:
| March 31, | June 30, | |||||
| 2017 | 2016 | |||||
| Plant - HLJ Huimeijia | $ | 697,717 | $ | 670,051 | ||
| Plant and Production Lines - Huimeijia | - | 1,806 | ||||
| Total | 697,717 | 671,857 | ||||
| Less: Construction in Progress for Discontinued Operations | - | 1,806 | ||||
| Construction in Progress for Continuing Operations | $ | 697,717 | $ | 670,051 |
On April 6, 2012, HLJ Huimeijia entered into an agreement with a contractor for construction of the HLJ Huimeijia plant. The estimated total cost of construction was approximately $1.86 million (RMB 12,800,000), and construction was anticipated to be completed by December 2016. As of March 31, 2017, 38% of construction had been completed and $697,717 (RMB 4,802,522) has been recorded as costs of construction in progress.
NOTE 8 - PROPERTY, PLANTS AND EQUIPMENT
Property, plants and equipment from the continuing operations of the Company consisted of the following:
| March 31, | June 30, | |||||
| 2017 | 2016 | |||||
| Building, Warehouses and Improvements | $ | 3,301,863 | $ | 4,360,191 | ||
| Machinery and Equipment | 1,210,803 | 1,232,861 | ||||
| Office Equipment | 61,451 | 69,330 | ||||
| Vehicles | 209,757 | 204,457 | ||||
| Others | 908,008 | - | ||||
| Less: Accumulated Depreciation | (2,149,873 | ) | (1,998,278 | ) | ||
| Total | 3,542,009 | 3,868,561 | ||||
| Less: Property and Equipment, net, Held for Discontinued Operations | - | 1,796 | ||||
| Property and Equipment, net, held for continuing operations | $ | 3,542,009 | $ | 3,866,765 |
18
Depreciation expenses from the continuing operations of the Company was $1,375,864 and $173,033 for the nine months ended March 31, 2017 and 2016, respectively. Depreciation expenses from discontinued operations was nil and $389 for the nine months ended March 31, 2017 and 2016, respectively. Depreciation expenses charged to operations from the continuing operations of the Company was $332,558 and $68,303 for the nine months ended March 31, 2017 and 2016, respectively. Depreciation expenses charged to cost of goods sold from the continuing operations of the Company was $1,043,307 and $104,730 for the nine months ended March 31, 2017 and 2016, respectively. Depreciation expenses charged to operations from discontinued operations was nil and $389 for the nine months ended March 31, 2017 and 2016, respectively. Depreciation expenses charged to cost of goods sold from discontinued operations was nil for each of the nine month periods ended March 31, 2017 and 2016, respectively.
As of March 31, 2017, a building owned by HLJ Huimeijia with a book value of $1,587,589 has been mortgaged in connection with a working capital loan in the principal amount of $1,452,813 (RMB 10,000,000). As of June 30, 2016, a building owned by HLJ Huimeijia with a book value of $1,676,627 has been mortgaged in connection with a working capital loan in the principal amount of $1,504,687 (RMB 10,000,000).
NOTE 9 - INTANGIBLE ASSETS
The following is a summary of intangible assets from the continuing operations of the Company:
| March 31, 2017 | June 30, 2016 | |||||
| Land Use Rights – Humankind | $ | 920,790 | $ | 953,670 | ||
| Health Supplement Product Patents – Humankind | 4,358,438 | 4,514,061 | ||||
| Pharmaceutical Patents - HLJ Huimeijia | 130,170 | 134,817 | ||||
| Land Use Rights - HLJ Huimeijia | 629,807 | 652,295 | ||||
| Less: Accumulated Amortization | (2,334,588 | ) | (2,063,784 | ) | ||
| Total | 3,704,617 | 4,191,059 | ||||
| Less: Intangible Assets, net, Held for Discontinued Operations | - | - | ||||
| Intangible Assets, net, Held for Continuing Operations | $ | 3,704,617 | $ | 4,191,059 |
All land in the PRC belongs to the government of the PRC. Enterprises and individuals can pay the PRC government a fee to obtain the right to use a piece of land for commercial purposes or residential purposes for an initial period of 50 years or 70 years, respectively. These land use rights can be sold, purchased, and exchanged in the market. The successor owner of the land use right will have the right to use the land for the time remaining on the initial period.
Amortization expenses from continuing operations of the Company was $124,093 and $264,117 for the nine months ended March 31, 2017 and 2016, respectively. Amortization expenses from discontinued operations was nil for each of the nine month periods ended March 31, 2017 and 2016.
As of March 31, 2017, HLJ Huimeijia’s land use rights with a book value of $629,807 have been mortgaged in connection with a working capital loan in the principal amount of $1,452,813 (RMB 10,000,000). As of June 30, 2016, HLJ Huimeijia’s land use rights with a book value of $652,295 have been mortgaged in connection with a working capital loan in the principal amount of $1,504,687 (RMB 10,000,000).
NOTE 10 - SHORT-TERM LOAN
On November 12, 2015, HLJ Huimeijia entered into a short-term loan agreement with a bank for a working capital loan in the principal amount of RMB 10,000,000, at an interest rate of 5.66% from November 12, 2015 to November 10, 2016. The loan was secured by land use rights and a building owned by HLJ Huimeijia, with a maturity date of November 10, 2016.
19
On November 17, 2016, the agreement was renewed with an interest rate of 6.09% with a maturity date of November 16, 2017.
As of March 31, 2017 and June 30, 2016, the Company’s short-term loans from its continuing operations was $1,452,813 and $1,504,687, respectively. As of March 31, 2017 and June 30, 2016, the Company’s short-term loans from the discontinued operations was both nil.
Interest expenses from the continuing operations of the Company were $64,867 and $58,479 for the nine months ended March 31, 2017 and 2016, respectively. Interest expenses from discontinued operations were nil for each of the nine month periods ended March 31, 2017 and 2016, respectively.
NOTE 11 - RELATED PARTY DEBTS
Related party debts, which represent temporary short-term loans from Mr. Xin Sun and Mr. Kai Sun, consisted of the following:
| March 31, 2017 | June 30, 2016 | |||||
| Mr. Xin Sun | $ | 3,386,534 | $ | 2,678,220 | ||
| Mr. Kai Sun | 33,973 | 35,186 | ||||
| Total | 3,420,506 | 2,713,406 | ||||
| Less: Related Party Debts, Held for Discontinued Operations | - | - | ||||
| Related Party Debts, Held for Continuing Operations | $ | 3,420,506 | $ | 2,713,406 |
These loans are unsecured and non-interest bearing and have no fixed terms of repayment; therefore, they are deemed payable on demand. Mr. Kai Sun is a PRC citizen and a family member of Mr. Xin Sun, the CEO of the Company.
NOTE 12 - INCOME TAXES
(a) Corporate income taxes United States
China Health US was organized in the United States. China Health US had no taxable income for US income tax purposes for the nine months ended March 31, 2017 and 2016, respectively. As of March 31, 2017, China Health US had a net operating loss carry forward for United States income taxes. Net operating loss carry forwards are available to reduce future years’ taxable income. Management believes that the realization of the benefits from these losses appears uncertain due to the Company’s operating history and the continued losses of its US entity. Accordingly, the Company has provided a 100% valuation allowance on the deferred tax asset to reduce the asset to zero. There were no changes in the valuation allowance for the nine months ended March 31, 2017 and 2016. Management reviews this valuation allowance periodically and makes adjustments accordingly.
Hong Kong
China Health HK was incorporated in Hong Kong and is subject to Hong Kong taxation on its activities conducted in Hong Kong and income arising in or derived from Hong Kong. No provision for income taxes have been made because China Health HK had no taxable income in Hong Kong.
People’s Republic of China
Under the EIT Law, the standard EIT rate is 25%. The PRC subsidiaries of the Company are subject to PRC income taxes on an entity basis on income arising in or derived from the tax jurisdiction in which they operate.
The provision for income taxes from the continuing operations of the Company consisted of the following for the three and nine months ended March 31, 2017 and 2016:
20
| For the Three Months | For the Nine Months | |||||||||||
| Ended | Ended | |||||||||||
| March 31 | March 31 | |||||||||||
| 2017 | 2016 | 2017 | 2016 | |||||||||
| Current provision: | ||||||||||||
| USA | $ | - | $ | - | $ | - | $ | - | ||||
| PRC | 189,876 | 35,077 | 683,526 | 105,960 | ||||||||
| Total current provision | 189,876 | 35,077 | 683,526 | 105,960 | ||||||||
| Deferred provision: | ||||||||||||
| USA | - | - | - | - | ||||||||
| PRC | - | - | - | - | ||||||||
| Total deferred provision | - | - | - | - | ||||||||
| Total provision for income taxes | 189,876 | 35,077 | 683,526 | 105,960 | ||||||||
| Less: Provision for income taxes, held for discontinued operations | - | - | - | - | ||||||||
| Provision for income taxes, held for continuing operations | $ | 189,876 | $ | 35,077 | $ | 683,526 | $ | 105,960 | ||||
Significant components of deferred tax assets from the continuing operations of the Company were as follows:
| March 31, | June 30, | |||||
| 2017 | 2016 | |||||
| Deferred tax assets | ||||||
| Net operating loss carry forward | $ | 131,773 | $ | 118,259 | ||
| Allowances for doubtful accounts | - | - | ||||
| Valuation allowance | (131,773 | ) | (118,259 | ) | ||
| Deferred tax assets, net | - | - | ||||
| Less: Deferred tax assets, net, held for discontinued operations | - | - | ||||
| Deferred tax assets, net, held for continuing operations | $ | - | $ | - |
As of March 31, 2017 and June 30, 2016, the Company accrued a 100% valuation allowance on its deferred tax assets based on the assessment on the probability of future reversion.
(b) Uncertain tax positions
There were no unrecognized tax benefits as of March 31, 2017 and June 30, 2016, respectively. Management does not anticipate any potential future adjustments in the next twelve months which would result in a material change to its tax positions. For the nine months ended March 31, 2017 and 2016, the Company did not incur any interest or penalties arising from its tax payments.
NOTE 13 - COMMITMENTS AND CONTINGENCIES
The Company’s assets are located in the PRC and revenues are derived from operations in the PRC.
In terms of industry regulations and policies, the economy of the PRC has been transitioning from a planned economy to market oriented economy. Although in recent years the PRC government has implemented measures emphasizing the utilization of market forces for economic reforms, the reduction of state ownership of productive assets and the establishment of sound corporate governance in business enterprises, a substantial portion of productive assets in the PRC is still owned by the PRC government. For example, all land is state owned and leased to business entities or individuals through the PRC government’s granting of land use rights. The granting process is typically based on government policies at the time of granting and can be lengthy and complex. This process may adversely affect the Company’s future manufacturing expansions. The PRC government also exercises significant control over the PRC’s economic growth through the allocation of resources and providing preferential treatment to particular industries or companies. Uncertainties may arise with changing of governmental policies and measures.
21
The Company faces a number of risks and challenges not typically associated with companies in North America or Western Europe, because its assets exist solely in the PRC, and its revenues are derived from its operations therein. The PRC is a developing country with an early stage market economic system, overshadowed by the state. Its political and economic systems are very different from the more developed countries and are in a state of change. The PRC also faces many social, economic and political challenges that may produce major shocks, instabilities and even crises, in both its domestic arena and in its relationships with other countries, including the United States. Such shocks, instabilities and crises may in turn significantly and negatively affect the Company’s performance.
The Company had no rental commitments as of March 31, 2017.
NOTE 14 - MAJOR SUPPLIERS AND CUSTOMERS
For the nine months ended March 31, 2017, the Company had two suppliers that in the aggregate accounted for 88% of the Company’s purchases for continuing operations, with each supplier accounting for 78% and 10%, respectively.
For the nine months ended March 31, 2016, the Company had one supplier that accounted for 79% of the Company’s purchases.
For the nine months ended March 31, 2017, the Company had six customers that in the aggregate accounted for 69% of the Company’s total sales for continuing operations, with each customer accounting for 15%, 13%, 12%, 11%, 10% and 8%, respectively.
For the nine months ended March 31, 2016, the Company had four customers that in the aggregate accounted for 43% of the Company’s total sales, with each customer accounting for 12%, 11%, 10% and 10%, respectively.
NOTE 15 - SEGMENT REPORTING
The Company is organized into three main business segments based on the types of products being provided to customers: HLJ Huimeijia, Humankind and “Others”. Each of the three operating segments referenced above has separate and distinct general ledgers. The chief operating decision maker (“CODM”) receives financial information, including information regarding revenue, gross margin, operating income, and net income from the various general ledger systems to make decisions about allocating resources and assessing performance; however, the principal measure of segment profitability or loss used by the CODM is net loss by segment. The discontinued Huimeijia business was included in the “Others” segment.
The following tables present summary information by segment for the three and nine months ended March 31, 2017 and 2016, respectively:
22
| For the Three Months Ended March 31, 2017 | For the Three Months Ended March 31, 2016 | |||||||||||||||||||||||
| Consolidated | Consolidated | |||||||||||||||||||||||
| from | from | |||||||||||||||||||||||
| HLJ | continuing | HLJ | continuing | |||||||||||||||||||||
| Huimeijia | Humankind | Others | operations | Huimeijia | Humankind | Others | operations | |||||||||||||||||
| Revenues | $ | - | $ | 1,338,886 | $ | - | $ | 1,338,886 | $ | 61,370 | $ | 1,615,903 | $ | - | $ | 1,677,273 | ||||||||
| Cost of revenues | - | 866,806 | - | 866,806 | 45,300 | 1,129,823 | - | 1,175,123 | ||||||||||||||||
| Gross profit | - | 472,080 | - | 472,080 | 16,070 | 486,080 | - | 502,150 | ||||||||||||||||
| Interest expense | 22,129 | - | 1 | 22,130 | 21,720 | - | - | 21,720 | ||||||||||||||||
| Depreciation and amortization | (22,357 | ) | 86,674 | - | 64,317 | 15,454 | 132,147 | 189 | 147,790 | |||||||||||||||
| Income tax | - | 189,876 | - | 189,876 | - | 35,077 | - | 35,077 | ||||||||||||||||
| Net income (loss) | (209,632 | ) | 285,052 | (130,385 | ) | (54,965 | ) | (107,278 | ) | 105,233 | (112,780 | ) | (114,825 | ) | ||||||||||
| Total capital expenditures | - | 39,968 | - | 39,968 | 78,096 | - | - | 78,096 | ||||||||||||||||
| Total assets | $ | 3,158,361 | $ | 37,483,078 | $ | 1,222 | $ | 40,642,661 | $ | 3,186,625 | $ | 37,013,289 | $ | 136,115 | $ | 40,336,029 | ||||||||
| For the Nine Months Ended March 31, 2017 | For the Nine Months Ended March 31, 2016 | |||||||||||||||||||||||
| Consolidated | Consolidated | |||||||||||||||||||||||
| from | from | |||||||||||||||||||||||
| HLJ | continuing | HLJ | continuing | |||||||||||||||||||||
| Huimeijia | Humankind | Others | operations | Huimeijia | Humankind | Others | operations | |||||||||||||||||
| Revenues | $ | 162 | $ | 4,410,388 | $ | - | $ | 4,410,550 | $ | 705,089 | $ | 5,653,903 | $ | - | $ | 6,358,992 | ||||||||
| Cost of revenues | 67 | 2,801,061 | - | 2,801,128 | 633,404 | 3,960,881 | - | 4,594,285 | ||||||||||||||||
| Gross profit | 95 | 1,609,327 | - | 1,609,422 | 71,685 | 1,693,022 | - | 1,764,707 | ||||||||||||||||
| Interest expense | 64,866 | - | 1 | 64,867 | 80,199 | - | - | 80,199 | ||||||||||||||||
| Depreciation and amortization | 41,808 | 414,843 | - | 456,651 | 43,679 | 435,952 | 578 | 480,209 | ||||||||||||||||
| Income tax | - | 683,526 | - | 683,526 | - | 105,960 | - | 105,960 | ||||||||||||||||
| Net income (loss) | (526,821 | ) | 1,766,002 | (414 | ) | 1,238,767 | (349,196 | ) | 317,882 | (225,856 | ) | (257,170 | ) | |||||||||||
| Total capital expenditures | - | 39,968 | - | 39,968 | 82,639 | 454 | - | 83,093 | ||||||||||||||||
| Total assets | $ | 3,158,361 | $ | 37,483,078 | $ | 1,222 | $ | 40,642,661 | $ | 3,186,625 | $ | 37,013,289 | $ | 136,115 | $ | 40,336,029 | ||||||||
23
| For the Three Months Ended | For the Three Months Ended | |||||||||||
| March 31, 2017 | March 31, 2016 | |||||||||||
| Consolidated from | Consolidated from | |||||||||||
| discontinued | discontinued | |||||||||||
| Huimeijia | operations | Huimeijia | operations | |||||||||
| Revenues | $ | - | $ | - | $ | - | $ | - | ||||
| Cost of revenues | - | - | - | - | ||||||||
| Gross profit | - | - | - | - | ||||||||
| Interest expenses | - | - | - | - | ||||||||
| Depreciation and amortization | - | - | 189 | 189 | ||||||||
| Income tax | - | - | - | - | ||||||||
| Net loss | 22 | - | (189 | ) | (189 | ) | ||||||
| Total capital expenditures | - | - | - | - | ||||||||
| Total assets | $ | 17,293 | $ | - | $ | 514,960 | $ | 514,960 | ||||
| For the Nine Months Ended | For the Nine Months Ended | |||||||||||
| March 31, 2017 | March 31, 2016 | |||||||||||
| Consolidated from | Consolidated from | |||||||||||
| discontinued | discontinued | |||||||||||
| Huimeijia | operations | Huimeijia | operations | |||||||||
| Revenues | $ | - | $ | - | $ | - | $ | - | ||||
| Cost of revenues | - | - | - | - | ||||||||
| Gross profit | - | - | - | - | ||||||||
| Interest expenses | - | - | - | - | ||||||||
| Depreciation and amortization | - | - | 578 | 578 | ||||||||
| Income tax | - | - | - | - | ||||||||
| Net loss | (28 | ) | - | (578 | ) | (578 | ) | |||||
| Total capital expenditures | - | - | - | - | ||||||||
| Total assets | $ | 17,293 | $ | - | $ | 514,960 | $ | 514,960 | ||||
NOTE 16 - DISCONTINUED OPERATIONS
In accordance with ASU No. 2014-08, “Reporting Discontinued Operations and Disclosures of Disposals of Components of an Entity”, a disposal of a component of an entity or a group of components of an entity is required to be reported as discontinued operations if the disposal represents a strategic shift that has (or will have) a major effect on an entity’s operations and financial results when the components of an entity meets the criteria in paragraph 205-20-45-1E to be classified as held for sale. When all of the criteria to be classified as held for sale are met, including management having the authority to approve the action and committing to a plan to sell the entity, the major current assets, other assets, current liabilities, and noncurrent liabilities are to be reported as components of total assets and liabilities separate from those balances of the continuing operations. At the same time, the results of all discontinued operations, less applicable income taxes (benefit), shall be reported as a component of net income (loss) separate from the net income (loss) of continued operations in accordance with ASC 205-20-45.
Reconciliation of the carrying amounts of major classes of assets and liabilities of discontinued operations classified as discontinued operations in the unaudited condensed consolidated balance sheets:
24
| March 31, 2017 | June 30, 2016 | |||||
| ASSETS | ||||||
| Current Assets | ||||||
| Cash and cash equivalents | $ | 8,254 | $ | 8,578 | ||
| Inventory | 5,024 | 5,203 | ||||
| Advances to suppliers | 538 | 558 | ||||
| Total Current Assets | 13,816 | 14,339 | ||||
| Property, plants and equipment, net | 1,734 | 1,796 | ||||
| Construction in progress | 1,743 | 1,806 | ||||
| Total Assets | $ | 3,477 | $ | 17,941 | ||
| LIABILITIES AND EQUITY | ||||||
| Current Liabilities: | $ | $ | ||||
| Accounts payable and accrued expenses | 538 | 558 | ||||
| Other payables | 15 | 16 | ||||
| Advances from customers | - | 481,500 | ||||
| Taxes payable | (59 | ) | (61 | ) | ||
| Total Current Liabilities | 494 | 482,013 | ||||
| Total Liabilities | $ | 494 | $ | 482,013 |
Reconciliation of the carrying amounts of major classes of net income (loss) from operations to be disposed of classified as discontinued operations in the unaudited condensed consolidated statements of operations and comprehensive income (loss):
| For the Three Months Ended | ||||||
| March 31, | ||||||
| 2017 | 2016 | |||||
| Operating Expenses | ||||||
| Depreciation and amortization expenses | $ | - | $ | 189 | ||
| Total Operating Expenses | - | 189 | ||||
| Income/(loss) from Operations | - | (189 | ) | |||
| Other income/(expenses), net | 22 | - | ||||
| Income/(loss) before Income Taxes | 22 | (189 | ) | |||
| Net Loss from Discontinued Operations | $ | 22 | $ | (189 | ) | |
| For the Nine Months Ended | ||||||
| March 31, | ||||||
| 2017 | 2016 | |||||
| Operating Expenses | ||||||
| Depreciation and amortization expenses | $ | - | $ | 578 | ||
| Total Operating Expenses | - | 578 | ||||
| Loss from Operations | - | (578 | ) | |||
| Other expenses, net | (28 | ) | ||||
| Loss before Income Taxes | (28 | ) | (578 | ) | ||
| Net Loss from Discontinued Operations | $ | (28 | ) | $ | (578 | ) |
25
NOTE 17 - SUBSEQUENT EVENTS
The Company has evaluated subsequent events from the balance sheet date through the date the financial statements were issued and determined that there are no additional items to disclose except the above mentioned matters.
| Item 2. | Management’s Discussion and Analysis of Financial Condition and Results of Operations. |
FORWARD LOOKING STATEMENTS
We make certain forward-looking statements in this report. Statements concerning our future operations, prospects, strategies, financial condition, future economic performance (including growth and earnings), demand for our services, and other statements of our plans, beliefs, or expectations, including the statements contained under this caption as well as under captions elsewhere in this document, are forward-looking statements. In some cases, these statements are identifiable through the use of words such as “anticipate,” “believe,” “estimate,” “expect,” “intend,” “plan,” “project,” “target,” “can,” “could,” “may,” “should,” “will,” “would,” and similar expressions. The forward-looking statements we make are not guarantees of future performance and are subject to various assumptions, risks, and other factors that could cause actual results to differ materially from those suggested by these forward-looking statements. These risks and uncertainties, together with the other risks described from time to time in reports and documents that we file with the SEC should be considered in evaluating forward-looking statements. Because such statements are subject to risks and uncertainties, actual results may differ materially from those expressed or implied by the forward-looking statements. Indeed, it is likely that some of our assumptions will prove to be incorrect. Our actual results and financial position will vary from those projected or implied in the forward-looking statements and the variances may be material. You are cautioned not to place undue reliance on such forward-looking statements, which reflect our view only as of the date of this report.
Important factors that could cause actual results to differ from those in the forward-looking statements include, without limitation, the following:
| • | the effect of political, economic, and market conditions and geopolitical events; | |
| • | legislative and regulatory changes that affect our business; | |
| • | the availability of funds and working capital; and | |
| • | the actions and initiatives of current and potential competitors. |
Except as required by applicable laws, regulations or rules, we do not undertake any responsibility to publicly release any revisions to these forward-looking statements to take into account events or circumstances that occur after the date of this report. Additionally, we do not undertake any responsibility to update you on the occurrence of any unanticipated events which may cause actual results to differ from those expressed or implied by any forward-looking statements.
The following discussion and analysis should be read in conjunction with our unaudited condensed consolidated financial statements and the related notes thereto as filed with the SEC and other financial information contained elsewhere in this report.
Except as otherwise indicated by the context, references in this report to “we,” “us,” “our,” “the Registrant,” “our Company,” or “the Company” are to China Health Industries Holdings, Inc., a Delaware corporation, China Health Industries Holdings Limited, a limited liability company incorporated under the laws of Hong Kong, its wholly owned subsidiary in China, Harbin Humankind Biology Technology Co. Limited (“Humankind”) and its indirect 99% owned subsidiary Harbin Huimeijia Medicine Company (“Huimeijia”), and indirect wholly owned subsidiary, Heilongjiang Huimeijia Pharmaceutical Co., Ltd. (“HLJ Huimeijia”). Unless the context otherwise requires, all references to (i) the “PRC” and “China” are to the People’s Republic of China; (ii) “U.S. dollar,” “$” and “US$” are to United States dollars; (iii) “RMB” are to Renminbi Yuan of China; (iv) “Securities Act” are to the Securities Act of 1933, as amended; and (v) “Exchange Act” are to the Securities Exchange Act of 1934, as amended.
26
Business Overview
Our principal business operations are conducted through our wholly-owned subsidiaries, Humankind and HLJ Huimeijia.
The Company owns a GMP-certified plant and production facilities and has the capacity to produce 21 different CFDA-approved medicines and 14 CFDA-approved health supplement products in soft capsule, hard capsule, tablet, granule and oral liquid forms. These products address the needs of some key sectors in China, including the feminine, geriatric and children’s markets.
HLJ Huimeijia's current GMP certificate expired at the end of December 2015. HLJ Huimeijia has applied for a new GMP certificate, which is expected to be obtained in July 2017. However, there is no assurance that we will obtain the new GMP certificate by such time. According to PRC law, HLJ Huimeijia must cease all production activities before receiving the new GMP certificate. The equipment and production line will begin reconstruction in the third quarter of the fiscal year 2016 and will continue through the third quarter of the fiscal year 2017 for the purpose of applying for the new GMP certificate. HLJ Huimeijia is currently in the final stages of reconstruction, which is expected to be completed in June 2017. Although HLJ Huimeijia could sell inventory produced prior to obtaining the new GMP certificate, management anticipates there will be no or very little revenue generated by HLJ Huimeijia after the expiration of the old GMP certificate.
On December 24, 2014, Humankind, Xiuzheng Pharmacy (the “Buyer”), Mr. Xin Sun and Huimeijia entered into a stock transfer agreement (the “Original Agreement”) pursuant to which Humankind and Mr. Xin Sun (the “Equity Holders”) were to sell their respective equity interests in Huimeijia to Xiuzheng Pharmacy. On February 9, 2015, the four parties entered into a supplementary agreement (the “Supplementary Agreement”) to modify the terms of the Original Agreement, pursuant to which the Equity Holders and Huimeijia would sell only the 19 drug approval numbers (the “Assets”) to Xiuzheng Pharmacy. The Equity Holders would have retained their equity interests in Huimeijia, but would have pledged such equity interests to Xiuzheng Pharmacy until the Assets were transferred. On October 12, 2016, the four parties agreed to rescind the Supplementary Agreement and entered into a new supplementary agreement, pursuant to which the four parties agreed to execute the transfer of the equity interests based on the Original Agreement and the Equity Holders agreed to sell their respective equity interests in Huimeijia to Xiuzheng Pharmacy for total cash consideration of RMB 8,000,000 (approximately $1,306,186) (the “Purchase Price”) to the Equity Holders. As of the date of this report, 80% of the Purchase Price has been paid, the Company has completed changes to its business registration, and Xiuzheng Pharmacy obtained a business license issued by the local State Administration of Industry and Commerce in Harbin (“Harbin SAIC”) for Huimeijia in which the ownership of Huimeijia has been recorded as held by Xiuzheng Pharmacy with Harbin SAIC, and the legal representative (a person that is authorized to take most of the corporate actions on behalf of a company under the corporate laws in China) of Huimeijia has now become a person appointed by the Buyer. The transfer of the Assets to the Buyer and the payment of the remainder of the Purchase Price to the Equity Holders are pending. As of March 31, 2017, the results of operations of Huimeijia’s business are reflected in the Company’s unaudited condensed consolidated financial statements as discontinued operations.
Our business is conducted through our sales agents and sales personnel. We sell our products directly to end customers through our own sales personnel as well as our sales agents, operating primarily in Anhui, Zhejiang, Shanghai, Beijing, Jiangsu, and Gansu, where most of our revenues are generated. Sales by agents in Anhui, Zhejiang, Shanghai, Beijing, Jiangsu, and Gansu provinces accounted for 15%, 13%, 12%, 11%, 10% and 8% of our total sales, respectively, for the nine months ended March 31, 2017. Although we do not currently sell our products online, we expect to do so in the future.
27
Results of Operations
Three months ended March 31, 2017 compared to the three months ended March 31, 2016
The following table summarizes the top lines of the results of our operations for the three months ended March 31, 2017 and 2016, respectively:
| March 31, | March 31, | |||||||||||
| 2017 | 2016 | Variance | % | |||||||||
| Revenues | $ | 1,338,886 | $ | 1,677,273 | $ | (338,387 | ) | -20.17% | ||||
| Humankind | 1,338,886 | 1,615,903 | (277,017 | ) | -17.14% | |||||||
| HLJ Huimeijia | - | 61,370 | (61,370 | ) | -100.00% | |||||||
| Cost of Goods Sold | $ | 866,806 | $ | 1,175,123 | $ | (308,317 | ) | -26.24% | ||||
| Humankind | 866,806 | 1,129,823 | (263,017 | ) | -23.28% | |||||||
| HLJ Huimeijia | - | 45,300 | (45,300 | ) | -100.00% | |||||||
| Gross Profit | $ | 472,080 | $ | 502,150 | $ | (30,070 | ) | -5.99% | ||||
| Humankind | 472,080 | 486,080 | (14,000 | ) | -2.88% | |||||||
| HLJ Huimeijia | - | 16,070 | (16,070 | ) | -100.00% |
Revenue
Total revenues from the Company’s continuing operations decreased by $338,387 or 20.17% for the three months ended March 31, 2017, as compared to the same period in 2016. The fall in revenues was primarily due to a decrease of $277,017 or 17.14% in Humankind’s revenues and a decrease of $61,370 or 100.00% in HLJ Huimeijia’s revenues for the three months ended March 31, 2017 as compared to the same period in 2016. The drop in Humankind’s sales revenues was primarily due to a reduction in the sales volume of Waterlilies Soft Capsules, which was caused by a decline in demand and our shift of marketing focus to Propolis and Black Ant Capsules. The significant decrease in HLJ Huimeijia’s the sales revenue was primarily due to the expiration of its GMP certificate on December 31, 2015. During the three months prior to such expiration, HLJ Huimeijia reduced its production and marketing operations as more attention was paid to the preparation of manufacturing and technical improvements in order to meet the requirements for obtaining a new GMP certificate. Since the third quarter of fiscal year 2016, HLJ Huimeijia has ceased all production activities, reconstructed its equipment and production line for the purpose of applying for the new GMP certificate, and continued to sell inventory produced before the expiration of the old GMP certificate.
Our total cost of sales from continuing operations of the Company decreased by $308,317 or 26.24% for the three months ended March 31, 2017 as compared to the same period in 2016. The plunge in the overall cost of sales was attributed to the drop of $263,017 or 23.28% in Humankind’s cost of sales and a decrease of $45,300 or 100.00% in HLJ Huimeijia’s cost of sales for the three months ended March 31, 2017 as compared to the same period in 2016. This decrease aligned with the decrease in sales volume of products sold by Humankind and HLJ Huimeijia.
Our gross margin from continuing operations of the Company decreased by $30,070 from $502,150 for the three months ended March 31, 2016 to $472,080 for the three months ended March 31, 2017. This change was consistent with the decrease in sales volume of products sold by Humankind and HLJ Huimeijia as discussed above.
Sales by Product Line
The following table summarizes a breakdown of our sales by major product line for the three months ended March 31, 2017 and 2016, respectively:
| March 31, 2017 | March 31, 2016 | |||||||||||||||||
| Quantity | % of | Quantity | % of | |||||||||||||||
| (Unit) | Sales US$ | Sales | (Unit) | Sales US$ | Sales | |||||||||||||
| Humankind | ||||||||||||||||||
| Waterlilies Soft Capsules (Sailuozhi) | 4,433 | $ | 261,406 | 19.52% | 15,076 | $ | 938,286 | 55.94% | ||||||||||
| Propolis and Black Ant Capsules | 40,669 | 1,077,480 | 80.48% | 24,145 | 677,613 | 40.40% | ||||||||||||
| HLJ Huimeijia | ||||||||||||||||||
| Musk Bone Strengthener Paste | - | - | 0.00% | 74,232 | 16,901 | 1.01% | ||||||||||||
| Musk Pain Relieving Paste | - | - | 0.00% | 9,036 | 1,186 | 0.07% | ||||||||||||
| Injury and Rheumatism relieving Paste | - | - | 0.00% | 90,635 | 23,344 | 1.39% | ||||||||||||
| Refining GouPi Cream | - | - | 0.00% | 26,195 | 5,416 | 0.32% | ||||||||||||
| Enema Glycerini | - | - | 0.00% | 133,140 | 11,336 | 0.68% | ||||||||||||
| UmguentumAcidiBoriciCamphoratum | - | - | 0.00% | 22,680 | 2,904 | 0.17% | ||||||||||||
| Indometacin and Furazolidone Suppositories | - | - | 0.00% | - | - | 0.00% | ||||||||||||
| Ge Hong Beriberi Water | - | - | 0.00% | 1,130 | 287 | 0.02% | ||||||||||||
| Total | $ | 1,338,886 | 100.00% | $ | 1,677,273 | 100.00% | ||||||||||||
28
Operating Expenses
The following table summarizes our operating expenses for the three months ended March 31, 2017 and 2016, respectively:
| March 31, 2017 | March 31, 2016 | Variance | % | |||||||||
| Operating Expenses | ||||||||||||
| Selling, general and administrative | $ | 486,427 | $ | 439,203 | $ | 47,224 | 10.75% | |||||
| Depreciation and amortization | 64,317 | 147,790 | (83,473 | ) | -56.48% | |||||||
| Total Operating Expenses | $ | 550,744 | $ | 586,993 | $ | (36,249 | ) | -6.18% |
Total operating expenses for the three months ended March 31, 2017 were $36,249 or 6.18% lower than in the corresponding period in 2016. The decline in operating expenses was primarily attributable to a decrease of $83,473 or 56.48% in depreciation and amortization expenses, offset by an increase of $47,224 or 10.75% in selling, general and administrative expenses. The increase in selling, general and administrative expenses was mainly due to the disposal of expired raw materials and products for the three months ended March 31, 2017 as compared to the same period in 2016. The decrease in depreciation and amortization expenses was primarily attributed to an unfavorable foreign exchange rate for the three months ended March 31, 2017, as compared to the same period in 2016.
Total operating expenses from discontinued operations decreased from $189 for the three months ended March 31, 2016 to nil for the corresponding period in 2017.
Interest Income and Interest Expense
Interest income from the Company’s continuing operations was $17,626 for the three months ended March 31, 2017, as compared to $17,667 for the three months ended March 31, 2016. This decrease of $41, or 0.23%, was mainly due to the decreased average balance of bank deposits compared with the same period of 2016.
Interest expense from the Company’s continuing operations was $22,130 for the three months ended March 31, 2017, an increase of $410 or 1.89%, as compared to $21,720 for the three months ended March 31, 2016. The increase of interest expense was mainly due to the increase in short-term loan interest rates from 5.66% to 6.09% in November 2016.
Investment Income
During the three months ended March 31, 2017, investment income from the Company’s continuing operations was $217,867, as compared to nil for the same period in 2016. On July 5, 2016, our Company entered into a one-year financial management agreement with the principal in the amount of $8,716,876 (RMB 60,000,000) at the expected annual rate of return of 10%. The financial institution that handled the Company’s short term investment with is the related party of the Company.
30
Income Taxes
Income taxes from the Company’s continuing operations significantly increased by $154,799, or 441.31%, from $35,077 for the three months ended March 31, 2016 to $189,876 for the three months ended March 31, 2017. The increase in income taxes was due to an increase in income before income taxes of one of the Company’s subsidiaries, Humankind, with an increase from $140,310 for the three months ended March 31, 2016 to $560,782 for the same period of 2017.
Net Income (Loss) from Continuing Operations and Income (Loss) Per Share
Net loss from the Company’s continuing operations was $54,965 for the three months ended March 31, 2017, as compared to $114,636 for the three months ended March 31, 2016. This decrease of $59,671, or 52.05% in net loss was primarily attributable to an increase in investment income of $217,867, partially offset by a decrease in gross profit of $30,070, an increase in depreciation and amortization expense in the amount of $83,284 and an increase in selling, general and administrative expenses of $47,224 for the three months ended March 31, 2017 as compared to the same period of 2016.
Loss per share was $0.0008 for the three months ended March 31, 2017 and $0.0018 for the three months ended March 31, 2016, respectively. This decrease was primarily a result of the above-described decrease in net loss.
Net Loss from Discontinued Operations
Net loss from discontinued operations was nil for the three months ended March 31, 2017, as compared to $189 for the three months ended March 31, 2016.
Net Income (Loss)
As a result of the foregoing, we had net loss of $54,965 for the three months ended March 31, 2017, compared to $114,825 for the same period in 2016. After deduction of non-controlling interest in loss, net loss attributable to the China Health Industries Holdings was $54,965 for the three months March 31, 2017, and $114,823 for the same period in 2016.
31
Nine months ended March 31, 2017 compared to the nine months ended March 31, 2016
The following table summarizes the top lines of the results of our operations for the nine months ended March 31, 2017 and 2016, respectively:
| March 31, | March 31 | |||||||||||
| 2017 | 2016 | Variance | % | |||||||||
| Revenues | $ | 4,410,550 | $ | 6,358,992 | $ | (1,948,442 | ) | -30.64% | ||||
| Humankind | 4,410,388 | 5,653,903 | (1,243,515 | ) | -21.99% | |||||||
| HLJ Huimeijia | 162 | 705,089 | (704,927 | ) | -99.98% | |||||||
| Cost of Goods Sold | $ | 2,801,128 | $ | 4,594,285 | $ | (1,793,157 | ) | -39.03% | ||||
| Humankind | 2,801,061 | 3,960,881 | (1,159,820 | ) | -29.28% | |||||||
| HLJ Huimeijia | 67 | 633,404 | (633,337 | ) | -99.99% | |||||||
| Gross Profit | $ | 1,609,422 | $ | 1,764,707 | $ | (155,285 | ) | -8.80% | ||||
| Humankind | 1,609,327 | 1,693,022 | (83,695 | ) | -4.94% | |||||||
| HLJ Huimeijia | 95 | 71,685 | (71,590 | ) | -99.87% |
Revenue
Total revenues from the Company’s continuing operations decreased by $1,948,442 or 30.64% for the nine months ended March 31, 2017 as compared to the same period in 2016. The fall in revenues was primarily due to a decrease of $1,243,515 or 21.99% in Humankind’s revenues and a decrease of $704,927 or 99.98% in HLJ Huimeijia’s revenues for the nine months ended March 31, 2017 as compared to the same period in 2016. The drop in the sales revenue in Humankind was primarily due to a reduction in the sales volume of Waterlilies Soft Capsules, which was caused by a decline in demand and our shift of marketing focus to Propolis and Black Ant Capsules. The significant decrease in HLJ Huimeijia’s sales revenue was primary due to the expiration of its GMP certificate on December 31, 2015. During the three months prior to such expiration, HLJ Huimeijia reduced its production and marketing operations as more attention was paid to the preparation of manufacturing and technical improvements in order to meet the requirements for obtaining a new GMP certificate. Since the third quarter of fiscal year 2016, HLJ Huimeijia has ceased all production activities, reconstructed its equipment and production lines for the purpose of applying for a new GMP certificate, and continued to sell inventory produced before the expiration of the old GMP certificate.
Our total cost of sales from the Company’s continuing operations dropped by $1,793,157 or 39.03% for the nine months ended March 31, 2017 as compared to the same period in 2016. The plunge in the overall cost of sales was attributed to the drop of $1,159,820 or 29.28% in Humankind’s cost of sales and a decrease of $633,337 or 99.99% in HLJ Huimeijia’s cost of sales for the nine months ended March 31, 2017 as compared to the same period in 2016. This decrease aligned with the decrease in the sales volume of products sold by Humankind and HLJ Huimeijia.
Our gross margin from the Company’s continuing operations declined by $155,285 from $1,764,707 for the nine months ended March 31, 2017 to $1,609,422 for the nine months ended March 31, 2016. This change was consistent with the decrease in the sales volume of products sold by Humankind and HLJ Huimeijia as discussed above.
Sales by Product Line
The following table summarizes a breakdown of our sales by major product line for the nine months ended March 31, 2017 and 2016, respectively:
32
| March 31, 2017 | March 31, 2016 | |||||||||||||||||
| Quantity | % of | Quantity | % of | |||||||||||||||
| (Unit) | Sales US$ | Sales | (Unit) | Sales US$ | Sales | |||||||||||||
| Humankind | ||||||||||||||||||
| Waterlilies Soft Capsules (Sailuozhi) | 15,057 | $ | 909,143 | 20.61% | 54,929 | $ | 3,506,062 | 55.13% | ||||||||||
| Propolis and Black Ant Capsules | 128,933 | 3,501,245 | 79.39% | 74,553 | 2,147,834 | 33.78% | ||||||||||||
| HLJ Huimeijia | ||||||||||||||||||
| Musk Bone Strengthener Paste | 59 | 24 | 0.00% | 985,399 | 260,282 | 4.09% | ||||||||||||
| Musk Pain Relieving Paste | 21 | 8 | 0.00% | 379,746 | 102,282 | 1.61% | ||||||||||||
| Injury and Rheumatism relieving Paste | 118 | 92 | 0.00% | 330,168 | 92,283 | 1.45% | ||||||||||||
| Refining GouPi Cream | 15 | 6 | 0.00% | 445,021 | 118,001 | 1.86% | ||||||||||||
| Enema Glycerini | - | - | 0.00% | 932,166 | 92,413 | 1.45% | ||||||||||||
| UmguentumAcidiBoriciCamphoratum | 10 | 3 | 0.00% | 133,090 | 37,498 | 0.59% | ||||||||||||
| Indometacin and Furazolidone Suppositories | - | - | 0.00% | 1,100 | 450 | 0.01% | ||||||||||||
| Ge Hong Beriberi Water | 92 | 29 | 0.00% | 6,480 | 1,887 | 0.03% | ||||||||||||
| Total | $ | 4,410,550 | 100.00% | $ | 6,358,992 | 100.00% | ||||||||||||
Operating Expenses
The following table summarizes our operating expenses for the nine months ended March 31, 2017 and 2016, respectively:
| March 31, 2017 | March 31,2016 | Variance | % | |||||||||
| Operating Expenses | ||||||||||||
| Selling, general and administrative | $ | 1,243,782 | $ | 1,439,223 | $ | (195,441 | ) | -13.58% | ||||
| Depreciation and amortization | 456,651 | 480,209 | (23,558 | ) | -4.91% | |||||||
| Total Operating Expenses | $ | 1,700,433 | $ | 1,919,432 | $ | (218,999 | ) | -11.41% |
Total operating expenses for the nine months ended March 31, 2017 were $218,999 or 11.41% lower than in the corresponding period in 2016. The decline in operating expenses was primarily attributable to a decrease of $195,441 or 13.58% in selling, general and administrative expenses and a fall of $23,558 or 4.91% in depreciation and amortization expenses. The decrease in selling, general and administrative expenses was mainly due to decreased expenses for the development of marketing and operations in order to focus on the construction of CIP for the nine months ended March 31, 2017, as compared to the same period in 2016. The decrease in depreciation and amortization expenses was primarily attributed to a more unfavorable foreign exchange rate for the nine months ended March 31, 2017 than the one in the same period in 2016.
Total operating expenses from the discontinued operations decreased from $578 for the nine months ended March 31, 2016 to nil for the corresponding period in 2017.
Interest Income and Interest Expenses
Interest income from the Company’s continuing operations was $55,114 for the nine months ended March 31, 2017, as compared to $53,191 for the nine months ended March 31, 2016. This increase of $1,923, or 3.62%, was mainly due to the increased average balance of bank deposits compared with the same period of 2016.
Interest expenses from the Company’s continuing operations was $64,867 for the nine months ended March 31, 2017, a decrease of $15,332 or 19.12%, as compared to $80,199 for the nine months ended March 31, 2016. The decrease in interest expenses was mainly due to fluctuations in exchange rates, despite the increase in short-term loan interest rates in November 2016.
33
Investment Income
During the nine months ended March 31, 2017, investment income from the Company’s continuing operations was $662,595, as compared to nil for the same period in 2016. On July 5, 2016, our Company entered into a one-year financial management agreement with the principal in the amount of $8,716,876 (RMB 60,000,000) with an expected annual rate of return of 10%. The financial institution that handled this short term investment is a related party of the Company.
Income Taxes
Income taxes from the Company’s continuing operations increased by $577,566, or 545.08%, from $105,960 for the nine months ended March 31, 2016 to $683,526 for the nine months ended March 31, 2017. This increase was primarily due to the increase in net book income before income taxes of one of the Company’s subsidiaries, Humankind, with an increase from $423,842 for the nine months ended March 31, 2016 to $2,319,261 for the same period of 2017.
Net Income (Loss) from Continuing Operations and Income (Loss) Per Share
Net income from the Company’s continuing operations was $1,238,767 for the nine months ended March 31, 2017, as compared to net loss of $256,592 for the nine months ended March 31, 2016. This increase of $1,495,359, or 582.78% in net income was primarily attributable to an increase in gain on disposal of subsidiaries in the amount of $1,150,663, an increase in investment income in the amount of $662,595, a decrease in selling, general and administrative expenses of $195,441, partially offset by a fall in gross profit of $155,285 and an increase in depreciation and amortization expenses in the amount of $22,980 for the nine months ended March 31, 2017 as compared to the same period of 2016.
Income per share was $0.0188 for the nine months ended March 31, 2017 and loss per share was $0.0039 for the nine months ended March 31, 2016, respectively. This increase was primarily a result of the above-described increase in net income.
Net Loss from Discontinued Operations
Net loss from discontinued operations was nil for the nine months ended March 31, 2017, as compared to $578 for the nine months ended March 31, 2016.
Net Income (Loss)
As a result of the foregoing, we had net income of $1,238,767 for the nine months ended March 31, 2017, compared to net loss of $257,170 for the same period in 2016. After deducting non-controlling interest in loss, net income attributable to the China Health Industries Holdings was $1,238,767 for the nine months March 31, 2017, and net loss attributable to the China Health Industries Holdings was $257,164 for the same period in 2016.
Liquidity and Capital Resources
We believe our current working capital position, together with our expected future cash flows from operations and loans from our major shareholder, will be adequate to fund our operations in the ordinary course of business, anticipated capital expenditures, debt payment requirements and other contractual obligations for at least the next twelve months. However, this belief is based upon many assumptions and is subject to numerous risks, and there can be no assurance that we will not require additional funding in the future.
The following table summarizes our cash and cash equivalents positions, our working capital, and our cash flow activities as of March 31, 2017 and June 30, 2016 and for the nine months ended March 31, 2017 and 2016:
| March 31, 2017 | June 30, 2016 | |||||
| Cash and cash equivalents | $ | 20,799,235 | $ | 29,783,152 | ||
| Working capital | $ | 26,097,121 | $ | 25,518,206 | ||
| Inventories | $ | 463,700 | $ | 414,784 |
34
| 2017 | 2016 | |||||
| For the nine months ended March 31: | ||||||
| Cash provided by (used in): | ||||||
| Operating activities | $ | (758,744 | ) | $ | 701,855 | |
| Investing activities | $ | (7,212,345 | ) | $ | (141,692 | ) |
| Financing activities | $ | 33,211 | $ | 312,032 |
For the nine months ended March 31, 2017, our net decrease in cash and cash equivalents from continuing operations totaled $8,983,917, which total was comprised of net cash used in operating activities in the amount of $758,744, net cash used in investing activities in the amount of $7,212,345 and the negative effect of prevailing exchange rates on our cash position of $1,046,039, offset by net cash provided by financing activities in the amount of $33,211.
For the nine months ended March 31, 2016, our net increase in cash and cash equivalents from continuing operations totaled $55,013, which total was comprised of net cash provided by operating activities in the amount of $701,855 and net cash provided by financing activities in the amount of $312,032, offset by the negative effect of prevailing exchange rates on our cash position of $817,182 and net cash used in investing activities in the amount of $141,692.
Our working capital from continuing operations at March 31, 2017 was $26,097,121, compared to working capital of $25,518,206 at June 30, 2016. This increase of $578,915 or 2.27% was primarily attributable to the increase in interest receivable in the amount of $653,766, the increase in advance to suppliers in the amount of $329,764, and the decrease in other payables in the amount of $464,513, offset by the increase in related party debts in the amount of $707,100 and the increase in taxes payable in the amount of $356,311.
Net cash used in operating activities was $758,744 for the nine months ended March 31, 2017, primarily attributable to an increase in interest receivable in the amount of $653,766, an increase in advances to suppliers in the amount of $329,764 and a decrease in other payables in the amount of $464,513. Net cash used in investing activities was $7,212,345 for the nine months ended March 31, 2017, primarily due to expenditures in short-term investments of $8,054,281. Net cash provided by financing activities from continuing operations was $33,211 for the nine months ended March 31, 2017, attributable to proceeds from related party debts in the amount of $85,085, partially offset by payment of short term loans in the amount of $51,874. The negative effect of exchange rate changes on cash and cash equivalents in the amount of $1,046,039 for the nine months ended March 31, 2017 was mainly a result of the effect of the devaluation of the RMB against the USD on the significant amount of cash and cash equivalents held by the Company in RMB. The exchange rates from USD to RMB were 6.8832 to 1 and 6.6459 to 1 as of March 31, 2017 and June 30, 2016, respectively, and the average exchange rate from USD to RMB was 6.7915 for the nine months ended March 31, 2017.
Net cash provided by operating activities was $701,855 for the nine months ended March 31, 2016, primarily attributable to the net loss available to the Company in the amount of $257,164, depreciation and amortization expenses of $608,903 and share based compensation of $225,000 as reconciled, and a decrease in inventory of $187,148, partially offset by an increase in advances to suppliers and prepaid expenses of $134,560. Net cash used in investing activities was $141,692 for the nine months ended March 31, 2016, primarily due to the cash used in the purchases of property, plants and equipment of $83,093 and the cash paid for construction in progress of $60,059 for the construction of a new plant for HLJ Huimeijia to expand and enhance its production capacity. Net cash provided by financing activities was $312,032 for the nine months ended March 31, 2016, attributable to the collections of related party debts in the amount of $357,277, offset by the repayment of related party debts in the amount of $45,245. The negative effect of exchange rate changes on cash and cash equivalents in the amount of $817,182 for the nine months ended March 31, 2016 was mainly a result of the effect of the devaluation of the RMB to the USD on the significant amount of cash and cash equivalents held by the Company in RMB. The exchange rates from USD to RMB were 6.4480 to 1 and 6.2000 to 1 as of March 31, 2016 and June 30, 2015, respectively, and the average exchange rate from USD to RMB was 6.4096 for the nine months ended March 31, 2016.
35
Other than as described in this report, we have no present agreements or commitments with respect to any material acquisitions of businesses, products, product rights or technologies or any other material capital expenditures. However, we will continue to evaluate acquisitions of, and/or investments in, products, technologies, capital equipment or improvements or companies that complement our business and may make such acquisitions and/or investments in the future. Accordingly, we may need to obtain additional sources of capital in the future to finance any such acquisitions and/or investments. We may not be able to obtain such financing on commercially reasonable terms, if at all. Even if we are able to obtain additional financing, it may contain undue restrictions on our operations, in the case of debt financing, or cause substantial dilution for our stockholders, in the case of equity financing.
Related Party Debts
We had related party debts from continuing operations in the amount of $3,420,506 as of March 31, 2017, as compared to $2,713,406 as of June 30, 2016, an increase of $707,100 or 26.06% . Our related party debts mainly consist of a loan from Mr. Xin Sun, the CEO of the Company. The loan is unsecured and non-interest bearing and has no fixed terms of repayment. There was no written agreement for the loan. See Note 11.
Off-Balance Sheet Arrangements
We do not have any off-balance sheet arrangements that are currently material or reasonably likely to be material to our financial position or results of operations.
Critical Accounting Policies and Estimates
We prepare the unaudited condensed consolidated financial statements in accordance with US GAAP. These accounting principles require us to make judgments, estimates and assumptions on the reported amounts of assets and liabilities at the end of each fiscal period, and the reported amounts of revenues and expenses during each fiscal period. We continually evaluate these judgments and estimates based on our own historical experience, knowledge and assessment of current business and other conditions, our expectations regarding the future based on available information, and assumptions that we believe to be reasonable.
There have been no material changes during the nine months ended March 31, 2017 in the Company’s significant accounting policies to those previously disclosed in the annual report on Form 10-K for the fiscal year ended June 30, 2016.
| Item 3. | Quantitative and Qualitative Disclosures About Market Risk |
Not applicable.
| Item 4. | Controls and Procedures |
Evaluation of Disclosure Controls and Procedures
We maintain a set of disclosure controls and procedures designed to ensure that information required to be disclosed by us in our reports filed under the Securities Exchange Act of 1934, as amended (the “Exchange Act”), is recorded, processed, summarized and reported within the time periods specified by the SEC’s rules and forms. Disclosure controls are also designed with the objective of ensuring that this information is accumulated and communicated to our management, including our chief executive and chief financial officer, as appropriate, to allow timely decisions regarding required disclosure.
At the conclusion of the period ended March 31, 2017, we carried out an evaluation, under the supervision and with the participation of our management, including our principal executive and principal financial officer, of the effectiveness of the design and operation of our disclosure controls and procedures (as such term is defined in Rules 13a-15(e) and 15d-15(e) under the Exchange Act). Based upon that evaluation, our principal executive and principal financial officer concluded that, due to the material weakness in our internal controls over financial reporting as discussed in our annual report on Form 10-K for the fiscal year ended June 30, 2016, as of the end of the period covered by this Quarterly Report on Form 10-Q, our disclosure controls and procedures were not effective to satisfy the objectives for which they are intended.
36
Despite the material weakness reported above, our management believes that our unaudited condensed consolidated financial statements included in this report fairly present in all material respects our financial condition, results of operations and cash flows for the periods presented because we have retained a consultant who has U.S. GAAP experience to assist us in the preparation of our unaudited condensed consolidated financial statements.
Changes in Internal Controls over Financial Reporting
No changes in our internal controls over financial reporting have come to management’s attention during the quarter ended March 31, 2017 that have materially affected, or are likely to materially affect, our internal control over financial reporting.
Limitations on Controls
Management does not expect that our disclosure controls and procedures or our internal control over financial reporting will prevent or detect all error and fraud. Any control system, no matter how well designed and operated, is based upon certain assumptions and can provide only reasonable, not absolute, assurance that its objectives will be met. Further, no evaluation of controls can provide absolute assurance that misstatements due to error or fraud will not occur or that all control issues and instances of fraud, if any, within the Company have been detected.
37
PART II - OTHER INFORMATION
| Item 6. | Exhibits. |
The exhibits required by this item are set forth in the Exhibit Index attached hereto.
SIGNATURES
Pursuant to the requirements of Section 13 or 15(d) of the Securities Exchange Act of 1934, the registrant has duly caused this report to be signed on its behalf by the undersigned thereunto duly authorized.
| CHINA HEALTH INDUSTRIES HOLDINGS, INC. | |
| /s/ Xin Sun | |
| By: | Xin Sun |
| Title: | Chief Executive Officer and Chief Financial |
| Officer | |
| (Principal Executive Officer, Principal | |
| Financial Officer | |
| and Principal Accounting Officer) | |
| Date: May 15, 2017 | |
38
EXHIBIT INDEX
40