Attached files
| file | filename |
|---|---|
| EXCEL - IDEA: XBRL DOCUMENT - China Health Industries Holdings, Inc. | Financial_Report.xls |
| EX-31 - EX-31 - China Health Industries Holdings, Inc. | v302172_ex31.htm |
| EX-32 - EX-32 - China Health Industries Holdings, Inc. | v302172_ex32.htm |
UNITED STATES
SECURITIES AND EXCHANGE COMMISSION
Washington, D.C. 20549
FORM 10-Q
(Mark One)
| S | QUARTERLY REPORT PURSUANT TO SECTION 13 OR 15(d) OF THE SECURITIES EXCHANGE ACT OF 1934 |
For the quarterly period ended December 31, 2011
| £ | TRANSITION REPORT PURSUANT TO SECTION 13 OR 15(d) OF THE EXCHANGE ACT |
For the transition period from ______________ to _____________
Commission File Number: 000-51060
CHINA HEALTH INDUSTRIES HOLDINGS, INC.
(Exact name of registrant as specified in its charter)
| Delaware | 86-0827216 | |
|
(State or other jurisdiction of incorporation or organization) |
(I.R.S. Employer Identification No.) | |
|
168 Binbei Street, Songbei District, Harbin City Heilongjiang Province, People’s Republic of China |
150028 | |
| (Address of principal executive offices) | (Zip Code) |
86-451-51719407
(Registrant’s telephone number, including area code)
Not Applicable
(Former name, former address and former fiscal year, if changed since last report)
Indicate by check mark whether the registrant (1) has filed reports required to be filed by Section 13 or 15(d) of the Securities Exchange Act of 1934 during the preceding 12 months (or for such shorter period that the registrant was required to file such reports), and (2) has been subject to such filing requirements for the past 90 days. Yes x No ¨
Indicate by check mark whether the registrant has submitted electronically and posted on its corporate Web site, if any, every Interactive Data File required to be submitted and posted pursuant to Rule 405 of Regulation S-T (§232.405 of this chapter) during the preceding 12 months (or for such shorter period that the registrant was required to submit and post such files). Yes x No ¨
Indicate by check mark whether the registrant is a large accelerated filer, an accelerated filer, a non-accelerated filer, or a smaller reporting company. See the definitions of “large accelerated filer”, “accelerated filer” and “smaller reporting company” in Rule 12b-2 of the Exchange Act.
| Large accelerated filer ¨ | Accelerated filer ¨ |
| Non-accelerated filer ¨ | Smaller reporting company x |
Indicate by check mark whether the registrant is a shell company (as defined in Rule 12b-2 of the Exchange Act). Yes ¨ No x
APPLICABLE ONLY TO ISSUERS INVOLVED IN BANKRUPTCY
PROCEEDINGS DURING THE PRECEDING FIVE YEARS
Indicate by check mark whether the registrant has filed all documents and reports required to be filed by Sections 12, 13, or 15(d) of the Securities Exchange Act of 1934 subsequent to the distribution of securities under a plan confirmed by a court. Yes ¨ No ¨
APPLICABLE ONLY TO CORPORATE ISSUERS
Indicate the number of shares outstanding of each of the issuer’s classes of common equity, as of the latest practicable date:
As of February 14, 2012, there are 62,239,737 shares of $0.0001 par value common stock issued and outstanding.
FORM 10-Q
CHINA HEALTH INDUSTRIES HOLDINGS, INC.
INDEX
| Page | |||
| PART I | FINANCIAL INFORMATION | 3 | |
| Item 1. Financial Statements (Unaudited). | 3 | ||
| Condensed Consolidated Balance Sheets as of December 31, 2011 (Unaudited) and June 30, 2011. | 3 | ||
| Condensed Consolidated Statements of Operations and Comprehensive Income for the Three and Six Months Ended December 31, 2011 and 2010 (Unaudited). | 4 | ||
| Condensed Consolidated Statements of Cash Flows for the Six Months Ended December 31, 2011 and 2010 (Unaudited). | 5 | ||
| Notes to Condensed Consolidated Financial Statements. | 6 | ||
| Item 2. Management’s Discussion and Analysis of Financial Condition and Results of Operations. | 14 | ||
| Item 3. Quantitative and Qualitative Disclosures About Market Risk. | 24 | ||
| Item 4. Controls and Procedures. | 24 | ||
| PART II | OTHER INFORMATION | 24 | |
| Item 1. Legal Proceedings. | 24 | ||
| Item 1A. Risk Factors. | 24 | ||
| Item 2. Unregistered Sales of Equity Securities and Use of Proceeds. | 24 | ||
| Item 3. Defaults Upon Senior Securities. | 24 | ||
| Item 4. (Removed and Reserved). | 25 | ||
| Item 5. Other Information. | 25 | ||
| Item 6. Exhibits. | 25 |
| 2 |
PART I - FINANCIAL INFORMATION
Item 1. Financial Statements (Unaudited).
CHINA HEALTH INDUSTRIES HOLDINGS, INC. AND SUBSIDIARIES
CONDENSED CONSOLIDATED BALANCE SHEETS
| December 31, 2011 | June 30, 2011 | |||||||
| (Unaudited) | (Audited) | |||||||
| ASSETS | ||||||||
| Current assets | ||||||||
| Cash and cash equivalents | $ | 27,608,798 | $ | 23,744,820 | ||||
| Accounts receivable | 17,528,687 | 8,506,933 | ||||||
| Inventory | 957,958 | 738,207 | ||||||
| Notes receivable | 3,217,862 | 3,126,340 | ||||||
| Prepaid expenses | 782,376 | 1,007,630 | ||||||
| Total current assets | 50,095,681 | 37,123,930 | ||||||
| Property & equipment – net | 1,209,702 | 1,147,281 | ||||||
| Intangible assets – net | 873,272 | 860,163 | ||||||
| Construction-in-progress | 481,264 | 1,856 | ||||||
| Long-term deposit | 3,336,564 | 3,249,014 | ||||||
| Total assets | $ | 55,996,483 | $ | 42,382,244 | ||||
| LIABILITIES AND STOCKHOLDERS' EQUITY | ||||||||
| Current liabilities | ||||||||
| Accounts payable and accrued expenses | $ | 2,256,807 | $ | 906,208 | ||||
| Related party debt | 433,783 | 432,924 | ||||||
| Wages payable | 1,183,772 | 1,352,906 | ||||||
| Tax payable | 3,417,251 | 2,657,582 | ||||||
| Total current liabilities | 7,291,613 | 5,349,620 | ||||||
| Stockholders' equity | ||||||||
| Common stock, ($0.0001 par value, 300,000,000 shares authorized, 62,239,737 issued and outstanding as December 31, 2011 | $ | 6,224 | $ | 6,224 | ||||
| and June 30, 2011, respectively) | 1,475,923 | 1,462,227 | ||||||
| Accumulated other comprehensive income | 3,176,102 | 2,010,981 | ||||||
| Statutory reserve | 38,679 | 38,679 | ||||||
| Retained earnings | 44,007,942 | 33,514,513 | ||||||
| Total stockholders' equity | 48,704,870 | 37,032,624 | ||||||
| Total liabilities and stockholders' equity | $ | 55,996,483 | $ | 42,382,244 | ||||
The accompanying notes are an integral part of these consolidated financial statements.
| 3 |
CHINA HEALTH INDUSTRIES HOLDINGS, INC. AND SUBSIDIARIES
CONDENSED CONSOLIDATED STATEMENTS OF OPERATIONS AND COMPREHENSIVE INCOME
(Unaudited)
| For the Three Months Ended | For the Six Months Ended | |||||||||||||||
| December 31, 2011 | December 31, 2010 | December 31, 2011 | December 31, 2010 | |||||||||||||
| REVENUE | 23,973,612 | 13,363,093 | 46,167,138 | 24,980,486 | ||||||||||||
| COST OF GOODS SOLD | 14,401,135 | 6,708,036 | 27,371,201 | 12,693,331 | ||||||||||||
| GROSS PROFIT | 9,572,477 | 6,655,057 | 18,795,937 | 12,287,155 | ||||||||||||
| OPERATING EXPENSES | ||||||||||||||||
| Selling, general & administrative | 2,286,370 | 1,227,027 | 4,129,519 | 2,488,419 | ||||||||||||
| Depreciation and amortization | 15,862 | 20,099 | 30,561 | 39,796 | ||||||||||||
| Research & development | 120,024 | 34,115 | 240,048 | 771,543 | ||||||||||||
| Total operating expenses | 2,422,256 | 1,281,241 | 4,400,128 | 3,299,758 | ||||||||||||
| INCOME FROM OPERATIONS | 7,150,221 | 5,373,816 | 14,395,809 | 8,987,397 | ||||||||||||
| OTHER INCOME | ||||||||||||||||
| Interest income | 76,778 | 39,282 | 149,916 | 78,637 | ||||||||||||
| Interest expense | (6,595 | ) | (1,168 | ) | (13,695 | ) | (2,336 | ) | ||||||||
| Total other income | 70,183 | 38,114 | 136,221 | 76,301 | ||||||||||||
| INCOME BEFORE INCOME TAXES | 7,220,404 | 5,411,930 | 14,532,030 | 9,063,698 | ||||||||||||
| Provision for income taxes | 2,041,873 | 1,548,022 | 4,038,601 | 2,663,436 | ||||||||||||
| NET INCOME | $ | 5,178,531 | $ | 3,863,908 | $ | 10,493,429 | $ | 6,400,262 | ||||||||
| OTHER COMPREHENSIVE INCOME | ||||||||||||||||
| Foreign currency translation gain (loss) | 631,937 | (23,552 | ) | 1,165,121 | 201,001 | |||||||||||
| Total other comprehensive income | $ | 5,810,468 | $ | 3,840,356 | $ | 11,658,550 | $ | 6,601,263 | ||||||||
| Earning per share: | ||||||||||||||||
| Basic & diluted earning per share | $ | 0.08 | $ | 0.06 | $ | 0.17 | $ | 0.10 | ||||||||
| Weighted average shares outstanding: | ||||||||||||||||
| Basic & diluted weighted average shares outstanding | 62,239,737 | 62,239,737 | 62,239,737 | 62,239,737 | ||||||||||||
The accompanying notes are an integral part of these consolidated financial statements.
| 4 |
CHINA HEALTH INDUSTRIES HOLDINGS, INC. AND SUBSIDIARIES
CONDENSED CONSOLIDATED STATEMENTS OF CASH FLOWS
(Unaudited)
| For the Six Months Ended December 31, | ||||||||
| 2011 | 2010 | |||||||
| Cash Flows from Operating Activities | ||||||||
| Net income | $ | 10,493,429 | $ | 6,400,262 | ||||
| Adjustments to reconcile net income to net cash provided by operating activities: | ||||||||
| Depreciation and amortization | 53,841 | 39,797 | ||||||
| Imputed interest | 13,695 | 2,336 | ||||||
| (Increase) / decrease in current assets: | ||||||||
| Accounts receivables and note receivables | (8,799,797 | ) | (98,337 | ) | ||||
| Inventory | (199,859 | ) | (126,721 | ) | ||||
| Prepaid expenses | 252,405 | (96,161 | ) | |||||
| Increase in current liabilities: | ||||||||
| Accounts payable and other payables | 1,808,701 | 363,150 | ||||||
| Net cash provided by operating activities | 3,622,415 | 6,484,326 | ||||||
| Cash Flows from Investing Activities | ||||||||
| Purchases of fixed assets | (76,076 | ) | (163,323 | ) | ||||
| Dues from notes receivable | - | (32,002 | ) | |||||
| Construction-in-progress | (479,357 | ) | 163,323 | |||||
| Net cash used in investing activities | (555,433 | ) | (32,002 | ) | ||||
| Cash Flows from Financing Activities | ||||||||
| Payment to related party | (479,357 | ) | - | |||||
| Proceeds from related party | 479,357 | 2,601 | ||||||
| Net cash provided by financing activities | - | 2,601 | ||||||
| Effect of exchange rate changes on cash and cash equivalents | 796,996 | (82,931 | ) | |||||
| Net increase in cash and cash equivalents | 3,863,978 | 6,371,994 | ||||||
| Cash and cash equivalents, beginning balance | 23,744,820 | 13,344,531 | ||||||
| Cash and cash equivalents, ending balance | $ | 27,608,798 | $ | 19,716,525 | ||||
| Supplemental cash flow information | ||||||||
| Cash paid for income taxes | $ | 6,911,670 | $ | 2,408,152 | ||||
The accompanying notes are an integral part of these consolidated financial statements.
| 5 |
CHINA HEALTH INDUSTRIES HOLDINGS, INC. AND SUBSIDIARIES
NOTES TO CONDENSED CONSOLIDATED FINANCIAL STATEMENTS
Note 1 - BUSINESS DESCRIPTION AND SIGNIFICANT ACCOUNTING POLICIES
The Company was incorporated in the state of Arizona on July 11, 1996 and was the successor of the business known as Arizona Mist, Inc. which began in 1989. On May 9, 2005, the Company entered into a Stock Purchase Agreement and Share Exchange (effecting a reverse merger) with Edmonds 6, Inc. (“Edmonds 6”) and our name was changed to Universal Fog, Inc. Edmonds 6 was incorporated on August 19, 2004 under the laws of the State of Delaware to engage in any lawful corporate undertaking, including, but not limited to, selected mergers and acquisitions. Pursuant to this agreement, Universal Fog, Inc. (which has been in continuous operation since 1996) became a wholly-owned subsidiary of Edmonds 6.
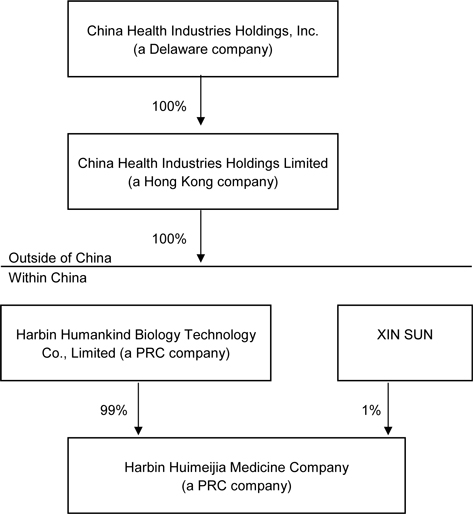
China Health Industries Holdings Limited ("China Health") was incorporated on July 20, 2007 in Hong Kong under the Companies Ordinance as a limited liability company. China Health was formed for the purpose of seeking and consummating a merger or acquisition with a business entity organized as a private corporation, partnership, or sole proprietorship as defined by FASB ACS topic 915 (“Development Stage Entities”).
Harbin Humankind Biology Technology Co., Limited ("Humankind") was incorporated in Harbin City, Heilongjiang Province, the People's Republic of China (the "PRC") on December 14, 2003, as a limited liability company under the Company Law of PRC. Humankind is engaged in the business of manufacture and sale of health products, “green” (or organic) food and detection of disease susceptibility or pre-disposition through genetic studies.
On August 20, 2007, the sole shareholder of China Health entered into a share purchase agreement (“Share Purchase Agreement”) with the owners of Humankind. Pursuant to the Share Purchase Agreement, China Health purchased 100% of the ownership in Humankind for a cash consideration of $60,408 (“Share Purchase”). Subsequent to the completion of the Share Purchase, Humankind became a wholly-owned subsidiary of China Health. The share purchase transaction was accounted for as a “reverse merger,” since the owner of Humankind owns a majority of the outstanding shares of China Health’s common stock immediately following the execution of the Share Purchase Agreement. Humankind is deemed to be the acquirer in the reverse merger. Consequently, the assets and liabilities and the historical operations that have been reflected in the financial statements for periods prior to the Share Purchase are those of Humankind and have been recorded at the historical cost basis. After completion of the Share Purchase, China Health’s consolidated financial statements include the assets and liabilities of both China Health and Humankind, the historical operations of Humankind and the operations of China Health and its subsidiaries from the closing date of the Share Purchase.
On October 14, 2008, Humankind set up a 99% owned subsidiary Harbin Huimeijia Medicine with its primary business being manufacturing and distributing medicine. Mr. Xin Sun, the Company’s majority owner, owns 1% of this subsidiary. The subsidiary is consolidated in the consolidated financial statements of the Company.
On December 31, 2008, China Health closed a reverse merger with Universal Fog, Inc., a U.S. public traded shell company (“Transaction”). China Health is the accounting acquirer in the Transaction and the Transaction has been treated as a recapitalization of the Company. After the Transaction and a 20:1 reverse stock split, Xin Sun owned 61,203,088 shares of common stock, representing 98.3% of the 62,234,737 total outstanding shares of common stock of the Company. On April 7, 2009, Mr. Sun transferred 28,200,000 shares of common stock to 296 individuals, leaving him with 33,003,088 shares of common stock of the Company, or approximately 53.03%. We changed our name from Universal Fog, Inc. to China Health Industries Holdings, Inc. on February 19, 2009.
| 6 |
Our present corporate structure is as follows:
BASIS OF PRESENTATION
The accompanying unaudited condensed consolidated financial statements have been prepared by China Health Industries Holdings, Inc. and subsidiaries without audit pursuant to the rules and regulations of the Securities and Exchange Commission. Certain information and disclosures normally included in financial statements prepared in accordance with generally accepted accounting principles have been condensed or omitted as allowed by such rules and regulations, and management believes that the disclosures are adequate to make the information presented not misleading. These condensed consolidated financial statements should be read in conjunction with the audited financial statements and notes thereto included in the Company’s Annual Report on Form 10-K for the year ended June 30, 2011. These condensed consolidated financial statements include all adjustments, which in the opinion of management are necessary to a fair presentation of financial position and results of operations. All such adjustments are of a normal and recurring nature. The results of operations for the six months ended December 31, 2011 may not be indicative of results that may be expected for the year ending June 30, 2012.
| 7 |
Translation of Foreign Currencies
China Health maintains its books and accounting records in PRC currency “Renminbi” (“RMB”), which is determined as the functional currency. Transactions denominated in currencies other than RMB are translated into RMB at the exchange rates quoted by the People’s Bank of China (“PBOC”) prevailing on the date of the transactions. Foreign currency exchange gains and losses resulting from these transactions are included in operations.
China Health’s financial statements are translated into the reporting currency, the United States Dollar (“USD”). Assets and liabilities of China Health are translated at the prevailing exchange rate at each reporting period end date. Contributed capital accounts are translated using the historical rate of exchange when capital is injected. Income and expense accounts are translated at the average rate of exchange during the reporting period. Translation adjustments resulting from translation of these financial statements are reflected as accumulated other comprehensive income in shareholders’ equity.
Use of Estimates
The preparation of financial statements in conformity with GAAP requires management to make estimates and judgments that affect the reported amounts of assets and liabilities, disclosure of contingent assets and liabilities on the date of the financial statements and the reported amounts of revenues and expenses during the reporting period. China Health bases its estimates and judgments on historical experience and on various other assumptions and information that are believed to be reasonable under the circumstances. Estimates and assumptions of future events and their effects cannot be perceived with certainty and, accordingly, these estimates may change as new events occur, as more experience is acquired, as additional information is obtained and as our operating environment changes. The more significant estimates and assumptions by management include, among others; useful lives and residual value of long-lived assets, valuation of Inventory, accounts receivable and notes receivable, impairment analysis of long-lived assets, intangible assets and deferred taxes. While China Health believes that the estimates and assumptions used in the preparation of the financial statements are appropriate, actual results could differ from those estimates.
Statement of Cash Flows
In accordance with Statement FASB ASC Topic 230, "Statement of Cash Flows," cash flows from the Company's operations is calculated based upon the local currencies. As a result, amounts related to assets and liabilities reported in the statement of cash flows will not necessarily agree with changes in the corresponding balances on the balance sheet.
Cash and Cash Equivalents
Cash and cash equivalents include cash on hand, deposits in banks with maturities of three months or less, and all highly liquid investments which are unrestricted as to withdrawal or use, and which have original maturities of three months or less at the time of purchase.
The company maintains cash and cash equivalents at several financial institutions. Only accounts at US financial institutions are insured by the Federal Deposit Insurance Corporation (FDIC) up to $250,000. As of December 31, 2011, the Company’s uninsured bank balances totaled $27,604,476, which was mainly maintained at financial institutions located in PRC. The Company’s insured bank balances totaled $4,322, which was maintained at US financial institutions.
| 8 |
Concentrations of Credit Risk
All of the Company’s manufacturing is located in the PRC. There can be no assurance that the Company will be able to successfully continue to manufacture its products and failure to do so would have a material adverse effect on the Company’s financial position, results of operations and cash flows. Also, the success of the Company’s operations is subject to numerous contingencies, some of which are beyond management’s control. These contingencies include general economic conditions, prices of raw materials, competition, governmental and political conditions, and changes in regulations. Because the Company is dependent on trade in the PRC, the Company is subject to various additional political, economic and other uncertainties. Among other risks, the Company’s operations will be subject to risk of restrictions on transfer of funds, domestic and international customs, changing taxation policies, foreign exchange restrictions, and political and governmental regulations.
The Company operates in China, which may give rise to significant foreign currency risks from fluctuations and the degree of volatility of foreign exchange rates between U.S. dollars and the Chinese currency RMB. The results of operations denominated in foreign currency are translated at the average rate of exchange during the reporting period.
Earnings per Share
Basic earnings per common share is computed by dividing net earnings applicable to common shareholders by the weighted-average number of common shares outstanding during the period. When applicable, diluted earnings per common share is determined using the weighted-average number of common shares outstanding during the period, adjusted for the dilutive effect of common stock equivalents, consisting of shares that might be issued upon exercise of common stock options and warrants. For the six months ended December 31, 2011 and 2010, the Company had no potential dilutive common stock equivalents outstanding.
Potential common shares issued are calculated using the treasury stock method, which recognizes the use of proceeds that could be obtained upon the exercise of options and warrants in computing diluted earnings per share. It assumes that any proceeds would be used to purchase common stock at the average market price of the common stock during the period.
FASB ASC Topic 260, Earnings Per Share, requires a reconciliation of the numerator and denominator of the basic and diluted earnings per share (EPS) computations.
Comprehensive Income
The Company reports comprehensive income in accordance with FASB ASC Topic 220 “Comprehensive Income," which established standards for reporting and displaying comprehensive income and its components in a financial statement that is displayed with the same prominence as other financial statements.
Total comprehensive income is defined as all changes in stockholders' equity during a period, other than those resulting from investments by and distributions to stockholders (i.e., issuance of equity securities and dividends). Generally, for the Company, total comprehensive income equals net income plus or minus adjustments for currency translation. Total comprehensive income represents the activity for a period net of related tax and was a gain of $631,937 and a loss of $23,552 for the three months ended December 31, 2011 and 2010, respectively and was a gain of $1,165,121 and $201,001 for the six months ended December 31, 2011 and 2010, respectively.
While total comprehensive income is the activity in a period and is largely driven by net earnings in that period, accumulated other comprehensive income or loss (“AOCI”) represents the cumulative balance of other comprehensive income as of the balance sheet date. For the Company, AOCI is primarily the cumulative balance related to adjustments for currency translation and increased overall equity by $3,176,102 and $2,010,981 as of December 31, 2011 and June 30, 2011, respectively.
Recent Accounting Pronouncements
In May 2011, Accounting Standards Update (“ASU”) 2011-04 was issued. This update amends Topic 820 to achieve common fair value measurement and disclosure requirement in US GAAP and IFRSs. The Company’s management believes that this pronouncement will not have a material effect on its financial position, results of operations or cash flows.
| 9 |
In June 2011, FASB issued the ASU 2011-05 “Presentation of Comprehensive Income” to amend ASC Topic 220. This update allows an entity to have the option to present the total of comprehensive income, the components of net income, and the components of other comprehensive income either in a single continuous statement of comprehensive income or in two separate but consecutive statements. In both choices, an entity is required to present each component of net income along with total net income, each component of other comprehensive income along with a total for other comprehensive income, and a total amount for comprehensive income. This update eliminates the option to present the components of other comprehensive income as part of the statement of changes in stockholders' equity. The amendments in this update do not change the items that must be reported in other comprehensive income or when an item of other comprehensive income must be reclassified to net income. The Company’s management believes that this pronouncement will not have a material effect on its financial position, results of operations or cash flows.
In September 2011, Accounting Standards Update (“ASU”) 2011-08 was issued. This update allows an entity to first assess qualitative factors to determine whether it is necessary to perform the two-step quantitative goodwill impairment test. The Company’s management believes that this pronouncement will not have a material effect on its financial position, results of operations or cash flows.
Note 2 – ACCOUNTS RECEIVABLE
The Company’s accounts receivable totaled to $17,528,687 and $8,506,933 as of December 31, 2011 and June 30, 2011, respectively. The increase in accounts receivable was primarily due to extending credit to the Company’s sales agents. These sales agents are the Company’s new customers and the Company offers these agents 60 days to 90 days term in order to increase the Company’s sales. Most of the Company’s products were sold to the end customers directly and the end customers made payments upon receipt of our product.
Note 3 – NOTES RECEIVABLE
Notes receivable consist of the following:
| December 31, | June 30, | |||||||
| 2011 | 2011 | |||||||
| Advances to employees | $ | 9,994 | $ | 2,955 | ||||
| Accrued Interest | 26,693 | 25,992 | ||||||
| Notes receivable -Tiefeng | 3,177,680 | 3,094,299 | ||||||
| Other Notes Receivable | 3,495 | 3,094 | ||||||
| Total notes receivable | $ | 3,217,862 | $ | 3,126,340 | ||||
The advances to employees are unsecured, non-interest bearing and have no fixed terms of repayment, therefore, deemed payable on demand.
On April 9, 2009, the Company’s wholly-owned subsidiary, Harbin Humankind Biology Technology Co., Limited (“Humankind”), entered into a letter of intent with the shareholders of Heilongjiang Tiefeng Rice Company Limited (“Tiefeng”) to purchase all the equity interest of Tiefeng (“the Share Transfer Agreement”). On July 23, 2009, the amount of $746,480 (RMB 5,000,000) was paid as retaining fees. The Share Purchase Agreement was signed on August 18, 2009; the amount of $7,312,507 (RMB 50,000,000) was prepaid to Tiefeng on August 19, 2009.
As of March 31, 2010, Tiefeng did not get the crucial certified documents from local government agencies. Based on the amended share purchase agreement, the deal is thus voided. Tiefeng paid back approximately $1.46 million (RMB 10,000,000) to the Company on March 31, 2010, an additional $1.46 million (RMB 10,000,000) was paid on April 30, 2010 as part of the deposit refund. Another $1.46 million (RMB 10,000,000) was paid on May 31, 2010. The balance of $3,177,680 (RMB 20,000,000) was converted to loans to Tiefeng with a two year term starting on May 5, 2010. Interest is charged semi-annually by using the current Chinese bank borrowing rate of 5.31%. As of December 31, 2011 and June 30, 2011, accrued interest income on the Tiefeng loan totals $26,693 and $25,992, respectively.
| 10 |
Note 4 - INVENTORIES
Inventories consist of following:
| December 31, | June 30, | |||||||
| 2011 | 2011 | |||||||
| Finished goods | $ | 249,769 | $ | 154,770 | ||||
| Work-in-process | 248,007 | 191,506 | ||||||
| Raw materials | 387,778 | 328,127 | ||||||
| Supplies and packing materials | 72,404 | 63,804 | ||||||
| Total inventory | $ | 957,958 | $ | 738,207 | ||||
Note 5 - DEPOSIT
The Company paid $3,336,564 (RMB 21,000,000) as of December 31, 2011 and $3,249,014 (RMB 21,000,000) as of June 30, 2011 to Harbin Songbei District Development and Construction Committee as prepayment for the acquisition of land use rights. The Company is in the process of going through a full range of procedures before the land use rights can be granted to the Company.
Note 6 – CONSTRUCTION IN PROGRESS
Plant and production lines currently under development are accounted for as construction-in-progress. Construction-in-progress is recorded at acquisition cost, including development expenditures, professional fees and interest expenses capitalized during the course of construction for the purpose of financing the project. Currently, construction is completed and the project is waiting for final inspection and examination and government approval. The Company had no capitalized interest and to date has funded this construction through operations without the use of outside debt financing. As of June 30, 2011, the Company has incurred $1,856 of construction in progress for plant and production lines.
On August 15, 2011, the Company entered into an agreement with a contractor to construct an office building for the Company. Estimated total cost of construction is approximately $622,372 (RMB 4,022,700). The Company anticipates the construction to be completed within 45 days from August 15, 2011 to October 15, 2011. Due to local weather condition, the construction has not been completed yet. As of December 31, 2011, 75% of construction has been completed and $481,264 (RMB 3,017,025) has been recorded as cost of construction in progress.
Upon readiness for use of the project, the cost of construction-in-progress will be transferred to property and equipment, at which time depreciation will commence.
Note 7 - PROPERTY AND EQUIPMENT
The following is a summary of property and equipment:
| December 31, | June 30, | |||||||
| 2011 | 2011 | |||||||
| Building and warehouses | $ | 1,102,970 | $ | 1,074,029 | ||||
| Machinery and equipment | 198,419 | 192,459 | ||||||
| Office equipment | 40,757 | 30,177 | ||||||
| Vehicles | 162,279 | 94,204 | ||||||
| Other | 23,833 | 23,207 | ||||||
| Less: Accumulated depreciation | (318,556 | ) | (266,795 | ) | ||||
| Total | $ | 1,209,702 | $ | 1,147,281 | ||||
Depreciation expense charged to operations was $20,639 and $30,448 for the six months ended December 31, 2011 and 2010, respectively. Depreciation expense charged to cost of goods sold was $23,280 and $0 for the six months ended December 31, 2011 and 2010, respectively.
| 11 |
Note 8 – INTANGIBLE ASSETS
The following is a summary of the intangible assets:
| December 31, | June 30, | |||||||
| 2011 | 2011 | |||||||
| Land use right | $ | 1,007,004 | $ | 980,581 | ||||
| Less: Accumulated amortization | (133,732 | ) | (120,418 | ) | ||||
| $ | 873,272 | $ | 860,163 | |||||
Amortization expense charged to operations was $9,922 and $9,349 for the six months ended December 31, 2011 and 2010, respectively.
Note 9 - RELATED PARTY DEBT
Related party debt represents temporary short-term loans from the majority owner, Mr. Xin Sun, a PRC citizen and other related parties. These loans are unsecured, non-interest bearing and have no fixed terms of repayment, therefore, deemed payable on demand. Cash flows classified as due to the majority owner and other related parties are classified as cash flows from financing activities. The total borrowings from Mr. Sun and other related parties were $433,783 and $432,924 as of December 31, 2011 and June 30 2010, respectively.
Interest was imputed on the loans using the Chinese bank borrowing rate of 6.31% for the six months ended December 31, 2011. The total imputed interest expense was $13,695 and $2,336 for the six months ended December 31, 2011 and 2010, respectively.
Note 10 - COMMITMENTS AND CONTINGENCIES
China Health’s assets are located in PRC and revenues are derived from operations in PRC.
In terms of industry regulations and policies, the economy of PRC has been transitioning from a planned economy to market oriented economy. Although in recent years the Chinese government has implemented measures emphasizing the utilization of market forces for economic reforms, the reduction of state ownership of productive assets and the establishment of sound corporate governance in business enterprises, a substantial portion of productive assets in PRC are still owned by the Chinese government. For example, all lands are state owned and are leased to business entities or individuals through governmental granting of land use rights. The granting process is typically based on government policies at the time of grant and it could be lengthy and complex. This process may adversely affect our future manufacturing expansions. The Chinese government also exercises significant control over PRC’s economic growth through allocation of resources and providing preferential treatment to particular industries or companies. Uncertainties may arise with changing of governmental policies and measures.
China Health faces a number of risks and challenges not typically associated with companies in North America and Western Europe, since its assets exist solely in the PRC, and its revenues are derived from its operations therein. The PRC is a developing country with an early stage market economic system, overshadowed by the state. Its political and economic systems are very different from the more developed countries and are in a state of change. The PRC also faces many social, economic and political challenges that may produce major shocks, instabilities and even crises, in both its domestic arena and in its relationships with other countries, including the United States. Such shocks, instabilities and crises may in turn significantly and negatively affect China Health’s performance.
The Company is not involved in any legal matters arising in the normal course of business. While incapable of estimation, in the opinion of the management, the regulatory and legal matters in which the Company might be involved in the future are not expected to have a material adverse effect on the Company’s financial position, results of operations, or cash flows.
| 12 |
Rental expense was approximately $11,134 and $88,500, for the six months ended December 31, 2011 and 2010, respectively. Since the Company orally terminated the rental agreement, there is no rental commitment for the six months ended December 31, 2011. The rental commitment for the six months ended December 31, 2010 was nil.
Note 11 – MAJOR SUPPLIERS AND CUSTOMERS
The Company had two suppliers that accounted for 82% of purchases for the six months ended December 31, 2011 with each accounting for 55% and 27%, respectively.
The Company had three customers that accounted for 37% of the company’s total sales for the six months ended December 31, 2011 with each accounting for 13%, 12% and 12%, respectively.
The Company had three suppliers that accounted for 93% of purchases for the six months ended December 31, 2010 with each accounting for 71%, 11% and 11%, respectively.
The Company had no customer that accounted for more than 10% of the company’s total sales for the six months ended December 31, 2010.
| 13 |
Item 2. Management’s Discussion and Analysis of Financial Condition and Results of Operations.
FORWARD LOOKING STATEMENTS
The following discussion should be read in conjunction with the information contained in our consolidated financial statements and the notes thereto appearing elsewhere herein and “Forward Looking Statements” summary set forth in the forepart of this Quarterly Report as well as the “Risk Factors” section in our annual report on Form 10-K (“Annual Report”) for the year ended June 30, 2011 filed with SEC on September 28, 2011 and are afforded the safe harbor provisions of Section 27A of the Securities Act and Section 21E of the Securities Exchange Act of 1934, as amended. Readers should carefully review the risk factors disclosed in the Annual Report and other documents filed by us with the SEC.
DISCUSSION
We make certain forward-looking statements in this report. Statements concerning our future operations, prospects, strategies, financial condition, future economic performance (including growth and earnings), demand for our products, and other statements of our plans, beliefs, or expectations, including the statements contained under the captions “Management’s Discussion and Analysis of Financial Condition and Results of Operations,” “Business,” as well as captions elsewhere in this document, are forward-looking statements. In some cases these statements are identifiable through the use of words such as “anticipate,” “believe,” “estimate,” “expect,” “intend,” “plan,” “project,” “target,” “can”, “could,” “may,” “should,” “will,” “would,” and similar expressions. We intend such forward-looking statements to be covered by the safe harbor provisions contained in Section 27A of the Securities Act of 1933, as amended (the “Securities Act”) and in Section 21E of the Securities Exchange Act of 1934, as amended (the “Exchange Act”). The forward-looking statements we make are not guarantees of future performance and are subject to various assumptions, risks, and other factors that could cause actual results to differ materially from those suggested by these forward-looking statements. Because such statements are subject to risks and uncertainties, actual results may differ materially from those expressed or implied by the forward-looking statements. Indeed, it is likely that some of our assumptions will prove to be incorrect. Our actual results and financial position will vary from those projected or implied in the forward-looking statements and the variances may be material. You are cautioned not to place undue reliance on such forward-looking statements. These risks and uncertainties, together with the other risks described from time to time in reports and documents that we file with the SEC should be considered in evaluating forward-looking statements.
The nature of our business makes predicting the future trends of our revenue, expenses, and net income difficult. Thus, our ability to predict results or the actual effect of our future plans or strategies is inherently uncertain. The risks and uncertainties involved in our business could affect the matters referred to in any forward-looking statements and it is possible that our actual results may differ materially from the anticipated results indicated in these forward-looking statements. Important factors that could cause actual results to differ from those in the forward-looking statements include, without limitation, the following:
| · | the effect of political, economic, and market conditions and geopolitical events; | |
| · | legislative and regulatory changes that affect our business; | |
| · | the availability of funds and working capital; | |
| · | the actions and initiatives of current and potential competitors; | |
| · | investor sentiment; and | |
| · | our reputation. |
We do not undertake any responsibility to publicly release any revisions to these forward-looking statements to take into account events or circumstances that occur after the date of this report. Additionally, we do not undertake any responsibility to update you on the occurrence of any unanticipated events which may cause actual results to differ from those expressed or implied by any forward-looking statements.
| 14 |
The following discussion and analysis should be read in conjunction with our condensed consolidated financial statements and the related notes thereto as filed with the SEC and other financial information contained elsewhere in this Quarterly Report.
Except as otherwise indicated by the context, references in this Form 10-Q to “we,” “us,” “our,” “the Registrant,” “our Company,” or “the Company” are to China Health Industries Holdings, Inc., a Delaware corporation, China Health Industries Holdings Limited, and its wholly owned subsidiary, Harbin Humankind Biology Technology Co. Limited and indirect 99% owned subsidiary, Harbin Huimeijia Medicine Company. Unless the context otherwise requires, all references to (i) “PRC” and “China” are to the People’s Republic of China; (ii) “U.S. dollar,” “$” and “US$” are to United States dollars; (iii) “RMB” are to Renminbi Yuan of China; (iv) “Securities Act” are to the Securities Act of 1933, as amended; and (v) “Exchange Act” are to the Securities Exchange Act of 1934, as amended.
Our History
The Company was incorporated in the state of Arizona on July 11, 1996 and was the successor of a business known as Arizona Mist, Inc. which began in 1989. On May 9, 2005, the Company entered into a stock purchase agreement and share exchange (effecting a reverse merger) with Edmonds 6, Inc. (“Edmonds 6”) and our name was changed to Universal Fog, Inc. Edmonds 6 was incorporated on August 19, 2004 under the laws of the State of Delaware to engage in any lawful corporate undertaking, including, but not limited to, selected mergers and acquisitions. Pursuant to this agreement, Universal Fog, Inc. (which has been in continuous operation since 1996) became a wholly-owned subsidiary of Edmonds 6.
The Company began manufacturing systems for outdoor cooling in Arizona and quickly expanded to distribute throughout the United States. Our primary product was a misting system which consisted of a high pressure pump assembled to specifications.
Pursuant to the Securities Purchase Agreement dated as of September 10, 2007 between the Company, Thomas Bontems (“Bontems”) and Xin Sun, we experienced a change in control whereby Xin Sun acquired a total of 22,000,545 shares of common stock of the Company from Bontems and the Company issued 2,061,200 shares of common stock of the Company to Xin Sun, such that upon consummation of the agreement, Xin Sun held an aggregate of 24,061,745 shares, or 51.53% of the total issued and outstanding shares of common stock of the Company on a fully-diluted basis.
Pursuant to the Asset Purchase and Sale Agreement dated September 10, 2007 between the Company and Universal Fog Systems, Inc., we then transferred all our liabilities to the latter on September 10, 2007 and similarly, all our assets on December 31, 2008.
On December 31, 2008, we acquired the business of Harbin Humankind Biology Technology Co. Limited through the acquisition of all the shares of China Health Industries Holdings Limited under the share exchange agreement dated October 15, 2007.
As a result of the above, China Health Industries Holdings Limited is now our wholly-owned subsidiary. Because Harbin Humankind Biology Technology Co., Limited (“Humankind”) is a wholly-owned subsidiary of China Health Industries Holdings Limited and Harbin Huimeijia Medicine Company (“Huimeijia”) is in turn a subsidiary of which 99% equity interest are owned by Harbin Humankind, both Harbin Humankind and Huimeijia are our indirectly owned subsidiaries.
Business Overview
Our principal business operations are conducted through our wholly owned subsidiary, Humankind and Humankind’s subsidiary, Huimeijia.
Humankind was incorporated in the People’s Republic of China (“PRC”) on December 14, 2003 and completed its Good Manufacturing Practice (“GMP”) certification on April 24, 2007. It is in the business of manufacture and sale of health products, “green” (or organic) food and detection of disease susceptibility or pre-disposition through genetic studies.
| 15 |
Huimeijia was incorporated in the PRC on October 14, 2008. Huimeijia completed its GMP certification on July 23, 2009 and will be producing and selling our drugs. As of the date of this report, Huimeijia has not started any production or sales.
Our business is conducted through our sales agents and sales personnel. We sell our products to the sales agents and sales personnel, and our sales agents and sales people then sell our products to the customers. We have sales agents located in Jiangsu, Zhejiang, Gansu, Shanghai, Anhui and Beijing. Our sales through agents in Zhejiang, Jiangsu and Gansu provinces accounted for 12%, 13% and 12% of our total sales respectively for the six months ended December 31, 2011. We expect to sell our products over the internet eventually. As of the date of this report, we have not started selling our products over the internet yet.
We have, through Humankind, licenses to manufacture and sell two health supplement products, each of which has a State Good Health Issue Number assigned to it (as provided below). In addition, Humankind distributes and sells 52 kinds of health food.
We are licensed to sell our products only in the PRC.
| (i) | Health Supplements |
Our “QunLe” brand Sailuozhi soft capsule, which is made from frog oil, soybean isoflavone, procyanidine (made from grape seeds) and vitamin C, is for freckle removal and supplementing the water content of the skin. The certification number issued by the State Food and Drug Administration on August 29, 2007 is 2007B0837.
On May 12, 2010, we received a patent for this product (200610010394.4) under the name “Run Chao” (which has now been changed to “Qunle”) with the National Bureau of Intellectual Property.
Pursuant to a technology transfer agreement dated October 12, 2007 (“Technology Transfer Agreement”), we purchased another health product known as “Kindlink” brand propolis and black ant capsule made from propolis, black ant, acanthopanax, astragalus root from Beijing Jindelikang Bio-Technology Co., Ltd. (“Jindelikang”). The change of the ownership has been approved by the State Food and Drug Administration. This product is consumed to boost one’s immunity. The certification number issued by the State Food and Drug Administration on August 20, 2004 for the license to manufacture the product is GuoShiJianZi G20040906. We have no continuing obligations under the Technology Transfer Agreement.
| (ii) | Health Food and Organic “Green” Food |
Our health and organic “green” food products include (i) Abalone, Sea Cucumber and Frog Oil Soft Capsules (Serial Number 016-2007), (ii) Ganodermalucidum and Aweto Soft Capsules (Serial Number 017-2007), (iii) Propolis Soft Capsules, (iv) Deep Sea Fish Oil (Serial Number 012-2006), (v) Liquid Calcium (Serial Number 013-2006), (vi) Multi-Vitamins (Serial Number 010-2007), (vii) Soybean Isoflavone (Serial Number 012-2006) and (viii) Royal Jelly (Serial Number 011-2006), (ix) Sleeping Beauty Capsule, (x) Virility Max Capsule, (xi) Ruddy Granule, (xii) Blood Cleanser Soft Capsule, (xiii) Colon Cleanser Capsule, (xiv) Energy Elemental Power and (xv) Waterlilies Soft Capsule(Sailuozhi) .
| 16 |
Results of Operations
For the three months ended December 31, 2011 as compared to three months ended December 31, 2010
| December 31, 2011 | December 31, 2010 | Percent Change | ||||||||||
| REVENUES | ||||||||||||
| Product Sales | $ | 23,973,612 | $ | 13,363,093 | 79.4 | % | ||||||
| Total revenues | $ | 23,973,612 | 13,363,093 | |||||||||
| COST OF GOODS SOLD | ||||||||||||
| Cost of goods sold | $ | 14,401,135 | $ | 6,708,036 | 114.7 | % | ||||||
| Gross Profit | $ | 9,572,477 | $ | 6,655,057 | 43.84 | % | ||||||
Revenue
Total revenues increased by $10,610,519, or 79.40%, for the three months ended December 31, 2011 compared to the same period in 2010. The increase in revenues was attributable to growth in product sales. This growth in product sales was attributable to increase in sales volume resulting from our efforts to continue to develop our distribution channels by hiring additional sales agents to ensure that our products and their benefits are introduced to those making or influencing the purchasing decisions.
Our cost of sales increased $7,693,099, or 114.68% for the three months ended December 31, 2011 compared to the same period in 2010. The costs of sales increased as a result of the increase in sales. The costs of sales did not increase in proportion to sales is because the regional sales agents get 25% discount of sales prices.
Our gross margin decreased 9.87% from 49.80% for the three months ended December 31, 2010 to 39.93% for the three months ended December 31, 2011. This decrease was primarily attributable to an increase in raw material costs and a 25% discount of sales prices offered to the regional sales agents. Due to high inflation in the People’s Republic of China, the prices of many of our raw materials have increased. We seek to establish relationships with more suppliers to lower our raw material costs.
Sales by Product Line
A break-down of our sales by major product line for the three months ended December 31, 2011 and 2010 is as follows:
| For the Three Months Ended December 31, | ||||||||||||||||||||||||
| 2011 | 2010 | |||||||||||||||||||||||
| Quantity | Quantity | % of | ||||||||||||||||||||||
| Product Category* | (Unit) | Sales US$ | % of Sales | (Unit) | Sales US$ | Sales | ||||||||||||||||||
| Sleeping Beauty Capsule | 63,580 | 862,456 | 3.60 | % | 22,758 | 344,334 | 2.58 | % | ||||||||||||||||
| Ruddy Granule | 64,370 | 1,757,833 | 7.34 | % | 33,956 | 1,027,525 | 7.69 | % | ||||||||||||||||
| Virility Max Capsule | 132,277 | 2,951,526 | 12.31 | % | 72,787 | 1,835,474 | 13.74 | % | ||||||||||||||||
| Blood Cleanser Soft Capsule | 64,491 | 1,751,182 | 7.30 | % | 41,107 | 1,243,917 | 9.31 | % | ||||||||||||||||
| Energy Elemental Powder | 61,032 | 690,621 | 2.88 | % | 10,379 | 130,864 | 0.98 | % | ||||||||||||||||
| Waterlilies Soft Capsule(Sailuozhi) | 141,969 | 11,783,327 | 49.15 | % | 67,407 | 6,374,275 | 47.70 | % | ||||||||||||||||
| Colon Cleanser Capsule | 144,678 | 4,176,667 | 17.42 | % | 73,415 | 2,406,704 | 18.01 | % | ||||||||||||||||
| Total | 23,973,612 | 100 | % | 13,363,093 | 100 | % | ||||||||||||||||||
*All of the products are manufactured by the Company.
| 17 |
Operating Expenses
The following table summarizes our operating expenses for the three months ended December 31, 2011 and 2010, respectively:
| For the Three Months Ended | ||||||||||||
| December 31, | ||||||||||||
| Percent | ||||||||||||
| 2011 | 2010 | Change | ||||||||||
| Operating Expenses | ||||||||||||
| Selling, general and administrative | $ | 2,286,370 | $ | 1,227,027 | 86.33 | % | ||||||
| Depreciation and amortization | 15,862 | 20,099 | (21.08 | )% | ||||||||
| Research and development | 120,024 | 34,115 | (251.82 | )% | ||||||||
| Total operating expenses | $ | 2,422,256 | $ | 1,281,241 | 89.06 | % | ||||||
Total operating expenses for the three months ended December 31, 2011 increased $1,141,015 or 89.06% compared to the same period in 2010. The higher operating expenses were primarily attributable to the increase in selling expenses as a result of increased bonus to sales agents and management, which related to the increase of sales. The Company also recognized the costs of research and development ratably over the terms of the technology development agreements it entered into during the period from April 9, 2010 through July 7, 2010.
Interest Income and Interest Expense
Interest income was $76,778 for the three months ended December 31, 2011 and $39,282 for the three months ended December 31, 2010. The increase was primarily due to accrued interests from the loan to Heilongjiang Tiefeng Rice Company Limit and increased interests from deposits in banks.
We incurred imputed interest expense in the amount of $6,595 for the three months ended December 31, 2011 and $1,168 for the three months ended December 31, 2010 on the loans payable to Mr. Xin Sun, chief executive officer and majority shareholder of our Company. These loans are unsecured, non-interest bearing and have no fixed terms of repayment.
Income Taxes
Income taxes were $2,041,873, an increase of $493,851 for the three months ended December 31, 2011 as compared to $1,548,022 for the same period in 2010. The increase was primarily attributable to increase in income before income taxes in the amount of $1,808,474.
Results of Operations
For the six months ended December 31, 2011 as compared to six months ended December 31, 2010
| December 31, 2011 | December 31, 2010 | Percent Change | ||||||||||
| REVENUES | ||||||||||||
| $ | 46,167,138 | $ | 24,980,486 | 84.81 | % | |||||||
| Total revenues | $ | 46,167,138 | 24,980,486 | |||||||||
| COST OF GOODS SOLD | ||||||||||||
| Cost of goods sold | $ | 27,371,201 | $ | 12,693,331 | 115.6 | % | ||||||
| Gross Profit | $ | 18,795,937 | $ | 12,287,155 | 52.97 | % | ||||||
| 18 |
Revenue
Total revenues increased by $21,186,652, or 84.81%, for the six months ended December 31, 2011 compared to the same period in 2010. The increase in revenues was attributable to growth in product sales. This growth in product sales was attributable to increase in sales volume resulting from our efforts to continue to develop our distribution channels by hiring additional sales agents to ensure that our products and their benefits are introduced to those making or influencing the purchasing decisions.
Our cost of sales increased $14,677,870, or 115.63% in the six months ended December 31, 2011 compared to the same period in 2010. The costs of sales increased as a result of the increase in sales. The costs of sales did not increase in proportion to sales is because the regional sales agents get 25% discount of sales prices.
Our gross margin decreased 9.02% from 49.19% for the six months ended December 31, 2010 to 40.71% for the six months ended December 31, 2011. This decrease was primarily attributable to an increase in the raw material costs and a 25% discount of sales prices offered to the regional sales agents. Due to high inflation in the People’s Republic of China, the prices of many of our raw materials have increased. We seek to establish relationships with more suppliers to lower our raw material costs.
Sales by Product Line
A break-down of our sales by major product line for the six months ended December 31, 2011 and 2010 is as follows:
| For the Six Months Ended December 31, | ||||||||||||||||||||||||
| 2011 | 2010 | |||||||||||||||||||||||
| Quantity | Quantity | % of | ||||||||||||||||||||||
| Product Category* | (Unit) | Sales US$ | % of Sales | (Unit) | Sales US$ | Sales | ||||||||||||||||||
| Sleeping Beauty Capsule | 118,566 | 1,640,500 | 3.55 | % | 61,251 | 926,608 | 3.71 | % | ||||||||||||||||
| Ruddy Granule | 121,851 | 3,373,720 | 7.31 | % | 59,815 | 1,809,850 | 7.24 | % | ||||||||||||||||
| Virility Max Capsule | 253,958 | 5,717,133 | 12.39 | % | 133,343 | 3,349,307 | 13.41 | % | ||||||||||||||||
| Blood Cleanser Soft Capsule | 123,024 | 3,404,148 | 7.37 | % | 74,910 | 2,266,575 | 9.07 | % | ||||||||||||||||
| Energy Elemental Powder | 118,620 | 1,363,458 | 2.95 | % | 28,954 | 365,013 | 1.46 | % | ||||||||||||||||
| Waterlilies Soft Capsule(Sailuozhi) | 271,814 | 22,716,940 | 49.21 | % | 117,229 | 11,084,551 | 44.37 | % | ||||||||||||||||
| Colon Cleanser Capsule | 273,653 | 7,951,239 | 17.22 | % | 157,989 | 5,178,582 | 20.73 | % | ||||||||||||||||
| Total | 46,167,138 | 100 | % | 24,980,486 | 100 | % | ||||||||||||||||||
*All of the products are manufactured by the Company.
Operating Expenses
The following table summarizes our operating expenses for the six months ended December 31, 2011 and 2010, respectively:
| For the Six Months Ended | ||||||||||||
| December 31, | ||||||||||||
| Percent | ||||||||||||
| 2011 | 2010 | Change | ||||||||||
| Operating Expenses | ||||||||||||
| Selling, general and administrative | $ | 4,129,519 | $ | 24,884,193 | 65.95 | % | ||||||
| Depreciation and amortization | 30,561 | 39,796 | (23.21 | )% | ||||||||
| Research and development | 240,045 | 771,543 | (68.89.21 | )% | ||||||||
| Total operating expenses | $ | 4,400,128 | $ | 3,299,758 | 33.35 | % | ||||||
| 19 |
Total operating expenses for the six months ended December 31, 2011 increased $1,100,370 or 33.35% over the same period in 2010. The higher operating expenses were primarily attributable to the increase in selling expenses as a result of increased bonus to sales agents and management, which related to the increase of sales.
Interest Income and Interest Expense
Interest income was $149,916 for the six months ended December 31, 2011 and $78,637 for the six months ended December 31, 2010. The increase was primarily due to accrued interest from the loan to Heilongjiang Tiefeng Rice Company Limited.
We incurred imputed interest expenses in the amount of $13,695 for the six months ended December 31, 2011 and $2,336 for the six months ended December 31, 2010 on the loans payable to Mr. Xin Sun, chief executive officer and majority shareholder of our Company. These loans are unsecured, non-interest bearing and have no fixed terms of repayment.
Income Taxes
Income taxes were $4,038,601 for the six months ended December 31, 2011, an increase of $1,375,165 compared to $2,663,436 for the same period in 2010. The increase was primarily attributable to increase in income before income taxes in the amount of $5,468,332.
2012 Outlook
We anticipate our total revenues in 2012 versus 2011 to increase by 20% or approximately $12.5 million with growth in all categories of our product sales. Our gross profit margin in 2012 is expected to be approximately 47% due to increase in raw material costs resulting from inflation. We estimate our overall 2012 net profit margin to be approximately 26%. However, there is no assurance that these predictions will be reached.
Liquidity and Capital Resources
We believe our current working capital position together with our expected future cash flows from operations will be adequate to fund our operations in the ordinary course of business, anticipated capital expenditures, debt payment requirements and other contractual obligations for at least the next twelve months. However, this belief is based upon many assumptions and is subject to numerous risks, and there can be no assurance that we will not require additional funding in the future.
The following table summarizes our cash and cash equivalents position, our working capital, and our cash flow activity as of December 31, 2011 and 2010 and for each of the six months then ended:
| 2011 | 2010 | |||||||
| As of December 31: | ||||||||
| Cash and cash equivalents | $ | 27,608,798 | $ | 19,716,525 | ||||
| Working capital | $ | 42,804,068 | $ | 22,283,596 | ||||
| Inventories | $ | 957,958 | $ | 311,243 | ||||
| For the Six Months Ended December 31: | ||||||||
| Cash provided by (used in): | ||||||||
| Operating activities | $ | 3,622,415 | $ | 6,484,326 | ||||
| Investing activities | $ | (555,433 | ) | $ | (32,002 | ) | ||
| Financing activities | $ | - | $ | 2,601 | ||||
| 20 |
As of December 31, 2011, cash and cash equivalents were $27,608,798 as compared to $19,716,525 at December 31, 2010. The increased cash and cash equivalents position was $7,892,273 or 40.03% at December 31, 2011. The increase in cash and cash equivalents was primarily attributable to increase in cash flows provided by operating activities.
Cash provided by operating activities was $3,622,415 for the six months ended December 31, 2011 compared to cash provided by operating activities of $6,484,326 for the same period in 2010. The decrease of $2,861,911 in cash provided by operating activities was primarily attributable to the increase in accounts receivable in the amount of $8,799,797.
Our working capital position at December 31, 2011 was $42,804,068, compared to working capital of $22,283,596 at December 31, 2010. Our increased working capital position in 2011 was principally funded by the increase in accounts receivable generated by increased sales. Management considers current working capital and borrowing capabilities adequate to cover our current operating and capital requirements.
We have no present agreements or commitments with respect to any material acquisitions of other businesses, products, product rights or technologies or any other material capital expenditures. However, we will continue to evaluate acquisitions of and/or investments in products, technologies, capital equipment or improvements or companies that complement our business and may make such acquisitions and/or investments in the future. Accordingly, we may need to obtain additional sources of capital in the future to finance any such acquisitions and/or investments. We may not be able to obtain such financing on commercially reasonable terms, if at all. Due to the ongoing global economic crisis, we believe it may be difficult to obtain additional financing if needed. Even if we are able to obtain additional financing, it may contain undue restrictions on our operations, in the case of debt financing, or cause substantial dilution for our stockholders, in the case of equity financing.
Plan of Operation
We will continue to focus on the expansion of our operation, development of new products and increase new customers. Additionally, we are putting more effort to develop our distribution channels by hiring more sales agents and sales people. We presently have enough liquidity to meet our expansion plans. However, depending on growth, the Company may need additional funding in the future.
Currency Exchange Fluctuations
Aggregate net foreign currency translation gains included in the condensed consolidated statements of operations were $1,165,121 and $201,001, for the six months ended December 31, 2011 and 2010, respectively, primarily due to the decline of the value of USD against RMB. The average exchange rates from USD to RMB were 6.3876 to 1 and 6.7788 to 1 for the six months ended December 31, 2011 and 2010, respectively, or a 5.77% change.
Off-Balance Sheet Arrangements
We do not have any off-balance sheet arrangements that are currently material or reasonably likely to be material to our financial position or results of operations.
Critical Accounting Policies and Estimates
This discussion and analysis of financial condition and results of operations is based on our condensed consolidated financial statements, which have been prepared in accordance with U.S. generally accepted accounting principles. The preparation of these financial statements requires us to make estimates and judgments that affect the reported amounts of assets, liabilities, revenues and expenses and related disclosures. On an on-going basis, we evaluate our estimates, including those related to property, plant and equipment, inventories, revenue recognition, accounts receivable, derivative warrant liability, warranty reserve, goodwill and intangibles, stock based compensation, and foreign currency transactions and translation. We base our estimates on historical experience and on various other market-specific assumptions that are believed to be reasonable under the circumstances, the results of which form the basis for making judgments about the carrying values of assets and liabilities that are not readily apparent from other sources. Actual results, however, may differ significantly from these estimates.
| 21 |
We believe the following critical accounting policies reflect the more significant judgments and estimates used in the preparation of our consolidated financial statements:
Accounts Receivable
The accounts receivable incurred in the current reporting period was primarily due to the receivables from our sales agents. These sales agents are our new customers and we offer these agents 60 days to 90 days term in order to increase our sales. Most of the products were sold to the end customers directly and the end customers made payments upon receipt of our product. The credit sale system has not been well established in the PRC. Our sale agreements with our customers provide that risk of loss passes to the customers upon delivery and that we accept product exchanges but we do not have a policy for product returns. Accordingly, accounts receivable are recorded at the invoiced amount and do not bear interest. We extend unsecured credit to our customers in the ordinary course of business but mitigate the associated risks by performing credit checks and actively pursuing past due accounts. An allowance for doubtful accounts is established and determined based on managements’ assessment of known requirements, aging of receivables, payment history, the customer’s current credit worthiness, and the economic environment.
Recognition of Revenue
We recognize revenue when it is both earned and realized or realizable. Our revenue comprises the fair value of the consideration received or receivable for the sale of goods and services net of value-added tax and other sales taxes, discounts, and after eliminating sales within the Group.
Our principal sources of revenue are from sales of our products through our direct sales professionals. These sales occur either through a purchase order submitted by the customer or through our direct marketing sales agents. We recognize revenue when title to the product, ownership and risk of loss have transferred to the customer, persuasive evidence of an arrangement exits and collection of the sales proceeds is reasonably assured, all of which generally occur upon shipment of goods to customers.
Most of our products are sold to end customers directly and customers made payments promptly. The Company may offer sales incentives and cash discounts to customers or resellers as a reduction of revenue rather than an operating expense. For the six months ended December 31, 2011 and 2010, the Company did not provide sales incentives to its customers or resellers.
We allow our customers to return product for exchange or credit subject to certain limitations. A provision for such returns is recorded based upon historical experience. We have reserve against revenue recognized for product exchange. The consumer credit system has not been well established and recognized by sellers in the PRC. Except for our sales agents, our end customers pay us instantaneously when they receive orders.
Cost
Matching Principle-Costs have to be matched with revenues and our costs always match with revenue. Cost of production is calculated based on actual number of products manufactured and matched with revenues as long as it is reasonable to do so. There has been no change in our calculation of cost of production. There are no circumstances that cause variations in our calculation of cost of production. Expenses are recognized not when the product is produced, but when the work or the product actually makes its contribution to revenue. Only if no connection with revenue can be established, cost may be charged as expenses to the expenses to the current period (e.g. office salaries and other administrative expenses). This principle allows greater evaluation of actual profitability and performance.
Cost of production is calculated based on actual number of products manufactured. We calculate the cost of production at the end of each month. If there is any work in progress, the cost of production is allocated between finished products and work in progress. Below is a detailed step-by-step description of our cost of production calculation:
| 22 |
| a. | Determine end-of-period quantity and amount of finished goods, semi-finished products, raw materials, and packing materials. | |
| b. | Based on sales plan, the Company purchases raw materials and packing materials by batches and calculate stock-in and stock-out quantity and amount respectively. Summary calculation will be made based on actual quantity of consumption at the end of each month. | |
| c. | Collect manufacturing overhead of each month, including depreciation, labor, water charge, electric charge, the consumptions of low value consumables. Distribute manufacturing overhead based on volume of production and make expense distribution sheet. | |
| d. | Apportion raw materials, packing materials and manufacturing overhead of each products in each month to finished-goods and semi-finished products. Carry over Cost of Goods Sold according to sales quantity. |
Foreign Currency Translation
The Company’s two operating subsidiaries maintain their financial statements in the functional currency, which is PRC currency “Renminbi” (“RMB”). Another subsidiary maintains its financial statements in a different functional currency, which is Hong Kong Dollar (“HKD”). Monetary assets and liabilities denominated in currencies other than the functional currencies are translated into the functional currency at rates of exchange prevailing at the balance sheet dates. Transactions denominated in currencies other than the functional currency are translated into the functional currency at the exchanges rates prevailing at the dates of the transaction. Exchange gains or losses arising from foreign currency transactions are included in the determination of net income for the respective periods.
For financial reporting purposes, the financial statements of subsidiaries, which are prepared using the functional currency, have been translated into reporting currency, the United States Dollars (“USD”). Assets and liabilities are translated at the prevailing exchange rate at each reporting period end date, revenue and expenses are translated at the average exchange rates, and stockholders’ equity is translated at historical exchange rates. Translation adjustments are not included in determining net income but are included in foreign exchange adjustment to other comprehensive income, a component of stockholders’ equity.
Recently Issued Accounting Pronouncements
In May 2011, Accounting Standards Update (“ASU”) 2011-04 was issued. This update amends Topic 820 to achieve common fair value measurement and disclosure requirement in US GAAP and IFRSs. The Company’s management believes that this pronouncement will not have a material effect on its financial position, results of operations or cash flows.
In June 2011, FASB issued the ASU 2011-05 “Presentation of Comprehensive Income” to amend ASC Topic 220. This update allows an entity to have the option to present the total of comprehensive income, the components of net income, and the components of other comprehensive income either in a single continuous statement of comprehensive income or in two separate but consecutive statements. In both choices, an entity is required to present each component of net income along with total net income, each component of other comprehensive income along with a total for other comprehensive income, and a total amount for comprehensive income. This update eliminates the option to present the components of other comprehensive income as part of the statement of changes in stockholders' equity. The amendments in this update do not change the items that must be reported in other comprehensive income or when an item of other comprehensive income must be reclassified to net income. The Company’s management believes that this pronouncement will not have a material effect on its financial position, results of operations or cash flows.
In September 2011, Accounting Standards Update (“ASU”) 2011-08 was issued. This update allows an entity to first assess qualitative factors to determine whether it is necessary to perform the two-step quantitative goodwill impairment test. The Company’s management believes that this pronouncement will not have a material effect on its financial position, results of operations or cash flows.
| 23 |
Item 3. Quantitative and Qualitative Disclosures About Market Risk.
Not applicable.
Item 4. Controls and Procedures.
Evaluation of our Disclosure Controls
As of the end of the period covered by this Quarterly Report on Form 10-Q, our principal executive officer and principal financial officer have evaluated the effectiveness of our “disclosure controls and procedures” (“Disclosure Controls”). Disclosure Controls, as defined in Rule 13a-15(e) of the Securities Exchange Act of 1934, as amended (the “Exchange Act”), are procedures that are designed with the objective of ensuring that information required to be disclosed in our reports filed under the Exchange Act, such as this Quarterly Report, is recorded, processed, summarized and reported within the time periods specified in the Securities and Exchange Commission’s rules and forms. Disclosure Controls are also designed with the objective of ensuring that such information is accumulated and communicated to our management, including the Chief Executive Officer (“CEO”) and Chief Financial Officer (“CFO”), as appropriate to allow timely decisions regarding required disclosure. Our management, including the CEO and CFO, does not expect that our Disclosure Controls will prevent all error and all fraud. A control system, no matter how well conceived and operated, can provide only reasonable, not absolute, assurance that the objectives of the control system are met. Further, the design of a control system must reflect the fact that there are resource constraints, and the benefits of controls must be considered relative to their costs. Because of the inherent limitations in all control systems, no evaluation of controls can provide absolute assurance that all control issues and instances of fraud, if any, within the company have been detected. These inherent limitations include the realities that judgments in decision-making can be faulty, and that breakdowns can occur because of simple error or mistake. The design of any system of controls also is based in part upon certain assumptions about the likelihood of future events, and there can be no assurance that any design will succeed in achieving its stated goals under all potential future conditions.
Based upon their controls evaluation, our CEO and CFO have concluded that our Disclosure Controls were effective at a reasonable assurance level as of December 31, 2011.
Changes in internal control over financial reporting
There have been no changes in our internal controls over financial reporting during our second fiscal quarter that have materially affected, or are reasonably likely to materially affect, our internal control over financial reporting.
PART II - OTHER INFORMATION
Item 1. Legal Proceedings.
There is no material legal proceeding pending against us.
Item 1A. Risk Factors.
Not applicable.
Item 2. Unregistered Sales of Equity Securities and Use of Proceeds.
None.
Item 3. Defaults Upon Senior Securities.
None.
| 24 |
Item 4. (Removed and Reserved).
Item 5. Other Information.
None.
Item 6. Exhibits.
| Exhibit | ||
| Number | Description of Exhibit | |
| 31 | Certification of Principal Executive Officer and Principal Financial Officer pursuant to Rule 13a-14 and Rule 15d-14(a), promulgated under the Securities and Exchange Act of 1934, as amended. | |
| 32 | Certification pursuant to 18 U.S.C. Section 1350, as adopted pursuant to Section 906 of the Sarbanes-Oxley Act of 2002. | |
| 101.INS | XBRL Instance Document* | |
| 101.SCH | XBRL Schema Document* | |
| 101.CAL | XBRL Calculation Linkbase Document* | |
| 101.LAB | XBRL Label Linkbase Document* | |
| 101.PRE | XBRL Presentation Linkbase Document* | |
| 101.DEF | XBRL Definition Linkbase Document* |
* Attached as Exhibits 101 to this report are the following financial statements from the Company’s Quarterly Report on Form 10-Q for the quarter ended December 31, 2011 formatted in XBRL (eXtensible Business Reporting Language): (i) the Condensed Consolidated Balance Sheets, (ii) the Condensed Consolidated Statements of Income and Comprehensive Income, (iii) the Condensed Consolidated Statements of Cash Flows, and (iv) related notes to these financial statements tagged as blocks of text. The XBRL-related information in Exhibits 101 to this Quarterly Report on Form 10-Q shall not be deemed “filed” or a part of a registration statement or prospectus for purposes of Sections 11 or 12 of the Securities Act of 1933, as amended, and is not filed for purposes of Section 18 of the Securities Exchange Act of 1934, as amended, or otherwise subject to the liabilities of those sections.
SIGNATURES
Pursuant to the requirements of the Securities Exchange Act of 1934, the registrant has duly caused this report to be signed on its behalf by the undersigned thereunto duly authorized.
| CHINA HEALTH INDUSTRIES HOLDINGS, INC. | |
| Date: February 14, 2012 | |
| /s/ Xin Sun | |
| Xin Sun | |
| Chief Executive Officer and Chief Financial Officer |
| 25 |