Attached files
| file | filename |
|---|---|
| EXCEL - IDEA: XBRL DOCUMENT - China Health Industries Holdings, Inc. | Financial_Report.xls |
| EX-31.2 - EXHIBIT 31.2 - China Health Industries Holdings, Inc. | exhibit31-2.htm |
| EX-32.1 - EXHIBIT 32.1 - China Health Industries Holdings, Inc. | exhibit32-1.htm |
| EX-31.1 - EXHIBIT 31.1 - China Health Industries Holdings, Inc. | exhibit31-1.htm |
UNITED STATES
SECURITIES AND EXCHANGE COMMISSION
WASHINGTON, D.C.
20549
FORM 10-Q
(Mark One)
[X] QUARTERLY REPORT PURSUANT TO SECTION 13 or 15(d) OF THE SECURITIES EXCHANGE ACT OF 1934.
For the quarterly period ended March 31, 2015
[ ] TRANSITION REPORT PURSUANT TO SECTION 13 OR 15(d) OF THE SECURITIES EXCHANGE ACT OF 1934.
For the transition period from ____________ to ____________
Commission File Number: 000-51060
CHINA HEALTH INDUSTRIES HOLDINGS, INC.
(Exact name of registrant as specified in its charter)
| Delaware | 86-0827216 |
| (State or other jurisdiction of | (IRS Employer |
| incorporation or organization) | Identification No.) |
168 Binbei Street, Songbei District
Harbin City,
Heilongjiang Province
People’s Republic of China 150028
(Address of principal executive offices) (Zip Code)
86-451-88100688
(Issuer's telephone number,
including area code)
Not Applicable
(Former name, former address
and former fiscal year, if changed since last report)
Indicate by check mark whether the issuer (1) filed all reports required to be filed by Section 13 or 15(d) of the Securities Exchange Act of 1934 during the preceding 12 months (or for such shorter period that the registrant was required to file such reports), and (2) has been subject to such filing requirements for the past 90 days. Yes [X] No [ ]
Indicate by check mark whether the registrant has submitted electronically and posted on its corporate Web site, if any, every Interactive Data File required to be submitted and posted pursuant to Rule 405 of Regulation S-T (§232.405 of this chapter) during the preceding 12 months (or for such shorter period that the registrant was required to submit and post such files). Yes [X] No [ ]
Indicate by check mark whether the registrant is a large accelerated filer, an accelerated filer, a non-accelerated filer, or a smaller reporting company. See the definitions of “large accelerated filer,” “accelerated filer” and “smaller reporting company” in Rule 12b-2 of the Exchange Act.
| Large accelerated filer [ ] | Accelerated filer [ ] |
| Non-accelerated filer [ ] | Smaller reporting company [X] |
| ( Do not check if a smaller reporting company ) |
Indicate by check mark whether the registrant is a shell company (as defined in Rule 12b-2 of the Exchange Act). Yes [ ] No [X]
APPLICABLE ONLY TO CORPORATE ISSUERS:
Indicate the number of shares outstanding of each of the issuer's classes of common stock, as of the latest practicable date: As of May 11, 2015, there are 65,539,737 shares of common stock, $0.0001 par value, issued and outstanding.
TABLE OF CONTENTS
| PART I | FINANCIAL INFORMATION | Page | |
| Item 1. |
Financial Statements (Unaudited) |
1 | |
|
|
|||
|
Condensed Consolidated Balance Sheets As of March 31, 2015 and June 30, 2014 (Unaudited) |
1 | ||
|
|
|||
|
Condensed Consolidated and Combined Statements of Operations and Comprehensive Income For the Three Months and Six Months Ended March 31, 2015 and 2014 (Unaudited) |
2 | ||
|
|
|||
|
Condensed Consolidated and Combined Statements of Cash Flows For the Nine Months Ended March 31, 2015 and 2014 (Unaudited) |
3 | ||
|
|
|||
|
Notes to Condensed Consolidated and Combined Financial Statements As of March 31, 2015 (Unaudited) |
4 | ||
|
|
|||
| Item 2. |
Management’s Discussion and Analysis of Financial Condition and Results of Operations |
18 | |
|
|
|||
| Item 3. |
Quantitative and Qualitative Disclosures About Market Risk |
26 | |
|
|
|||
| Item 4. |
Controls and Procedures |
26 | |
|
|
|||
| PART II |
OTHER INFORMATION |
27 | |
|
|
|||
| Item 6. |
Exhibits |
27 | |
|
|
|||
| Signatures |
|
28 | |
| Exhibits/Certifications |
|
29 |
PART I
FINANCIAL INFORMATION
| Item 1. | Financial Statements |
| CHINA HEALTH INDUSTRIES HOLDINGS, INC. AND SUBSIDIARIES |
| CONDENSED CONSOLIDATED BALANCE SHEETS |
| (UNAUDITED) |
| March 31, | June 30, | |||||
|
|
2015 | 2014 | ||||
|
ASSETS |
||||||
|
|
||||||
|
Current assets |
||||||
|
Cash and cash equivalents |
$ | 29,034,685 | $ | 27,232,074 | ||
|
Notes receivable |
- | 28,095 | ||||
|
Accounts receivable, net |
1,350,831 | 2,230,746 | ||||
|
Inventory |
838,156 | 1,037,939 | ||||
|
Other receivables, net |
48,561 | 83,570 | ||||
|
Advance to suppliers |
34,325 | 40,504 | ||||
|
Prepaid expenses |
- | 101,965 | ||||
|
Total current assets |
31,306,558 | 30,754,893 | ||||
|
|
||||||
|
Property, plant and equipment, net |
4,416,931 | 4,661,072 | ||||
|
Intangible assets, net |
5,053,860 | 5,452,161 | ||||
|
Construction in progress |
534,983 | 1,934 | ||||
|
Total assets |
$ | 41,312,332 | $ | 40,870,060 | ||
|
|
||||||
|
LIABILITIES AND EQUITY |
||||||
|
|
||||||
|
Current liabilities |
||||||
|
Short-term loans |
$ | 1,613,163 | $ | 1,611,967 | ||
|
Accounts payable and accrued expenses |
534,257 | 627,109 | ||||
|
Other payables |
62,298 | 83,798 | ||||
|
Advance from customers |
742,428 | 245,308 | ||||
|
Related party debts |
1,823,709 | 1,776,851 | ||||
|
Wages payable |
153,613 | 69,544 | ||||
|
Taxes payable |
155,206 | 403,970 | ||||
|
Total current liabilities |
5,084,674 | 4,818,547 | ||||
|
|
||||||
|
Equity |
||||||
|
Common stock, ($0.0001
par value, 300,000,000 |
$ | 6,224 | $ | 6,224 | ||
|
Additional paid-in capital |
27,317 | 27,317 | ||||
|
Accumulated other comprehensive income |
3,269,649 | 3,242,959 | ||||
|
Statutory reserve |
38,679 | 38,679 | ||||
|
Retained earnings |
32,885,554 | 32,736,081 | ||||
|
Total stockholders' equity |
36,227,423 | 36,051,260 | ||||
|
Non-controlling interests |
235 | 253 | ||||
|
Total equity |
36,227,658 | 36,051,513 | ||||
|
|
||||||
|
Total liabilities and equity |
$ | 41,312,332 | $ | 40,870,060 |
The accompanying notes are an integral part of these condensed consolidated financial statements.
1
| CHINA HEALTH INDUSTRIES HOLDINGS, INC. AND SUBSIDIARIES |
| CONDENSED CONSOLIDATED AND COMBINED STATEMENTS OF OPERATIONS AND COMPREHENSIVE |
| INCOME |
| (UNAUDITED) |
| For the Three Months Ended | For the Nine Months Ended | |||||||||||
| March 31, | March 31, | March 31, | March 31, | |||||||||
|
|
2015 | 2014 | 2015 | 2014 | ||||||||
|
|
||||||||||||
|
REVENUE |
$ | 1,933,377 | $ | 2,555,394 | $ | 8,211,156 | $ | 6,501,198 | ||||
|
|
||||||||||||
|
COST OF GOODS SOLD |
1,403,081 | 1,781,580 | 5,796,457 | 5,030,815 | ||||||||
|
|
||||||||||||
|
GROSS PROFIT |
530,296 | 773,814 | 2,414,699 | 1,470,383 | ||||||||
|
|
||||||||||||
|
OPERATING EXPENSES |
||||||||||||
|
Selling, general and administrative expenses |
515,085 | 540,192 | 1,570,843 | 1,594,887 | ||||||||
|
Depreciation and amortization expenses |
173,083 | 42,684 | 516,679 | 587,283 | ||||||||
|
Research and development expenses |
- | 47 | - | 157,552 | ||||||||
|
Total operating expenses |
688,168 | 582,923 | 2,087,522 | 2,339,722 | ||||||||
|
|
||||||||||||
|
INCOME (LOSS) FROM OPERATIONS |
(157,872 | ) | 190,891 | 327,177 | (869,339 | ) | ||||||
|
|
||||||||||||
|
OTHER INCOME/(EXPENSES) |
||||||||||||
|
Interest income |
24,479 | 23,644 | 72,865 | 87,746 | ||||||||
|
Interest expense |
(31,276 | ) | (40,277 | ) | (93,474 | ) | (84,280 | ) | ||||
|
Other income/(expenses), net |
9,623 | (38,810 | ) | 29,179 | (4,682 | ) | ||||||
|
Total other income (expense), net |
2,826 | (55,443 | ) | 8,570 | (1,216 | ) | ||||||
|
|
||||||||||||
|
INCOME (LOSS) BEFORE INCOME TAXES |
(155,046 | ) | 135,448 | 335,747 | (870,555 | ) | ||||||
|
|
||||||||||||
|
Provision for income taxes |
25,754 | - | 186,292 | - | ||||||||
|
|
||||||||||||
|
NET INCOME (LOSS) |
(180,800 | ) | 135,448 | 149,455 | (870,555 | ) | ||||||
|
Less: net loss attributable to non-controlling interests |
(18 | ) | 1 | (18 | ) | (70 | ) | |||||
|
Net income (loss) attributable to China Health Industries Holdings |
(180,782 | ) | 135,447 | 149,473 | (870,485 | ) | ||||||
|
Foreign currency translation gain |
35,113 | (970,760 | ) | 26,672 | (460,681 | ) | ||||||
|
Comprehensive income/(loss) |
(145,687 | ) | (835,312 | ) | 176,127 | (1,331,236 | ) | |||||
|
Less: comprehensive loss attributable to non- controlling interests |
(36 | ) | (7 | ) | (36 | ) | (73 | ) | ||||
|
COMPREHENSIVE INCOME/(LOSS) ATTRIBUTABLE TO CHINA HEALTH INDUSTRIES HOLDINGS |
$ | (145,651 | ) | $ | (835,305 | ) | $ | 176,163 | $ | (1,331,163 | ) | |
|
|
||||||||||||
|
Net income (loss) attributable to China Health Industries Holdings' shareholders per share are: |
||||||||||||
|
Basic & diluted income (loss) per share |
$ | (0.003 | ) | $ | 0.002 | $ | 0.002 | $ | (0.014 | ) | ||
|
|
||||||||||||
|
Weighted average shares outstanding: |
||||||||||||
|
Basic & diluted weighted average shares outstanding |
62,239,737 | 62,239,737 | 62,239,737 | 62,239,737 | ||||||||
The accompanying notes are an integral part of these condensed consolidated and combined financial statements.
2
| CHINA HEALTH INDUSTRIES HOLDINGS, INC. AND SUBSIDIARIES |
| CONDENSED CONSOLIDATED AND COMBINED STATEMENTS OF CASH FLOWS |
| (UNAUDITED) |
| For the Nine Months Ended | ||||||
| March 31, | March 31, | |||||
|
|
2015 | 2014 | ||||
|
|
||||||
|
Cash Flows from Operating Activities |
||||||
|
Net income (loss) available to China Health Industries Holdings |
$ | 149,473 | $ | (870,485 | ) | |
|
Adjustments to reconcile net loss to net cash provided by (used in) operating activities: |
||||||
|
Depreciation and amortization expenses |
673,370 | 690,619 | ||||
|
(Recovery of) provision for doubtful accounts |
- | (2,166 | ) | |||
|
Noncontrolling interests |
- | (70 | ) | |||
|
Changes in operating assets and liabilities |
||||||
|
Accounts receivable |
883,986 | (1,722,779 | ) | |||
|
Other receivables |
35,166 | 22,819 | ||||
|
Inventory |
201,102 | (139,946 | ) | |||
|
Advance to Suppliers and prepaid expenses |
108,546 | 274,820 | ||||
|
Accounts payables and accrued expenses |
(93,568 | ) | 88,950 | |||
|
Advance from customers and other payables |
476,683 | (25,153 | ) | |||
|
Wages payable |
84,247 | (123,648 | ) | |||
|
Taxes payable |
(249,747 | ) | 120,744 | |||
|
Net cash provided by (used in) operating activities |
2,269,258 | (1,686,295 | ) | |||
|
|
||||||
|
Cash Flows from Investing Activities |
||||||
|
Decrease in notes receivable |
28,193 | 18,438 | ||||
|
Purchases of property, plant and equipment |
(21,643 | ) | (102,151 | ) | ||
|
Purchases of intangible assets |
- | (11,460 | ) | |||
|
Increase in construction in progress |
(534,508 | ) | - | |||
|
Net cash used in investing activities |
(527,958 | ) | (95,173 | ) | ||
|
|
||||||
|
Cash Flows from Financing Activities |
||||||
|
Repayment of related party debts |
(517,627 | ) | - | |||
|
Proceeds from related party debts |
563,636 | (184,056 | ) | |||
|
Payment of short-term loan |
- | (1,146,381 | ) | |||
|
Proceeds from short-term loan |
- | 1,637,687 | ||||
|
Net cash provided by financing activities |
46,009 | 307,250 | ||||
|
|
||||||
|
|
||||||
|
Effect of exchange rate changes on cash and cash equivalents |
15,302 | (342,273 | ) | |||
|
|
||||||
|
Net increase/(decrease) in cash and cash equivalents |
1,802,611 | (1,816,491 | ) | |||
|
|
||||||
|
Cash and cash equivalents, beginning balance |
27,232,074 | 28,868,533 | ||||
|
|
||||||
|
Cash and cash equivalents, ending balance |
$ | 29,034,685 | $ | 27,052,042 | ||
|
|
||||||
|
Supplemental cash flow information |
||||||
|
Cash paid for income taxes |
$ | 190,536 | $ | - | ||
|
Cash paid for interest expense |
$ | 93,474 | $ | 90,613 | ||
|
|
||||||
|
Non-cash investing activities: |
||||||
|
|
||||||
|
Loan from related party for the construction of a facility |
$ | 493,363 | $ | - | ||
|
Transfer to property, plant and equipment from construction in progress |
$ | - | $ | 2,166,812 | ||
The accompanying notes are an integral part of these condensed consolidated and combined financial statements.
3
| CHINA HEALTH INDUSTRIES HOLDINGS, INC. AND SUBSIDIARIES |
| NOTES TO CONDENSED CONSOLIDATED AND COMBINED FINANCIAL STATEMENTS |
Note 1 - ORGANIZATION AND BUSINESS BACKGROUND
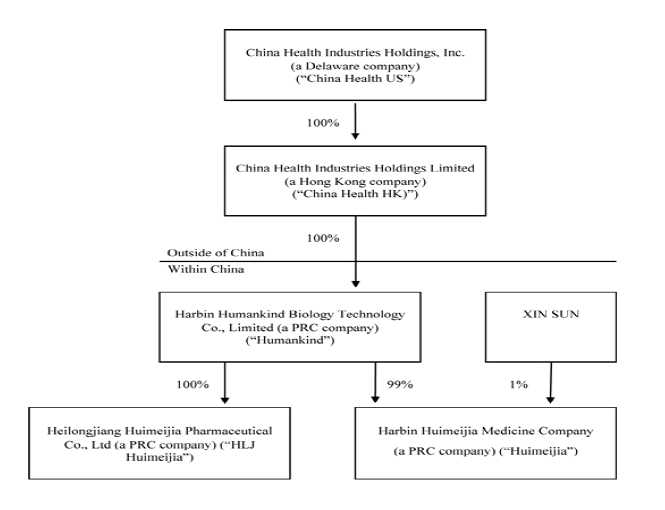
China Health Industries Holdings, Inc. (“China Health US”) was incorporated in the State of Arizona on July 11, 1996 and was the successor of the business known as Arizona Mist, Inc. which began in 1989. On May 9, 2005, it entered into a Stock Purchase Agreement and Share Exchange (effecting a reverse merger) with Edmonds 6, Inc. (“Edmonds 6”), a Delaware corporation, and changed its name to Universal Fog, Inc. Pursuant to this agreement, Universal Fog, Inc. (which has been in continuous operation since 1996) became a wholly-owned subsidiary of Edmonds 6.
China Health Industries Holdings Limited (“China Health HK”) was incorporated on July 20, 2007 in Hong Kong under the Companies Ordinance as a limited liability company. China Health HK was formed for the purpose of seeking and consummating a merger or acquisition with a business entity organized as a private corporation, partnership, or sole proprietorship as defined by the Financial Accounting Standards Board (“FASB”) ACS Topic 915 (“Development Stage Entities”).
Harbin Humankind Biology Technology Co., Limited (“Humankind”) was incorporated in Harbin City, Heilongjiang Province, the PRC on December 14, 2003, as a limited liability company under the Company Law of the PRC. Humankind is engaged in the manufacturing and sale of health products.
On August 20, 2007, the sole shareholder of China Health HK entered into a share purchase agreement (the “Share Purchase Agreement”) with the owners of Humankind. Pursuant to the Share Purchase Agreement, China Health HK purchased 100% of the ownership in Humankind for a cash consideration of $60,408 (the “Share Purchase”). Subsequent to the completion of the Share Purchase, Humankind became a wholly-owned subsidiary of China Health HK. The Share Purchase was accounted for as a “reverse merger” since the owner of Humankind owned a majority of the outstanding shares of China Health HK’s common stock immediately following the execution of the Share Purchase Agreement, it was deemed to be the acquirer in the reverse merger. Consequently, the assets and liabilities and the historical operations that have been reflected in the financial statements for periods prior to the Share Purchase are those of Humankind and have been recorded at the historical cost basis. After completion of the Share Purchase, China Health HK’s consolidated financial statements include the assets and liabilities of both China Health HK and Humankind, the historical operations of Humankind, and the operations of China Health HK and its subsidiaries from the closing date of the Share Purchase.
On October 14, 2008, Humankind set up a 99% owned subsidiary, Harbin Huimeijia Medicine Company (“Huimeijia”), with its primary business being manufacturing and distributing medicine. Mr. Xin Sun, the Company’s majority owner, owns 1% of Huimeijia. Huimeijia is consolidated in the consolidated financial statements of China Health HK.
On December 31, 2008, China Health HK entered into a reverse merger with Universal Fog, Inc., a U.S. publicly traded shell company (the “Transaction”). China Health HK is the acquirer in the Transaction, and the Transaction has been treated as a recapitalization of China Health US. After the Transaction and a 20:1 reverse stock split, Mr. Xin Sun owned 61,203,088 shares of common stock, representing 98.3% of the 62,234,737 total outstanding shares of common stock of China Health US. On April 7, 2009, Mr. Sun transferred 28,200,000 shares of common stock to 296 individuals, leaving him with 33,003,088 shares of common stock of China Health US, or approximately 53.03% of the total outstanding shares of common stock. Universal Fog, Inc. changed its name to China Health Industries Holdings, Inc. on February 19, 2009.
On November 22, 2013, Humankind completed the acquisition of Heilongjiang Huimeijia Pharmaceutical Co., Ltd. (“HLJ Huimeijia”) for a total purchase price of $16,339,869 (RMB100,000,000) (the “Purchase Price”). HLJ Huimeijia was founded on October 30, 2003, and is engaged in the manufacturing and distribution of tincture, ointments, rubber paste (including hormones), topical solution, suppositories, liniment (including traditional Chinese medicine extractions), enemas and oral liquids. HLJ Huimeijia’s predecessor is Heilongjiang Xue Du Pharmaceutical Co., Ltd., which has established its brand name in the market through its supply of high quality medical products. HLJ Huimeijia is categorized as a “high and new technology” enterprise by the Science Technology Department in Heilongjiang Province. HLJ Huimeijia has 21 products which have been approved by, and have received approval numbers issued by, the China State Food and Drug Administration (the “CFDA”). In addition, HLJ Huimeijia is the holder of one patent for utility models, five patents for external design and two trademarks in China, including the Chinese brand name of “Xue Du” which has an established reputation among customers in northeastern China.
China Health US, China Health HK, Humankind, Huimeijia and HLJ Huimeijia are collectively referred herein to as the “Company.”
As of March 31, 2015, the Company’s corporate structure is as follows:
4
5
Note 2 - SIGNIFICANT ACCOUNTING POLICIES
This summary of significant accounting policies of the Company is presented to assist in understanding the Company’s financial statements. The financial statements and notes are representations of the Company’s management, which is responsible for their integrity and objectivity. These accounting policies conform to generally accepted accounting principles in the United States ("US GAAP") and have been consistently applied in the preparation of the consolidated financial statements.
Basis of Presentation
The accompanying unaudited consolidated and combined financial statements have been prepared by Company without audit pursuant to the rules and regulations of the U.S. Securities and Exchange Commission (“SEC”). Certain information and disclosures normally included in financial statements prepared in accordance with US GAAP have been condensed or omitted as allowed by such rules and regulations, and management believes that the disclosures are adequate to make the information presented not misleading. These consolidated and combined financial statements should be read in conjunction with the audited financial statements and notes thereto included in the Company’s Annual Report on Form 10-K for the years ended June 30, 2014 and 2013.These consolidated and combined financial statements include all adjustments, which in the opinion of management are necessary to a fair presentation of financial position and results of operations. All such adjustments are of a normal and recurring nature. The results of operations for the nine months ended March 31, 2015 may not be indicative of results that may be expected for the year ended June 30, 2015.
Principles of Consolidation
The accompanying consolidated and combined financial statements include China Health US and its four subsidiary companies, China Health HK, Humankind, Huimeijia, and HLJ Huimeijia. All significant intercompany balances and transactions have been eliminated in consolidation and combination.
Segment Reporting
FASB ASC Topic 280, “Segment Reporting”, established standards for reporting information about operating segments on a basis consistent with the Company's internal organizational structure as well as information about geographical areas, business segments and major customers in financial statements for details on the Company's business segments. The Company has three reportable operating segments: Humankind, HLJ Huimeijia and others. The segments are grouped based on the types of products provided.
Fair Value of Financial Instruments
The provisions of accounting guidance, FASB ASC Topic 820 that applies to the Company requires all entities to disclose the fair value of financial instruments, both assets and liabilities recognized and not recognized on the balance sheet, for which it is practicable to estimate fair value, and defines fair value of a financial instrument as the amount at which the instrument could be exchanged in a current transaction between willing parties.
Fair Value Measurements
FASB ASC Topic 820, “Fair Value Measurements and Disclosures”, clarifies the definition of fair value for financial reporting, establishes a framework for measuring fair value and requires additional disclosures about the use of fair value measurements.
Various inputs are considered when determining the fair value of the Company’s debt. The inputs or methodologies used for valuing securities are not necessarily an indication of the risk associated with investing in these securities. These inputs are summarized in the three broad levels listed below.
Level 1- observable market inputs that are unadjusted quoted prices for identical assets or liabilities in active markets;
Level 2 - other significant observable inputs (including quoted prices for similar securities, interest rates, credit risk, etc.);
Level 3 - significant unobservable inputs (including the Company’s own assumptions in determining the fair value of investments).
The carrying value of financial assets and liabilities recorded at fair value is measured on a recurring or nonrecurring basis. Financial assets and liabilities measured on a non-recurring basis are those that are adjusted to fair value when a significant event occurs. The Company had no financial assets or liabilities carried and measured on a nonrecurring basis during the reporting periods. Financial assets and liabilities measured on a recurring basis are those that are adjusted to fair value each time a financial statement is prepared. The Company had no financial assets or liabilities carried and measured on a recurring basis during the reporting periods.
6
The availability of inputs observable in the market varies from instrument to instrument and depends on a variety of factors including the type of instrument, whether the instrument is actively traded, and other characteristics particular to the transaction. For many financial instruments, pricing inputs are readily observable in the market, the valuation methodology used is widely accepted by market participants, and the valuation does not require significant management discretion. For other financial instruments, pricing inputs are less observable in the market and may require management judgment.
Statement of Cash Flows
In accordance with Statement FASB ASC Topic 230, “Statement of Cash Flows”, cash flow from the Company's operations is calculated based upon the local currencies and translated to the reporting currency using an average foreign exchange rate for the reporting period. As a result, amounts related to assets and liabilities reported in the statement of cash flows will not necessarily agree with changes in the corresponding balances on the balance sheet.
Use of Estimates and Assumptions
The preparation of financial statements in conformity with US GAAP requires management to make estimates and judgments that affect the reported amounts of assets and liabilities, disclosure of contingent assets and liabilities on the date of the financial statements and the reported amounts of revenues and expenses during the reporting period. The Company bases its estimates and judgments on historical experience and on various other assumptions and information that are believed to be reasonable under the circumstances. Estimates and assumptions of future events and their effects cannot be perceived with certainty and, accordingly, these estimates may change as new events occur, as more experience is acquired, as additional information is obtained and as the Company’s operating environment changes. Significant estimates and assumptions by management include, among others; useful lives of long-lived assets and intangible assets, valuation of inventory, accounts receivable and notes receivable, impairment analysis of long-lived assets, construction in progress, intangible assets and deferred taxes. While the Company believes that the estimates and assumptions used in the preparation of the financial statements are appropriate, actual results could differ from those estimates. Estimates and assumptions are periodically reviewed and the effects of revisions are reflected in the financial statements in the period they are determined to be necessary.
Cash and Cash Equivalents
Cash and cash equivalents include cash on hand, deposits in banks with maturities of three months or less, and all highly liquid investments which are unrestricted as to withdrawal or use, and which have original maturities of three months or less at the time of purchase.
As of March 31, 2015 and June 30, 2014, the Company’s uninsured bank balance was mainly maintained at financial institutions located in the PRC and HK, totaled $29,034,685 and $27,232,074 respectively. The Company has no insured bank balance as of March 31, 2015 and June 30, 2014, respectively.
Accounts Receivable
Accounts receivable are recorded at the invoiced amount and do not bear interest. The Company extends unsecured credit to its customers in the ordinary course of business but mitigates the associated risks by performing credit checks and actively pursuing past due accounts. An allowance for doubtful accounts is established and determined based on management’s assessment of known requirements, aging of receivables, payment and bad debt history, the customer’s current credit worthiness, changes in customer payment patterns and the economic environment. The Company’s current credit policy is ninety (90) day payment terms for sales, which has been implemented since November 1, 2013. Prior to that, it was thirty (30) day. As of March 31, 2015 and June 30, 2014, the net balances of accounts receivable were $1,350,831 and $2,230,746, respectively. The Company determines the allowance based on aging data, historical collection experience, customer specific facts and economic conditions. Account balances are charged off against the allowance after all means of collection have been exhausted and the potential for recovery is considered remote. The Company evaluated the nature of all accounts receivable then provided allowance for doubtful accounts. As of March 31, 2015 and June 30, 2014, the balances of allowance for doubtful accounts were $45,497 and $45,463, respectively.
7
Advance to Suppliers
The Company periodically makes advances to certain vendors for purchases of raw materials, and records these purchases as advance to suppliers. As of March 31, 2015 and June 30, 2014, advance to suppliers amounted to $34,325 and $40,504, respectively.
Prepaid Expenses
Prepaid expenses principally include prepaid R&D expenses, prepaid income taxes and amount paid to secure the use of assets or the receipt of services at a future date or continuously over one or more future periods. As of March 31, 2015 and June 30, 2014, prepaid expenses amounted to nil and $101,965, respectively.
Inventory
Inventory consists of raw materials, supplies and package materials, work in progress and finished goods of manufactured products.
Inventory is stated at lower of cost or market and consists of materials, labor and overhead. HLJ Huimeijia uses the weighted average method for inventory valuation. The other entities of the Company use the first-in, first-out (“FIFO”) method for inventory valuation. Overhead costs included in finished goods include direct labor cost and other costs directly applicable to the manufacturing process. The Company evaluates inventory for excess, slow moving, obsolete inventory and inventory the value of which is in excess of its net realizable value. This evaluation includes analysis of sales levels by product and projections of future demand. If future demand or market conditions are less favorable than the Company’s projections, a write-down of inventory may be required, and would be reflected in cost of goods sold in the period the revision is made. There was no inventory impairment provided for the nine months ended March 31, 2015 and 2014 respectively.
Impairment of Long-Lived Assets
The Company’s long-lived assets and other assets are reviewed for impairment in accordance with the guidance of the FASB ASC Topic 360-10 “Property, Plant, and Equipment” and FASB ASC Topic 205 “Presentation of Financial Statements.” The Company tests for impairment losses on long-lived assets used in operations whenever events or changes in circumstances indicate that the carrying amount of the asset may not be recoverable. Recoverability of an asset to be held and used is measured by a comparison of the carrying amount of the asset to the future undiscounted cash flows expected to be generated by the asset. If such asset is considered to be impaired, the impairment to be recognized is measured by the amount by which the carrying amount of the asset exceeds its fair value. Impairment evaluations involve management’s estimates on asset useful lives and future cash flows. Actual useful lives and cash flows could be different from those estimated by management which could have a material effect on the Company’s reporting results and financial position. Fair value is determined through various valuation techniques including discounted cash flow models, quoted market values and third-party independent appraisals, as considered necessary. As of March 31, 2015 and June 30, 2014, the Company has not experienced impairment losses on its long-lived assets. However, there can be no assurances that demand for the Company’s products or services will continue, which could result in an impairment of long-lived assets in the future.
Property, Plant and Equipment
Property, plant and equipment are carried at the lower of cost or fair value. Maintenance, repairs and minor renewals are expensed as incurred, major renewals and improvements that extend the lives or increase the capacity of plant assets are capitalized.
When assets are retired or disposed of, the cost and accumulated depreciation are removed from the accounts, and any resulting gains or losses are included in the results of operations in the reporting period of disposition
Depreciation is calculated on a straight-line basis over the estimated useful life of the assets. The depreciable lives applied are:
| Building, Warehouse and Improvements | 20 to 30 years |
| Office Equipment | 3 to 7 years |
| Vehicles | 5 to 15 years |
| Machinery and Equipment | 7 to 15 years |
8
Intangible Assets
The Company evaluates intangible assets in accordance with FASB ASC Topic 350, “Intangibles — Goodwill and Other.” Intangible assets deemed to have indefinite lives are not amortized, but are subject to annual impairment tests. If the assumptions and estimates used to allocate the purchase price are not correct, or if business conditions change, purchase price adjustments or future asset impairment charges could be required. The value of the Company’s intangible assets could be impacted by future adverse changes such as: (i) any future declines in the Company’s operating results, (ii) a decline in the valuation of technology, including the valuation of the Company’s common stock, (iii) a significant slowdown in the worldwide economy or (iv) any failure to meet the performance projections included in the Company’s forecasts of future operating results. In accordance with FASB ASC Topic 350, the Company tests intangible assets for impairment on an annual basis or more frequently if the Company believes indicators of impairment exist. Impairment evaluations involve management estimates of asset useful lives and future cash flows. Significant management judgment is required in the forecasts of future operating results that are used in the evaluations. It is possible, however, that the plans and estimates used may be incorrect. If the Company’s actual results, or the plans and estimates used in future impairment analysis, are lower than the original estimates used to assess the recoverability of these assets, it could incur additional impairment charges in a future period. Based on such evaluations, there was no impairment recorded for intangible assets for the nine months ended March 31, 2015 and 2014, respectively.
Construction in Progress
Construction in progress represents the costs incurred in connection with the construction of buildings or new additions to the Company’s plant facilities. Costs classified as construction in progress include all costs of obtaining the asset and bringing it to the location and condition necessary for its intended use. No depreciation is provided for construction in progress until such time as the assets are completed and are placed into service.
The Company reviews the carrying value of construction in progress for impairment whenever events and circumstances indicate that the carrying value of an asset may not be recoverable from the estimated future cash flows expected to result from its use and eventual disposition. In cases where undiscounted expected future cash flows are less than the carrying value of the assets, an impairment loss is recognized equal to an amount by which the carrying value exceeds the fair value of the assets. The factors considered by management in performing this assessment include current operating results, trends and prospects, the manner in which the property is used, and the effects of obsolescence, demand, competition and other economic factors. Based on this assessment, there was no impairment recorded for construction in progress for the nine months ended March 31, 2015 and 2014, respectively.
Translation of Foreign Currencies
Humankind, Huimeijia and HLJ Huimeijia maintain their books and accounting records in PRC currency “Renminbi” (“RMB”), which has been determined as the functional currency. Transactions denominated in currencies other than RMB are translated into RMB at the exchange rates prevailing on the date of the transactions, as quoted by the Federal Reserve Board. Foreign currency exchange gains and losses resulting from these transactions are included in operations.
Humankind, Huimeijia and HLJ Huimeijia’s financial statements are translated into the reporting currency, the United States Dollar (“USD”). Assets and liabilities of the above entities are translated at the prevailing exchange rate at each reporting period end date. Contributed capital accounts are translated using the historical rate of exchange when capital is injected. Income and expense accounts are translated at the average rate of exchange during the reporting period. Translation adjustments resulting from the translation of these financial statements are reflected as accumulated other comprehensive income in shareholders’ equity and non-controlling interests.
Revenue Recognition
The Company recognizes revenue when it is both earned and realized or realizable. The Company’s policy is to recognize revenue when title to the product, ownership and risk of loss have transferred to the customer, persuasive evidence of an arrangement exits and collection of the sales proceeds is reasonably assured, all of which generally occur upon shipment of goods to customers. The majority of the Company’s revenue relates to the sale of inventory to customers, and revenue is recognized when title and the risks and rewards of ownership pass to the customer. Given the nature of the Company’s business and the applicable rules guiding revenue recognition, the Company’s revenue recognition practices do not contain estimates that materially affect the results of operations. The Company records revenue at the discounted selling price and allows its customers to return products for exchange or credit subject to certain limitations. A provision for such returns is recorded based upon historical experience. There has been no provision recorded for returns based upon historical experience for the nine months ended March 31, 2015 and 2014, respectively.
9
Cost of Goods Sold
Cost of goods sold consists primarily of the costs of raw materials, freight charges, direct labor, depreciation of plants and machinery, warehousing and overhead costs associated with the manufacturing process and commission expenses.
Income Taxes
The Company adopts FASB ASC Topic 740, “Income Taxes,” which requires the recognition of deferred tax assets and liabilities for the expected future tax consequences of events that have been included in the financial statements or tax returns. Under this method, deferred income taxes are recognized for the tax consequences in future years of differences between the tax bases of assets and liabilities and their financial reporting amounts at each period end based on enacted tax laws and statutory tax rates applicable to the periods in which the differences are expected to affect taxable income. Valuation allowances are established when necessary to reduce deferred tax assets to the amount expected to be realized.
In July 2006 the FASB issued FIN 48(ASC 740-10), “Accounting for Uncertainty in Income Taxes — An Interpretation of FASB Statement No. 109 (ASC 740)”, which requires income tax positions to meet a more-likely-than-not recognition threshold to be recognized in the financial statements. Under FIN 48(ASC 740-10), tax positions that previously failed to meet the more-likely-than-not threshold should be recognized in the first subsequent financial reporting period in which that threshold is met. Previously recognized tax positions that no longer meet the more-likely-than-not threshold should be derecognized in the first subsequent financial reporting period in which that threshold is no longer met.
As a result of the implementation of FIN 48 (ASC 740-10), the Company undertook a comprehensive review of its portfolio of tax positions in accordance with recognition standards established by FIN 48 (ASC 740-10). The Company recognized no material adjustments to liabilities or stockholders’ equity as a result of the implementation. The adoption of FIN 48 did not have a material impact on the Company’s financial statements.
The application of tax laws and regulations is subject to legal and factual interpretation, judgment and uncertainty. Tax laws and regulations themselves are subject to change as a result of changes in fiscal policy, changes in legislation, the evolution of regulations and court rulings. Therefore, the actual liability may be materially different from the Company’s estimates, which could result in the need to record additional tax liabilities or potentially reverse previously recorded tax liabilities or deferred tax asset valuation allowance.
Enterprise Income Tax
Under the Provisional Regulations of PRC Concerning Income Tax on Enterprises promulgated by the PRC (the “EIT Law”), income tax is payable by enterprises at a rate of 25% of their taxable income.
Value Added Tax
The Provisional Regulations of PRC Concerning Value Added Tax promulgated by the State Council came into effect on January 1, 1994. Under these regulations and the Implementing Rules of the Provisional Regulations of the PRC Concerning Value Added Tax, value added tax (“VAT”) is imposed on goods sold in, or imported into, the PRC and on processing, repair and replacement services provided within the PRC.
VAT payable in the PRC is charged on an aggregated basis at a rate of 13% or 17% (depending on the type of goods involved) on the full price collected for the goods sold or, in the case of taxable services provided, at a rate of 17% on the charges for the taxable services provided, but excluding, in respect of both goods and services, any amount paid in respect of VAT included in the price or charges, and less any deductible VAT already paid by the taxpayer on purchases of goods and services in the same financial year. As of March 31, 2015 and June 30, 2014, VAT payables were $222,793 and $287,441, respectively.
Sales-Related Taxes
Pursuant to the tax law and regulations of the PRC, the Company is obligated to pay 7% and 5% of the annual VAT paid as taxes on maintaining and building cities and education additional fees, both of which belong to sales-related taxes. Sales-related taxes are recorded when sales revenue is recognized. Sales-related taxes for the nine months ended March 31, 2015 and 2014 were $143,987 and $112,614, respectively.
10
Concentrations of Business and Credit Risks
All of the Company’s manufacturing is located in the PRC. There can be no assurance that the Company will be able to successfully continue to manufacture its products and failure to do so would have a material adverse effect on the Company’s financial position, results of operations and cash flows. Also, the success of the Company’s operations is subject to numerous contingencies, some of which are beyond management’s control. These contingencies include general economic conditions, prices of raw materials, competition, governmental and political conditions, and changes in regulations. Since the Company is dependent on trade in the PRC, the Company is subject to various additional political, economic and other uncertainties. Among other risks, the Company’s operations will be subject to the risks of restrictions on transfer of funds, domestic customs, changing taxation policies, foreign exchange restrictions, and political and governmental regulations.
The Company operates in China, which may give rise to significant foreign currency risks from fluctuations and the degree of volatility of foreign exchange rates between USD and RMB. The results of operations denominated in foreign currency are translated at the average rate of exchange during the reporting periods.
Earnings Per Share
Basic earnings per common share is computed by dividing net earnings applicable to common shareholders by the weighted-average number of common shares outstanding during the period. When applicable, diluted earnings per common share is determined using the weighted-average number of common shares outstanding during the period, adjusted for the dilutive effect of common stock equivalents, consisting of shares that might be issued upon exercise of common stock options and warrants. For the nine months ended March 31, 2015 and 2014, the Company had no potential dilutive common stock equivalents outstanding.
Potential common shares issued are calculated using the treasury stock method, which recognizes the use of proceeds that could be obtained upon the exercise of options and warrants in computing diluted earnings per share. It assumes that any proceeds would be used to purchase common stock at the average market price of the common stock during the period. FASB ASC Topic 260, “Earnings Per Share”, requires a reconciliation of the numerator and denominator of the basic and diluted earnings per share (EPS) computations.
Recent Accounting Pronouncements
On November 3, 2014, the FASB issued Accounting Standards Update (“ASU”) No. 2014-16, “Derivatives and Hedging (Topic 815): Determining Whether the Host Contract in a Hybrid Financial Instrument Issued in the Form of a Share Is More Akin to Debt or to Equity (a consensus of the FASB Emerging Issues Task Force)”.The amendments permit the use of the Fed Funds Effective Swap Rate (also referred to as the Overnight Index Swap Rate, or OIS) as a benchmark interest rate for hedge accounting purposes. Public business entities are required to implement the new requirements in fiscal years (and interim periods within those fiscal years) beginning after December 15, 2015. All other types of entities are required to implement the new requirements in fiscal years beginning after December 15, 2015, and interim periods beginning after December 15, 2016. The Company does not expect the adoption to have material impact on the Company's consolidated financial statement.
On November 18, 2014, FASB issued ASU No. 2014-17, “Pushdown Accounting (a consensus of the FASB Emerging Issues Task Force)”, which allows an acquired entity to elect to apply pushdown accounting in its separate financial statements on a change-in control event. The acquired entity elects whether to apply pushdown accounting individually for each change-in-control event, and may apply pushdown accounting during the reporting period in which the change-in-control event occurs. Effective November 18, 2014, an acquired entity may apply ASU 2014-17 to future change-in-control events. The Company does not expect the adoption of ASU 2014-17 to have material impact on the Company's consolidated financial statement.
On December 23, 2014, FASB issued Accounting Standards Update (ASU) No. 2014-18, “Accounting for Identifiable Intangible Assets in a Business Combination”. The ASU contains an accounting alternative for private companies that acquire identifiable intangible assets in a business combination. Under the accounting alternative, many customer-related intangible assets and all noncompete agreements would not be recognized separately and would be subsumed into goodwill. An entity that elects this alternative is also required to adopt the alternative accounting in FASB Accounting Standards Update No. 2014-02, Accounting for Goodwill. (However, an entity that elects to adopt the goodwill alternative does not need to adopt the guidance in ASU 2014-18.) ASU 2014-18 does not require an entity to provide any incremental disclosures beyond those required by ASC 805. Once elected, the accounting alternative would be applied to all future business combinations entered into in the first annual period beginning after December 15, 2015. Early adoption would be permitted. The Company does not expect the adoption of ASU 2014-18 to have material impact on the Company's consolidated financial statement.
11
On January 9, 2015, FASB published ASU 2015-01, “Simplifying Income Statement Presentation by Eliminating the Concept of Extraordinary Items”. The ASU applies to all entities and is effective for fiscal years, and interim periods within those fiscal years, beginning after December 15, 2015. A reporting entity may apply the amendments prospectively. A reporting entity also may apply the amendments retrospectively to all prior periods presented in the financial statements. Early adoption is permitted provided that the guidance is applied from the beginning of the fiscal year of adoption. The Company does not expect the adoption of ASU 2015-01 to have material impact on the Company's consolidated financial statement.
In February 2015, FASB issued ASU No. 2015-02, Consolidation (Topic 810): Amendments to the Consolidation Analysis, which is intended to improve targeted areas of consolidation guidance for legal entities such as limited partnerships, limited liability corporations, and securitization structures. This ASU will be effective for periods beginning after December 15, 2015 for public companies. Management is evaluating the potential impact, if any, on the Company’s financial position and results of operations.
NOTE 3 – ACQUISITION
On November 22, 2013, Humankind completed the acquisition of HLJ Huimeijia for a total purchase price of $16,339,869 (RMB 100, 000,000) (the “Purchase Price”). HLJ Huimeijia was founded on October 30, 2003. HLJ Huimeijia is engaged in the manufacturing and distribution of tincture, ointments, rubber paste (including hormones), solution (topical), suppositories, liniment (including traditional Chinese medicine extraction), enemas and oral liquid. HLJ Huimeijia’s predecessor is Heilongjiang Xue Du Pharmaceutical Co., Ltd., which had established its brand name in the market by its medical products. HLJ Huimeijia is categorized as a “high and new technology” enterprise by the Science Technology Department in Heilongjiang Province. HLJ Huimeijia has 21 products which have been approved by, and have received approval numbers issued by, the China State Food and Drug Administration (“CFDA”). In addition, HLJ Huimeijia is a holder of one patent for utility models, five patents for external design and two trademarks in China, including the Chinese brand name of “Xue Du” that has an established reputation among customers in northeastern China.
HLJ Huimeijia and Humankind are under the common control of Mr. Xin Sun, the CEO of the Company before and after the date of the completion of the acquisition, or the transfer. Humankind’s accounting policy adopted the guidance in ASC 805-50-05-5 for the transfer of net assets between entities under common control to apply a method similar to the pooling-of-interests method. Under this method, the financial statements of Humankind shall report results of operations for the period in which the transfer occurs as though the transfer of net assets had occurred at the beginning of the period. Results of operations for that period will thus comprise those of the previously separate entities combined from the beginning of the period to the date the transfer is completed and those of the combined operations from that date to the end of the period. Similarly, Humankind shall present the statements of financial position and other financial information as of the beginning of the period as though the assets and liabilities had been transferred at that date. Financial statements and financial information of Humankind presented for prior years also shall be retrospectively adjusted to furnish comparative information.
NOTE 4 –ASSETS SALE
On December 24, 2014, Humankind entered into a stock transfer agreement (the “Agreement”) with Xiuzheng Pharmaceutical Group Co., Ltd. a company incorporated under the laws of the People’s Republic of China and located in Jilin province (“Xiuzheng Pharmacy” or the “Buyer”), Mr. Xin Sun, the CEO of the Company, and Huimeijia, pursuant to which, Humankind and Mr. Xin Sun (the “Equity Holders”), shall sell their respective equity interests in Huimeijia to Xiuzheng Pharmacy. The transfer of the 100% equity interests of Huimeijia to the Buyer was for a total cash consideration of RMB 8,000,000 (approximately $1,306,186) to the Equity Holders.
On February 9, 2015, the four parties entered into a supplementary agreement (the “Supplementary Agreement”) to modify the terms of the Agreement, pursuant to which, the Equity Holders and Huimeijia (collectively the “Assets Transferors”) shall only sell the 19 drug approval numbers (including the tablet, capsule, powder, mixture, oral liquid, syrup and oral solution under the 19 approval numbers; licenses including the original copies of Business License, Organization Code Certificate, Tax Registration Certificate, Drug Production Permit and GMP Certificate, and other documents and original copies related to the production and operation of the 19 drugs) (the “Assets”) to Xiuzheng Pharmacy. The Equity Holders will retain the equity interests in Huimeijia, but will have the equity interests pledged to Xiuzheng Pharmacy until the Assets are transferred, at which time all the cash consideration shall be paid by the Buyer. The total cash consideration remains to be the same as under the Agreement, i.e., RMB 8,000,000 (approximately $1,306,186) to the Assets Transferors.
In the event that the Assets are failed to be transferred to the Buyer due to the fault of the Assets Transferors, the paid consideration shall be returned to the Buyer with interests accrued. If the failure of the transfer of the Assets is a result of the government policy changes or force majeure, the paid cash consideration shall be returned to the Buyer but without any interests.
12
As of March 31, 2015, the transfer of the Assets had not been completed. The Company is striving to accelerate the process of the transfer.
NOTE 5 - ACCOUNTS RECEIVABLE
The Company’s accounts receivable amounted to $1,350,831 and $2,230,746, respectively, net of allowance for doubtful accounts amounting to $45,497 and $45,463 as of March 31, 2015 and June 30, 2014, respectively.
NOTE 6 - INVENTORIES
Inventory consists of following:
| March 31, 2015 | June 30, 2014 | |||||
| Raw Materials | $ | 331,305 | $ | 524,446 | ||
| Supplies and Packing Materials | 12,363 | 10,485 | ||||
| Work-in-Progress | 281,325 | 248,304 | ||||
| Finished Goods | 213,163 | 254,704 | ||||
| Total | $ | 838,156 | $ | 1,037,939 |
For the nine months ended March 31, 2015 and 2014, the Company has not made provision for inventory in regards to excessive, slow moving or obsolete items.
NOTE 7 - CONSTRUCTION IN PROGRESS
Construction in progress consisted of the following:
| March 31, 2015 | June 30, 2014 | |||||
| Plant - HLJ Huimeijia | $ | 533,047 | $ | - | ||
| Plant and Production Lines - Huimeijia | 1,936 | 1,934 | ||||
| Total | $ | 534,983 | $ | 1,934 |
On April 6, 2012, HLJ Huimeijia entered into an agreement with a contractor for the plant, the estimated total cost of construction was approximately $2.09 million (RMB 12,800,000), anticipated to be completed within 720 days from April 20, 2012 to December 30, 2015. As of March 31, 2015, 26% of construction had been completed and $533,047 (RMB 3,304,360) had been recorded as a cost of construction in progress.
NOTE 8 - PROPERTY, PLANT AND EQUIPMENT
Property, plant and equipment consisted of the following:
| March 31, 2015 | June 30, 2014 | |||||
|
Building, Warehouses and Improvements |
$ | 4,650,328 | $ | 4,646,879 | ||
|
Machinery and Equipment |
1,234,597 | 1,231,702 | ||||
|
Office Equipment |
126,988 | 108,112 | ||||
|
Vehicles |
232,548 | 231,570 | ||||
|
Other |
24,197 | 24,180 | ||||
|
Less Accumulated Depreciation |
(1,851,727 | ) | (1,581,371 | ) | ||
|
Total |
$ | 4,416,931 | $ | 4,661,072 |
Depreciation expense was $269,920 and $235,866 for the nine months ended March 31, 2015 and 2014, respectively. Depreciation expense charged to operations was $113,229 and $132,530 for the nine months ended March 31, 2015 and 2014, respectively. Depreciation expense charged to cost of goods sold was $156,690 and $103,336 for the nine months ended March 31, 2015 and 2014, respectively.
13
As of March 31, 2015, the building of HLJ Huimeijia in the book value of $1,797,499 has been mortgaged for the working capital loan in the principal amount of $1,611,707 (RMB 10,000,000). As of June 30, 2014, the building of HLJ Huimeijia in the book value of $1,796,166 has been mortgaged for the working capital loan in the principal amount of $1,611,967 (RMB 10,000,000).
NOTE 9 - INTANGIBLE ASSETS
The following is a summary of intangible assets:
|
|
March 31, 2015 | June 30, 2014 | ||||
|
Land Use Rights – Humankind |
$ | 1,022,420 | $ | 1,021,662 | ||
|
Health Supplement Product Patents – Humankind |
4,839,490 | 4,835,901 | ||||
|
Pharmaceutical Patents - HLJ Huimeijia |
144,537 | 144,430 | ||||
|
Land Use Rights - HLJ Huimeijia |
699,320 | 698,802 | ||||
|
Less: Accumulated Amortization |
(1,651,907 | ) | (1,248,634 | ) | ||
|
Total |
$ | 5,053,860 | $ | 5,452,161 |
All land in the PRC belongs to the State. Enterprises and individuals can pay the State a fee to obtain the right to use a piece of land for commercial purposes or residential purposes for an initial period of 50 years or 70 years, respectively. The land use right can be sold, purchased, and exchanged in the market. The successor owner of the land use right will have the right to use the land for the time remaining on the initial period.
Amortization expense charged to operations was $403,450 and $454,753 for the nine months ended March 31, 2015 and 2014, respectively.
As of March 31, 2015, land use rights of HLJ Huimeijia with the book value of $699,320 have been mortgaged for a working capital loan in the principal amount of $1,611,707 (RMB 10,000,000). As of June 30, 2014, land use rights of HLJ Huimeijia with a book value of $698,802 have been mortgaged for a working capital loan in the principal amount of $1,611,967 (RMB 10,000,000).
NOTE 10 - SHORT-TERM LOAN
On November 20, 2014, HLJ Huimeijia entered into a short-term loan agreement with a bank for a working capital loan in the principal amount of RMB 10,000,000, at an interest rate of 7.8% from November 20, 2014 to November 19, 2015. The loan was secured by the land use right and the building of HLJ Huimeijia, with a maturity date of November 19, 2015. As of March 31, 2015 and June 30, 2014, the Company’s short-term loan was $1,613,163 and $1,611,967, respectively.
Interest expenses were $93,474 and $84,280 for the nine months ended March 31, 2015 and 2014, respectively.
NOTE 11 - RELATED PARTY DEBTS
Related party debts, which represent temporary short-term loans from Mr. Xin Sun and Mr. Kai Sun consisted of the following:
| March 31, 2015 | June 30, 2014 | |||||
| Mr. Xin Sun | $ | 1,808,065 | $ | 1,739,157 | ||
| Mr. Kai Sun | 15,644 | 37,694 | ||||
| Total | $ | 1,823,709 | $ | 1,776,851 |
These loans are unsecured and non-interest bearing and have no fixed terms of repayment; therefore, they are deemed payable on demand. Mr. Kai Sun is a PRC citizen and a family member of Mr. Xin Sun, the CEO of the Company.
NOTE 12 - INCOME TAXES
(a) Corporate income taxes
United States
China Health US was organized in the United States. China Health US had no taxable income for US income tax purposes for the years ended June 30, 2014 and 2013, respectively. As of March 31, 2015, China Health US has a net operating loss carry forward for United States income taxes. Net operating loss carry forwards are available to reduce future years’ taxable income. Management believes that the realization of the benefits from these losses appears uncertain due to the Company’s operating history and the continued losses of the US entity. Accordingly, the Company has provided a 100% valuation allowance on the deferred tax asset to reduce the asset to zero. There were no changes in the valuation allowance for the nine months ended March 31, 2015 and 2014. Management reviews this valuation allowance periodically and makes adjustments accordingly.
14
Hong Kong
China Health HK was incorporated in the Hong Kong and is subject to Hong Kong taxation on its activities conducted in Hong Kong and income arising in or derived from Hong Kong. No provision for income taxes have been made as China Health HK has no taxable income in Hong Kong.
People’s Republic of China
Under the EIT Law, the standard EIT rate is 25%. The PRC subsidiaries of the Company are subject to PRC income taxes on an entity basis on income arising in or derived from the tax jurisdiction in which they operate.
The provision for income taxes on income consists of the following for the nine and three months ended March 31, 2015 and 2014:
Provision for income taxes consisted of:
| For the Nine Months Ended March 31, | For the Three Months Ended March 31, | |||||||||||
| 2015 | 2014 | 2015 | 2014 | |||||||||
|
Current provision : |
||||||||||||
|
USA |
$ | - | $ | - | $ | - | $ | - | ||||
|
China |
186,292 | - | 25,754 | - | ||||||||
|
Total current provision |
186,292 | - | 25,754 | - | ||||||||
|
Deferred provision: |
||||||||||||
|
USA |
- | - | - | - | ||||||||
|
China |
- | - | - | - | ||||||||
|
Total deferred provision |
- | - | - | - | ||||||||
|
Total provision for income taxes |
$ | 186,292 | $ | - | $ | 25,754 | $ | - | ||||
Significant components of deferred tax assets were as follows:
|
|
March 31, 2015 | June 30, 2014 | ||||
|
Deferred tax assets |
||||||
|
Net operating loss carry forward |
$ | 404,040 | $ | 322,469 | ||
|
Allowance for doubtful accounts |
15,620 | 108 | ||||
|
Valuation allowance |
(419,660 | ) | (322,577 | ) | ||
|
Deferred tax assets, net |
$ | - | $ | - |
As of March 31, 2015 and June 30, 2014, the Company accrued a 100% valuation allowance on its deferred tax assets based on the assessment on the probability of future reversion.
(b) Uncertain tax positions
There were no unrecognized tax benefits as of March 31, 2015 and June 30, 2014, respectively. Management does not anticipate any potential future adjustments in the next twelve months which would result in a material change to its tax positions. For the nine months ended March 31, 2015 and 2014, the Company did not incur any interest and penalties arising from its tax payments.
NOTE 13 - COMMITMENTS AND CONTINGENCIES
The Company’s assets are located in the PRC and revenues are derived from operations in the PRC.
15
In terms of industry regulations and policies, the economy of the PRC has been transitioning from a planned economy to market oriented economy. Although in recent years the Chinese government has implemented measures emphasizing the utilization of market forces for economic reforms, the reduction of state ownership of productive assets and the establishment of sound corporate governance in business enterprises, a substantial portion of productive assets in the PRC is still owned by the Chinese government. For example, all land is state owned and leased to business entities or individuals through the government’s granting of Land Use Rights. The granting process is typically based on government policies at the time of granting and can be lengthy and complex. This process may adversely affect the Company’s future manufacturing expansions. The Chinese government also exercises significant control over the PRC’s economic growth through the allocation of resources and providing preferential treatment to particular industries or companies. Uncertainties may arise with changing of governmental policies and measures.
The Company faces a number of risks and challenges not typically associated with companies in North America and Western Europe, since its assets exist solely in the PRC, and its revenues are derived from its operations therein. The PRC is a developing country with an early stage market economic system, overshadowed by the state. Its political and economic systems are very different from the more developed countries and are in a state of change. The PRC also faces many social, economic and political challenges that may produce major shocks, instabilities and even crises, in both its domestic arena and in its relationships with other countries, including the United States. Such shocks, instabilities and crises may in turn significantly and negatively affect the Company’s performance.
Since the Company terminated its rental agreement on January 9, 2013, it had no rental commitment as of March 31, 2015.
NOTE 14 - MAJOR SUPPLIERS AND CUSTOMERS
The Company had one supplier that in the aggregate accounted for 64% of the Company’s purchases for the nine months ended March 31, 2015.
The Company had three customers that in the aggregate accounted for 32% of the Company’s total sales for the nine months ended March 31, 2015, with each customer accounting for 11%, 11% and 10%, respectively.
The Company had one supplier that in the aggregate accounted for 85% of the Company’s purchases for the nine months ended March 31, 2014.
The Company had four customers that in the aggregate accounted for 46% of the Company’s total sales for the nine months ended March 31, 2014, with each customer accounting for 12%, 12%, 11% and 11%, respectively.
NOTE 15 - SEGMENT REPORTING
The Company was organized into three main business segments based on the types of products being provided to customers: HLJ Huimeijia, Humankind and others. Each of the three operating segments referenced above has separate and distinct general ledgers. The chief operating decision maker (“CODM”) receives financial information, including revenue, gross margin, operating income, and net income produced from the various general ledger systems to make decisions about allocating resources and assessing performance; however, the principal measure of segment profitability or loss used by the CODM is net loss by segment.
The following tables’ present summary information by segment for the nine months ended March 31, 2015 and 2014, respectively:
|
|
As of and For the Nine Months Ended March 31, 2015 | As of and For the Nine Months Ended March 31, 2014 | ||||||||||||||||||||||
|
|
HLJ | HLJ | ||||||||||||||||||||||
|
|
Huimeijia | Humankind | Others | Consolidated | Huimeijia | Humankind | Others | Consolidated | ||||||||||||||||
|
Revenues |
$ | 1,286,898 | 6,924,258 | - | 8,211,156 | 980,495 | 5,520,703 | - | 6,501,198 | |||||||||||||||
|
Cost of revenues |
948,552 | 4,847,905 | - | 5,796,457 | 712,868 | 4,317,947 | - | 5,030,815 | ||||||||||||||||
|
Gross profit |
338,346 | 2,076,353 | - | 2,414,699 | 267,627 | 1,202,756 | - | 1,470,383 | ||||||||||||||||
|
Interest expense |
93,474 | - | - | 93,474 | 84,280 | - | - | 84,280 | ||||||||||||||||
|
Depreciation and amortization |
58,559 | 456,315 | 1,805 | 516,679 | 88,093 | 492,142 | 7,048 | 587,283 | ||||||||||||||||
|
Income tax |
- | 186,292 | - | 186,292 | - | - | - | - | ||||||||||||||||
|
Net income (loss) |
(407,422 | ) | 558,878 | (2,001 | ) | 149,455 | (369,816 | ) | (493,492 | ) | (7,247 | ) | (870,555 | ) | ||||||||||
|
Total capital expenditures |
4,388 | 17,255 | - | 21,643 | 37,299 | 64,852 | - | 102,151 | ||||||||||||||||
|
Total assets |
3,277,624 | 38,008,963 | 25,745 | 41,312,332 | 3,508,374 | 37,071,786 | 98,211 | 40,678,371 | ||||||||||||||||
|
Non-controlling interests |
$ | - | - | 235 | 235 | - | - | 241 | 241 | |||||||||||||||
16
| As of and For the Three Months Ended March 31, 2015 | As of and For the Three Months Ended March 31, 2014 | |||||||||||||||||||||||
| HLJ | HLJ | |||||||||||||||||||||||
| Huimeijia | Humankind | Others | Consolidated | Huimeijia | Humankind | Others | Consolidated | |||||||||||||||||
|
Revenues |
$ | 324,208 | 1,609,169 | - | 1,933,377 | 229,513 | 2,325,881 | - | 2,555,394 | |||||||||||||||
|
Cost of revenues |
255,376 | 1,147,705 | - | 1,403,081 | 188,309 | 1,593,271 | - | 1,781,580 | ||||||||||||||||
|
Gross profit |
68,832 | 461,464 | - | 530,296 | 41,204 | 732,610 | - | 773,814 | ||||||||||||||||
|
Interest expense |
31,276 | - | - | 31,276 | 40,277 | - | - | 40,277 | ||||||||||||||||
|
Depreciation and amortization |
27,292 | 143,986 | 1,805 | 173,083 | (131,801 | ) | 174,487 | (2 | ) | 42,684 | ||||||||||||||
|
Income tax |
- | 25,754 | - | 25,754 | - | - | - | - | ||||||||||||||||
|
Net income (loss) |
(256,188 | ) | 77,264 | (1,876 | ) | (180,800 | ) | 24,278 | (159,796 | ) | 70 | 135,448 | ||||||||||||
|
Total capital expenditures |
1,445 | 16,443 | - | 17,888 | (427 | ) | 18 | - | (409 | ) | ||||||||||||||
|
Total assets |
3,277,624 | 38,008,963 | 25,745 | 41,312,332 | 3,508,374 | 37,071,786 | 40,678,371 | |||||||||||||||||
|
Non-controlling interests |
$ | - | - | 235 | 235 | - | - | 250 | 250 | |||||||||||||||
NOTE 16 - STOCK BASED COMPENSATION
On March 27, 2015 the Board of Directors adopted the Company’s 2015 Equity Incentive Plan (the “Plan”), which became effective as of such date. The Plan is intended to be construed as an employee benefit plan that satisfies the requirements for exemption from the restrictions of Section 16(b) of the Exchange Act. A summary of the principal provisions of the Plan is set forth below.
The aggregate number of shares of common stock that may be issued under the Plan is 6,000,000 shares. In the event that the Board determines that any dividend or other distribution, recapitalization, stock split, reverse stock split, reorganization, merger, consolidation, split-up, spin-off, combination, repurchase, or exchange of Common Stock or other securities of the Company, or other corporate transaction or event affects the common stock such that an adjustment is determined by the Board, in its sole discretion, to be necessary or appropriate in order to prevent dilution or enlargement of benefits or potential benefits intended to be made available under the Plan, the Board may, in such manner as it in good faith deems equitable, adjust any or all of (i) the number of shares of common stock or other securities of the Company (or number and kind of other securities or property) with respect to which awards may be granted, (ii) the number of shares of common stock or other securities of the Company (or number and kind of other securities or property) subject to outstanding awards, and (iii) the exercise price with respect to any stock option, or make provision for an immediate cash payment to the holder of an outstanding award in consideration for the cancellation of such award.
Individuals eligible for awards under the Plan shall consist of employees (including officers), directors and consultants, or those who will become employees (including officers), directors and consultants, of the Company and/or its subsidiaries whose performance or contribution, in the sole discretion of the Committee, benefits or will benefit the Company or any subsidiary.
The Plan shall be effective upon its approval by the Board and adoption by the Company. The Plan shall terminate on March 27, 2025, except with respect to awards then outstanding. After such date no further awards shall be granted under the Plan.
On March 30, 2015, the Company granted 3,000,000 and 300,000 restricted shares to Mr. Xin Sun, Chief Executive Officer and Chief Financial Officer of the Company and an employee, respectively. The vesting periods of the restricted shares under the Plan were determined based on individual stock award agreements and would be recognized as equity compensation for the fiscal years ended June 30, 2015 and 2016. The grant was pursuant to the Plan and a Restricted Stock Award Agreement, and was based on the exemption afforded by Regulation S under the Securities Act of 1933, as amended. As the stock certificates were issued on April 2, 2015, the total 3,300,000 restricted shares were no included in the outstanding share as of March 31, 2015 hence were not reflected in the Condensed Consolidated Balance Sheets.
17
| Item 2. | Management’s Discussion and Analysis of Financial Condition and Results of Operations. |
FORWARD LOOKING STATEMENTS
We make certain forward-looking statements in this report. Statements concerning our future operations, prospects, strategies, financial condition, future economic performance (including growth and earnings), demand for our services, and other statements of our plans, beliefs, or expectations, including the statements contained under the captions “Management’s Discussion and Analysis of Financial Condition and Results of Operations,” “Business,” as well as captions elsewhere in this document, are forward-looking statements. In some cases these statements are identifiable through the use of words such as “anticipate,” “believe,” “estimate,” “expect,” “intend,” “plan,” “project,” “target,” “can,” “could,” “may,” “should,” “will,” “would,” and similar expressions. The forward-looking statements we make are not guarantees of future performance and are subject to various assumptions, risks, and other factors that could cause actual results to differ materially from those suggested by these forward-looking statements. Because such statements are subject to risks and uncertainties, actual results may differ materially from those expressed or implied by the forward-looking statements. Indeed, it is likely that some of our assumptions will prove to be incorrect. Our actual results and financial position will vary from those projected or implied in the forward-looking statements and the variances may be material. You are cautioned not to place undue reliance on such forward-looking statements. These risks and uncertainties, together with the other risks described from time to time in reports and documents that we file with the SEC should be considered in evaluating forward-looking statements.
The nature of our business makes predicting the future trends of our revenue, expenses, and net income difficult. Thus, our ability to predict results or the actual effect of our future plans or strategies is inherently uncertain. The risks and uncertainties involved in our business could affect the matters referred to in any forward-looking statements and it is possible that our actual results may differ materially from the anticipated results indicated in these forward-looking statements. Important factors that could cause actual results to differ from those in the forward-looking statements include, without limitation, the following:
-
the effect of political, economic, and market conditions and geopolitical events;
-
legislative and regulatory changes that affect our business;
-
the availability of funds and working capital;
-
the actions and initiatives of current and potential competitors;
-
investor sentiment;
-
our reputation.
We do not undertake any responsibility to publicly release any revisions to these forward-looking statements to take into account events or circumstances that occur after the date of this report. Additionally, we do not undertake any responsibility to update you on the occurrence of any unanticipated events which may cause actual results to differ from those expressed or implied by any forward-looking statements.
The following discussion and analysis should be read in conjunction with our consolidated financial statements and the related notes thereto as filed with the SEC and other financial information contained elsewhere in this report.
Except as otherwise indicated by the context, references in this report to “we,” “us,” “our,” “the Registrant,” “our Company,” or “the Company” are to China Health Industries Holdings, Inc., a Delaware corporation, China Health Industries Holdings Limited, a corporation incorporated under the laws of Hong Kong, its wholly owned subsidiary in China, Harbin Humankind Biology Technology Co. Limited (“Humankind”) and indirect 99% owned subsidiary, Harbin Huimeijia Medicine Company and indirect wholly owned subsidiary, Heilongjiang Huimeijia Pharmaceutical Co., Ltd. (“HLJ Huimeijia”). Unless the context otherwise requires, all references to (i) “PRC” and “China” are to the People’s Republic of China; (ii) “U.S. dollar,” “$” and “US$” are to United States dollars; (iii) “RMB” are to Renminbi Yuan of China; (iv) “Securities Act” are to the Securities Act of 1933, as amended; and (v) “Exchange Act” are to the Securities Exchange Act of 1934, as amended.
18
Business Overview
Our principal business operations are conducted through our wholly-owned subsidiaries, Humankind and HLJ Huimeijia.
The Company owns GMP-certified plant and facilities and has the capacity to produce 21 CFDA-approved medicines and 14 CFDA-approved health supplement products in soft capsule, hard capsule, tablet, granule and oral liquid forms. These products address the needs of key sectors, including the feminine, geriatric and children’s markets.
Our business is conducted through our sales agents and sales personnel. We sell our products directly to end-customers by our own sales personnel, as well as sales agents, operating primarily in Jiangsu, Zhejiang, Gansu, Shanghai, Anhui and Beijing, where most of our revenues are generated. Our sales through agents in Zhejiang, Beijing and Jiangsu provinces accounted for 11%, 11%, and 10% of our total sales, respectively, for the nine months ended March 31, 2015. Although we do not currently sell our products online, we expect to do so in the future.
Results of Operations
The three months ended March 31, 2015 compared to the three months ended March 31, 2014.
The following table summarizes the top lines of the results of our operations for the three months ended March 31, 2015 and 2014, respectively:
| March 31, 2015 | March 31, 2014 | Variance | % | |||||||||
| Revenues | $ | 1,933,377 | $ | 2,555,394 | $ | (622,017 | ) | -24.34% | ||||
| Humankind | 1,609,169 | 2,325,881 | (716,712 | ) | -30.81% | |||||||
| HLJ Huimeijia | 324,208 | 229,513 | 94,695 | 41.26% | ||||||||
| Cost of Goods Sold | $ | 1,403,081 | $ | 1,781,580 | $ | (378,499 | ) | -21.25% | ||||
| Humankind | 1,147,705 | 1,593,271 | (445,566 | ) | -27.97% | |||||||
| HLJ Huimeijia | 255,376 | 188,309 | 67,067 | 35.62% | ||||||||
| Gross Profit | $ | 530,296 | $ | 773,814 | $ | (243,518 | ) | -31.47% | ||||
| Humankind | 461,464 | 732,610 | (271,146 | ) | -37.01% | |||||||
| HLJ Huimeijia | 68,832 | 41,204 | 27,628 | 67.05% |
Revenue
Total revenues decreased by $622,017, or 24.34%, for the three months ended March 31, 2015 as compared to the same period in 2014. The decrease in revenues was primarily due to a decrease of $716,712 or 30.81% in Humankind’s revenues, and partially offset by an increase of $94,695 or 41.26% in HLJ Huimeijia’s revenues for the three months ended March 31, 2015 as compared to the same period in 2014. The reason for the decrease of the sales revenue in Humankind was due to the decrease in average sales price and sales volume. The average unit sale prices to the agents of Waterlilies Soft Capsule (Sailuozhi) and Propolis and Black Ant Capsule were decreased from $67.6 to $65.2 and from $30.6 to $29.3, for the three months ended March 31, 2015 and 2014, respectively. The sales volume in Waterlilies Soft Capsule (Sailuozhi) and Propolis and Black Ant Capsule decreased 5,659 and 8,832 boxes for the three months ended March 31, 2015 as compared to the same period in 2014, respectively, this decrease was caused by the loss of a small amount of customers who were not satisfied with the Company’s product portfolio as currently the Humankind only sells two products, Waterlilies Soft Capsule (Sailuozhi) and Propolis and Black Ant Capsule. The Company strives to expand the variety of its products and has purchased 12 new products from Guangzhou Aoda Biology Beauty Healthy Technology Co. Ltd in 2013. However, the majority of the 12 products were either under the review by the CFDA or in the process of Corporate Standard Registration, a backup registration not subject to the CFDA approval but subject to the CFDA’s monitor on the production after such a registration. The Company plans to accelerate the registration process and manufacture and release four to six new products to form a series of health-care products in the near future. The Company is also considering to develop new sales areas by acquiring new distributors or explore market for medical products in order to enhance the profits. The increase of the sales revenue in HLJ Huimeijia was mainly due to an increase in the total number of wholesale customers we served for the three months ended March 31, 2015.
Our total cost of sales decreased $378,499 or 21.25% for the three months ended March 31, 2015 as compared to the same period in 2014. The decrease in cost of sales was primarily due to a decrease of $445,566 or 27.97% in Humankind’s cost of sales, and partially offset by an increase of $67,067 or 35.62% in HLJ Huimeijia’s cost of sales for the three months ended March 31, 2015 as compared to the same period in 2014. This decrease was primarily due to the decrease in sales volume.
19
Our gross profit decreased $243,518 from $773,814 for the three months ended March 31, 2014 to $530,296 for the three months ended March 31, 2015. The decrease was primarily attributable to the $271,146 decrease in the gross profit from the products of Humankind’s that generally have higher margins. Our overall gross profit margin decreased 2.85% to 27.43% for the three months ended March 31, 2015 from 30.28% for the same period in 2014, primarily due the 2.82% decrease in the gross profit margin from Humankind, this decrease was due mainly to a decline in sales prices of Waterlilies Soft Capsule (Sailuozhi) and Propolis and Black Ant Capsule and a decline in sales volume as discussed above.
Sales by Product Line
The following table summarizes a breakdown of our sales by major product lines for the three months ended March 31, 2015 and 2014, respectively:
|
|
March 31, 2015 | March 31, 2014 | ||||||||||||||||
|
|
Quantity | % of | Quantity | % of | ||||||||||||||
|
|
(Unit) | Sales US$ | Sales | (Unit) | Sales US$ | Sales | ||||||||||||
|
Humankind |
||||||||||||||||||
|
Waterlilies Soft Capsule (Sailuozhi) |
15,807 | $ | 1,031,381 | 53.35% | 21,466 | $ | 1,452,095 | 56.82% | ||||||||||
|
Propolis and Black Ant Capsule |
19,708 | 577,787 | 29.88% | 28,540 | 873,786 | 34.19% | ||||||||||||
|
HLJ Huimeijia |
||||||||||||||||||
|
Muskiness Bone Strengthener Paste |
433,701 | $ | 118,283 | 6.12% | 353,265 | $ | 69,417 | 2.72% | ||||||||||
|
Muskiness Pain Relieving Paste |
139,776 | 44,869 | 2.32% | 80,012 | 24,455 | 0.96% | ||||||||||||
|
Injury and Rheumatism relieving Paste |
134,966 | 39,670 | 2.05% | 88,962 | 24,073 | 0.94% | ||||||||||||
|
Refining GouPi Cream |
295,896 | 67,981 | 3.52% | 63,838 | 19,733 | 0.77% | ||||||||||||
|
Injury and Paralysis Tincture |
- | - | - | 4,574 | 5,284 | 0.21% | ||||||||||||
|
Ge Hong Beriberi Water |
3,973 | 1,305 | 0.07% | 35,680 | 9,836 | 0.38% | ||||||||||||
|
Matrine Suppositories |
- | - | - | 48 | 24 | 0.00% | ||||||||||||
|
Pelvic Inflammation Suppository |
7,344 | 3,633 | 0.19% | 10,347 | 5,184 | 0.20% | ||||||||||||
|
Indometacin and Furazolidone Suppositories |
17,740 | 9,139 | 0.47% | 11,173 | 5,325 | 0.21% | ||||||||||||
|
Triamcinolone Acetonide and Neomycin Paste |
6,250 | 372 | 0.02% | 50,500 | 3,391 | 0.13% | ||||||||||||
|
Enema Glycerini |
247,020 | 25,887 | 1.34% | 497,474 | 49,127 | 1.92% | ||||||||||||
|
Hydrogen Peroxide Solution |
- | - | - | 15,800 | 1,642 | 0.06% | ||||||||||||
|
Umguentum Acidi Borici Camphoratum |
41,440 | 13,070 | 0.68% | 34,605 | 11,914 | 0.47% | ||||||||||||
|
Ethacriding Lactate Solution |
- | - | - | 1,000 | 108 | 0.00% | ||||||||||||
|
Total |
1,363,621 | $ | 1,933,377 | 100.00% | 1,297,284 | $ | 2,555,394 | 100.00% | ||||||||||
20
Operating Expenses
The following table summarizes our operating expenses for the three months ended March 31, 2015 and 2014, respectively:
|
|
March 31, 2015 | March 31, 2014 | Variance | % | ||||||||
|
Operating Expenses |
||||||||||||
|
Selling, general and administrative |
$ | 515,085 | $ | 540,192 | $ | (25,107 | ) | -4.65% | ||||
|
Depreciation and amortization |
173,083 | 42,684 | 130,399 | 305.50% | ||||||||
|
Research and development |
- | 47 | (47 | ) | -100.00% | |||||||
|
Total Operating Expenses |
$ | 688,168 | $ | 582,923 | $ | 105,245 | 18.05% |
Total operating expenses for the three months ended March 31, 2015 increased $105,245, or 18.05%, as compared to the corresponding period in 2014. The increase in operating expenses was primarily attributable to an increase of $130,399, or 305.50% in depreciation and amortization results from increased capital expenditure on our newly purchased machinery and equipment for the three months ended March 31, 2015, and reversed adjustment of land use right amortization in the quarter of 2014, which was caused by changed estimated useful life.
Interest Income and Interest Expense
Interest income was $24,479 for the three months ended March 31, 2015, as compared to $23,644 for the three months ended March 31, 2014. This increase of $835, or 3.53%, was primarily due to the increase in the average balance of deposits in the bank.
Interest expense was $31,276 for the three months ended March 31, 2015, as compared to $40,277 for the three months ended March 31, 2014. This decrease of $9,001 or 22.35% was primarily due to the decrease in short-term loan. The average daily short-term loans were $1,603,613 and $1,638,681 for the three months ended March 31, 2015 and 2014, respectively.
Income Taxes
Income taxes increased $25,754, or 100%, from $0 for the three months ended March 31, 2014 to $25,754 for the three months ended March 31, 2015. This was due to the Company’s loss before income taxes for the three months ended March 31, 2014 which resulted in $0 of income tax for that period.
Net Income (Loss) and Income (Loss) Per Share
Net loss was $180,800 for the three months ended March 31, 2015, as compared to net income of $135,448 for the three months ended March 31, 2014. This decrease of $316,248, or 233.48% in net income was primarily attributable to the decrease in revenues in the amount of $622,017, the increase in operating expense in the amount of $105,245, and the increase in the income tax of $25,754, partially offset by the decrease in cost of goods sold of $378,499.
Loss per share was $0.003 for the three months ended March 31, 2015 and income per share was $0.002 for the three months ended March 31, 2014. This decrease was primarily a result of the above increase in net loss.
The nine months ended March 31, 2015 compared to the nine months ended March 31, 2014.
The following table summarizes the top lines of the results of our operations for the nine months ended March 31, 2015 and 2014, respectively:
|
|
March 31, 2015 | March 31, 2014 | Variance | % | ||||||||
|
Revenues |
$ | 8,211,156 | $ | 6,501,198 | $ | 1,709,958 | 26.30% | |||||
|
Humankind |
6,924,258 | 5,520,703 | 1,403,555 | 25.42% | ||||||||
|
HLJ Huimeijia |
1,286,898 | 980,495 | 306,403 | 31.25% | ||||||||
|
Cost of Goods Sold |
$ | 5,796,457 | $ | 5,030,815 | $ | 765,642 | 15.22% | |||||
|
Humankind |
4,847,905 | 4,317,947 | 529,958 | 12.27% | ||||||||
|
HLJ Huimeijia |
948,552 | 712,868 | 235,684 | 33.06% | ||||||||
|
Gross Profit |
$ | 2,414,699 | $ | 1,470,383 | $ | 944,316 | 64.22% | |||||
|
Humankind |
2,076,353 | 1,202,756 | 873,597 | 72.63% | ||||||||
|
HLJ Huimeijia |
338,346 | 267,627 | 70,719 | 26.42% |
21
Revenue
Total revenues increased by $1,709,958, or 26.30%, for the nine months ended March 31, 2015 as compared to the same period in 2014. The increase in revenues was primarily due to an increase of $1,403,555 or 25.42% in Humankind’s revenues and an increase of $306,403 or 31.25% in HLJ Huimeijia’s revenues for the nine months ended March 31, 2015 as compared to the same period in 2014. The reason for the increase of the sales revenue in Humankind was due to the enhanced sales price and the increase in sales volume primarily during the six months ended December 31, 2014. The sales volume increase was attributable to the Company’s greater efforts in generating publicity for the nine months ended March 31, 2015.
Our total cost of sales increased $765,642 or 15.22% for the nine months ended March 31, 2015 as compared to the same period in 2014. The increase in cost of sales was primarily due to an increase of $529,958 or 12.27% in Humankind’s cost of sales and an increase of $235,684 or 33.06% in HLJ Huimeijia’s cost of sales for the nine months ended March 31, 2015 as compared to the same period in 2014. This increase was primarily due to the increase in sales volume.
Our gross profit increased $944,316 from $1,470,383 for the nine months ended March 31, 2014 to $2,414,699 for the nine months ended March 31, 2015. The increase was primarily attributable to the $873,597 increase in the gross profit from Humankind that generally have higher margins. Our overall gross profit margin increased 6.79% to 29.41% for the nine months ended March 31, 2015 from 22.62% for the same period in 2014, primarily due the 8.20% increase in the gross profit margin from Humankind, this increase was attributable to the enhanced sales prices of our two primary products and the increase in sales volume. The average sales prices of Waterlilies Soft Capsule (Sailuozhi) increased $7.3 from $59.2 for the nine months ended March 31, 2014 to $66.5 for the nine months ended December 31, 2015, and the sales prices of Propolis and Black Ant Capsule increased $2.0 from $27.8 for the nine months ended March 31, 2014 to $29.8 for the nine months ended March 31, 2015. The sales volume in Waterlilies Soft Capsule (Sailuozhi) and Propolis and Black Ant Capsule increased 5,698 and 14,921 boxes for the nine months ended March 31, 2015 as compared to the same period in 2014, respectively.
Sales by Product Line
The following table summarizes a breakdown of our sales by major product line for the nine months ended March 31, 2015 and 2014, respectively:
|
|
March 31, 2015 | March 31, 2014 | ||||||||||||||||
|
|
Quantity | % of | Quantity | % of | ||||||||||||||
|
|
(Unit) | Sales US$ | Sales | (Unit) | Sales US$ | Sales | ||||||||||||
|
Humankind |
||||||||||||||||||
|
Waterlilies Soft Capsule (Sailuozhi) |
64,682 | $ | 4,302,976 | 68.54% | 58,984 | $ | 3,491,329 | 88.48% | ||||||||||
|
Propolis and Black Ant Capsule |
87,877 | 2,621,281 | 41.75% | 72,956 | 2,029,374 | 51.43% | ||||||||||||
|
HLJ Huimeijia |
||||||||||||||||||
|
Muskiness Bone Strengthener Paste |
1,553,616 | $ | 432,121 | 6.88% | 1,102,362 | $ | 291,807 | 7.40% | ||||||||||
|
Muskiness Pain Relieving Paste |
653,964 | 194,201 | 3.09% | 382,159 | 115,871 | 2.94% | ||||||||||||
|
Injury and Rheumatism relieving Paste |
579,146 | 160,376 | 2.55% | 351,803 | 94,254 | 2.39% | ||||||||||||
|
Refining GouPi Cream |
839,651 | 218,448 | 3.48% | 472,015 | 115,531 | 2.93% | ||||||||||||
|
Injury and Paralysis Tincture |
19,876 | 20,372 | 0.32% | 32,254 | 34,999 | 0.89% | ||||||||||||
|
Ge Hong Beriberi Water |
13,748 | 4,315 | 0.07% | 41,918 | 12,030 | 0.30% | ||||||||||||
|
Matrine Suppositories |
- | - | - | 3,983 | 1,850 | 0.05% | ||||||||||||
|
Pelvic Inflammation Suppository |
39,276 | 22,598 | 0.36% | 27,684 | 14,771 | 0.37% | ||||||||||||
|
Indometacin and Furazolidone Suppositories |
54,596 | 27,919 | 0.44% | 36,547 | 17,527 | 0.44% | ||||||||||||
|
Triamcinolone Acetonide and Neomycin Paste |
292,350 | 20,067 | 0.32% | 306,100 | 20,771 | 0.53% | ||||||||||||
|
Compound Fluocinonide Tincture |
- | - | - | 477 | 434 | 0.01% | ||||||||||||
|
Enema Glycerini |
1,122,367 | 113,583 | 1.81% | 1,324,571 | 128,087 | 3.25% | ||||||||||||
|
Hydrogen Peroxide Solution |
96,710 | 10,758 | 0.17% | 179,080 | 17,776 | 0.45% | ||||||||||||
|
Umguentum Acidi Borici Camphoratum |
194,387 | 62,141 | 0.99% | 336,676 | 102,936 | 2.61% | ||||||||||||
|
Ethacriding Lactate Solution |
- | - | - | 113,250 | 11,851 | 0.30% | ||||||||||||
|
Total |
5,612,246 | $ | 8,211,156 | 130.80% | 4,710,879 | $ | 6,501,198 | 164.76% | ||||||||||
22
Operating Expenses
The following table summarizes our operating expenses for the nine months ended March 31, 2015 and 2014, respectively:
|
|
March 31, 2015 | March 31, 2014 | Variance | % | ||||||||
|
Operating Expenses |
||||||||||||
|
Selling, general and administrative |
$ | 1,570,843 | $ | 1,594,887 | $ | (24,044 | ) | -1.51% | ||||
|
Depreciation and amortization |
516,679 | 587,283 | (70,604 | ) | -12.02% | |||||||
|
Research and development |
- | 157,552 | (157,552 | ) | -100.00% | |||||||
|
Total Operating Expenses |
$ | 2,087,522 | $ | 2,339,722 | $ | (252,200 | ) | -10.78% |
Total operating expenses for the nine months ended March 31, 2015 decreased $252,200, or 10.78%, as compared to the corresponding period in 2014. The decrease in operating expenses was primarily attributable to a decrease of $157,552, or 100% in research and development expense, which had already been fully amortized in July 2013, and decrease of $70,604, or 12.02%, in depreciation and amortization resulted from the accrued amortization complementally for land use right for previous years before December 31, 2013.
Interest Income and Interest Expense
Interest income was $72,865 for the nine months ended March 31, 2015, as compared to $87,746 for the nine months ended March 31, 2014. This decrease of $14,881, or 16.96%, was primarily due to the decrease in the average balance of deposits in banks.
Interest expense was $93,474 for the nine months ended March 31, 2015, as compared to $84,280 for the nine months ended March 31, 2014. This increase of $9,194 or 10.91% was primarily due to the increase in short-term loans. The average daily short-term loans were $1,617,683 and $1,354,379 for the nine months ended March 31, 2015 and 2014, respectively.
23
Income Taxes
Income taxes increased $186,292, or 100%, from $0 for the nine months ended March 31, 2014 to $186,292 for the nine months ended March 31, 2015. This was due to the difference between the Company’s $335,747 income before income taxes for the nine months ended March 31, 2015 and a loss of $870,555 before income taxes for the nine months ended March 31, 2014.
Net Income (Loss) and Income (Loss) Per Share
Net income was $149,455 for the nine months ended March 31, 2015, as compared to net loss of $870,555 for the nine months ended March 31, 2014. This increase of $1,020,010, or 117.17% in net income was primarily attributable to the increase in revenues in the amount of $1,709,958, the decrease in operating expense in the amount of $252,200, partially offset by the increase in cost of goods sold of $765,642 and the increase in the income tax of $186,292.
Income per share was $0.002 for the nine months ended March 31, 2015 and loss per share was $0.014 for the nine months ended March 31, 2014. This increase was primarily a result of the above increase in net income.
Liquidity and Capital Resources
We believe our current working capital position, together with our expected future cash flows from operations, will be adequate to fund our operations in the ordinary course of business, anticipated capital expenditures, debt payment requirements and other contractual obligations for at least the next twelve months. However, this belief is based upon many assumptions and is subject to numerous risks, and there can be no assurance that we will not require additional funding in the future.
The following table summarizes our cash and cash equivalents position, our working capital, and our cash flow activity as of March 31, 2015 and 2014 and for each of the nine months then ended:
| 2015 | 2014 | |||||
| As of March 31: | ||||||
| Cash and cash equivalents | $ | 29,034,685 | $ | 27,052,042 | ||
| Working capital | $ | 26,221,884 | $ | 25,258,007 | ||
| Inventories | $ | 908,152 | $ | 1,129,339 | ||
| For the nine months ended March 31 : | ||||||
| Cash provided by (used in): | ||||||
| Operating activities | $ | 2,269,240 | $ | (1,669,461 | ) | |
| Investing activities | $ | (527,958 | ) | $ | (113,615 | ) |
| Financing activities | $ | 46,009 | $ | 307,250 |
For the nine months ended March 31, 2015, cash and cash equivalents increased $1,802,611 from $27,232,074 as of June 30, 2014 to $29,034,685 as of March 31, 2015, primarily attributable to net cash provided by operating activities in the amount of $2,269,240 and financing activities in the amount of $46,009, and the effect of exchange rate changes in the amount of $15,302, partially offset by net cash used in investing activities in the amount of $527,958.
For the nine months ended March 31, 2014, cash and cash equivalents decreased $1,816,491 from $28,868,533 as of June 30, 2013 to $27,052,042 as of March 31, 2014, primarily attributable to net cash used in operating activities in the amount of $1,669,461 and investing activities in the amount of $113,615, and the negative effect of exchange rate changes in the amount of $342,273, partially offset by net cash provided by financing activities in the amount of $307,250.
Our working capital at March 31, 2015 was $26,221,884, compared to working capital of $25,258,007 at March 31, 2014. This increase of $963,877 or 3.82% was primarily attributable to an increase in cash and cash equivalents of $1,982,643 and advance from customers of $532,518, partially offset by the decrease in accounts receivable, net of $478,207, the decrease in inventory of $291,183 and the decrease in taxes payable of $215,738.
24
Net cash provided by operating activities was $2,269,240 for the nine months ended March 31, 2015, primarily attributable to the net income available to the Company in the amount of $149,473, the depreciation and amortization expenses of $673,370 as reconciled, the decrease in account receivables of $883,986, the decrease in inventory of $201,102, the increase in advance from customers and other payables in the amount of $476,683 and the increase in wages payable of $84,247. Net cash used in investing activities was $527,958 for the nine months ended March 31, 2015, primarily attributable to an increase in construction in progress of $534,508, which is for the construction of a plant of HLJ Huimeijia to enhance its production capacity, expected to be complete before December 31, 2015. Net cash provided by financing activities was $46,009 for the nine months ended March 31, 2015, attributable to the proceeds from related party debts in the amount of $563,636, offset by repayment of related party debts in the amount of $517,627. The positive effect of exchange rate changes on cash and cash equivalents in the amount of $15,302 for the nine months ended March 31, 2015 was mainly a result of the effect of the depreciation of the RMB to the USD on the significant amount of cash and cash equivalents held by the Company in RMB. The foreign exchange rate of USD to RMB was 6.1990 to 1 as of March 31, 2015 and 6.2036 to 1 as of June 30, 2014, respectively and the average exchange rate from USD to RMB was 6.1821 for the nine months ended March 31, 2015.
Net cash used in operating activities was $1,686,295 for the nine months ended March 31, 2014, primarily attributable to a net loss available to the Company in the amount of $870,485 and net increase in accounts receivable of $1,722,779 resulting from Humankind’s extension of the credit period, partially offset by depreciation and amortization expenses of $690,619 as reconciled and net decrease in advance to suppliers and prepaid expense of $274,820. Net cash provided by financing activities was $307,250 for the nine months ended March 31, 2014, mainly attributable to proceeds of short-term loans in the amount of $1,637,687, partially offset by payment of related party debts in the amount of $184,056 and payment of short-term loan in the amount of $1,146,381. The negative effect of exchange rate changes on cash and cash equivalents in the amount of $342,273 for the nine months ended March 31, 2014 was mainly a result of the effect of the appreciation of the RMB to the USD on the significant amount of cash and cash equivalents held by the Company in RMB. The foreign exchange rate of USD to RMB was 6.1374 to 1 as of June 30, 2013 and 6.2164 to 1 as of March 31, 2014, respectively and the average exchange rate from USD to RMB was 6.1062 for the nine months ended March 31, 2014.
Other than as described in this report, we have no present agreements or commitments with respect to any material acquisitions of businesses, products, product rights or technologies or any other material capital expenditures. However, we will continue to evaluate acquisitions of, and/or investments in, products, technologies, capital equipment or improvements or companies that complement our business and may make such acquisitions and/or investments in the future. Accordingly, we may need to obtain additional sources of capital in the future to finance any such acquisitions and/or investments. We may not be able to obtain such financing on commercially reasonable terms, if at all. Even if we are able to obtain additional financing, it may contain undue restrictions on our operations, in the case of debt financing, or cause substantial dilution for our stockholders, in the case of equity financing.
Related Party Debts
We had related party debts of $1,823,709 as of March 31, 2015, as compared to $1,776,851 as of June 30, 2014, an increase of $46,858 or 2.64%, which is mainly attributable to a loan in the amount of $650,543 from Mr. Xin Sun, the CEO of the Company for the construction of the factory. The loan is unsecured and non-interest bearing and has no fixed terms of repayment. There was no written agreement for the loan.
Off-Balance Sheet Arrangements
We do not have any off-balance sheet arrangements that are currently material or reasonably likely to be material to our financial position or results of operations.
Critical Accounting Policies and Estimates
We prepare the condensed consolidated financial statements in accordance with US GAAP. These accounting principles require us to make judgments, estimates and assumptions on the reported amounts of assets and liabilities at the end of each fiscal period, and the reported amounts of revenues and expenses during each fiscal period. We continually evaluate these judgments and estimates based on our own historical experience, knowledge and assessment of current business and other conditions, our expectations regarding the future based on available information and assumptions that we believe to be reasonable.
There has been no material changes during the nine months ended March 31, 2015 in the Company’s significant accounting policies to those previously disclosed in the June 30, 2014 annual report.
25
| Item 3. | Quantitative and Qualitative Disclosures About Market Risk |
Not applicable.
| Item 4. | Controls and Procedures |
Evaluation of Disclosure Controls and Procedures
We maintain a set of disclosure controls and procedures designed to ensure that information required to be disclosed by us in our reports filed under the Securities Exchange Act of 1934, as amended (the “Exchange Act”), is recorded, processed, summarized and reported within the time periods specified by the SEC’s rules and forms. Disclosure controls are also designed with the objective of ensuring that this information is accumulated and communicated to our management, including our principal executive and principal financial officer, as appropriate, to allow timely decisions regarding required disclosure.
At the conclusion of the period ended March 31, 2015 we carried out an evaluation, under the supervision and with the participation of our management, including our principal executive and principal financial officer, of the effectiveness of the design and operation of our disclosure controls and procedures (as such term is defined in Rules 13a-15(e) and 15d-15(e) under the Exchange Act. Based upon that evaluation, our principal executive and principal financial officer concluded that, due to the material weakness in our internal control over financial reporting as discussed in our annual report on Form 10-K for the fiscal year ended June 30, 2014, as of the end of the period covered by this Quarterly Report on Form 10-Q, our disclosure controls and procedures were not effective to satisfy the objectives for which they are intended.
In an effort to remedy this material weakness in the future, we intend to do the following:
-
Develop a comprehensive training and development plan, for our finance, accounting and internal audit personnel, including our Chief Financial Officer, Financial Manager, and others, in the principles and rules of U.S. GAAP, SEC reporting requirements and the application thereof.
-
Design and implement a program to provide ongoing company-wide training regarding the Company’s internal controls, with particular emphasis on our finance and accounting staff.
-
Implement an internal review process over financial reporting to review all recent accounting pronouncements and to verify that the accounting treatment identified in such report have been fully implemented and confirmed by our internal control department. In the future, we will continue to improve our ongoing review and supervision of our internal control over financial reporting.
-
Hire an individual that possesses the requisite U.S. GAAP experience and education.
Despite the material weakness reported above, our management believes that our unaudited condensed consolidated and combined financial statements included in this report fairly present in all material respects our financial condition, results of operations and cash flows for the periods presented due to the fact that we have retained a consultant who has U.S. GAAP experience to assist us in the preparation of our unaudited condensed consolidated and combined financial statements.
26
Changes in Internal Control over Financial Reporting
No changes in our internal control over financial reporting have come to management’s attention during the quarter ended March 31, 2015 that have materially affected, or are likely to materially affect, our internal control over financial reporting.
Limitations on Controls
Management does not expect that our disclosure controls and procedures or our internal control over financial reporting will prevent or detect all error and fraud. Any control system, no matter how well designed and operated, is based upon certain assumptions and can provide only reasonable, not absolute, assurance that its objectives will be met. Further, no evaluation of controls can provide absolute assurance that misstatements due to error or fraud will not occur or that all control issues and instances of fraud, if any, within the Company have been detected.
PART II
OTHER INFORMATION
| Item 6. | Exhibits. |
The exhibits required by this item are set forth in the Exhibit Index attached hereto.
27
SIGNATURES
Pursuant to the requirements of Section 13 or 15(d) of the Securities Exchange Act of 1934, the registrant has duly caused this report to be signed on its behalf by the undersigned thereunto duly authorized.
| CHINA HEALTH INDUSTRIES HOLDINGS, INC. | ||
| /s/ Xin Sun | ||
| By: | Xin Sun | |
| Title: | Chief Executive Officer and Chief Financial Officer | |
| (principal executive officer, principal financial officer and | ||
| principal accounting officer) | ||
| Date: | May 15, 2015 | |
28
EXHIBIT INDEX
| Exhibit No. | Description |
| 31.1 | Certification of the Principal Executive Officer pursuant to Section 302 of the Sarbanes-Oxley Act of 2002. |
| 31.2 | Certification of the Principal Financial Officer pursuant to Section 302 of the Sarbanes-Oxley Act of 2002. |
| 32.1 | Certification of the Principal Executive Officer and the Principal Financial Officer pursuant to U.S.C. Section 1350 as adopted pursuant to Section 906 of the Sarbanes-Oxley Act of 2002. |
| 101.INS | XBRL Instance Document |
| 101.SCH | XBRL Taxonomy Extension Schema Document |
| 101.CAL | XBRL Taxonomy Extension Calculation Linkbase Document |
| 101.DEF | XBRL Taxonomy Extension Definition Linkbase Document |
| 101.LAB | XBRL Taxonomy Extension Label Linkbase Document |
| 101.PRE | XBRL Taxonomy Extension Presentation Linkbase Document |
29