Attached files
| file | filename |
|---|---|
| EX-99.1 - EX-99.1 - RAIT Financial Trust | ras-ex991_6.htm |
| 8-K - 8-K EARNINGS RELEASE - RAIT Financial Trust | ras-8k_20161231.htm |
Exhibit 99.2

Fourth Quarter 2016
Supplemental Information

TABLE OF CONTENTS
|
Company Information
|
3 |
|
Forward-Looking Statements
|
5 |
|
Earnings Release Text
|
6 |
|
Financial Highlights
|
10 |
|
Balance Sheets |
|
|
Consolidated by quarter |
11 |
|
Statements of Operations, FFO & CORE FFO |
|
|
Consolidated |
12 |
|
Consolidated – Trailing 5 Quarters |
13 |
|
Fee and Other Income
|
14 |
|
EBITDA and Coverage Ratios
|
15 |
|
Portfolio Data: |
|
|
Lending |
16 |
|
Real Estate Summary |
17 |
|
Real Estate Properties, Changes in the portfolio |
18 |
|
Real Estate Properties at December 31, 2016
|
19 |
|
Indebtedness Overview
|
20 |
|
Definitions |
21 |
2

RAIT Financial Trust
December 31, 2016
Company Information:
RAIT Financial Trust is an internally-managed real estate investment trust that provides debt financing options to owners of commercial real estate and owns a portfolio of commercial real estate properties located throughout the United States.
|
Corporate Headquarters |
Two Logan Square 100 N. 18th Street, 23rd Floor Philadelphia, Pa 19103 215.207.2100
|
|
Trading Symbol |
NYSE: “RAS”
|
|
Investor Relations Contact |
Andres Viroslav Two Logan Square 100 N. 18th Street, 23rd Floor Philadelphia, Pa 19103 215.207.2100 |
3
Common and Preferred Stock Information:
|
|
|
For the Three Months Ended |
|
|||||||||||||||||
|
|
|
December 31, 2016 |
|
|
September 30, 2016 |
|
|
June 30, 2016 |
|
|
March 31, 2016 |
|
|
December 31, 2015 |
|
|||||
|
Common: |
|
|
|
|
|
|
|
|
|
|
|
|
|
|
|
|
|
|
|
|
|
Share Price, period end |
|
$ |
3.36 |
|
|
$ |
3.38 |
|
|
$ |
3.13 |
|
|
$ |
3.14 |
|
|
$ |
2.70 |
|
|
Share Price, high |
|
$ |
3.45 |
|
|
$ |
3.40 |
|
|
$ |
3.39 |
|
|
$ |
3.23 |
|
|
$ |
5.45 |
|
|
Share Price, low |
|
$ |
2.41 |
|
|
$ |
2.88 |
|
|
$ |
2.73 |
|
|
$ |
1.85 |
|
|
$ |
2.25 |
|
|
Dividends declared |
|
$ |
0.09 |
|
|
$ |
0.09 |
|
|
$ |
0.09 |
|
|
$ |
0.09 |
|
|
$ |
0.09 |
|
|
Dividend yield, period end |
|
|
10.7 |
% |
|
|
10.7 |
% |
|
|
11.5 |
% |
|
|
11.5 |
% |
|
|
13.3 |
% |
|
Common shares outstanding |
|
|
92,295,478 |
|
|
|
92,174,644 |
|
|
|
92,185,242 |
|
|
|
91,870,571 |
|
|
|
91,586,767 |
|
|
Weighted Average common shares, basic |
|
|
91,203,955 |
|
|
|
91,201,784 |
|
|
|
91,190,583 |
|
|
|
91,018,160 |
|
|
|
90,642,318 |
|
|
Weighted Average common shares, diluted |
|
|
91,971,817 |
|
|
|
91,201,784 |
|
|
|
91,190,583 |
|
|
|
91,018,160 |
|
|
|
90,842,752 |
|
|
|
|
|
|
|
|
|
|
|
|
|
|
|
|
|
|
|
|
|
|
|
|
Preferred: |
|
|
|
|
|
|
|
|
|
|
|
|
|
|
|
|
|
|
|
|
|
Series A |
|
|
|
|
|
|
|
|
|
|
|
|
|
|
|
|
|
|
|
|
|
Shares outstanding |
|
|
5,344,353 |
|
|
|
5,344,353 |
|
|
|
5,306,084 |
|
|
|
5,306,084 |
|
|
|
5,306,084 |
|
|
Share price, period end |
|
$ |
20.28 |
|
|
$ |
20.34 |
|
|
$ |
19.55 |
|
|
$ |
17.50 |
|
|
$ |
18.15 |
|
|
Par, per share |
|
$ |
25.00 |
|
|
$ |
25.00 |
|
|
$ |
25.00 |
|
|
$ |
25.00 |
|
|
$ |
25.00 |
|
|
Dividend |
|
$ |
0.484375 |
|
|
$ |
0.484375 |
|
|
$ |
0.484375 |
|
|
$ |
0.484375 |
|
|
$ |
0.484375 |
|
|
Yield |
|
|
9.6 |
% |
|
|
9.5 |
% |
|
|
9.9 |
% |
|
|
11.1 |
% |
|
|
10.7 |
% |
|
Series B |
|
|
|
|
|
|
|
|
|
|
|
|
|
|
|
|
|
|
|
|
|
Shares outstanding |
|
|
2,340,969 |
|
|
|
2,340,969 |
|
|
|
2,340,969 |
|
|
|
2,340,969 |
|
|
|
2,340,969 |
|
|
Share price, period end |
|
$ |
21.26 |
|
|
$ |
21.76 |
|
|
$ |
19.97 |
|
|
$ |
17.94 |
|
|
$ |
18.98 |
|
|
Par, per share |
|
$ |
25.00 |
|
|
$ |
25.00 |
|
|
$ |
25.00 |
|
|
$ |
25.00 |
|
|
$ |
25.00 |
|
|
Dividend |
|
$ |
0.5234375 |
|
|
$ |
0.5234375 |
|
|
$ |
0.5234375 |
|
|
$ |
0.5234375 |
|
|
$ |
0.5234375 |
|
|
Yield |
|
|
9.8 |
% |
|
|
9.6 |
% |
|
|
10.5 |
% |
|
|
11.7 |
% |
|
|
11.0 |
% |
|
Series C |
|
|
|
|
|
|
|
|
|
|
|
|
|
|
|
|
|
|
|
|
|
Shares outstanding |
|
|
1,640,425 |
|
|
|
1,640,425 |
|
|
|
1,640,425 |
|
|
|
1,640,425 |
|
|
|
1,640,425 |
|
|
Share price, period end |
|
$ |
22.56 |
|
|
$ |
22.93 |
|
|
$ |
21.27 |
|
|
$ |
18.20 |
|
|
$ |
19.70 |
|
|
Par, per share |
|
$ |
25.00 |
|
|
$ |
25.00 |
|
|
$ |
25.00 |
|
|
$ |
25.00 |
|
|
$ |
25.00 |
|
|
Dividend |
|
$ |
0.5546875 |
|
|
$ |
0.5546875 |
|
|
$ |
0.5546875 |
|
|
$ |
0.5546875 |
|
|
$ |
0.5546875 |
|
|
Yield |
|
|
9.8 |
% |
|
|
9.7 |
% |
|
|
10.4 |
% |
|
|
12.2 |
% |
|
|
11.3 |
% |
|
Series D (not publicly traded) |
|
|
|
|
|
|
|
|
|
|
|
|
|
|
|
|
|
|
|
|
|
Shares outstanding |
|
|
3,536,000 |
|
|
|
4,000,000 |
|
|
|
4,000,000 |
|
|
|
4,000,000 |
|
|
|
4,000,000 |
|
|
Par, per share |
|
$ |
25.00 |
|
|
$ |
25.00 |
|
|
$ |
25.00 |
|
|
$ |
25.00 |
|
|
$ |
25.00 |
|
|
Coupon |
|
|
8.50 |
% |
|
|
8.50 |
% |
|
|
8.50 |
% |
|
|
8.50 |
% |
|
|
8.50 |
% |
4
This supplement may contain certain forward-looking statements within the meaning of Section 27A of the Securities Act of 1933, as amended, and Section 21E of the Securities Exchange Act of 1934, as amended. Such forward-looking statements can generally be identified by our use of forward-looking terminology such as “2017 expectations,” “guidance,” “may,” “plan”, “should,” “expect,” “intend,” “anticipate,” “estimate,” “believe,” “seek,” “opportunities” or other similar words or terms. Because such statements include risks, uncertainties and contingencies, actual results may differ materially from the expectations, intentions, beliefs, plans or predictions of the future expressed or implied by such forward-looking statements.
RAIT’s forward-looking statements include, but are not limited to, statements regarding RAIT’s plans and initiatives and 2017 expectations to (i) simplify its business model, (ii) focus on its core commercial real estate lending business, (iii) increase loan origination levels, when compared to 2016, as capital from non-lending related asset sales is re-deployed, (iv) deleverage by using cash generated by asset sales to repay debt, (v) opportunistically divest and maximize the value of RAIT’s legacy REO portfolio and existing property management operations and, ultimately, minimize REO holdings, (vi) significantly reduce its total expense base, (vii) continue to sell non-lending assets, (viii) achieve significant annual expense savings in connection with the internalization of IRT, (ix) sell in whole or substantial part its Urban Retail retail property management business and achieve costs savings in connection with such sale, and (x) enhance its long-term prospects and create value for its shareholders. Such forward-looking statements are based upon RAIT’s historical performance and its current plans, estimates, predictions and expectations and are not a representation that such plans, estimates, predictions or expectations will be achieved. Because such statements include risks, uncertainties and contingencies, actual results may differ materially from the expectations, intentions, beliefs, plans or predictions of the future expressed or implied by such forward-looking statements.
Risks, uncertainties and contingencies that may affect the results expressed or implied by RAIT’s forward-looking statements include, but are not limited to: (i) whether RAIT will be able to continue to implement its strategy to transition RAIT to a more lender focused, simpler, and more cost-efficient business model, to deleverage and to generate enhanced returns for its shareholders; (ii) whether RAIT will be able to continue to opportunistically divest and maximize the value of RAIT’s legacy REO portfolio and existing property management operations and the majority of RAIT’s non-lending assets; (iii) whether anticipated cost savings from the internalization of IRT will be achieved; (iv) whether the divestiture of RAIT’s CRE portfolio and other non-lending assets will lead to lower asset management costs and lower expenses; (v) whether RAIT will be able to reduce compensation and G&A expenses and indebtedness; (vi) whether RAIT’s new leadership will lead to enhanced value for shareholders; (vii) whether RAIT will be able to create sustainable earnings and grow book value; (viii) whether RAIT will be able to redeploy capital from non-lending related asset sales; (ix) whether RAIT will be able to increase loan origination levels; (x) whether the disposition of non-core assets, reductions in debt levels and expected loan repayments will impact RAIT’s earning and CAD; (xi) whether RAIT will continue to pay dividends and the amount of such dividends; (xii) whether RAIT will be able to organically increase reliance on match-funded asset-level debt; (xiii) overall conditions in commercial real estate and the economy generally; (xiv) whether market conditions will enable us to continue to implement our capital recycling and debt reduction plan involving selling properties and repurchasing or paying down our debt; (xv) whether we will be able to originate sufficient bridge loans; (xvi) whether the timing and amount of investments, repayments, any capital raised and our use of leverage will vary from those underlying our assumptions; (xvii) changes in the expected yield of our investments; (xviii) changes in financial markets and interest rates, or to the business or financial condition of RAIT or its business; (xix) whether RAIT will be able to originate loans in the amounts assumed; (xx) whether RAIT will generate any CMBS gain on sale profits; (xxi) whether the amount of loan repayments will be at the level assumed; (xxii) whether our management changes will be successfully implemented; (xxiii) whether RAIT will be able to dispose of its industrial portfolio or sell the other properties; (xxiv) the availability of financing and capital, including through the capital and securitization markets; (xxv) risks, disruption, costs and uncertainty caused by or related to the actions of activist shareholders, including that if individuals are elected to our Board with a specific agenda, it may adversely affect our ability to effectively implement our business strategy and create value for our shareholders and perceived uncertainties as to our future direction as a result of potential changes to the composition of our Board may lead to the perception of a change in the direction of our business, instability or a lack of continuity which may be exploited by our competitors, cause concern to our current or potential customers, and may result in the loss of potential business opportunities and make it more difficult to attract and retain qualified personnel and business partners; and (xxvi) other factors described in RAIT’s Annual Report on Form 10-K, Quarterly Reports on Form 10-Q and in other filings with the SEC. RAIT undertakes no obligation to update these forward-looking statements to reflect events or circumstances after the date hereof or to reflect the occurrence of unanticipated events, except as may be required by law.
5
RAIT Financial Trust Announces Fourth Quarter and Fiscal 2016 Financial Results
PHILADELPHIA, PA — February 24, 2017 — RAIT Financial Trust (“RAIT”) (NYSE: RAS) today announced fourth quarter and fiscal 2016 financial results. All per share results are reported on a diluted basis.
Results for the Quarter
|
|
- |
GAAP Earnings per share of $0.17 for the quarter ended December 31, 2016 compared to earnings per share of $0.02 for the quarter ended December 31, 2015. |
|
|
- |
Cash Available for Distribution (“CAD”) per share of $0.07 for the quarter ended December 31, 2016 compared to $0.19 per share for the quarter ended December 31, 2015. |
Results for the Year
|
|
- |
GAAP Earnings (loss) per share of ($0.11) for the year ended December 31, 2016 compared to earnings per share of $0.08 for the year ended December 31, 2015. |
|
|
- |
CAD per share of $0.45 for the year ended December 31, 2016 compared to $0.77 per share for the year ended December 31, 2015. |
|
|
- |
Assets Under Management (“AUM”) - AUM declined 39.6% to $3.6 billion as of the year ended December 31, 2016, compared to $5.9 billion as of the year ended December 31, 2015. |
2016 Key Business Accomplishments
|
- |
Monetization of RAIT’s Investment in IRT & RAIT’s Multi-family Property Management Business |
|
|
o |
RAIT sold the external advisor of Independence Realty Trust, Inc. (“IRT”) and RAIT’s multi-family property management business to IRT for $43.0 million in aggregate proceeds. |
|
|
o |
RAIT sold its IRT stock ownership position to IRT, generating $62.2 million in aggregate gross proceeds. |
|
|
o |
RAIT deconsolidated IRT from its financial statements. |
|
- |
2016 Property Sales |
|
|
o |
RAIT sold 18 properties which generated aggregate gross proceeds of $337.9 million. |
|
|
o |
After repayment of debt, RAIT received aggregate net proceeds of approximately $35.0 million. |
|
- |
Reductions in Compensation & General and Administrative Expenses (G&A) |
|
|
o |
Prior to instituting strategic initiatives in 2016, RAIT’s compensation and G&A expenses were $49.0 million for the year ended December 31, 2015 and would have been $56.2 million for the year ended 2016. As a result of 2016 strategic initiatives, RAIT’s compensation and G&A expenses declined to $31.7 million for the year ended December 31, 2016. |
|
|
o |
Created a headcount reduction of ~460 employees. |
|
- |
Debt Reductions |
|
|
o |
RAIT’s indebtedness, based on principal amount, declined by $664.6 million, or 27.1%, during the year ended December 31, 2016. Total recourse debt, excluding RAIT’s secured warehouse facilities, declined by $56.7 million, or 13.6%, during the year ended December 31, 2016. |
|
- |
Changes in Company Leadership and Board Beginning in 2016 and Continuing Through February 2017 |
|
|
o |
RAIT announced a new Board leadership structure and executive management changes to oversee and execute RAIT’s strategy and its transition to a more lender-focused and simpler, cost efficient and lower leverage business model. |
|
|
o |
On October 24, 2016, RAIT announced that Michael J. Malter, who joined RAIT’s Board of Trustees (the “Board”) in November 2015, was elected by the Board to serve as its independent Chairman. |
6
|
|
o |
On February 15, 2017, RAIT announced that Thomas D. Wren, a former banking executive and federal banking regulator, had joined the Board as a new independent trustee with substantial financial, regulatory, capital markets and mortgage REIT expertise, the third new Trustee to join RAIT’s nine-person Board since November 2015. |
|
|
o |
On February 21, 2017, RAIT announced that Paul W. Kopsky, Jr., a highly accomplished executive with extensive financial and operational leadership expertise across a diverse range of industries, was named to succeed James J. Sebra as RAIT’s Chief Financial Officer and Treasurer. |
|
- |
Cash Balance |
|
|
o |
Ended 2016 with $110.5 million of un-restricted cash. |
“Over the course of the year we have made significant progress toward our strategic goal of focusing on our core commercial real estate lending business and we look forward to carrying that momentum into 2017,” said Scott Davidson, RAIT’s Chief Executive Officer. “We made a number of strategic decisions around, and took actions to further, the aim of developing a sustainable platform for growth, including the monetization of our IRT investments, property sales and de-leveraging. As we continue to divest non-lending assets, we are also committed to the sale of Urban Retail which should result in additional cost reductions as well as further organizational simplicity. We will continue our focus on expense reduction while concentrating on our core commercial real estate lending activities. We are confident that we are pursuing the right strategy to position RAIT to grow long-term shareholder value.”
Commercial Real Estate (“CRE”) Lending Business
|
- |
On November 30, 2016, RAIT closed its sixth non-recourse, floating rate CMBS transaction. The transaction involved the sale, by a RAIT subsidiary, of investment grade notes totaling approximately $216.7 million with a weighted average cost of LIBOR plus 2.03%, which provided an advance rate to the RAIT subsidiary of approximately 84.0%. RAIT affiliates retained all of the below investment grade and un-rated subordinated interests totaling approximately $41.3 million. |
|
- |
RAIT originated $67.5 million of loans during the quarter ended December 31, 2016 consisting of six floating-rate bridge loans. RAIT originated $156.8 million of loans during the year ended December 31, 2016 consisting of $143.0 million of floating-rate bridge loans and $13.8 million of fixed-rate conduit loans. |
|
- |
RAIT sold $35.2 million of conduit loans during the year ended December 31, 2016 which generated fee income of $0.2 million. |
|
- |
CRE loan repayments were $116.8 million for the quarter ended December 31, 2016 and $425.0 million for the year ended December 31, 2016. |
CRE Property Portfolio & Property Sales
|
- |
As of December 31, 2016, RAIT’s real estate portfolio stood at $854.6 million, comprised of $328.0 million of office properties, $147.2 million of multi-family properties, $152.6 million of retail properties, $93.4 million of industrial properties, $81.1 million of properties in re-development and $52.3 million of land. |
|
- |
During the year ended December 31, 2016, RAIT sold 18 properties for $337.9 million which generated a $53.3 million GAAP gain. The proceeds from the sales were used to reduce debt and the sales generated $35.0 million of net proceeds to RAIT. |
|
- |
RAIT reported an $11.1 million asset impairment for the quarter ended December 31, 2016 related to six properties it expects to sell. |
Dividends
|
- |
On December 16, 2016, the Board declared a fourth quarter 2016 cash dividend on common shares of $0.09 per share. The dividend was paid on January 31, 2017 to holders of record on January 10, 2017. |
|
- |
On November 2, 2016, the Board declared a fourth quarter 2016 cash dividend of $0.484375 per share on RAIT’s 7.75% Series A Cumulative Redeemable Preferred Shares, $0.5234375 per share on RAIT’s 8.375% Series B Cumulative Redeemable Preferred Shares and $0.5546875 per share on RAIT’s 8.875% Series C Cumulative Redeemable Preferred Shares. The dividends were paid on January 3, 2017 to holders of record on December 1, 2016. |
7
RAIT expects that 2017 will be a transitional year as RAIT continues to transform into a more focused, cost-efficient and lower leverage business concentrated on CRE lending. Stakeholders should therefore anticipate the following during 2017:
|
|
- |
Continuous divestment of the majority of RAIT’s non-lending assets, including its commercial property management business operated by its subsidiary Urban Retail Properties, LLC, and further reductions in compensation and G&A expenses and indebtedness; |
|
|
- |
Increasing loan origination levels, when compared to 2016, as capital from non-lending related asset sales is re-deployed; |
|
|
- |
A decline in RAIT’s earnings and CAD, when compared to 2016, which is expected to be primarily impacted by the disposition of non-core assets, reductions in debt levels and expected loan repayments; |
|
|
- |
The Board expects to declare a cash dividend of $0.09 per share on its common stock for the first quarter of 2017 when RAIT announces its first quarter 2017 earnings; |
|
|
- |
G&A expenses are expected to decrease further throughout 2017 to a run-rate of approximately $25 million and into 2018 with a targeted annual run rate of approximately $21.5 million; |
|
|
- |
RAIT will not be providing earnings and CAD guidance for 2017. |
Selected Financial Information
See Schedule I to this Release for selected financial information for RAIT.
Non-GAAP Financial Measures and Definitions
RAIT discloses the following non-GAAP financial measures in this release: funds from operations (“FFO”), CAD and net operating income (“NOI”). A reconciliation of RAIT’s reported net income (loss) allocable to common shares to its FFO and CAD is included as Schedule IV to this release. A reconciliation of RAIT’s same store NOI to its reported same store net income (loss) is included as Schedule VI to this release. See Schedule VI to this release for management’s respective definitions and rationales for the usefulness of each of these non-GAAP financial measures and other definitions used in this release.
Supplemental Information
RAIT produces supplemental information that includes details regarding the performance of the portfolio, financial information, non-GAAP financial measures and other useful information for investors. The supplemental also contains deconsolidating financial information. The supplemental information is available via the Company's website, www.rait.com, through the "Investor Relations" section.
Conference Call
All interested parties can listen to the live conference call webcast at 9:30 AM ET on Friday, February 24, 2017 from the home page of the RAIT Financial Trust website at www.rait.com or by dialing 1.844.775.2541, access code 64221042. For those who are not available to listen to the live call, the replay will be available shortly following the live call on RAIT’s website and telephonically until Friday, March 3, 2017, by dialing 855.859.2056, access code 64221042.
About RAIT Financial Trust
RAIT Financial Trust is an internally-managed real estate investment trust focused on providing debt financing options to owners of commercial real estate throughout the United States. For more information, please visit www.rait.com or call Investor Relations at 215.207.2100.
Forward-Looking Statements
This press release may contain certain forward-looking statements within the meaning of Section 27A of the Securities Act of 1933, as amended, and Section 21E of the Securities Exchange Act of 1934, as amended. Such forward-looking statements can generally be identified by our use of forward-looking terminology such as “2017 expectations,” “guidance,” “may,” “plan”, “should,” “expect,”
8
“intend,” “anticipate,” “estimate,” “believe,” “seek,” “opportunities” or other similar words or terms. Because such statements include risks, uncertainties and contingencies, actual results may differ materially from the expectations, intentions, beliefs, plans or predictions of the future expressed or implied by such forward-looking statements.
RAIT’s forward-looking statements include, but are not limited to, statements regarding RAIT’s plans and initiatives and 2017 expectations to (i) simplify its business model, (ii) focus on its core commercial real estate lending business, (iii) increase loan origination levels, when compared to 2016, as capital from non-lending related asset sales is re-deployed, (iv) deleverage by using cash generated by asset sales to repay debt, (v) opportunistically divest and maximize the value of RAIT’s legacy REO portfolio and existing property management operations and, ultimately, minimize REO holdings, (vi) significantly reduce its total expense base, (vii) continue to sell non-lending assets, (viii) achieve significant annual expense savings in connection with the internalization of IRT, (ix) sell in whole or substantial part its Urban Retail retail property management business and achieve costs savings in connection with such sale, and (x) enhance its long-term prospects and create value for its shareholders. Such forward-looking statements are based upon RAIT’s historical performance and its current plans, estimates, predictions and expectations and are not a representation that such plans, estimates, predictions or expectations will be achieved. Because such statements include risks, uncertainties and contingencies, actual results may differ materially from the expectations, intentions, beliefs, plans or predictions of the future expressed or implied by such forward-looking statements.
Risks, uncertainties and contingencies that may affect the results expressed or implied by RAIT’s forward-looking statements include, but are not limited to: (i) whether RAIT will be able to continue to implement its strategy to transition RAIT to a more lender focused, simpler, and more cost-efficient business model, to deleverage and to generate enhanced returns for its shareholders; (ii) whether RAIT will be able to continue to opportunistically divest and maximize the value of RAIT’s legacy REO portfolio and existing property management operations and the majority of RAIT’s non-lending assets; (iii) whether anticipated cost savings from the internalization of IRT will be achieved; (iv) whether the divestiture of RAIT’s CRE portfolio and other non-lending assets will lead to lower asset management costs and lower expenses; (v) whether RAIT will be able to reduce compensation and G&A expenses and indebtedness; (vi) whether RAIT’s new leadership will lead to enhanced value for shareholders; (vii) whether RAIT will be able to create sustainable earnings and grow book value; (viii) whether RAIT will be able to redeploy capital from non-lending related asset sales; (ix) whether RAIT will be able to increase loan origination levels; (x) whether the disposition of non-core assets, reductions in debt levels and expected loan repayments will impact RAIT’s earning and CAD; (xi) whether RAIT will continue to pay dividends and the amount of such dividends; (xii) whether RAIT will be able to organically increase reliance on match-funded asset-level debt; (xiii) overall conditions in commercial real estate and the economy generally; (xiv) whether market conditions will enable us to continue to implement our capital recycling and debt reduction plan involving selling properties and repurchasing or paying down our debt; (xv) whether we will be able to originate sufficient bridge loans; (xvi) whether the timing and amount of investments, repayments, any capital raised and our use of leverage will vary from those underlying our assumptions; (xvii) changes in the expected yield of our investments; (xviii) changes in financial markets and interest rates, or to the business or financial condition of RAIT or its business; (xix) whether RAIT will be able to originate loans in the amounts assumed; (xx) whether RAIT will generate any CMBS gain on sale profits; (xxi) whether the amount of loan repayments will be at the level assumed; (xxii) whether our management changes will be successfully implemented; (xxiii) whether RAIT will be able to dispose of its industrial portfolio or sell the other properties; (xxiv) the availability of financing and capital, including through the capital and securitization markets; (xxv) risks, disruption, costs and uncertainty caused by or related to the actions of activist shareholders, including that if individuals are elected to our Board with a specific agenda, it may adversely affect our ability to effectively implement our business strategy and create value for our shareholders and perceived uncertainties as to our future direction as a result of potential changes to the composition of our Board may lead to the perception of a change in the direction of our business, instability or a lack of continuity which may be exploited by our competitors, cause concern to our current or potential customers, and may result in the loss of potential business opportunities and make it more difficult to attract and retain qualified personnel and business partners; and (xxvi) other factors described in RAIT’s Annual Report on Form 10-K, Quarterly Reports on Form 10-Q and in other filings with the SEC. RAIT undertakes no obligation to update these forward-looking statements to reflect events or circumstances after the date hereof or to reflect the occurrence of unanticipated events, except as may be required by law.
RAIT Financial Trust Contact
Andres Viroslav
215-207-2100
aviroslav@rait.com
9
|
($'s in 000's) |
|
For the Three Months Ended |
|
|||||||||||||||||
|
|
|
December 31, 2016 |
|
|
September 30, 2016 |
|
|
June 30, 2016 |
|
|
March 31, 2016 |
|
|
December 31, 2015 |
|
|||||
|
OPERATING DATA: |
|
|
|
|
|
|
|
|
|
|
|
|
|
|
|
|
|
|
|
|
|
Lending: |
|
|
|
|
|
|
|
|
|
|
|
|
|
|
|
|
|
|
|
|
|
Investments in loans |
|
$ |
1,292,639 |
|
|
$ |
1,373,615 |
|
|
$ |
1,495,343 |
|
|
$ |
1,612,632 |
|
|
$ |
1,623,583 |
|
|
Gross loan production |
|
$ |
67,540 |
|
|
$ |
25,550 |
|
|
$ |
23,185 |
|
|
$ |
40,475 |
|
|
$ |
321,837 |
|
|
CMBS income |
|
$ |
20 |
|
|
$ |
305 |
|
|
$ |
(260 |
) |
|
$ |
171 |
|
|
$ |
1,135 |
|
|
CMBS loans sold |
|
$ |
- |
|
|
$ |
13,800 |
|
|
$ |
21,377 |
|
|
$ |
- |
|
|
$ |
85,430 |
|
|
Average CMBS Gain on Sale (points) |
|
|
- |
|
|
|
2.2 |
|
|
|
(1.2 |
) |
(a) |
|
- |
|
|
|
1.3 |
|
|
|
|
|
|
|
|
|
|
|
|
|
|
|
|
|
|
|
|
|
|
|
|
Real estate portfolio: |
|
|
|
|
|
|
|
|
|
|
|
|
|
|
|
|
|
|
|
|
|
Gross real estate investments |
|
$ |
854,646 |
|
|
$ |
965,362 |
|
|
$ |
1,095,024 |
|
|
$ |
1,130,295 |
|
|
$ |
1,145,630 |
|
|
Property income |
|
$ |
23,501 |
|
|
$ |
29,614 |
|
|
$ |
29,666 |
|
|
$ |
30,055 |
|
|
$ |
29,756 |
|
|
Operating expenses |
|
$ |
13,084 |
|
|
$ |
14,635 |
|
|
$ |
14,327 |
|
|
$ |
14,848 |
|
|
$ |
14,922 |
|
|
Net operating income |
|
$ |
10,417 |
|
|
$ |
14,979 |
|
|
$ |
15,339 |
|
|
$ |
15,207 |
|
|
$ |
14,834 |
|
|
NOI margin |
|
|
44.3 |
% |
|
|
50.6 |
% |
|
|
51.7 |
% |
|
|
50.6 |
% |
|
|
49.9 |
% |
|
|
|
|
|
|
|
|
|
|
|
|
|
|
|
|
|
|
|
|
|
|
|
EARNINGS & DIVIDENDS: |
|
|
|
|
|
|
|
|
|
|
|
|
|
|
|
|
|
|
|
|
|
Earnings (loss) per share from continuing operations - diluted |
|
$ |
(0.37 |
) |
|
$ |
(0.02 |
) |
|
$ |
(0.15 |
) |
|
$ |
(0.22 |
) |
|
$ |
(0.02 |
) |
|
Earnings (loss) per share from discontinued operations - diluted |
|
$ |
0.54 |
|
|
$ |
0.02 |
|
|
$ |
0.07 |
|
|
$ |
0.02 |
|
|
$ |
0.04 |
|
|
Earnings (loss) per share -- diluted |
|
$ |
0.17 |
|
|
$ |
- |
|
|
$ |
(0.08 |
) |
|
$ |
(0.20 |
) |
|
$ |
0.02 |
|
|
FFO per share |
|
$ |
0.05 |
|
|
$ |
0.12 |
|
|
$ |
(0.04 |
) |
|
$ |
(0.03 |
) |
|
$ |
(0.07 |
) |
|
CAD per share |
|
$ |
0.07 |
|
|
$ |
0.12 |
|
|
$ |
0.12 |
|
|
$ |
0.14 |
|
|
$ |
0.19 |
|
|
Dividends per share |
|
$ |
0.09 |
|
|
$ |
0.09 |
|
|
$ |
0.09 |
|
|
$ |
0.09 |
|
|
$ |
0.09 |
|
|
CAD payout ratio |
|
|
128.6 |
% |
|
|
75.0 |
% |
|
|
75.0 |
% |
|
|
64.3 |
% |
|
|
47.4 |
% |
|
|
|
|
|
|
|
|
|
|
|
|
|
|
|
|
|
|
|
|
|
|
|
CAPITALIZATION AND COVERAGE RATIOS: |
|
|
|
|
|
|
|
|
|
|
|
|
|
|
|
|
|
|
|
|
|
Recourse/Non-Recourse Debt: |
|
|
|
|
|
|
|
|
|
|
|
|
|
|
|
|
|
|
|
|
|
Recourse |
|
$ |
365,921 |
|
|
$ |
509,938 |
|
|
$ |
479,608 |
|
|
$ |
509,466 |
|
|
$ |
484,764 |
|
|
Non-Recourse |
|
|
1,361,246 |
|
|
|
1,441,510 |
|
|
|
1,620,777 |
|
|
|
1,830,841 |
|
|
|
1,914,711 |
|
|
Total Recourse/Non-Recourse debt |
|
|
1,727,167 |
|
|
|
1,951,448 |
|
|
|
2,100,385 |
|
|
|
2,340,307 |
|
|
|
2,399,475 |
|
|
Preferred shares (par) |
|
|
321,544 |
|
|
|
333,144 |
|
|
|
332,187 |
|
|
|
332,187 |
|
|
|
332,187 |
|
|
Common shares (market capitalization) |
|
|
310,113 |
|
|
|
311,550 |
|
|
|
288,540 |
|
|
|
288,474 |
|
|
|
247,284 |
|
|
Noncontrolling interests, at carrying value (b) |
|
|
5,386 |
|
|
|
5,386 |
|
|
|
1,792 |
|
|
|
2,782 |
|
|
|
3,948 |
|
|
Total capitalization |
|
$ |
2,364,210 |
|
|
$ |
2,601,528 |
|
|
$ |
2,722,904 |
|
|
$ |
2,963,750 |
|
|
$ |
2,982,894 |
|
|
|
|
|
|
|
|
|
|
|
|
|
|
|
|
|
|
|
|
|
|
|
|
Total Liabilities/Total Gross Assets |
|
|
76.2 |
% |
|
|
74.9 |
% |
|
|
75.7 |
% |
|
|
77.3 |
% |
|
|
77.4 |
% |
|
Total Liabilities + Preferred/Total Gross Assets |
|
|
88.8 |
% |
|
|
83.0 |
% |
|
|
83.4 |
% |
|
|
84.6 |
% |
|
|
84.5 |
% |
|
|
|
|
|
|
|
|
|
|
|
|
|
|
|
|
|
|
|
|
|
|
|
Interest Coverage |
|
|
1.40 |
x |
|
|
1.85 |
x |
|
|
1.87 |
x |
|
|
1.89 |
x |
|
|
2.02 |
x |
|
Interest + Preferred Coverage |
|
|
1.00 |
x |
|
|
1.46 |
x |
|
|
1.50 |
x |
|
|
1.53 |
x |
|
|
1.62 |
x |
|
|
|
|
|
|
|
|
|
|
|
|
|
|
|
|
|
|
|
|
|
|
|
OTHER KEY BENCHMARKS: |
|
|
|
|
|
|
|
|
|
|
|
|
|
|
|
|
|
|
|
|
|
Total Assets Under Management (AUM) |
|
$ |
3,575,224 |
|
|
$ |
5,128,101 |
|
|
$ |
5,491,448 |
|
|
$ |
5,854,824 |
|
|
$ |
5,923,601 |
|
|
Total Gross Assets |
|
$ |
2,556,302 |
|
|
$ |
4,118,215 |
|
|
$ |
4,275,086 |
|
|
$ |
4,551,613 |
|
|
$ |
4,634,035 |
|
|
|
(a) |
During the second quarter of 2016, we sold $21.4 million of CMBS loans at a loss on sale. Including the net interest margin we earned on these loans since their origination, we had a net gain of $49, or 0.2 points. |
|
|
(b) |
Excludes noncontrolling interests associated with discontinued operations. |
10
CONSOLIDATED, by quarter
|
($'s in 000's) |
|
As of |
|
|
|||||||||||||||||
|
|
|
December 31, 2016 |
|
|
September 30, 2016 |
|
|
June 30, 2016 |
|
|
March 31, 2016 |
|
|
December 31, 2015 |
|
|
|||||
|
Assets |
|
|
|
|
|
|
|
|
|
|
|
|
|
|
|
|
|
|
|
|
|
|
Investments in loans: |
|
|
|
|
|
|
|
|
|
|
|
|
|
|
|
|
|
|
|
|
|
|
Investment in loans |
|
$ |
1,292,639 |
|
|
$ |
1,373,615 |
|
|
$ |
1,495,343 |
|
|
$ |
1,612,632 |
|
|
$ |
1,623,583 |
|
|
|
Allowance for loan losses |
|
|
(12,354 |
) |
|
|
(18,655 |
) |
|
|
(18,237 |
) |
|
|
(18,165 |
) |
|
|
(17,097 |
) |
|
|
Investments in loans, net |
|
|
1,280,285 |
|
|
|
1,354,960 |
|
|
|
1,477,106 |
|
|
|
1,594,467 |
|
|
|
1,606,486 |
|
|
|
Investments in real estate: |
|
|
|
|
|
|
|
|
|
|
|
|
|
|
|
|
|
|
|
|
|
|
Investments in real estate at cost |
|
|
854,646 |
|
|
|
965,362 |
|
|
|
1,095,024 |
|
|
|
1,130,295 |
|
|
|
1,145,630 |
|
|
|
Accumulated depreciation |
|
|
(138,214 |
) |
|
|
(156,613 |
) |
|
|
(164,037 |
) |
|
|
(164,999 |
) |
|
|
(158,688 |
) |
|
|
Investments in real estate, net |
|
|
716,432 |
|
|
|
808,749 |
|
|
|
930,987 |
|
|
|
965,296 |
|
|
|
986,942 |
|
|
|
Cash and cash equivalents |
|
|
110,531 |
|
|
|
36,019 |
|
|
|
38,726 |
|
|
|
72,425 |
|
|
|
87,581 |
|
|
|
Restricted cash |
|
|
190,179 |
|
|
|
229,957 |
|
|
|
152,650 |
|
|
|
193,151 |
|
|
|
207,599 |
|
|
|
Accrued interest receivable |
|
|
36,271 |
|
|
|
41,603 |
|
|
|
42,139 |
|
|
|
49,987 |
|
|
|
47,343 |
|
|
|
Other assets |
|
|
53,878 |
|
|
|
81,546 |
|
|
|
64,385 |
|
|
|
70,580 |
|
|
|
67,566 |
|
|
|
Intangible assets, net |
|
|
19,267 |
|
|
|
23,165 |
|
|
|
25,668 |
|
|
|
26,679 |
|
|
|
28,864 |
|
|
|
Assets of discontinued operations |
|
|
- |
|
|
|
1,306,532 |
|
|
|
1,308,403 |
|
|
|
1,345,185 |
|
|
|
1,383,547 |
|
|
|
Total assets |
|
$ |
2,406,843 |
|
|
$ |
3,882,531 |
|
|
$ |
4,040,064 |
|
|
$ |
4,317,770 |
|
|
$ |
4,415,928 |
|
|
|
|
|
|
|
|
|
|
|
|
|
|
|
|
|
|
|
|
|
|
|
|
|
|
Liabilities and Equity |
|
|
|
|
|
|
|
|
|
|
|
|
|
|
|
|
|
|
|
|
|
|
Indebtedness, net |
|
$ |
1,751,082 |
|
|
$ |
1,975,863 |
|
|
$ |
2,124,906 |
|
|
$ |
2,364,902 |
|
|
$ |
2,399,475 |
|
|
|
Accrued interest payable |
|
|
8,347 |
|
|
|
10,464 |
|
|
|
10,401 |
|
|
|
11,985 |
|
|
|
8,595 |
|
|
|
Accounts payable and accrued expenses |
|
|
20,016 |
|
|
|
20,082 |
|
|
|
16,328 |
|
|
|
15,785 |
|
|
|
22,557 |
|
|
|
Derivative liabilities |
|
|
- |
|
|
|
1,748 |
|
|
|
2,809 |
|
|
|
4,181 |
|
|
|
4,727 |
|
|
|
Borrowers' escrows, dividends payable and other liabilities |
|
|
168,047 |
|
|
|
168,692 |
|
|
|
176,789 |
|
|
|
197,967 |
|
|
|
197,908 |
|
|
|
Liabilities of discontinued operations |
|
|
- |
|
|
|
906,225 |
|
|
|
903,907 |
|
|
|
923,352 |
|
|
|
952,530 |
|
|
|
Total liabilities |
|
|
1,947,492 |
|
|
|
3,083,074 |
|
|
|
3,235,140 |
|
|
|
3,518,172 |
|
|
|
3,585,792 |
|
|
|
|
|
|
|
|
|
|
|
|
|
|
|
|
|
|
|
|
|
|
|
|
|
|
Series D preferred stock |
|
|
81,581 |
|
|
|
90,728 |
|
|
|
88,861 |
|
|
|
87,085 |
|
|
|
85,395 |
|
|
|
|
|
|
|
|
|
|
|
|
|
|
|
|
|
|
|
|
|
|
|
|
|
|
Equity: |
|
|
|
|
|
|
|
|
|
|
|
|
|
|
|
|
|
|
|
|
|
|
Shareholders' Equity: |
|
|
|
|
|
|
|
|
|
|
|
|
|
|
|
|
|
|
|
|
|
|
7.75% Series A Preferred shares |
|
|
53 |
|
|
|
53 |
|
|
|
53 |
|
|
|
53 |
|
|
|
53 |
|
|
|
8.375% Series B Preferred shares |
|
|
23 |
|
|
|
23 |
|
|
|
23 |
|
|
|
23 |
|
|
|
23 |
|
|
|
8.875% Series C Preferred shares |
|
|
17 |
|
|
|
17 |
|
|
|
17 |
|
|
|
17 |
|
|
|
17 |
|
|
|
Common shares, $0.03 par value per share |
|
|
2,769 |
|
|
|
2,766 |
|
|
|
2,766 |
|
|
|
2,756 |
|
|
|
2,748 |
|
|
|
Additional paid in capital |
|
|
2,093,257 |
|
|
|
2,090,210 |
|
|
|
2,088,781 |
|
|
|
2,087,913 |
|
|
|
2,087,137 |
|
|
|
Accumulated other comprehensive income (loss) |
|
|
- |
|
|
|
(112 |
) |
|
|
(972 |
) |
|
|
(2,434 |
) |
|
|
(4,699 |
) |
|
|
Retained earnings (deficit) |
|
|
(1,723,735 |
) |
|
|
(1,731,141 |
) |
|
|
(1,722,936 |
) |
|
|
(1,707,143 |
) |
|
|
(1,680,751 |
) |
|
|
Total shareholders' equity |
|
|
372,384 |
|
|
|
361,816 |
|
|
|
367,732 |
|
|
|
381,185 |
|
|
|
404,528 |
|
|
|
Noncontrolling interests - continuing operations |
|
|
5,386 |
|
|
|
5,386 |
|
|
|
1,792 |
|
|
|
2,782 |
|
|
|
3,948 |
|
|
|
Noncontrolling interests - discontinued operations |
|
|
- |
|
|
|
341,527 |
|
|
|
346,539 |
|
|
|
328,546 |
|
|
|
336,265 |
|
|
|
Total noncontrolling interests |
|
|
5,386 |
|
|
|
346,913 |
|
|
|
348,331 |
|
|
|
331,328 |
|
|
|
340,213 |
|
|
|
Total equity |
|
|
377,770 |
|
|
|
708,729 |
|
|
|
716,063 |
|
|
|
712,513 |
|
|
|
744,741 |
|
|
|
Total liabilities and equity |
|
$ |
2,406,843 |
|
|
$ |
3,882,531 |
|
|
$ |
4,040,064 |
|
|
$ |
4,317,770 |
|
|
$ |
4,415,928 |
|
|
11
STATEMENTS OF OPERATIONS, FFO & CAD
CONSOLIDATED – THREE AND TWELVE MONTHS ENDED DECEMBER 31, 2016
|
($'s in 000's, except per share amounts) |
|
Three Months Ended December 31, |
|
|
Twelve Months Ended December 31, |
|
||||||||||
|
|
|
2016 |
|
|
2015 |
|
|
2016 |
|
|
2015 |
|
||||
|
Revenue: |
|
|
|
|
|
|
|
|
|
|
|
|
|
|
|
|
|
Net interest margin |
|
|
|
|
|
|
|
|
|
|
|
|
|
|
|
|
|
Investment interest income |
|
$ |
19,693 |
|
|
$ |
26,609 |
|
|
$ |
89,203 |
|
|
$ |
98,432 |
|
|
Investment interest expense |
|
|
(8,849 |
) |
|
|
(6,733 |
) |
|
|
(35,806 |
) |
|
|
(29,250 |
) |
|
Net interest margin |
|
|
10,844 |
|
|
|
19,876 |
|
|
|
53,397 |
|
|
|
69,182 |
|
|
Property income |
|
|
23,501 |
|
|
|
29,756 |
|
|
|
112,836 |
|
|
|
124,157 |
|
|
Fee and other income |
|
|
1,400 |
|
|
|
3,515 |
|
|
|
7,374 |
|
|
|
18,275 |
|
|
Total revenue |
|
|
35,745 |
|
|
|
53,147 |
|
|
|
173,607 |
|
|
|
211,614 |
|
|
|
|
|
|
|
|
|
|
|
|
|
|
|
|
|
|
|
|
Expenses: |
|
|
|
|
|
|
|
|
|
|
|
|
|
|
|
|
|
Interest expense |
|
|
11,914 |
|
|
|
15,491 |
|
|
|
55,049 |
|
|
|
61,750 |
|
|
Real estate operating expenses |
|
|
13,084 |
|
|
|
14,922 |
|
|
|
56,894 |
|
|
|
62,726 |
|
|
Property management expenses |
|
|
2,240 |
|
|
|
2,220 |
|
|
|
9,479 |
|
|
|
9,323 |
|
|
General and administrative expenses: |
|
|
|
|
|
|
|
|
|
|
|
|
|
|
|
|
|
Compensation expenses |
|
|
6,275 |
|
|
|
4,854 |
|
|
|
18,437 |
|
|
|
15,349 |
|
|
Other general and administrative expenses |
|
|
3,300 |
|
|
|
3,895 |
|
|
|
13,273 |
|
|
|
14,707 |
|
|
Total general and administrative expenses |
|
|
9,575 |
|
|
|
8,749 |
|
|
|
31,710 |
|
|
|
30,056 |
|
|
Acquisition and integration expenses |
|
|
248 |
|
|
|
940 |
|
|
|
624 |
|
|
|
2,332 |
|
|
Provision for loan losses |
|
|
3,848 |
|
|
|
2,450 |
|
|
|
8,050 |
|
|
|
8,300 |
|
|
Depreciation and amortization expense |
|
|
12,031 |
|
|
|
10,883 |
|
|
|
51,304 |
|
|
|
45,505 |
|
|
IRT internalization and management transition expenses |
|
|
6,271 |
|
|
|
— |
|
|
|
6,271 |
|
|
|
— |
|
|
Total expenses |
|
|
59,211 |
|
|
|
55,655 |
|
|
|
219,381 |
|
|
|
219,992 |
|
|
Operating Income |
|
|
(23,466 |
) |
|
|
(2,508 |
) |
|
|
(45,774 |
) |
|
|
(8,378 |
) |
|
Other income (expense) |
|
|
(457 |
) |
|
|
(48 |
) |
|
|
(427 |
) |
|
|
(1,083 |
) |
|
Gains (losses) on assets |
|
|
29,461 |
|
|
|
12,682 |
|
|
|
53,272 |
|
|
|
37,393 |
|
|
Asset impairment |
|
|
(11,127 |
) |
|
|
(929 |
) |
|
|
(37,785 |
) |
|
|
(8,179 |
) |
|
Gains (losses) on debt extinguishment |
|
|
333 |
|
|
|
— |
|
|
|
1,331 |
|
|
|
— |
|
|
Change in fair value of financial instruments |
|
|
1,109 |
|
|
|
(1,828 |
) |
|
|
(5,946 |
) |
|
|
11,638 |
|
|
Income (loss) before taxes |
|
|
(4,147 |
) |
|
|
7,369 |
|
|
|
(35,329 |
) |
|
|
31,391 |
|
|
Income tax benefit (provision) |
|
|
(20,601 |
) |
|
|
(1,478 |
) |
|
|
(2,550 |
) |
|
|
(2,798 |
) |
|
Income (loss) from continuing operations |
|
|
(24,748 |
) |
|
|
5,891 |
|
|
|
(37,879 |
) |
|
|
28,593 |
|
|
Discontinued operations: |
|
|
|
|
|
|
|
|
|
|
|
|
|
|
|
|
|
Income (loss) from discontinued operations |
|
|
1,671 |
|
|
|
6,069 |
|
|
|
40,144 |
|
|
|
34,900 |
|
|
Gain (loss) on disposal of discontinued operations |
|
|
47,808 |
|
|
|
— |
|
|
|
47,808 |
|
|
|
— |
|
|
Net income (loss) |
|
|
24,731 |
|
|
|
11,960 |
|
|
|
50,073 |
|
|
|
63,493 |
|
|
Income allocated to preferred shares |
|
|
(9,310 |
) |
|
|
(8,447 |
) |
|
|
(35,160 |
) |
|
|
(32,830 |
) |
|
(Income) loss allocated to noncontrolling interests |
|
|
187 |
|
|
|
(1,682 |
) |
|
|
(24,733 |
) |
|
|
(23,505 |
) |
|
Net income (loss) available to common shares |
|
$ |
15,608 |
|
|
$ |
1,831 |
|
|
$ |
(9,820 |
) |
|
$ |
7,158 |
|
|
|
|
|
|
|
|
|
|
|
|
|
|
|
|
|
|
|
|
Amount attributable to common shares: |
|
|
|
|
|
|
|
|
|
|
|
|
|
|
|
|
|
Net income (loss) available to common shares from continuing operations |
|
$ |
(34,078 |
) |
|
$ |
(1,797 |
) |
|
$ |
(69,604 |
) |
|
$ |
(2,002 |
) |
|
Net income (loss) available to common shares from discontinued operations |
|
|
49,686 |
|
|
|
3,628 |
|
|
|
59,784 |
|
|
|
9,160 |
|
|
Net income (loss) available to common shares |
|
$ |
15,608 |
|
|
$ |
1,831 |
|
|
$ |
(9,820 |
) |
|
$ |
7,158 |
|
|
|
|
|
|
|
|
|
|
|
|
|
|
|
|
|
|
|
|
EPS - Basic: |
|
|
|
|
|
|
|
|
|
|
|
|
|
|
|
|
|
Earnings (loss) per share from continuing operations |
|
$ |
(0.37 |
) |
|
$ |
(0.02 |
) |
|
$ |
(0.77 |
) |
|
$ |
(0.03 |
) |
|
Earnings (loss) per share from discontinued operations |
|
|
0.54 |
|
|
|
0.04 |
|
|
|
0.66 |
|
|
|
0.11 |
|
|
Earnings Per Share - Basic |
|
$ |
0.17 |
|
|
$ |
0.02 |
|
|
$ |
(0.11 |
) |
|
$ |
0.08 |
|
|
|
|
|
|
|
|
|
|
|
|
|
|
|
|
|
|
|
|
EPS - Diluted: |
|
|
|
|
|
|
|
|
|
|
|
|
|
|
|
|
|
Earnings (loss) per share from continuing operations |
|
$ |
(0.37 |
) |
|
$ |
(0.02 |
) |
|
$ |
(0.77 |
) |
|
$ |
(0.03 |
) |
|
Earnings (loss) per share from discontinued operations |
|
|
0.54 |
|
|
|
0.04 |
|
|
|
0.66 |
|
|
|
0.11 |
|
|
Earnings Per Share - Diluted |
|
$ |
0.17 |
|
|
$ |
0.02 |
|
|
$ |
(0.11 |
) |
|
$ |
0.08 |
|
|
Weighted-average shares outstanding - Basic |
|
|
91,203,955 |
|
|
|
90,642,318 |
|
|
|
91,153,861 |
|
|
|
85,524,073 |
|
|
Weighted-average shares outstanding - Diluted |
|
|
91,971,817 |
|
|
|
90,842,752 |
|
|
|
91,153,861 |
|
|
|
86,457,871 |
|
|
|
|
|
|
|
|
|
|
|
|
|
|
|
|
|
|
|
|
FUNDS FROM OPERATIONS (FFO): |
|
|
|
|
|
|
|
|
|
|
|
|
|
|
|
|
|
Net Income (loss) available to common shares |
|
$ |
15,608 |
|
|
$ |
1,831 |
|
|
$ |
(9,820 |
) |
|
$ |
7,158 |
|
|
Add-Back (Deduct): |
|
|
|
|
|
|
|
|
|
|
|
|
|
|
|
|
|
Depreciation |
|
|
7,031 |
|
|
|
8,809 |
|
|
|
35,570 |
|
|
|
36,951 |
|
|
(Gains) Losses on the sale of real estate |
|
|
(29,461 |
) |
|
|
(12,391 |
) |
|
|
(53,272 |
) |
|
|
(37,102 |
) |
|
Asset impairment |
|
|
11,127 |
|
|
|
929 |
|
|
|
37,785 |
|
|
|
8,179 |
|
|
Adjustments related to discontinued operations |
|
|
65 |
|
|
|
(5,200 |
) |
|
|
(1,747 |
) |
|
|
(2,267 |
) |
|
FFO |
|
$ |
4,370 |
|
|
$ |
(6,022 |
) |
|
$ |
8,516 |
|
|
$ |
12,919 |
|
|
FFO per share--basic |
|
$ |
0.05 |
|
|
$ |
(0.07 |
) |
|
$ |
0.09 |
|
|
$ |
0.15 |
|
|
Weighted-average shares outstanding |
|
|
91,203,955 |
|
|
|
90,642,318 |
|
|
|
91,153,861 |
|
|
|
85,524,073 |
|
|
|
|
|
|
|
|
|
|
|
|
|
|
|
|
|
|
|
|
CASH AVAILABLE FOR DISTRIBUTION (CAD): |
|
|
|
|
|
|
|
|
|
|
|
|
|
|
|
|
|
Net Income (loss) available to common shares |
|
$ |
15,608 |
|
|
$ |
1,831 |
|
|
$ |
(9,820 |
) |
|
$ |
7,158 |
|
|
Add-Back (Deduct): |
|
|
|
|
|
|
|
|
|
|
|
|
|
|
|
|
|
Depreciation and amortization expense |
|
|
12,031 |
|
|
|
10,883 |
|
|
|
51,304 |
|
|
|
45,505 |
|
|
Change in fair value of financial instruments |
|
|
(1,109 |
) |
|
|
1,828 |
|
|
|
5,946 |
|
|
|
(11,638 |
) |
|
(Gains) losses on assets |
|
|
(29,461 |
) |
|
|
(12,682 |
) |
|
|
(53,272 |
) |
|
|
(37,393 |
) |
|
(Gains) losses on debt extinguishment |
|
|
(333 |
) |
|
|
— |
|
|
|
(1,331 |
) |
|
|
— |
|
|
Deferred income tax (benefit) provision |
|
|
20,303 |
|
|
|
1,633 |
|
|
|
2,213 |
|
|
|
2,484 |
|
|
Straight-line rental adjustments |
|
|
(187 |
) |
|
|
148 |
|
|
|
(1,369 |
) |
|
|
95 |
|
|
Equity based compensation |
|
|
555 |
|
|
|
715 |
|
|
|
3,396 |
|
|
|
3,970 |
|
|
Acquisition and integration expenses |
|
|
248 |
|
|
|
940 |
|
|
|
624 |
|
|
|
2,332 |
|
|
Origination fees and other deferred items |
|
|
12,686 |
|
|
|
8,252 |
|
|
|
34,063 |
|
|
|
32,093 |
|
|
Provision for losses |
|
|
3,848 |
|
|
|
2,450 |
|
|
|
8,050 |
|
|
|
8,300 |
|
|
IRT internalization and management transition expenses |
|
|
6,271 |
|
|
|
— |
|
|
|
6,271 |
|
|
|
— |
|
|
Asset impairment |
|
|
11,127 |
|
|
|
929 |
|
|
|
37,785 |
|
|
|
8,179 |
|
|
Discontinued operations and noncontrolling interest effect of certain adjustments |
|
|
(45,034 |
) |
|
|
149 |
|
|
|
(43,272 |
) |
|
|
5,061 |
|
|
CAD |
|
$ |
6,553 |
|
|
$ |
17,076 |
|
|
$ |
40,588 |
|
|
$ |
66,146 |
|
|
CAD per share |
|
$ |
0.07 |
|
|
$ |
0.19 |
|
|
$ |
0.45 |
|
|
$ |
0.77 |
|
|
Weighted-average shares outstanding |
|
|
91,203,955 |
|
|
|
90,642,318 |
|
|
|
91,153,861 |
|
|
|
85,524,073 |
|
12
STATEMENT OF OPERATIONS, FFO & CAD
CONSOLIDATED – by quarter
|
($'s in 000's, except per share amounts) |
|
For the Three Months Ended |
|
|||||||||||||||||
|
|
|
December 31, 2016 |
|
|
September 30, 2016 |
|
|
June 30, 2016 |
|
|
March 31, 2016 |
|
|
December 31, 2015 |
|
|||||
|
Revenue: |
|
|
|
|
|
|
|
|
|
|
|
|
|
|
|
|
|
|
|
|
|
Net interest margin |
|
|
|
|
|
|
|
|
|
|
|
|
|
|
|
|
|
|
|
|
|
Investment interest income |
|
$ |
19,693 |
|
|
$ |
20,189 |
|
|
$ |
23,519 |
|
|
$ |
25,802 |
|
|
$ |
26,609 |
|
|
Investment interest expense |
|
|
(8,849 |
) |
|
|
(8,512 |
) |
|
|
(9,125 |
) |
|
|
(9,320 |
) |
|
|
(6,733 |
) |
|
Net interest margin |
|
|
10,844 |
|
|
|
11,677 |
|
|
|
14,394 |
|
|
|
16,482 |
|
|
|
19,876 |
|
|
Property income |
|
|
23,501 |
|
|
|
29,614 |
|
|
|
29,666 |
|
|
|
30,055 |
|
|
|
29,756 |
|
|
Fee and other income |
|
|
1,400 |
|
|
|
1,946 |
|
|
|
1,914 |
|
|
|
2,114 |
|
|
|
3,515 |
|
|
Total revenue |
|
|
35,745 |
|
|
|
43,237 |
|
|
|
45,974 |
|
|
|
48,651 |
|
|
|
53,147 |
|
|
Expenses: |
|
|
|
|
|
|
|
|
|
|
|
|
|
|
|
|
|
|
|
|
|
Interest expense |
|
|
11,914 |
|
|
|
13,298 |
|
|
|
13,967 |
|
|
|
15,870 |
|
|
|
15,491 |
|
|
Real estate operating expenses |
|
|
13,084 |
|
|
|
14,635 |
|
|
|
14,327 |
|
|
|
14,848 |
|
|
|
14,922 |
|
|
Property management expenses |
|
|
2,240 |
|
|
|
2,226 |
|
|
|
2,846 |
|
|
|
2,167 |
|
|
|
2,220 |
|
|
General and administrative expenses: |
|
|
|
|
|
|
|
|
|
|
|
|
|
|
|
|
|
|
|
|
|
Compensation expenses |
|
|
6,275 |
|
|
|
4,675 |
|
|
|
3,862 |
|
|
|
3,625 |
|
|
|
4,854 |
|
|
Other general and administrative expenses |
|
|
3,300 |
|
|
|
3,052 |
|
|
|
3,706 |
|
|
|
3,215 |
|
|
|
3,895 |
|
|
Total general and administrative expenses |
|
|
9,575 |
|
|
|
7,727 |
|
|
|
7,568 |
|
|
|
6,840 |
|
|
|
8,749 |
|
|
Acquisition and integration expenses |
|
|
248 |
|
|
|
197 |
|
|
|
70 |
|
|
|
109 |
|
|
|
940 |
|
|
Provision for loan losses |
|
|
3,848 |
|
|
|
1,533 |
|
|
|
1,344 |
|
|
|
1,325 |
|
|
|
2,450 |
|
|
Depreciation and amortization expense |
|
|
12,031 |
|
|
|
11,466 |
|
|
|
15,134 |
|
|
|
12,673 |
|
|
|
10,883 |
|
|
IRT internalization and management transition expenses |
|
|
6,271 |
|
|
|
- |
|
|
|
- |
|
|
|
- |
|
|
|
- |
|
|
Total expenses |
|
|
59,211 |
|
|
|
51,082 |
|
|
|
55,256 |
|
|
|
53,832 |
|
|
|
55,655 |
|
|
Operating Income |
|
|
(23,466 |
) |
|
|
(7,845 |
) |
|
|
(9,282 |
) |
|
|
(5,181 |
) |
|
|
(2,508 |
) |
|
Other income (expense) |
|
|
(457 |
) |
|
|
(70 |
) |
|
|
39 |
|
|
|
61 |
|
|
|
(48 |
) |
|
Gains (losses) on assets |
|
|
29,461 |
|
|
|
18,194 |
|
|
|
5,812 |
|
|
|
(195 |
) |
|
|
12,682 |
|
|
Asset impairment |
|
|
(11,127 |
) |
|
|
(18,872 |
) |
|
|
(3,864 |
) |
|
|
(3,922 |
) |
|
|
(929 |
) |
|
Gains (losses) on debt extinguishment |
|
|
333 |
|
|
|
(6 |
) |
|
|
660 |
|
|
|
344 |
|
|
|
— |
|
|
Change in fair value of financial instruments |
|
|
1,109 |
|
|
|
(1,375 |
) |
|
|
(1,592 |
) |
|
|
(4,088 |
) |
|
|
(1,828 |
) |
|
Income (loss) before taxes |
|
|
(4,147 |
) |
|
|
(9,974 |
) |
|
|
(8,227 |
) |
|
|
(12,981 |
) |
|
|
7,369 |
|
|
Income tax benefit (provision) |
|
|
(20,601 |
) |
|
|
15,302 |
|
|
|
1,756 |
|
|
|
993 |
|
|
|
(1,478 |
) |
|
Income (loss) from continuing operations |
|
|
(24,748 |
) |
|
|
5,328 |
|
|
|
(6,471 |
) |
|
|
(11,988 |
) |
|
|
5,891 |
|
|
Discontinued operations: |
|
|
|
|
|
|
|
|
|
|
|
|
|
|
|
|
|
|
|
|
|
Income (loss) from discontinued operations |
|
|
1,671 |
|
|
|
4,112 |
|
|
|
32,876 |
|
|
|
1,485 |
|
|
|
6,069 |
|
|
Gain (loss) on disposal of discontinued operations |
|
|
47,808 |
|
|
|
— |
|
|
|
— |
|
|
|
— |
|
|
|
— |
|
|
Net income (loss) |
|
|
24,731 |
|
|
|
9,440 |
|
|
|
26,405 |
|
|
|
(10,503 |
) |
|
|
11,960 |
|
|
Income allocated to preferred shares |
|
|
(9,310 |
) |
|
|
(8,715 |
) |
|
|
(8,615 |
) |
|
|
(8,520 |
) |
|
|
(8,447 |
) |
|
(Income) loss allocated to noncontrolling interests |
|
|
187 |
|
|
|
(729 |
) |
|
|
(25,370 |
) |
|
|
1,179 |
|
|
|
(1,682 |
) |
|
Net income (loss) available to common shares |
|
$ |
15,608 |
|
|
$ |
(4 |
) |
|
$ |
(7,580 |
) |
|
$ |
(17,844 |
) |
|
$ |
1,831 |
|
|
|
|
|
|
|
|
|
|
|
|
|
|
|
|
|
|
|
|
|
|
|
|
Amount attributable to common shares: |
|
|
|
|
|
|
|
|
|
|
|
|
|
|
|
|
|
|
|
|
|
Net income (loss) available to common shares from continuing operations |
|
$ |
(34,078 |
) |
|
$ |
(2,048 |
) |
|
$ |
(14,115 |
) |
|
$ |
(19,363 |
) |
|
$ |
(1,797 |
) |
|
Net income (loss) available to common shares from discontinued operations |
|
|
49,686 |
|
|
|
2,044 |
|
|
|
6,535 |
|
|
|
1,519 |
|
|
|
3,628 |
|
|
Net income (loss) available to common shares |
|
$ |
15,608 |
|
|
$ |
(4 |
) |
|
$ |
(7,580 |
) |
|
$ |
(17,844 |
) |
|
$ |
1,831 |
|
|
|
|
|
|
|
|
|
|
|
|
|
|
|
|
|
|
|
|
|
|
|
|
EPS - Basic: |
|
|
|
|
|
|
|
|
|
|
|
|
|
|
|
|
|
|
|
|
|
Earnings (loss) per share from continuing operations |
|
$ |
(0.37 |
) |
|
$ |
(0.02 |
) |
|
$ |
(0.15 |
) |
|
$ |
(0.22 |
) |
|
$ |
(0.02 |
) |
|
Earnings (loss) per share from discontinued operations |
|
|
0.54 |
|
|
|
0.02 |
|
|
|
0.07 |
|
|
|
0.02 |
|
|
|
0.04 |
|
|
Earnings Per Share - Basic |
|
$ |
0.17 |
|
|
$ |
- |
|
|
$ |
(0.08 |
) |
|
$ |
(0.20 |
) |
|
$ |
0.02 |
|
|
|
|
|
|
|
|
|
|
|
|
|
|
|
|
|
|
|
|
|
|
|
|
EPS - Diluted: |
|
|
|
|
|
|
|
|
|
|
|
|
|
|
|
|
|
|
|
|
|
Earnings (loss) per share from continuing operations |
|
$ |
(0.37 |
) |
|
$ |
(0.02 |
) |
|
$ |
(0.15 |
) |
|
$ |
(0.22 |
) |
|
$ |
(0.02 |
) |
|
Earnings (loss) per share from discontinued operations |
|
|
0.54 |
|
|
|
0.02 |
|
|
|
0.07 |
|
|
|
0.02 |
|
|
|
0.04 |
|
|
Earnings Per Share - Diluted |
|
$ |
0.17 |
|
|
$ |
- |
|
|
$ |
(0.08 |
) |
|
$ |
(0.20 |
) |
|
$ |
0.02 |
|
|
|
|
|
|
|
|
|
|
|
|
|
|
|
|
|
|
|
|
|
|
|
|
Weighted-average shares outstanding - Basic |
|
|
91,203,955 |
|
|
|
91,201,784 |
|
|
|
91,190,583 |
|
|
|
91,018,160 |
|
|
|
90,642,318 |
|
|
Weighted-average shares outstanding - Diluted |
|
|
91,971,817 |
|
|
|
91,201,784 |
|
|
|
91,190,583 |
|
|
|
91,018,160 |
|
|
|
90,842,752 |
|
|
|
|
|
|
|
|
|
|
|
|
|
|
|
|
|
|
|
|
|
|
|
|
Funds From Operations (FFO): |
|
|
|
|
|
|
|
|
|
|
|
|
|
|
|
|
|
|
|
|
|
Net Income (loss) available to common shares |
|
$ |
15,608 |
|
|
$ |
(4 |
) |
|
$ |
(7,580 |
) |
|
$ |
(17,844 |
) |
|
$ |
1,831 |
|
|
Add-Back (Deduct): |
|
|
|
|
|
|
|
|
|
|
|
|
|
|
|
|
|
|
|
|
|
Depreciation |
|
|
7,031 |
|
|
|
8,884 |
|
|
|
9,484 |
|
|
|
10,171 |
|
|
|
8,809 |
|
|
(Gains) Losses on the sale of real estate |
|
|
(29,461 |
) |
|
|
(18,194 |
) |
|
|
(5,812 |
) |
|
|
195 |
|
|
|
(12,391 |
) |
|
Asset impairment |
|
|
11,127 |
|
|
|
18,872 |
|
|
|
3,864 |
|
|
|
3,922 |
|
|
|
929 |
|
|
Adjustments related to discontinued operations |
|
|
65 |
|
|
|
1,195 |
|
|
|
(3,832 |
) |
|
|
825 |
|
|
|
(5,200 |
) |
|
FFO |
|
$ |
4,370 |
|
|
$ |
10,753 |
|
|
$ |
(3,876 |
) |
|
$ |
(2,731 |
) |
|
$ |
(6,022 |
) |
|
FFO per share |
|
$ |
0.05 |
|
|
$ |
0.12 |
|
|
$ |
(0.04 |
) |
|
$ |
(0.03 |
) |
|
$ |
(0.07 |
) |
|
Weighted average shares |
|
|
91,203,955 |
|
|
|
91,201,784 |
|
|
|
91,190,583 |
|
|
|
91,018,160 |
|
|
|
90,642,318 |
|
|
|
|
|
|
|
|
|
|
|
|
|
|
|
|
|
|
|
|
|
|
|
|
Cash Available for Distribution (CAD): |
|
|
|
|
|
|
|
|
|
|
|
|
|
|
|
|
|
|
|
|
|
Net Income (loss) available to common shares |
|
$ |
15,608 |
|
|
$ |
(4 |
) |
|
$ |
(7,580 |
) |
|
$ |
(17,844 |
) |
|
$ |
1,831 |
|
|
Add-Back (Deduct): |
|
|
|
|
|
|
|
|
|
|
|
|
|
|
|
|
|
|
|
|
|
Depreciation and amortization expense |
|
|
12,031 |
|
|
|
11,466 |
|
|
|
15,134 |
|
|
|
12,673 |
|
|
|
10,883 |
|
|
Change in fair value of financial instruments |
|
|
(1,109 |
) |
|
|
1,375 |
|
|
|
1,592 |
|
|
|
4,088 |
|
|
|
1,828 |
|
|
(Gains) losses on assets |
|
|
(29,461 |
) |
|
|
(18,194 |
) |
|
|
(5,812 |
) |
|
|
195 |
|
|
|
(12,682 |
) |
|
(Gains) losses on debt extinguishment |
|
|
(333 |
) |
|
|
6 |
|
|
|
(660 |
) |
|
|
(344 |
) |
|
|
— |
|
|
Deferred income tax (benefit) provision |
|
|
20,303 |
|
|
|
(15,249 |
) |
|
|
(1,733 |
) |
|
|
(1,108 |
) |
|
|
1,633 |
|
|
Straight-line rental adjustments |
|
|
(187 |
) |
|
|
(622 |
) |
|
|
(142 |
) |
|
|
(418 |
) |
|
|
148 |
|
|
Equity based compensation |
|
|
555 |
|
|
|
819 |
|
|
|
954 |
|
|
|
1,068 |
|
|
|
715 |
|
|
Acquisition and integration expenses |
|
|
248 |
|
|
|
197 |
|
|
|
70 |
|
|
|
109 |
|
|
|
940 |
|
|
Origination fees and other deferred items |
|
|
12,686 |
|
|
|
8,535 |
|
|
|
5,911 |
|
|
|
6,931 |
|
|
|
8,252 |
|
|
Provision for losses |
|
|
3,848 |
|
|
|
1,533 |
|
|
|
1,344 |
|
|
|
1,325 |
|
|
|
2,450 |
|
|
IRT internalization and management transition expenses |
|
|
6,271 |
|
|
|
— |
|
|
|
— |
|
|
|
— |
|
|
|
— |
|
|
Asset impairment |
|
|
11,127 |
|
|
|
18,872 |
|
|
|
3,864 |
|
|
|
3,922 |
|
|
|
929 |
|
|
Discontinued operations and noncontrolling interest effect of certain adjustments |
|
|
(45,034 |
) |
|
|
1,885 |
|
|
|
(2,405 |
) |
|
|
2,282 |
|
|
|
149 |
|
|
CAD |
|
$ |
6,553 |
|
|
$ |
10,619 |
|
|
$ |
10,537 |
|
|
$ |
12,879 |
|
|
$ |
17,076 |
|
|
CAD per share |
|
$ |
0.07 |
|
|
$ |
0.12 |
|
|
$ |
0.12 |
|
|
$ |
0.14 |
|
|
$ |
0.19 |
|
|
Weighted average shares |
|
|
91,203,955 |
|
|
|
91,201,784 |
|
|
|
91,190,583 |
|
|
|
91,018,160 |
|
|
|
90,642,318 |
|
13
TRAILING 5 QUARTERS
|
($'s in 000's) |
|
Three Months Ended |
|
|
|
|
Twelve Months Ended |
|
||||||||||||||||||||||
|
|
|
December 31, 2016 |
|
|
September 30, 2016 |
|
|
June 30, 2016 |
|
|
March 31, 2016 |
|
|
December 31, 2015 |
|
|
|
|
December 31, 2016 |
|
|
December 31, 2015 |
|
|||||||
|
|
|
|
|
|
|
|
|
|
|
|
|
|
|
|
|
|
|
|
|
|
|
|
|
|
|
|
|
|
|
|
|
CMBS income (a) |
|
$ |
20 |
|
|
$ |
305 |
|
|
$ |
(260 |
) |
|
$ |
171 |
|
|
$ |
1,135 |
|
|
|
|
$ |
236 |
|
|
$ |
7,246 |
|
|
Property management & leasing fees |
|
|
1,162 |
|
|
|
1,490 |
|
|
|
2,014 |
|
|
|
1,567 |
|
|
|
2,300 |
|
|
|
|
|
6,233 |
|
|
|
10,603 |
|
|
Property reimbursement income |
|
|
79 |
|
|
|
22 |
|
|
|
23 |
|
|
|
22 |
|
|
|
- |
|
|
|
|
|
146 |
|
|
|
- |
|
|
Other income |
|
|
139 |
|
|
|
129 |
|
|
|
137 |
|
|
|
354 |
|
|
|
80 |
|
|
|
|
|
759 |
|
|
|
426 |
|
|
Fee and other income, as reported |
|
|
1,400 |
|
|
|
1,946 |
|
|
|
1,914 |
|
|
|
2,114 |
|
|
|
3,515 |
|
|
|
|
|
7,374 |
|
|
|
18,275 |
|
|
Fee and other income, discontinued operations |
|
|
3,424 |
|
|
|
661 |
|
|
|
861 |
|
|
|
738 |
|
|
|
1,026 |
|
|
|
|
|
5,684 |
|
|
|
2,793 |
|
|
|
|
|
|
|
|
|
|
|
|
|
|
|
|
|
|
|
|
|
|
|
|
|
|
|
|
|
|
|
|
|
|
Add: Items eliminated in consolidation: |
|
|
|
|
|
|
|
|
|
|
|
|
|
|
|
|
|
|
|
|
|
|
|
|
|
|
|
|
|
|
|
IRT Property management fees (b) |
|
|
66 |
|
|
|
1,219 |
|
|
|
1,229 |
|
|
|
1,262 |
|
|
|
1,294 |
|
|
|
|
|
3,776 |
|
|
|
3,674 |
|
|
IRT advisory fees (b) |
|
|
93 |
|
|
|
1,933 |
|
|
|
1,862 |
|
|
|
1,696 |
|
|
|
1,882 |
|
|
|
|
|
5,584 |
|
|
|
5,613 |
|
|
Total fee and other income |
|
$ |
4,983 |
|
|
$ |
5,759 |
|
|
$ |
5,866 |
|
|
$ |
5,810 |
|
|
$ |
7,717 |
|
|
|
|
$ |
22,418 |
|
|
$ |
30,355 |
|
|
|
(a) |
During the second quarter of 2016, we sold $21.4 million of CMBS loans at a loss on sale. Including the net interest margin we earned on these loans since their origination, we had a net gain of $49, or 0.2 points. |
|
|
(b) |
Represent fees paid by IRT to RAIT affiliates for services rendered through the date IRT was consolidated by RAIT. IRT was deconsolidated on October 5, 2016. Fees earned from IRT from October 5, 2016 through December 31, 2016 are included in fee and other income, discontinued operations. Excludes property management fees from RAIT owned properties. |
14
RECONCILIATION OF NET INCOME TO ADJUSTED EBITDA AND COVERAGE RATIOS
|
($'s in 000's) |
|
Three Months Ended |
|
|
|
Twelve Months Ended |
|
||||||||||||||||||||||
|
|
|
December 31, 2016 |
|
|
September 30, 2016 |
|
|
June 30, 2016 |
|
|
March 31, 2016 |
|
|
December 31, 2015 |
|
|
|
December 31, 2016 |
|
|
December 31, 2015 |
|
|||||||
|
ADJUSTED EBITDA: |
|
|
|
|
|
|
|
|
|
|
|
|
|
|
|
|
|
|
|
|
|
|
|
|
|
|
|
|
|
|
Net income (loss) |
|
$ |
24,731 |
|
|
$ |
9,440 |
|
|
$ |
26,405 |
|
|
$ |
(10,503 |
) |
|
$ |
11,960 |
|
|
|
$ |
50,073 |
|
|
$ |
63,493 |
|
|
Add (deduct): |
|
|
|
|
|
|
|
|
|
|
|
|
|
|
|
|
|
|
|
|
|
|
|
|
|
|
|
|
|
|
Investment interest expense |
|
|
8,849 |
|
|
|
8,512 |
|
|
|
9,125 |
|
|
|
9,320 |
|
|
|
6,733 |
|
|
|
|
35,806 |
|
|
|
29,250 |
|
|
Interest expense |
|
|
11,914 |
|
|
|
13,298 |
|
|
|
13,967 |
|
|
|
15,870 |
|
|
|
15,491 |
|
|
|
|
55,049 |
|
|
|
61,750 |
|
|
Acquisition and integration expenses |
|
|
248 |
|
|
|
197 |
|
|
|
70 |
|
|
|
109 |
|
|
|
940 |
|
|
|
|
624 |
|
|
|
2,332 |
|
|
Depreciation and amortization |
|
|
12,031 |
|
|
|
11,466 |
|
|
|
15,134 |
|
|
|
12,673 |
|
|
|
10,883 |
|
|
|
|
51,304 |
|
|
|
45,505 |
|
|
Provision for loan losses |
|
|
3,848 |
|
|
|
1,533 |
|
|
|
1,344 |
|
|
|
1,325 |
|
|
|
2,450 |
|
|
|
|
8,050 |
|
|
|
8,300 |
|
|
IRT internalization and management transition expenses |
|
|
6,271 |
|
|
|
- |
|
|
|
- |
|
|
|
- |
|
|
|
- |
|
|
|
|
6,271 |
|
|
|
- |
|
|
(Gains) losses on assets |
|
|
(29,461 |
) |
|
|
(18,194 |
) |
|
|
(5,812 |
) |
|
|
195 |
|
|
|
(12,682 |
) |
|
|
|
(53,272 |
) |
|
|
(37,393 |
) |
|
Asset impairment |
|
|
11,127 |
|
|
|
18,872 |
|
|
|
3,864 |
|
|
|
3,922 |
|
|
|
929 |
|
|
|
|
37,785 |
|
|
|
8,179 |
|
|
(Gain) loss on debt extinguishment |
|
|
(333 |
) |
|
|
6 |
|
|
|
(660 |
) |
|
|
(344 |
) |
|
|
- |
|
|
|
|
(1,331 |
) |
|
|
- |
|
|
Change in fair value of financial instruments |
|
|
(1,109 |
) |
|
|
1,375 |
|
|
|
1,592 |
|
|
|
4,088 |
|
|
|
1,828 |
|
|
|
|
5,946 |
|
|
|
(11,638 |
) |
|
Income tax (benefit) provision |
|
|
20,601 |
|
|
|
(15,302 |
) |
|
|
(1,756 |
) |
|
|
(993 |
) |
|
|
1,478 |
|
|
|
|
2,550 |
|
|
|
2,798 |
|
|
Additions (deductions) from discontinued operations |
|
|
(44,794 |
) |
|
|
15,983 |
|
|
|
(12,650 |
) |
|
|
18,781 |
|
|
|
15,138 |
|
|
|
|
(22,680 |
) |
|
|
20,693 |
|
|
Adjusted EBITDA |
|
$ |
23,923 |
|
|
$ |
47,186 |
|
|
$ |
50,623 |
|
|
$ |
54,443 |
|
|
$ |
55,148 |
|
|
|
$ |
176,175 |
|
|
$ |
193,269 |
|
|
|
|
|
|
|
|
|
|
|
|
|
|
|
|
|
|
|
|
|
|
|
|
|
|
|
|
|
|
|
|
|
INTEREST COST: |
|
|
|
|
|
|
|
|
|
|
|
|
|
|
|
|
|
|
|
|
|
|
|
|
|
|
|
|
|
|
Investment interest expense |
|
$ |
8,849 |
|
|
$ |
8,512 |
|
|
$ |
9,125 |
|
|
$ |
9,320 |
|
|
$ |
6,733 |
|
|
|
$ |
35,806 |
|
|
$ |
22,517 |
|
|
Interest expense |
|
|
11,914 |
|
|
|
13,298 |
|
|
|
13,967 |
|
|
|
15,870 |
|
|
|
15,491 |
|
|
|
|
55,049 |
|
|
|
46,259 |
|
|
Interest expense - IRT |
|
|
482 |
|
|
|
8,820 |
|
|
|
8,923 |
|
|
|
9,712 |
|
|
|
9,917 |
|
|
|
|
27,937 |
|
|
|
22,588 |
|
|
Total Interest Expense |
|
|
21,245 |
|
|
|
30,630 |
|
|
|
32,015 |
|
|
|
34,902 |
|
|
|
32,141 |
|
|
|
|
118,792 |
|
|
|
91,364 |
|
|
Less: Amortization of deferred financing costs and debt discounts |
|
|
(4,181 |
) |
|
|
(5,131 |
) |
|
|
(4,995 |
) |
|
|
(6,076 |
) |
|
|
(4,840 |
) |
|
|
|
(20,383 |
) |
|
|
(13,103 |
) |
|
Interest Cost |
|
$ |
17,064 |
|
|
$ |
25,499 |
|
|
$ |
27,020 |
|
|
$ |
28,826 |
|
|
$ |
27,301 |
|
|
|
$ |
98,409 |
|
|
$ |
78,261 |
|
|
|
|
|
|
|
|
|
|
|
|
|
|
|
|
|
|
|
|
|
|
|
|
|
|
|
|
|
|
|
|
|
PREFERRED COST: |
|
|
|
|
|
|
|
|
|
|
|
|
|
|
|
|
|
|
|
|
|
|
|
|
|
|
|
|
|
|
Net income allocated to preferred shares |
|
$ |
9,310 |
|
|
$ |
8,715 |
|
|
$ |
8,615 |
|
|
$ |
8,520 |
|
|
$ |
8,447 |
|
|
|
$ |
35,160 |
|
|
$ |
24,383 |
|
|
Less: preferred share discount amortization |
|
|
(2,453 |
) |
|
|
(1,867 |
) |
|
|
(1,776 |
) |
|
|
(1,690 |
) |
|
|
(1,608 |
) |
|
|
|
(7,786 |
) |
|
|
(6,537 |
) |
|
Preferred cost |
|
$ |
6,857 |
|
|
$ |
6,848 |
|
|
$ |
6,839 |
|
|
$ |
6,830 |
|
|
$ |
6,839 |
|
|
|
$ |
27,374 |
|
|
$ |
17,846 |
|
|
|
|
|
|
|
|
|
|
|
|
|
|
|
|
|
|
|
|
|
|
|
|
|
|
|
|
|
|
|
|
|
INTEREST COVERAGE: |
|
|
1.40 |
x |
|
|
1.85 |
x |
|
|
1.87 |
x |
|
|
1.89 |
x |
|
|
2.02 |
x |
|
|
|
1.79 |
x |
|
|
2.47 |
x |
|
INTEREST + PREFERRED COVERAGE: |
|
|
1.00 |
x |
|
|
1.46 |
x |
|
|
1.50 |
x |
|
|
1.53 |
x |
|
|
1.62 |
x |
|
|
|
1.40 |
x |
|
|
2.01 |
x |
15
Loan Portfolio Data, As of December 31, 2016
($’s in 000’s)
|
Loan Type |
|
Unpaid Principal Balance |
|
|
Weighted Average Coupon |
|
|
Remaining Life, Years (weighted average) |
|
|
# of Loans |
|
|
|
|
|
|
|||||||||||||||
|
Bridge loans |
|
$ |
1,142,052 |
|
|
|
5.8 |
% |
|
|
1.5 |
|
|
|
92 |
|
|
|
|
|
||||||||||||
|
Conduit loans |
|
|
20,181 |
|
|
|
4.8 |
% |
|
|
8.7 |
|
|
|
2 |
|
|
|
|
|
||||||||||||
|
Mezzanine loans |
|
|
89,811 |
|
|
|
9.9 |
% |
|
|
3.2 |
|
|
|
23 |
|
|
|
|
|
||||||||||||
|
Preferred equity investments |
|
|
42,830 |
|
|
|
8.2 |
% |
|
|
8.7 |
|
|
|
17 |
|
|
|
|
|
||||||||||||
|
Total |
|
|
1,294,874 |
|
|
|
6.1 |
% |
|
|
3.0 |
|
|
|
134 |
|
|
|
|
|
||||||||||||
|
Unamortized discounts, fees and costs |
|
|
(2,235 |
) |
|
|
|
|
|
|
|
|
|
|
|
|
|
|
|
|
||||||||||||
|
Aggregate carrying amount |
|
$ |
1,292,639 |
|
|
|
|
|
|
|
|
|
|
|
|
|
|
|
|
|
|
|
|
|
|
|
|
|
|
|
|
|
|
|
|
|
|
|
|
|
|
|
|
|
|
|
|
|
|
|
|
|
|
|
|
|
|
|
|
|
|
|
|
|
|
|
|
|
|
|
|
|
|
|
|
|
|
|
|
|
|
|
|
|
|
|
|
|
|
|
|
|
|
|
|
|
|
|
|
|
|
Loan Portfolio Data Trends |
|
|
|
|
|
|
|
|
|
|
|
|
|
|
|
|
|
|
|
|
|
|
|
|
|
|
|
|
|
|
|
|
|
($'s on 000's) |
|
|
|
|
|
|
|
|
|
|
|
|
|
|
|
|
|
|
|
|
|
|
|
|
|
|
|
|
|
|
|
|
|
|
|
For the Three Months Ended |
|
|
|
|
For the Twelve Months Ended |
|
|
|
||||||||||||||||||||||
|
|
|
December 31, 2016 |
|
|
September 30, 2016 |
|
|
June 30, 2016 |
|
|
March 31, 2016 |
|
|
December 31, 2015 |
|
|
|
|
December 31, 2016 |
|
|
December 31, 2015 |
|
|
|
|||||||
|
Bridge First Mortgage loans: |
|
|
|
|
|
|
|
|
|
|
|
|
|
|
|
|
|
|
|
|
|
|
|
|
|
|
|
|
|
|
|
|
|
Origination volume |
|
$ |
67,540 |
|
|
$ |
25,550 |
|
|
$ |
18,185 |
|
|
$ |
31,675 |
|
|
$ |
249,937 |
|
|
|
|
$ |
142,950 |
|
|
$ |
607,840 |
|
|
|
|
# of loans originated |
|
|
6 |
|
|
|
2 |
|
|
|
2 |
|
|
|
4 |
|
|
|
16 |
|
|
|
|
|
14 |
|
|
|
52 |
|
|
|
|
Loan payoffs |
|
$ |
106,523 |
|
|
$ |
99,601 |
|
|
$ |
109,285 |
|
|
$ |
44,062 |
|
|
$ |
98,474 |
|
|
|
|
$ |
359,471 |
|
|
$ |
200,030 |
|
|
|
|
Unpaid principal balance (period end) |
|
$ |
1,142,052 |
|
|
$ |
1,187,277 |
|
|
$ |
1,273,846 |
|
|
$ |
1,363,132 |
|
|
$ |
1,378,089 |
|
|
|
|
$ |
1,142,052 |
|
|
$ |
1,378,089 |
|
|
|
|
Weighted average coupon (period end) |
|
|
5.8 |
% |
|
|
5.7 |
% |
|
|
5.7 |
% |
|
|
5.6 |
% |
|
|
5.6 |
% |
|
|
|
|
5.8 |
% |
|
|
5.6 |
% |
|
|
|
|
|
|
|
|
|
|
|
|
|
|
|
|
|
|
|
|
|
|
|
|
|
|
|
|
|
|
|
|
|
|
|
|
|
Conduit First Mortgage loans (for sale): |
|
|
|
|
|
|
|
|
|
|
|
|
|
|
|
|
|
|
|
|
|
|
|
|
|
|
|
|
|
|
|
|
|
Origination volume |
|
$ |
- |
|
|
$ |
- |
|
|
$ |
5,000 |
|
|
$ |
8,800 |
|
|
$ |
71,900 |
|
|
|
|
$ |
13,800 |
|
|
$ |
384,054 |
|
|
|
|
# of loans originated |
|
|
- |
|
|
|
- |
|
|
|
1 |
|
|
|
1 |
|
|
|
12 |
|
|
|
|
|
2 |
|
|
|
42 |
|
|
|
|
Loans sold to securitization |
|
$ |
- |
|
|
$ |
13,800 |
|
|
$ |
21,377 |
|
|
$ |
- |
|
|
$ |
85,340 |
|
|
|
|
$ |
35,177 |
|
|
$ |
424,979 |
|
|
|
|
CMBS income (a) |
|
|
20 |
|
|
|
305 |
|
|
|
(260 |
) |
|
|
171 |
|
|
|
1,135 |
|
|
|
|
|
236 |
|
|
|
7,246 |
|
|
|
|
Securitization profit % (a) |
|
|
- |
|
|
|
2.2 |
% |
|
|
-1.2 |
% |
|
|
- |
|
|
|
1.3 |
% |
|
|
|
|
0.2 |
% |
|
|
1.7 |
% |
|
|
|
Unpaid principal balance (period end) |
|
$ |
20,181 |
|
|
$ |
41,455 |
|
|
$ |
41,455 |
|
|
$ |
57,928 |
|
|
$ |
49,239 |
|
|
|
|
$ |
20,181 |
|
|
$ |
49,239 |
|
|
|
|
Weighted average coupon (period end) |
|
|
4.8 |
% |
|
|
4.8 |
% |
|
|
4.8 |
% |
|
|
4.9 |
% |
|
|
4.8 |
% |
|
|
|
|
4.8 |
% |
|
|
4.8 |
% |
|
|
|
|
|
|
|
|
|
|
|
|
|
|
|
|
|
|
|
|
|
|
|
|
|
|
|
|
|
|
|
|
|
|
|
|
|
Mezzanine and Preferred Equity Investments: |
|
|
|
|
|
|
|
|
|
|
|
|
|
|
|
|
|
|
|
|
|
|
|
|
|
|
|
|
|
|||
|
Origination volume |
|
$ |
— |
|
|
$ |
— |
|
|
$ |
— |
|
|
$ |
— |
|
|
$ |
— |
|
|
|
|
$ |
— |
|
|
$ |
5,000 |
|
|
|
|
Loan payoffs |
|
$ |
2,960 |
|
|
$ |
33,635 |
|
|
$ |
10,678 |
|
|
$ |
10,991 |
|
|
$ |
23,143 |
|
|
|
|
$ |
58,264 |
|
|
$ |
91,198 |
|
|
|
|
Unpaid principal balance (period end) |
|
|
132,641 |
|
|
|
146,883 |
|
|
|
181,520 |
|
|
|
193,652 |
|
|
|
199,793 |
|
|
|
|
|
132,641 |
|
|
|
199,793 |
|
|
|
|
Weighted average coupon (period end) |
|
|
9.4 |
% |
|
|
8.8 |
% |
|
|
8.9 |
% |
|
|
9.4 |
% |
|
|
9.5 |
% |
|
|
|
|
9.4 |
% |
|
|
9.5 |
% |
|
|
|
|
|
|
|
|
|
|
|
|
|
|
|
|
|
|
|
|
|
|
|
|
|
|
|
|
|
|
|
|
|
|
|
|
|
Non-accrual loans (period end): |
|
|
|
|
|
|
|
|
|
|
|
|
|
|
|
|
|
|
|
|
|
|
|
|
|
|
|
|
|
|
|
|
|
Bridge loans |
|
$ |
113,509 |
|
|
$ |
92,035 |
|
|
$ |
17,235 |
|
|
$ |
15,645 |
|
|
$ |
15,645 |
|
|
|
|
$ |
113,509 |
|
|
$ |
15,645 |
|
|
|
|
Mezzanine and preferred equity |
|
|
7,529 |
|
|
|
17,433 |
|
|
|
18,467 |
|
|
|
20,044 |
|
|
|
20,292 |
|
|
|
|
|
7,529 |
|
|
|
20,292 |
|
|
|
|
Total non-accrual loans |
|
$ |
121,038 |
|
|
$ |
109,468 |
|
|
$ |
35,702 |
|
|
$ |
35,689 |
|
|
$ |
35,937 |
|
|
|
|
$ |
121,038 |
|
|
$ |
35,937 |
|
|
|
|
|
|
|
|
|
|
|
|
|
|
|
|
|
|
|
|
|
|
|
|
|
|
|
|
|
|
|
|
|
|
|
|
|
|
Credit status (period end): |
|
|
|
|
|
|
|
|
|
|
|
|
|
|
|
|
|
|
|
|
|
|
|
|
|
|
|
|
|
|
|
|
|
Satisfactory |
|
$ |
1,142,467 |
|
|
$ |
1,247,647 |
|
|
$ |
1,367,819 |
|
|
$ |
1,482,723 |
|
|
$ |
1,494,884 |
|
|
|
|
$ |
1,142,467 |
|
|
$ |
1,494,884 |
|
|
|
|
Watchlist -- expecting full recovery |
|
|
32,748 |
|
|
|
18,500 |
|
|
|
74,800 |
|
|
|
77,800 |
|
|
|
77,800 |
|
|
|
|
|
32,748 |
|
|
|
77,800 |
|
|
|
|
Watchlist -- with reserves |
|
|
119,659 |
|
|
|
109,468 |
|
|
|
54,202 |
|
|
|
54,189 |
|
|
|
54,437 |
|
|
|
|
|
119,659 |
|
|
|
54,437 |
|
|
|
|
Total |
|
$ |
1,294,874 |
|
|
$ |
1,375,615 |
|
|
$ |
1,496,821 |
|
|
$ |
1,614,712 |
|
|
$ |
1,627,121 |
|
|
|
|
$ |
1,294,874 |
|
|
$ |
1,627,121 |
|
|
|
|
|
|
|
|
|
|
|
|
|
|
|
|
|
|
|
|
|
|
|
|
|
|
|
|
|
|
|
|
|
|
|
|
|
|
Loan loss reserves: |
|
|
|
|
|
|
|
|
|
|
|
|
|
|
|
|
|
|
|
|
|
|
|
|
|
|
|
|
|
|
|
|
|
Beginning balance |
|
$ |
18,655 |
|
|
$ |
18,237 |
|
|
$ |
18,165 |
|
|
$ |
17,097 |
|
|
$ |
14,647 |
|
|
|
|
$ |
17,097 |
|
|
$ |
9,218 |
|
|
|
|
Provision |
|
|
3,848 |
|
|
|
1,533 |
|
|
|
1,344 |
|
|
|
1,325 |
|
|
|
2,450 |
|
|
|
|
|
8,050 |
|
|
|
8,300 |
|
|
|
|
Charge-offs, net of recoveries |
|
|
(10,149 |
) |
|
|
(1,115 |
) |
|
|
(1,272 |
) |
|
|
(257 |
) |
|
|
— |
|
|
|
|
|
(12,793 |
) |
|
|
(421 |
) |
|
|
|
Ending balance |
|
$ |
12,354 |
|
|
$ |
18,655 |
|
|
$ |
18,237 |
|
|
$ |
18,165 |
|
|
$ |
17,097 |
|
|
|
|
$ |
12,354 |
|
|
$ |
17,097 |
|
|
|
|
|
|
|
|
|
|
|
|
|
|
|
|
|
|
|
|
|
|
|
|
|
|
|
|
|
|
|
|
|
|
|
|
|
|
Statistics as a % of Total Loans (period end): |
|
|
|
|
|
|
|
|
|
|
|
|
|
|
|
|
|
|
|
|
|
|
|
|
|
|
|
|
|
|||
|
Non-accrual loans |
|
|
9.3 |
% |
|
|
8.0 |
% |
|
|
2.4 |
% |
|
|
2.2 |
% |
|
|
2.2 |
% |
|
|
|
|
9.3 |
% |
|
|
2.2 |
% |
|
|
|
Watchlist -- expecting full recovery |
|
|
2.5 |
% |
|
|
1.3 |
% |
|
|
5.0 |
% |
|
|
4.8 |
% |
|
|
4.8 |
% |
|
|
|
|
2.5 |
% |
|
|
4.8 |
% |
|
|
|
Watchlist -- with reserves |
|
|
9.0 |
% |
|
|
8.0 |
% |
|
|
3.6 |
% |
|
|
3.4 |
% |
|
|
3.3 |
% |
|
|
|
|
9.2 |
% |
|
|
3.3 |
% |
|
|
|
Loan loss reserves |
|
|
1.0 |
% |
|
|
1.4 |
% |
|
|
1.2 |
% |
|
|
1.1 |
% |
|
|
1.1 |
% |
|
|
|
|
1.0 |
% |
|
|
1.1 |
% |
|
|
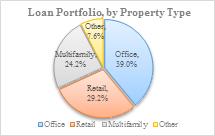
|
(a) |
During the second quarter of 2016, we sold $21.4 million of CMBS loans at a loss on sale. Including the net interest margin we earned on these loans since their origination, we had a net gain of $49, or 0.2 points. |
16
|
Real Estate Portfolio Summary, as of December 31, 2016 |
|
|
|
|
|
|
|
|
|
|
|
|
|
|
|
|
|
|
|
|
|
|
|
|||||||
|
($'s in 000's) |
|
|
|
|
|
|
|
|
|
|
|
|
|
|
|
|
|
|
|
|
|
|
|
|
|
|
|
|
|
|
|
Property Type |
|
Gross Cost |
|
|
# of Properties |
|
|
Units / Square Feet / Acres |
|
|
Weighted Average Occupancy |
|
|
Weighted Average Rental Rate |
|
|
|
|
|
|
|
|
|
|
|
|||||
|
RAIT: |
|
|
|
|
|
|
|
|
|
|
|
|
|
|
|
|
|
|
|
|
|
|
|
|
|
|
|
|
|
|
|
Multifamily |
|
$ |
147,201 |
|
|
|
6 |
|
|
|
1,703 |
|
|
|
93.0 |
% |
|
$ |
828 |
|
|
per unit, per month |
|
|||||||
|
Office |
|
|
328,029 |
|
|
|
14 |
|
|
|
2,253,564 |
|
|
|
78.7 |
% |
|
$ |
19.42 |
|
|
per square foot, per year |
|
|||||||
|
Retail |
|
|
152,629 |
|
|
|
6 |
|
|
|
1,493,073 |
|
|
|
75.9 |
% |
|
$ |
13.70 |
|
|
per square foot, per year |
|
|||||||
|
Industrial |
|
|
93,423 |
|
|
|
12 |
|
|
|
1,840,277 |
|
|
|
69.6 |
% |
|
$ |
3.00 |
|
|
per square foot, per year |
|
|||||||
|
Redevelopment |
|
|
81,130 |
|
|
|
2 |
|
|
|
1,206,514 |
|
|
|
|
|
|
|
|
|
|
|
|
|
|
|
|
|
|
|
|
Land |
|
|
52,234 |
|
|
|
7 |
|
|
|
13.7 |
|
|
|
|
|
|
|
|
|
|
|
|
|
|
|
|
|
|
|
|
Total RAIT Owned |
|
|
854,646 |
|
|
|
47 |
|
|
|
|
|
|
|
|
|
|
|
|
|
|
|
|
|
|
|
|
|
|
|
|
Accumulated depreciation |
|
|
(138,214 |
) |
|
|
|
|
|
|
|
|
|
|
|
|
|
|
|
|
|
|
|
|
|
|
|
|
|
|
|
Carrying Amount |
|
$ |
716,432 |
|
|
|
|
|
|
|
|
|
|
|
|
|
|
|
|
|
|
|
|
|
|
|
|
|
|
|
|
|
|
|
|
|
|
|
|
|
|
|
|
|
|
|
|
|
|
|
|
|
|
|
|
|
|
|
|
|
|
|
|
|
|
|
|
|
|
|
|
|
|
|
|
|
|
|
|
|
|
|
|
|
|
|
|
|
|
|
|
|
|
|
|
Real Estate Same Store Property Trends |
|
For the Three Months Ended |
|
|
|
|
For the Year Ended |
|
||||||||||||||||||||||
|
($'s in 000's) |
|
December 31, 2016 |
|
|
September 30, 2016 |
|
|
June 30, 2016 |
|
|
March 31, 2016 |
|
|
December 31, 2015 |
|
|
|
|
December 31, 2016 |
|
|
December 31, 2015 |
|
|||||||
|
RAIT Multifamily Portfolio: |
|
|
|
|
|
|
|
|
|
|
|
|
|
|
|
|
|
|
|
|
|
|
|
|
|
|
|
|
|
|
|
# of Properties |
|
|
6 |
|
|
|
6 |
|
|
|
6 |
|
|
|
6 |
|
|
|
6 |
|
|
|
|
|
6 |
|
|
|
6 |
|
|
# of Units |
|
|
1,703 |
|
|
|
1,703 |
|
|
|
1,703 |
|
|
|
1,703 |
|
|
|
1,703 |
|
|
|
|
|
1,703 |
|
|
|
1,703 |
|
|
Property income |
|
$ |
4,171 |
|
|
$ |
4,142 |
|
|
$ |
4,078 |
|
|
$ |
3,977 |
|
|
$ |
3,928 |
|
|
|
|
$ |
16,368 |
|
|
$ |
15,310 |
|
|
Operating expenses |
|
|
1,954 |
|
|
|
2,023 |
|
|
|
1,853 |
|
|
|
1,807 |
|
|
|
1,919 |
|
|
|
|
|
7,637 |
|
|
|
7,478 |
|
|
Net operating income |
|
|
2,217 |
|
|
|
2,119 |
|
|
|
2,225 |
|
|
|
2,170 |
|
|
|
2,009 |
|
|
|
|
|
8,731 |
|
|
|
7,832 |
|
|
NOI margin |
|
|
53.2 |
% |
|
|
51.2 |
% |
|
|
54.6 |
% |
|
|
54.6 |
% |
|
|
51.1 |
% |
|
|
|
|
53.3 |
% |
|
|
51.2 |
% |
|
Occupancy |
|
|
93.0 |
% |
|
|
93.3 |
% |
|
|
94.1 |
% |
|
|
93.1 |
% |
|
|
92.8 |
% |
|
|
|
|
93.4 |
% |
|
|
92.7 |
% |
|
Effective monthly rental rate, per unit |
|
$ |
828 |
|
|
$ |
898 |
|
|
$ |
802 |
|
|
$ |
853 |
|
|
$ |
833 |
|
|
|
|
$ |
845 |
|
|
$ |
822 |
|
|
|
|
|
|
|
|
|
|
|
|
|
|
|
|
|
|
|
|
|
|
|
|
|
|
|
|
|
|
|
|
|
|
RAIT Office Portfolio: |
|
|
|
|
|
|
|
|
|
|
|
|
|
|
|
|
|
|
|
|
|
|
|
|
|
|
|
|
|
|
|
# of Properties |
|
|
12 |
|
|
|
12 |
|
|
|
12 |
|
|
|
12 |
|
|
|
12 |
|
|
|
|
|
12 |
|
|
|
12 |
|
|
Square feet |
|
|
2,145,968 |
|
|
|
2,145,968 |
|
|
|
2,145,968 |
|
|
|
2,145,968 |
|
|
|
2,145,968 |
|
|
|
|
|
2,145,968 |
|
|
|
2,145,968 |
|
|
Property income |
|
$ |
8,621 |
|
|
$ |
9,949 |
|
|
$ |
8,742 |
|
|
$ |
8,840 |
|
|
$ |
8,813 |
|
|
|
|
$ |
36,152 |
|
|
$ |
35,613 |
|
|
Operating expenses |
|
|
3,857 |
|
|
|
3,839 |
|
|
|
4,039 |
|
|
|
4,013 |
|
|
|
4,141 |
|
|
|
|
|
15,748 |
|
|
|
16,150 |
|
|
Net operating income |
|
|
4,764 |
|
|
|
6,110 |
|
|
|
4,703 |
|
|
|
4,827 |
|
|
|
4,672 |
|
|
|
|
|
20,404 |
|
|
|
19,463 |
|
|
NOI margin |
|
|
55.3 |
% |
|
|
61.4 |
% |
|
|
53.8 |
% |
|
|
54.6 |
% |
|
|
53.0 |
% |
|
|
|
|
56.4 |
% |
|
|
54.7 |
% |
|
Occupancy |
|
|
78.8 |
% |
|
|
78.6 |
% |
|
|
77.8 |
% |
|
|
78.2 |
% |
|
|
79.4 |
% |
|
|
|
|
78.4 |
% |
|
|
78.3 |
% |
|
Effective annual rental rate, per square foot |
|
$ |
19.25 |
|
|
$ |
20.12 |
|
|
$ |
19.81 |
|
|
$ |
19.88 |
|
|
$ |
19.81 |
|
|
|
|
$ |
19.76 |
|
|
$ |
19.99 |
|
|
|
|
|
|
|
|
|
|
|
|
|
|
|
|
|
|
|
|
|
|
|
|
|
|
|
|
|
|
|
|
|
|
RAIT Retail Portfolio: |
|
|
|
|
|
|
|
|
|
|
|
|
|
|
|
|
|
|
|
|
|
|
|
|
|
|
|
|
|
|
|
# of Properties |
|
|
5 |
|
|
|
5 |
|
|
|
5 |
|
|
|
5 |
|
|
|
5 |
|
|
|
|
|
5 |
|
|
|
5 |
|
|
Square feet |
|
|
1,378,080 |
|
|
|
1,493,073 |
|
|
|
1,493,073 |
|
|
|
1,493,073 |
|
|
|
1,493,073 |
|
|
|
|
|
1,493,073 |
|
|
|
1,493,073 |
|
|
Property income |
|
$ |
3,727 |
|
|
$ |
3,676 |
|
|
$ |
3,575 |
|
|
$ |
3,542 |
|
|
$ |
3,580 |
|
|
|
|
$ |
14,520 |
|
|
$ |
14,480 |
|
|
Operating expenses |
|
|
2,024 |
|
|
|
1,881 |
|
|
|
1,900 |
|
|
|
2,028 |
|
|
|
1,987 |
|
|
|
|
|
7,833 |
|
|
|
8,408 |
|
|
Net operating income |
|
|
1,703 |
|
|
|
1,795 |
|
|
|
1,675 |
|
|
|
1,514 |
|
|
|
1,593 |
|
|
|
|
|
6,687 |
|
|
|
6,072 |
|
|
NOI margin |
|
|
45.7 |
% |
|
|
48.8 |
% |
|
|
46.9 |
% |
|
|
42.7 |
% |
|
|
44.5 |
% |
|
|
|
|
46.1 |
% |
|
|
41.9 |
% |
|
Occupancy |
|
|
76.8 |
% |
|
|
72.4 |
% |
|
|
73.2 |
% |
|
|
71.3 |
% |
|
|
68.6 |
% |
|
|
|
|
73.4 |
% |
|
|
69.5 |
% |
|
Effective annual rental rate, per square foot |
|
$ |
13.70 |
|
|
$ |
14.73 |
|
|
$ |
13.63 |
|
|
$ |
14.39 |
|
|
$ |
15.23 |
|
|
|
|
$ |
14.11 |
|
|
$ |
14.99 |
|
|
|
|
|
|
|
|
|
|
|
|
|
|
|
|
|
|
|
|
|
|
|
|
|
|
|
|
|
|
|
|
|
|
RAIT Industrial Portfolio: |
|
|
|
|
|
|
|
|
|
|
|
|
|
|
|
|
|
|
|
|
|
|
|
|
|
|
|
|
|
|
|
No same store properties |
|
|
— |
|
|
|
— |
|
|
|
— |
|
|
|
— |
|
|
|
— |
|
|
|
|
|
— |
|
|
|
— |
|
|
|
|
|
|
|
|
|
|
|
|
|
|
|
|
|
|
|
|
|
|
|
|
|
|
|
|
|
|
|
|
|
|
Total RAIT Same Store Revenue |
|
$ |
16,519 |
|
|
$ |
17,767 |
|
|
$ |
16,395 |
|
|
$ |
16,359 |
|
|
$ |
16,321 |
|
|
|
|
$ |
67,040 |
|
|
$ |
65,403 |
|
|
Total RAIT Same Store Operating expenses |
|
|
7,835 |
|
|
|
7,743 |
|
|
|
7,792 |
|
|
|
7,848 |
|
|
|
8,047 |
|
|
|
|
|
31,218 |
|
|
|
32,036 |
|
|
Total RAIT Same Store Net operating income (a) |
|
$ |
8,684 |
|
|
$ |
10,024 |
|
|
$ |
8,603 |
|
|
$ |
8,511 |
|
|
$ |
8,274 |
|
|
|
|
$ |
35,822 |
|
|
$ |
33,367 |
|
|
|
|
|
|
|
|
|
|
|
|
|
|
|
|
|
|
|
|
|
|
|
|
|
|
|
|
|
|
|
|
|
|
RAIT NOI Increase |
|
|
5.0 |
% |
|
|
|
|
|
|
|
|
|
|
|
|
|
|
|
|
|
|
|
|
7.4 |
% |
|
|
|
|
|
|
(a) |
See definition and reconciliation to net income in the definitions section. |
17
CHANGES IN THE PORTFOLIO – YEAR-TO-DATE DECEMBER 31, 2016:
|
($'s in 000's) |
|
City & State |
|
Square Feet / Units/Acres |
|
|
Month Acquired / Sold |
|
Transaction |
|
Value |
|
||
|
ADDITIONS: |
|
|
|
|
|
|
|
|
|
|
|
|
|
|
|
Industrial |
|
|
|
|
|
|
|
|
|
|
|
|
|
|
|
Gettysburg Pike 6930 |
|
Fort Wayne, IN |
|
|
161,000 |
|
|
Apr 2016 |
|
Loan conversion (a) |
|
$ |
5,670 |
|
|
Gettysburg Pike 6932 |
|
Fort Wayne, IN |
|
|
63,804 |
|
|
Apr 2016 |
|
Loan conversion (a) |
|
|
2,460 |
|
|
Total Industrial |
|
|
|
|
224,804 |
|
|
|
|
|
|
|
8,130 |
|
|
|
|
|
|
|
|
|
|
|
|
|
|
|
|
|
|
Office: |
|
|
|
|
|
|
|
|
|
|
|
|
|
|
|
Lake Avenue |
|
Fort Wayne, IN |
|
|
25,200 |
|
|
Apr 2016 |
|
Loan conversion (a) |
|
|
3,220 |
|
|
Moreau Court |
|
South Bend, IN |
|
|
82,396 |
|
|
Apr 2016 |
|
Loan conversion (a) |
|
|
7,030 |
|
|
Total Office |
|
|
|
|
107,596 |
|
|
|
|
|
|
|
10,250 |
|
|
|
|
|
|
|
|
|
|
|
|
|
|
|
|
|
|
Retail: |
|
|
|
|
|
|
|
|
|
|
|
|
|
|
|
Raritan |
|
Raritan, NJ |
|
|
114,993 |
|
|
Dec 2016 |
|
Loan conversion |
|
|
31,860 |
|
|
Total Retail |
|
|
|
|
114,993 |
|
|
|
|
|
|
|
31,860 |
|
|
|
|
|
|
|
|
|
|
|
|
|
|
|
|
|
|
Total Additions: |
|
|
|
|
|
|
|
|
|
|
|
$ |
50,240 |
|
|
|
|
|
|
|
|
|
|
|
|
|
|
|
|
|
|
|
|
|
|
|
|
|
|
|
|
|
|
|
|
|
|
|
|
|
|
|
|
|
|
|
|
|
|
|
|
|
|
SALES: |
|
|
|
|
|
|
|
|
|
|
|
|
|
|
|
Multifamily: |
|
|
|
|
|
|
|
|
|
|
|
|
|
|
|
Ventura |
|
Gainesville, FL |
|
|
208 |
|
|
Mar 2016 |
|
Sale |
|
$ |
8,750 |
|
|
Desert Wind |
|
Phoenix, AZ |
|
|
216 |
|
|
May 2016 |
|
Sale |
|
|
8,750 |
|
|
Las Vistas |
|
Phoenix, AZ |
|
|
200 |
|
|
May 2016 |
|
Sale |
|
|
10,500 |
|
|
Penny Lane |
|
Mesa, AZ |
|
|
136 |
|
|
May 2016 |
|
Sale |
|
|
10,000 |
|
|
Sandal Ridge |
|
Mesa, AZ |
|
|
196 |
|
|
May 2016 |
|
Sale |
|
|
12,250 |
|
|
Silversmith |
|
Jacksonville, FL |
|
|
140 |
|
|
Jun 2016 |
|
Sale |
|
|
6,200 |
|
|
Augusta |
|
Las Vegas, NV |
|
|
272 |
|
|
Sep 2016 |
|
Sale |
|
|
37,500 |
|
|
Coles Crossing |
|
Cypress, TX |
|
|
370 |
|
|
Sep 2016 |
|
Sale |
|
|
43,750 |
|
|
Eagle Ridge |
|
Colton, CA |
|
|
144 |
|
|
Sep 2016 |
|
Sale |
|
|
18,431 |
|
|
Grand Terrace |
|
Colton, CA |
|
|
208 |
|
|
Sep 2016 |
|
Sale |
|
|
26,219 |
|
|
Regency Meadows |
|
Las Vegas, NV |
|
|
120 |
|
|
Nov 2016 |
|
Sale |
|
|
7,200 |
|
|
Ellington Apartments |
|
Miami Gardens, FL |
|
|
343 |
|
|
Nov 2016 |
|
Sale |
|
|
36,200 |
|
|
River Park West |
|
Houston, TX |
|
|
288 |
|
|
Nov 2016 |
|
Sale |
|
|
30,150 |
|
|
Mandalay |
|
Austin, TX |
|
|
300 |
|
|
Dec 2016 |
|
Sale |
|
|
36,000 |
|
|
Ashford Place |
|
Tampa, FL |
|
|
369 |
|
|
Dec 2016 |
|
Sale |
|
|
24,050 |
|
|
Tierra Bella |
|
Las Vegas, NV |
|
|
98 |
|
|
Dec 2016 |
|
Sale |
|
|
12,468 |
|
|
Total Multifamily |
|
|
|
|
3,608 |
|
|
|
|
|
|
|
328,418 |
|
|
|
|
|
|
|
|
|
|
|
|
|
|
|
|
|
|
Office: |
|
|
|
|
|
|
|
|
|
|
|
|
|
|
|
Mineral Business Center |
|
Denver, CO |
|
|
117,461 |
|
|
Mar 2016 |
|
Sale |
|
|
7,949 |
|
|
Total Office |
|
|
|
|
117,461 |
|
|
|
|
|
|
|
7,949 |
|
|
|
|
|
|
|
|
|
|
|
|
|
|
|
|
|
|
Land: |
|
|
|
|
|
|
|
|
|
|
|
|
|
|
|
Saxony Inn |
|
Daytona Beach, FL |
|
|
0.5 |
|
|
Apr 2016 |
|
Sale |
|
|
1,500 |
|
|
Total Land |
|
|
|
|
0.5 |
|
|
|
|
|
|
|
1,500 |
|
|
Total RAIT Sales: |
|
|
|
|
|
|
|
|
|
|
|
$ |
337,867 |
|
|
(a) |
Represents one loan portfolio conversion. |
18
REAL ESTATE PROPERTIES, AS OF DECEMBER 31, 2016
|
($'s in 000's) |
|
|
|
|
|
|
|
|
|
|
|
INVESTMENTS IN REAL ESTATE |
|
|
|
|
|
|
|
|
|
|
|
|
|
||||||||||
|
Property Name |
|
Location |
|
Units/ Square Feet/ Acres |
|
|
Year of Acquisition |
|
Description |
|
|
Gross Cost |
|
|
Accumulated Depreciation |
|
|
Net Book Value |
|
|
Occupancy (Period End) |
|
|
Average Occupancy (a) |
|
|
Rental Rate (b) |
|
|||||||
|
|
|
|
|
|
|
|
|
|
|
|
|
|
|
|
|
|
|
|
|
|
|
|
|
|
|
|
|
|
|
|
|
|
|
|
|
|
HELD FOR DISPOSITION |
|
||||||||||||||||||||||||||||||||||
|
|
|
|
|
|
|
|
|
|
|
|
|
|
|
|
|
|
|
|
|
|
|
|
|
|
|
|
|
|
|
|
|
|
|
|
|
|
RAIT MULTIFAMILY PORTFOLIO: |
|
|
|
|
|
|
|
|
|
|
|
|
|
|
|
|
|
|
|
|
|
|
|
|
|
|
|
|
|
|
|||||
|
Oyster Point |
|
Newport News, VA |
|
|
278 |
|
|
2008 |
|
Multi-Family |
|
|
$ |
16,649 |
|
|
$ |
(5,264 |
) |
|
$ |
11,385 |
|
|
|
91.7 |
% |
|
|
91.0 |
% |
|
|
687 |
|
|
Tuscany Bay |
|
Orlando, FL |
|
|
396 |
|
|
2008 |
|
Multi-Family |
|
|
|
37,699 |
|
|
|
(9,347 |
) |
|
|
28,352 |
|
|
|
96.0 |
% |
|
|
95.8 |
% |
|
|
866 |
|
|
Emerald Bay |
|
Las Vegas, NV |
|
|
337 |
|
|
2009 |
|
Multi-Family |
|
|
|
29,904 |
|
|
|
(7,213 |
) |
|
|
22,691 |
|
|
|
92.3 |
% |
|
|
93.0 |
% |
|
|
690 |
|
|
Lexington |
|
Jackson, MS |
|
|
220 |
|
|
2010 |
|
Multi-Family |
|
|
|
16,957 |
|
|
|
(3,390 |
) |
|
|
13,567 |
|
|
|
95.5 |
% |
|
|
95.1 |
% |
|
|
898 |
|
|
Trails at Northpointe |
|
Jackson, MS |
|
|
144 |
|
|
2010 |
|
Multi-Family |
|
|
|
7,855 |
|
|
|
(1,771 |
) |
|
|
6,084 |
|
|
|
90.3 |
% |
|
|
90.3 |
% |
|
|
695 |
|
|
|
|
|
|
|
|
|
|
|
|
|
|
|
|
|
|
|
|
|
|
|
|
|
|
|
|
|
|
|
|
|
|
|
|
|
|
|
Subtotal -- Multifamily |
|
|
|
|
1,375 |
|
|
|
|
|
|
|
$ |
109,064 |
|
|
$ |
(26,985 |
) |
|
$ |
82,079 |
|
|
|
93.5 |
% |
|
|
93.5 |
% |
|
$ |
774 |
|
|
|
|
|
|
|
|
|
|
|
|
|
|
|
|
|
|
|
|
|
|
|
|
|
|
|
|
|
|
|
|
|
|
|
|
|
|
|
RAIT OFFICE PORTFOLIO: |
|
|
|
|
|
|
|
|
|
|
|
|
|
|
|
|
|
|
|
|
|
|
|
|
|
|
|
|
|
|
|||||
|
McDowell |
|
Scottsdale, AZ |
|
|
255,573 |
|
|
2007 |
|
Office |
|
|
$ |
74,727 |
|
|
$ |
(18,344 |
) |
|
$ |
56,383 |
|
|
|
99.7 |
% |
|
|
99.7 |
% |
|
|
24.13 |
|
|
Executive Center |
|
Milwaukee, WI |
|
|
102,017 |
|
|
2009 |
|
Office |
|
|
|
11,955 |
|
|
|
(3,269 |
) |
|
|
8,686 |
|
|
|
95.7 |
% |
|
|
95.6 |
% |
|
|
18.11 |
|
|
Tiffany Square |
|
Colorado Springs, CO |
|
|
184,219 |
|
|
2010 |
|
Office |
|
|
|
14,599 |
|
|
|
(3,508 |
) |
|
|
11,091 |
|
|
|
74.6 |
% |
|
|
74.6 |
% |
|
|
16.09 |
|
|
Four Resource Square |
|
Charlotte, NC |
|
|
151,916 |
|
|
2011 |
|
Office |
|
|
|
21,856 |
|
|
|
(3,740 |
) |
|
|
18,116 |
|
|
|
90.1 |
% |
|
|
90.1 |
% |
|
|
16.22 |
|
|
UBS Tower |
|
St. Paul, MN |
|
|
228,882 |
|
|
2012 |
|
Office |
|
|
|
16,830 |
|
|
|
(4,645 |
) |
|
|
12,185 |
|
|
|
81.7 |
% |
|
|
81.0 |
% |
|
|
18.69 |
|
|
Rutherford |
|
Woodlawn, MD |
|
|
85,806 |
|
|
2014 |
|
Office |
|
|
|
7,713 |
|
|
|
(1,648 |
) |
|
|
6,065 |
|
|
|
87.9 |
% |
|
|
87.9 |
% |
|
|
19.29 |
|
|
Union Medical |
|
Colorado Springs, CO |
|
|
151,299 |
|
|
2014 |
|
Office |
|
|
|
29,420 |
|
|
|
(3,004 |
) |
|
|
26,416 |
|
|
|
87.9 |
% |
|
|
87.9 |
% |
|
|
27.06 |
|
|
100 East Lancaster Avenue |
|
Downingtown, PA |
|
|
37,963 |
|
|
2014 |
|
Office |
|
|
|
5,287 |
|
|
|
(460 |
) |
|
|
4,827 |
|
|
|
74.3 |
% |
|
|
74.3 |
% |
|
|
21.12 |
|
|
Lake Avenue |
|
Fort Wayne, IN |
|
|
25,200 |
|
|
2016 |
|
Office |
|
|
|
3,011 |
|
|
|
(67 |
) |
|
|
2,944 |
|
|
|
100.0 |
% |
|
|
100.0 |
% |
|
|
13.99 |
|
|
Moreau Court |
|
South Bend, IN |
|
|
82,396 |
|
|
2016 |
|
Office |
|
|
|
6,022 |
|
|
|
(194 |
) |
|
|
5,828 |
|
|
|
69.4 |
% |
|
|
69.4 |
% |
|
|
25.50 |
|
|
|
|
|
|
|
|
|
|
|
|
|
|
|
|
|
|
|
|
|
|
|
|
|
|
|
|
|
|
|
|
|
|
|
|
|
|
|
Subtotal -- Office |
|
|
|
|
1,305,271 |
|
|
|
|
|
|
|
$ |
191,420 |
|
|
$ |
(38,879 |
) |
|
$ |
152,541 |
|
|
|
86.8 |
% |
|
|
86.7 |
% |
|
$ |
20.47 |
|
|
|
|
|
|
|
|
|
|
|
|
|
|
|
|
|
|
|
|
|
|
|
|
|
|
|
|
|
|
|
|
|
|
|
|
|
|
|
RAIT INDUSTRIAL PORTFOLIO: |
|
|
|
|
|
|
|
|
|
|
|
|
|
|
|
|
|
|
|
|
|
|
|
|
|
|
|
|
|
|
|||||
|
Adams Aircraft |
|
Englewood, CO |
|
|
48,490 |
|
|
2015 |
|
Industrial |
|
|
$ |
4,731 |
|
|
$ |
(174 |
) |
|
$ |
4,557 |
|
|
|
28.7 |
% |
|
|
28.7 |
% |
|
$ |
6.33 |
|
|
South Midco |
|
Witchita, KS |
|
|
73,740 |
|
|
2015 |
|
Industrial |
|
|
|
3,696 |
|
|
|
(144 |
) |
|
|
3,552 |
|
|
|
100.0 |
% |
|
|
100.0 |
% |
|
|
8.51 |
|
|
East Glendale |
|
Sparks, NV |
|
|
31,976 |
|
|
2015 |
|
Industrial |
|
|
|
1,121 |
|
|
|
(30 |
) |
|
|
1,091 |
|
|
|
100.0 |
% |
|
|
100.0 |
% |
|
|
4.46 |
|
|
Perry Avenue |
|
Attleboro, MA |
|
|
456,000 |
|
|
2015 |
|
Industrial |
|
|
|
26,573 |
|
|
|
(1,044 |
) |
|
|
25,529 |
|
|
|
100.0 |
% |
|
|
100.0 |
% |
|
|
4.53 |
|
|
Interstate Drive |
|
West Springfield, MA |
|
|
143,025 |
|
|
2015 |
|
Industrial |
|
|
|
5,162 |
|
|
|
(197 |
) |
|
|
4,965 |
|
|
|
0.0 |
% |
|
|
0.0 |
% |
|
|
- |
|
|
Hunt Valley Circle |
|
New Kensington, PA |
|
|
198,000 |
|
|
2015 |
|
Industrial |
|
|
|
9,613 |
|
|
|
(363 |
) |
|
|
9,250 |
|
|
|
100.0 |
% |
|
|
100.0 |
% |
|
|
4.25 |
|
|
Kirby Circle |
|
Palm Bay, FL |
|
|
231,313 |
|
|
2015 |
|
Industrial |
|
|
|
16,846 |
|
|
|
(670 |
) |
|
|
16,176 |
|
|
|
0.0 |
% |
|
|
0.0 |
% |
|
|
- |
|
|
Rex Boulevard |
|
Auburn Hills, MI |
|
|
151,200 |
|
|
2015 |
|
Industrial |
|
|
|
7,464 |
|
|
|
(255 |
) |
|
|
7,209 |
|
|
|
0.0 |
% |
|
|
0.0 |
% |
|
|
- |
|
|
Square Drive |
|
Marysville, OH |
|
|
130,044 |
|
|
2015 |
|
Industrial |
|
|
|
5,203 |
|
|
|
(208 |
) |
|
|
4,995 |
|
|
|
100.0 |
% |
|
|
100.0 |
% |
|
|
2.09 |
|
|
Fondorf Drive |
|
Columbus, OH |
|
|
151,685 |
|
|
2015 |
|
Industrial |
|
|
|
5,397 |
|
|
|
(220 |
) |
|
|
5,177 |
|
|
|
100.0 |
% |
|
|
100.0 |
% |
|
|
3.55 |
|
|
Gettysburg Pke 6930 |
|
Fort Wayne, IN |
|
|
161,000 |
|
|
2016 |
|
Industrial |
|
|
|
5,308 |
|
|
|
(120 |
) |
|
|
5,188 |
|
|
|
100.0 |
% |
|
|
100.0 |
% |
|
|
3.21 |
|
|
Gettysburg Pke 6932 |
|
Fort Wayne, IN |
|
|
63,804 |
|
|
2016 |
|
Industrial |
|
|
|
2,309 |
|
|
|
(55 |
) |
|
|
2,254 |
|
|
|
100.0 |
% |
|
|
100.0 |
% |
|
|
3.21 |
|
|
|
|
|
|
|
|
|
|
|
|
|
|
|
|
|
|
|
|
|
|
|
|
|
|
|
|
|
|
|
|
|
|
|
|
|
|
|
Subtotal -- Industrial |
|
|
|
|
1,840,277 |
|
|
|
|
|
|
|
$ |
93,423 |
|
|
$ |
(3,480 |
) |
|
$ |
89,943 |
|
|
|
69.6 |
% |
|
|
69.6 |
% |
|
$ |
3.00 |
|
|
|
|
|
|
|
|
|
|
|
|
|
|
|
|
|
|
|
|
|
|
|
|
|
|
|
|
|
|
|
|
|
|
|
|
|
|
|
RAIT RETAIL PORTFOLIO: |
|
|
|
|
|
|
|
|
|
|
|
|
|
|
|
|
|
|
|
|
|
|
|
|
|
|
|
|
|
|
|||||
|
Sharpstown Mall |
|
Houston, TX |
|
|
637,555 |
|
|
2009 |
|
Retail |
|
|
$ |
41,549 |
|
|
$ |
(10,177 |
) |
|
$ |
31,372 |
|
|
|
61.1 |
% |
|
|
58.0 |
% |
|
$ |
14.22 |
|
|
South Plaza |
|
Nashville, TN |
|
|
284,697 |
|
|
2011 |
|
Retail |
|
|
|
23,397 |
|
|
|
(3,708 |
) |
|
|
19,689 |
|
|
|
88.3 |
% |
|
|
88.4 |
% |
|
|
9.08 |
|
|
May’s Crossing |
|
Round Rock, TX |
|
|
64,084 |
|
|
2012 |
|
Retail |
|
|
|
8,506 |
|
|
|
(1,169 |
) |
|
|
7,337 |
|
|
|
81.5 |
% |
|
|
81.5 |
% |
|
|
14.06 |
|
|
Oakland Square |
|
Troy, MI |
|
|
220,226 |
|
|
2014 |
|
Retail |
|
|
|
22,357 |
|
|
|
(1,443 |
) |
|
|
20,914 |
|
|
|
100.0 |
% |
|
|
100.0 |
% |
|
|
12.44 |
|
|
Oakland Plaza |
|
Troy, MI |
|
|
171,518 |
|
|
2014 |
|
Retail |
|
|
|
25,530 |
|
|
|
(1,655 |
) |
|
|
23,875 |
|
|
|
95.9 |
% |
|
|
96.1 |
% |
|
|
20.88 |
|
|
|
|
|
|
|
|
|
|
|
|
|
|
|
|
|
|
|
|
|
|
|
|
|
|
|
|
|
|
|
|
|
|
|
|
|
|
|
Subtotal -- Retail |
|
|
|
|
1,378,080 |
|
|
|
|
|
|
|
$ |
121,339 |
|
|
$ |
(18,152 |
) |
|
$ |
103,187 |
|
|
|
78.2 |
% |
|
|
76.8 |
% |
|
$ |
13.70 |
|
|
|
|
|
|
|
|
|
|
|
|
|
|
|
|
|
|
|
|
|
|
|
|
|
|
|
|
|
|
|
|
|
|
|
|
|
|
|
RAIT LAND PORTFOLIO: |
|
|
|
|
|
|
|
|
|
|
|
|
|
|
|
|
|
|
|
|
|
|
|
|
|
|
|
|
|
|
|||||
|
Treasure Island Resort |
|
Daytona Beach, FL |
|
|
2.5 |
|
|
2011 |
|
Land |
|
|
$ |
10,811 |
|
|
$ |
- |
|
|
$ |
10,811 |
|
|
|
|
|
|
|
|
|
|
|
|
|
|
Sunny Shores Resort |
|
Daytona Beach, FL |
|
|
1.0 |
|
|
2011 |
|
Land |
|
|
|
3,422 |
|
|
|
- |
|
|
|
3,422 |
|
|
|
|
|
|
|
|
|
|
|
|
|
|
MGS Gift Shop |
|
Daytona Beach, FL |
|
|
1.0 |
|
|
2011 |
|
Land |
|
|
|
425 |
|
|
|
- |
|
|
|
425 |
|
|
|
|
|
|
|
|
|
|
|
|
|
|
Beachcomber Beach Resort |
|
Daytona Beach, FL |
|
|
2.9 |
|
|
2011 |
|
Land |
|
|
|
10,343 |
|
|
|
- |
|
|
|
10,343 |
|
|
|
|
|
|
|
|
|
|
|
|
|
|
Subtotal -- Land |
|
|
|
|
7.4 |
|
|
|
|
|
|
|
$ |
25,001 |
|
|
$ |
- |
|
|
$ |
25,001 |
|
|
|
|
|
|
|
|
|
|
|
|
|
|
|
|
|
|
|
|
|
|
|
|
|
|
|
|
|
|
|
|
|
|
|
|
|
|
|
|
|
|
|
|
|
|
|
|
|
|
|
TOTAL RAIT - HELD FOR DISPOSITION |
|
|
|
|
|
|
|
|
|
|
$ |
540,247 |
|
|
$ |
(87,496 |
) |
|
$ |
452,751 |
|
|
|
|
|
|
|
|
|
|
|
|
|
||
|
|
|
|
|
|
|
|
|
|
|
|
|
|
|
|
|
|
|
|
|
|
|
|
|
|
|
|
|
|
|
|
|
|
|
|
|
|
HELD FOR INVESTMENT |
|
||||||||||||||||||||||||||||||||||
|
|
|
|
|
|
|
|
|
|
|
|
|
|
|
|
|
|
|
|
|
|
|
|
|
|
|
|
|
|
|
|
|
|
|
|
|
|
RAIT MULTIFAMILY PORTFOLIO: |
|
|
|
|
|
|
|
|
|
|
|
|
|
|
|
|
|
|
|
|
|
|
|
|
|
|
|
|
|
|
|
|
|
||
|
South Terrace |
|
Durham, NC |
|
|
328 |
|
|
2013 |
|
Multi-Family |
|
|
$ |
38,137 |
|
|
$ |
(4,166 |
) |
|
$ |
33,971 |
|
|
|
90.2 |
% |
|
|
91.3 |
% |
|
|
1,053 |
|
|
Subtotal -- Multifamily |
|
|
|
|
328 |
|
|
|
|
|
|
|
$ |
38,137 |
|
|
$ |
(4,166 |
) |
|
$ |
33,971 |
|
|
|
90.2 |
% |
|
|
91.3 |
% |
|
$ |
1,053 |
|
|
|
|
|
|
|
|
|
|
|
|
|
|
|
|
|
|
|
|
|
|
|
|
|
|
|
|
|
|
|
|
|
|
|
|
|
|
|
RAIT OFFICE PORTFOLIO: |
|
|
|
|
|
|
|
|
|
|
|
|
|
|
|
|
|
|
|
|
|
|
|
|
|
|
|
|
|
|
|
|
|
||
|
Reuss |
|
Milwaukee, WI |
|
|
578,104 |
|
|
2004 |
|
Office |
|
|
$ |
64,000 |
|
|
$ |
(23,606 |
) |
|
$ |
40,394 |
|
|
|
53.3 |
% |
|
|
54.6 |
% |
|
$ |
18.21 |
|
|
1501 Yamato Road |
|
Boca Raton, FL |
|
|
171,489 |
|
|
2009 |
|
Office |
|
|
|
47,328 |
|
|
|
(10,299 |
) |
|
|
37,029 |
|
|
|
100.0 |
% |
|
|
100.0 |
% |
|
|
19.51 |
|
|
Executive Mews - Willow Grove |
|
Willow Grove, PA |
|
|
86,554 |
|
|
2010 |
|
Office |
|
|
|
12,831 |
|
|
|
(2,716 |
) |
|
|
10,115 |
|
|
|
77.0 |
% |
|
|
75.9 |
% |
|
|
13.69 |
|
|
Executive Mews - Cherry Hill |
|
Cherry Hill, NJ |
|
|
112,146 |
|
|
2010 |
|
Office |
|
|
|
12,450 |
|
|
|
(3,218 |
) |
|
|
9,232 |
|
|
|
77.0 |
% |
|
|
79.2 |
% |
|
|
18.33 |
|
|
Subtotal -- Office |
|
|
|
|
948,293 |
|
|
|
|
|
|
|
$ |
136,609 |
|
|
$ |
(39,839 |
) |
|
$ |
96,770 |
|
|
|
66.7 |
% |
|
|
67.7 |
% |
|
$ |
18.05 |
|
|
|
|
|
|
|
|
|
|
|
|
|
|
|
|
|
|
|
|
|
|
|
|
|
|
|
|
|
|
|
|
|
|
|
|
|
|
|
RAIT RETAIL PORTFOLIO: |
|
|
|
|
|
|
|
|
|
|
|
|
|
|
|
|
|
|
|
|
|
|
|
|
|
|
|
|
|
|
|
|
|
|
|
|
Raritan (c) |
|
Raritan, NJ |
|
|
114,993 |
|
|
2016 |
|
Retail |
|
|
$ |
31,290 |
|
|
$ |
- |
|
|
$ |
31,290 |
|
|
|
65.1 |
% |
|
|
65.1 |
% |
|
|
- |
|
|
Subtotal -- Retail |
|
|
|
|
114,993 |
|
|
|
|
|
|
|
$ |
31,290 |
|
|
$ |
- |
|
|
$ |
31,290 |
|
|
|
65.1 |
% |
|
|
65.1 |
% |
|
$ |
- |
|
|
|
|
|
|
|
|
|
|
|
|
|
|
|
|
|
|
|
|
|
|
|
|
|
|
|
|
|
|
|
|
|
|
|
|
|
|
|
RAIT REDEVELOPMENT PORTFOLIO: |
|
|
|
|
|
|
|
|
|
|
|
|
|
|
|
|
|
|
|
|
|
|
|
|
|
|
|
|
|
|
|||||
|
Inlet Square Mall |
|
Myrtle Beach, SC |
|
|
436,719 |
|
|
2009 |
|
Retail |
|
|
$ |
11,390 |
|
|
$ |
(3,681 |
) |
|
$ |
7,709 |
|
|
|
33.2 |
% |
|
|
32.8 |
% |
|
|
|
|
|
Erieview Tower |
|
Cleveland, OH |
|
|
769,795 |
|
|
2015 |
|
Office |
|
|
|
69,740 |
|
|
|
(3,032 |
) |
|
|
66,708 |
|
|
|
43.6 |
% |
|
|
43.7 |
% |
|
|
|
|
|
|
|
|
|
|
|
|
|
|
|
|
|
|
|
|
|
|
|
|
|
|
|
|
|
|
|
|
|
|
|
|
|
|
|
|
|
|
Subtotal -- Redevelopment |
|
|
|
|
1,206,514 |
|
|
|
|
|
|
|
$ |
81,130 |
|
|
$ |
(6,713 |
) |
|
$ |
74,417 |
|
|
|
39.8 |
% |
|
|
39.8 |
% |
|
|
|
|
|
|
|
|
|
|
|
|
|
|
|
|
|
|
|
|
|
|
|
|
|
|
|
|
|
|
|
|
|
|
|
|
|
|
|
|
|
|
RAIT LAND PORTFOLIO: |
|
|
|
|
|
|
|
|
|
|
|
|
|
|
|
|
|
|
|
|
|
|
|
|
|
|
|
|
|
|
|
|
|
|
|
|
Willow Grove |
|
Willow Grove, PA |
|
|
0.5 |
|
|
2001 |
|
Land |
|
|
$ |
307 |
|
|
$ |
- |
|
|
$ |
307 |
|
|
|
|
|
|
|
|
|
|
|
|
|
|
Cherry Hill |
|
Cherry Hill, NJ |
|
|
0.5 |
|
|
2001 |
|
Land |
|
|
|
307 |
|
|
|
- |
|
|
|
307 |
|
|
|
|
|
|
|
|
|
|
|
|
|
|
Corey Landings |
|
St. Pete Beach, FL |
|
|
5.3 |
|
|
2009 |
|
Land |
|
|
|
26,619 |
|
|
|
- |
|
|
|
26,619 |
|
|
|
|
|
|
|
|
|
|
|
|
|
|
Subtotal -- Land |
|
|
|
|
6.3 |
|
|
|
|
|
|
|
$ |
27,233 |
|
|
$ |
- |
|
|
$ |
27,233 |
|
|
|
|
|
|
|
|
|
|
|
|
|
|
|
|
|
|
|
|
|
|
|
|
|
|
|
|
|
|
|
|
|
|
|
|
|
|
|
|
|
|
|
|
|
|
|
|
|
|
|
TOTAL RAIT - HELD FOR INVESTMENT |
|
|
|
|
|
|
|
|
|
|
$ |
314,399 |
|
|
$ |
(50,718 |
) |
|
$ |
263,681 |
|
|
|
|
|
|
|
|
|
|
|
|
|
||
|
|
|
|
|
|
|
|
|
|
|
|
|
|
|
|
|
|
|
|
|
|
|
|
|
|
|
|
|
|
|
|
|
|
|
|
|
|
TOTAL RAIT |
|
|
|
|
|
|
|
|
|
|
|
|
$ |
854,646 |
|
|
$ |
(138,214 |
) |
|
$ |
716,432 |
|
|
|
|
|
|
|
|
|
|
|
|
|
(a) Average occupancy represents the daily average occupancy for the three-month period ended December 31, 2016.
|
(b) |
Multifamily rental rate data is per unit, per month. Office, Industrial and Retail are per square foot, per year. |
|
(c) |
Property acquired on December 27, 2016. Rental income insignificant for the three-month period ended December 31, 2016. |
19
As of December 31, 2016
|
($'S in 000's) |
|
Unpaid Principal |
|
|
Unamortized Discount and Debt Issuance Costs |
|
|
Carrying Amount |
|
|
Rate |
|
|
Maturity Date |
|
||||
|
RAIT Indebtedness: |
|
|
|
|
|
|
|
|
|
|
|
|
|
|
|
|
|
|
|
|
Recourse debt |
|
|
|
|
|
|
|
|
|
|
|
|
|
|
|
|
|
|
|
|
7% convertible senior notes |
|
$ |
871 |
|
|
$ |
(40 |
) |
|
$ |
831 |
|
|
|
7.0 |
% |
|
04/2031 |
|
|
4% convertible senior notes |
|
|
126,098 |
|
|
|
(5,827 |
) |
|
|
120,271 |
|
|
|
4.0 |
% |
|
10/2033 |
(a) |
|
7.625% senior notes |
|
|
57,287 |
|
|
|
(1,719 |
) |
|
|
55,568 |
|
|
|
7.6 |
% |
|
04/2024 |
|
|
7.125% senior notes |
|
|
70,731 |
|
|
|
(1,543 |
) |
|
|
69,188 |
|
|
|
7.1 |
% |
|
08/2019 |
|
|
Senior secured notes |
|
|
62,000 |
|
|
|
(3,767 |
) |
|
|
58,233 |
|
|
|
7.0 |
% |
|
04/2017-04/2019 |
(b) |
|
Lending warehouse facilities |
|
|
|
|
|
|
|
|
|
|
|
|
|
|
|
|
|
|
|
|
Conduit loans |
|
|
- |
|
|
|
(531 |
) |
|
|
(531 |
) |
|
|
- |
|
|
11/2017-07/2018 |
|
|
Floating rate loans |
|
|
26,421 |
|
|
|
(982 |
) |
|
|
25,439 |
|
|
|
3.1 |
% |
|
12/2017-07/2018 |
|
|
Total |
|
|
26,421 |
|
|
|
(1,513 |
) |
|
|
24,908 |
|
|
|
3.1 |
% |
|
|
|
|
Junior subordinated notes, at fair value |
|
|
18,671 |
|
|
|
(6,849 |
) |
|
|
11,822 |
|
|
|
4.8 |
% |
|
03/2035 |
|
|
Junior subordinated notes, at amortized cost |
|
|
25,100 |
|
|
|
- |
|
|
|
25,100 |
|
|
|
3.4 |
% |
|
04/2037 |
|
|
Total Recourse Debt |
|
|
387,179 |
|
|
|
(21,258 |
) |
|
|
365,921 |
|
|
|
5.5 |
% |
|
|
|
|
Non-Recourse debt |
|
|
|
|
|
|
|
|
|
|
|
|
|
|
|
|
|
|
|
|
Securitization notes payable: |
|
|
|
|
|
|
|
|
|
|
|
|
|
|
|
|
|
|
|
|
CRE CDO I |
|
|
376,089 |
|
|
|
(4,947 |
) |
|
|
371,142 |
|
|
|
1.5 |
% |
|
11/2046 |
|
|
CRE CDO II |
|
|
166,227 |
|
|
|
(2,868 |
) |
|
|
163,359 |
|
|
|
2.2 |
% |
|
06/2045 |
|
|
FL3 |
|
|
57,942 |
|
|
|
(244 |
) |
|
|
57,698 |
|
|
|
3.4 |
% |
|
12/2031 |
|
|
FL4 |
|
|
107,998 |
|
|
|
(516 |
) |
|
|
107,482 |
|
|
|
2.8 |
% |
|
12/2031 |
|
|
FL5 |
|
|
265,304 |
|
|
|
(2,424 |
) |
|
|
262,880 |
|
|
|
3.5 |
% |
|
01/2031 |
|
|
FL6 |
|
|
216,677 |
|
|
|
(3,660 |
) |
|
|
213,017 |
|
|
|
2.7 |
% |
|
11/2031 |
|
|
Total securitization notes payable |
|
|
1,190,237 |
|
|
|
(14,659 |
) |
|
|
1,175,578 |
|
|
|
2.5 |
% |
|
|
|
|
Loans payable on real estate |
|
|
186,237 |
|
|
|
(569 |
) |
|
|
185,668 |
|
|
|
5.7 |
% |
|
06/2016-12/2021 |
(c) |
|
Total Non-recourse debt |
|
|
1,376,474 |
|
|
|
(15,228 |
) |
|
|
1,361,246 |
|
|
|
2.9 |
% |
|
|
|
|
Other Indebtedness |
|
|
24,321 |
|
|
|
(406 |
) |
|
|
23,915 |
|
|
|
- |
|
|
- |
|
|
Total RAIT Indebtedness |
|
$ |
1,787,974 |
|
|
$ |
(36,892 |
) |
|
$ |
1,751,082 |
|
|
|
3.5 |
% |
|
|
|
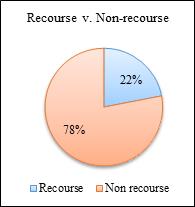
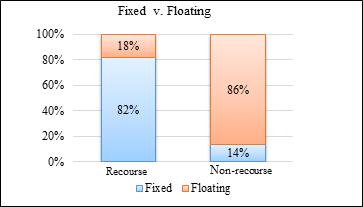
(b)
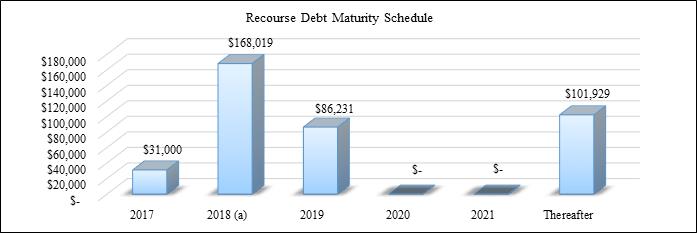
|
|
(a) |
Includes the $126,098 of 4% convertible senior notes that may be put in October 2018. |
|
|
(b) |
In January 2017, we repaid, in full, $15,500 of this outstanding debt that had a maturity date of April 1, 2017. |
|
|
(c) |
One loan payable on real estate had a maturity date of June 2016. This loan is in the process of being resolved with the lender. |
20
Adjusted EBITDA
Adjusted Earnings before Interest, Taxes, Depreciation and Amortization, is a non-GAAP financial measure. We calculate Adjusted EBITDA as Net Income, before the effects of investment interest expense, interest expense, acquisition and integration expenses, depreciation and amortization, provision for loan losses (gains) losses on assets, asset impairments, (gains) losses on debt extinguishments, change in fair value of financial instruments, and income tax (benefit) provision as well as similar items and other non-recurring items such as (gains) losses on acquisitions related to discontinued operations. [In the quarter ended December 31, 2016, we changed our method of calculating Adjusted EBITDA to exclude provision for loan losses.] We believe Adjusted EBITDA provides useful information to investors to ascertain our interest coverage and interest plus preferred dividends coverage ratios.
Assets Under Management
Assets under management, or AUM, is an operating measure representing the total assets that we own or are managing for third parties. While not all AUM generates fee income, it is an important operating measure to gauge our asset growth, volume of originations, size and scale of our operations and our performance. AUM includes our total investment portfolio, assets associated with unconsolidated securitizations for which we derive asset management fees and real estate properties we manage on behalf of third parties.
Cash Available for Distribution
Cash available for distribution, or CAD, is a non-GAAP financial measure. We believe that CAD provides investors and management with a meaningful indicator of operating performance. Management also uses CAD, among other measures, to evaluate profitability and our board of trustees considers CAD in determining our quarterly cash distributions. We also believe that CAD is useful because it adjusts for a variety of noncash items (such as depreciation and amortization, equity-based compensation, provision for loan losses and non-cash interest income and expense items). In addition, the compensation committee of our board of trustees used CAD as a metric in establishing quantitative performance based awards for certain of our executive officers beginning in 2015. Furthermore, in measuring our performance in periods prior to 2015, CAD removes the effect of our previous consolidation of the legacy securitizations, T8 and T9, which we deconsolidated as part of our exit of the Taberna business in December 2014.
We calculate CAD by subtracting from or adding to net income (loss) attributable to common shareholders the following items: depreciation and amortization items including depreciation and amortization, straight-line rental income or expense, amortization of in place leases, amortization of deferred financing costs, amortization of discount on financings and equity-based compensation; changes in the fair value of our financial instruments; realized gains (losses) on assets; provision for loan losses; asset impairments; acquisition gains or losses and transaction costs; certain fee income eliminated in consolidation that is attributable to third parties; and one-time events pursuant to changes in U.S. GAAP and certain other non-routine items. In the quarter ended March 31, 2016, we changed our method of calculating CAD to exclude the impact of real property sales from CAD. We made this change in response to investor feedback to focus CAD on our core business activities. In addition, we provide guidance regarding our expected CAD in future periods and this change removes variability resulting from the ultimate timing of future property sales.
CAD should not be considered as an alternative to net income (loss) or cash generated from operating activities, determined in accordance with U.S. GAAP, as an indicator of operating performance. For example, CAD does not adjust for the accrual of income and expenses that may not be received or paid in cash during the associated periods. Please refer to our consolidated financial statements prepared in accordance with U.S. GAAP in our most recent report on Form 10-K or Form 10-Q filed with the Securities and Exchange Commission. In addition, our methodology for calculating CAD may differ from the methodologies used by other comparable companies, including other REITs, when calculating the same or similar supplemental financial measures and may not be comparable with these companies.
Funds from Operations
We believe that funds from operations, or FFO, which is a non-GAAP financial measure, is an additional appropriate measure of the operating performance of a REIT. We compute FFO in accordance with the standards established by the National Association of Real Estate Investment Trusts, or NAREIT, as net income or loss allocated to common shares (computed in accordance with GAAP), excluding real estate-related depreciation and amortization expense, gains or losses on sales of real estate, asset impairment and the cumulative effect of changes in accounting principles. Our management utilizes FFO as a measure of our operating performance. FFO is not an equivalent to net income or cash generated from operating activities determined in accordance with U.S. GAAP. Furthermore, FFO does not represent amounts available for management’s discretionary use because of needed capital replacement or expansion, debt service obligations or other commitments or uncertainties. FFO should not be considered as an alternative to net income as an indicator of our operating performance or as an alternative to cash flow from operating activities as a measure of our liquidity.
21
Gross real estate investments equal investments in real estate, net plus accumulated depreciation as it appears on the consolidated balance sheet. The following table provides a reconciliation of investments in real estate, net to total gross real estate investments.
|
|
As of |
|
|||||||||||||||||
|
|
December 31, 2016 |
|
|
September 30, 2016 |
|
|
June 30, 2016 |
|
|
March 31, 2016 |
|
|
December 31, 2015 |
|
|||||
|
Investments in real estate, net |
$ |
716,432 |
|
|
$ |
808,749 |
|
|
$ |
930,987 |
|
|
$ |
965,296 |
|
|
$ |
986,942 |
|
|
Plus: Accumulated Depreciation |
|
138,214 |
|
|
|
156,613 |
|
|
|
164,037 |
|
|
|
164,999 |
|
|
|
158,688 |
|
|
Gross real estate investments |
$ |
854,646 |
|
|
$ |
965,362 |
|
|
$ |
1,095,024 |
|
|
$ |
1,130,295 |
|
|
$ |
1,145,630 |
|
Interest Coverage
Interest coverage is computed as Adjusted EBITDA divided by interest costs (excluding amortization of deferred financing costs and debt discounts)
Interest + Preferred Coverage
Interest + Preferred coverage is computed as Adjusted EBITDA divided by the sum of interest costs (excluding amortization of deferred financing costs and debt discounts) and preferred costs (excluding amortization of preferred share discounts).
Net Operating Income
Net Operating Income (“NOI”), a non-GAAP financial measure, is a useful measure of the operating performance of its real estate portfolio. NOI is defined as total property revenue less total property operating expenses, excluding depreciation and amortization and interest expense. Other REITs may use different methodologies for calculating NOI, and accordingly, our NOI may not be comparable to other REITs. We believe that this measure provides an operating perspective not immediately apparent from GAAP operating income or net income. We use NOI to evaluate our real estate portfolio performance on a same store and non-same store basis because NOI measures the core operations of property performance by excluding corporate level expenses and other items not related to property operating performance and captures trends in rental rates and property operating expenses.
Same Store Properties and Same Store Portfolio
RAIT reviews its same store properties or portfolio at the beginning of the calendar year. Properties are added into the same store portfolio if they were owned at the beginning of the previous year. Properties that have been sold are excluded from the same store portfolio. Properties included in the redevelopment portfolio are not part of the same store portfolio. A reconciliation of our same store net operating income to net income is as follows for each of the periods presented below:
|
|
|
For the Three Months Ended |
|
|
|
For the Year Ended |
|
||||||||||||||||||||||
|
|
|
December 31, 2016 |
|
|
September 30, 2016 |
|
|
June 30, 2016 |
|
|
March 31, 2016 |
|
|
December 31, 2015 |
|
|
|
December 31, 2016 |
|
|
December 31, 2015 |
|
|||||||
|
Same store property net operating income |
|
$ |
8,684 |
|
|
$ |
10,024 |
|
|
$ |
8,603 |
|
|
$ |
8,511 |
|
|
$ |
8,274 |
|
|
|
$ |
35,822 |
|
|
$ |
33,367 |
|
|
Non same store property net operating income |
|
|
1,733 |
|
|
|
4,955 |
|
|
|
6,736 |
|
|
|
6,696 |
|
|
|
6,560 |
|
|
|
|
20,120 |
|
|
|
28,064 |
|
|
Net interest margin |
|
|
10,844 |
|
|
|
11,677 |
|
|
|
14,394 |
|
|
|
16,482 |
|
|
|
19,876 |
|
|
|
|
53,397 |
|
|
|
69,182 |
|
|
Fee and other income |
|
|
1,400 |
|
|
|
1,946 |
|
|
|
1,914 |
|
|
|
2,114 |
|
|
|
3,515 |
|
|
|
|
7,374 |
|
|
|
18,275 |
|
|
Interest expense |
|
|
(11,914 |
) |
|
|
(13,298 |
) |
|
|
(13,967 |
) |
|
|
(15,870 |
) |
|
|
(15,491 |
) |
|
|
|
(55,049 |
) |
|
|
(61,750 |
) |
|
Compensation expenses |
|
|
(6,275 |
) |
|
|
(4,675 |
) |
|
|
(3,862 |
) |
|
|
(3,625 |
) |
|
|
(4,854 |
) |
|
|
|
(18,437 |
) |
|
|
(15,349 |
) |
|
General and administrative expenses |
|
|
(3,300 |
) |
|
|
(3,052 |
) |
|
|
(3,706 |
) |
|
|
(3,215 |
) |
|
|
(3,895 |
) |
|
|
|
(13,273 |
) |
|
|
(14,707 |
) |
|
Property management expenses |
|
|
(2,240 |
) |
|
|
(2,226 |
) |
|
|
(2,846 |
) |
|
|
(2,167 |
) |
|
|
(2,220 |
) |
|
|
|
(9,479 |
) |
|
|
(9,323 |
) |
|
Acquisition and integration expenses |
|
|
(248 |
) |
|
|
(197 |
) |
|
|
(70 |
) |
|
|
(109 |
) |
|
|
(940 |
) |
|
|
|
(624 |
) |
|
|
(2,332 |
) |
|
Provision for loan losses |
|
|
(3,848 |
) |
|
|
(1,533 |
) |
|
|
(1,344 |
) |
|
|
(1,325 |
) |
|
|
(2,450 |
) |
|
|
|
(8,050 |
) |
|
|
(8,300 |
) |
|
Depreciation and amortization expense |
|
|
(12,031 |
) |
|
|
(11,466 |
) |
|
|
(15,134 |
) |
|
|
(12,673 |
) |
|
|
(10,883 |
) |
|
|
|
(51,304 |
) |
|
|
(45,505 |
) |
|
IRT internalization and management transition expenses |
|
|
(6,271 |
) |
|
|
- |
|
|
|
- |
|
|
|
- |
|
|
|
- |
|
|
|
|
(6,271 |
) |
|
|
- |
|
|
Other income (expense) |
|
|
(457 |
) |
|
|
(70 |
) |
|
|
39 |
|
|
|
61 |
|
|
|
(48 |
) |
|
|
|
(427 |
) |
|
|
(1,083 |
) |
|
Gains (losses) on assets |
|
|
29,461 |
|
|
|
18,194 |
|
|
|
5,812 |
|
|
|
(195 |
) |
|
|
12,682 |
|
|
|
|
53,272 |
|
|
|
37,393 |
|
|
Asset impairment |
|
|
(11,127 |
) |
|
|
(18,872 |
) |
|
|
(3,864 |
) |
|
|
(3,922 |
) |
|
|
(929 |
) |
|
|
|
(37,785 |
) |
|
|
(8,179 |
) |
|
Gains (losses) on debt extinguishment |
|
|
333 |
|
|
|
(6 |
) |
|
|
660 |
|
|
|
344 |
|
|
|
- |
|
|
|
|
1,331 |
|
|
|
- |
|
|
Change in fair value of financial instruments |
|
|
1,109 |
|
|
|
(1,375 |
) |
|
|
(1,592 |
) |
|
|
(4,088 |
) |
|
|
(1,828 |
) |
|
|
|
(5,946 |
) |
|
|
11,638 |
|
|
Income tax benefit (provision) |
|
|
(20,601 |
) |
|
|
15,302 |
|
|
|
1,756 |
|
|
|
993 |
|
|
|
(1,478 |
) |
|
|
|
(2,550 |
) |
|
|
(2,798 |
) |
|
Income (loss) from discontinued operations |
|
|
1,671 |
|
|
|
4,112 |
|
|
|
32,876 |
|
|
|
1,485 |
|
|
|
6,069 |
|
|
|
|
40,144 |
|
|
|
34,900 |
|
|
Gain (loss) on disposal of discontinued operations |
|
|
47,808 |
|
|
|
- |
|
|
|
- |
|
|
|
- |
|
|
|
- |
|
|
|
|
47,808 |
|
|
|
- |
|
|
Net income (loss) |
|
$ |
24,731 |
|
|
$ |
9,440 |
|
|
$ |
26,405 |
|
|
$ |
(10,503 |
) |
|
$ |
11,960 |
|
|
|
$ |
50,073 |
|
|
$ |
63,493 |
|
22
Total gross assets equals total assets plus accumulated depreciation as these captions are reported on the consolidated balance sheet. The following table provides a reconciliation of total assets to total gross assets.
|
|
As of |
|
|||||||||||||||||
|
|
December 31, 2016 |
|
|
September 30, 2016 |
|
|
June 30, 2016 |
|
|
March 31, 2016 |
|
|
December 31, 2015 |
|
|||||
|
Total Assets |
$ |
2,406,843 |
|
|
$ |
3,882,531 |
|
|
$ |
4,040,064 |
|
|
$ |
4,317,770 |
|
|
$ |
4,415,928 |
|
|
Plus: Accumulated Depreciation (a) |
|
138,214 |
|
|
|
209,437 |
|
|
|
209,096 |
|
|
|
209,421 |
|
|
|
198,326 |
|
|
Plus: Accumulated Amortization (b) (c) |
|
11,245 |
|
|
|
26,247 |
|
|
|
25,926 |
|
|
|
24,422 |
|
|
|
19,781 |
|
|
Total Gross Assets |
$ |
2,556,302 |
|
|
$ |
4,118,215 |
|
|
$ |
4,275,086 |
|
|
$ |
4,551,613 |
|
|
$ |
4,634,035 |
|
|
|
(a) |
Includes accumulated depreciation from discontinued operations. |
|
|
(b) |
Includes accumulated amortization from discontinued operations. |
|
|
(c) |
Represents accumulated amortization of real estate-related intangible assets and liabilities. |
23