Attached files
| file | filename |
|---|---|
| EX-32.1 - EXHIBIT 32.1 - PhenixFIN Corp | v451143_ex32-1.htm |
| EX-31.2 - EXHIBIT 31.2 - PhenixFIN Corp | v451143_ex31-2.htm |
| EX-31.1 - EXHIBIT 31.1 - PhenixFIN Corp | v451143_ex31-1.htm |
| EX-21.1 - EXHIBIT 21.1 - PhenixFIN Corp | v451143_ex21-1.htm |
UNITED STATES
SECURITIES AND EXCHANGE COMMISSION
WASHINGTON, DC 20549
Form 10-K
| (Mark One) | |
| x | ANNUAL REPORT PURSUANT TO SECTION 13 OR 15(d) OF THE SECURITIES EXCHANGE ACT OF 1934 |
| For the fiscal year ended September 30, 2016 | |
| or | |
| ¨ | TRANSITION REPORT PURSUANT TO SECTION 13 OR 15(d) OF THE SECURITIES EXCHANGE ACT OF 1934 |
For the transition period from to
Commission file number: 1-35040
MEDLEY CAPITAL CORPORATION
(Exact Name of Registrant as Specified in its Charter)
| Delaware | 27-4576073 | |
| (State or Other Jurisdiction of | (I.R.S. Employer | |
| Incorporation or Organization) | Identification No.) | |
| 280 Park Avenue, 6th Floor East, New York, NY 10017 | 10017 | |
| (Address of Principal Executive Offices) | (Zip Code) |
(212) 759-0777
(Registrant’s Telephone Number, Including Area Code)
Securities registered pursuant to Section 12(b) of the Act:
| Title of Each Class | Name of Each Exchange on Which Registered | |
| Common Stock, par value $0.001 per share | The New York Stock Exchange | |
| 7.125% Notes due 2019 | The New York Stock Exchange | |
| 6.500% Notes due 2021 | The New York Stock Exchange | |
| 6.125% Notes due 2023 | The New York Stock Exchange |
Securities registered pursuant to Section 12(g) of the Act: None
Indicate by check mark if the registrant is a well-known seasoned issuer, as defined in Rule 405 of the Securities Act. Yes ¨ No x
Indicate by check mark if the registrant is not required to file reports pursuant to Section 13 or 15(d) of the Act. Yes ¨ No x
Indicate by check mark whether the registrant: (1) has filed all reports required to be filed by Section 13 or 15(d) of the Securities Exchange Act of 1934 during the preceding 12 months (or for such shorter period that the registrant was required to file such reports), and (2) has been subject to such filing requirements for the past 90 days. Yes x No ¨
Indicate by check mark if disclosure of delinquent filers pursuant to Item 405 of Regulation S-K is not contained herein, and will not be contained, to the best of the registrant’s knowledge, in definitive proxy or information statements incorporated by reference in Part III of this Form 10-K or any amendment to this Form 10-K. x
Indicate by check mark whether the registrant has submitted electronically and posted on its corporate Web site, if any, every Interactive Data File required to be submitted and posted pursuant to Rule 405 of Regulation S-T (§232.405 of this chapter) during the preceding 12 months (or for such shorter period that the registrant was required to submit and post such files). Yes ¨ No ¨
Indicate by check mark whether the registrant is a large accelerated filer, an accelerated filer, a non-accelerated filer or a smaller reporting company. See definitions of “large accelerated filer”, “accelerated filer” and “smaller reporting company” in Rule 12b-2 of the Exchange Act. (Check one):
Large accelerated filer ¨ Accelerated filer x Non-accelerated filer ¨ Smaller reporting company ¨
Indicate by check mark whether the registrant is a shell company (as defined in Rule 12b-2 of the Securities Exchange Act of 1934). Yes ¨ No x
The aggregate market value of the Registrant’s common stock held by non-affiliates of the Registrant as of March 31, 2016 was $358,696,149. The Registrant had 54,474,211 shares of common stock, $0.001 par value, outstanding as of December 8, 2016.
DOCUMENTS INCORPORATED BY REFERENCE
Portions of the registrant’s proxy statement to be filed with the Securities and Exchange Commission pursuant to Regulation 14A in connection with the registrant’s 2016 Annual Meeting of Stockholders, which will be filed subsequent to the date hereof, are incorporated by reference into Part III of this Form 10-K. Such proxy statement will be filed with the Securities and Exchange Commission not later than 120 days following the end of the Registrant’s fiscal year ended September 30, 2016.
MEDLEY CAPITAL CORPORATION
TABLE OF CONTENTS
| 2 |
In this annual report on Form 10-K, except as otherwise indicated, the terms:
| · | “we”, “us”, “our”, “Medley Capital” and the “Company” refer to Medley Capital Corporation, a Delaware corporation, and its subsidiaries for the periods after our consummation of the formation transaction and to Medley Capital BDC LLC, a Delaware limited liability company, for the periods prior to our consummation of the formation transaction described elsewhere in this Form 10-K; |
| · | “MCC Advisors” and the “Adviser” refer to MCC Advisors LLC, our investment adviser; MCC Advisors is a majority owned subsidiary of Medley LLC, which is controlled by Medley Management Inc., a publicly traded asset management firm, which in turn is controlled by Medley Group LLC, an entity wholly-owned by the senior professionals of Medley LLC; and |
| · | “Medley” refers, collectively, to the activities and operations of Medley Capital LLC, Medley LLC, Medley Management Inc., Medley Group LLC, MCC Advisors, associated investment funds and their respective affiliates. |
GENERAL
Medley Capital Corporation is a non-diversified closed end management investment company incorporated in Delaware that has elected to be treated and is regulated as a business development company (“BDC”) under the Investment Company Act of 1940, as amended (the “1940 Act”). We completed our initial public offering (“IPO”) and commenced operations on January 20, 2011. The Company has elected and qualified to be treated for U.S. federal income tax purposes as a regulated investment company (“RIC”) under subchapter M of the Internal Revenue Code of 1986, as amended (the “Code”), commencing with our first taxable year as a corporation, and we intend to operate in a manner so as to maintain our RIC tax treatment. We are externally managed and advised by our investment adviser, MCC Advisors, pursuant to an investment management agreement.
Our investment objective is to generate current income and capital appreciation by lending directly to privately held middle market companies, primarily through directly originated transactions to help these companies expand their business, refinance and make acquisitions. Our investment portfolio generally consists of senior secured first lien term loans and senior secured second lien term loans. In connection with many of our investments, we receive warrants or other equity participation features which we believe will increase the total investment returns.
We believe the middle-market private debt market is undergoing structural shifts that are creating significant opportunities for non-bank lenders and investors. The underlying drivers of these structural changes include: reduced participation by banks in the private debt markets, particularly within the middle-market, and demand for private debt created by committed and uninvested private equity capital. We focus on taking advantage of this structural shift by lending directly to companies that are underserved by the traditional banking system and generally seek to avoid broadly marketed investment opportunities. We source investment opportunities through direct relationships with companies, financial intermediaries such as national, regional and local bankers, accountants, lawyers and consultants, as well as through financial sponsors. As a leading provider of private debt, Medley is often sought out as a preferred financing partner.
Our investment activities are managed by our investment adviser, MCC Advisors, which is an investment adviser registered under the Investment Advisers Act of 1940, as amended. MCC Advisors is an affiliate of Medley and has offices in New York and San Francisco. Our Investment Team, which is provided for by MCC Advisors, is responsible for sourcing investment opportunities, conducting industry research, performing diligence on potential investments, structuring our investments and monitoring our portfolio companies on an ongoing basis. MCC Advisors’ team draws on its expertise in lending to predominantly privately held borrowers in a range of sectors, including industrials, and transportation, energy and natural resources, financials and real estate. In addition, MCC Advisors seeks to diversify our portfolio of loans by company type, asset type, transaction size, industry and geography.
Our Investment Team has on average over 21 years of experience in the credit business, including originating, underwriting, principal investing and loan structuring. Our Advisor, through Medley, has access to over 89 employees, including over 45 investment, origination and credit management professionals, and over 44 operations, marketing and distribution professionals, each with extensive experience in their respective disciplines. We believe that MCC Advisors’ disciplined and consistent approach to origination, portfolio construction and risk management should allow it to achieve compelling risk-adjusted returns for Medley Capital.
| 3 |
MCC Advisors also serves as our administrator and provides us with office space, equipment and other office services. The responsibilities of our administrator include overseeing our financial records, preparing reports to our stockholders and reports filed with the Securities and Exchange Commission (the “SEC”) and generally monitoring the payment of our expenses and the performance of administrative and professional services rendered to us by others.
As a BDC, we are required to comply with regulatory requirements, including limitations on our use of debt. We are permitted to, and expect to continue to, finance our investments through borrowings. However, as a BDC, we are only generally allowed to borrow amounts such that our asset coverage, as defined in the 1940 Act, equals at least 200% after such borrowing. The amount of leverage that we employ will depend on our assessment of market conditions and other factors at the time of any proposed borrowing.
On November 25, 2013, we received an amended order from the SEC (the “Co-Investment Order”) that expanded our ability to negotiate the terms of co-investment transactions with other funds managed by MCC Advisors or its affiliates, including Sierra Income Corporation, a non-traded business development company, subject to the conditions included therein. In situations where co-investment with other funds managed by MCC Advisors or its affiliates is not permitted or appropriate, such as when there is an opportunity to invest in different securities of the same issuer or where the different investments could be expected to result in a conflict between our interests and those of other MCC Advisors clients, MCC Advisors will need to decide which client will proceed with the investment. MCC Advisors will make these determinations based on its policies and procedures, which generally require that such opportunities be offered to eligible accounts on an alternating basis that will be fair and equitable over time. Moreover, except in certain circumstances, we will be unable to invest in any issuer in which a fund managed by MCC Advisors or its affiliates has previously invested. Similar restrictions limit our ability to transact business with our officers or directors or their affiliates.
Under the terms of the relief set forth in the Co-Investment Order permitting us to co-invest with other funds managed by MCC Advisors or its affiliates, a “required majority” (as defined in Section 57(o) of the 1940 Act) of our independent directors must make certain conclusions in connection with a co-investment transaction, including that (1) the terms of the proposed transaction, including the consideration to be paid, are reasonable and fair to us and our stockholders and do not involve overreaching of us or our stockholders on the part of any person concerned and (2) the transaction is consistent with the interests of our stockholders and is consistent with our investment objectives and strategies. On July 26, 2016, the Company, MCC Advisors and certain other affiliated funds and investment advisers filed an exemptive application for a co-investment order that would supersede the Exemptive Order and allow affiliated registered investment companies to participate in co-investment transactions with us that would otherwise be prohibited under Section 17(d) and 57(a)(4) and Rule 17d-1. The Exemptive Order will remain in effect unless and until the revised application is approved by the SEC. The terms of the revised application are substantially similar to the Exemptive Order.
On March 26, 2013, our wholly-owned subsidiary, Medley SBIC LP (“SBIC LP”), a Delaware limited partnership, received a license from the Small Business Administration (“SBA”) to operate as a Small Business Investment Company (“SBIC”) under Section 301(c) of the Small Business Investment Company Act of 1958.
The SBIC license allows SBIC LP to obtain leverage by issuing SBA-guaranteed debentures, subject to the issuance of a capital commitment by the SBA and other customary procedures. SBA-guaranteed debentures are non-recourse, interest only debentures with interest payable semi-annually and have a ten year maturity. The principal amount of SBA-guaranteed debentures is not required to be paid prior to maturity but may be prepaid at any time without penalty. The interest rate of SBA-guaranteed debentures is fixed on a semi-annual basis at a market-driven spread over U.S. Treasury Notes with 10-year maturities. The SBA, as a creditor, will have a superior claim to SBIC LP’s assets over our stockholders in the event we liquidate SBIC LP or the SBA exercises its remedies under the SBA-guaranteed debentures issued by SBIC LP upon an event of default.
SBA regulations currently limit the amount that SBIC LP may borrow to a maximum of $150 million when it has at least $75 million in regulatory capital, receives a capital commitment from the SBA and has been through an examination by the SBA subsequent to licensing.
On November 16, 2012, we obtained exemptive relief from the SEC to permit us to exclude the debt of SBIC LP guaranteed by the SBA from our 200% asset coverage test under the 1940 Act. The exemptive relief provides us with increased flexibility under the 200% asset coverage test by permitting us to borrow, through SBIC LP, up to $150 million more than we would otherwise be able to absent the receipt of this exemptive relief.
Our principal executive office is located at 280 Park Avenue, 6th Floor East, New York, NY 10017 and our telephone number is (212) 759-0777.
Formation Transactions
Medley Capital BDC LLC (the “LLC”), a Delaware limited liability company, was formed on April 23, 2010.
Prior to the pricing of our IPO, Medley Opportunity Fund LP (“MOF LP”), a Delaware limited partnership, and Medley Opportunity Fund, Ltd. (“MOF LTD”), a Cayman Islands exempted limited liability company, transferred all of their respective interests in six loan participations in secured loans to middle market companies with a combined fair value, plus payment-in-kind interest and accrued interest thereon, of approximately $84.95 million (the “Loan Assets”) to MOF I BDC LLC, a Delaware limited liability company (“MOF I BDC”) in exchange for membership interests in MOF I BDC. As a result, MOF LTD owned approximately 90% of the outstanding MOF I BDC membership interests and MOF LP owned approximately 10% of the outstanding MOF I BDC membership interests. On January 18, 2011, each of MOF LTD and MOF LP contributed their respective MOF I BDC membership interests to the LLC in exchange for LLC membership interests. As a result, MOF I BDC became a wholly-owned subsidiary of the LLC.
| 4 |
On January 18, 2011, the LLC converted into Medley Capital Corporation, a Delaware corporation. As a result, MOF LTD and MOF LP’s LLC membership interests were exchanged for 5,759,356 shares of the Company’s common stock at $14.75 per share. On January 20, 2011, the Company filed an election to be regulated as a BDC under the 1940 Act.
On January 20, 2011, we priced our IPO and sold 11,111,112 shares of common stock at $12.00 per share. On February 24, 2011, an additional 450,000 shares of our common stock were issued at a price of $12.00 per share pursuant to the partial exercise of the underwriters’ over-allotment option. Net of underwriting fees and estimated offering costs, the Company raised a total of approximately $129.6 million. Our shares began trading on January 20, 2011 on the New York Stock Exchange under the symbol “MCC.”
Investment Process Overview
We view our investment process as consisting of three distinct phases described below:
Sourcing and Origination MCC Advisors sources investment opportunities through access to a network of contacts developed in the financial services and related industries by Medley. It is the Adviser’s responsibility to identify specific opportunities, to refine opportunities through rigorous due diligence of the underlying facts and circumstances while remaining flexible and responsive to client’s needs. With a total of over 45 investment professionals in the New York and San Francisco offices involved in sourcing and origination for MCC Advisors, each investment professional is able to maintain long-standing relationships and responsibility for a specified market. Each quarter, these origination efforts attract hundreds of inquiries from potential middle market borrowers.
An investment pipeline is maintained to manage all prospective investment opportunities and is reviewed weekly by the Investment Committee of MCC Advisors (“Investment Committee”). The purpose of the investment pipeline, which is comprised of all prospective investment opportunities at various stages of due diligence and approval, is to evaluate, monitor and approve all of our investments, subject to the oversight of our Investment Committee.
Credit Evaluation We utilize a systematic, consistent approach to credit evaluation developed by Medley, with a particular focus on determining the value of a business in a downside scenario. The key criteria that we consider and attributes that we seek include: (i) strong and resilient underlying business fundamentals; (ii) a substantial equity cushion in the form of capital ranking junior in the right of payment to our investment; (iii) sophisticated management teams with a minimum operating history of two years; (iv) a conclusion that overall downside risk is manageable; (v) collateral support in the form of accounts receivable, inventory, machinery, equipment, real estate, IP, overall enterprise value and other assets; and (vi) limited requirements for future financing beyond the proposed commitment. The first review of an opportunity is conducted using the above-mentioned analysis to determine if the opportunity meets MCC Advisors general investment criteria. The next three reviews performed by the Investment Committee include the following: (1) an Early Read Memo, (2) a Green Light Memo, and (3) Investment Committee approval memo. MCC Advisors maintains a rigorous in-house due diligence process. Prior to making each investment, MCC Advisors subjects each potential portfolio company to an extensive credit review process, including analysis of market and operational dynamics as well as both historical and projected financial information. Areas of additional focus include management or sponsor experience, industry and competitive dynamics, and tangible asset values. Background checks and tax compliance checks are typically required on all portfolio company management teams.
Our due diligence process typically entails:
| · | negotiation and execution of a term sheet; |
| · | on-site visits; |
| · | interviews with management, employees, customers and vendors; |
| · | review of loan documents and material contracts, as applicable; |
| · | obtaining background checks on all principals/partners/founders; |
| · | completing customer and supplier calls; |
| · | review of tax and accounting issues related to a contemplated capital structure; |
| 5 |
| · | developing a financial model with sensitivity analysis that includes a management case, expected case and downside case; |
| · | receiving third party reports such as environmental, appraisal and consulting reports, as applicable. |
Monitoring MCC Advisors views active portfolio monitoring as a vital part of our investment process. MCC Advisors utilizes a proprietary portfolio monitoring system, Asset Management System (“AMS”), which maintains a centralized, dynamic electronic reporting system which houses, organizes and archives all portfolio data by investment. This is the primary system that tracks all changes to investment terms and conditions. AMS produces a report for each investment within the portfolio by summarizing the investment’s general information, terms and structure, financial performance, covenant package, history of events and call notes. Each month, the previous month reports are archived and an updated report is created. This feature enables MCC Advisors to track the history of every investment, while maintaining access to the most recent reporting information available, ensuring accurate reporting of the investment.
MCC Advisors will typically require portfolio companies to adhere to certain affirmative covenants requiring the following reports:
| · | monthly financial statements | · | annual audits and management letters |
| · | monthly covenant certificates | · | quarterly industry updates |
| · | monthly management discussion & analysis | · | quarterly customer and supplier concentration updates |
| · | monthly bank statements | · | quarterly backlog/pipeline reports |
| · | annual insurance certificates | · | annual budgets and forecasts. |
MCC Advisors holds quarterly portfolio reviews where the Investment Committee reviews each transaction in detail and reassesses the risk rating presently assigned.
Rating Criteria In addition to external risk management research and internal monitoring tools, we use an investment rating system to characterize and monitor the credit profile and our expected level of returns on each investment in our portfolio. We use a five-level numeric rating scale. The following is a description of the conditions associated with each investment rating:
|
Credit Rating |
Definition | |
| 1 | Investments that are performing above expectations. | |
| 2 | Investments that are performing within expectations, with risks that are neutral or favorable compared to risks at the time of origination. | |
| All new loans are rated ‘2’. | ||
| 3 | Investments that are performing below expectations and that require closer monitoring, but where no loss of interest, dividend or principal is expected. | |
| Companies rated ‘3’ may be out of compliance with financial covenants, however, loan payments are generally not past due. |
| 4 | Investments that are performing below expectations and for which risk has increased materially since origination. | |
| Some loss of interest or dividend is expected but no loss of principal. | ||
| In addition to the borrower being generally out of compliance with debt covenants, loan payments may be past due (but generally not more than 180 days past due). | ||
| 5 | Investments that are performing substantially below expectations and whose risks have increased substantially since origination. | |
| Most or all of the debt covenants are out of compliance and payments are substantially delinquent. | ||
| Some loss of principal is expected. |
| 6 |
Investment Committee
The purpose of the Investment Committee, which is comprised of a minimum of three members selected from senior members of MCC Advisors’ Investment Team, is to evaluate and approve all of our investments. The Investment Committee process is intended to bring the diverse experience and perspectives of the committee’s members to the analysis and consideration of each investment. The Investment Committee serves to provide investment consistency and adherence to our core investment philosophy and policies. The Investment Committee also determines appropriate investment sizing and suggests ongoing monitoring requirements.
In addition to reviewing investments, Investment Committee meetings serve as a forum to discuss credit views and outlooks. Potential transactions and deal flow are reviewed on a regular basis. Members of the investment team are encouraged to share information and views on credits with the Investment Committee early in their analysis. We believe this process improves the quality of the analysis and assists the investment team members to work more efficiently.
Each transaction is presented to the Investment Committee in a formal written report. All of our new investments and the exit or sale of an existing investment must be approved by a majority vote of the Investment Committee, although unanimous agreement is sought.
Investment Structure
Once we have determined that a prospective portfolio company is suitable for investment, we work with the management of that company and its other capital providers to structure an investment. We negotiate among these parties to agree on how our investment is expected to perform relative to the other capital in the portfolio company’s capital structure.
We structure our investments, which typically have maturities of three to seven years, as follows:
Senior Secured First Lien Term Loans We structure these investments as senior secured loans. We obtain security interests in the assets of the portfolio companies that serve as collateral in support of the repayment of such loans. This collateral generally takes the form of first-priority liens on the assets of the portfolio company borrower. Our senior secured loans may provide for amortization of principal with the majority of the amortization due at maturity.
Senior Secured Second Lien Term Loans We structure these investments as junior, secured loans. We obtain security interests in the assets of these portfolio companies that serves as collateral in support of the repayment of such loans. This collateral generally takes the form of second-priority liens on the assets of a portfolio company. These loans typically provide for amortization of principal in the initial years of the loans, with the majority of the amortization due at maturity.
Senior Secured First Lien Notes We structure these investments as senior secured loans. We obtain security interests in the assets of these portfolio companies that serve as collateral in support of the repayment of such loans. This collateral generally takes the form of priority liens on the assets of a portfolio company. These loans typically have interest-only payments (often representing a combination of cash pay and payment-in-kind, or PIK interest), with amortization of principal due at maturity. PIK interest represents contractually deferred interest added to the loan balance that is generally due at the end of the loan term and recorded as interest income on an accrual basis to the extent such amounts are expected to be collected.
Warrants and Minority Equity Securities In some cases, we may also receive nominally priced warrants or options to buy a minority equity interest in the portfolio company in connection with a debt investment. As a result, as a portfolio company appreciates in value, we may achieve additional investment return from this equity interest. We may structure such warrants to include provisions protecting our rights as a minority-interest holder, as well as a “put,” or right to sell such securities back to the issuer, upon the occurrence of specified events. In many cases, we may also seek to obtain registration rights in connection with these equity interests, which may include demand and “piggyback” registration rights.
Unitranche Loans We structure our unitranche loans, which combine the characteristics of traditional senior secured first lien term loans and subordinated notes as senior secured loans. We obtain security interests in the assets of these portfolio companies that serve as collateral in support of the repayment of these loans. This collateral generally takes the form of first-priority liens on the assets of a portfolio company. Unitranche loans typically provide for amortization of principal in the initial years of the loans, with the majority of the amortization due at maturity.
Unsecured Debt We structure these investments as unsecured, subordinated loans that provide for relatively high, fixed interest rates that provide us with significant current interest income. These loans typically have interest-only payments (often representing a combination of cash pay and payment-in-kind, or PIK interest), with amortization of principal due at maturity. Subordinated notes generally allow the borrower to make a large lump sum payment of principal at the end of the loan term, and there is a risk of loss if the borrower is unable to pay the lump sum or refinance the amount owed at maturity. Subordinated notes are generally more volatile than secured loans and may involve a greater risk of loss of principal. Subordinated notes often include a PIK feature, which effectively operates as negative amortization of loan principal.
| 7 |
We tailor the terms of each investment to the facts and circumstances of the transaction and the prospective portfolio company, negotiating a structure that protects our rights and manages our risk while creating incentives for the portfolio company to achieve its business plan and improve its operating results. We seek to limit the downside potential of our investments by:
| · | selecting investments that we believe have a low probability of loss of principal; |
| · | requiring a total return on our investments (including both interest and potential equity appreciation) that we believe will compensate us appropriately for credit risk; and |
| · | negotiating covenants in connection with our investments that afford our portfolio companies as much flexibility in managing their businesses as possible, consistent with the preservation of our capital. Such restrictions may include affirmative and negative covenants, default penalties, lien protection, change of control provisions and board rights, including either observation or rights to a seat on the board of directors under some circumstances. |
We expect to hold most of our investments to maturity or repayment, but we may realize or sell some of our investments earlier if a liquidity event occurs, such as a sale or recapitalization transaction, or the worsening of the credit quality of the portfolio company.
Managerial Assistance
As a BDC, we offer, and must provide upon request, managerial assistance to certain of our portfolio companies. This assistance could involve, among other things, monitoring the operations of our portfolio companies, participating in board and management meetings, consulting with and advising officers of portfolio companies and providing other organizational and financial guidance. MCC Advisors provides such managerial assistance on our behalf to portfolio companies that request this assistance. We may receive fees for these services and will reimburse MCC Advisors, as our administrator, for its allocated costs in providing such assistance, subject to the review and approval by our board of directors, including our independent directors.
Leverage
Through our Senior Secured Term Loan Credit Agreement, as amended (the ‘‘Term Loan Facility’’) and Senior Secured Revolving Credit Agreement, as amended (the ‘‘Revolving Credit Facility’’ and, collectively with the Term Loan Facility, as amended, the ‘‘Facilities’’), we borrow funds to make additional investments, a practice known as ‘‘leverage,’’ to attempt to increase return to our common stockholders. The amount of leverage that we employ at any particular time will depend on our investment advisers’ and our board of directors’ assessments of market and other factors at the time of any proposed borrowing. As of December 8, 2016, total commitments under the Facilities are $517.5 million, comprised of $343.5 million committed to the Revolving Credit Facility and $174.0 million committed to the Term Loan Facility. With these additional commitments, the Company has exercised the aggregate accordion feature permitting subsequent increases to the Facilities up to an aggregate maximum amount of $600.0 million. We are also subject to certain regulatory requirements relating to our borrowings. For a discussion of such requirements, see ‘‘Regulation — Senior Securities’’ and ‘‘Regulation — Small Business Investment Company Regulations.’’
We may from time to time seek to retire or repurchase our common stock through cash purchases, as well as retire, cancel or purchase our outstanding debt through cash purchases and/or exchanges, in open market purchases, privately negotiated transactions or otherwise. Such repurchases or exchanges, if any, will depend on prevailing market conditions, our liquidity requirements, contractual and regulatory restrictions and other factors. The amounts involved may be material.
Competition
Our primary competitors to provide financing to private middle-market companies are public and private funds, commercial and investment banks, commercial finance companies, other BDCs, SBICs and private equity and hedge funds. Some competitors may have access to funding sources that are not available to us. In addition, some of our competitors may have higher risk tolerances or different risk assessments, which could allow them to consider a wider variety of investments and establish more relationships than us. Furthermore, many of our competitors are not subject to the regulatory restrictions that the 1940 Act imposes on us as a BDC or to the distribution and other requirements we must satisfy to maintain our favorable RIC tax status.
Employees
We do not have any employees. Our day-to-day investment operations are managed by our investment adviser. Our investment adviser employs a total of over 45 investment professionals, including its principals. In addition, we reimburse our administrator for the allocable portion of overhead and other expenses incurred by it in performing its obligations under an administration agreement, including the compensation of our chief financial officer and chief compliance officer, and their staff.
| 8 |
Administration
We have entered into an administration agreement, pursuant to which MCC Advisors furnishes us with office facilities, equipment and clerical, bookkeeping, recordkeeping and other administrative services at such facilities. Under our administration agreement, MCC Advisors performs, or oversees the performance of, our required administrative services, which include, among other things, being responsible for the financial records which we are required to maintain and preparing reports to our stockholders and reports filed with the SEC.
Information Available
We maintain a website at http://www.medleycapitalcorp.com . We make available, free of charge, on our website, our annual report on Form 10-K, quarterly reports on Form 10-Q, current reports on Form 8-K and amendments to those reports as soon as reasonably practicable after we electronically file such material with, or furnish it to, the U.S. Securities and Exchange Commission, or SEC. Information contained on our website is not incorporated by reference into this annual report on Form 10-K and you should not consider information contained on our website to be part of this annual report on Form 10-K or any other report we file with the SEC.
INVESTMENTS
We have built a diverse portfolio that includes senior secured first lien term loans, senior secured second lien term loans, unitranche, senior secured first lien notes, subordinated notes and warrants and minority equity securities by investing approximately $10 million to $50 million of capital, on average, in the securities of middle-market companies.
The following table shows the portfolio composition by industry grouping at fair value at September 30, 2016 (dollars in thousands):
| Fair Value | Percentage | |||||||
| Services: Business | $ | 123,703 | 13.5 | % | ||||
| Banking, Finance, Insurance & Real Estate | 96,207 | 10.5 | ||||||
| Construction & Building | 91,087 | 10.0 | ||||||
| Hotel, Gaming & Leisure | 68,605 | 7.5 | ||||||
| Automotive | 60,303 | 6.6 | ||||||
| Healthcare & Pharmaceuticals | 57,041 | 6.2 | ||||||
| Energy: Oil & Gas | 52,646 | 5.8 | ||||||
| Aerospace & Defense | 51,656 | 5.6 | ||||||
| Telecommunications | 44,015 | 4.8 | ||||||
| Containers, Packaging & Glass | 42,197 | 4.6 | ||||||
| Chemicals, Plastics & Rubber | 32,640 | 3.6 | ||||||
| Multisector Holdings | 31,252 | 3.4 | ||||||
| Beverage & Food | 30,225 | 3.3 | ||||||
| Capital Equipment | 29,756 | 3.3 | ||||||
| Consumer goods: Durable | 24,696 | 2.7 | ||||||
| Metals & Mining | 20,246 | 2.2 | ||||||
| High Tech Industries | 14,489 | 1.6 | ||||||
| Retail | 12,565 | 1.4 | ||||||
| Services: Consumer | 9,440 | 1.0 | ||||||
| Media: Broadcasting & Subscription | 7,832 | 0.9 | ||||||
| Consumer goods: Non-durable | 7,208 | 0.8 | ||||||
| Wholesale | 6,375 | 0.7 | ||||||
| Total | $ | 914,184 | 100.0 | % | ||||
| 9 |
The following table shows the portfolio composition by industry grouping at fair value at September 30, 2015 (dollars in thousands):
| Fair Value | Percentage | |||||||
| Services: Business | $ | 161,700 | 13.3 | % | ||||
| Construction & Building | 103,939 | 8.6 | ||||||
| Banking, Finance, Insurance & Real Estate | 101,899 | 8.4 | ||||||
| Automotive | 99,414 | 8.2 | ||||||
| Healthcare & Pharmaceuticals | 92,258 | 7.6 | ||||||
| Metals & Mining | 90,469 | 7.4 | ||||||
| Hotel, Gaming & Leisure | 73,821 | 6.1 | ||||||
| Aerospace & Defense | 69,885 | 5.7 | ||||||
| Energy: Oil & Gas | 63,339 | 5.2 | ||||||
| Containers, Packaging & Glass | 58,766 | 4.8 | ||||||
| Chemicals, Plastics & Rubber | 46,548 | 3.8 | ||||||
| Retail | 43,399 | 3.6 | ||||||
| Telecommunications | 40,519 | 3.3 | ||||||
| Beverage & Food | 39,575 | 3.3 | ||||||
| Capital Equipment | 29,764 | 2.4 | ||||||
| Consumer goods: Durable | 24,715 | 2.0 | ||||||
| Services: Consumer | 17,000 | 1.4 | ||||||
| High Tech Industries | 14,774 | 1.2 | ||||||
| Multisector Holdings | 14,216 | 1.2 | ||||||
| Consumer goods: Non-durable | 11,888 | 1.0 | ||||||
| Consumer Discretionary | 10,000 | 0.8 | ||||||
| Media: Broadcasting & Subscription | 7,744 | 0.6 | ||||||
| Transportation: Cargo | 460 | 0.1 | ||||||
| Total | $ | 1,216,092 | 100.0 | % | ||||
The following table sets forth certain information as of September 30, 2016, for each portfolio company in which we had an investment. Other than these Investments, our only formal relationship with our portfolio companies is the managerial assistance that we provide upon request and the board observer or participation rights we may receive in connection with our investment.
| 10 |
| Name of Portfolio Company | Sector | Security Owned by Us | Maturity | Interest Rate(1) | Principal Due at Maturity | Fair Value | Percentage
| |||||||||||||||
| AAR Intermediate Holdings, LLC | Energy: Oil & Gas | Senior Secured First Lien Term Loan A | 9/30/2021 | 6.00 | % | 8,984,232 | 8,984,232 | 1.7 | % | |||||||||||||
| AAR Intermediate Holdings, LLC | Energy: Oil & Gas | Senior Secured First Lien Term Loan B | 9/30/2021 | 9.00 | % | 18,451,002 | 14,889,405 | 2.9 | % | |||||||||||||
| AAR Intermediate Holdings, LLC | Energy: Oil & Gas | Revolver | 9/30/2021 | 6.00 | % | - | - | - | ||||||||||||||
| AAR Intermediate Holdings, LLC | Energy: Oil & Gas | Equity | - | - | - | - | ||||||||||||||||
| Access Media Holdings, LLC | Media: Broadcasting & Subscription | Senior Secured First Lien Term Loan | 7/22/2020 | 10.00 | % | 7,929,093 | 7,832,358 | 1.5 | % | |||||||||||||
| Access Media Holdings, LLC | Media: Broadcasting & Subscription | Preferred Equity Series A | - | 1,600,000 | - | - | ||||||||||||||||
| Access Media Holdings, LLC | Media: Broadcasting & Subscription | Preferred Equity Series AA | - | 616,000 | - | - | ||||||||||||||||
| Access Media Holdings, LLC | Media: Broadcasting & Subscription | Equity | - | - | - | - | ||||||||||||||||
| Accupac, Inc. | Containers, Packaging & Glass | Senior Secured Second Lien Term Loan | 7/14/2020 | 11.00 | % | 27,000,000 | 27,000,000 | 5.2 | % | |||||||||||||
| Advanced Diagnostic Holdings, LLC | Healthcare & Pharmaceuticals | Senior Secured First Lien Term Loan | 12/11/2020 | 9.63 | % | 15,262,608 | 15,701,560 | 3.0 | % | |||||||||||||
| Albertville Quality Foods, Inc. | Beverage & Food | Senior Secured First Lien Term Loan | 10/31/2018 | 10.50 | % | 15,972,097 | 16,131,818 | 3.1 | % | |||||||||||||
| Autosplice, Inc. | High Tech Industries | Senior Secured First Lien Term Loan | 6/30/2019 | 10.50 | % | 14,441,783 | 14,489,296 | 2.8 | % | |||||||||||||
| Backcountry.com, LLC | Retail | Senior Secured First Lien Term Loan | 6/30/2020 | 8.25 | % | 2,551,042 | 2,576,552 | 0.5 | % | |||||||||||||
| Be Green Packaging, LLC | Containers, Packaging & Glass | Equity | - | - | - | - | ||||||||||||||||
| Black Angus Steakhouses, LLC | Hotel, Gaming & Leisure | Senior Secured First Lien Term Loan | 4/24/2020 | 10.00 | % | 7,906,250 | 7,721,117 | 1.5 | % | |||||||||||||
| Black Angus Steakhouses, LLC | Hotel, Gaming & Leisure | Senior Secured First Lien Delayed Draw | 4/24/2020 | 10.00 | % | - | - | - | ||||||||||||||
| Black Angus Steakhouses, LLC | Hotel, Gaming & Leisure | Revolver | 4/24/2020 | 10.00 | % | 446,429 | 441,911 | 0.1 | % | |||||||||||||
| Brantley Transportation LLC | Energy: Oil & Gas | Senior Secured First Lien Term Loan | 8/2/2017 | 12.00 | % | 10,060,902 | 5,351,092 | 1.0 | % | |||||||||||||
| Brantley Transportation LLC | Energy: Oil & Gas | Senior Secured First Lien Delayed Draw | 8/2/2017 | 6.00 | % | 637,500 | 637,500 | 0.1 | % | |||||||||||||
| Brantley Transportation LLC | Energy: Oil & Gas | Equity | - | - | - | - | ||||||||||||||||
| Capstone Nutrition | Healthcare & Pharmaceuticals | Senior Secured First Lien Term Loan | 4/28/2019 | 13.50 | % | 22,784,841 | 14,615,564 | 2.8 | % | |||||||||||||
| Capstone Nutrition | Healthcare & Pharmaceuticals | Senior Secured First Lien Delayed Draw | 4/28/2019 | 13.50 | % | 9,858,981 | 6,324,142 | 1.2 | % | |||||||||||||
| Capstone Nutrition | Healthcare & Pharmaceuticals | Equity | - | - | - | - | ||||||||||||||||
| ConvergeOne Holdings Corporation | Telecommunications | Senior Secured Second Lien Term Loan | 6/17/2021 | 9.00 | % | 12,500,000 | 12,458,500 | 2.4 | % | |||||||||||||
| CP OPCO LLC | Services: Consumer | Senior Secured First Lien Term Loan A | 3/31/2019 | 5.50 | % | 2,805,273 | 2,805,273 | 0.6 | % | |||||||||||||
| CP OPCO LLC | Services: Consumer | Senior Secured First Lien Term Loan B | 3/31/2019 | 5.50 | % | 1,168,864 | 1,168,864 | 0.2 | % | |||||||||||||
| CP OPCO LLC | Services: Consumer | Senior Secured First Lien Term Loan C | 3/31/2019 | 7.00 | % | 8,204,394 | 4,102,197 | 0.8 | % | |||||||||||||
| CP OPCO LLC | Services: Consumer | Senior Secured First Lien Term Loan D | 3/31/2019 | 7.00 | % | 5,107,884 | - | - | ||||||||||||||
| CP OPCO LLC | Services: Consumer | Revolver | 3/31/2019 | 5.50 | % | 725,552 | 725,552 | 0.1 | % | |||||||||||||
| CP OPCO LLC | Services: Consumer | Revolver | 3/31/2019 | 7.00 | % | 638,486 | 638,486 | 0.1 | % | |||||||||||||
| CP OPCO LLC | Services: Consumer | Equity | - | - | - | - | ||||||||||||||||
| Crow Precision Components LLC | Aerospace & Defense | Senior Secured First Lien Term Loan | 9/30/2019 | 9.50 | % | 13,540,000 | 13,540,000 | 2.6 | % | |||||||||||||
| Crow Precision Components LLC | Aerospace & Defense | 9/30/2019 | - | - | 414,305 | 0.1 | % | |||||||||||||||
| DHISCO Electronic Distribution, Inc. | Hotel, Gaming & Leisure | Senior Secured First Lien Term Loan A | 11/10/2019 | 10.50 | % | 31,238,095 | 29,545,615 | 5.7 | % | |||||||||||||
| DHISCO Electronic Distribution, Inc. | Hotel, Gaming & Leisure | Senior Secured First Lien Term Loan B | 2/10/2018 | 10.50 | % | 6,982,024 | 6,587,260 | 1.3 | % | |||||||||||||
| DHISCO Electronic Distribution, Inc. | Hotel, Gaming & Leisure | Revolver | 5/10/2017 | 10.50 | % | - | - | - | ||||||||||||||
| DHISCO Electronic Distribution, Inc. | Hotel, Gaming & Leisure | Equity | - | - | 70,624 | 0.0 | % | |||||||||||||||
| DLR Restaurants LLC | Hotel, Gaming & Leisure | Senior Secured First Lien Term Loan | 4/18/2018 | 15.50 | % | 24,117,310 | 23,958,859 | 4.6 | % | |||||||||||||
| DLR Restaurants LLC | Hotel, Gaming & Leisure | Unsecured Debt | 4/18/2018 | 16.00 | % | 287,531 | 279,604 | 0.1 | % | |||||||||||||
| Dream Finders Homes, LLC | Construction & Building | Senior Secured First Lien Term Loan B | 10/1/2018 | 15.35 | % | 7,093,318 | 7,071,897 | 1.4 | % | |||||||||||||
| Dream Finders Homes, LLC | Construction & Building | Warrants | 10/1/2018 | - | - | 1,619,379 | 0.3 | % | ||||||||||||||
| Dynamic Energy Services International LLC | Energy: Oil & Gas | Senior Secured First Lien Term Loan | 3/6/2018 | 11.00 | % | 16,046,050 | 13,307,952 | 2.6 | % | |||||||||||||
| Essex Crane Rental Corp. | Construction & Building | Senior Secured First Lien Term Loan | 5/13/2019 | 13.50 | % | 23,190,922 | 1,159,546 | 0.2 | % | |||||||||||||
| 11 |
| Name of Portfolio Company | Sector | Security Owned by Us | Maturity | Interest Rate(1) | Principal Due at Maturity | Fair Value | Percentage
| |||||||||||||||
| FKI Security Group LLC | Capital Equipment | Senior Secured First Lien Term Loan | 3/30/2020 | 9.50 | % | 14,531,250 | 14,605,650 | 2.8 | % | |||||||||||||
| Footprint Acquisition LLC | Services: Business | Senior Secured First Lien Term Loan | 2/27/2020 | 8.52 | % | 5,250,102 | 5,340,509 | 1.0 | % | |||||||||||||
| Footprint Acquisition LLC | Services: Business | Preferred Equity | 8.75 | % | 5,749,795 | 5,749,508 | 1.1 | % | ||||||||||||||
| Footprint Acquisition LLC | Services: Business | Equity | - | - | 1,171,650 | 0.2 | % | |||||||||||||||
| Freedom Powersports LLC | Automotive | Senior Secured First Lien Term Loan | 9/26/2019 | 12.25 | % | 13,890,000 | 14,167,800 | 2.7 | % | |||||||||||||
| Harrison Gypsum, LLC | Construction & Building | Senior Secured First Lien Term Loan | 12/21/2018 | 10.50 | % | 53,776,985 | 51,930,283 | 10.1 | % | |||||||||||||
| Heligear Acquisition Co. | Aerospace & Defense | Senior Secured First Lien Note
| 10/15/2019 | 10.25 | % | 20,000,000 | 21,047,400 | 4.1 | % | |||||||||||||
| JD Norman Industries, Inc. | Automotive | Senior Secured First Lien Term Loan | 3/6/2019 | 12.77 | % | 21,300,000 | 20,219,025 | 3.9 | % | |||||||||||||
| Jordan Reses Supply Company, LLC | Healthcare & Pharmaceuticals | Senior Secured Second Lien Term Loan | 4/24/2020 | 12.00 | % | 20,000,000 | 20,400,000 | 4.0 | % | |||||||||||||
| Lighting Science Group Corporation | Containers, Packaging & Glass | Senior Secured Second Lien Term Loan | 2/19/2019 | 12.84 | % | 16,053,472 | 15,077,260 | 2.9 | % | |||||||||||||
| Lighting Science Group Corporation | Containers, Packaging & Glass | Warrants | 2/19/2024 | - | - | 120,000 | 0.0 | % | ||||||||||||||
| LSF9 Atlantis Holdings, LLC | Retail | Senior Secured First Lien Term Loan | 1/15/2021 | 10.00 | % | 9,750,000 | 9,988,485 | 1.9 | % | |||||||||||||
| Lydell Jewelry Design Studio, LLC | Consumer goods: Non-durable | Senior Secured First Lien Term Loan | 9/13/2018 | 14.50 | % | 15,576,447 | 5,707,522 | 1.1 | % | |||||||||||||
| Lydell Jewelry Design Studio, LLC | Consumer goods: Non-durable | Senior Secured First Lien Term Loan | 9/13/2018 | 6.50 | % | 1,500,000 | 1,500,000 | 0.3 | % | |||||||||||||
| Lydell Jewelry Design Studio, LLC | Consumer goods: Non-durable | Equity | - | - | - | - | ||||||||||||||||
| Lydell Jewelry Design Studio, LLC | Consumer goods: Non-durable | Equity | - | - | - | - | ||||||||||||||||
| MCC Senior Loan Strategy JV I LLC | Multisector Holdings | Equity | - | - | 31,252,416 | 6.0 | % | |||||||||||||||
| Merchant Cash and Capital, LLC | Banking, Finance, Insurance & Real Estate | Senior Secured First Lien Delayed Draw | 12/4/2016 | 11.00 | % | 17,033,522 | 17,033,522 | 3.3 | % | |||||||||||||
| Merchant Cash and Capital, LLC | Banking, Finance, Insurance & Real Estate | Senior Secured Second Lien Term Loan | 5/4/2017 | 12.00 | % | 15,000,000 | 14,999,250 | 2.9 | % | |||||||||||||
| Miratech Intermediate Holdings, Inc. | Automotive | Senior Secured First Lien Term Loan | 5/9/2019 | 10.00 | % | 12,695,105 | 12,478,272 | 2.5 | % | |||||||||||||
| Momentum Telecom, Inc. | Telecommunications | Senior Secured First Lien Term Loan | 3/10/2019 | 9.50 | % | 12,593,281 | 12,719,213 | 2.5 | % | |||||||||||||
| Nation Safe Drivers Holdings, Inc. | Banking, Finance, Insurance & Real Estate | Senior Secured Second Lien Term Loan | 9/29/2020 | 10.00 | % | 35,278,846 | 35,631,635 | 6.9 | % | |||||||||||||
| Nielsen & Bainbridge, LLC | Consumer goods: Durable | Senior Secured Second Lien Term Loan | 8/15/2021 | 10.25 | % | 25,000,000 | 24,696,000 | 4.8 | % | |||||||||||||
| NorthStar Group Services, Inc. | Construction & Building | Unsecured Debt | 10/24/2019 | 18.00 | % | 26,107,691 | 26,042,683 | 5.0 | % | |||||||||||||
| Omnivere, LLC | Services: Business | Senior Secured First Lien Term Loan | 5/5/2019 | 13.84 | % | 22,360,258 | 22,360,258 | 4.3 | % | |||||||||||||
| Omnivere, LLC | Services: Business | Unsecured Debt | 7/24/2025 | 8.00 | % | 22,808,291 | 11,336,861 | 2.2 | % | |||||||||||||
| Omnivere, LLC | Services: Business | Warrants | 5/5/2019 | - | - | - | - | |||||||||||||||
| Oxford Mining Company, LLC | Metals & Mining | Senior Secured First Lien Term Loan | 12/31/2018 | 12.25 | % | 20,661,469 | 20,245,760 | 3.9 | % | |||||||||||||
| The Plastics Group, Inc. | Chemicals, Plastics & Rubber | Senior Secured First Lien Term Loan | 2/28/2019 | 13.00 | % | 21,867,506 | 21,457,709 | 4.2 | % | |||||||||||||
| 12 |
| Name of Portfolio Company | Sector | Security Owned by Us | Maturity | Interest Rate(1) | Principal Due at Maturity | Fair Value | Percentage | |||||||||||||||
| Point.360 | Services: Business | Senior Secured First Lien Term Loan | 7/8/2020 | 6.33 | % | 1,953,269 | 1,849,160 | 0.4 | % | |||||||||||||
| Point.360 | Services: Business | Equity | - | - | 359,462 | 0.1 | % | |||||||||||||||
| Point.360 | Services: Business | Warrants | 7/8/2020 | - | - | 243,317 | 0.1 | % | ||||||||||||||
| Prestige Industries LLC | Services: Business | Senior Secured Second Lien Term Loan | 11/1/2017 | 13.00 | % | 7,679,806 | 2,818,258 | 0.6 | % | |||||||||||||
| Prestige Industries LLC | Services: Business | Warrants | 11/1/2017 | - | - | - | - | |||||||||||||||
| Prince Mineral Holdings Corp. | Wholesale | Senior Secured First Lien Note | 12/15/2019 | 11.50 | % | 6,800,000 | 6,375,000 | 1.2 | % | |||||||||||||
| Reddy Ice Corporation | Beverage & Food | Senior Secured Second Lien Term Loan | 11/1/2019 | 10.75 | % | 17,000,000 | 14,092,830 | 2.7 | % | |||||||||||||
| Response Team Holdings, LLC | Construction & Building | Preferred Equity | 12.00 | % | 6,256,390 | 3,262,707 | 0.6 | % | ||||||||||||||
| Response Team Holdings, LLC | Construction & Building | Warrants | 3/28/2019 | - | - | - | - | |||||||||||||||
| Safeworks, LLC | Capital Equipment | Unsecured Debt | 1/31/2020 | 12.00 | % | 15,000,000 | 15,150,000 | 2.9 | % | |||||||||||||
| Sendero Drilling Company, LLC | Energy: Oil & Gas | Senior Secured First Lien Term Loan | 3/18/2019 | 11.52 | % | 3,996,312 | 4,076,238 | 0.8 | % | |||||||||||||
| Sendero Drilling Company, LLC | Energy: Oil & Gas | Warrants | 3/18/2019 | - | - | 5,399,817 | 1.1 | % | ||||||||||||||
| Seotowncenter, Inc. | Services: Business | Senior Secured First Lien Term Loan | 9/11/2019 | 10.00 | % | 24,699,566 | 24,212,737 | 4.7 | % | |||||||||||||
| Seotowncenter, Inc. | Services: Business | Equity | - | - | 139,602 | 0.0 | % | |||||||||||||||
| Ship Supply Acquisition Corporation | Services: Business | Senior Secured First Lien Term Loan | 7/31/2020 | 9.00 | % | 8,073,731 | 8,151,400 | 1.6 | % | |||||||||||||
| Stancor, Inc. | Services: Business | Senior Secured First Lien Term Loan | 8/19/2019 | 8.75 | % | 5,090,909 | 5,090,909 | 1.0 | % | |||||||||||||
| Stancor, Inc. | Services: Business | Equity | - | - | 125,830 | 0.0 | % | |||||||||||||||
| T Residential Holdings, LLC | Banking, Finance, Insurance & Real Estate | Senior Secured First Lien Term Loan | 3/28/2019 | 12.00 | % | 18,500,000 | 18,542,920 | 3.6 | % | |||||||||||||
| Taylored Freight Services, LLC | Services: Business | Senior Secured Second Lien Term Loan | 11/1/2017 | 13.00 | % | 15,040,795 | 14,841,956 | 2.9 | % | |||||||||||||
| Tenere Acquisition Corp. | Chemicals, Plastics, & Rubber | Senior Secured First Lien Term Loan | 12/15/2017 | 13.00 | % | 11,051,371 | 11,181,885 | 2.2 | % | |||||||||||||
| Transtelco, Inc. | Telecommunications | Senior Secured First Lien Term Loan | 11/19/2017 | 10.50 | % | 18,672,000 | 18,837,434 | 3.7 | % | |||||||||||||
| United Road Towing, Inc. | Services: Business | Senior Secured Second Lien Term Loan | 2/21/2020 | 9.84 | % | 18,725,607 | 18,725,607 | 3.6 | % | |||||||||||||
| United Road Towing, Inc. | Services: Business | Preferred Equity Class C | 2/21/2020 | 8.00 | % | 18,802,789 | 1,186,268 | 0.2 | % | |||||||||||||
| United Road Towing, Inc. | Services: Business | Preferred Equity Class C-1 | 2/21/2020 | 8.00 | % | 2,990,965 | - | - | ||||||||||||||
| United Road Towing, Inc. | Services: Business | Preferred Equity Class A-2 | 2/21/2020 | 8.00 | % | 5,409,618 | - | - | ||||||||||||||
| United Road Towing, Inc. | Services: Business | Equity | - | - | - | - | ||||||||||||||||
| US Multifamily, LLC | Banking, Finance, Insurance & Real Estate | Senior Secured First Lien Term Loan | 9/10/2019 | 10.00 | % | 6,670,000 | 6,670,000 | 1.3 | % | |||||||||||||
| US Multifamily, LLC | Banking, Finance, Insurance & Real Estate | Preferred Equity | - | - | 3,330,000 | 0.7 | % | |||||||||||||||
| Velocity Pooling Vehicle, LLC | Automotive | Senior Secured Second Lien Term Loan | 5/13/2022 | 8.25 | % | 24,000,000 | 12,795,840 | 2.5 | % | |||||||||||||
| Watermill-QMC Midco, Inc. | Automotive | Equity | - | - | 641,888 | 0.1 | % | |||||||||||||||
| Wheels Up Partners LLC | Aerospace & Defense | Senior Secured First Lien Delayed Draw | 10/15/2021 | 9.55 | % | 16,598,494 | 16,654,099 | 3.2 | % | |||||||||||||
| Total Portfolio Investments | $ | 999,944,105 | $ | 914,184,295 | 176.9 | % | ||||||||||||||||
| (1) | All interest is payable in cash and all LIBOR represents 1 and 3 Month LIBOR unless otherwise indicated. For each debt investment, we have provided the current interest rate as of September 30, 2016. |
| 13 |
As of September 30, 2016, the weighted average yield based upon original cost on our portfolio investments was approximately 11.8%, and 78.7% of our income-bearing investment portfolio bore interest based on floating rates, such as LIBOR, and 21.3% bore interest at fixed rates. The weighted average yield on income producing investments is computed based upon a combination of the cash flows to date and the contractual interest payments, principal amortization and fee notes due at maturity without giving effect to closing fees received, base management fees, incentive fees or general fund related expenses. Each floating rate loan uses LIBOR as its floating rate index. For each floating rate loan, the projected fixed-rate equivalent coupon rate used to forecast the interest cash flows was calculated by adding the interest rate spread specified in the relevant loan document to the fixed-rate equivalent LIBOR rate, duration-matched to the specific loan, adjusted by the LIBOR floor and/or cap in place on that loan.
Overview of Portfolio Companies
Set forth below is a brief description of the business of our portfolio companies as of September 30, 2016.
| Portfolio Company | Brief Description of Portfolio Company | |
| AAR Intermediate Holdings, LLC | AAR Intermediate Holdings, LLC (“AAR”) provides field support services to oil and gas independent producers, drilling companies and midstream companies in the Denver-Julesburg Basin, with headquarters in the heart of the Wattenberg region in Greeley, CO. AAR builds, repairs, modifies and maintains oil and gas production equipment, sites, wells and pipelines. | |
| Access Media Holdings, LLC | Access Media Holdings, LLC (d/b/a Access Media 3, Inc.) headquartered in Oak Brook, IL, is a triple-play provider of digital satellite television, high speed internet and voice services to the residential multi-dwelling unit (“MDU”) market in the United States. | |
| Accupac, Inc. | Accupac, Inc., (“Accupac”) headquartered in Mainland, PA, is a contract manufacturer and packager of liquids, lotions, gels, and creams selling to the over-the counter and prescription markets. Founded in 1974, Accupac focuses on and has differentiated capabilities in three attractive verticals of the contract manufacturing space including Topical, Oral Care and Specialty Application. Accupac’s capabilities are suited for a wide variety of products and the Accupac’s solutions span the breadth of the supply chain including sourcing and procurement, manufacturing and packaging, and finished product distribution. | |
| Advanced Diagnostic Holdings, LLC | Advanced Diagnostic Holdings, LLC, founded in 2003 and headquartered in Tampa, FL, is a provider of specialty neuro and musculoskeletal diagnostic imaging services to physicians and chiropractors. | |
| Albertville Quality Foods, Inc. | Albertville Quality Foods, Inc. (“AQF”) which is headquartered in Albertville, AL is a company which “further processes” and distributes value-added, partially cooked meat products from two facilities located in Albertville, AL and one pork processing facility located in Pontotoc, MS. “Further processing” involves sourcing meats from a variety of suppliers which are then hand-cut, tumbled, massaged, marinated or breaded to meet retail customers’ exact recipe specifications for size, texture, appearance, and flavor profile. AQF primarily produces breaded chicken products including tenders, breasts and bites for long-standing customer contracts with national chains, foodservice distributors and retail establishments. |
| 14 |
| Autosplice, Inc. | Autosplice, Inc. (“Autosplice”), founded in 1954 and headquartered in San Diego, CA, is a global supplier of highly engineered, mission-critical electrical interconnectors to OEMs and Tier 1 suppliers. Autosplice serves a wide variety of end-markets, providing the automotive, industrial, telecommunications, medical, transportation, consumer, and other applications. | |
| Backcountry.com, LLC | Backcountry.com, LLC founded in 1996 in Park City, UT, is an online specialty retailer for outdoor adventure, cycling, motorcycle and action sports gear and clothing. | |
| Be Green Packaging, LLC | Founded in 2007 and headquartered in Thousand Oaks, CA, Be Green Packaging, LLC designs and manufactures sustainable, tree-free, molded fiber products and packaging for the food service and consumer packaged goods end markets. | |
| Black Angus Steakhouses, LLC | Black Angus Steakhouses, LLC, founded in 1964 and headquartered in Los Altos, CA, operates restaurants across six states including California, Arizona, Alaska, New Mexico, Washington, and Hawaii. | |
| Brantley Transportation LLC | Brantley Transportation LLC, (“Brantley”) based in Monahans, TX, was founded more than 50 years ago and is a provider of mission-critical transportation services to energy producers and drilling companies in the upstream and midstream energy markets. Brantley leverages its fleet of trucks, trailers, cranes and related specialized heavy equipment to provide its customers with customized services involving drilling rig transportation and field services, which includes the disassembly, transportation, and reassembly of drilling rigs and related equipment as well as production services. | |
| Capstone Nutrition | Capstone Nutrition ("Capstone") which is headquartered in Ogden, UT is a pure-play developer and manufacturer in the nutrition industry. Since 1992, Capstone has been developing, producing, and packaging capsule, tablet, and powder products for a variety of customers in the United States and Internationally. | |
| ConvergeOne Holdings Corporation | ConvergeOne Holdings Corporation which is headquartered in Eagan, MN is an independent provider of innovative communications solutions and managed services to large and medium sized enterprises globally. | |
| CP OPCO LLC | CP OPCO LLC, founded in 1978 and headquartered in Inglewood, CA, offers its customers a complete solution, pairing a broad portfolio of event rental products and temporary structures with value-added event services. | |
| Crow Precision Components, LLC | Crow Precision Components, LLC is a Fort Worth, TX based forger of aluminum and steel used for mission critical aircraft components, among other end markets. | |
| DHISCO Electronic Distribution, Inc. | DHISCO Electronic Distribution, Inc. which is headquartered in Dallas, TX is a full service platform that assists lodging providers in the distribution of hotel information to end consumers through various distribution channels. |
| 15 |
| DLR Restaurants LLC | DLR Restaurants LLC (d/b/a “Dick’s Last Resort”, or “DLR”), established in 1985 and headquartered in Nashville, TN, operates company owned restaurants and earns a licensing fee on licensed restaurants located throughout the United States. Dick’s Last Resort has developed an identifiable brand for its unique casual dining restaurant concept that targets tourists and business travelers in high foot traffic locations. DLR competes in the “concept” niche within casual dining with key competitors such as Margaritaville, Hooters, Señor Frogs, and Joe’s Crab Shack. | |
| Dream Finders Homes, LLC | Founded in 2009, Dream Finders Homes, LLC ("DFH") which is headquartered in Jacksonville, FL is a residential homebuilder currently operating in the greater Jacksonville, FL market. DFH builds both single-family homes and townhomes, and is developing and building units in a number of attractive communities across Clay County, St. John’s County, and Nassau County. | |
| Dynamic Energy Services International LLC | Dynamic Energy Services International LLC which is headquartered in Wayne, PA is a provider of full-service fabrication, construction and maintenance services to a broad range of worldwide markets including oil and gas, industrial and petrochemical markets. | |
| Essex Crane Rental Corp. | Headquartered in Chicago, IL, Essex Crane Rental Corp. (“Essex”) is a subsidiary of Essex Rental Corp. (the “Parent”) (Nasdaq: ESSX). Essex is a provider of lattice-boom crawler cranes and tower, max-er and ringer attachments. Essex specializes in crane rentals, used crane sales, and other crane services. | |
| FKI Security Group LLC | FKI Security Group LLC, founded in 1951 and headquartered in New Albany, IN, is a global manufacturer and national service provider of security, safety and asset protection products used in a variety of industries, including the financial services, government, retail, education, and medical end markets. | |
| Footprint Acquisition LLC | Footprint Acquisition LLC, headquartered in Lisle, IL, is a provider of in store merchandising and logistics solutions to major retailers and consumer packaged goods manufacturers. | |
| Freedom Powersports LLC | Freedom Powersports LLC (“Freedom”) headquartered in Weatherford, TX is a powersports dealer with locations in TX, GA, and AL. Freedom was formed in February 2013 when Trinity Private Equity Group facilitated a management-led buyout of two dealership locations and served as the initial dealership platform. | |
| Harrison Gypsum LLC | Harrison Gypsum LLC, (“Harrison”) founded in 1955 and headquartered in Norman, OK, mines and processes gypsum and plaster in OK and TX. Gypsum is a soft sulfate mineral most commonly found in layered sedimentary deposits and primarily used to create drywall as a finish in walls and ceilings. Harrison has successfully been able to develop and market gypsum to a diverse set of end markets, including building products, oil and gas, infrastructure, food/pharmaceuticals, in addition to other industries and associated freight, with products such as fines, filler, plaster, retarder rock, food/pharmaceutical grade gypsum and road rock. | |
| Heligear Acquisition Co. | Heligear Acquisition Co. (d/b/a Northstar Aerospace, Inc) headquartered in Bedford Park, IL is an independent manufacturer of flight-critical aerospace gears and power transmission systems for domestic and international military and commercial aircraft applications. |
| 16 |
| JD Norman Industries, Inc. | JD Norman Industries, Inc., founded in 2004 and headquartered in Addison, IL, is a manufacturer of engineered value-added metal components and systems including stampings, wire forms, machined components, coiled springs, and assemblies. | |
| Jordan Reses Supply Company, LLC | Jordan Reses Supply Company, LLC, founded in 1985 and headquartered in Ann Arbor, MI, is a national distributor of respiratory equipment solely focused on serving the Veterans Affairs and the federal government. | |
| Lighting Science Group Corporation | Headquartered in Satellite Beach, FL, Lighting Science Group Corporation (“LSG”) is one of the world’s light emitting diode (“LED”) lighting technology companies. LSG designs, develops and markets general illumination products that exclusively use LEDs as their light source. The LSG’s broad product portfolio includes LED-based retrofit lamps (replacement bulbs) used in existing light fixtures as well as purpose-built LED-based luminaires (light fixtures). | |
| LSF9 Atlantis Holdings, LLC | LSF9 Atlantis Holdings, LLC (d/b/a A2Z Wireless Holdings, Inc. or “A2Z”), founded in 1996 and headquartered in Greenville, NC, is a leading retailer of Verizon wireless products and services. A2Z operates Verizon-branded retail stores that offer a comprehensive mix of wireless devices including smartphones, feature phones, tablets, mobile broadband, and wearables, as well as, a broad range of accessories and device insurance coverage. | |
| Lydell Jewelry Design Studio, LLC | Lydell Jewelry Design Studio, LLC, founded in 1992 and headquartered in NY, provides private label costume/fashion jewelry programs for retail chains in the United States. | |
| MCC Senior Loan Strategy JV I LLC | MCC Senior Loan Strategy JV I LLC commenced operations on July 15, 2015 and generates current income and capital appreciation by investing primarily in the debt of privately-held middle market companies in the United States with a focus on senior secured first lien term loans. See "Note 3 - Investments" in "Item 8 - Consolidated Financial Statements and Supplementary Data." | |
| Merchant Cash and Capital, LLC | Founded in 2005 and headquartered in New York, NY, Merchant Cash and Capital, LLC is a specialty finance firm that provides cash advances to merchants by purchasing a percentage of the merchant‘s future credit card receivables at a discount. | |
| Miratech Intermediate Holdings, Inc. | Miratech Intermediate Holdings, Inc. (“Miratech”) is a provider of highly specialized emissions solutions for natural gas and diesel reciprocating engines. Founded in 1992 and based in Tulsa, OK, Miratech offers catalysts, housings, and services for the power generation, natural gas and compression end markets. Miratech’s highly engineered products are sold into blue chip OEM customers and engine manufacturers. | |
| Momentum Telecom, Inc. | Momentum Telecom, Inc., founded in 2011 and headquartered in Birmingham, AL, offers residential, small business, and enterprise high speed data and voice-over-IP operational support services. | |
| Nation Safe Drivers Holdings, Inc. | Nation Safe Drivers Holdings, Inc. headquartered in Boca Raton, FL is a provider of towing and roadside assistance services as well as supplemental insurance related products. |
| 17 |
| Nielsen & Bainbridge, LLC | Nielsen & Bainbridge, LLC headquartered in Chicago, IL is a designer, manufacturer, and provider of custom framing components and ready-made frames for independent framers and mass merchants globally. | |
| NorthStar Group Services, Inc. | NorthStar Group Services, Inc., founded in 1980 and headquartered in Brea, CA, is a one-stop provider of demolition and environmental remediation services including demolition, asset & scrap recovery, abatement of asbestos, lead, and mold, and disaster response. | |
| OmniVere, LLC | OmniVere, LLC headquartered in Chicago, IL is a full service eDiscovery company that serves as a true end-to-end service provider in the eDiscovery industry. | |
| Oxford Mining Company, LLC | Oxford Mining Company, LLC (d/b/a Westmoreland Resource Partners, L.P. or "Westmoreland"), headquartered in Columbus, OH, is a producer of high-value thermal coal and surface-mined coal. Westmoreland operates active surface mines with mining complexes principally in Ohio, Kentucky, West Virginia and Pennsylvania. | |
| Point.360 | Point.360 (OTC: PTSX) headquartered in Los Angeles, CA is a publicly traded, full-service content management company with several facilities strategically located throughout Los Angeles supporting all aspects of postproduction. | |
| Prestige Industries LLC | Prestige Industries LLC (“Prestige”) headquartered in Lyndhurst, NJ is a provider of commercial laundry services to the hospitality industry in the New York Tri-State area, operating a network of 3 strategically located laundry facilities. Prestige offers its customers a full suite of laundry services including: (i) terry & linen, (ii) food & beverage, (iii) valet services, (iv) garment cleaning and (v) laundry management. | |
| Prince Mineral Holdings Corp. | Prince Mineral Holding Corp. (“Prince Mineral") headquartered in New York, NY is a global value-added distributor of specialty mineral products and niche industrial additives. Prince Mineral sources, processes and distributes its products for use in brick, glass, agriculture, foundry, refractory and steel, oil and gas and coal end markets. Prince Mineral functions as a value-added processing intermediary. | |
| Reddy Ice Corporation | Reddy Ice Corporation headquartered in Dallas, TX is a manufacturer and distributor of packaged ice in the US, with a top market share in the majority of its footprint, which spans 34 states. | |
| Response Team Holdings, LLC | Response Team Holdings, LLC, founded in 2010 and headquartered in Raleigh, NC, provides mitigation, restoration, and ancillary services to single and multi-family prospects, healthcare organizations, schools, municipalities, and commercial businesses. | |
| Safeworks, LLC | Safeworks, LLC, founded in 1947 and headquartered in Seattle, WA, is a manufacturer of suspended access products designed to enable customers to work safely and productively at extended heights. | |
| Sendero Drilling Company, LLC | Founded in 2010 as a wholly owned subsidiary of Pioneer Natural Resources, Sendero Drilling Company, LLC is a land drilling contractor headquartered in San Angelo, TX. |
| 18 |
| Seotowncenter, Inc. | Seotowncenter, Inc., founded in 2009 and based in Lehi, UT, is a tech-enabled business services company that delivers white label search engine optimization and local search and digital campaign fulfillment to the small and midsize business market. | |
| Ship Supply Acquisition Corporation | Ship Supply Acquisition Corporation, founded in 1968 and headquartered in Miami, FL, is a logistics services business that provides products and maritime services for commercial and military marine vessels through four segments: (i) global logistics services, (ii) comprehensive husbandry services, (iii) full service vessel management to large passenger-carrying vessels, and (iv) fuel broker services. | |
| Stancor, Inc. | Stancor, Inc., founded in 1985 and based out of Monroe, CT, is a designer and manufacturer of electric submersible pumps, control, accessories, and parts. | |
| T Residential Holdings LLC | T Residential Holdings, LLC headquartered in Dallas, Tx is a carve-out of Transcontinental Realty Investors and currently owns a portfolio of high-quality, class A, multifamily properties concentrated in the southern United States. | |
| Taylored Freight Services, LLC | Taylored Freight Services, LLC, founded in 1992 and based in Los Angeles, CA, is a port-based, third-party logistics provider that specializes in warehousing, fulfillment, transportation and related value-added services to support the global supply chains of manufacturers and importers of apparel, accessories, toys and sporting goods. | |
| Tenere Acquisition Corp. | Tenere Acquisition Corp., founded in 1994 and located in Dresser, WI, is a sophisticated, full-service, designer and fabricator of complex engineered metal and plastic parts and assemblies. | |
| The Plastics Group, Inc. | The Plastics Group, Inc ("TPG"), founded in 1997 and based in Willowbrook, IL, is a full-service manufacturer of blow molded plastic components and systems for a targeted set of growing applications and end markets. TPG operates two complementary businesses: a custom business serving original equipment manufacturer customers and a proprietary line of consumer products sold through retailers and distributors. | |
| Transtelco, Inc. | Transtelco, Inc. (“Transtelco”) headquartered in El Paso, TX provides data and voice telecom services over its wholly-owned high capacity network. Transtelco provides (i) dedicated internet protocol access, (ii) transport services, (iii) colocation, (iv) spectrum leasing, and (v) voice services under multi-year contracts to large carrier and enterprise customers in the U.S. and Mexico. | |
| United Road Towing, Inc. | United Road Towing, Inc. (“URT”) headquartered in Moneka, IL is an integrated towing company in the United States. URT provides a complete range of towing, vehicle storage and vehicle auction services. | |
| US Multifamily, LLC | US Multifamily, LLC (“US Multifamily”) is a real estate private equity firm headquartered in Atlantic Beach, FL, with offices in Atlanta, Georgia and Charlotte, North Carolina. US Multifamily is focused on distressed multifamily assets primarily located in the Southeastern region of the United States. | |
| Velocity Pooling Vehicle, LLC | Velocity Pooling Vehicle, LLC headquartered in Indianapolis, IN is a manufacturer comprised of a group of highly recognizable brands serving nearly all product categories in the powersports aftermarket industry and a distributor of proprietary and sourced brands to a variety of dealers and retailers. | |
| Watermill-QMC Midco, Inc. | Watermill-QMC Midco, Inc (d/b/a Quality Metalcraft, Inc.), founded in 1964 and headquartered in Livonia, MI, is a provider of complex assemblies for specialty automotive production, prototype and factory assist applications. | |
| Wheels Up Partners LLC | Wheels Up Partners LLC ("WUP") headquartered in New York, NY is the first membership based private aviation club. Founded in 2013 WUP charges members a one-time initiation fee with annual dues thereafter. Members are granted access to a closed fleet of newly redesigned King Air 350i turboprop aircrafts, with no upfront block purchase or minimum flying required. |
| 19 |
THE ADVISER
MCC Advisors serves as our investment adviser and is registered as an investment adviser under the Investment Advisers Act of 1940, as amended (“Advisers Act”). Subject to the overall supervision of our board of directors, MCC Advisors manages the day-to-day operations of, and provides investment advisory and management services to us pursuant to an investment management agreement by and between the Company and MCC Advisors.
Investment Management Agreement
Under the terms of our investment management agreement, MCC Advisors:
| · | determines the composition of our portfolio, the nature and timing of the changes to our portfolio and the manner of implementing such changes; |
| · | identifies, evaluates and negotiates the structure of the investments we make (including performing due diligence on our prospective portfolio companies); and |
| · | executes, closes, monitors and administers the investments we make, including the exercise of any voting or consent rights. |
MCC Advisors’ services under the investment management agreement are not exclusive, and it is free to furnish similar services to other entities so long as its services to us are not impaired.
Pursuant to our investment management agreement, we pay MCC Advisors a fee for investment advisory and management services consisting of a base management fee and a two-part incentive fee.
On December 3, 2015, MCC Advisors recommended and, in consultation with the Board, agreed to reduce fees under the investment management agreement. Beginning January 1, 2016, the base management fee was reduced to 1.50% on gross assets above $1 billion. In addition, MCC Advisors reduced its incentive fee from 20% on pre-incentive fee net investment income over an 8% hurdle, to 17.5% on pre-incentive fee net investment income over a 6% hurdle. Moreover, the revised incentive fee includes a netting mechanism and is subject to a rolling three-year look back from January 1, 2016 forward. Under no circumstances will the new fee structure result in higher fees to MCC Advisors than fees under the prior investment management agreement.
The following discussion of our base management fee and two-part incentive fee reflect the terms of the fee waiver agreement executed by MCC Advisors on February 8, 2016 (the “Fee Waiver Agreement”). The terms of the Fee Waiver Agreement are effective as of January 1, 2016, and are a permanent reduction in the base management fee and incentive fee on net investment income payable to MCC Advisors for the investment advisory and management services it provides under the investment management agreement. The Fee Waiver Agreement does not change the second component of the incentive fee, which is the incentive fee on capital gains.
Base Management Fee
For providing investment advisory and management services to us, MCC Advisors receives a base management fee. The base management fee is calculated at an annual rate of 1.75% (0.4375% per quarter) of up to $1.0 billion of the Company’s gross assets and 1.50% (0.375% per quarter) of any amounts over $1.0 billion of the Company’s gross assets, and is payable quarterly in arrears. The base management fee will be calculated based on the average value of the Company’s gross assets at the end of the two most recently completed calendar quarters and will be appropriately pro-rated for any partial quarter.
| 20 |
Incentive Fee The incentive fee has two components, as follows:
Incentive Fee Based on Income
The first component of the incentive fee is payable quarterly in arrears and is based on our pre-incentive fee net investment income earned during the calendar quarter for which the incentive fee is being calculated. MCC Advisors is entitled to receive the incentive fee on net investment income from us if our Ordinary Income (as defined below) exceeds a quarterly “hurdle rate” of 1.5%. The hurdle amount is calculated after making appropriate adjustments to the Company’s net assets, as determined as of the beginning of each applicable calendar quarter, in order to account for any capital raising or other capital actions as a result of any issuances by the Company of its common stock (including issuances pursuant to our dividend reinvestment plan), any repurchase by the Company of its own common stock, and any dividends paid by the Company, each as may have occurred during the relevant quarter.
Beginning with the calendar quarter that commenced on January 1, 2016, the incentive fee on net investment income will be determined and paid quarterly in arrears at the end of each calendar quarter by reference to our aggregate net investment income, as adjusted as described below, from the calendar quarter then ending and the eleven preceding calendar quarters (or if shorter, the number of quarters that have occurred since January 1, 2016). We refer to such period as the “Trailing Twelve Quarters.”
The hurdle amount for the incentive fee on net investment income is determined on a quarterly basis, and is equal to 1.5% multiplied by the Company’s net asset value at the beginning of each applicable calendar quarter comprising the relevant Trailing Twelve Quarters. The hurdle amount is calculated after making appropriate adjustments to the Company’s net assets, as determined as of the beginning of each applicable calendar quarter, in order to account for any capital raising or other capital actions as a result of any issuances by the Company of its common stock (including issuances pursuant to our dividend reinvestment plan), any repurchase by the Company of its own common stock, and any dividends paid by the Company, each as may have occurred during the relevant quarter. The incentive fee for any partial period will be appropriately prorated. Any incentive fee on net investment income will be paid to MCC Advisors on a quarterly basis, and will be based on the amount by which (A) aggregate net investment income (“Ordinary Income”) in respect of the relevant Trailing Twelve Quarters exceeds (B) the hurdle amount for such Trailing Twelve Quarters. The amount of the excess of (A) over (B) described in this paragraph for such Trailing Twelve Quarters is referred to as the “Excess Income Amount.” For the avoidance of doubt, Ordinary Income is net of all fees and expenses, including the base management fee but excluding any incentive fee on Pre-Incentive Fee net investment income or on the Company’s capital gains.
Quarterly Incentive Fee Based on Net Investment Income
The incentive fee on net investment income for each quarter is determined as follows:
· No incentive fee on net investment income is payable to MCC Advisors for any calendar quarter for which there is no Excess Income Amount;
· 100% of the Ordinary Income, if any, that exceeds the hurdle amount, but is less than or equal to an amount, which we refer to as the “Catch-up Amount,” determined as the sum of 1.8182% multiplied by the Company’s net assets at the beginning of each applicable calendar quarter, as adjusted as noted above, comprising the relevant Trailing Twelve Quarters is included in the calculation of the incentive fee on net investment income; and
· 17.5% of the Ordinary Income that exceeds the Catch-up Amount is included in the calculation of the incentive fee on net investment income.
The amount of the incentive fee on net investment income that will be paid to MCC Advisors for a particular quarter will equal the excess of the incentive fee so calculated minus the aggregate incentive fees on net investment income that were paid in respect of the first eleven calendar quarters (or the portion thereof) included in the relevant Trailing Twelve Quarters but not in excess of the Incentive Fee Cap (as described below).
The incentive fee on net investment income that is paid to MCC Advisors for a particular quarter is subject to a cap (the “Incentive Fee Cap”). The Incentive Fee Cap for any quarter is an amount equal to (a) 17.5% of the Cumulative Net Return (as defined below) during the relevant Trailing Twelve Quarters minus (b) the aggregate incentive fees on net investment income that were paid in respect of the first eleven calendar quarters (or the portion thereof) included in the relevant Trailing Twelve Quarters.
| 21 |
“Cumulative Net Return” means (x) the Ordinary Income in respect of the relevant Trailing Twelve Quarters minus (y) any Net Capital Loss (as described below), if any, in respect of the relevant Trailing Twelve Quarters. If, in any quarter, the Incentive Fee Cap is zero or a negative value, the Company will pay no incentive fee on net investment income to MCC Advisors for such quarter. If, in any quarter, the Incentive Fee Cap for such quarter is a positive value but is less than the incentive fee on net investment income that is payable to MCC Advisors for such quarter (before giving effect to the Incentive Fee Cap) calculated as described above, the Company will pay an incentive fee on net investment income to MCC Advisors equal to the Incentive Fee Cap for such quarter. If, in any quarter, the Incentive Fee Cap for such quarter is equal to or greater than the incentive fee on net investment income that is payable to MCC Advisors for such quarter (before giving effect to the Incentive Fee Cap) calculated as described above, the Company will pay an incentive fee on net investment income to MCC Advisors, calculated as described above, for such quarter without regard to the Incentive Fee Cap.
“Net Capital Loss” in respect of a particular period means the difference, if positive, between (i) aggregate capital losses, whether realized or unrealized, and dilution to the Company’s net assets due to capital raising or capital actions, in such period and (ii) aggregate capital gains, whether realized or unrealized and accretion to the Company’s net assets due to capital raising or capital action, in such period.
Dilution to the Company’s net assets due to capital raising is calculated, in the case of issuances of common stock, as the amount by which the net asset value per share was adjusted over the transaction price per share, multiplied by the number of shares issued. Accretion to the Company’s net assets due to capital raising is calculated, in the case of issuances of common stock (including issuances pursuant to our dividend reinvestment plan), as the excess of the transaction price per share over the amount by which the net asset value per share was adjusted, multiplied by the number of shares issued. Accretion to the Company’s net assets due to other capital action is calculated, in the case of repurchases by the Company of its own common stock, as the excess of the amount by which the net asset value per share was adjusted over the transaction price per share multiplied by the number of shares repurchased by the Company.
For the avoidance of doubt, the purpose of the new incentive fee calculation under the Fee Waiver Agreement is to permanently reduce aggregate fees payable to MCC Advisors by the Company, effective as of January 1, 2016. In order to ensure that the Company will pay MCC Advisors lesser aggregate fees on a cumulative basis, as calculated beginning January 1, 2016, we will, at the end of each quarter, also calculate the base management fee and incentive fee on net investment income owed by the Company to MCC Advisors based on the formula in place prior to January 1, 2016. If, at any time beginning January 1, 2016, the aggregate fees on a cumulative basis, as calculated based on the formula in place after January 1, 2016, would be greater than the aggregate fees on a cumulative basis, as calculated based on the formula in place prior to January 1, 2016, MCC Advisors shall only be entitled to the lesser of those two amounts.
The second component of the incentive fee is determined and payable in arrears as of the end of each calendar year (or upon termination of the investment management agreement as of the termination date) and equals 20.0% of our cumulative aggregate realized capital gains less cumulative realized capital losses, unrealized capital depreciation (unrealized depreciation on a gross investment-by-investment basis at the end of each calendar year) and all capital gains upon which prior performance-based capital gains incentive fee payments were previously made to the investment adviser.
Under GAAP, the Company calculates the second component of the incentive fee as if the Company had realized all assets at their fair values as of the reporting date. Accordingly, the Company accrues a provisional capital gains incentive fee taking into account any unrealized gains or losses. As the provisional capital gains incentive fee is subject to the performance of investments until there is a realization event, the amount of the provisional capital gains incentive fee accrued at a reporting date may vary from the capital gains incentive that is ultimately realized and the differences could be material.
For the year ended September 30, 2016, the Company incurred net base management fees payable to MCC Advisors of $19.3 million and $8.0 million of incentive fees related to pre-incentive fee net investment income.
The following is a graphical representation of the calculation of the income-related portion of the incentive fee effective as of January 1, 2016 pursuant to the Fee Waiver Agreement:
Pre-incentive Fee Net Investment Income
(Expressed as a Percentage of the Value of Net Assets)
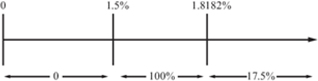
| 22 |
Examples of Quarterly Incentive Fee Calculation
Example 1: Income Related Portion of Incentive Fee:
| · | Quarter 1 |
| · | Net Asset Value at the start of Quarter 1 = $100.0 million (1 million shares) |
| · | Quarter 1 Ordinary Income = $5.0 million |
| · | Quarter 1 Issue 1 million shares at $101 per share = $1.0 million |
| · | Quarter 1 Capital Gain = $1.0 million |
| · | Quarter 1 Hurdle Amount = $1.5 million (calculated based on a quarterly 1.5% hurdle rate) |
| · | Quarter 1 Catchup Amount = $1.81818 million (calculated based on a quarterly 1.81818% rate) |
| · | Quarter 2 |
| · | Net Asset Value at the start of Quarter 2 = $100.0 million (1 million shares) |
| · | Quarter 2 Ordinary Income = $1.5 million |
| · | Quarter 2 Capital Gain = $1.0 million |
| · | Quarter 2 Hurdle Amount = $1.5 million (calculated based on a quarterly 1.5% hurdle rate) |
| · | Quarter 2 Catchup Amount = $1.81818 million (calculated based on a quarterly 1.81818% rate) |
| · | Quarter 3 |
| · | Net Asset Value at the start of Quarter 3 = $100.0 million (1 million shares) |
| · | Quarter 3 Ordinary Income = $4.0 million |
| · | Quarter 3 Repurchase 500,000 shares at $99 per share = $0.50 million |
| · | Quarter 3 Capital Loss = ($8.0) million |
| · | Quarter 3 Hurdle Amount = $1.5 million (calculated based on a quarterly 1.5% hurdle rate) |
| · | Quarter 3 Catchup Amount = $1.81818 million (calculated based on a quarterly 1.81818% rate) |
| · | Quarter 4 |
| · | Net Asset Value at the start of Quarter 4 = $100.0 million (1 million shares) |
| · | Quarter 4 Ordinary Income = $4.0 million |
| 23 |
| · | Quarter 4 Capital Gain = $3.0 million | |
| · | Quarter 4 Hurdle Amount = $1.5 million (calculated based on a quarterly 1.5% hurdle rate) | |
| · | Quarter 4 Catchup Amount = $1.81818 million (calculated based on a quarterly 1.81818% rate) |
Determination of Incentive Fee Based on Income:
In Quarter 1, the Ordinary Income of $5.0 million exceeds the Hurdle Amount of $1.50 million and the Catchup Amount of $1.8182 million. There is $2 million of Net Capital Gains, including a capital gain of $1 million and accretion to the Company’s net asset value of $1 million as a result of issuing shares at a transaction price that exceeds the net asset value per share. As a result, an Incentive Fee based on income of $875,000 ((100% of $318,182) + (17.5% of $3,181,818)) is payable to our investment adviser for Quarter 1.
In Quarter 2, the Quarter 2 Ordinary Income of $1.50 million does not exceed the Quarter 2 Hurdle Amount of $1.50 million, but the aggregate Ordinary Income for the Trailing Twelve Quarters of $6.50 million exceeds the aggregate Hurdle Amount for the Trailing Twelve Quarters of $3.0 million and the aggregate Catchup Amount for the Trailing Twelve Quarters of $3.6364 million. There are no Net Capital Losses. As a result, an Incentive Fee based on income of $262,500 ($1,137,500 (100% of $636,364) + (17.5% of 2,863,636) minus $875,000 paid in Quarter 1) would be payable to our investment adviser for Quarter 2.
In Quarter 3, the aggregate Ordinary Income of the Trailing Twelve Quarters of $10.5 million exceeds the aggregate Hurdle Amount for the Trailing Twelve Quarters of $4.5 million and the aggregate Catchup Amount for the Trailing Twelve Quarters of $5.4545 million. However, there is an aggregate Net Capital Loss of ($4.5) million for the Trailing Twelve Quarters. As a result, the Incentive Fee Cap would apply. The Incentive Fee Cap equals $(87,500), calculated as follows:
(17.5% x ($10.5 million minus $4.5 million)) minus $1,137,500 paid in Quarters 1 and 2. Because the Incentive Fee Cap is a negative value, there is no Incentive Fee based on income payable to the adviser for Quarter 3.
In Quarter 4, the aggregate Ordinary Income of the Trailing Twelve Quarters of $14.50 million exceeds the aggregate Hurdle Amount for the Trailing Twelve Quarters of $6.0 million and the aggregate Catchup Amount for the Trailing Twelve Quarters of $7.2727 million. The calculation of the Incentive Fee based on income would be $1.40 million ($2,537,500 (100% of $1,272,727) + (17.5% of $7,227,272) minus $1,137,500 million paid in Quarters 1 and 2). However, there is an aggregate Net Capital Loss of $(1.50) million for the Trailing Twelve Quarters. As a result, the Incentive Fee Cap would apply. The Incentive Fee Cap equals $1,137,500 calculated as follows:
(17.5% X ($14.5 million minus $1.5 million)) minus $1,137,500. Because the Incentive Fee Cap is positive but less than the Incentive Fee based on Income of $1.40 million calculated prior to the Incentive Fee Cap, an Incentive Fee based on Income of $1,137,500 is payable to our investment adviser for Quarter 4.
| Example 2: | Capital Gains Portion of Incentive Fee: |
Alternative 1:
Assumptions
Year 1: $20 million investment made in Company A (“Investment A”), and $30 million investment made in Company B (“Investment B”)
Year 2: Investment A sold for $50 million and fair market value, or FMV, of Investment B determined to be $32 million
Year 3: FMV of Investment B determined to be $25 million
Year 4: Investment B sold for $31 million
The capital gains portion of the incentive fee would be:
Year 1: None
Year 2: Capital gains incentive fee of $6.0 million ($30 million realized capital gains on sale of Investment A multiplied by 20.0%)
Year 3: None; $5.0 million (20.0% multiplied by ($30 million cumulative capital gains less $5 million cumulative capital depreciation)) less $6.0 million (previous capital gains fee paid in Year 2) (the $1.0 million difference would not be deducted from future capital gains incentive fees)
Year 4: Capital gains incentive fee of $200,000; $6.2 million ($31 million cumulative realized capital gains multiplied by 20.0%) less $6.0 million (capital gains fee paid in Year 2)
| 24 |
Alternative 2:
Assumptions
Year 1: $20 million investment made in Company A (“Investment A”), $30 million investment made in Company B (“Investment B”) and $25 million investment made in Company C (“Investment C”)
Year 2: Investment A sold for $50 million, FMV of Investment B determined to be $25 million and FMV of Investment C determined to be $25 million
Year 3: FMV of Investment B determined to be $27 million and Investment C sold for $30 million
Year 4: FMV of Investment B determined to be $35 million
Year 5: Investment B sold for $20 million
The capital gains portion of the incentive fee would be:
Year 1: None
Year 2: Capital gains incentive fee of $5.0 million; 20.0% multiplied by $25 million ($30 million realized capital gains on Investment A less $5 million unrealized capital depreciation on Investment B)
Year 3: Capital gains incentive fee of $1.4 million; $6.4 million (20.0% multiplied by $32 million ($35 million cumulative realized capital gains less $3 million unrealized capital depreciation on Investment B)) less $5.0 million capital gains fee received in Year 2
Year 4: None
Year 5: None; $5.0 million of capital gains incentive fee (20.0% multiplied by $25 million (cumulative realized capital gains of $35 million less realized capital losses of $10 million)) less $6.4 million cumulative capital gains fee paid in Year 2 and Year 3 (the $1.4 million difference would not be deducted from future capital gains incentive fees)
As noted above, in order to ensure that the Company will pay MCC Advisors a lesser base management fee and incentive fee on net investment income on a cumulative basis, as calculated beginning January 1, 2016, the Company will, at the end of each quarter, also calculate the base management fee and incentive fee on net investment income owed by the Company to MCC Advisors based on the formula in place prior to the Fee Waiver Agreement, and pay lesser of those two amounts. Set forth below is a description of the base management fee and the incentive fee on net investment income payable to MCC Advisors prior to the Fee Waiver Agreement.
Base Management Fee — Prior to Fee Waiver Agreement
The base management fee was calculated at an annual rate of 1.75% of our gross assets, and is payable quarterly in arrears. The base management fee is based on the average value of our gross assets at the end of the two most recently completed calendar quarters.
Incentive Fee — Prior to Fee Waiver Agreement
The incentive fee based on net investment income was calculated as 20.0% of the amount, if any, by which our pre-incentive fee net investment income, expressed as a rate of return on the value of our net assets calculated as of the end of the calendar quarter immediately preceding the calendar quarter for which the incentive fee is being calculated, exceeds a 2.0% (which is 8.0% annualized) hurdle rate but also includes a “‘catch-up’ provision. Under this provision, in any calendar quarter, our investment adviser receives no incentive fee until our net investment income equals the hurdle rate of 2.0%, but then receives, as a “catch-up”, 100% of our pre-incentive fee net investment income with respect to that portion of such pre-incentive fee net investment income, if any, that exceeds the hurdle rate but is less than 2.5%. The effect of this provision is that, if pre-incentive fee net investment income exceeds 2.5% in any calendar quarter, our investment adviser will receive 20% of our pre-incentive fee net investment income as if the hurdle rate did not apply. For this purpose, pre-incentive fee net investment income means interest income, dividend income and any other income including any other fees (other than fees for providing managerial assistance), such as commitment, origination, structuring, diligence and consulting fees or other fees that we receive from portfolio companies accrued during the calendar quarter, minus our operating expenses for the quarter including the base management fee, expenses payable under the administration agreement, and any interest expense and any dividends paid on any issued and outstanding preferred stock, but excluding the incentive fee. Pre-incentive fee net investment income includes, in the case of investments with a deferred interest feature (such as original issue discount, debt instruments with payment-in-kind interest and zero coupon securities), accrued income that we have not yet received in cash.
Payment of Our Expenses
All investment professionals and staff of MCC Advisors, when, and to the extent, engaged in providing investment advisory and management services to us, and the compensation and routine overhead expenses of such personnel allocable to such services, is provided and paid for by MCC Advisors. We bear all other costs and expenses of our operations and transactions, including those relating to:
| · | our organization and continued corporate existence; | |
| · | calculating our net asset value (“NAV”) (including the cost and expenses of any independent valuation firms); | |
| · | expenses, including travel expense, incurred by MCC Advisors or payable to third parties performing due diligence on prospective portfolio companies, monitoring our investments and, if necessary, enforcing our rights; | |
| · | interest payable on debt incurred to finance our investments; |
| 25 |
| · | the costs of all offerings of common shares and other securities; |
| · | the base management fee and any incentive management fee; |
| · | distributions on our shares; |
| · | administration fees payable under our administration agreement; |
| · | the allocated costs incurred by MCC Advisors as our administrator in providing managerial assistance to those portfolio companies that request it; |
| · | amounts payable to third parties relating to, or associated with, making investments; |
| · | transfer agent and custodial fees; |
| · | all registration and listing fees; |
| · | U.S. federal, state and local taxes; |
| · | independent directors’ fees and expenses; |
| · | costs of preparing and filing reports or other documents with the SEC or other regulators; |
| · | the costs of any reports, proxy statements or other notices to our stockholders, including printing costs; |
| · | our fidelity bond; |
| · | directors and officers/errors and omissions liability insurance, and any other insurance premiums; |
| · | indemnification payments; |
| · | direct costs and expenses of administration, including audit and legal costs; and |
| · | all other expenses reasonably incurred by us or MCC Advisors in connection with administering our business, such as the allocable portion of overhead under our administration agreement, including rent and other allocable portions of the cost of our officers and their respective staffs (including travel expenses). |
We reimburse MCC Advisors for costs and expenses incurred for office space rental, office equipment and utilities allocable to the performance by MCC Advisors of its duties under the administration agreement, as well as any costs and expenses incurred relating to any non-investment advisory, administrative or operating services provided to us or in the form of managerial assistance to portfolio companies that request it.
From time to time, MCC Advisors pays amounts owed by us to third party providers of goods or services. We subsequently reimburse MCC Advisors for such amounts paid on our behalf.
Limitation of Liability and Indemnification
The investment management agreement provides that MCC Advisors and its officers, directors, employees and affiliates are not liable to us or any of our stockholders for any act or omission by it or its employees in the supervision or management of our investment activities or for any loss sustained by us or our stockholders, except that the foregoing exculpation does not extend to any act or omission constituting willful misfeasance, bad faith, gross negligence or reckless disregard of its obligations under the investment management agreement. The investment management agreement also provides for indemnification by us of MCC Advisors’ members, directors, officers, employees, agents and control persons for liabilities incurred by it in connection with their services to us, subject to the same limitations and to certain conditions.
| 26 |
Duration and Termination
The investment management agreement was initially approved by our board of directors on November 3, 2010 was executed on January 11, 2011. Pursuant to its terms and under the 1940 Act, the investment management agreement had an initial two year term, and then was subject to an annual approval by our board of directors. Unless terminated earlier as described below, it will continue in effect from year to year if approved annually by our board of directors or by the affirmative vote of the holders of a majority of our outstanding voting securities, including, in either case, approval by a majority of our directors who are not interested persons. The investment management agreement will automatically terminate in the event of its assignment. The investment management agreement may be terminated by either party without penalty upon not more than 60 days’ written notice to the other. See “Risks — Risks Related to Our Business — We are dependent upon senior management personnel of MCC Advisors for our future success, and if MCC Advisors is unable to retain qualified personnel or if MCC Advisors loses any member of its senior management team, our ability to achieve our investment objective could be significantly harmed.”
Annual Board Approval of the Investment Management Agreement
Our board of directors held an in-person meeting on December 7, 2016, in order to consider the annual approval and continuation of our investment management agreement. In its consideration of the investment management agreement, the board of directors focused on information it had received relating to, among other things: (a) the nature, quality and extent of the advisory and other services to be provided to us by our investment adviser, MCC Advisors; (b) comparative data with respect to advisory fees or similar expenses paid by other business development companies with similar investment objectives; (c) our projected operating expenses and expense ratio compared to business development companies with similar investment objectives; (d) any existing and potential sources of indirect income to MCC Advisors from its relationships with us and the profitability of those relationships; (e) information about the services to be performed and the personnel performing such services under the investment management agreement; (f) the organizational capability and financial condition of MCC Advisors and its affiliates; and (g) various other factors.
Based on the information reviewed and the discussions, the board of directors, including a majority of the non-interested directors, concluded that the investment management fee rates and terms are reasonable in relation to the services to be provided and approved the investment management agreement as being in the best interests of our stockholders. Specifically the board of directors approved the extension of the investment management agreement for an additional period of one year beginning on January 19, 2017.
Notwithstanding the approval noted above, on December 3, 2015, MCC Advisors recommended and, in consultation with the Board, agreed to reduce fees under the investment management agreement. As of January 1, 2016, the base management fee was reduced to 1.50% on gross assets above $1 billion. In addition, MCC Advisors reduced its incentive fee from 20% on pre-incentive fee net investment income over an 8% hurdle, to 17.5% on pre-incentive fee net investment income over a 6% hurdle. Moreover, the revised incentive fee includes a netting mechanism and is subject to a rolling three-year look back from January 1, 2016 forward. Under no circumstances will the new fee structure result in higher fees to MCC Advisors than fees under the prior investment management agreement.
License Agreement
We have entered into a license agreement with Medley Capital LLC under which Medley Capital LLC has agreed to grant us a non-exclusive, royalty-free license to use the name “Medley”. Under this agreement, we will have a right to use the “Medley” name for so long as MCC Advisors or one of its affiliates remains our investment adviser. Other than with respect to this limited license, we have no legal right to the “Medley” name. This license agreement will remain in effect for so long as the investment management agreement with MCC Advisors is in effect.
REGULATION
General
We have elected to be regulated as a BDC under the 1940 Act. The 1940 Act contains prohibitions and restrictions relating to transactions between BDCs and their affiliates (including any investment advisers or sub-advisers), principal underwriters and affiliates of those affiliates or underwriters and requires that a majority of the directors be persons other than “interested persons”, as that term is defined in the 1940 Act. In addition, the 1940 Act provides that we may not change the nature of our business so as to cease to be, or to withdraw our election as, a BDC unless approved by “a majority of our outstanding voting securities.”
We may invest up to 100% of our assets in securities acquired directly from issuers in privately negotiated transactions. We do not intend to acquire securities issued by any investment company that exceed the limits imposed by the 1940 Act. Under these limits, except for registered money market funds we generally cannot acquire more than 3% of the voting stock of any investment company, invest more than 5% of the value of our total assets in the securities of one investment company or invest more than 10% of the value of our total assets in the securities of more than one investment company. With regard to that portion of our portfolio invested in securities issued by investment companies, it should be noted that such investments might subject our stockholders to additional expenses. None of our investment policies are fundamental and any may be changed without stockholder approval.
| 27 |
Qualifying Assets
Under the 1940 Act, a BDC may not acquire any asset other than assets of the type listed in section 55(a) of the 1940 Act, which are referred to as qualifying assets, unless, at the time the acquisition is made, qualifying assets represent at least 70% of the company’s total assets. The principal categories of qualifying assets relevant to our business are the following:
| (1) | Securities purchased in transactions not involving any public offering from the issuer of such securities, which issuer (subject to certain limited exceptions) is an eligible portfolio company, or from any person who is, or has been during the preceding 13 months, an affiliated person of an eligible portfolio company, or from any other person, subject to such rules as may be prescribed by the SEC. An eligible portfolio company is defined in the 1940 Act as any issuer which: |
| · | is organized under the laws of, and has its principal place of business in, the United States; |
| · | is not an investment company (other than a small business investment company wholly owned by the Company) or a company that would be an investment company but for certain exclusions under the 1940 Act; and |
| · | satisfies either of the following: |
| o | has a market capitalization of less than $250 million or does not have any class of securities listed on a national securities exchange; or |
| o | is controlled by a BDC or a group of companies including a BDC, the BDC actually exercises a controlling influence over the management or policies of the eligible portfolio company, and, as a result thereof, the BDC has an affiliated person who is a director of the eligible portfolio company. |
| (2) | Securities of an eligible portfolio company purchased from any person in a private transaction if there is no ready market for such securities and we already own 60% of the outstanding equity of the eligible portfolio company. |
| (3) | Securities received in exchange for or distributed on or with respect to securities described above, or pursuant to the exercise of warrants or rights relating to such securities. |
| (4) | Securities of any eligible portfolio company which we control. |
| (5) | Securities purchased in a private transaction from a U.S. issuer that is not an investment company or from an affiliated person of the issuer, or in transactions incident thereto, if the issuer is in bankruptcy and subject to reorganization or if the issuer, immediately prior to the purchase of its securities was unable to meet its obligations as they came due without material assistance other than conventional lending or financing arrangements. |
| (6) | Cash, cash equivalents, U.S. Government securities or high-quality debt securities maturing in one year or less from the time of investment. |
The regulations defining and interpreting qualifying assets may change over time. We may adjust our investment focus needed to comply with and/or take advantage of any regulatory, legislative, administrative or judicial actions in this area.
Managerial Assistance to Portfolio Companies
A BDC must have been organized and have its principal place of business in the United States and must be operated for the purpose of making investments in the types of securities described in “Regulation — Qualifying Assets” above. However, in order to count portfolio securities as qualifying assets for the purpose of the 70% test, the BDC must either control the issuer of the securities or must offer to make available to the issuer of the securities (other than small and solvent companies described above) significant managerial assistance. Where the BDC purchases such securities in conjunction with one or more other persons acting together, the BDC will satisfy this test if one of the other persons in the group makes available such managerial assistance. Making available managerial assistance means, among other things, any arrangement whereby the BDC, through its directors, officers or employees, offers to provide, and, if accepted, does so provide, significant guidance and counsel concerning the management, operations or business objectives and policies of a portfolio company.
| 28 |
Temporary Investments
Pending investment in other types of “qualifying assets”, as described above, our investments may consist of cash, cash equivalents, U.S. Government securities or high-quality debt securities maturing in one year or less from the time of investment, which we refer to, collectively, as temporary investments, so that 70% of our assets are qualifying assets. Typically, we will invest in highly rated commercial paper, U.S. Government agency notes, U.S. Treasury bills or in repurchase agreements relating to such securities that are fully collateralized by cash or securities issued by the U.S. Government or its agencies. A repurchase agreement involves the purchase by an investor, such as us, of a specified security and the simultaneous agreement by the seller to repurchase it at an agreed-upon future date and at a price which is greater than the purchase price by an amount that reflects an agreed-upon interest rate. There is no percentage restriction on the proportion of our assets that may be invested in such repurchase agreements. However, certain diversification tests in order to qualify as a RIC for federal income tax purposes will typically require us to limit the amount we invest with any one counterparty. Our investment adviser will monitor the creditworthiness of the counterparties with which we enter into repurchase agreement transactions.
Senior Securities
We are permitted, under specified conditions, to issue multiple classes of indebtedness and one class of stock senior to our common stock if our asset coverage, as defined in the 1940 Act, is at least equal to 200% immediately after each such issuance. In addition, while any preferred stock or publicly traded debt securities are outstanding, we may be prohibited from making distributions to our stockholders or the repurchasing of such securities or shares unless we meet the applicable asset coverage ratios at the time of the distribution or repurchase. We may also borrow amounts up to 5% of the value of our total assets for temporary or emergency purposes without regard to asset coverage. For a discussion of the risks associated with leverage, see “Item 1A.Risk Factors—Risks Related to our Business—If we use borrowed funds to make investments or fund our business operations, we will be exposed to risks typically associated with leverage which will increase the risk of investing in us.”
On March 26, 2013, our wholly-owned subsidiary, Medley SBIC LP (‘‘SBIC LP’’), received a Small Business Investment Company (‘‘SBIC’’) license from the Small Business Administration (‘‘SBA’’). In anticipation of receiving an SBIC license, on November 16, 2012, we obtained exemptive relief from the SEC to permit us to exclude the debt of SBIC LP guaranteed by the SBA from from the 200% asset coverage ratio we are required to maintain under the 1940 Act. Pursuant to the 200% asset coverage ratio limitation, we are permitted to borrow one dollar for every dollar we have in assets less all liabilities and indebtedness not represented by debt securities issued by us or loans obtained by us.
The exemptive relief provides us with increased flexibility under the 200% asset coverage test by permitting SBIC LP to borrow up to $150 million (the maximum amount of SBA-guaranteed debentures an SBIC may currently have outstanding once certain conditions have been met) more than we would otherwise be able to absent the receipt of this exemptive relief. As a result, we would, in effect, be permitted to have a lower asset coverage ratio than the 200% asset coverage ratio limitation under the 1940 Act. For example, we would be able to borrow up to $150 million more than the approximately $441.2 million permitted under the asset coverage ratio limit as of September 30, 2016. For additional information on SBA regulations that will affect our access to SBA-guaranteed debentures, see ‘‘Risk Factors —Risks Relating to Our Business. Our SBIC subsidiary is subject to SBA regulations, and any failure to comply with SBA regulations could have an adverse effect on our operations.’’ SBA regulations currently limit the amount that the SBIC LP may borrow to a maximum of $150 million when it has at least $75 million in regulatory capital, receives a capital commitment from the SBA and has been through an examination by the SBA subsequent to licensing.
Code of Ethics
We and MCC Advisors have each adopted a code of ethics pursuant to Rule 17j-1 under the 1940 Act that establishes procedures for personal investments and restricts certain personal securities transactions. Personnel subject to each code may invest in securities for their personal investment accounts, including securities that may be purchased or held by us, so long as such investments are made in accordance with the code’s requirements. You may read and copy the code of ethics at the SEC’s Public Reference Room in Washington, D.C. You may obtain information on the operation of the Public Reference Room by calling the SEC at (202) 551-8090. In addition, the code of ethics is attached as an exhibit to the registration statement of which this prospectus is a part, and is available on the EDGAR Database on the SEC’s Internet site at http://www.sec.gov . You may also obtain copies of the code of ethics, after paying a duplicating fee, by electronic request at the following e-mail address: publicinfo@sec.gov , or by writing the SEC’s Public Reference Section, 100 F Street, N.E., Washington, D.C. 20549.
Privacy Policy
We are committed to maintaining the privacy of stockholders and to safeguarding our non-public personal information. The following information is provided to help you understand what personal information we collect, how we protect that information and why, in certain cases, we may share information with select other parties.
Generally, we do not receive any nonpublic personal information relating to our stockholders, although certain nonpublic personal information of our stockholders may become available to us. We do not disclose any nonpublic personal information about our stockholders or former stockholders to anyone, except as permitted by law or as is necessary in order to service stockholder accounts (for example, to a transfer agent or third party administrator).
We restrict access to nonpublic personal information about our stockholders to our investment adviser’s employees with a legitimate business need for the information. We maintain physical, electronic and procedural safeguards designed to protect the nonpublic personal information of our stockholders.
| 29 |
Proxy Voting Policies and Procedures
We have delegated our proxy voting responsibility to MCC Advisors. The Proxy Voting Policies and Procedures of MCC Advisors are set forth below. The guidelines are reviewed periodically by MCC Advisors and our independent directors, and, accordingly, are subject to change.
MCC Advisors is registered with the SEC as an investment adviser under the Advisers Act. As an investment adviser registered under the Advisers Act, MCC Advisors will have fiduciary duties to us. As part of this duty, MCC Advisors recognizes that it must vote client securities in a timely manner free of conflicts of interest and in our best interests and the best interests of our stockholders. MCC Advisors’ Proxy Voting Policies and Procedures have been formulated to ensure decision-making consistent with these fiduciary duties.
These policies and procedures for voting proxies for our investment advisory clients are intended to comply with Section 206 of, and Rule 206(4)-6 under, the Advisers Act.
Proxy Policies
MCC Advisors evaluates routine proxy matters, such as proxy proposals, amendments or resolutions on a case-by-case basis. Routine matters are typically proposed by management and MCC Advisors will normally support such matters so long as they do not measurably change the structure, management control, or operation of the corporation and are consistent with industry standards as well as the corporate laws of the state of incorporation.
MCC Advisors also evaluates non-routine matters on a case-by-case basis. Non-routine proposals concerning social issues are typically proposed by stockholders who believe that the corporation’s internally adopted policies are ill-advised or misguided. If MCC Advisors has determined that management is generally socially responsible, MCC Advisors will generally vote against these types of non-routine proposals. Non-routine proposals concerning financial or corporate issues are usually offered by management and seek to change a corporation’s legal, business or financial structure. MCC Advisors will generally vote in favor of such proposals provided the position of current stockholders is preserved or enhanced. Non-routine proposals concerning stockholder rights are made regularly by both management and stockholders. They can be generalized as involving issues that transfer or realign board or stockholder voting power. MCC Advisors typically would oppose any proposal aimed solely at thwarting potential takeovers by requiring, for example, super-majority approval. At the same time, MCC Advisors believes stability and continuity promote profitability. MCC Advisors’ guidelines in this area seek a balanced view and individual proposals will be carefully assessed in the context of their particular circumstances.
If a vote may involve a material conflict of interest, prior to approving such vote, MCC Advisors must consult with its chief compliance officer to determine whether the potential conflict is material and if so, the appropriate method to resolve such conflict. If the conflict is determined not to be material, MCC Advisors’ employees shall vote the proxy in accordance with MCC Advisors’ proxy voting policy.
Proxy Voting Records
You may obtain information about how we voted proxies by making a written request for proxy voting information to:
Chief Compliance Officer
Medley Capital Corporation
280 Park Avenue, 6th Floor East
New York, NY 10017
Other
Under the 1940 Act, we are not generally able to issue and sell our common stock at a price below NAV per share. We may, however, issue and sell our common stock, at a price below the current NAV of the common stock, or issue and sell warrants, options or rights to acquire such common stock, at a price below the current NAV of the common stock if our board of directors determines that such sale is in our best interest and in the best interests of our stockholders, and our stockholders have approved our policy and practice of making such sales within the preceding 12 months. In any such case, the price at which our securities are to be issued and sold may not be less than a price which, in the determination of our board of directors, closely approximates the market value of such securities. However, we currently do not have the requisite stockholder approval, nor do we have any current plans to seek stockholder approval, to sell or issue shares of our common stock at a price below NAV per share.
| 30 |
In addition, at our 2012 Annual Meeting of Stockholders we received approval from our stockholders to authorize us, with the approval of our board of directors, to issue securities to, subscribe to, convert to, or purchase shares of the Company’s common stock in one or more offerings, subject to certain conditions as set forth in the proxy statement. Such authorization has no expiration.
We expect to be periodically examined by the SEC for compliance with the 1940 Act.
We are required to provide and maintain a bond issued by a reputable fidelity insurance company to protect us against larceny and embezzlement. Furthermore, as a BDC, we are prohibited from protecting any director or officer against any liability to us or our stockholders arising from willful misfeasance, bad faith, gross negligence or reckless disregard of the duties involved in the conduct of such person’s office.
We and MCC Advisors adopted written policies and procedures reasonably designed to prevent violation of the federal securities laws, and will review these policies and procedures annually for their adequacy and the effectiveness of their implementation. We and MCC Advisors have designated a chief compliance officer to be responsible for administering the policies and procedures.
Small Business Investment Company Regulations
On March 26, 2013, our wholly-owned subsidiary, Medley SBIC LP (“SBIC LP”), a Delaware limited partnership, received a license from the Small Business Administration (“SBA”) to operate as a Small Business Investment Company (“SBIC”) under Section 301(c) of the Small Business Investment Company Act of 1958.
The SBIC license allows the SBIC LP to obtain leverage by issuing SBA-guaranteed debentures, subject to the issuance of a capital commitment by the SBA and other customary procedures. SBA-guaranteed debentures are non-recourse, interest only debentures with interest payable semi-annually and have a ten year maturity. The principal amount of SBA-guaranteed debentures is not required to be paid prior to maturity but may be prepaid at any time without penalty. The interest rate of SBA-guaranteed debentures is fixed on a semi-annual basis at a market-driven spread over U.S. Treasury Notes with 10-year maturities. The SBA, as a creditor, will have a superior claim to the SBIC LP’s assets over our stockholders in the event we liquidate the SBIC LP or the SBA exercises its remedies under the SBA-guaranteed debentures issued by the SBIC LP upon an event of default.
SBICs are designed to stimulate the flow of private equity capital to eligible small businesses. Under SBA regulations, SBICs may make loans to eligible small businesses, invest in the equity securities of such businesses and provide them with consulting and advisory services. SBA regulations currently limit the amount that an SBIC may borrow up to a maximum of $150 million when it has at least $75 million in regulatory capital, receives a capital commitment from the SBA and has been through an examination by the SBA subsequent to licensing.
Under present SBA regulations, eligible small businesses generally include businesses that (together with their affiliates) have a tangible net worth not exceeding $18 million and have average annual fully taxed net income after U.S. federal income taxes not exceeding $6 million (average net income to be computed without benefit of any carryover loss) for the two most recent fiscal years. In addition, an SBIC must devote 25% of its investment activity to “smaller” concerns as defined by the SBA. A smaller concern generally includes businesses that have a tangible net worth not exceeding $6 million and have average annual net income after U.S. federal income taxes not exceeding $2 million (average net income to be computed without benefit of any net carryover loss) for the two most recent fiscal years. SBA regulations also provide alternative size standard criteria to determine eligibility for designation as an eligible small business or smaller concern, which criteria depend on the primary industry in which the business is engaged and are based on such factors as the number of employees and gross revenue. However, once an SBIC has invested in a company, it may continue to make follow-on investments in the company, regardless of the size of the company at the time of the follow-on investment, up to the time of the company’s initial public offering, if any.
The SBA prohibits an SBIC from providing funds to small businesses for certain purposes, such as relending or investing outside the United States, to businesses engaged in a few prohibited industries and to certain “passive” ( i.e. , non-operating) companies. In addition, without prior SBA approval, an SBIC may not invest an amount equal to more than approximately 30% of the SBIC’s regulatory capital in any one company and its affiliates.
The SBA places certain limitations on the financing terms of investments by SBICs in portfolio companies (such as limiting the permissible interest rate on debt securities held by an SBIC in a portfolio company). Although prior regulations prohibited an SBIC from controlling a small business concern except in limited circumstances, regulations adopted by the SBA in 2002 now allow an SBIC to exercise control over a small business for a period of up to seven years from the date on which the SBIC initially acquires its control position. This control period may be extended for an additional period of time with the SBA’s prior written approval.
The SBA restricts the ability of an SBIC to lend money to any of its officers, directors and employees or to invest in affiliates thereof. The SBA also prohibits, without prior SBA approval, a “change of control” of an SBIC or transfers that would result in any person (or a group of persons acting in concert) owning 10% or more of a class of capital stock of a licensed SBIC. A “change of control” is any event which would result in the transfer of the power, direct or indirect, to direct the management and policies of an SBIC, whether through ownership, contractual arrangements or otherwise.
| 31 |
An SBIC (or group of SBICs under common control) may generally have outstanding debentures guaranteed by the SBA in amounts up to twice the amount of the privately raised funds of the SBIC(s). Debentures guaranteed by the SBA have a maturity of ten years, require semi-annual payments of interest and do not require any principal payments prior to maturity. The SBA, as a creditor, will have a superior claim to our SBIC subsidiary’s assets over our stockholders in the event we liquidate our SBIC subsidiary or the SBA exercises its remedies under the SBA-guaranteed debentures issued by our SBIC subsidiary upon an event of default.
SBICs must invest idle funds that are not being used to make loans in investments permitted under SBIC regulations in the following limited types of securities: (1) direct obligations of, or obligations guaranteed as to principal and interest by, the U.S. government, which mature within 15 months from the date of the investment; (2) repurchase agreements with federally insured institutions with a maturity of seven days or less (and the securities underlying the repurchase obligations must be direct obligations of or guaranteed by the federal government); (3) certificates of deposit with a maturity of one year or less, issued by a federally insured institution; (4) a deposit account in a federally insured institution that is subject to a withdrawal restriction of one year or less; (5) a checking account in a federally insured institution; or (6) a reasonable petty cash fund.
SBICs are periodically examined and audited by the SBA’s staff to determine their compliance with SBA regulations and are periodically required to file certain forms with the SBA. If an SBIC fails to comply with applicable SBA regulations, the SBA could, depending on the severity of the violation, limit or prohibit the SBIC’s use of debentures, declare outstanding debentures immediately due and payable, and/or limit the SBIC from making new investments. In addition, the SBIC may also be limited in its ability to make distributions to us if it does not have sufficient capital in accordance with SBA regulations. Such actions by the SBA would, in turn, negatively affect us because Medley SBIC LP is our wholly owned subsidiary.
Neither the SBA nor the U.S. government or any of its agencies or officers has approved any ownership interest to be issued by us or any obligation that we or any of our subsidiaries may incur.
Election to Be Taxed as a RIC
As a BDC, we have elected and qualified to be treated as a RIC under Subchapter M of the Code. As a RIC, we generally will not have to pay corporate-level U.S. federal income taxes on any net ordinary income or capital gains that we timely distribute to our stockholders as dividends. To qualify as a RIC, we must, among other things, meet certain source-of-income and asset diversification requirements (as described below). In addition, we must distribute to our stockholders, for each taxable year, at least 90% of our “investment company taxable income,” which is generally our net ordinary income plus the excess of realized net short-term capital gains over realized net long-term capital losses (the “Distribution Requirement”). Our SBIC subsidiary may be limited by the Small Business Investment Act of 1958, and SBA regulations governing SBICs, from making certain distributions to us that may be necessary to enable us to maintain our status as a RIC. We may have to request a waiver of the SBA’s restrictions for our SBIC subsidiary to make certain distributions to maintain our RIC status. We cannot assure you that the SBA will grant such a waiver.
Taxation as a RIC
As a RIC, if we satisfy the Distribution Requirement, we will not be subject to U.S. federal income tax on the portion of our investment company taxable income and net capital gain, defined as net long-term capital gains in excess of net short-term capital losses, we distribute to stockholders. We will be subject to U.S. federal income tax at regular corporate rates on any net income or net capital gain not distributed to our stockholders.
Medley Capital will be subject to a nondeductible U.S. federal excise tax of 4% on undistributed income if it does not distribute at least 98% of its ordinary income in any calendar year and 98.2% of its capital gain net income for each one-year period ending on October 31. Depending on the level of investment company taxable income (“ICTI”) earned in a tax year, the Company may choose to carry forward ICTI in excess of current year dividend distributions into the next tax year. Any such carryover ICTI must be distributed before the end of that next tax year through a dividend declared prior to filing the final tax return related to the year which generated such ICTI. To the extent that the Company determines that its estimated current year annual taxable income will be in excess of estimated current year dividend distributions for excise tax purposes, the Company accrues excise tax, if any, on estimated excess taxable income as taxable income is earned.
| 32 |
In order to qualify as a RIC for U.S. federal income tax purposes, we must, among other things:
| · | qualify to be treated as a BDC under the 1940 Act at all times during each taxable year; |
| · | derive in each taxable year at least 90% of our gross income from dividends, interest, payments with respect to certain securities loans, gains from the sale of stock or other securities, or other income derived with respect to our business of investing in such stock or securities, and net income derived from interests in “qualified publicly traded partnerships” (partnerships that are traded on an established securities market or tradable on a secondary market, other than partnerships that derive 90% of their income from interest, dividends and other permitted RIC income) (the “90% Income Test”); and |
| · | diversify our holdings so that at the end of each quarter of the taxable year: |
| o | at least 50% of the value of our assets consists of cash, cash equivalents, U.S. government securities, securities of other RICs, and other securities if such other securities of any one issuer do not represent more than 5% of the value of our assets or more than 10% of the outstanding voting securities of the issuer; and |
| o | no more than 25% of the value of our assets is invested in the securities, other than U.S. government securities or securities of other RICs, of one issuer or of two or more issuers that are controlled, as determined under applicable tax rules, by us and that are engaged in the same or similar or related trades or businesses or in the securities of one or more qualified publicly traded partnerships (the “Diversification Tests”). |
We may invest in partnerships, including qualified publicly traded partnerships, which may result in our being subject to state, local or foreign income and franchise or withholding liabilities.
Any underwriting fees paid by us are not deductible. We may be required to recognize taxable income in circumstances in which we do not receive cash. For example, if we hold debt obligations that are treated under applicable tax rules as having original issue discount (such as debt instruments with PIK interest or, in certain cases, with increasing interest rates or issued with warrants), we must include in income each year a portion of the original issue discount that accrues over the life of the obligation, regardless of whether cash representing such income is received by us in the same taxable year. Because any original issue discount accrued will be included in our investment company taxable income for the year of accrual, we may be required to make a distribution to our stockholders in order to satisfy the Distribution Requirement, even though we will not have received any corresponding cash amount.
Certain of our investment practices may be subject to special and complex U.S. federal income tax provisions that may, among other things, (1) treat dividends that would otherwise constitute qualified dividend income as non-qualified dividend income, (2) treat dividends that would otherwise be eligible for the corporate dividends received deduction as ineligible for such treatment, (3) disallow, suspend or otherwise limit the allowance of certain losses or deductions, (4) convert lower-taxed long term capital gain into higher-taxed short-term capital gain or ordinary income, (5) convert an ordinary loss or a deduction into a capital loss (the deductibility of which is more limited), (6) cause us to recognize income or gain without a corresponding receipt of cash, (7) adversely affect the time as to when a purchase or sale of stock or securities is deemed to occur, (8) adversely alter the characterization of certain complex financial transactions and (9) produce income that will not be qualifying income for purposes of the 90% Income Test. We intend to monitor our transactions and may make certain tax elections to mitigate the effect of these provisions and prevent our disqualification as a RIC.
Gains or losses realized by us from warrants acquired as well as any loss attributable to the lapse of such warrants generally will be treated as capital gain or loss. Such gain or loss generally will be long term or short term, depending on how long we held a particular warrant.
Although we do not presently expect to do so, we are authorized to borrow funds and to sell assets in order to satisfy distribution requirements. However, under the 1940 Act, we are not permitted to make distributions to our stockholders while our debt obligations and other senior securities are outstanding unless certain “asset coverage” tests are met. See “Business — Regulation — Senior Securities.” Moreover, our ability to dispose of assets to meet our distribution requirements may be limited by (1) the illiquid nature of our portfolio and/or (2) other requirements relating to our qualification as a RIC, including the Diversification Tests. If we dispose of assets in order to meet the Distribution Requirement or the excise tax requirement, we may make such dispositions at times that, from an investment standpoint, are not advantageous.
Some of the income and fees that we may recognize will not satisfy the 90% Income Test. In order to ensure that such income and fees do not disqualify us as a RIC for a failure to satisfy the 90% Income Test, we may be required to recognize such income and fees indirectly through one or more entities treated as corporations for U.S. federal income tax purposes. Such corporations will be required to pay U.S. corporate income tax on their earnings, which ultimately will reduce our return on such income and fees.
Failure to Qualify as a RIC
If we were unable to continue to qualify for treatment as a RIC, we would be subject to tax on all of our taxable income at regular corporate rates. We would not be able to deduct distributions to stockholders, nor would they be required to be made. Distributions, including distributions of net long-term capital gain, would generally be taxable to our stockholders as ordinary dividend income to the extent of our current and accumulated earnings and profits. Subject to certain limitations under the Code, corporate distributees would be eligible for the dividends received deduction. Distributions in excess of our current and accumulated earnings and profits would be treated first as a return of capital to the extent of the stockholder’s tax basis, and any remaining distributions would be treated as a capital gain. If we fail to qualify as a RIC for a period greater than two taxable years, to qualify as a RIC in a subsequent year we may be subject to regular corporate tax on any net built-in gains with respect to certain of our assets (i.e. , the excess of the aggregate gains, including items of income, over aggregate losses that would have been realized with respect to such assets if we had been liquidated) that we elect to recognize on requalification or when recognized over the next ten years.
| 33 |
Foreign Account Tax Compliance Act
Legislation was enacted on March 18, 2010 that will impose a 30% U.S. withholding tax on dividends paid by U.S. issuers to a foreign financial institution after December 31, 2013 and on the gross proceeds from the disposition of stock paid to a foreign financial institution after December 31, 2016, unless such institution enters into an agreement with the U.S. Treasury Department (“Treasury”) to collect and provide to Treasury substantial information regarding U.S. account holders, including certain account holders that are foreign entities with U.S. owners, with such institution. The legislation also generally imposes a withholding tax of 30% on dividends paid by U.S. issuers and on the gross proceeds from the disposition of stock paid to a non-financial foreign entity unless such entity provides the withholding agent with a certification that it does not have any substantial U.S. owners or a certification identifying the direct and indirect substantial U.S. owners of the entity. Under certain circumstances, a holder may be eligible for refunds or credits of such taxes. Investors are urged to consult with their own tax advisors regarding the possible implications of this recently enacted legislation on their investment in shares of our common stock.
Before you invest in our securities, you should be aware of various risks, including those described below. You should carefully consider these risk factors, together with all of the other information included in this Form 10-K, before you decide whether to make an investment in our securities. The risks set out below are not the only risks we face. The risks described below, as well as additional risks and uncertainties presently unknown by us or currently not deemed significant could negatively affect our business, financial condition and results of operations. In such case, our NAV and the trading price of our common stock or other securities could decline, and you may lose all or part of your investment.
RISK RELATING TO OUR BUSINESS AND STRUCTURE
Certain Risks in the Current Environment
Capital markets may experience periods of disruption and instability and we cannot predict when these conditions will occur. Such market conditions could materially and adversely affect debt and equity capital markets in the United States and abroad, which could have a negative impact on our business, financial condition and results of operations.
As a business development company, we must maintain our ability to raise additional capital for investment purposes. Without sufficient access to the capital markets or credit markets, we may be forced to curtail our business operations or we may not be able to pursue new business opportunities.
The U.S. and global capital markets experienced extreme volatility and disruption that began in mid-2007, and the U.S. economy was in recession for several consecutive calendar quarters during the same period, as evidenced by a lack of liquidity in the debt capital markets, write-offs in the financial services sector, the re-pricing of credit risk and the failure of certain major financial institutions. While the capital markets have improved, these conditions could deteriorate again in the future. During such market disruptions, we may have difficulty raising debt or equity capital, especially as a result of regulatory constraints.
Market conditions may in the future make it difficult to extend the maturity of or refinance our existing indebtedness and any failure to do so could have a material adverse effect on our business. The illiquidity of our investments may make it difficult for us to sell such investments if required. As a result, we may realize significantly less than the value at which we have recorded our investments. In addition, significant changes in the capital markets, including the disruption and volatility, have had, and may in the future have, a negative effect on the valuations of our investments and on the potential for liquidity events involving our investments. An inability to raise capital, and any required sale of our investments for liquidity purposes, could have a material adverse impact on our business, financial condition and results of operations.
Various social and political tensions in the United States and around the world, including in the Middle East, Eastern Europe and Russia, may continue to contribute to increased market volatility, may have long-term effects on the United States and worldwide financial markets, and may cause further economic uncertainties or deterioration in the United States and worldwide. Several European Union (‘‘EU’’) countries, including Greece, Ireland, Italy, Spain, and Portugal, continue to face budget issues, some of which may have negative long-term effects for the economies of those countries and other EU countries. In July and August 2015, Greece reached agreements with its creditors for bailouts that provide aid in exchange for certain austerity measures. These and similar austerity measures may adversely affect world economic conditions and have an adverse impact on our business and that of our portfolio companies. In the second quarter of 2015, stock prices in China experienced a significant drop, resulting primarily from continued sell-off of shares trading in Chinese markets. In August 2015, Chinese authorities sharply devalued China’s currency. In addition, the referendum by British voters to exit the EU (“Brexit”) in June 2016 has led to further disruption and instability in the global markets. There is also continued concern about national-level support for the euro and the accompanying coordination of fiscal and wage policy among European Economic and Monetary Union member countries. The recent United States and global economic downturn, or a return to the recessionary period in the United States, could adversely impact our investments. We cannot predict the duration of the effects related to these or similar events in the future on the U.S. economy and securities markets or on our investments. We monitor developments and seek to manage our investments in a manner consistent with achieving our investment objective, but there can be no assurance that we will be successful in doing so.
| 34 |
Any further disruptive conditions in the financial industry and the impact of new legislation in response to those conditions could restrict our business operations and could adversely impact our results of operations and financial condition. In addition, the business development company market may be more sensitive to changes in interest rates or other factors and to the extent the business development company market trades down, our shares might likewise be affected. If the fair value of our assets declines substantially, we may fail to maintain the asset coverage ratios imposed upon us by the 1940 Act. Any such failure would affect our ability to issue securities, including borrowings, and pay dividends, which could materially impair our business operations. Our liquidity could be impaired further by an inability to access the capital markets or to consummate new borrowing facilities to provide capital for normal operations, including new originations. In recent years, reflecting concern about the stability of the financial markets, many lenders and institutional investors have reduced or ceased providing funding to borrowers.
Difficult market and political conditions may adversely affect our business in many ways, including by reducing the value or hampering the performance of the investments made by our funds, each of which could materially and adversely affect our business, results of operations and financial condition.
Our business is materially affected by conditions in the global financial markets and economic and political conditions throughout the world, such as interest rates, availability and cost of credit, inflation rates, economic uncertainty, changes in laws (including laws relating to our taxation, taxation of our investors, the possibility of changes to tax laws in either the United States or any non-U.S. jurisdiction and regulations on asset managers), trade barriers, commodity prices, currency exchange rates and controls and national and international political circumstances (including wars, terrorist acts and security operations). These factors are outside of our control and may affect the level and volatility of asset prices and the liquidity and value of investments, and we may not be able to or may choose not to manage our exposure to these conditions. Ongoing developments in the U.S. and global financial markets following the unprecedented turmoil in the global capital markets and the financial services industry in late 2008 and early 2009 continue to illustrate that the current environment is still one of uncertainty and instability for investment management businesses. These and other conditions in the global financial markets and the global economy may result in adverse consequences for our funds and their respective investee companies, which could restrict such funds’ investment activities and impede such funds’ ability to effectively achieve their investment objectives. In addition, because the fees we earn under our investment management agreements are based in part on the market value of our assets under management and in part on investment performance, if any of these factors cause a decline in our assets under management or result in non-performance of loans by investee companies, it would result in lower fees earned, which could in turn materially and adversely affect our business and results of operations.
The downgrade of the U.S. credit rating and the economic crisis in Europe could negatively impact our liquidity, financial condition and earnings.
U.S. debt ceiling and budget deficit concerns together with signs of deteriorating sovereign debt conditions in Europe continue to present the possibility of a credit-rating downgrade, economic slowdowns, or a recession for the United States. The impact of any further downgrades to the U.S. government’s sovereign credit rating or downgraded sovereign credit ratings of European countries or the Russian Federation, or their perceived creditworthiness could adversely affect the U.S. and global financial markets and economic conditions. These developments, along with any further European sovereign debt issues, could cause interest rates and borrowing costs to rise, which may negatively impact our ability to access the debt markets on favorable terms. Continued adverse economic conditions could have a material adverse effect on our business, financial condition and results of operations.
In October 2014, the U.S. Federal Reserve announced that it has terminated its bond-buying program, or quantitative easing, which was designed to stimulate the economy and expand the Federal Reserve's holdings of long-term securities until key economic indicators, such as the unemployment rate, showed signs of improvement. It is unclear what effect, if any, the Federal Reserve's termination of quantitative easing will have on the value of our investments. However, it is possible that without quantitative easing by the Federal Reserve, these developments, along with the European sovereign debt crisis, could cause interest rates and borrowing costs to rise, which may negatively impact our ability to access the debt markets on favorable terms. On December 16, 2015, the Federal Reserve raised the target range for the federal funds rate to a range between 0.25% to 0.50%. Additionally, on September 21, 2016, the Federal Reserve reaffirmed its view that the current target range for the federal funds rate was appropriate based on current economic conditions and that it would be appropriate to raise the rate when economic conditions improve further. However, if key economic indicators, such as the unemployment rate or inflation, do not progress at a rate consistent with the Federal Reserve’s objectives, the target range for the federal funds rate may increase and cause interest rates and borrowing costs to rise, which may negatively impact our ability to access the debt markets on favorable terms. Any continued adverse economic conditions could have a material adverse effect on our business, financial condition and results of operations.
| 35 |
A failure or the perceived risk of a failure to raise the statutory debt limit of the United States could have a material adverse effect on our business, financial condition and results of operations.
In the future, the U.S. Government may not be able to meet its debt payments unless the federal debt ceiling is raised. The federal debt limit has been suspended since late 2015, but the law is set to be reinstated in March 2016. If legislation increasing the debt ceiling is not enacted, as needed, and the debt ceiling is reached, the federal government may stop or delay making payments on its obligations. A failure by Congress to raise the debt limit to the extent necessary would increase the risk of default by the United States on its obligations, as well as the risk of other economic dislocations. If the U.S. Government fails to complete its budget process or to provide for a continuing resolution before the expiration of the current continuing resolution, another federal government shutdown may result. Such a failure or the perceived risk of such a failure, consequently, could have a material adverse effect on the financial markets and economic conditions in the United States and throughout the world. It could also limit our ability and the ability of our portfolio companies to obtain financing, and it could have a material adverse effect on the valuation of our portfolio companies. Consequently, the continued uncertainty in the general economic environment and potential debt ceiling implications, as well in specific economies of several individual geographic markets in which our portfolio companies operate, could adversely affect our business, financial condition and results of operations.
Risks Related to Our Business
We may suffer credit losses.
Private debt in the form of secured loans to corporate and asset-based borrowers is highly speculative and involves a high degree of risk of credit loss, and therefore an investment in our securities may not be suitable for someone with a low tolerance for risk. These risks are likely to increase during an economic recession, such as the economic recession or downturn that the United States and many other countries have recently experienced or are experiencing.
Because we use borrowed funds to make investments or fund our business operations, we are exposed to risks typically associated with leverage which increase the risk of investing in us.
We have borrowed funds, including through the issuance of $40.0 million, $63.5 million, and $74.0 million in aggregate principal amount of 7.125% unsecured notes due March 30, 2019, 6.125% unsecured notes due March 30, 2023, and 6.50% unsecured notes due January 30, 2021 (collectively the “Notes”), through draws from our Revolving Credit Facility, Term Loan Facility and SBA-guaranteed debentures to leverage our capital structure, which is generally considered a speculative investment technique. As of September 30, 2016, before netting out debt issuance costs, our Term Loan Facility and Revolving Credit Facility had outstanding balances of $174.0 million and $14.0 million, respectively, and we had $150.0 million SBA-guaranteed debentures outstanding. As a result:
| · | our common shares may be exposed to an increased risk of loss because a decrease in the value of our investments may have a greater negative impact on the value of our common shares than if we did not use leverage; |
| · | if we do not appropriately match the assets and liabilities of our business, adverse changes in interest rates could reduce or eliminate the incremental income we make with the proceeds of any leverage; |
| · | our ability to pay dividends on our common stock may be restricted if our asset coverage ratio with respect to each of our outstanding senior securities representing indebtedness and our outstanding preferred shares, as defined by the 1940 Act, is not at least 200% and any amounts used to service indebtedness or preferred stock would not be available for such dividends; |
| · | the Revolving Credit Facility is subject to periodic renewal by our lenders, whose continued participation cannot be guaranteed; |
| · | the Facilities contain covenants restricting our operating flexibility; |
| · | we, and indirectly our stockholders, bear the cost of issuing and paying interest or dividends on such securities; and |
| · | any convertible or exchangeable securities that we issue may have rights, preferences and privileges more favorable than those of our common shares. |
Under the provisions of the 1940 Act, we are permitted, as a BDC, to issue debt securities or preferred stock and/or borrow money from banks and other financial institutions, which we collectively refer to as “senior securities”, only in amounts such that our asset coverage ratio equals at least 200% after each issuance of senior securities.
For a discussion of the terms of the Facilities and the Notes, see “Management’s Discussion and Analysis of Financial Condition and Results of Operations — Financial Condition, Liquidity and Capital Resources.”
| 36 |
Legislation may allow us to incur additional leverage.
As a BDC, generally, we are not permitted to incur indebtedness unless immediately after such borrowing we have an asset coverage for total borrowings of at least 200% (i.e., the amount of debt may not exceed 50% of the value of our assets). If recent legislation in the U.S. House of Representatives is passed, or similar legislation is introduced, it would modify this section of the 1940 Act and increase the amount of debt that BDCs may incur by modifying the asset coverage percentage from 200% to 150%. As a result, we may be able to incur additional indebtedness in the future, and our shareholders may face increased investment risk. In addition, since our management fee is calculated as a percentage of the value of our gross assets, which includes any borrowings for investment purposes, the management fee expenses will increase if we incur additional indebtedness.
Covenants in the Facilities may restrict our financial and operating flexibility.
We maintain the Facilities with certain lenders party thereto from time to time and ING Capital LLC, as administrative agent. The Facilities are secured by substantially all of our assets, subject to certain exclusions. Availability of loans under the Facilities is linked to the valuation of the collateral pursuant to a borrowing base mechanism. Borrowings under the Facilities are subject to, among other things, a minimum borrowing/collateral base. Substantially all of our assets are pledged as collateral under the Facilities. The Facilities require us to, among other things (i) make representations and warranties regarding the collateral as well as our business and operations, (ii) agree to certain indemnification obligations, and (iii) agree to comply with various affirmative and negative covenants. The documents for each of the Facilities also include default provisions such as the failure to make timely payments under the Facilities, as the case may be, the occurrence of a change in control, and our failure to materially perform under the operative agreements governing the Facilities, which, if not complied with, could accelerate repayment under the Facilities, thereby materially and adversely affecting our liquidity, financial condition and results of operations.
As a result of such covenants and restrictions in the Facilities, we will be limited in how we conduct our business and we may be unable to raise additional debt or equity financing to take advantage of new business opportunities. In addition, our ability to satisfy the financial requirements required by the Facilities can be affected by events beyond our control and we cannot assure you that we will meet these requirements. We cannot assure you that we will be able to maintain compliance with these covenants in the future and, if we fail to do so, we may be in default under the Facilities, and we may be prohibited from undertaking actions that are necessary or desirable to maintain and expand our business.
Default under the Facilities could allow the lender(s) to declare all amounts outstanding to be immediately due and payable. If the lender(s) declare amounts outstanding under the Facilities to be due, the lender(s) could proceed against the assets pledged to secure the debt under the Facilities. Any event of default, therefore, could have a material adverse effect on our business if the lender(s) determine to exercise their rights.
The lack of liquidity in our investments may adversely affect our business.
We anticipate that our investments generally will be made in private companies. Substantially all of these securities will be subject to legal and other restrictions on resale or will be otherwise less liquid than publicly traded securities. The illiquidity of our investments may make it difficult for us to sell such investments if the need arises. In addition, if we are required to liquidate all or a portion of our portfolio quickly, we may realize significantly less than the value at which we had previously recorded our investments. In addition, we may face other restrictions on our ability to liquidate an investment in a portfolio company to the extent that we or MCC Advisors has material non-public information regarding such portfolio company.
A substantial portion of our portfolio investments will be recorded at fair value as determined in good faith by or under the direction of our board of directors and, as a result, there may be uncertainty regarding the value of our portfolio investments.
The debt and equity securities in which we invest for which market quotations are not readily available will be valued at fair value as determined in good faith by or under the direction of our board of directors. Most, if not all, of our investments (other than cash and cash equivalents) will be classified as Level 3 under Accounting Standards Codification Topic 820 — Fair Value Measurements and Disclosures. This means that our portfolio valuations will be based on unobservable inputs and our own assumptions about how market participants would price the asset or liability in question. We expect that inputs into the determination of fair value of our portfolio investments will require significant management judgment or estimation. Even if observable market data are available, such information may be the result of consensus pricing information or broker quotes, which include a disclaimer that the broker would not be held to such a price in an actual transaction. The non-binding nature of consensus pricing and/or quotes accompanied by disclaimers materially reduces the reliability of such information. We have retained the services of independent valuation firms to review the valuation of these loans and securities. The types of factors that our board of directors may take into account in determining the fair value of our investments generally include, as appropriate, comparison to publicly traded securities including such factors as yield, maturity and measures of credit quality, the enterprise value of a portfolio company, the nature and realizable value of any collateral, the portfolio company’s ability to make payments and its earnings and discounted cash flow, the markets in which the portfolio company does business and other relevant factors. Because such valuations, and particularly valuations of private securities and private companies, are inherently uncertain, may fluctuate over short periods of time and may be based on estimates, our determinations of fair value may differ materially from the values that would have been used if a ready market for these loans and securities existed. Our NAV could be adversely affected if our determinations regarding the fair value of our investments were materially higher than the values that we ultimately realize upon the disposal of such loans and securities.
| 37 |
We are a non-diversified investment company within the meaning of the 1940 Act, and therefore we are not limited with respect to the proportion of our assets that may be invested in securities of a single issuer.
We are classified as a non-diversified investment company within the meaning of the 1940 Act, which means that we are not limited by the 1940 Act with respect to the proportion of our assets that we may invest in securities of a single issuer. We also are not adopting any policy restricting the percentage of our assets that may be invested in a single portfolio company. To the extent that we assume large positions in the securities of a small number of issuers, our NAV may fluctuate to a greater extent than that of a diversified investment company as a result of changes in the financial condition or the market’s assessment of the issuer. We may also be more susceptible to any single economic or regulatory occurrence than a diversified investment company. Beyond our income tax diversification requirements under Subchapter M of the Code, we do not have fixed guidelines for diversification, and our investments could be concentrated in relatively few portfolio companies.
Our ability to enter into transactions with our affiliates will be restricted, which may limit the scope of investments available to us.
We are prohibited under the 1940 Act from participating in certain transactions with our affiliates without the prior approval of our independent directors and, in some cases, of the SEC. Any person that owns, directly or indirectly, five percent or more of our outstanding voting securities will be our affiliate for purposes of the 1940 Act, and we are generally prohibited from buying or selling any security from or to such affiliate, absent the prior approval of our independent directors. The 1940 Act also prohibits certain “joint” transactions with certain of our affiliates, which could include investments in the same portfolio company, without prior approval of our independent directors and, in some cases, of the SEC. We are prohibited from buying or selling any security from or to any person who owns more than 25% of our voting securities or certain of that person’s affiliates, or entering into prohibited joint transactions with such persons, absent the prior approval of the SEC. As a result of these restrictions, we may be prohibited from buying or selling any security (other than any security of which we are the issuer) from or to any portfolio company of a private equity fund managed by our investment adviser or its affiliates without the prior approval of the SEC, which may limit the scope of investment opportunities that would otherwise be available to us.
We may, however, co-invest with our investment adviser and its affiliates’ other clients in certain circumstances where doing so is consistent with applicable law and SEC staff interpretations. For example, we may co-invest with such accounts consistent with guidance promulgated by the SEC staff permitting us and such other accounts to purchase interests in a single class of privately placed securities so long as certain conditions are met, including that MCC Advisors, acting on our behalf and on behalf of other clients, negotiates no term other than price. We may also co-invest with our investment adviser’s other clients as otherwise permissible under regulatory guidance, applicable regulations and MCC Advisors’ allocation policy. Under this allocation policy, a fixed percentage of each opportunity, which may vary based on asset class and from time to time, will be offered to us and similar eligible accounts, as periodically determined by MCC Advisors and approved by our board of directors, including our independent directors. The allocation policy further provides that allocations among us and these other accounts will generally be made pro rata based on each account’s capital available for investment, as determined, in our case, by MCC Advisors. It is our policy to base our determinations as to the amount of capital available for investment based on such factors as the amount of cash on-hand, existing commitments and reserves, if any, the targeted leverage level, the targeted asset mix and diversification requirements and other investment policies and restrictions set by our board of directors or imposed by applicable laws, rules, regulations or interpretations. We expect that these determinations will be made similarly for other accounts. However, we can offer no assurance that investment opportunities will be allocated to us fairly or equitably in the short-term or over time.
In addition, we have received an order from the SEC that permits us to negotiate the terms of co-investments with other funds managed by MCC Advisors or its affiliates subject to the conditions included therein. In situations where co-investment with other funds managed by MCC Advisors or its affiliates is not permitted or appropriate, such as when there is an opportunity to invest in different securities of the same issuer or where the different investments could be expected to result in a conflict between our interests and those of other MCC Advisors clients, MCC Advisors will need to decide which client will proceed with the investment. MCC Advisors will make these determinations based on its policies and procedures, which generally require that such opportunities be offered to eligible accounts on an alternating basis that will be fair and equitable over time. Moreover, except in certain circumstances, we will be unable to invest in any issuer in which a fund managed by MCC Advisors or its affiliates has previously invested. Similar restrictions limit our ability to transact business with our officers or directors or their affiliates.
We will be exposed to risks associated with changes in interest rates.
Interest rate fluctuations may have a substantial negative impact on our investments, the value of our common stock and our rate of return on invested capital. A reduction in the interest rates on new investments relative to interest rates on current investments could also have an adverse impact on our net interest income. An increase in interest rates could decrease the value of any investments we hold which earn fixed interest rates and also could increase our interest expense, thereby decreasing our net income. Also, an increase in interest rates available to investors could make investment in our common stock less attractive if we are not able to increase our dividend rate, which could reduce the value of our common stock.
| 38 |
It is unclear how increased regulatory oversight and changes in the method for determining LIBOR may affect the value of the financial obligations to be held or issued by us that are linked to LIBOR, or how such changes could affect our results of operations or financial condition.
In the recent past, concerns have been publicized that some of the member banks surveyed by British Bankers’ Association (“BBA”) in connection with the calculation of LIBOR across a range of maturities and currencies may have been under-reporting or otherwise manipulating the inter-bank lending rate applicable to them in order to profit on their derivative positions or to avoid an appearance of capital insufficiency or adverse reputational or other consequences that may have resulted from reporting inter-bank lending rates higher than those they actually submitted. A number of BBA member banks entered into settlements with their regulators and law enforcement agencies with respect to alleged manipulation of LIBOR, and investigations by regulators and governmental authorities in various jurisdictions are ongoing. Following a review of LIBOR conducted at the request of the U.K. government, on September 28, 2012, recommendations for reforming the setting and governing of LIBOR were released, which are referred to as the Wheatley Review. The Wheatley Review made a number of recommendations for changes with respect to LIBOR, including the introduction of S-5 statutory regulation of LIBOR, the transfer of responsibility for LIBOR from the BBA to an independent administrator, changes to the method of the compilation of lending rates and new regulatory oversight and enforcement mechanisms for rate-setting and a reduction in the number of currencies and tenors for which LIBOR is published. Based on the Wheatley Review and on a subsequent public and governmental consultation process, on March 25, 2013, the U.K. Financial Services Authority published final rules for the U.K. Financial Conduct Authority’s regulation and supervision of LIBOR, which are referred to as the FCA Rules. In particular, the FCA Rules include requirements that (1) an independent LIBOR administrator monitor and survey LIBOR submissions to identify breaches of practice standards and/or potentially manipulative behavior, and (2) firms submitting data to LIBOR establish and maintain a clear conflicts of interest policy and appropriate systems and controls. It is uncertain what additional regulatory changes or what changes, if any, in the method of determining LIBOR may be required or made by the U.K. government or other governmental or regulatory authorities.
Accordingly, uncertainty as to the nature of such changes may adversely affect the market for or value of any LIBOR-linked securities, loans, derivatives and other financial obligations or extensions of credit held by or due to us or on our overall financial condition or results of operations. In addition, any further changes or reforms to the determination or supervision of LIBOR may result in a sudden or prolonged increase or decrease in reported LIBOR, which could have an adverse impact on the market for or value of any LIBOR-linked securities, loans, derivatives and other financial obligations or extensions of credit held by or due to us or on our overall financial condition or results of operations.
Because we use debt to finance our investments, changes in interest rates will affect our cost of capital and net investment income.
Because we borrow money to make investments, our net investment income will depend, in part, upon the difference between the rate at which we borrow funds and the rate at which we invest those funds. As a result, we can offer no assurance that a significant change in market interest rates will not have a material adverse effect on our net investment income in the event we use our existing debt to finance our investments. In periods of rising interest rates, our cost of funds will increase to the extent we access the Facilities, since the interest rate on the Facilities is floating, which could reduce our net investment income to the extent any debt investments have fixed interest rates. We expect that our long-term fixed-rate investments will be financed primarily with issuances of equity and long-term debt securities. We may use interest rate risk management techniques in an effort to limit our exposure to interest rate fluctuations. Such techniques may include various interest rate hedging activities to the extent permitted by the 1940 Act.
You should also be aware that a rise in the general level of interest rates typically leads to higher interest rates applicable to our debt investments. Accordingly, an increase in interest rates may result in an increase of the amount of incentive fees payable to MCC Advisors.
If MCC Advisors is unable to manage our investments effectively, we may be unable to achieve our investment objective.
Our ability to achieve our investment objective will depend on our ability to manage our business, which will depend, in turn, on the ability of MCC Advisors to identify, invest in and monitor companies that meet our investment criteria. Accomplishing this result largely will be a function of MCC Advisors’ investment process and, in conjunction with its role as our administrator, its ability to provide competent, attentive and efficient services to us.
MCC Advisors’ senior management team is comprised of members of the senior management team for Medley LLC, and they manage other investment funds. They may also be required to provide managerial assistance to our portfolio companies. These demands on their time may distract them or slow our rate of investment. Any failure to manage our business effectively could have a material adverse effect on our business, financial condition and results of operations.
| 39 |
We may experience fluctuations in our periodic operating results.
We could experience fluctuations in our periodic operating results due to a number of factors, including the interest rates payable on the debt securities we acquire, the default rate on such securities, the level of our expenses (including the interest rates payable on our borrowings), the dividend rates payable on preferred stock we issue, variations in and the timing of the recognition of realized and unrealized gains or losses, the degree to which we encounter competition in our markets and general economic conditions. As a result of these factors, results for any period should not be relied upon as being indicative of performance in future periods.
Any failure on our part to maintain our status as a BDC would reduce our operating flexibility.
If we fail to maintain our status as a BDC, we might be regulated as a closed-end investment company under the 1940 Act, which would subject us to substantially more onerous regulatory restrictions under the 1940 Act and correspondingly decrease our operating flexibility.
We may have difficulty paying our required distributions if we recognize income before or without receiving cash representing such income.
For U.S. federal income tax purposes, we may include in income certain amounts that we have not yet received in cash, such as original issue discount, which may arise if we receive warrants in connection with the making of a loan or possibly in other circumstances, such as payment-in-kind (“PIK”) interest, which represents contractual interest added to the loan balance and due at the end of the loan term. Such original issue discount, which could be significant relative to our overall investment activities, or increases in loan balances as a result of PIK arrangements are included in income before we receive any corresponding cash payments. We also may be required to include in income certain other amounts that we do not receive in cash.
Since in certain cases we may recognize income before or without receiving cash representing such income, we may have difficulty meeting the tax requirement to distribute at least 90% of our net ordinary income and realized net short-term capital gains in excess of realized net long-term capital losses, if any, to maintain our status as a RIC. Accordingly, we may have to sell some of our investments at times we would not consider advantageous, raise additional debt or equity capital or reduce new investment originations to meet these distribution requirements. If we are not able to raise cash from other sources, we may fail to qualify and maintain our status as a RIC and thus become subject to corporate-level U.S. federal income tax. See “Tax Matters — Taxation of the Company”.
We may be required to pay incentive fees on income accrued, but not yet received in cash.
That part of the incentive fee payable by us that relates to our net investment income is computed and paid on income that may include interest that has been accrued but not yet received in cash, such as market discount, debt instruments with PIK, interest, preferred stock with PIK dividends and zero coupon securities. If a portfolio company defaults on a loan, it is possible that accrued interest previously used in the calculation of the incentive fee will become uncollectible. Consequently, we may make incentive fee payments on income accruals that we may not collect in the future and with respect to which we do not have a clawback right against MCC Advisors.
We may not be able to pay you dividends and our dividends may not grow over time.
We intend to pay quarterly dividends to our stockholders out of assets legally available for distribution. We cannot assure you that we will achieve investment results that will allow us to pay a specified level of cash dividends or year-to-year increases in cash dividends. Our ability to pay dividends might be adversely affected by, among other things, the impact of one or more of the risk factors described herein. In addition, the inability to satisfy the asset coverage test applicable to us as a BDC could limit our ability to pay dividends. All dividends will be paid at the discretion of our board of directors and will depend on our earnings, our financial condition, maintenance of our RIC status, compliance with applicable BDC regulations, restrictions on the payment of dividends under the Facilities, our SBIC subsidiary’s compliance with SBIC regulations and such other factors as our board of directors may deem relevant from time to time. We cannot assure you that we will pay dividends to our stockholders in the future.
Our SBIC subsidiary may be unable to make distributions to us that will enable us to meet or maintain RIC status, which could result in the imposition of an entity-level tax.
In order for us to continue to qualify for RIC tax treatment and to minimize corporate-level U.S. federal income taxes, we will be required to distribute substantially all of our net ordinary income and net capital gain income, including income from certain of our subsidiaries, which includes the income from our SBIC subsidiary. We are partially dependent on our SBIC subsidiary for cash distributions to enable us to meet the RIC distribution requirements. Our SBIC subsidiary may be limited by the Small Business Investment Act of 1958, and SBIC regulations governing SBICs, from making certain distributions to us that may be necessary to enable us to maintain our status as a RIC. We may have to request a waiver of the SBA’s restrictions for our SBIC subsidiary to make certain distributions to maintain our eligibility for RIC status. We cannot assure you that the SBA will grant such a waiver and if our SBIC subsidiary is unable to obtain a waiver, compliance with the SBIC regulations may result in loss of RIC tax treatment and a consequent imposition of an entity-level tax on us.
| 40 |
Pursuant to SBA regulations, a SBIC with outstanding debenture leverage may only distribute cumulative realized profits (less unrealized losses on investments). It may not return more than 2% of its outstanding capital in any fiscal year without SBA approval. Historically, the SBA has permitted payment in excess of 2% only pursuant to an approved wind up plan filed by our SBIC subsidiary pursuant to which SBA determines that repayment of our outstanding debentures is adequately assured.
Our SBIC subsidiary is subject to SBA regulations, and any failure to comply with SBA regulations could have an adverse effect on our operations.
On March 26, 2013, our wholly-owned subsidiary, Medley SBIC LP (“SBIC LP”), received a Small Business Investment Company (“SBIC”) license from the SBA.
The SBIC license allows SBIC LP to obtain leverage by issuing SBA-guaranteed debentures, subject to the issuance of a capital commitment by the SBA and other customary procedures. SBA-guaranteed debentures are non-recourse, interest only debentures with interest payable semi-annually and have a ten year maturity. The principal amount of SBA-guaranteed debentures is not required to be paid prior to maturity but may be prepaid at any time without penalty. The interest rate of SBA-guaranteed debentures is fixed on a semi-annual basis at a market-driven spread over U.S. Treasury Notes with 10-year maturities. The SBA, as a creditor, will have a superior claim to SBIC LP’s assets over our stockholders in the event we liquidate SBIC LP or the SBA exercises its remedies under the SBA-guaranteed debentures issued by SBIC LP upon an event of default.
Further, the SBA regulations require that a licensed SBIC be periodically examined and audited by the SBA to determine its compliance with the relevant SBA regulations. The SBA prohibits, without prior SBA approval, a “change of control” of an SBIC or any transfers of the capital stock of a licensed SBIC. If our SBIC subsidiary fails to comply with applicable SBIC regulations, the SBA could, depending on the severity of the violation, limit or prohibit its use of debentures, declare outstanding debentures immediately due and payable, and/or limit it from making new investments. In addition, the SBA can revoke or suspend a license for willful or repeated violation of, or willful or repeated failure to observe, any provision of the Small Business Investment Act of 1958 or any rule or regulation promulgated thereunder. Our SBIC subsidiary’s investment adviser has limited experience managing an SBIC. Its limited experience in complying with SBA regulations may hinder its ability to take advantage of our SBIC subsidiary’s access to SBA-guaranteed debentures. Any failure to comply with SBA regulations could have an adverse effect on our operations.
SBA regulations limit the outstanding dollar amount of SBA guaranteed debentures that may be issued by an SBIC or group of SBICs under common control.
The SBA regulations currently limit the dollar amount of SBA-guaranteed debentures that can be issued by any one SBIC to $150.0 million or to a group of SBICs under common control to $350.0 million. Moreover, an SBIC may not borrow an amount in excess of two times (and in certain cases, up to three times) its regulatory capital. As of September 30, 2016, our SBIC subsidiary had $150 million in SBA-guaranteed debentures outstanding. Now that we have reached the maximum dollar amount of SBA-guaranteed debentures permitted, if we require additional capital, our cost of capital may increase, and there is no assurance that we will be able to obtain additional financing on acceptable terms.
Moreover, the current status of our SBIC subsidiary as an SBIC does not automatically assure that our SBIC subsidiary will continue to receive SBA-guaranteed debenture funding. Receipt of SBA leverage funding is dependent upon our SBIC subsidiary continuing to be in compliance with SBA regulations and policies and the availability of SBA funding. The amount of SBA leverage funding available to SBICs is dependent upon annual Congressional authorizations and in the future may be subject to annual Congressional appropriations. There can be no assurance that there will be sufficient debenture funding available at the times desired by our SBIC subsidiary.
The debentures guaranteed by the SBA have a maturity of ten years and require semi-annual payments of interest. Our SBIC subsidiary will need to generate sufficient cash flow to make required interest payments on the debentures. If our SBIC subsidiary is unable to meet their financial obligations under the debentures, the SBA, as a creditor, will have a superior claim to our SBIC subsidiary's assets over our stockholders in the event we liquidate our SBIC subsidiary or the SBA exercises its remedies under such debentures as the result of a default by us.
| 41 |
The highly competitive market in which we operate may limit our investment opportunities.
A number of entities compete with us to make the types of investments that we make. We compete with other BDCs and investment funds (including public and private funds, commercial and investment banks, commercial financing companies, other SBICs and, to the extent they provide an alternative form of financing, private equity funds). Additionally, because competition for investment opportunities generally has increased among alternative investment vehicles, such as hedge funds, those entities have begun to invest in areas in which they have not traditionally invested. As a result of these new entrants, competition for investment opportunities has intensified in recent years and may intensify further in the future. Some of our existing and potential competitors are substantially larger and have considerably greater financial, technical and marketing resources than we do. For example, some competitors may have a lower cost of funds and access to funding sources that are not available to us. In addition, some of our competitors may have higher risk tolerances or different risk assessments, which could allow them to consider a wider variety of investments and establish more relationships than us. Furthermore, many of our competitors are not subject to the regulatory restrictions and valuation requirements that the 1940 Act imposes on us as a BDC and the tax consequences of qualifying as a RIC. We cannot assure you that the competitive pressures we face will not have a material adverse effect on our business, financial condition and results of operations. Also, as a result of this existing and potentially increasing competition, we may not be able to take advantage of attractive investment opportunities from time to time, and we can offer no assurance that we will be able to identify and make investments that are consistent with our investment objective.
We do not seek to compete primarily based on the interest rates we offer, and we believe that some of our competitors make loans with interest rates that are comparable to or lower than the rates we offer. We may lose investment opportunities if we do not match our competitors’ pricing, terms and structure. If we match our competitors’ pricing, terms and structure, we may experience decreased net interest income and increased risk of credit loss. A significant part of our competitive advantage stems from the fact that the market for investments in mid-sized companies is underserved by traditional commercial banks and other financial institutions. A significant increase in the number and/or size of our competitors in this target market could force us to accept less attractive investment terms. Furthermore, many of our competitors have greater experience operating under the regulatory restrictions of the 1940 Act.
We depend upon senior management personnel of MCC Advisors for our future success, and if MCC Advisors is unable to retain qualified personnel or if MCC Advisors loses any member of its senior management team, our ability to achieve our investment objective could be significantly harmed.
We depend on MCC Advisors’ investment management team, or the Investment Team, which is provided by MCC Advisors, for the identification, final selection, structuring, closing and monitoring of our investments. Our Investment Team is integral to our asset management activities and has critical industry experience and relationships that we will rely on to implement our business plan. Our future success depends on our Investment Team’s continued service to MCC Advisors. The departure of any of the members of the Investment Team could have a material adverse effect on our ability to achieve our investment objective. As a result, we may not be able to operate our business as we expect, and our ability to compete could be harmed, which could cause our operating results to suffer. In addition, we can offer no assurance that MCC Advisors will remain our investment adviser or our administrator. Moreover, we also experience competition in attracting and retaining qualified personnel, particularly investment professionals, and we may be unable to maintain or grow our business if we cannot attract and retain such personnel.
Our investment adviser may not be able to achieve the same or similar returns as those achieved by our senior management and Investment Team while they were employed at prior positions.
The track record and achievements of the senior management and Investment Team of MCC Advisors are not necessarily indicative of future results that will be achieved by our investment adviser. As a result, our investment adviser may not be able to achieve the same or similar returns as those achieved by our senior management and Investment Team while they were employed at prior positions.
Because we expect to distribute substantially all of our net investment income and net realized capital gains to our stockholders, we will need additional capital to finance our growth and such capital may not be available on favorable terms or at all.
We have elected and qualified to be taxed for U.S. federal income tax purposes as a RIC under Subchapter M of the Code. As a RIC, we must meet certain requirements, including source-of-income, asset diversification and distribution requirements in order to not have to pay corporate-level U.S. federal income taxes on income we distribute to our stockholders as dividends, which allows us to substantially reduce or eliminate our corporate-level U.S. federal income tax liability. As a BDC, we are generally required to meet a coverage ratio of total assets to total senior securities, which includes all of our borrowings and any preferred stock we may issue in the future, of at least 200% at the time we issue any debt or preferred stock. This requirement limits the amount of our leverage. Because we will continue to need capital to grow our investment portfolio, this limitation may prevent us from incurring debt or issuing preferred stock and require us to raise additional equity at a time when it may be disadvantageous to do so. We cannot assure you that debt and equity financing will be available to us on favorable terms, or at all, and debt financings may be restricted by the terms of any of our outstanding borrowings. In addition, as a BDC, we are generally not permitted to issue common stock priced below NAV without stockholder approval. If additional funds are not available to us, we could be forced to curtail or cease new lending and investment activities, and our NAV could decline.
| 42 |
Our board of directors may change our investment objective, operating policies and strategies without prior notice or stockholder approval.
Our board of directors has the authority to modify or waive certain of our operating policies and strategies without prior notice and without stockholder approval. However, absent stockholder approval, we may not change the nature of our business so as to cease to be, or withdraw our election as, a BDC. We cannot predict the effect any changes to our current operating policies and strategies would have on our business, operating results or value of our stock. Nevertheless, the effects could adversely affect our business and impact our ability to make distributions and cause you to lose all or part of your investment.
There are significant potential conflicts of interest that could affect our investment returns.
There may be times when MCC Advisors, its senior management and Investment Team, and members of its Investment Committee have interests that differ from those of our stockholders, giving rise to a conflict of interest. In particular, certain private investment funds managed by the senior members of MCC Advisors hold controlling or minority equity interests, or have the right to acquire such equity interests, in some of our portfolio companies. As a result, the senior members of MCC Advisors may face conflicts of interest in connection with making business decisions for these portfolio companies to the extent that such decisions affect the debt and equity holders in these portfolio companies differently. In addition, the senior members of MCC Advisors may face conflicts of interests in connection with making investment or other decisions, including granting loan waivers or concessions on our behalf with respect to these portfolio companies given that they also manage private investment funds that hold the equity interests in these portfolio companies.
There may be conflicts of interest related to obligations MCC Advisors’ senior management and Investment Team and members of its Investment Committee have to other clients.
Senior management, the Investment Team, and the Investment Committee of MCC Advisors serve or may serve as officers, directors or principals of entities that operate in the same or a related line of business as we do, or of investment funds managed by MCC Advisors or its affiliates. In serving in these multiple capacities, they may have obligations to other clients or investors in those entities, the fulfillment of which may not be in our best interests or in the best interest of our stockholders. For example, members of the Investment Team have management responsibilities for other investment funds, accounts or other investment vehicles managed by affiliates of MCC Advisors, which gives rise to conflicts of interest.
Our investment objective may overlap with the investment objectives of such investment funds, accounts or other investment vehicles. For example, affiliates of MCC Advisors currently manage private funds and managed accounts that are seeking new capital commitments and will pursue an investment strategy similar to our strategy, and we may compete with these and other entities managed by affiliates of MCC Advisors for capital and investment opportunities. As a result, those individuals may face conflicts in the allocation of investment opportunities among us and other investment funds or accounts advised by principals of, or affiliated with, MCC Advisors.
We have received an order from the SEC which permits us to co-invest with certain other investment funds managed by MCC Advisors or its affiliates, subject to the conditions included therein. In situations where we cannot co-invest with other investment funds managed by MCC Advisors or its affiliates, the investment policies and procedures of MCC Advisors generally require that such opportunities be offered to us and such other investment funds on an alternating basis. However, there can be no assurance that we will be able to participate in all investment opportunities that are suitable to us.
MCC Advisors may, from time to time, possess material non-public information, limiting our investment discretion.
MCC Advisors and members of its senior management and the Investment Team and the Investment Committee may serve as directors of, or in a similar capacity with, companies in which we invest, the securities of which are purchased or sold on our behalf. In the event that material nonpublic information is obtained with respect to such companies, we could be prohibited for a period of time from purchasing or selling the securities of such companies by law or otherwise, and this prohibition may have an adverse effect on us.
Our incentive fee structure may create incentives for MCC Advisors that are not fully aligned with the interests of our stockholders.
In the course of our investing activities, we will pay management and incentive fees to MCC Advisors. These fees are based on our gross assets. As a result, investors in our common stock will invest on a “gross” basis and receive distributions on a “net” basis after expenses, resulting in a lower rate of return than one might achieve through direct investments. Because these fees are based on our gross assets, MCC Advisors will benefit when we incur debt or use leverage. Additionally, under the incentive fee structure, MCC Advisors may benefit when capital gains are recognized and, because MCC Advisors determines when a holding is sold, MCC Advisors controls the timing of the recognition of such capital gains. Our board of directors is charged with protecting our interests by monitoring how MCC Advisors addresses these and other conflicts of interests associated with its management services and compensation. While they are not expected to review or approve each borrowing or incurrence of leverage, our independent directors will periodically review MCC Advisors’ services and fees as well as its portfolio management decisions and portfolio performance. In connection with these reviews, our independent directors will consider whether our fees and expenses (including those related to leverage) remain appropriate. As a result of this arrangement, MCC Advisors or its affiliates may from time to time have interests that differ from those of our stockholders, giving rise to a conflict.
| 43 |
The part of the incentive fee payable to MCC Advisors that relates to our net investment income will be computed and paid on income that may include interest income that has been accrued but not yet received in cash. This fee structure may be considered to involve a conflict of interest for MCC Advisors to the extent that it may encourage MCC Advisors to favor debt financings that provide for deferred interest, rather than current cash payments of interest. MCC Advisors may have an incentive to invest in deferred interest securities in circumstances where it would not have done so but for the opportunity to continue to earn the incentive fee even when the issuers of the deferred interest securities would not be able to make actual cash payments to us on such securities. This risk could be increased because MCC Advisors is not obligated to reimburse us for any incentive fees received even if we subsequently incur losses or never receive in cash the deferred income that was previously accrued.
Because we borrow money, the potential for loss on amounts invested in us will be magnified and may increase the risk of investing in us.
Borrowings, also known as leverage, magnify the potential for loss on invested equity capital. If we continue to use leverage to partially finance our investments, which we have increasingly done over the years, you will experience increased risks of investing in our securities. We borrow under the Facilities, issued the Notes, issued the SBA-guaranteed debentures and may issue other debt securities or enter into other types of borrowing arrangements in the future. If the value of our assets decreases, leveraging would cause our NAV to decline more sharply than it otherwise would have had we not leveraged. Similarly, any decrease in our income would cause net income to decline more sharply than it would have had we not borrowed. Such a decline could negatively affect our ability to make common stock distributions or scheduled debt payments. Leverage is generally considered a speculative investment technique and we only intend to use leverage if expected returns will exceed the cost of borrowing.
As of September 30, 2016, before netting out debt issuance costs, our Term Loan Facility and Revolving Credit Facility had outstanding balances of $174.0 million and $14.0 million, respectively, $150.0 million SBA-guaranteed debentures outstanding and we had $177.5 million of outstanding Notes. The Facilities and the Notes require periodic payments of interest. The weighted average interest rate charged on our borrowings as of September 30, 2016 was 4.4% (exclusive of debt issuance costs). We will need to generate sufficient cash flow to make these required interest payments. In order for us to cover our annual interest payments on indebtedness, we must achieve annual returns on total assets of at least 2.42% as of September 30, 2016. If we are unable to meet the financial obligations under the Facilities, the lenders under the Facilities will have a superior to claim to our assets over our stockholders. If we are unable to meet the financial obligations under the Notes, the holders thereof will have the right to declare the principal amount and accrued and unpaid interest on the outstanding Notes to be due and payable immediately.
We have received exemptive relief from the SEC to permit us to exclude the debt of our SBIC subsidiary guaranteed by the SBA from the definition of senior securities in the 200% asset coverage ratio we are required to maintain under the 1940 Act. Pursuant to such exemptive relief, we have the ability to incur leverage in excess of the amounts set forth in the 1940 Act by excluding the debt of our SBIC subsidiary. If we incur additional leverage in excess of the amounts set forth in the 1940 Act, our NAV will decline more sharply if the value of our assets declines than if we had not incurred such additional leverage and the effects of leverage described above will be magnified.
Illustration . The following table illustrates the effect of leverage on returns from an investment in our common stock assuming various annual returns, net of expenses. The calculations in the table below are hypothetical and actual returns may be higher or lower than those appearing below.
Assumed Return on Our Portfolio (1)
(net of expenses)
| (10)% | (5)% | 0% | 5% | 10% | ||||||||||||||||
| Corresponding net return to common stockholder | (24.2 | )% | (14.2 | )% | (4.2 | )% | 5.7 | % | 15.7 | % | ||||||||||
(1) Assumes $1,030.9 million in total assets, $501.6 million in debt outstanding, $516.9 million in net assets, and a weighted average interest rate of 4.4%. Actual interest payments may be different.
| 44 |
Our incentive fee may induce our investment adviser to make certain investments, including speculative investments.
The incentive fee payable by us to MCC Advisors may create an incentive for MCC Advisors to make investments on our behalf that are risky or more speculative than would be the case in the absence of such compensation arrangement. The way in which the incentive fee payable to MCC Advisors is determined, which is calculated separately in two components as a percentage of the interest and other ordinary income in excess of a quarterly minimum hurdle rate and as a percentage of the realized gain on invested capital, may encourage MCC Advisors to use leverage or take additional risk to increase the return on our investments. The use of leverage may magnify the potential for gain or loss on amounts invested. The use of leverage is considered a speculative technique. If we borrow from banks or other lenders, we would expect that such lenders will seek recovery against our assets in the event of a default and these lenders likely will have claims on our assets that are superior to those of our equity holders. In addition, MCC Advisors receives the incentive fee based, in part, upon net capital gains realized on our investments. Unlike the portion of the incentive fee based on income, there is no minimum level of gain applicable to the portion of the incentive fee based on net capital gains. As a result, MCC Advisors may have an incentive to invest more in investments that are likely to result in capital gains as compared to income producing securities. This practice could result in our investing in more speculative securities than would otherwise be the case, which could result in higher investment losses, particularly during economic downturns.
We may invest, to the extent permitted by law, in the securities and instruments of other investment companies, including private funds, and, to the extent we so invest, we will bear our ratable share of any such investment company’s expenses, including management and performance fees. We will also remain obligated to pay management and incentive fees to MCC Advisors with respect to the assets invested in the securities and instruments of other investment companies. With respect to each of these investments, each of our common stockholders will bear his or her share of the management and incentive fee of MCC Advisors as well as indirectly bear the management and performance fees and other expenses of any investment companies in which we invest.
We may be obligated to pay our investment adviser incentive compensation even if we incur a loss and may pay more than 20% of our net capital gains because we cannot recover payments made in previous years.
MCC Advisors will be entitled to incentive compensation for each fiscal quarter in an amount equal to a percentage of the excess of our net investment income for that quarter above a threshold return for that quarter. Our pre-incentive fee net investment income for incentive compensation purposes excludes realized and unrealized capital losses that we may incur in the fiscal quarter, even if such capital losses result in a net loss on our statement of operations for that quarter. Thus, we may be required to pay MCC Advisors incentive compensation for a fiscal quarter even if there is a decline in the value of our portfolio or we incur a net loss for that quarter. If we pay an incentive fee of 20% of our realized capital gains (net of all realized capital losses and unrealized capital depreciation on a cumulative basis) and thereafter experience additional realized capital losses or unrealized capital depreciation, we will not be able to recover any portion of the incentive fee previously paid.
The valuation process for certain of our portfolio holdings creates a conflict of interest.
A substantial portion of our portfolio investments are expected to be made in the form of securities that are not publicly traded. As a result, our board of directors will determine the fair value of these securities in good faith pursuant to our valuation policy. In connection with that determination, investment professionals from MCC Advisors prepare portfolio company valuations based upon the most recent financial statements available and projected financial results of each portfolio company. In addition, certain members of our board of directors, including Brook Taube, Seth Taube and Jeff Tonkel, have a pecuniary interest in MCC Advisors. The participation of MCC Advisors’ investment professionals in our valuation process, and the pecuniary interest in MCC Advisors by certain members of our board of directors, could result in a conflict of interest as the management fee that we will pay MCC Advisors is based on our gross assets.
Other arrangements with MCC Advisors may create conflicts of interest.
We utilize MCC Advisors’ office space and pay to MCC Advisors our allocable portion of overhead and other expenses incurred by MCC Advisors in performing its obligations under the administration agreement, such as our allocable portion of the cost of our chief financial officer and chief compliance officer and their respective staffs. This results in conflicts of interest that our board of directors must monitor.
The investment management agreement and administration agreement with MCC Advisors were not negotiated on an arm’s length basis and may not be as favorable to us as if they had been negotiated with an unaffiliated third party.
The investment management agreement and the administration agreement were negotiated between related parties. Consequently, their terms, including fees payable to MCC Advisors, may not be as favorable to us as if they had been negotiated with an unaffiliated third party.
Our ability to sell or otherwise exit investments in which affiliates of MCC Advisors also have an investment may be restricted.
We may be considered affiliates with respect to certain of our portfolio companies. Certain private funds advised by the senior members of MCC Advisors also hold interests in these portfolio companies and as such these interests may be considered a joint enterprise under applicable regulations. To the extent that our interests in these portfolio companies may need to be restructured in the future or to the extent that we choose to exit certain of these transactions, our ability to do so will be limited.
| 45 |
We are highly dependent on information systems and systems failures could significantly disrupt our business, which may, in turn, negatively affect the market price of our common stock and our ability to pay dividends.
Our business is highly dependent on our and third parties’ communications and information systems. Any failure or interruption of those systems, including as a result of the termination of an agreement with any third-party service providers, could cause delays or other problems in our activities. Our financial, accounting, data processing, backup or other operating systems and facilities may fail to operate properly or become disabled or damaged as a result of a number of factors including events that are wholly or partially beyond our control and adversely affect our business. There could be:
| · | sudden electrical or telecommunications outages; |
| · | natural disasters such as earthquakes, tornadoes and hurricanes; |
| · | disease pandemics; |
| · | events arising from local or larger scale political or social matters, including terrorist acts; and |
| · | cyber-attacks. |
These events, in turn, could have a material adverse effect on our operating results and negatively affect the market price of our common stock and our ability to pay dividends to our stockholders.
The failure in cybersecurity systems, as well as the occurrence of events unanticipated in our disaster recovery systems and management continuity planning could impair our ability to conduct business effectively.
Cybersecurity refers to the combination of technologies, processes, and procedures established to protect information technology systems and data from unauthorized access, attack, or damage. We are subject to cybersecurity risks. Information cyber security risks have significantly increased in recent years and, while we have not experienced any material losses relating to cyber-attacks or other information security breaches, we could suffer such losses in the future. Our computer systems, both internal and those provided by third-party service providers, software and networks may be vulnerable to unauthorized access, computer viruses or other malicious code and other events that could have a security impact. If one or more of such events occur, this potentially could jeopardize confidential and other information, including nonpublic personal information and sensitive business data, processed and stored in, and transmitted through, our computer systems and networks, or otherwise cause interruptions or malfunctions in our operations or the operations of our customers or counterparties, which could result in significant losses or reputational damage. This could result in significant losses, reputational damage, litigation, regulatory fines or penalties, or otherwise adversely affect our business, financial condition or results of operations. Privacy and information security laws and regulation changes, and compliance with those changes, may result in cost increases due to system changes and the development of new administrative processes. In addition, we may be required to expend significant additional resources to modify our protective measures and to investigate and remediate vulnerabilities or other exposures arising from operational and security risks. We currently do not maintain insurance coverage relating to cybersecurity risks, and we may be required to expend significant additional resources to modify our protective measures or to investigate and remediate vulnerabilities or other exposures, and we may be subject to litigation and financial losses that are not fully insured.
Third parties with which we do business may also be sources of cybersecurity or other technological risks. Cyber security failures or breaches by our investment adviser and other service providers (including, but not limited to, accountants, custodians, transfer agents and administrators), and the issuers of securities in which we invest, also have the ability to cause disruptions and impact business operations, potentially resulting in financial losses, interference with our ability to calculate its net asset value, impediments to trading, the inability of our stockholders to transact business, violations of applicable privacy and other laws, regulatory fines, penalties, reputation damages, reimbursement of other compensation costs, or additional compliance costs. In addition, substantial costs may be incurred in order to prevent any cyber incidents in the future.
We outsource certain functions and these relationships allow for the storage and processing of our information, as well as customer, counterparty, employee and borrower information. While we engage in actions to reduce our exposure resulting from outsourcing, ongoing threats may result in unauthorized access, loss, exposure or destruction of data, or other cybersecurity incidents, with increased costs and other consequences, including those described above.
Our business and operations could be negatively affected if we become subject to any securities litigation or stockholder activism, which could cause us to incur significant expense, hinder execution of investment strategy and impact our stock price.
In the past, following periods of volatility in the market price of a company’s securities, securities class-action litigation has often been brought against that company. Stockholder activism, which could take many forms or arise in a variety of situations, has been increasing in the BDC space recently. While we are currently not subject to any securities litigation or stockholder activism, due to the potential volatility of our stock price and for a variety of other reasons, we may in the future become the target of securities litigation or stockholder activism. Securities litigation and stockholder activism, including potential proxy contests, could result in substantial costs and divert management’s and our board of directors’ attention and resources from our business. Additionally, such securities litigation and stockholder activism could give rise to perceived uncertainties as to our future, adversely affect our relationships with service providers and make it more difficult to attract and retain qualified personnel. Also, we may be required to incur significant legal fees and other expenses related to any securities litigation and activist stockholder matters. Further, our stock price could be subject to significant fluctuation or otherwise be adversely affected by the events, risks and uncertainties of any securities litigation and stockholder activism.
| 46 |
Risks Related to Our Investments
We may not realize gains from our equity investments.
When we make a debt investment, we may acquire warrants or other equity securities as well. In addition, we may invest directly in the equity securities of portfolio companies. Our goal is ultimately to dispose of such equity interests and realize gains upon our disposition of such interests. However, the equity interests we receive may not appreciate in value and, in fact, may decline in value. Accordingly, we may not be able to realize gains from our equity interests, and any gains that we do realize on the disposition of any equity interests may not be sufficient to offset any other losses we experience.
Our investments are very risky and highly speculative.
We invest primarily in senior secured first lien term loans and senior secured second lien term loans issued by private middle-market companies.
Senior Secured Loans There is a risk that the collateral securing our loans may decrease in value over time, may be difficult to sell in a timely manner, may be difficult to appraise and may fluctuate in value based upon the success of the business and market conditions, including as a result of the inability of the portfolio company to raise additional capital, and, in some circumstances, our lien could be subordinated to claims of other creditors. In addition, deterioration in a portfolio company’s financial condition and prospects, including its inability to raise additional capital, may be accompanied by deterioration in the value of the collateral for the loan. Consequently, the fact that a loan is secured does not guarantee that we will receive principal and interest payments according to the loan’s terms, or at all, or that we will be able to collect on the loan should we be forced to enforce our remedies.
Equity Investments When we invest in senior secured first lien term loans or senior secured second lien term loans, we may receive warrants or other equity securities as well. In addition, we may invest directly in the equity securities of portfolio companies. The warrants or equity interests we receive may not appreciate in value and, in fact, may decline in value. Accordingly, we may not be able to realize gains from our warrants or equity interests, and any gains that we do realize on the disposition of any warrants or equity interests may not be sufficient to offset any other losses we experience.
In addition, investing in private middle-market companies involves a number of significant risks. See “Our investments in private middle-market portfolio companies may be risky, and you could lose all or part of your investment” below.
Our investments in private middle-market portfolio companies may be risky, and you could lose all or part of your investment.
Investments in private middle-market companies involve a number of significant risks. Generally, little public information exists about these companies, and we are required to rely on the ability of the Investment Team to obtain adequate information to evaluate the potential returns from investing in these companies. If we are unable to uncover all material information about these companies, we may not make a fully informed investment decision, and we may lose money on our investments. Private middle-market companies may have limited financial resources and may be unable to meet their obligations under their debt securities that we hold, which may be accompanied by a deterioration in the value of any collateral and a reduction in the likelihood of our realizing any guarantees we may have obtained in connection with our investment. In addition, they typically have shorter operating histories, narrower product lines and smaller market shares than larger businesses, which tend to render them more vulnerable to competitors’ actions and market conditions, as well as general economic downturns. Additionally, private middle-market companies are more likely to depend on the management talents and efforts of a small group of persons; therefore, the death, disability, resignation or termination of one or more of these persons could have a material adverse impact on our portfolio company and, in turn, on us. Private middle-market companies also generally have less predictable operating results, may from time to time be parties to litigation, may be engaged in rapidly changing businesses with products subject to a substantial risk of obsolescence and may require substantial additional capital to support their operations, finance expansion or maintain their competitive position. In addition, our executive officers, directors and MCC Advisors may, in the ordinary course of business, be named as defendants in litigation arising from our investments in these types of companies.
We intend to invest primarily in secured debt issued by our portfolio companies. In the case of our senior secured first lien term loans, the portfolio companies usually have, or may be permitted to incur, other debt that ranks equally with the debt securities in which we invest. With respect to our senior secured second lien term loans, the portfolio companies usually have, or may be permitted to incur, other debt that ranks above or equally with the debt securities in which we invest. In the case of debt ranking above the senior secured second lien term loans in which we invest, we would be subordinate to such debt in the event of an insolvency, liquidation, dissolution, reorganization or bankruptcy of the relevant portfolio company and therefore the holders of debt instruments ranking senior to our investment in that portfolio company would typically be entitled to receive payment in full before we receive any distribution. In the case of debt ranking equally with debt securities in which we invest, we would have to share any distributions on an equal and ratable basis with other creditors holding such debt in the event of an insolvency, liquidation, dissolution, reorganization or bankruptcy of the relevant portfolio company.
| 47 |
Additionally, certain loans that we make to portfolio companies may be secured on a second priority basis by the same collateral securing senior secured debt of such companies. The first priority liens on the collateral will secure the portfolio company’s obligations under any outstanding senior debt and may secure certain other future debt that may be permitted to be incurred by the portfolio company under the agreements governing the loans. The holders of obligations secured by the first priority liens on the collateral will generally control the liquidation of, and be entitled to receive proceeds from, any realization of the collateral to repay their obligations in full before us. In addition, the value of the collateral in the event of liquidation will depend on market and economic conditions, the availability of buyers and other factors. There can be no assurance that the proceeds, if any, from the sale or sales of all of the collateral would be sufficient to satisfy the loan obligations secured by the second priority liens after payment in full of all obligations secured by the first priority liens on the collateral. If such proceeds are not sufficient to repay amounts outstanding under the loan obligations secured by the second priority liens, then we, to the extent not repaid from the proceeds of the sale of the collateral, will only have an unsecured claim against the portfolio company’s remaining assets, if any.
The rights we may have with respect to the collateral securing the loans we make to our portfolio companies with senior debt outstanding may also be limited pursuant to the terms of one or more intercreditor agreements that we enter into with the holders of senior debt. Under such an intercreditor agreement, at any time that obligations that have the benefit of the first priority liens are outstanding, any of the following actions that may be taken in respect of the collateral will be at the direction of the holders of the obligations secured by the first priority liens: (1) the ability to cause the commencement of enforcement proceedings against the collateral; (2) the ability to control the conduct of such proceedings; (3) the approval of amendments to collateral documents; (4) releases of liens on the collateral; and (5) waivers of past defaults under collateral documents. We may not have the ability to control or direct such actions, even if our rights are adversely affected.
Continuation of the current decline in oil and natural gas prices for a prolonged period of time could have a material adverse effect on the Company.
Approximately 5.8% of the Company's portfolio at fair value is invested in energy-related businesses. A decline in oil and natural gas prices would adversely affect the credit quality of these investments. A decrease in credit quality would, in turn, negatively affect the fair value of these investments, which would consequently negatively affect the Company's financial position and results of operations. Should the current decline in oil and natural gas prices persist, it is likely that the Company's energy-related portfolio companies' abilities to satisfy financial or operating covenants imposed by the Company or other lenders will be adversely affected, thereby negatively impacting the Company's financial condition and their ability to satisfy their debt service and other obligations to the Company.
Our portfolio companies may prepay loans, which prepayment may reduce stated yields if capital returned cannot be invested in transactions with equal or greater expected yields.
Our loans to portfolio companies are callable at any time, and most of them at no premium to par. It is uncertain as to when each loan may be called. Whether a loan is called will depend both on the continued positive performance of the portfolio company and the existence of favorable financing market conditions that allow such company the ability to replace existing financing with less expensive capital. As market conditions change frequently, it is unknown when, and if, this may be possible for each portfolio company. In the case of some of these loans, having the loan called early may reduce the achievable yield for us below the stated yield to maturity contained herein if the capital returned cannot be invested in transactions with equal or greater expected yields.
We may acquire indirect interests in loans rather than direct interests, which would subject us to additional risk.
We may make or acquire loans or investments through participation agreements. A participation agreement typically results in a contractual relationship only with the counterparty to the participation agreement and not with the borrower. MCC Advisors has adopted best execution procedures and guidelines to mitigate credit and counterparty risk when we acquire a loan through a participation agreement. In investing through participations, we will generally not have a right to enforce compliance by the borrower with the terms of the loan agreement against the borrower, and we may not directly benefit from the collateral supporting the debt obligation in which it has purchased the participation. As a result, we will be exposed to the credit risk of both the borrower and the counterparty selling the participation. In the event of insolvency of the counterparty, we, by virtue of holding participation interests in the loan, may be treated as its general unsecured creditor. In addition, although we may have certain contractual rights under the loan participation that require the counterparty to obtain our consent prior to taking various actions relating to the loan, we cannot guarantee that the counterparty will seek such consent prior to taking various actions. Further, in investing through participation agreements, we may not be able to conduct the due diligence on the borrower or the quality of the loan with respect to which it is buying a participation that we would otherwise conduct if we were investing directly in the loan, which may result in us being exposed to greater credit or fraud risk with respect to the borrower or the loan than we expected when initially purchasing the participation. See “Risks Related to Our Business — There are significant potential conflicts of interest that could affect our investment returns” above.
| 48 |
Our failure to make follow-on investments in our portfolio companies could impair the value of our portfolio and our ability to make follow-on investments in certain portfolio companies may be restricted.
Following an initial investment in a portfolio company, provided that there are no restrictions imposed by the 1940 Act, we may make additional investments in that portfolio company as “follow-on” investments in order to: (1) increase or maintain in whole or in part our equity ownership percentage; (2) exercise warrants, options or convertible securities that were acquired in the original or subsequent financing; or (3) attempt to preserve or enhance the value of our initial investment.
We have the discretion to make any follow-on investments, subject to the availability of capital resources. We may elect not to make follow-on investments or otherwise lack sufficient funds to make those investments. Our failure to make follow-on investments may, in some circumstances, jeopardize the continued viability of a portfolio company and our initial investment, or may result in a missed opportunity for us to increase our participation in a successful operation. Even if we have sufficient capital to make a desired follow-on investment, we may elect not to make such follow-on investment because we may not want to increase our concentration of risk, because we prefer other opportunities, because we are inhibited by compliance with BDC requirements or because we desire to maintain our RIC tax status. We also may be restricted from making follow-on investments in certain portfolio companies to the extent that affiliates of ours hold interests in such companies.
Our ability to invest in public companies may be limited in certain circumstances.
To maintain our status as a BDC, we are not permitted to acquire any assets other than “qualifying assets” specified in the 1940 Act unless, at the time the acquisition is made, at least 70% of our total assets are qualifying assets (with certain limited exceptions). Subject to certain exceptions for follow-on investments and distressed companies, an investment in an issuer that has outstanding securities listed on a national securities exchange may be treated as qualifying assets only if such issuer has a market capitalization that is less than $250 million at the time of such investment. In addition, we may invest up to 30% of our portfolio in opportunistic investments which will be intended to diversify or complement the remainder of our portfolio and to enhance our returns to stockholders. These investments may include private equity investments, securities of public companies that are broadly traded and securities of non-U.S. companies. We expect that these public companies generally will have debt securities that are non-investment grade.
Our investments in foreign securities may involve significant risks in addition to the risks inherent in U.S. investments.
Our investment strategy contemplates that a portion of our investments may be in securities of foreign companies. Investing in foreign companies may expose us to additional risks not typically associated with investing in U.S. companies. These risks include changes in exchange control regulations, political and social instability, expropriation, imposition of foreign taxes, less liquid markets and less available information than is generally the case in the United States, higher transaction costs, less government supervision of exchanges, brokers and issuers, less developed bankruptcy laws, difficulty in enforcing contractual obligations, lack of uniform accounting and auditing standards and greater price volatility.
Although it is anticipated that most of our investments will be denominated in U.S. dollars, our investments that are denominated in a foreign currency will be subject to the risk that the value of a particular currency may change in relation to the U.S. dollar. Among the factors that may affect currency values are trade balances, the level of short-term interest rates, differences in relative values of similar assets in different currencies, long-term opportunities for investment and capital appreciation and political developments. We may employ hedging techniques to minimize these risks, but we can offer no assurance that we will, in fact, hedge currency risk or, that if we do, such strategies will be effective. As a result, a change in currency exchange rates may adversely affect our profitability.
Hedging transactions may expose us to additional risks.
We may engage in currency or interest rate hedging transactions. If we engage in hedging transactions, we may expose ourselves to risks associated with such transactions. We may utilize instruments such as forward contracts, currency options and interest rate swaps, caps, collars and floors to seek to hedge against fluctuations in the relative values of our portfolio positions from changes in currency exchange rates and market interest rates. Hedging against a decline in the values of our portfolio positions does not eliminate the possibility of fluctuations in the values of such positions or prevent losses if the values of such positions decline. However, such hedging can establish other positions designed to gain from those same developments, thereby offsetting the decline in the value of such portfolio positions. Such hedging transaction may also limit the opportunity for gain if the values of the underlying portfolio positions should increase. Moreover, it may not be possible to hedge against an exchange rate or interest rate fluctuation that is so generally anticipated that we are not able to enter into a hedging transaction at an acceptable price.
While we may enter into transactions to seek to reduce currency exchange rate and interest rate risks, unanticipated changes in currency exchange rates or interest rates may result in poorer overall investment performance than if we had not engaged in any such hedging transactions. In addition, the degree of correlation between price movements of the instruments used in a hedging strategy and price movements in the portfolio positions being hedged may vary. Moreover, for a variety of reasons, we may not seek or be able to establish a perfect correlation between such hedging instruments and the portfolio holdings being hedged. Any such imperfect correlation may prevent us from achieving the intended hedge and expose us to risk of loss. In addition, it may not be possible to hedge fully or perfectly against currency fluctuations affecting the value of securities denominated in non-U.S. currencies because the value of those securities is likely to fluctuate as a result of factors not related to currency fluctuations.
| 49 |
The disposition of our investments may result in contingent liabilities.
We currently expect that a significant portion of our investments will involve lending directly to private companies. In connection with the disposition of an investment in private securities, we may be required to make representations about the business and financial affairs of the portfolio company typical of those made in connection with the sale of a business. We may also be required to indemnify the purchasers of such investment to the extent that any such representations turn out to be inaccurate or with respect to certain potential liabilities. These arrangements may result in contingent liabilities that ultimately yield funding obligations that must be satisfied through our return of certain distributions previously made to us.
If we invest in the securities and obligations of distressed and bankrupt issuers, we might not receive interest or other payments.
We may invest in the securities and obligations of distressed and bankrupt issuers, including debt obligations that are in covenant or payment default. Such investments generally are considered speculative. The repayment of defaulted obligations is subject to significant uncertainties. Defaulted obligations might be repaid only after lengthy workout or bankruptcy proceedings, during which the issuer of those obligations might not make any interest or other payments. We may not realize gains from our equity investments.
Risks Related to Our Operations as a BDC and a RIC
Regulations governing our operation as a BDC may limit our ability to, and the way in which we raise additional capital, which could have a material adverse impact on our liquidity, financial condition and results of operations.
Our business requires a substantial amount of capital to operate and grow. We may acquire additional capital from the issuance of senior securities (including debt and preferred stock), the issuance of additional shares of our common stock or from securitization transactions. We also may issue, through our SBIC subsidiary, additional SBA-guaranteed debentures, subject to certain restrictions. For a discussion of the requirements for issuing SBA-guaranteed debentures, see “Regulation — Small Business Investment Company Regulations.” However, we may not be able to raise additional capital in the future on favorable terms or at all. Additionally, we may only issue senior securities up to the maximum amount permitted by the 1940 Act. The 1940 Act permits us to issue senior securities only in amounts such that our asset coverage, as defined in the 1940 Act, equals at least 200% after such issuance or incurrence. If our assets decline in value and we fail to satisfy this test, we may be required to liquidate a portion of our investments and repay a portion of our indebtedness at a time when such sales or repayment may be disadvantageous, which could have a material adverse impact on our liquidity, financial condition and results of operations.
| · | Senior Securities . As a result of issuing senior securities, we would also be exposed to typical risks associated with leverage, including an increased risk of loss. If we issue preferred securities, such securities would rank “senior” to common stock in our capital structure, resulting in preferred stockholders having separate voting rights and possibly rights, preferences or privileges more favorable than those granted to holders of our common stock. Furthermore, the issuance of preferred securities could have the effect of delaying, deferring or preventing a transaction or a change of control that might involve a premium price for our common stockholders or otherwise be in your best interest. |
| · | Additional Common Stock . Our board of directors may decide to issue common stock to finance our operations rather than issuing debt or other senior securities. As a BDC, we are generally not able to issue our common stock at a price below NAV without first obtaining required approvals from our stockholders and our independent directors. In any such case, the price at which our securities are to be issued and sold may not be less than a price that, in the determination of our board of directors, closely approximates the market value of such securities at the relevant time. We may also make rights offerings to our stockholders at prices per share less than the NAV per share, subject to the requirements of the 1940 Act. If we raise additional funds by issuing more common stock or senior securities convertible into, or exchangeable for, our common stock, the percentage ownership of our stockholders at that time would decrease, and such stockholders may experience dilution. |
Changes in the laws or regulations governing our business, or changes in the interpretations thereof, and any failure by us to comply with these laws or regulations, could have a material adverse effect on our business, results of operations or financial condition.
Changes in the laws or regulations or the interpretations of the laws and regulations that govern BDCs, RICs or non-depository commercial lenders could significantly affect our operations and our cost of doing business. We are subject to federal, state and local laws and regulations and are subject to judicial and administrative decisions that affect our operations, including our loan originations, maximum interest rates, fees and other charges, disclosures to portfolio companies, the terms of secured transactions, collection and foreclosure procedures and other trade practices. If these laws, regulations or decisions change, or if we expand our business into jurisdictions that have adopted more stringent requirements than those in which we currently conduct business, we may have to incur significant expenses in order to comply, or we might have to restrict our operations. In addition, if we do not comply with applicable laws, regulations and decisions, we may lose licenses needed for the conduct of our business and may be subject to civil fines and criminal penalties. In addition, any change to the SBA’s current debenture SBIC program could have a significant impact on our ability to obtain lower-cost leverage, through our SBIC subsidiary, and therefore, our ability to compete with other finance companies.
| 50 |
The impact of recent financial reform legislation on us is uncertain.
In light of current conditions in the U.S. and global financial markets and the U.S. and global economy, legislators, the presidential administration and regulators have increased their focus on the regulation of the financial services industry. The Dodd-Frank Reform Act became effective on July 21, 2010, however many provisions of the Dodd-Frank Reform Act have delayed effective dates or will not become effective until the relevant federal agencies issue new rules to implement the Dodd-Frank Reform Act. Nevertheless, the Dodd-Frank Reform Act may have a material adverse impact on the financial services industry as a whole and on our business, results of operations and financial condition. Accordingly, we are continuing to evaluate the effect the Dodd-Frank Reform Act or its implementing regulations will have on our business, results of operations or financial condition.
If we do not invest a sufficient portion of our assets in qualifying assets, we could fail to qualify as a BDC, which would have a material adverse effect on our business, financial condition and results of operations.
As a BDC, we may not acquire any assets other than “qualifying assets” unless, at the time of and after giving effect to such acquisition, at least 70% of our total assets are qualifying assets. See “Regulation”. Our intent is that a substantial portion of the investments that we acquire will constitute qualifying assets. However, we may be precluded from investing in what we believe are attractive investments if such investments are not qualifying assets for purposes of the 1940 Act. If we do not invest a sufficient portion of our assets in qualifying assets, we could be found to be in violation of the 1940 Act provisions applicable to BDCs and possibly lose our status as a BDC, which would have a material adverse effect on our business, financial condition and results of operations.
We will become subject to corporate-level U.S. federal income tax if we are unable to maintain our qualification as a regulated investment company under Subchapter M of the Code.
We have elected and qualified to be treated as a RIC under Subchapter M of the Code and intend to maintain such qualification for succeeding tax years. No assurance can be given that we will be able to qualify for and maintain our RIC status. To obtain and maintain RIC tax treatment under the Code, we must meet the following annual distribution, income source and asset diversification requirements.
| · | The distribution requirement for a RIC is satisfied if we distribute to our stockholders at least 90% of our net ordinary income and realized net short-term capital gains in excess of realized net long-term capital losses, if any. Because we may use debt financing, we are subject to certain asset coverage ratio requirements under the 1940 Act and financial covenants under loan and credit agreements that could, under certain circumstances, restrict us from making distributions necessary to satisfy the distribution requirement. If we are unable to obtain cash from other sources, we could fail to qualify for RIC tax treatment and thus become subject to corporate-level U.S. federal income tax. |
| · | The income source requirement is satisfied if we obtain at least 90% of our income for each fiscal year from dividends, interest, gains from the sale of stock or securities or similar sources. |
| · | The asset diversification requirement is satisfied if we meet certain asset diversification requirements at the end of each quarter of our taxable year. Failure to meet those requirements may result in our having to dispose of certain investments quickly in order to prevent the loss of RIC status. Because most of our investments will be in private companies, and therefore will be relatively illiquid, any such dispositions could be made at disadvantageous prices and could result in substantial losses. |
If we fail to qualify for RIC tax treatment for any reason and remain or become subject to corporate-level U.S. federal income tax, the resulting corporate taxes could substantially reduce our net assets, the amount of income available for distribution and the amount of our distributions. Such a failure would have a material adverse effect on our results of operations and financial conditions, and thus, our stockholders.
Risks Relating to an Investment in Our Securities
Investing in our securities may involve an above average degree of risk.
The investments we make in accordance with our investment objective may result in a higher amount of risk than alternative investment options and a higher risk of volatility or loss of principal. Our investments in portfolio companies involve higher levels of risk and, therefore, an investment in our securities may not be suitable for someone with lower risk tolerance.
| 51 |
Shares of closed-end investment companies, including business development companies, may, at times, trade at a discount to their NAV.
Shares of closed-end investment companies, including business development companies, may, at times, trade at a discount from NAV. This characteristic of closed-end investment companies and business development companies is separate and distinct from the risk that our NAV per share may decline. We cannot predict whether our common stock will trade at, above or below NAV.
The market price of our common stock may fluctuate significantly.
The market price and liquidity of the market for shares of our common stock may be significantly affected by numerous factors, some of which are beyond our control and may not be directly related to our operating performance. These factors include:
| · | significant volatility in the market price and trading volume of securities of business development companies or other companies in our sector, which are not necessarily related to the operating performance of the companies; |
| · | changes in regulatory policies, accounting pronouncements or tax guidelines, particularly with respect to BDCs, SBICs or RICs; |
| · | loss of our qualification as a RIC or BDC or our SBIC subsidiary’s status as an SBIC; |
| · | changes in earnings or variations in operating results; |
| · | changes in the value of our portfolio of investments; |
| · | changes in accounting guidelines governing valuation of our investments; |
| · | any shortfall in revenue or net income or any increase in losses from levels expected by investors or securities analysts; |
| · | departure of MCC Advisors’ or any of its affiliates’ key personnel; |
| · | operating performance of companies comparable to us; |
| · | general economic trends and other external factors; and |
| · | loss of a major funding source. |
Sales of substantial amounts of our common stock in the public market may have an adverse effect on the market price of our common stock.
Sales of substantial amounts of our common stock, or the availability of such common stock for sale, could adversely affect the prevailing market prices for our common stock. If this occurs and continues, it could impair our ability to raise additional capital through the sale of securities should we desire to do so.
Certain provisions of the Delaware General Corporation Law and our certificate of incorporation and bylaws could deter takeover attempts and have an adverse impact on the price of our common stock.
The Delaware General Corporation Law, our certificate of incorporation and our bylaws contain provisions that may have the effect of discouraging a third party from making an acquisition proposal for us. These anti-takeover provisions may inhibit a change in control in circumstances that could give the holders of our common stock the opportunity to realize a premium over the market price of our common stock.
The NAV per share of our common stock may be diluted if we sell shares of our common stock in one or more offerings at prices below the then current NAV per share of our common stock or securities to subscribe for or convertible into shares of our common stock.
While we currently do not have the requisite stockholder approval to sell shares of our common stock at a price or prices below our then current NAV per share, we may seek such approval in the future. In addition, at our 2012 Annual Meeting of Stockholders, we received approval from our stockholders to authorize the Company, with the approval of our board of directors, to issue securities to, subscribe to, convert to, or purchase shares of the Company’s common stock in one or more offerings, subject to certain conditions as set forth in the proxy statement. Such authorization has no expiration.
| 52 |
Any decision to sell shares of our common stock below its then current NAV per share or issue securities to subscribe for or convertible into shares of our common stock would be subject to the determination by our board of directors that such issuance is in our and our stockholders’ best interests.
If we were to sell shares of our common stock below its then current NAV per share, such sales would result in an immediate dilution to the NAV per share of our common stock. This dilution would occur as a result of the sale of shares at a price below the then current NAV per share of our common stock and a proportionately greater decrease in the stockholders’ interest in our earnings and assets and their voting interest in us than the increase in our assets resulting from such issuance. Because the number of shares of common stock that could be so issued and the timing of any issuance is not currently known, the actual dilutive effect cannot be predicted.
If we issue warrants or securities to subscribe for or convertible into shares of our common stock, subject to certain limitations, the exercise or conversion price per share could be less than NAV per share at the time of exercise or conversion (including through the operation of anti-dilution protections). Because we would incur expenses in connection with any issuance of such securities, such issuance could result in a dilution of the NAV per share at the time of exercise or conversion. This dilution would include reduction in NAV per share as a result of the proportionately greater decrease in the stockholders’ interest in our earnings and assets and their voting interest than the increase in our assets resulting from such issuance.
Further, if our current stockholders do not purchase any shares to maintain their percentage interest, regardless of whether such offering is above or below the then current NAV per share, their voting power will be diluted. For example, if we sell an additional 10% of our shares of common stock at a 5% discount from NAV, a stockholder who does not participate in that offering for its proportionate interest will suffer NAV dilution of up to 0.5% or $5 per $1,000 of NAV.
The Notes are unsecured and therefore are effectively subordinated to any secured indebtedness we have currently incurred or may incur in the future.
The Notes are not secured by any of our assets or any of the assets of our subsidiaries. As a result, the Notes are effectively subordinated to any secured indebtedness we or our subsidiaries have currently incurred and may incur in the future (or any indebtedness that is initially unsecured to which we subsequently grant security) to the extent of the value of the assets securing such indebtedness. In any liquidation, dissolution, bankruptcy or other similar proceeding, the holders of any of our existing or future secured indebtedness and the secured indebtedness of our subsidiaries may assert rights against the assets pledged to secure that indebtedness in order to receive full payment of their indebtedness before the assets may be used to pay other creditors, including the holders of the Notes. As of September 30, 2016, before netting out debt issuance costs, there was $174.0 million outstanding under our Term Loan Facility, $14.0 million outstanding under our Revolving Credit Facility, and $150.0 million SBA-guaranteed debentures outstanding. The indebtedness under the Facilities and the SBA-guaranteed debentures are effectively senior to the Notes to the extent of the value of the assets securing such indebtedness.
The Notes are structurally subordinated to the indebtedness and other liabilities of our subsidiaries.
The Notes are obligations exclusively of the Company and not of any of our subsidiaries. None of our subsidiaries is a guarantor of the Notes and the Notes are not required to be guaranteed by any subsidiary we may acquire or create in the future. Any assets of our subsidiaries will not be directly available to satisfy the claims of our creditors, including holders of the Notes. Except to the extent we are a creditor with recognized claims against our subsidiaries, all claims of creditors of our subsidiaries will have priority over our equity interests in such subsidiaries (and therefore the claims of our creditors, including holders of the Notes) with respect to the assets of such subsidiaries. Even if we are recognized as a creditor of one or more of our subsidiaries, our claims would still be effectively subordinated to any security interests in the assets of any such subsidiary and to any indebtedness or other liabilities of any such subsidiary senior to our claims. Consequently, the Notes will be structurally subordinated to all indebtedness and other liabilities of any of our subsidiaries and any subsidiaries that we may in the future acquire or establish. Although our subsidiaries currently do not have any indebtedness outstanding, they may incur substantial indebtedness in the future, all of which would be structurally senior to the Notes.
The indenture under which the Notes were issued contains limited protection for holders of the Notes.
The indenture under which the Notes were issued offers limited protection to holders of the Notes. The terms of the indenture and the Notes do not restrict our or any of our subsidiaries’ ability to engage in, or otherwise be a party to, a variety of corporate transactions, circumstances or events that could have an adverse impact on your investment in the Notes. In particular, the terms of the indenture and the Notes place no restrictions on our or our subsidiaries’ ability to:
| · | issue securities or otherwise incur additional indebtedness or other obligations, including (1) any indebtedness or other obligations that would be equal in right of payment to the Notes, (2) any indebtedness or other obligations that would be secured and therefore rank effectively senior in right of payment to the Notes to the extent of the values of the assets securing such debt, (3) indebtedness of ours that is guaranteed by one or more of our subsidiaries and which therefore is structurally senior to the Notes and (4) securities, indebtedness or obligations issued or incurred by our subsidiaries that would be senior to our equity interests in our subsidiaries and therefore rank structurally senior to the Notes with respect to the assets of our subsidiaries, in each case other than an incurrence of indebtedness or other obligation that would cause a violation of Section 18(a)(1)(A) of the 1940 Act, as modified by Section 61(a)(1) of the 1940 Act, or any successor provisions. These provisions generally prohibit us from making additional borrowings, including through the issuance of additional debt or the sale of additional debt securities, unless our asset coverage, as defined in the 1940 Act, equals at least 200% after such borrowings; |
| 53 |
| · | pay dividends on, or purchase or redeem or make any payments in respect of, capital stock or other securities ranking junior in right of payment to the Notes, in each case other than dividends, purchases, redemptions or payments that would cause a violation of Section 18(a)(1)(B) of the 1940 Act, as modified by Section 61(a)(1) of the 1940 Act, or any successor provisions. These provisions generally prohibit us from declaring any cash dividend or distribution upon any class of our capital stock, or purchasing any such capital stock if our asset coverage, as defined in the 1940 Act, is below 200% at the time of the declaration of the dividend or distribution or the purchase and after deducting the amount of such dividend, distribution or purchase; |
| · | sell assets (other than certain limited restrictions on our ability to consolidate, merge or sell all or substantially all of our assets); |
| · | enter into transactions with affiliates; |
| · | create liens (including liens on the shares of our subsidiaries) or enter into sale and leaseback transactions; |
| · | make investments; or |
| · | create restrictions on the payment of dividends or other amounts to us from our subsidiaries. |
In addition, the indenture does not require us to offer to purchase the Notes in connection with a change of control or any other event.
Furthermore, the terms of the indenture and the Notes generally do not protect holders of the Notes in the event that we experience changes (including significant adverse changes) in our financial condition, results of operations or credit ratings, as they do not require that we or our subsidiaries adhere to any financial tests or ratios or specified levels of net worth, revenues, income, cash flow, or liquidity other than as described under the indenture. Any changes, while unlikely, to the financial tests in the 1940 Act could affect the terms of the Notes.
Our ability to recapitalize, incur additional debt and take a number of other actions that are not limited by the terms of the Notes may have important consequences for you as a holder of the Notes, including making it more difficult for us to satisfy our obligations with respect to the Notes or negatively affecting the trading value of the Notes. Other debt we issue or incur in the future could contain more protections for its holders than the indenture and the Notes, including additional covenants and events of default. For example, the indenture under which the Notes will be issued does not contain cross-default provisions that are contained in the Facilities. The issuance or incurrence of any such debt with incremental protections could affect the market for and trading levels and prices of the Notes.
An active trading market for the Notes may not develop or be sustained, which could limit the market price of the Notes or your ability to sell them.
Although the Notes are listed on the NYSE under the symbols “MCQ,” in the case of the 2019 Notes, “MCV,” in the case of the 2023 Notes, and “MCX,” in the case of the 2021 Notes, we cannot provide any assurances that an active trading market will develop or be sustained for the Notes or that you will be able to sell your Notes. At various times, the Notes may trade at a discount from their initial offering price depending on prevailing interest rates, the market for similar securities, our credit ratings, general economic conditions, our financial condition, performance and prospects and other factors. To the extent an active trading market is not sustained, the liquidity and trading price for the Notes may be harmed.
If we default on our obligations to pay our other indebtedness, we may not be able to make payments on the Notes.
Any default under the agreements governing our indebtedness, including a default under the Facilities or other indebtedness to which we may be a party that is not waived by the required lenders, and the remedies sought by the holders of such indebtedness could make us unable to pay principal, premium, if any, and interest on the Notes and substantially decrease the market value of the Notes. If we are unable to generate sufficient cash flow and are otherwise unable to obtain funds necessary to meet required payments of principal, premium, if any, and interest on our indebtedness, or if we otherwise fail to comply with the various covenants, including financial and operating covenants, in the instruments governing our indebtedness (including the Facilities), we could be in default under the terms of the agreements governing such indebtedness. In the event of such default, the holders of such indebtedness could elect to declare all the funds borrowed thereunder to be due and payable, together with accrued and unpaid interest, the lenders under the Facilities or other debt we may incur in the future could elect to terminate their commitments, cease making further loans and institute foreclosure proceedings against our assets, and we could be forced into bankruptcy or liquidation. If our operating performance declines, we may in the future need to seek to obtain waivers from the required lenders under the Facilities or other debt that we may incur in the future to avoid being in default. If we breach our covenants under the Facilities or other debt and seek a waiver, we may not be able to obtain a waiver from the required lenders. If this occurs, we would be in default under the Facilities or other debt, the lenders could exercise their rights as described above, and we could be forced into bankruptcy or liquidation. If we are unable to repay debt, lenders having secured obligations could proceed against the collateral securing the debt. Because the Facilities have, and any future credit facilities will likely have, customary cross-default provisions, if the indebtedness under the Notes, the Facilities or under any future credit facility is accelerated, we may be unable to repay or finance the amounts due.
| 54 |
If we issue preferred stock, the NAV and market value of our common stock may become more volatile.
If we issue preferred stock, we cannot assure you that such issuance would result in a higher yield or return to the holders of our common stock. The issuance of preferred stock would likely cause the NAV and market value of our common stock to become more volatile. If the dividend rate on the preferred stock were to approach the net rate of return on our investment portfolio, the benefit of leverage to the holders of our common stock would be reduced. If the dividend rate on the preferred stock were to exceed the net rate of return on our portfolio, the leverage would result in a lower rate of return to the holders of our common stock than if we had not issued preferred stock. Any decline in the NAV of our investments would be borne entirely by the holders of our common stock. Therefore, if the market value of our portfolio were to decline, the leverage would result in a greater decrease in NAV to the holders of our common stock than if we were not leveraged through the issuance of preferred stock. This greater NAV decrease would also tend to cause a greater decline in the market price for our common stock. We might be in danger of failing to maintain the required asset coverage of the preferred stock or of losing our ratings on the preferred stock or, in an extreme case, our current investment income might not be sufficient to meet the dividend requirements on the preferred stock. In order to counteract such an event, we might need to liquidate investments in order to fund a redemption of some or all of the preferred stock. In addition, we would pay (and the holders of our common stock would bear) all costs and expenses relating to the issuance and ongoing maintenance of the preferred stock, including higher advisory fees if our total return exceeds the dividend rate on the preferred stock. Holders of preferred stock may have different interests than holders of our common stock and may at times have disproportionate influence over our affairs.
Holders of any preferred stock we might issue would have the right to elect members of the board of directors and class voting rights on certain matters.
Holders of any preferred stock we might issue, voting separately as a single class, would have the right to elect two members of the board of directors at all times and in the event dividends become two full years in arrears, would have the right to elect a majority of our directors until such arrearage is completely eliminated. In addition, preferred stockholders would have class voting rights on certain matters, including changes in fundamental investment restrictions and conversion to open-end status, and accordingly would be able to veto any such changes. Restrictions imposed on the declarations and payment of dividends or other distributions to the holders of our common stock and preferred stock, both by the 1940 Act and by requirements imposed by rating agencies or the terms of our Facilities, might impair our ability to maintain our qualification as a RIC for U.S. federal income tax purposes. While we would intend to redeem our preferred stock to the extent necessary to enable us to distribute our income as required to maintain our qualification as a RIC, there can be no assurance that such actions could be effected in time to meet the tax requirements.
Item 1B. Unresolved Staff Comments
None.
Properties
We do not own any real estate or other physical properties materially important to our operation. Our headquarters are currently located at 280 Park Avenue, 6th Floor East, New York, NY 10017. Our administrator furnishes us office space and we reimburse it for such costs on an allocated basis.
From time to time, we are involved in various legal proceedings, lawsuits and claims incidental to the conduct of our business. Our businesses are also subject to extensive regulation, which may result in regulatory proceedings against us. Except as described below, we are not currently party to any material legal proceedings.
| 55 |
MCC Advisors LLC was named as a defendant in a lawsuit on May 29, 2015, by Moshe Barkat and Modern VideoFilm Holdings, LLC (“MVF Holdings”) against MCC, MOF II, MCC Advisors LLC, Deloitte Transactions and Business Analytics LLP A/K/A Deloitte ERG (“Deloitte”), Scott Avila (“Avila”), Charles Sweet, and Modern VideoFilm, Inc. (“MVF”). The lawsuit is pending in the California Superior Court, Los Angeles County, Central District, as Case No. BC 583437. The lawsuit was filed after MCC, as agent for the lender group, exercised remedies following a series of defaults by MVF and MVF Holdings on a secured loan with an outstanding balance at the time in excess of $65 million. The lawsuit sought damages in excess of $100 million. Deloitte and Avila have settled the claims against them in exchange for payment of $1.5 million. Following a separate lawsuit by Mr. Barkat against MVF's D&O insurance carrier, the carrier, Charles Sweet and MVF have settled the claims against them. On June 6, 2016, the court granted the defendants' demurrers on several counts and dismissed Mr. Barkat's claims except with respect to his claim for intentional interference with contract. MCC and the other defendants continue to dispute the remaining allegations and are vigorously defending the lawsuit while pursuing affirmative counterclaims against Mr. Barkat and MVF Holdings. On August 29, 2016, MVF Holdings filed another lawsuit in the California Superior Court, Los Angeles County, Central District, as Case No. BC 631888 (the “Derivative Action”), naming Medley as a defendant, among others. In the Derivative Action, MVF Holdings reasserts substantially the same claims that were previously asserted in each of their three prior complaints. MVF Holdings claims for breach of fiduciary duty and related causes of action have already been dismissed by the California Superior Court on several occasions, most recently, on June 6, 2016, when the Court dismissed those claims with prejudice. Medley and the other defendants believe the outstanding claims for alleged interference with Mr. Barkat's employment contract, and the other causes of action asserted in the Derivative Action are without merit and all defendants intend to continue to assert a vigorous defense.
Item 4. Mine Safety Disclosures
None.
Item 5. Market for Registrant’s Common Equity, Related Stockholder Matters and Issuer Purchases of Equity Securities
Price Range of Common Stock
Our common stock is currently traded on the New York Stock Exchange under the symbol “MCC”. The following table lists the high and low closing sale prices for our common stock, the closing sale prices as a percentage of net asset value, or NAV, and the dividends per share declared by us for each fiscal quarter for the years ended September 30, 2015 and 2016.
| Closing Sales Price | ||||||||||||||||||||||||
| Period | NAV(1) | High | Low | Premium/Discount of High Sales Price to NAV(2) | Premium/Discount of Low Sales Price to NAV(2) | Declared Dividends(3) | ||||||||||||||||||
| Fiscal year ended September 30, 2015 | ||||||||||||||||||||||||
| First quarter | $ | 11.74 | $ | 11.79 | $ | 8.84 | 100.43 | % | 75.30 | % | $ | 0.37 | ||||||||||||
| Second quarter | $ | 11.68 | $ | 9.72 | $ | 8.70 | 83.25 | % | 74.52 | % | $ | 0.30 | ||||||||||||
| Third quarter | $ | 11.53 | $ | 9.53 | $ | 8.85 | 82.65 | % | 76.76 | % | $ | 0.30 | ||||||||||||
| Fourth quarter | $ | 11.00 | $ | 9.19 | $ | 7.41 | 83.55 | % | 67.36 | % | $ | 0.30 | ||||||||||||
| Fiscal year ended September 30, 2016 | ||||||||||||||||||||||||
| First quarter | $ | 10.01 | $ | 8.16 | $ | 7.01 | 81.52 | % | 70.03 | % | $ | 0.30 | ||||||||||||
| Second quarter | $ | 9.80 | $ | 7.74 | $ | 5.37 | 78.98 | % | 54.80 | % | $ | 0.30 | ||||||||||||
| Third quarter | $ | 9.76 | $ | 6.95 | $ | 6.26 | 71.21 | % | 64.14 | % | $ | 0.30 | ||||||||||||
| Fourth quarter | $ | 9.49 | $ | 7.77 | $ | 7.05 | 81.88 | % | 74.29 | % | $ | 0.22 | ||||||||||||
(1) NAV per share is determined as of the last day in the relevant quarter and therefore may not reflect the NAV per share on the date of the high and low sales prices. The NAVs shown are based on outstanding shares at the end of each period.
(2) Calculated as of the respective high or low closing sales price divided by the quarter end NAV.
(3) Represents the cash dividend declared for the specified quarter.
The last reported price for our common stock on December 7, 2016 was $7.65 per share. As of September 30, 2016, we had 13 stockholders of record.
| 56 |
Sales of Unregistered Securities
During the year ended September 30, 2016, we did not issue any shares of common stock under our dividend reinvestment plan.
On February 5, 2015, the Company’s board of directors approved a share repurchase plan to repurchase equity interests up to an aggregate amount of $30 million between the period of the approval date and February 5, 2016. On December 4, 2015, the board of directors extended the duration of the share repurchase program through December 31, 2016 and increased the aggregate amount to $50.0 million. Any stock repurchases will be made through the open market at times, and in such amounts, as management deems appropriate. During the year ended September 30, 2016 we repurchased 1,862,941 shares with an aggregate dollar value of $12.9 million.
Distributions
Our dividends, if any, are determined by the board of directors. We have elected and qualified to be treated as a RIC under Subchapter M of the Code. To maintain RIC qualification, we must distribute at least 90% of our net ordinary income and net short-term capital gains in excess of our net long-term capital losses, if any. We will be subject to a 4% nondeductible federal excise tax on our undistributed income unless we distribute in a timely manner an amount at least equal to the sum of (1) 98% of our ordinary income for each calendar year, (2) 98.2% of our capital gain net income (both long-term and short-term) for the one-year period ending October 31 in that calendar year and (3) any income realized, but not distributed in the preceding year.
The following table reflects the cash distributions, including dividends and returns of capital per share that we have declared on our common stock since completion of our initial public offering.
Dividends Declared
| Record Dates | Payment Dates | Per Share | ||||
| Fiscal year ended September 30, 2011 | ||||||
| June 1, 2011 | June 15, 2011 | $ | 0.16 | |||
| September 1, 2011 | September 15, 2011 | $ | 0.21 | |||
| Total | $ | 0.37 | ||||
| Fiscal year ended September 30, 2012 | ||||||
| December 15, 2011 | December 30, 2011 | $ | 0.25 | |||
| February 24, 2012 | March 15, 2012 | $ | 0.28 | |||
| May 25, 2012 | June 15, 2012 | $ | 0.31 | |||
| August 24, 2012 | September 14, 2012 | $ | 0.36 | |||
| Total | $ | 1.20 | ||||
| Fiscal year ended September 30, 2013 | ||||||
| November 23, 2012 | December 14, 2012 | $ | 0.36 | |||
| February 27, 2013 | March 15, 2013 | $ | 0.36 | |||
| May 27, 2013 | June 14, 2013 | $ | 0.36 | |||
| August 23, 2013 | September 13, 2013 | $ | 0.37 | |||
| Total | $ | 1.45 | ||||
| Fiscal year ended September 30, 2014 | ||||||
| November 22, 2013 | December 13, 2013 | $ | 0.37 | |||
| February 26, 2014 | March 14, 2014 | $ | 0.37 | |||
| May 28, 2014 | June 13, 2014 | $ | 0.37 | |||
| August 27, 2014 | September 12, 2014 | $ | 0.37 | |||
| Total | $ | 1.48 | ||||
| Fiscal year ended September 30, 2015 | ||||||
| November 26, 2014 | December 12, 2014 | $ | 0.37 | |||
| February 25, 2015 | March 13, 2015 | $ | 0.30 | |||
| May 20, 2015 | June 12, 2015 | $ | 0.30 | |||
| August 19, 2015 | September 11, 2015 | $ | 0.30 | |||
| Total | $ | 1.27 | ||||
| Fiscal year ended September 30, 2016 | ||||||
| November 25, 2015 | December 18, 2015 | $ | 0.30 | |||
| February 24, 2016 | March 18, 2016 | $ | 0.30 | |||
| May 25, 2016 | June 24, 2016 | $ | 0.30 | |||
| August 24, 2016 | September 23, 2016 | $ | 0.22 | |||
| Total | $ | 1.12 | ||||
| 57 |
Subsequent to September 30, 2016, our board of directors declared a quarterly dividend of $0.22 per share payable on December 23, 2016, to stockholders of record at the close of business on November 23, 2016.
We have adopted a dividend reinvestment plan that provides for reinvestment of our dividends and other distributions on behalf of our stockholders, unless a stockholder elects to receive cash as provided below. As a result, if our board of directors authorizes, and we declare, a cash dividend or other distribution, then our stockholders who have not “opted out” of our dividend reinvestment plan will have their cash distribution automatically reinvested in additional shares of our common stock, rather than receiving the cash distribution.
Stock Performance Graph
This graph compares the stockholder return on our common stock from January 20, 2011 (IPO) to September 30, 2016 with that of the Standard & Poor’s 500 Stock Index and the Russell 2000 Financial Services Index. This graph assumes that on January 20, 2011, $100 was invested in our common stock, the S&P 500 Index, and the Russell 2000 Financial Services Index. The graph also assumes the reinvestment of all cash dividends prior to any tax effect. The graph and other information furnished under this Part II Item 5 of this annual report on Form 10-K shall not be deemed to be “soliciting material” or to be “filed” with the SEC or subject to Regulation 14A or 14C, or to the liabilities of Section 18 of the Exchange Act. The stock price performance included in the below graph is not necessarily indicative of future stock performance.
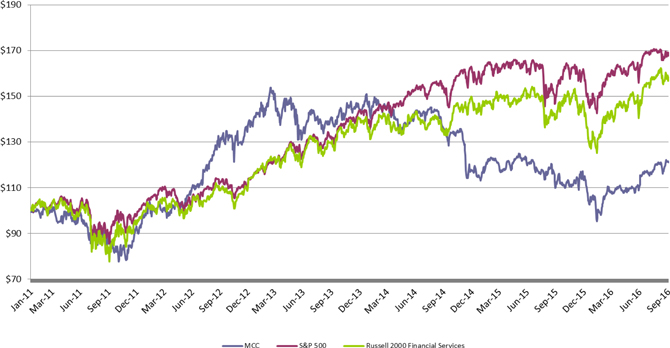
Item 6. Selected Financial Data
We have derived the selected financial data below from our audited consolidated financial statements for the fiscal years ended September 30, 2016, 2015, 2014, 2013, and 2012 which have been audited by Ernst & Young LLP, our independent registered public accounting firm.
The following selected financial data should be read together with our financial statements and the related notes and the discussion under “Item 7. Management’s Discussion and Analysis of Financial Condition and Results of Operations” (dollars in thousands except per share and other data).
| 58 |
| For the years ended September 30, | ||||||||||||||||||||
| 2016 | 2015 | 2014 | 2013 | 2012 | ||||||||||||||||
| Statement of Operations data: | ||||||||||||||||||||
| Total investment income | $ | 120,749 | $ | 149,196 | $ | 139,390 | $ | 88,991 | $ | 44,520 | ||||||||||
| Base management fee | 19,470 | 22,450 | 17,684 | 10,918 | 5,480 | |||||||||||||||
| Incentive fee | 11,492 | 18,234 | 18,667 | 11,600 | 5,886 | |||||||||||||||
| All other expenses | 39,843 | 35,576 | 28,371 | 20,074 | 9,644 | |||||||||||||||
| Management fee waiver | (143 | ) | - | - | - | (41 | ) | |||||||||||||
| Incentive fee waiver | (3,504 | ) | - | - | - | - | ||||||||||||||
| Net investment income | 53,591 | 72,936 | 74,668 | 46,399 | 23,510 | |||||||||||||||
| Unrealized appreciation/(depreciation) on investments | (42,257 | ) | (26,723 | ) | (21,274 | ) | (7,242 | ) | (1,062 | ) | ||||||||||
| Change in provision for deferred taxes on unrealized appreciation/(depreciation) on investments | 87 | (61 | ) | (1,592 | ) | - | - | |||||||||||||
| Realized gain/(loss) on investments | (39,383 | ) | (60,910 | ) | 356 | 261 | (44 | ) | ||||||||||||
| Net increase in net assets resulting from operations | (27,962 | ) | (14,758 | ) | 52,158 | 39,418 | 22,404 | |||||||||||||
| Per share data: | ||||||||||||||||||||
| Net asset value per common share at year end | $ | 9.49 | $ | 11.00 | $ | 12.43 | $ | 12.70 | $ | 12.52 | ||||||||||
| Market price at year end | 7.63 | 7.44 | 11.81 | 13.79 | 14.07 | |||||||||||||||
| Net investment income | 0.97 | 1.27 | 1.58 | 1.53 | 1.31 | |||||||||||||||
| Net realized and unrealized loss on investments | (1.47 | ) | (1.52 | ) | (0.45 | ) | (0.23 | ) | (0.06 | ) | ||||||||||
| Provision for taxes or unrealized gain/(loss) on investments | - | (0.01 | ) | (0.03 | ) | - | - | |||||||||||||
| Net increase/(decrease) in net assets resulting from operations | (0.50 | ) | (0.26 | ) | 1.10 | 1.30 | 1.25 | |||||||||||||
| Dividends paid | 1.12 | 1.27 | 1.48 | 1.45 | 1.20 | |||||||||||||||
| Statement of Assets and Liabilities data: | ||||||||||||||||||||
| Total investments at fair value | $ | 914,184 | $ | 1,216,092 | $ | 1,245,538 | $ | 749,237 | $ | 401,949 | ||||||||||
| Cash and cash equivalents | 104,485 | 15,714 | 36,731 | 8,558 | 4,894 | |||||||||||||||
| Other assets(2) | 12,211 | 12,276 | 30,189 | 10,075 | 4,276 | |||||||||||||||
| Total assets | 1,030,880 | 1,244,082 | 1,312,458 | 767,870 | 411,119 | |||||||||||||||
| Total liabilities | 513,961 | 624,162 | 582,601 | 258,036 | 121,780 | |||||||||||||||
| Total net assets | 516,919 | 619,920 | 729,857 | 509,834 | 289,339 | |||||||||||||||
| Other data: | ||||||||||||||||||||
| Weighted average annual yield on debt investments(1) | 11.8 | % | 12.3 | % | 12.6 | % | 13.8 | % | 14.3 | |||||||||||
| Number of investments at year end | 58 | 72 | 79 | 57 | 38 | |||||||||||||||
| (1) | The weighted average yield is based upon original cost on our debt investments. |
| (2) | On January 1, 2016, we adopted Accounting Standards Update (“ASU”) 2015-03 which requires that debt issuance costs related to a recognized debt liability to be presented on the balance sheet as a direct deduction from the carrying amount of the debt liability rather than as an asset. Adoption of ASU 2015-03 requires the changes to be applied retrospectively. |
Item 7. Management’s Discussion and Analysis of Financial Condition and Results of Operations
The following discussion and analysis should be read in conjunction with our financial statements and related notes and other financial information appearing elsewhere in this annual on Form 10-K.
Except as otherwise specified, references to “we,” “us,” “our,” or the “Company,” refer to Medley Capital Corporation.
Forward-Looking Statements
Some of the statements in this annual report on Form 10-K constitute forward-looking statements, which relate to future events or our performance or financial condition. The forward-looking statements contained in this annual report on Form 10-K involve risks and uncertainties, including statements as to:
| · | the introduction, withdrawal, success and timing of business initiatives and strategies; |
| · | changes in political, economic or industry conditions, the interest rate environment or conditions affecting the financial and capital markets, which could result in changes in the value of our assets; |
| · | the relative and absolute investment performance and operations of MCC Advisors; |
| · | the impact of increased competition; |
| · | the impact of future acquisitions and divestitures; |
| · | our business prospects and the prospects of our portfolio companies; |
| · | the impact of legislative and regulatory actions and reforms and regulatory, supervisory or enforcement actions of government agencies relating to us or MCC Advisors; |
| · | our contractual arrangements and relationships with third parties; |
| · | any future financings by us; |
| 59 |
| · | the ability of MCC Advisors to attract and retain highly talented professionals; |
| · | fluctuations in foreign currency exchange rates; |
| · | the impact of changes to tax legislation and, generally, our tax position; and |
| · | the unfavorable resolution of legal proceedings. |
Such forward-looking statements may include statements preceded by, followed by or that otherwise include the words “trend,” “opportunity,” “pipeline,” “believe,” “comfortable,” “expect,” “anticipate,” “current,” “intention,” “estimate,” “position,” “assume,” “potential,” “outlook,” “continue,” “remain,” “maintain,” “sustain,” “seek,” “achieve,” and similar expressions, or future or conditional verbs such as “will,” “would,” “should,” “could,” “may,” or similar expressions. The forward looking statements contained in this annual report involve risks and uncertainties. Our actual results could differ materially from those implied or expressed in the forward-looking statements for any reason, including the factors set forth as “Risk Factors” and elsewhere in this annual report on Form 10-K.
We have based the forward-looking statements included in this report on information available to us on the date of this report, and we assume no obligation to update any such forward-looking statements. Actual results could differ materially from those anticipated in our forward-looking statements, and future results could differ materially from historical performance. Although we undertake no obligation to revise or update any forward-looking statements, whether as a result of new information, future events or otherwise, you are advised to consult any additional disclosures that we may make directly to you or through reports that we have filed or in the future may file with the Securities and Exchange Commission (“SEC”), including annual reports on Form 10-K, registration statements on Form N-2, quarterly reports on Form 10-Q and current reports on Form 8-K.
Overview
We are an externally-managed, non-diversified closed-end management investment company that filed an election to be regulated as a BDC under the 1940 Act. In addition, we have elected and qualified to be treated for U.S. federal income tax purposes as a RIC under subchapter M of the Code.
We commenced operations and completed our initial public offering on January 20, 2011. Our investment activities are managed by MCC Advisors and supervised by our board of directors, of which a majority of the members are independent of us.
Our investment objective is to generate current income and capital appreciation by lending to privately-held middle market companies, primarily through directly originated transactions, to help these companies fund acquisitions, growth or refinancing. Our portfolio generally consists of senior secured first lien term loans and senior secured second lien term loans. In many of our investments, we receive warrants or other equity participation features, which we believe will increase the total investment returns.
As a BDC, we are required to comply with certain regulatory requirements. For instance, we generally have to invest at least 70% of our total assets in “qualifying assets,” including securities of private or thinly traded public U.S. companies, cash, cash equivalents, U.S. government securities and high-quality debt investments that mature in one year or less. In addition, we are only allowed to borrow money such that our asset coverage, as defined in the 1940 Act, equals at least 200% after such borrowing, with certain limited exceptions. To maintain our RIC status, we must meet specified source-of-income and asset diversification requirements. To maintain our RIC tax treatment under subchapter M for U.S. federal income tax purposes, we must timely distribute at least 90% of our net ordinary income and realized net short-term capital gains in excess of realized net long-term capital losses, if any, for the taxable year.
Revenues
We generate revenue in the form of interest income on the debt that we hold and capital gains, if any, on warrants or other equity interests that we may acquire in portfolio companies. We invest our assets primarily in privately held companies with enterprise or asset values between $25 million and $250 million and focus on investment sizes of $10 million to $50 million. We believe that pursuing opportunities of this size offers several benefits including reduced competition, a larger investment opportunity set and the ability to minimize the impact of financial intermediaries. We expect our debt investments to bear interest at either a fixed or floating rate. Interest on debt will be payable generally either monthly or quarterly. In some cases our debt investments may provide for a portion of the interest to be PIK. To the extent interest is PIK, it will be payable through the increase of the principal amount of the obligation by the amount of interest due on the then-outstanding aggregate principal amount of such obligation. The principal amount of the debt and any accrued but unpaid interest will generally become due at the maturity date. In addition, we may generate revenue in the form of commitment, origination, structuring or diligence fees, fees for providing managerial assistance or investment management services and possibly consulting fees. Any such fees will be generated in connection with our investments and recognized as earned.
| 60 |
Expenses
Our primary operating expenses include the payment of management and incentive fees pursuant to the investment management agreement we have with MCC Advisors and overhead expenses, including our allocable portion of our administrator’s overhead under the administration agreement. Our management and incentive fees compensate MCC Advisors for its work in identifying, evaluating, negotiating, closing and monitoring our investments. We bear all other costs and expenses of our operations and transactions, including those relating to:
| · | our organization and continued corporate existence; |
| · | calculating our NAV (including the cost and expenses of any independent valuation firms); |
| · | expenses incurred by MCC Advisors payable to third parties, including agents, consultants or other advisers, in monitoring our financial and legal affairs and in monitoring our investments and performing due diligence on our prospective portfolio companies; |
| · | interest payable on debt, if any, incurred to finance our investments; |
| · | the costs of all offerings of common stock and other securities, if any; |
| · | the base management fee and any incentive fee; |
| · | distributions on our shares; |
| · | administration fees payable under our administration agreement; |
| · | the allocated costs incurred by MCC Advisors in providing managerial assistance to those portfolio companies that request it; |
| · | amounts payable to third parties relating to, or associated with, making investments; |
| · | transfer agent and custodial fees; |
| · | registration fees and listing fees; |
| · | U.S. federal, state and local taxes; |
| · | independent director fees and expenses; |
| · | costs of preparing and filing reports or other documents with the SEC or other regulators; |
| · | the costs of any reports, proxy statements or other notices to our stockholders, including printing costs; |
| · | our fidelity bond; |
| · | directors and officers/errors and omissions liability insurance, and any other insurance premiums; |
| · | indemnification payments; |
| · | direct costs and expenses of administration, including audit and legal costs; and |
| · | all other expenses reasonably incurred by us or MCC Advisors in connection with administering our business, such as the allocable portion of overhead under our administration agreement, including rent and other allocable portions of the cost of certain of our officers and their respective staffs (including travel expenses). |
| 61 |
Portfolio and Investment Activity
As of September 30, 2016 and 2015, our portfolio had a fair market value of approximately $914.2 million and $1,216.1 million, respectively. The following table summarizes our portfolio and investment activity during the fiscal years ended September 30, 2016 and 2015 (dollars in thousands):
| For the years ended September 30 | ||||||||
| 2016 | 2015 | |||||||
| Investments made in new portfolio companies | $ | 25,554 | $ | 168,828 | ||||
| Investments made in existing portfolio companies | 68,905 | 104,536 | ||||||
| Aggregate amount in exits and repayments | (327,600 | ) | (227,493 | ) | ||||
| Net investment activity | $ | (233,141 | ) | $ | 45,871 | |||
| Portfolio Companies, at beginning of period | 72 | 79 | ||||||
| Number of new portfolio companies | 2 | 13 | ||||||
| Number of exited portfolio companies | (16 | ) | (20 | ) | ||||
| Portfolio companies, at end of period | 58 | 72 | ||||||
| Number of investments in existing portfolio companies | 17 | 18 | ||||||
The following table summarizes the amortized cost and the fair value of our average portfolio company investment and largest portfolio company investment as of September 30, 2016 and 2015 (dollars in thousands):
| As of | As of | |||||||||||||||
| September 30, 2016 | September 30, 2015 | |||||||||||||||
| Amortized Cost | Fair Value | Amortized Cost | Fair Value | |||||||||||||
| Average portfolio company investment | $ | 17,464 | $ | 15,762 | $ | 17,674 | $ | 16,890 | ||||||||
| Largest portfolio company investment | 53,777 | 51,930 | 56,135 | 55,225 | ||||||||||||
The following table summarizes the amortized cost and the fair value of investments as of September 30, 2016 (dollars in thousands):
| Amortized Cost | Percentage | Fair Value | Percentage | |||||||||||||
| Senior Secured First Lien Term Loans | $ | 612,762 | 60.5 | % | $ | 565,329 | 61.8 | % | ||||||||
| Senior Secured Second Lien Term Loans | 229,898 | 22.7 | 213,537 | 23.4 | ||||||||||||
| Senior Secured First Lien Notes | 26,755 | 2.6 | 27,423 | 3.0 | ||||||||||||
| Unsecured Debt | 62,150 | 6.1 | 52,809 | 5.8 | ||||||||||||
| MCC Senior Loan Strategy JV I LLC | 32,113 | 3.2 | 31,252 | 3.4 | ||||||||||||
| Equity/Warrants | 49,213 | 4.9 | 23,834 | 2.6 | ||||||||||||
| Total | $ | 1,012,891 | 100.0 | % | $ | 914,184 | 100.0 | % | ||||||||
The following table summarizes the amortized cost and the fair value of investments as of September 30, 2015 (dollars in thousands):
| Amortized Cost | Percentage | Fair Value | Percentage | |||||||||||||
| Senior Secured First Lien Term Loans | $ | 740,831 | 58.2 | % | $ | 695,970 | 57.2 | % | ||||||||
| Senior Secured Second Lien Term Loans | 379,115 | 29.8 | 372,176 | 30.6 | ||||||||||||
| Senior Secured First Lien Notes | 37,697 | 3.0 | 36,380 | 3.0 | ||||||||||||
| Unsecured Debt | 50,941 | 4.0 | 45,661 | 3.7 | ||||||||||||
| MCC Senior Loan Strategy JV I LLC | 14,437 | 1.1 | 14,216 | 1.2 | ||||||||||||
| Equity/Warrants | 49,520 | 3.9 | 51,689 | 4.3 | ||||||||||||
| Total | $ | 1,272,541 | 100.0 | % | $ | 1,216,092 | 100.0 | % | ||||||||
As of September 30, 2016, our income-bearing investment portfolio, which represented nearly 89.0% of our total portfolio, had a weighted average yield based upon cost of our portfolio investments of approximately 11.8%, and 78.7% of our income-bearing investment portfolio bore interest based on floating rates, such as LIBOR, and 21.3% bore interest at fixed rates.
| 62 |
MCC Advisors regularly assesses the risk profile of each of our investments and rates each of them based on the following categories, which we refer to as MCC Advisors’ investment credit rating:
| Credit Rating |
Definition | |
| 1 | Investments that are performing above expectations. | |
| 2 | Investments that are performing within expectations, with risks that are neutral or favorable compared to risks at the time of origination. | |
| All new loans are rated ‘2’. | ||
| 3 | Investments that are performing below expectations and that require closer monitoring, but where no loss of interest, dividend or principal is expected. | |
| Companies rated ‘3’ may be out of compliance with financial covenants, however, loan payments are generally not past due. | ||
| 4 | Investments that are performing below expectations and for which risk has increased materially since origination. | |
| Some loss of interest or dividend is expected but no loss of principal. | ||
| In addition to the borrower being generally out of compliance with debt covenants, loan payments may be past due (but generally not more than 180 days past due). | ||
| 5 | Investments that are performing substantially below expectations and whose risks have increased substantially since origination. | |
| Most or all of the debt covenants are out of compliance and payments are substantially delinquent. | ||
| Some loss of principal is expected. |
The following table shows the distribution of our investments on the 1 to 5 investment performance rating scale at fair value as of September 30, 2016 and 2015 (dollars in thousands):
| As of September 30, 2016 | As of September 30, 2015 | |||||||||||||||
| Investment Performance Rating | Fair Value | Percentage | Fair Value | Percentage | ||||||||||||
| 1 | $ | 112,770 | 12.3 | % | $ | 146,699 | 12.0 | % | ||||||||
| 2 | 554,384 | 60.6 | 947,949 | 78.0 | ||||||||||||
| 3 | 170,496 | 18.7 | 121,444 | 10.0 | ||||||||||||
| 4 | 65,349 | 7.2 | - | - | ||||||||||||
| 5 | 11,185 | 1.2 | - | - | ||||||||||||
| Total | $ | 914,184 | 100.0 | % | $ | 1,216,092 | 100.0 | % | ||||||||
| 63 |
Results of Operations
Operating results for the years ended September 30, 2016, 2015 and 2014 are as follows (dollars in thousands):
| For the years ended September 30 | ||||||||||||
| 2016 | 2015 | 2014 | ||||||||||
| Total investment income | $ | 120,749 | $ | 149,196 | $ | 139,390 | ||||||
| Total expenses, net | 67,158 | 76,260 | 64,722 | |||||||||
| Net investment income | 53,591 | 72,936 | 74,668 | |||||||||
| Net realized gains/(losses) | (39,383 | ) | (60,910 | ) | 356 | |||||||
| Net unrealized gains/(losses) on investments | (42,257 | ) | (26,723 | ) | (21,274 | ) | ||||||
| Change in provision for deferred taxes on unrealized appreciation/(depreciation) on investments | 87 | (61 | ) | (1,592 | ) | |||||||
| Net increase in net assets resulting from operations | $ | (27,962 | ) | $ | (14,758 | ) | $ | 52,158 | ||||
Investment Income
For the year ended September 30, 2016, investment income totaled $120.7 million, of which $113.2 million was attributable to portfolio interest and dividend income, and $7.5 million to fee income. For the year ended September 30, 2015, investment income totaled $149.2 million, of which $138.5 million was attributable to portfolio interest and dividend income, and $10.7 million to fee income. For the year ended September 30, 2014, investment income totaled $139.4 million, of which $110.3 million was attributable to portfolio interest and $29.1 million to fee income.
Operating Expenses
Operating expenses for the years ended September 30, 2016, 2015 and 2014 are as follows (dollars in thousands):
| For the years ended September 30 | ||||||||||||
| 2016 | 2015 | 2014 | ||||||||||
| Base management fees | $ | 19,470 | $ | 22,450 | $ | 17,684 | ||||||
| Incentive fees | 11,492 | 18,234 | 18,667 | |||||||||
| Interest and financing expenses | 30,277 | 25,531 | 20,133 | |||||||||
| Administrator expenses | 3,915 | 4,107 | 3,353 | |||||||||
| General and administrative | 2,336 | 1,932 | 1,513 | |||||||||
| Professional fees | 2,277 | 2,865 | 2,251 | |||||||||
| Directors fees | 544 | 579 | 551 | |||||||||
| Insurance | 494 | 562 | 570 | |||||||||
| Expenses before management and incentive fee waivers | 70,805 | 76,260 | 64,722 | |||||||||
| Management fee waiver | (143 | ) | - | - | ||||||||
| Incentive fee waiver | (3,504 | ) | - | - | ||||||||
| Expenses, net of management and incentive fee waivers | $ | 67,158 | $ | 76,260 | $ | 64,722 | ||||||
For the year ended September 30, 2016, total operating expenses before manager expense waiver and reimbursement decreased by $5.5 million, or 7.2%, compared to the year ended September 30, 2015.
For the year ended September 30, 2015, total operating expenses before manager expense waiver and reimbursement increased by $11.5 million, or 17.8%, compared to the year ended September 30, 2014.
For the year ended September 30, 2014, total operating expenses before manager expense waiver and reimbursement increased by $22.1 million, or 51.9%, compared to the year ended September 30, 2013.
Interest and financing expenses were higher in the year ended September 30, 2016 than the year ended September 30, 2015 as a result of an increase in commitment on a four-year senior secured revolving credit facility, issuing $40.0 million in aggregate principal amount of 7.125% unsecured notes that mature on March 30, 2019 (the “2019 Notes“), an increase in commitment on a five-year senior secured term loan credit facility, issuing $63.5 million in aggregate principal amount of 6.125% unsecured notes that mature on March 30, 2023 (the “2023 Notes“), issuing $74.0 million in aggregate principal amount of 6.50% unsecured notes that mature on January 30, 2021 (the “2021 Notes”), and issuing SBA-guaranteed debentures (“SBA Debentures”).
| 64 |
Excluding interest and financing expenses, expenses decreased for the year ended September 30, 2016 compared to the year ended September 30, 2015 due to a decrease in base management fees, incentive fees, administrative service fees, professional fees, insurance fees, and director’s fees, offset by an increase in general and administrative expenses. Base management fees, which are calculated based on average gross assets, decreased due to the decline in the portfolio throughout the period. The incentive fee decreased as a result of the decrease in pre-incentive fee net investment income. In addition, both the management and incentive fees decreased due to the fee waiver agreement described in the Investment Management Agreement section. Administrative service fees decreased due to lower administrator expenses. Professional fees have decreased due to lower legal, audit, and valuation service expenses.
Net Realized Gains/Losses from Investments
We measure realized gains or losses by the difference between the net proceeds from the disposition and the amortized cost basis of an investment, without regard to unrealized gains or losses previously recognized.
During the years ended September 30, 2016, 2015 and 2014 we recognized $39.4 million of realized loss, $60.9 million of realized loss, and $0.4 million of realized gains on our portfolio investments, respectively.
During the year ended September 30, 2016, $15.7 million of our realized loss related to certain non-cash restructuring transactions, which is recorded on the Consolidated Statements of Operations as a component of net realized gain/(loss) from investments. There were no realized gains or losses related to such non-cash restructuring transactions for the years ended September 30, 2015 and 2014.
Net Unrealized Appreciation/Depreciation on Investments
Net change in unrealized appreciation or depreciation on investments reflects the net change in the fair value of our investment portfolio. For the years ended September 30, 2016, 2015 and 2014, we had $42.3 million, $26.7 million, and $21.3 million of unrealized depreciation, respectively, on portfolio investments.
Provision for Deferred Taxes on Unrealized Appreciation on Investments
Certain consolidated subsidiaries of ours are subject to U.S. federal and state income taxes. These taxable subsidiaries are not consolidated with the Company for income tax purposes, but are consolidated for GAAP purposes, and may generate income tax liabilities or assets from temporary differences in the recognition of items for financial reporting and income tax purposes at the subsidiaries. For the year ended September 30, 2016, the change in provision for deferred taxes on the unrealized depreciation on investments was $0.1 million. For the years ended September 30, 2015, and 2014, the change in provision for deferred taxes on the unrealized appreciation on investments were $0.1 million, and $1.6 million respectively.
Changes in Net Assets from Operations
For the year ended September 30, 2016, we recorded a net decrease in net assets resulting from operations of $28.0 million compared to a net decrease in net assets resulting from operations of $14.8 million for the year ended September 30, 2015 and a net increase in net assets resulting from operations of $52.2 million for the year ended September 30, 2014 as a result of the factors discussed above. Based on 55,399,646, 57,624,779, and 47,366,892 weighted average common shares outstanding for the years ended September 30, 2016, 2015 and 2014, respectively, our per share net decrease in net assets resulting from operations was $0.50 for the year ended September 30, 2016 compared to a per share net decrease in net assets from operations of $0.26 for the year ended September 30, 2015 and a per share net increase in net assets from operations of $1.10 for the year ended September 30, 2014.
Financial Condition, Liquidity and Capital Resources
As a RIC, we distribute substantially all of our net income to our stockholders and have an ongoing need to raise additional capital for investment purposes. To fund growth, we have a number of alternatives available to increase capital; including raising equity, increasing debt, and funding from operational cash flow.
Our liquidity and capital resources have been generated primarily from the net proceeds of public offerings of common stock, advances from the Revolving Facility and the Term Loan Facility and net proceeds from the issuance of notes as well as cash flows from operations.
On January 20, 2011, we completed our IPO and issued 11,111,112 common shares and received net proceeds of $129.6 million.
On March 21, 2012, we issued $40.0 million in aggregate principal amount of the 2019 Notes. The 2019 Notes may be redeemed in whole or in part at any time or from time to time at our option on or after March 30, 2015. The 2019 Notes bear interest at a rate of 7.125% per year, payable quarterly on March 30, June 30, September 30 and December 30 of each year, beginning June 30, 2012. The 2019 Notes are listed on the New York Stock Exchange and trade thereon under the trading symbol “MCQ”. As of September 30, 2016, $40.0 million in aggregate principal amount of the 2019 Notes were outstanding.
| 65 |
On August 24, 2012, we completed a public offering of 5,750,000 shares, including the underwriters’ full exercise of the option to purchase additional shares, of our common stock at a public offering price of $12.95 per share, raising approximately $71.9 million in net proceeds.
On December 3, 2012, we completed a public offering of 5,000,000 shares of our common stock at a public offering price of $13.75 per share, raising approximately $66.0 million in net proceeds. On December 19, 2012, we sold an additional 495,263 shares of our common stock at a public offering price of $13.75 per share, raising approximately $6.5 million in net proceeds, pursuant to the underwriters’ partial exercise of the option to purchase additional shares.
On March 18, 2013, the Company issued $60.0 million in aggregate principal amount of the 2023 Notes. The 2023 Notes may be redeemed in whole or in part at any time or from time to time at the Company's option on or after March 30, 2016. The 2023 Notes bear interest at a rate of 6.125% per year, payable quarterly on March 30, June 30, September 30 and December 30 of each year, beginning June 30, 2013. The 2023 Notes are listed on the New York Stock Exchange and trade thereon under the trading symbol “MCV”.
On March 26, 2013, the Company closed an additional $3.5 million in aggregate principal amount of the 2023 Notes, pursuant to the partial exercise of the underwriters’ option to purchase additional notes.
On April 12, 2013, we completed a public offering of 4,000,000 shares of our common stock and an additional 492,271 shares of our common stock pursuant to the underwriters’ partial exercise of the over-allotment option at a public offering price of $14.70 per share, raising approximately $63.4 million in net proceeds.
On September 9, 2013, we completed a public offering of 6,900,000 shares of our common stock, which included the full exercise of the underwriters’ option to purchase an additional 900,000 shares, at a public offering price of $13.00 per share, raising approximately $86.6 million in net proceeds.
On February 5, 2014 we completed a public offering of 6,000,000 shares of our common stock at a public offering price of $14.00 per share, raising approximately $81.1 million in net proceeds.
On April 28, 2014 we completed a public offering of 6,000,000 shares of our common stock at a public offering price of $13.25 per share, raising approximately $76.9 million in net proceeds.
On August 1, 2014, the Company entered into an “At-The-Market” (“ATM”) equity distribution agreement with Goldman, Sachs & Co., Barclays Capital Inc., Credit Suisse Securities (USA) LLC, J.P. Morgan Securities LLC, Keefe, Bruyette & Woods, Inc., BB&T Capital Markets, a division of BB&T Securities, LLC, Janney Montgomery Scott LLC, Ladenburg Thalmann & Co. Inc., MLV & Co. LLC, Maxim Group LLC, National Securities Corporation and Gilford Securities Incorporated, through which the Company could sell shares of its common stock having an aggregate offering price of up to $100.0 million. During the period from August 5, 2014 to September 30, 2014, the Company sold 671,278 shares of its common stock at an average price of $12.87 per share, and raised $8.7 million in net proceeds, under the ATM Program.
On August 26, 2014, the Company completed a public offering of 5,000,000 shares of our common stock and an additional 750,000 shares of our common stock pursuant to the underwriters’ partial exercise of the over-allotment option at a public offering price of $13.02 per share, raising approximately $72.8 million in net proceeds.
On July 28, 2015, we entered into Amendment No. 7 to our existing Revolver Amendment and Amendment No. 7 to our existing Term Loan Amendment, each with certain lenders party thereto and ING Capital LLC, as administrative agent. The Amendments amend certain provisions of the Facilities.
The pricing in the case of the Term Loan Facility was reduced for LIBOR loans from LIBOR (with no minimum) plus 3.25% to LIBOR plus 3.00%. The pricing on the Revolving Credit Facility will remain the same at LIBOR (with no minimum) plus 2.75%. Both the Term Loan Facility and Revolving Credit Facility will decrease by an additional 25 basis points upon receiving an investment grade rating from Standard & Poor’s.
Additionally, the Term Loan Facility’s bullet maturity was extended from June 2019 to July 2020 and the Revolving Credit Facility’s revolving period was extended from June 2017 to July 2019, followed by a one-year amortization period and a final maturity in July 2020.
On December 17, 2015, the Company issued $70.8 million in aggregate principal amount of 6.50% unsecured notes that mature on January 30, 2021 (the ‘‘2021 Notes’’ and together with the 2019 Notes and 2023 Notes, the “Notes”). The 2021 Notes may be redeemed in whole or in part at any time or from time to time at the Company’s option on or after January 30, 2019. The 2021 Notes bear interest at a rate of 6.50% per year, payable quarterly on January 30, April 30, July 30 and October 30 of each year, beginning January 30, 2016. The 2021 Notes are listed on the New York Stock Exchange and trade thereon under the trading symbol ‘‘MCX’’.
| 66 |
On January 14, 2016, the Company closed an additional $3.25 million in aggregate principal amount of the 2021 Notes, pursuant to the partial exercise of the underwriters’ option to purchase additional notes.
As of September 30, 2016, total commitments under the Facilities are $517.5 million, comprised of $343.5 million committed to the Revolving Credit Facility and $174.0 million funded under the Term Loan Facility.
As of September 30, 2016, we had $104.5 million in cash. In the future, we may generate cash from future offerings of securities, future borrowings and cash flows from operations, including interest earned from the temporary investment of cash in U.S. government securities and other high-quality debt investments that mature in one year or less. Our primary use of funds is investments in our targeted asset classes, cash distributions to our stockholders, and other general corporate purposes.
In order to satisfy the Code requirements applicable to a RIC, we intend to distribute to our stockholders substantially all of our taxable income, but we may also elect to periodically spill over certain excess undistributed taxable income from one tax year into the next tax year. In addition, as a BDC, for each taxable year we generally are required to meet a coverage ratio of total assets to total senior securities, which include borrowings and any preferred stock we may issue in the future, of at least 200%. This requirement limits the amount that we may borrow.
On March 26, 2013, our wholly-owned subsidiary, Medley SBIC LP (“SBIC LP”) received a Small Business Investment Company (“SBIC”) license from the Small Business Administration (“SBA”).
The SBIC license allows the SBIC LP to obtain leverage by issuing SBA Debentures, subject to the issuance of a capital commitment by the SBA and other customary procedures. SBA Debentures are non-recourse, interest only debentures with interest payable semi-annually and have a ten year maturity. The principal amount of SBA Debentures is not required to be paid prior to maturity but may be prepaid at any time without penalty. The interest rate of SBA Debentures is fixed on a semi-annual basis at a market-driven spread over U.S. Treasury Notes with 10-year maturities. The SBA, as a creditor, will have a superior claim to the SBIC LP’s assets over our stockholders in the event we liquidate the SBIC LP or the SBA exercises its remedies under the SBA Debentures issued by the SBIC LP upon an event of default.
SBA regulations currently limit the amount that the SBIC LP may borrow to a maximum of $150.0 million when it has at least $75.0 million in regulatory capital, receives a capital commitment from the SBA and has been through an examination by the SBA subsequent to licensing.
On November 16, 2012, we obtained exemptive relief from the SEC to permit us to exclude the debt of the SBIC LP guaranteed by the SBA from our 200% asset coverage test under the 1940 Act. The exemptive relief provides us with increased flexibility under the 200% asset coverage test by permitting it to borrow up to $150.0 million more than it would otherwise be able to absent the receipt of this exemptive relief.
As of September 30, 2016, SBIC LP had $75.0 million in regulatory capital and had $150.0 million SBA Debentures outstanding.
Contractual Obligations and Off-Balance Sheet Arrangements
As of September 30, 2016 and 2015, we had commitments under loan and financing agreements to fund up to $9.2 million to 8 portfolio companies and $28.1 million to 12 portfolio companies, respectively. These commitments are primarily composed of senior secured term loans and a revolver and an analysis of their value is included in the Consolidated Schedule of Investments. The commitments are generally subject to the borrowers meeting certain criteria such as compliance with covenants and certain operational metrics. The terms of the borrowings and financings subject to commitment are comparable to the terms of other loan and equity securities in our portfolio. A summary of the composition of the unfunded commitments as of September 30, 2016 and 2015 is shown in the table below (dollars in thousands):
| As of | ||||||||
| September 30, 2016 | September 30, 2015 | |||||||
| Tenere Acquisition Corp. | $ | 2,000 | $ | 2,000 | ||||
| DHISCO Electronic Distribution, Inc. - Revolver | 1,905 | 3,048 | ||||||
| AAR Intermediate Holdings, LLC - Revolver | 1,797 | - | ||||||
| Black Angus Steakhouses, LLC - Delayed Draw Term Loan | 893 | 893 | ||||||
| Brantley Transportation LLC - Delayed Draw Term Loan | 863 | - | ||||||
| CP OPCO LLC - Revolver | 609 | - | ||||||
| Lydell Jewelry Design Studio, LLC - Delayed Draw Term Loan | 500 | - | ||||||
| Black Angus Steakhouses, LLC - Revolver | 446 | 446 | ||||||
| Access Media Holdings, LLC - Series AA Preferred Equity | 184 | - | ||||||
| Be Green Packaging, LLC - Revolver | - | 479 | ||||||
| Red Skye Wireless LLC | - | 7,500 | ||||||
| RCS Management Corporation & Specialized Medical Services, Inc. | - | 5,000 | ||||||
| Autosplice, Inc. | - | 3,026 | ||||||
| Freedom Powersports LLC - Delayed Draw Term Loan | - | 1,800 | ||||||
| Point.360 | - | 1,600 | ||||||
| Be Green Packaging, LLC - Delayed Draw Term Loan | - | 750 | ||||||
| Ship Supply Acquisition Corporation | - | 622 | ||||||
| Meridian Behavioral Health, LLC - Term Loan B | - | 500 | ||||||
| Access Media Holdings, LLC - Series A Preferred Equity | - | 424 | ||||||
| Total | $ | 9,197 | $ | 28,088 | ||||
| 67 |
We have certain contracts under which we have material future commitments. We have entered into an investment management agreement with MCC Advisors in accordance with the 1940 Act. The investment management agreement became effective upon the pricing of our initial public offering. Under the investment management agreement, MCC Advisors has agreed to provide us with investment advisory and management services. For these services, we have agreed to pay a base management fee equal to a percentage of our gross assets and an incentive fee based on our performance.
We have also entered into an administration agreement with MCC Advisors as our administrator. The administration agreement became effective upon the pricing of our initial public offering. Under the administration agreement, MCC Advisors has agreed to furnish us with office facilities and equipment, provide us clerical, bookkeeping and record keeping services at such facilities and provide us with other administrative services necessary to conduct our day-to-day operations. MCC Advisors will also provide on our behalf significant managerial assistance to those portfolio companies to which we are required to provide such assistance.
The following table shows our payment obligations for repayment of debt and other contractual obligations at September 30, 2016 (dollars in thousands):
| Payment Due by Period | ||||||||||||||||||||
| Total | Less than 1 year | 1 - 3 years | 3 - 5 years | More than 5 years | ||||||||||||||||
| Revolving Facility | $ | 14,000 | $ | - | $ | - | $ | 14,000 | $ | - | ||||||||||
| Term Loan Facility | 174,000 | - | - | 174,000 | - | |||||||||||||||
| 7.125% Notes | 40,000 | - | 40,000 | - | - | |||||||||||||||
| 6.50% Notes | 74,013 | - | - | 74,013 | - | |||||||||||||||
| 6.125% Notes | 63,500 | - | - | - | 63,500 | |||||||||||||||
| SBA Debenture | 150,000 | - | - | - | 150,000 | |||||||||||||||
| Total contractual obligations | $ | 515,513 | $ | - | $ | 40,000 | $ | 262,013 | $ | 213,500 | ||||||||||
If any of the contractual obligations discussed above are terminated, our costs under any new agreements that we enter into may increase. In addition, we would likely incur significant time and expense in locating alternative parties to provide the services we expect to receive under our investment management agreement and our administration agreement. Any new investment management agreement would also be subject to approval by our stockholders.
On March 27, 2015, Medley Capital Corporation and Great American Life Insurance Company (“GALIC”) entered into a limited liability company operating agreement to co-manage MCC Senior Loan Strategy JV I LLC (“MCC JV”). Medley Capital Corporation and GALIC have committed to provide $100 million of equity to MCC JV, with Medley Capital Corporation providing $87.5 million and GALIC providing $12.5 million. MCC JV commenced operations on July 15, 2015. On August 4, 2015, MCC JV entered into a senior secured revolving credit facility (the “JV Facility”) led by Credit Suisse, AG with initial commitments of $100 million. As of September 30, 2016, MCC JV has drawn approximately $68.1 million on the JV Facility. As of September 30, 2016, MCC JV had total investments at fair value of $93.4 million. As of September 30, 2016, MCC JV’s portfolio was comprised of senior secured first lien term loans to 30 different borrowers. As of September 30, 2016, certain investments in one portfolio company were on non-accrual status.
Medley Capital Corporation has determined that MCC JV is an investment company under ASC 946, however in accordance with such guidance, Medley Capital Corporation will generally not consolidate its investment in a company other than a wholly owned investment company subsidiary or a controlled operating company whose business consists of providing services to the Company. Accordingly, Medley Capital Corporation does not consolidate its interest in MCC JV.
| 68 |
Distributions
We have elected and qualified to be treated for U.S. federal income tax purposes as a RIC under subchapter M of the Code. As a RIC, in any taxable year with respect to which we timely distribute at least 90 percent of the sum of our (i) investment company taxable income (which is generally our net ordinary income plus the excess of realized net short-term capital gains over realized net long-term capital losses) determined without regard to the deduction for dividends paid and (ii) net tax exempt interest income (which is the excess of our gross tax exempt interest income over certain disallowed deductions), we (but not our stockholders) generally will not be subject to U.S. federal income tax on investment company taxable income and net capital gains that we distribute to our stockholders. We intend to distribute annually all or substantially all of such income, but we may also elect to periodically spill over certain excess undistributed taxable income from one tax year to the next tax year. To the extent that we retain our net capital gains or any investment company taxable income, we will be subject to U.S. federal income tax. We may choose to retain our net capital gains or any investment company taxable income, and pay the associated federal corporate income tax, including the federal excise tax described below.
Amounts not distributed on a timely basis in accordance with a calendar year distribution requirement are subject to a nondeductible 4% U.S. federal excise tax payable by us. To avoid this tax, we must distribute (or be deemed to have distributed) during each calendar year an amount equal to the sum of:
| (1) | at least 98.0 percent of our ordinary income (not taking into account any capital gains or losses) for the calendar year; |
| (2) | at least 98.2 percent of the amount by which our capital gains exceed our capital losses (adjusted for certain ordinary losses) for a one-year period ending on October 31st of the calendar year; and |
| (3) | income realized, but not distributed, in preceding years and on which we did not pay federal income tax. |
While we intend to distribute any income and capital gains in the manner necessary to minimize imposition of the 4% U.S. federal excise tax, sufficient amounts of our taxable income and capital gains may not be distributed to avoid entirely the imposition of the tax. In that event, we will be liable for the tax only on the amount by which we do not meet the foregoing distribution requirement.
We intend to pay quarterly dividends to our stockholders out of assets legally available for distribution. We cannot assure you that we will achieve investment results that will allow us to pay a specified level of dividends or year-to-year increases in dividends. In addition, the inability to satisfy the asset coverage test applicable to us as a BDC could limit our ability to pay dividends. All dividends will be paid at the discretion of our board of directors and will depend on our earnings, our financial condition, maintenance of our RIC status, compliance with applicable BDC regulations and such other factors as our board of directors may deem relevant from time to time. We cannot assure you that we will pay dividends to our stockholders in the future.
To the extent our taxable earnings fall below the total amount of our distributions for a taxable year, a portion of those distributions may be deemed a return of capital to our stockholders for U.S. federal income tax purposes. Stockholders should read any written disclosure accompanying a distribution carefully and should not assume that the source of any distribution is our ordinary income or gains.
We have adopted an “opt out” dividend reinvestment plan for our common stockholders. As a result, if we declare a cash dividend or other distribution, each stockholder that has not “opted out” of our dividend reinvestment plan will have their dividends automatically reinvested in additional shares of our common stock rather than receiving cash dividends. Stockholders who receive distributions in the form of shares of common stock will be subject to the same federal, state and local tax consequences as if they received cash distributions.
The following table summarizes the dividend distributions during the year ended September 30, 2016:
| Date Declared | Record Date | Payment Date | Amount Per Share | |||||
| 11/5/2015 | 11/25/2015 | 12/18/2015 | 0.30 | |||||
| 2/1/2016 | 2/24/2016 | 3/18/2016 | 0.30 | |||||
| 5/5/2016 | 5/25/2016 | 6/24/2016 | 0.30 | |||||
| 8/7/2016 | 8/24/2016 | 9/23/2016 | 0.22 | |||||
| 69 |
Stock Repurchase Program
The following table summarizes our share repurchases under our stock repurchase program for the years ended September 30, 2016 and 2015 (dollars in thousands):
| For the year ended September 30 | ||||||||||||
| 2016 | 2015 | 2014 | ||||||||||
| Dollar amount repurchased | $ | 12,870 | $ | 21,205 | N/A | (1) | ||||||
| Shares Repurchased | 1,862,941 | 2,396,132 | N/A | (1) | ||||||||
| Average price per share | $ | 6.91 | $ | 8.89 | N/A | (1) | ||||||
| Weighted average discount to Net Asset Value | 31.0 | % | 23.5 | % | N/A | (1) | ||||||
| (1) | The Company did not repurchase any shares for the year ended September 30, 2014. |
On February 5, 2015, our board of directors approved a share repurchase program pursuant to which we could purchase up to an aggregate amount of $30.0 million of our common stock between the period of the approval date and February 5, 2016. On December 4, 2015, the board of directors extended the duration of the share repurchase program through December 31, 2016, and increased the aggregate amount to $50.0 million. Any stock repurchases will be made through the open market at times, and in such amounts, as management deems appropriate. As of September 30, 2016, the Company has repurchased an aggregate of 4,259,073 shares of common stock at an average price of $8.16 per share with a total cost of approximately $34.1 million. The maximum dollar value of shares that may yet be purchased under the plan is $15.9 million. This program may be limited or terminated at any time without prior notice. Since the inception of the program, the Company's net asset value per share was increased by approximately $0.23 as a result of the share repurchases.
Related Party Transactions
Concurrent with the pricing of our initial public offering, we entered into a number of business relationships with affiliated or related parties, including the following:
| · | We entered into an investment management agreement with MCC Advisors. Mr. Brook Taube, our chairman and chief executive officer, is a managing partner and senior portfolio manager of MCC Advisors, and Mr. Seth Taube, one of our directors, is a managing partner of MCC Advisors. |
| · | MCC Advisors provides us with the office facilities and administrative services necessary to conduct day-to-day operations pursuant to our administration agreement. We reimburse MCC Advisors for the allocable portion (subject to the review and approval of our board of directors) of overhead and other expenses incurred by it in performing its obligations under the administration agreement, including rent, the fees and expenses associated with performing compliance functions, and our allocable portion of the cost of our chief financial officer and chief compliance officer and their respective staffs. |
| · | We have entered into a license agreement with Medley Capital LLC, pursuant to which Medley Capital LLC has granted us a non-exclusive, royalty-free license to use the name “Medley.” |
| · | Certain affiliates of MCC Advisors, Medley Capital LLC, their respective affiliates and some of their employees purchased in the initial public offering an aggregate of 833,333 shares of common stock at the initial public offering price per share of $12.00. We received the full proceeds from the sale of these shares, and no underwriting discounts or commissions were paid in respect of these shares. |
MCC Advisors and its affiliates may in the future manage other accounts that have investment mandates that are similar, in whole and in part, with ours. MCC Advisors and its affiliates may determine that an investment is appropriate for us and for one or more of those other accounts. In such event, depending on the availability of such investment and other appropriate factors, and pursuant to MCC Advisors’ allocation policy, MCC Advisors or its affiliates may determine that we should invest side-by-side with one or more other accounts. We will not make any investments if they are not permitted by applicable law and interpretive positions of the SEC and its staff, or if they are inconsistent with MCC Advisors’ allocation procedures.
In addition, we have adopted a formal code of ethics that governs the conduct of our and MCC Advisors’ officers, directors and employees. Our officers and directors also remain subject to the duties imposed by both the 1940 Act and the Delaware General Corporation Law.
| 70 |
Investment Management Agreement
Under the terms of our investment management agreement, MCC Advisors:
| · | determines the composition of our portfolio, the nature and timing of the changes to our portfolio and the manner of implementing such changes; | |
| · | identifies, evaluates and negotiates the structure of the investments we make (including performing due diligence on our prospective portfolio companies); and |
| · | executes, closes, monitors and administers the investments we make, including the exercise of any voting or consent rights. |
MCC Advisors’ services under the investment management agreement are not exclusive, and it is free to furnish similar services to other entities so long as its services to us are not impaired.
Pursuant to our investment management agreement, we pay MCC Advisors a fee for investment advisory and management services consisting of a base management fee and a two-part incentive fee.
On December 3, 2015, MCC Advisors recommended and, in consultation with the Board, agreed to reduce fees under the investment management agreement. Beginning January 1, 2016, the base management fee was reduced to 1.50% on gross assets above $1 billion. In addition, MCC Advisors reduced its incentive fee from 20% on pre-incentive fee net investment income over an 8% hurdle, to 17.5% on pre-incentive fee net investment income over a 6% hurdle. Moreover, the revised incentive fee includes a netting mechanism and is subject to a rolling three-year look back from January 1, 2016 forward. Under no circumstances will the new fee structure result in higher fees to MCC Advisors than fees under the prior investment management agreement.
The following discussion of our base management fee and two-part incentive fee reflects the terms of the fee waiver agreement executed by MCC Advisors on February 8, 2016 (the “Fee Waiver Agreement”). The terms of the Fee Waiver Agreement are effective as of January 1, 2016, and are a permanent reduction in the base management fee and incentive fee on net investment income payable to MCC Advisors for the investment advisory and management services it provides under the investment management agreement. The Fee Waiver Agreement does not change the second component of the incentive fee, which is the incentive fee on capital gains.
Base Management Fee
For providing investment advisory and management services to us, MCC Advisors receives a base management fee. The base management fee is calculated at an annual rate of 1.75% (0.4375% per quarter) of up to $1.0 billion of the Company’s gross assets and 1.50% (0.375% per quarter) of any amounts over $1.0 billion of the Company’s gross assets, and is payable quarterly in arrears. The base management fee will be calculated based on the average value of the Company’s gross assets at the end of the two most recently completed calendar quarters and will be appropriately pro-rated for any partial quarter.
Incentive Fee
The incentive fee has two components, as follows:
Incentive Fee Based on Income
The first component of the incentive fee is payable quarterly in arrears and is based on our pre-incentive fee net investment income earned during the calendar quarter for which the incentive fee is being calculated. MCC Advisors is entitled to receive the incentive fee on net investment income from us if our Ordinary Income (as defined below) exceeds a quarterly “hurdle rate” of 1.5%. The hurdle amount is calculated after making appropriate adjustments to the Company’s net assets, as determined as of the beginning of each applicable calendar quarter, in order to account for any capital raising or other capital actions as a result of any issuances by the Company of its common stock (including issuances pursuant to our dividend reinvestment plan), any repurchase by the Company of its own common stock, and any dividends paid by the Company, each as may have occurred during the relevant quarter.
Beginning with the calendar quarter that commenced on January 1, 2016, the incentive fee on net investment income will be determined and paid quarterly in arrears at the end of each calendar quarter by reference to our aggregate net investment income, as adjusted as described below, from the calendar quarter then ending and the eleven preceding calendar quarters (or if shorter, the number of quarters that have occurred since January 1, 2016). We refer to such period as the “Trailing Twelve Quarters.”
The hurdle amount for the incentive fee on net investment income is determined on a quarterly basis, and is equal to 1.5% multiplied by the Company’s net asset value at the beginning of each applicable calendar quarter comprising the relevant Trailing Twelve Quarters. The hurdle amount is calculated after making appropriate adjustments to the Company’s net assets, as determined as of the beginning of each applicable calendar quarter, in order to account for any capital raising or other capital actions as a result of any issuances by the Company of its common stock (including issuances pursuant to our dividend reinvestment plan), any repurchase by the Company of its own common stock, and any dividends paid by the Company, each as may have occurred during the relevant quarter. The incentive fee for any partial period will be appropriately prorated. Any incentive fee on net investment income will be paid to MCC Advisors on a quarterly basis, and will be based on the amount by which (A) aggregate net investment income (“Ordinary Income”) in respect of the relevant Trailing Twelve Quarters exceeds (B) the hurdle amount for such Trailing Twelve Quarters. The amount of the excess of (A) over (B) described in this paragraph for such Trailing Twelve Quarters is referred to as the “Excess Income Amount.” For the avoidance of doubt, Ordinary Income is net of all fees and expenses, including the reduced base management fee but excluding any incentive fee on Pre-Incentive Fee net investment income or on the Company’s capital gains.
| 71 |
Quarterly Incentive Fee Based on Income
The incentive fee on net investment income for each quarter is determined as follows:
| · | No incentive fee on net investment income is payable to MCC Advisors for any calendar quarter for which there is no Excess Income Amount. | |
| · | 100% of the Ordinary Income, if any, that exceeds the hurdle amount, but is less than or equal to an amount, which we refer to as the “Catch-up Amount,” determined as the sum of 1.8182% multiplied by the Company’s net assets at the beginning of each applicable calendar quarter, as adjusted as noted above, comprising the relevant Trailing Twelve Quarters is included in the calculation of the incentive fee on net investment income; and | |
| · | 17.5% of the Ordinary Income that exceeds the Catch-up Amount is included in the calculation of the incentive fee on net investment income. |
The amount of the incentive fee on net investment income that will be paid to MCC Advisors for a particular quarter will equal the excess of the incentive fee so calculated minus the aggregate incentive fees on net investment income that were paid in respect of the first eleven calendar quarters (or the portion thereof) included in the relevant Trailing Twelve Quarters but not in excess of the Incentive Fee Cap (as described below).
The incentive fee on net investment income that is paid to MCC Advisors for a particular quarter is subject to a cap (the “Incentive Fee Cap”). The Incentive Fee Cap for any quarter is an amount equal to (a) 17.5% of the Cumulative Net Return (as defined below) during the relevant Trailing Twelve Quarters minus (b) the aggregate incentive fees on net investment income that were paid in respect of the first eleven calendar quarters (or the portion thereof) included in the relevant Trailing Twelve Quarters.
“Cumulative Net Return” means (x) the Ordinary Income in respect of the relevant Trailing Twelve Quarters minus (y) any Net Capital Loss (as described below), if any, in respect of the relevant Trailing Twelve Quarters. If, in any quarter, the Incentive Fee Cap is zero or a negative value, the Company will pay no incentive fee on net investment income to MCC Advisors for such quarter. If, in any quarter, the Incentive Fee Cap for such quarter is a positive value but is less than the incentive fee on net investment income that is payable to MCC Advisors for such quarter (before giving effect to the Incentive Fee Cap) calculated as described above, the Company will pay an incentive fee on net investment income to MCC Advisors equal to the Incentive Fee Cap for such quarter. If, in any quarter, the Incentive Fee Cap for such quarter is equal to or greater than the incentive fee on net investment income that is payable to MCC Advisors for such quarter (before giving effect to the Incentive Fee Cap) calculated as described above, the Company will pay an incentive fee on net investment income to MCC Advisors, calculated as described above, for such quarter without regard to the Incentive Fee Cap.
“Net Capital Loss” in respect of a particular period means the difference, if positive, between (i) aggregate capital losses, whether realized or unrealized, and dilution to the Company’s net assets due to capital raising or capital actions, in such period and (ii) aggregate capital gains, whether realized or unrealized and accretion to the Company’s net assets due to capital raising or capital action, in such period.
Dilution to the Company’s net assets due to capital raising is calculated, in the case of issuances of common stock, as the amount by which the net asset value per share was adjusted over the transaction price per share, multiplied by the number of shares issued. Accretion to the Company’s net assets due to capital raising is calculated, in the case of issuances of common stock (including issuances pursuant to our dividend reinvestment plan), as the excess of the transaction price per share over the amount by which the net asset value per share was adjusted, multiplied by the number of shares issued. Accretion to the Company’s net assets due to other capital action is calculated, in the case of repurchases by the Company of its own common stock, as the excess of the amount by which the net asset value per share was adjusted over the transaction price per share multiplied by the number of shares repurchased by the Company.
For the avoidance of doubt, the purpose of the new incentive fee calculation under the Fee Waiver Agreement is to permanently reduce aggregate fees payable to MCC Advisors by the Company, effective as of January 1, 2016. In order to ensure that the Company will pay MCC Advisors lesser aggregate fees on a cumulative basis, as calculated beginning January 1, 2016, we will, at the end of each quarter, also calculate the base management fee and incentive fee on net investment income owed by the Company to MCC Advisors based on the formula in place prior to January 1, 2016. If, at any time beginning January 1, 2016, the aggregate fees on a cumulative basis, as calculated based on the formula in place after January 1, 2016, would be greater than the aggregate fees on a cumulative basis, as calculated based on the formula in place prior to January 1, 2016, MCC Advisors shall only be entitled to the lesser of those two amounts.
| 72 |
The second component of the incentive fee is determined and payable in arrears as of the end of each calendar year (or upon termination of the investment management agreement as of the termination date) and equals 20.0% of our cumulative aggregate realized capital gains less cumulative realized capital losses, unrealized capital depreciation (unrealized depreciation on a gross investment-by-investment basis at the end of each calendar year) and all capital gains upon which prior performance-based capital gains incentive fee payments were previously made to the investment adviser.
Under GAAP, the Company calculates the second component of the incentive fee as if the Company had realized all assets at their fair values as of the reporting date. Accordingly, the Company accrues a provisional capital gains incentive fee taking into account any unrealized gains or losses. As the provisional capital gains incentive fee is subject to the performance of investments until there is a realization event, the amount of the provisional capital gains incentive fee accrued at a reporting date may vary from the capital gains incentive that is ultimately realized and the differences could be material.
Critical Accounting Policies
The preparation of financial statements and related disclosures in conformity with U.S. generally accepted accounting principles requires management to make estimates and assumptions that affect the reported amounts of assets and liabilities, disclosure of contingent assets and liabilities at the date of the financial statements, and revenues and expenses during the periods reported. Actual results could materially differ from those estimates. We have identified the following items as critical accounting policies.
Valuation of Portfolio Investments
We value investments for which market quotations are readily available at their market quotations, which are generally obtained from an independent pricing service or multiple broker-dealers or market makers. We weight the use of third-party broker quotes, if any, in determining fair value based on our understanding of the level of actual transactions used by the broker to develop the quote and whether the quote was an indicative price or binding offer. However, a readily available market value is not expected to exist for many of the investments in our portfolio, and we value these portfolio investments at fair value as determined in good faith by our board of directors under our valuation policy and process. We may seek pricing information with respect to certain of our investments from pricing services or brokers or dealers in order to value such investments. We also employ independent third party valuation firms for all of our investments for which there is not a readily available market value.
Valuation methods may include comparisons of financial ratios of the portfolio companies that issued such private equity securities to peer companies that are public, the nature and realizable value of any collateral, the portfolio company’s ability to make payments and its earnings and discounted cash flows, the markets in which the portfolio company does business, and other relevant factors. When an external event such as a purchase transaction, public offering or subsequent equity sale occurs, we will consider the pricing indicated by the external event to corroborate the private equity valuation. Due to the inherent uncertainty of determining the fair value of investments that do not have a readily available market value, the fair value of the investments may differ significantly from the values that would have been used had a readily available market value existed for such investments, and the differences could be material.
Our board of directors is ultimately and solely responsible for determining the fair value of the investments in our portfolio that are not publicly traded, whose market prices are not readily available on a quarterly basis or any other situation where portfolio investments require a fair value determination.
With respect to investments for which market quotations are not readily available, our board of directors will undertake a multi-step valuation process each quarter, as described below:
| · | Our quarterly valuation process begins with each investment being initially valued by the investment professionals responsible for monitoring the portfolio investment. |
| · | Preliminary valuation conclusions are then documented and discussed with senior management. |
| · | At least twice annually, the valuation for each portfolio investment is reviewed by an independent valuation firm. |
| · | The audit committee of our board of directors reviews the preliminary valuations of the investment professionals, senior management and independent valuation firms. |
| · | Our board of directors discusses the valuations and determines the fair value of each investment in our portfolio in good faith based on the input of MCC Advisors, the respective independent valuation firms and the audit committee. |
In following these approaches, the types of factors that are taken into account in fair value pricing investments include available current market data, including relevant and applicable market trading and transaction comparables; applicable market yields and multiples; security covenants; call protection provisions; information rights; the nature and realizable value of any collateral; the portfolio company’s ability to make payments; the portfolio company’s earnings and discounted cash flows; the markets in which the portfolio company does business; comparisons of financial ratios of peer companies that are public; comparable merger and acquisition transactions; and the principal market and enterprise values.
| 73 |
Determination of fair values involves subjective judgments and estimates not verifiable by auditing procedures. Under current auditing standards, the notes to our financial statements refer to the uncertainty with respect to the possible effect of such valuations, and any change in such valuations, on our consolidated financial statements.
Revenue Recognition
Our revenue recognition policies are as follows:
Investments and Related Investment Income We account for investment transactions on a trade-date basis and interest income, adjusted for amortization of premiums and accretion of discounts, is recorded on an accrual basis. For investments with contractual PIK interest, which represents contractual interest accrued and added to the principal balance that generally becomes due at maturity, we will not accrue PIK interest if the portfolio company valuation indicates that the PIK interest is not collectible. Origination, closing and/or commitment fees associated with investments in portfolio companies are recognized as income when the investment transaction closes. Other fees are capitalized as deferred revenue and recorded into income over the respective period. Prepayment penalties received by the Company for debt instruments paid back to the Company prior to the maturity date are recorded as income upon receipt. Realized gains or losses on investments are measured by the difference between the net proceeds from the disposition and the amortized cost basis of investment, without regard to unrealized gains or losses previously recognized. We report changes in the fair value of investments that are measured at fair value as a component of the net change in unrealized appreciation/(depreciation) on investments in our Consolidated Statement of Operations.
Non-accrual We place loans on non-accrual status when principal and interest payments are past due by 90 days or more, or when there is reasonable doubt that we will collect principal or interest. Accrued interest is generally reversed when a loan is placed on non-accrual. Interest payments received on non-accrual loans may be recognized as income or applied to principal depending upon management’s judgment. Non-accrual loans are restored to accrual status when past due principal and interest is paid and, in our management’s judgment, are likely to remain current. At September 30, 2016, certain investments in nine portfolio companies held by the Company were on non-accrual status with a combined fair value of approximately $55.9 million, or 6.1% of the fair value of our portfolio. At September 30, 2015, certain investments in three portfolio companies held by the Company were on non-accrual status with a combined fair value of approximately $25.5 million, or 2.1% of the fair value of our portfolio. At September 30, 2014, certain investments in four portfolio companies held by the Company were on non-accrual status with a combined fair value of approximately $40.3 million, or 3.2% of the fair value of our portfolio.
Federal Income Taxes
The Company has elected and qualified to be treated for U.S. federal income tax purposes as a RIC under subchapter M of the Code, commencing with its first taxable year as a corporation, and it intends to operate in a manner so as to maintain its RIC tax treatment. As a RIC, among other things, the Company is required to meet certain source of income and asset diversification requirements. Once qualified as a RIC, the Company must timely distribute to its stockholders at least 90% of the sum of investment company taxable income (“ICTI”) including PIK, as defined by the Code, and net tax exempt interest income (which is the excess of our gross tax exempt interest income over certain disallowed deductions) for each taxable year in order to be eligible for tax treatment under subchapter M of the Code. The Company will be subject to a nondeductible U.S. federal excise tax of 4% on undistributed income if it does not distribute at least 98% of its net ordinary income for any calendar year and 98.2% of its capital gain net income for each one-year period ending on October 31 of such calendar year and any income realized, but not distributed, in preceding years and on which we did not pay federal income tax. Depending on the level of ICTI earned in a tax year, the Company may choose to carry forward ICTI in excess of current year dividend distributions into the next tax year and pay a 4% excise tax on such income, as required. To the extent that the Company determines that its estimated current year annual taxable income will be in excess of estimated current year dividend distributions for excise tax purposes, the Company accrues excise tax, if any, on estimated excess taxable income as taxable income is earned. Any such carryover ICTI must be distributed before the end of that next tax year through a dividend declared prior to filing the final tax return related to the year which generated such ICTI.
Because federal income tax regulations differ from GAAP, distributions in accordance with tax regulations may differ from net investment income and realized gains recognized for financial reporting purposes. Differences may be permanent or temporary. Permanent differences are reclassified among capital accounts in the consolidated financial statements to reflect their tax character. Temporary differences arise when certain items of income, expense, gain or loss are recognized at some time in the future. Differences in classification may also result from the treatment of short-term gains as ordinary income for tax purposes.
Recent Developments
On November 3, 2016, the Company’s board of directors declared a quarterly dividend of $0.22 per share payable on December 23, 2016, to stockholders of record at the close of business on November 23, 2016.
On December 7, 2016, the Company's board of directors authorized an extension of the current $50 million share repurchase program through December 31, 2017.
| 74 |
Item 7A. Quantitative and Qualitative Disclosures About Market Risk
We are subject to financial market risks, including changes in interest rates. Changes in interest rates may affect both our cost of funding and our interest income from portfolio investments and cash and cash equivalents. Our investment income will be affected by changes in various interest rates, including LIBOR, to the extent our debt investments include floating interest rates. In the future, we expect other loans in our portfolio will have floating rates. We may hedge against interest rate fluctuations by using standard hedging instruments such as futures, options and forward contracts subject to the requirements of the 1940 Act. For the year ended September 30, 2016, we did not engage in hedging activities.
As of September 30, 2016, 78.7% of our income-bearing investment portfolio bore interest based on floating rates. The composition of our floating rate debt investments by cash interest rate floor as of September 30, 2016 was as follows (dollars in thousands):
| September 30, 2016 | ||||||||
| Fair Value | % of Floating Rate Portfolio | |||||||
| Under 1% | $ | 141,508 | 22.1 | % | ||||
| 1% to under 2% | 445,742 | 69.6 | ||||||
| 2% to under 3% | 35,632 | 5.6 | ||||||
| 3% | 17,033 | 2.7 | ||||||
| Total | $ | 639,915 | 100.0 | % | ||||
Based on our Consolidated Statement of Assets and Liabilities as of September 30, 2016, the following table (dollars in thousands) shows the approximate increase/(decrease) in components of net assets resulting from operations of hypothetical base rate changes in interest rates, assuming no changes in our investment and capital structure.
| Basis point increase(1) | Interest Income | Interest Expense | Net Increase/ (Decrease) | |||||||||
| 100 | $ | 3,900 | $ | 1,900 | $ | 2,000 | ||||||
| 200 | 9,700 | 3,800 | 5,900 | |||||||||
| 300 | 17,200 | 5,600 | 11,600 | |||||||||
| 400 | 24,600 | 7,500 | 17,100 | |||||||||
| 500 | 30,100 | 9,400 | 20,700 | |||||||||
As of September 30, 2015, 78.8% of our income-bearing investment portfolio bore interest based on floating rates. The composition of our floating rate debt investments by cash interest rate floor as of September 30, 2015 was as follows (dollars in thousands):
| September 30, 2015 | ||||||||
| Fair Value | % of Floating Rate Portfolio | |||||||
| Under 1% | $ | 144,637 | 15.9 | % | ||||
| 1% to under 2% | 669,130 | 73.7 | ||||||
| 2% to under 3% | 77,497 | 8.5 | ||||||
| 3% | 17,548 | 1.9 | ||||||
| Total | $ | 908,812 | 100.0 | % | ||||
Based on our Consolidated Statement of Assets and Liabilities as of September 30, 2015, the following table (dollars in thousands) shows the approximate increase/(decrease) in components of net assets resulting from operations of hypothetical base rate changes in interest rates, assuming no changes in our investment and capital structure.
| Basis point increase(1) | Interest Income | Interest Expense | Net Increase/ (Decrease) | |||||||||
| 100 | $ | 2,600 | $ | 5,200 | $ | (2,600 | ) | |||||
| 200 | 10,100 | 10,300 | (200 | ) | ||||||||
| 300 | 18,900 | 15,500 | 3,400 | |||||||||
| 400 | 27,800 | 20,700 | 7,100 | |||||||||
| 500 | 36,600 | 25,800 | 10,800 | |||||||||
(1) A hypothetical decline in interest rates would not have a material impact on our financial statements.
| 75 |
Item 8. Consolidated Financial Statements and Supplementary Data
INDEX TO CONSOLIDATED FINANCIAL STATEMENTS
| 76 |
Report of Independent Registered Public Accounting Firm
To Board of Directors and the Shareholders of Medley Capital Corporation
We have audited the accompanying consolidated statements of assets and liabilities of Medley Capital Corporation (the Company), including the consolidated schedules of investments, as of September 30, 2016 and 2015, and the related consolidated statements of operations, changes in net assets, and cash flows, for each of the three years in the period ended September 30, 2016. These financial statements are the responsibility of the Company’s management. Our responsibility is to express an opinion on these financial statements based on our audits.
We conducted our audits in accordance with the standards of the Public Company Accounting Oversight Board (United States). Those standards require that we plan and perform the audit to obtain reasonable assurance about whether the financial statements are free of material misstatement. An audit includes examining, on a test basis, evidence supporting the amounts and disclosures in the financial statements. An audit also includes assessing the accounting principles used and significant estimates made by management, as well as evaluating the overall financial statement presentation. Our procedures included confirmation of investments owned as of September 30, 2016 and 2015 by correspondence with the custodian, directly with designees of the portfolio companies and debt agents, as applicable. We believe that our audits provide a reasonable basis for our opinion.
In our opinion, the financial statements referred to above present fairly, in all material respects, the consolidated financial position of Medley Capital Corporation at September 30, 2016 and 2015, and the consolidated results of its operations, changes in its net assets, and its cash flows, for each of the three years in the period ended September 30, 2016 in conformity with U.S. generally accepted accounting principles.
We also have audited, in accordance with the standards of the Public Company Accounting Oversight Board (United States), Medley Capital Corporation’s internal control over financial reporting as of September 30, 2016, based on criteria established in Internal Control-Integrated Framework issued by the Committee of Sponsoring Organizations of the Treadway Commission (2013 framework) and our report dated December 8, 2016 expressed an unqualified opinion thereon.
/s/ Ernst and Young LLP
New York, New York
December 8, 2016
| F-1 |
Report of Independent Registered Public Accounting Firm
To the Shareholders and Board of Directors of Medley Capital Corporation
We have audited Medley Capital Corporation’s (the Company) internal control over financial reporting as of September 30, 2016, based on criteria established in Internal Control - Integrated Framework issued by the Committee of Sponsoring Organizations of the Treadway Commission (2013 framework) (the “COSO criteria”). Medley Capital Corporation’s management is responsible for maintaining effective internal control over financial reporting, and for its assessment of the effectiveness of internal control over financial reporting included in Item 9A of Form 10-K, Management’s Report on Internal Control over Financial Reporting. Our responsibility is to express an opinion on the company’s internal control over financial reporting based on our audit.
We conducted our audit in accordance with the standards of the Public Company Accounting Oversight Board (United States). Those standards require that we plan and perform the audit to obtain reasonable assurance about whether effective internal control over financial reporting was maintained in all material respects. Our audit included obtaining an understanding of internal control over financial reporting, assessing the risk that a material weakness exists, testing and evaluating the design and operating effectiveness of internal control based on the assessed risk, and performing such other procedures as we considered necessary in the circumstances. We believe that our audit provides a reasonable basis for our opinion.
A company’s internal control over financial reporting is a process designed to provide reasonable assurance regarding the reliability of financial reporting and the preparation of financial statements for external purposes in accordance with generally accepted accounting principles. A company’s internal control over financial reporting includes those policies and procedures that (1) pertain to the maintenance of records that, in reasonable detail, accurately and fairly reflect the transactions and dispositions of the assets of the company; (2) provide reasonable assurance that transactions are recorded as necessary to permit preparation of financial statements in accordance with generally accepted accounting principles, and that receipts and expenditures of the company are being made only in accordance with authorizations of management and directors of the company; and (3) provide reasonable assurance regarding prevention or timely detection of unauthorized acquisition, use, or disposition of the company’s assets that could have a material effect on the financial statements.
Because of its inherent limitations, internal control over financial reporting may not prevent or detect misstatements. Also, projections of any evaluation of effectiveness to future periods are subject to the risk that controls may become inadequate because of changes in conditions, or that the degree of compliance with the policies or procedures may deteriorate.
In our opinion, Medley Capital Corporation maintained, in all material respects, effective internal control over financial reporting as of September 30, 2016, based on the COSO criteria.
We also have audited, in accordance with the standards of the Public Company Accounting Oversight Board (United States), the consolidated statements of assets and liabilities, including the consolidated schedules of investments, as of September 30, 2016 and 2015, and the related consolidated statements of operations, changes in net assets, and cash flows, for each of the three years in the period ended September 30, 2016, and our report dated December 8, 2016 expressed an unqualified opinion thereon.
/s/ Ernst and Young LLP
New York, New York
December 8, 2016
| F-2 |
Consolidated Statements of Assets and Liabilities
| As of | ||||||||
| September 30, 2016 | September 30, 2015 | |||||||
| ASSETS | ||||||||
| Investments at fair value | ||||||||
| Non-controlled/non-affiliated investments (amortized cost of $813,813,853 and $1,175,785,384, respectively) | $ | 767,302,020 | $ | 1,131,893,787 | ||||
| Controlled investments (amortized cost of $189,077,188 and $86,755,896, respectively) | 136,882,275 | 74,198,202 | ||||||
| Affiliated investments (amortized cost of $10,000,000 and $10,000,000, respectively) | 10,000,000 | 10,000,000 | ||||||
| Total investments at fair value | 914,184,295 | 1,216,091,989 | ||||||
| Cash and cash equivalents | 104,485,263 | 15,714,256 | ||||||
| Interest receivable | 8,982,154 | 9,542,547 | ||||||
| Fees receivable | 1,403,383 | 1,389,634 | ||||||
| Other assets | 893,140 | 556,285 | ||||||
| Receivable for dispositions and investments sold | 689,379 | 578,868 | ||||||
| Deferred offering costs | 242,991 | 208,477 | ||||||
| Total assets | $ | 1,030,880,605 | $ | 1,244,082,056 | ||||
| LIABILITIES | ||||||||
| Revolving credit facility payable (net of debt issuance costs of $3,589,844 and $4,160,150, respectively) | $ | 10,410,156 | $ | 188,539,850 | ||||
| Term loan payable (net of debt issuance costs of $2,196,756 and $2,436,590, respectively) | 171,803,244 | 171,563,410 | ||||||
| Notes payable (net of debt issuance costs of $4,629,649 and $2,324,664, respectively) | 172,883,176 | 101,175,336 | ||||||
| SBA debentures payable (net of debt issuance costs of $3,525,029 and $4,206,226, respectively) | 146,474,971 | 145,793,774 | ||||||
| Management and incentive fees payable (See note 6) | 4,558,619 | 9,962,534 | ||||||
| Accounts payable and accrued expenses | 2,662,950 | 2,503,442 | ||||||
| Deferred tax liability | 2,003,724 | 1,797,356 | ||||||
| Interest and fees payable | 1,714,023 | 1,313,931 | ||||||
| Administrator expenses payable (See note 6) | 990,236 | 1,000,846 | ||||||
| Deferred revenue | 369,805 | 402,029 | ||||||
| Due to affiliate | 90,559 | 109,164 | ||||||
| Total liabilities | $ | 513,961,463 | $ | 624,161,672 | ||||
| Commitments (See note 8) | ||||||||
| NET ASSETS | ||||||||
| Common stock, par value $0.001 per share, 100,000,000 common shares authorized, 54,474,211 and 56,337,152 common shares issued and outstanding, respectively | $ | 54,474 | $ | 56,337 | ||||
| Capital in excess of par value | 705,326,059 | 718,240,597 | ||||||
| Accumulated undistributed net investment income | 10,811,762 | 20,351,831 | ||||||
| Accumulated net realized gain/(loss) from investments | (99,000,266 | ) | (60,625,616 | ) | ||||
| Net unrealized appreciation/(depreciation) on investments, net of deferred taxes | (100,272,887 | ) | (58,102,765 | ) | ||||
| Total net assets | 516,919,142 | 619,920,384 | ||||||
| Total liabilities and net assets | $ | 1,030,880,605 | $ | 1,244,082,056 | ||||
| NET ASSET VALUE PER SHARE | $ | 9.49 | $ | 11.00 | ||||
See accompanying notes to consolidated financial statements.
| F-3 |
Consolidated Statements of Operations
| For the years ended September 30 | ||||||||||||
| 2016 | 2015 | 2014 | ||||||||||
| INVESTMENT INCOME: | ||||||||||||
| Interest from investments | ||||||||||||
| Non-controlled/non-affiliated investments: | ||||||||||||
| Cash | $ | 98,057,236 | $ | 125,023,291 | $ | 98,195,758 | ||||||
| Payment-in-kind | 8,009,607 | 8,293,561 | 10,043,605 | |||||||||
| Affiliated investments: | ||||||||||||
| Cash | 667,000 | 1,138,652 | 1,206,713 | |||||||||
| Payment-in-kind | - | 190,446 | 469,292 | |||||||||
| Controlled investments: | ||||||||||||
| Cash | 949,732 | 2,030,504 | 178,849 | |||||||||
| Payment-in-kind | 4,531,210 | 1,670,033 | 213,838 | |||||||||
| Total interest income | 112,214,785 | 138,346,487 | 110,308,055 | |||||||||
| Dividend income, net of provisional taxes ($511,510, $143,883 and $0, respectively) | 1,046,476 | 107,434 | - | |||||||||
| Interest from cash and cash equivalents | 32,242 | 5,805 | 8,063 | |||||||||
| Fee income (See note 9) | 7,455,466 | 10,736,376 | 29,073,742 | |||||||||
| Total investment income | 120,748,969 | 149,196,102 | 139,389,860 | |||||||||
| EXPENSES: | ||||||||||||
| Base management fees (See note 6) | 19,469,583 | 22,450,398 | 17,683,996 | |||||||||
| Incentive fees (See note 6) | 11,492,006 | 18,234,110 | 18,667,053 | |||||||||
| Interest and financing expenses | 30,276,926 | 25,531,099 | 20,132,727 | |||||||||
| Administrator expenses (See note 6) | 3,915,506 | 4,106,806 | 3,353,438 | |||||||||
| General and administrative | 2,336,025 | 1,931,881 | 1,512,693 | |||||||||
| Professional fees | 2,276,902 | 2,865,187 | 2,250,984 | |||||||||
| Directors fees | 543,847 | 578,587 | 551,123 | |||||||||
| Insurance | 494,136 | 561,594 | 569,632 | |||||||||
| Expenses before management and incentive fee waivers | 70,804,931 | 76,259,662 | 64,721,646 | |||||||||
| Management fee waiver (See note 6) | (142,546 | ) | - | - | ||||||||
| Incentive fee waiver (See note 6) | (3,504,103 | ) | - | - | ||||||||
| Total expenses net of management and incentive fee waivers | 67,158,282 | 76,259,662 | 64,721,646 | |||||||||
| NET INVESTMENT INCOME | 53,590,687 | 72,936,440 | 74,668,214 | |||||||||
| REALIZED AND UNREALIZED GAIN/(LOSS) ON INVESTMENTS: | ||||||||||||
| Net realized gain/(loss) from investments | (39,382,650 | ) | (60,910,209 | ) | 355,744 | |||||||
| Net unrealized appreciation/(depreciation) on investments | (42,257,455 | ) | (26,722,725 | ) | (21,273,648 | ) | ||||||
| Change in provision for deferred taxes on unrealized (appreciation)/depreciation on investments | 87,333 | (61,329 | ) | (1,592,145 | ) | |||||||
| Net gain/(loss) on investments | (81,552,772 | ) | (87,694,263 | ) | (22,510,049 | ) | ||||||
| NET INCREASE/(DECREASE) IN NET ASSETS RESULTING FROM OPERATIONS | $ | (27,962,085 | ) | $ | (14,757,823 | ) | $ | 52,158,165 | ||||
| WEIGHTED AVERAGE - BASIC AND DILUTED EARNINGS PER COMMON SHARE | $ | (0.50 | ) | $ | (0.26 | ) | $ | 1.10 | ||||
| WEIGHTED AVERAGE - BASIC AND DILUTED NET INVESTMENT INCOME PER COMMON SHARE | $ | 0.97 | $ | 1.27 | $ | 1.58 | ||||||
| WEIGHTED AVERAGE COMMON STOCK OUTSTANDING - BASIC AND DILUTED (SEE NOTE 11) | 55,399,646 | 57,624,779 | 47,366,892 | |||||||||
| DIVIDENDS DECLARED PER COMMON SHARE | $ | 1.12 | $ | 1.27 | $ | 1.48 | ||||||
See accompanying notes to consolidated financial statements.
| F-4 |
Consolidated Statements of Changes in Net Assets
| For the years ended September 30 | ||||||||||||
| 2016 | 2015 | 2014 | ||||||||||
| OPERATIONS: | ||||||||||||
| Net investment income | $ | 53,590,687 | $ | 72,936,440 | $ | 74,668,214 | ||||||
| Net realized gain/(loss) from investments | (39,382,650 | ) | (60,910,209 | ) | 355,744 | |||||||
| Net unrealized appreciation/(depreciation) on investments | (42,257,455 | ) | (26,722,725 | ) | (21,273,648 | ) | ||||||
| Change in provision for deferred taxes on unrealized gain on investments | 87,333 | (61,329 | ) | (1,592,145 | ) | |||||||
| Net increase/(decrease) in net assets from operations | (27,962,085 | ) | (14,757,823 | ) | 52,158,165 | |||||||
| SHAREHOLDER DISTRIBUTIONS: | ||||||||||||
| Distributions from net investment income | (62,122,756 | ) | (73,973,810 | ) | (64,544,920 | ) | ||||||
| Distributions from net realized gains | - | - | (989,866 | ) | ||||||||
| Distributions from tax return of capital | - | - | (7,481,540 | ) | ||||||||
| Net decrease in net assets from shareholder distributions | (62,122,756 | ) | (73,973,810 | ) | (73,016,326 | ) | ||||||
| COMMON SHARE TRANSACTIONS: | ||||||||||||
| Repurchase of common stock under stock repurchase program (1,862,941, 2,396,132 and 0 shares, respectively) | (12,869,972 | ) | (21,204,864 | ) | - | |||||||
| Offering costs | (46,429 | ) | - | (561,141 | ) | |||||||
| Issuance of common stock, net of underwriting costs (0, 0, and 18,421,278 shares, respectively) | - | - | 239,396,018 | |||||||||
| Issuance of common stock under dividend reinvestment plan (0, 0, and 159,102 shares, respectively) | - | - | 2,045,710 | |||||||||
| Net increase/(decrease) in net assets from common share transactions | (12,916,401 | ) | (21,204,864 | ) | 240,880,587 | |||||||
| Total increase/(decrease) in net assets | (103,001,242 | ) | (109,936,497 | ) | 220,022,426 | |||||||
| Net assets at beginning of year | 619,920,384 | 729,856,881 | 509,834,455 | |||||||||
| Net assets at end of year including accumulated undistributed net investment income of $10,811,766, $20,351,831, and $21,673,794 respectively | $ | 516,919,142 | $ | 619,920,384 | $ | 729,856,881 | ||||||
| Net asset value per common share | $ | 9.49 | $ | 11.00 | $ | 12.43 | ||||||
| Common shares outstanding at end of year | 54,474,211 | 56,337,152 | 58,733,284 | |||||||||
See accompanying notes to consolidated financial statements.
| F-5 |
Consolidated Statements of Cash Flows
| For the years ended September 30 | ||||||||||||
| 2016 | 2015 | 2014 | ||||||||||
| Cash flows from operating activities | ||||||||||||
| NET INCREASE/(DECREASE) IN NET ASSETS FROM OPERATIONS | $ | (27,962,085 | ) | $ | (14,757,823 | ) | $ | 52,158,165 | ||||
| ADJUSTMENTS TO RECONCILE NET INCREASE/(DECREASE) IN NET ASSETS FROM OPERATIONS TO NET CASH PROVIDED/(USED) BY OPERATING ACTIVITIES: | ||||||||||||
| Investment increases due to payment-in-kind interest | (14,442,519 | ) | (10,443,996 | ) | (12,132,979 | ) | ||||||
| Net amortization of premium/(discount) on investments | (874,204 | ) | (1,692,973 | ) | (835,131 | ) | ||||||
| Amortization of debt issuance costs | 3,550,181 | 2,593,026 | 2,169,982 | |||||||||
| Net realized (gain)/loss from investments | 39,382,650 | 60,910,209 | (355,744 | ) | ||||||||
| Net deferred income taxes | 206,368 | 205,211 | 1,592,145 | |||||||||
| Net unrealized (appreciation)/depreciation on investments | 42,257,455 | 26,722,725 | 21,273,648 | |||||||||
| Proceeds from sale and settlements of investments | 333,056,400 | 260,419,011 | 388,979,191 | |||||||||
| Purchases, originations and participations | (97,472,088 | ) | (306,468,674 | ) | (893,230,650 | ) | ||||||
| (Increase)/decrease in operating assets: | ||||||||||||
| Interest receivable | 560,393 | 3,552,956 | (3,487,964 | ) | ||||||||
| Fees receivable | (13,749 | ) | 540,445 | (1,930,079 | ) | |||||||
| Other assets | (336,853 | ) | 94,750 | (401,647 | ) | |||||||
| Receivable for dispositions and investments sold | (110,511 | ) | 13,710,742 | (14,289,610 | ) | |||||||
| Increase/(decrease) in operating liabilities: | ||||||||||||
| Payable for investments purchased, originated and participated | - | (54,995,000 | ) | 54,940,987 | ||||||||
| Management and incentive fees payable, net | (5,403,915 | ) | (482,277 | ) | 3,545,158 | |||||||
| Accounts payable and accrued expenses | 159,508 | 173,198 | 1,024,883 | |||||||||
| Interest and fees payable | 400,092 | (782,240 | ) | 940,647 | ||||||||
| Administrator expenses payable | (10,610 | ) | (11,620 | ) | 311,258 | |||||||
| Deferred revenue | (32,224 | ) | 136,536 | 9,571 | ||||||||
| Due to affiliate | (18,605 | ) | 69,600 | (42,519 | ) | |||||||
| NET CASH PROVIDED/(USED) BY OPERATING ACTIVITIES | 272,895,684 | (20,506,194 | ) | (399,760,688 | ) | |||||||
| Cash flows from financing activities | ||||||||||||
| Proceeds from issuance of common stock, net of underwriting costs | - | - | 241,441,728 | |||||||||
| Repurchase of common stock under stock repurchase program | (12,869,972 | ) | (21,204,864 | ) | - | |||||||
| Offering costs paid | (80,944 | ) | - | (656,095 | ) | |||||||
| Borrowings under revolving credit facility | 147,112,825 | 206,000,000 | 633,800,000 | |||||||||
| Repayments of revolving credit facility | (251,800,000 | ) | (107,300,000 | ) | (368,300,000 | ) | ||||||
| Financing costs paid | (4,363,830 | ) | (4,032,364 | ) | (5,335,030 | ) | ||||||
| Payments of cash dividends | (62,122,756 | ) | (73,973,810 | ) | (73,016,326 | ) | ||||||
| NET CASH PROVIDED/(USED) BY FINANCING ACTIVITIES | (184,124,677 | ) | (511,038 | ) | 427,934,277 | |||||||
| NET INCREASE/(DECREASE) IN CASH AND CASH EQUIVALENTS | 88,771,007 | (21,017,232 | ) | 28,173,589 | ||||||||
| CASH AND CASH EQUIVALENTS, BEGINNING OF YEAR | 15,714,256 | 36,731,488 | 8,557,899 | |||||||||
| CASH AND CASH EQUIVALENTS, END OF YEAR | $ | 104,485,263 | $ | 15,714,256 | $ | 36,731,488 | ||||||
| Supplemental Information: | ||||||||||||
| Interest paid during the year | $ | 26,249,761 | $ | 23,643,303 | $ | 16,945,277 | ||||||
| Supplemental non-cash information: | ||||||||||||
| Payment-in-kind interest income | $ | 12,540,818 | $ | 10,154,040 | $ | 10,726,734 | ||||||
| Net amortization of premium/(discount) on investments | $ | 874,204 | $ | 1,692,973 | $ | 835,131 | ||||||
| Amortization of debt issuance costs | $ | (3,550,181 | ) | $ | (2,593,026 | ) | $ | (2,169,982 | ) | |||
| Non-cash purchase of investments | $ | 31,883,728 | $ | - | $ | - | ||||||
| Non-cash sale of investments | $ | 31,883,728 | $ | - | $ | - | ||||||
| Issuance of common stock in connection with dividend reinvestment plan | $ | - | $ | - | $ | 2,045,710 | ||||||
See accompanying notes to consolidated financial statements.
| F-6 |
Consolidated Schedule of Investments
September 30, 2016
| Company(1) | Industry | Type of Investment | Maturity | Par Amount(2) | Cost(3) | Fair Value | %
of Net Assets(4) | |||||||||||||||
| Non-Controlled/Non-Affiliated Investments: | ||||||||||||||||||||||
| Access Media Holdings, LLC(7) | Media: Broadcasting & Subscription | Senior Secured First Lien Term Loan (10.00%) | 7/22/2020 | 7,929,093 | 7,929,092 | 7,832,358 | 1.5 | % | ||||||||||||||
| Preferred Equity Series A | 1,600,000 | 1,600,000 | - | 0.0 | % | |||||||||||||||||
| Preferred Equity Series AA | 616,000 | 616,000 | - | 0.0 | % | |||||||||||||||||
| 16% of Common Equity of Newco | - | - | - | 0.0 | % | |||||||||||||||||
| 10,145,093 | 10,145,092 | 7,832,358 | ||||||||||||||||||||
| Accupac, Inc. | Containers, Packaging & Glass | Senior Secured Second Lien Term Loan (LIBOR + 10.00% Cash, 1.00% LIBOR Floor)(18) | 7/14/2020 | 27,000,000 | 27,000,000 | 27,000,000 | 5.2 | % | ||||||||||||||
| 27,000,000 | 27,000,000 | 27,000,000 | ||||||||||||||||||||
| Advanced Diagnostic Holdings, LLC | Healthcare & Pharmaceuticals | Senior Secured First Lien Term Loan (LIBOR + 8.75% Cash, 0.875% LIBOR Floor)(19) | 12/11/2020 | 15,262,608 | 15,262,608 | 15,701,560 | 3.0 | % | ||||||||||||||
| 15,262,608 | 15,262,608 | 15,701,560 | ||||||||||||||||||||
| Albertville Quality Foods, Inc.(12) | Beverage & Food | Senior Secured First Lien Term Loan (LIBOR + 9.50% Cash, 1.00% LIBOR Floor, 3.00% LIBOR Cap)(18) | 10/31/2018 | 15,972,097 | 15,972,097 | 16,131,818 | 3.1 | % | ||||||||||||||
| 15,972,097 | 15,972,097 | 16,131,818 | ||||||||||||||||||||
| Autosplice, Inc. | High Tech Industries | Senior Secured First Lien Term Loan (LIBOR + 9.50% Cash, 1.00% LIBOR Floor)(19) | 6/30/2019 | 14,441,783 | 14,441,784 | 14,489,296 | 2.8 | % | ||||||||||||||
| 14,441,783 | 14,441,784 | 14,489,296 | ||||||||||||||||||||
| Backcountry.com, LLC | Retail | Senior Secured First Lien Term Loan (LIBOR + 7.25% Cash, 1.00% LIBOR Floor)(19) | 6/30/2020 | 2,551,042 | 2,551,042 | 2,576,552 | 0.5 | % | ||||||||||||||
| 2,551,042 | 2,551,042 | 2,576,552 | ||||||||||||||||||||
| Be Green Packaging, LLC | Containers, Packaging & Glass | Equity - 417 Common Shares(33) | - | 416,250 | - | 0.0 | % | |||||||||||||||
| - | 416,250 | - | ||||||||||||||||||||
| F-7 |
| Company(1) | Industry | Type of Investment | Maturity | Par Amount(2) | Cost(3) | Fair Value | % of Net Assets(4) | |||||||||||||||
| Black Angus Steakhouses, LLC(7)(9) | Hotel, Gaming & Leisure | Senior Secured First Lien Term Loan (LIBOR + 9.00% Cash, 1.00% LIBOR Floor)(18) | 4/24/2020 | 7,906,250 | 7,906,250 | 7,721,117 | 1.5 | % | ||||||||||||||
| Senior Secured First Lien Delayed Draw (LIBOR + 9.00%, 1.00% LIBOR Floor) | 4/24/2020 | - | - | - | 0.0 | % | ||||||||||||||||
| Revolver (LIBOR + 9.00%, 1.00% LIBOR Floor)(27) | 4/24/2020 | 446,429 | 446,429 | 441,911 | 0.1 | % | ||||||||||||||||
| 8,352,679 | 8,352,679 | 8,163,028 | ||||||||||||||||||||
| Brantley Transportation LLC(7)(12) | Energy: Oil & Gas | Senior Secured First Lien Term Loan (12.00% PIK)(10) | 8/2/2017 | 10,060,902 | 9,051,055 | 5,351,092 | 1.0 | % | ||||||||||||||
| Senior Secured First Lien Delayed Draw (LIBOR + 5.00%, 1.00% LIBOR Floor) | 8/2/2017 | 637,500 | 637,500 | 637,500 | 0.1 | % | ||||||||||||||||
| 7.50 Common Units represent 8.04% of the outstanding equity interest of Brantley Trucking, LLC | 8/2/2017 | - | - | - | 0.0 | % | ||||||||||||||||
| 10,698,402 | 9,688,555 | 5,988,592 | ||||||||||||||||||||
| ConvergeOne Holdings Corporation | Telecommunications | Senior Secured Second Lien Term Loan (LIBOR + 8.00% Cash, 1.00% LIBOR Floor)(19) | 6/17/2021 | 12,500,000 | 12,406,960 | 12,458,500 | 2.4 | % | ||||||||||||||
| 12,500,000 | 12,406,960 | 12,458,500 | ||||||||||||||||||||
| CP OPCO LLC(7) | Services: Consumer | Senior Secured First Lien Term Loan A (LIBOR + 4.50% Cash, 1.00% LIBOR Floor)(19)(31) | 3/31/2019 | 2,805,273 | 2,805,273 | 2,805,273 | 0.6 | % | ||||||||||||||
| Senior Secured First Lien Term Loan B (LIBOR + 4.50% Cash, 1.00% LIBOR Floor)(19)(31) | 3/31/2019 | 1,168,864 | 1,168,864 | 1,168,864 | 0.2 | % | ||||||||||||||||
| Senior Secured First Lien Term Loan C (LIBOR + 6.00% Cash, 1.00% LIBOR Floor)(10)(19)(32) | 3/31/2019 | 8,204,394 | 4,063,090 | 4,102,197 | 0.8 | % | ||||||||||||||||
| Senior Secured First Lien Term Loan D (LIBOR + 6.00% Cash, 1.00% LIBOR Floor)(10)(19)(32) | 3/31/2019 | 5,107,884 | - | - | 0.0 | % | ||||||||||||||||
| Revolving Credit Facility (LIBOR + 4.50% Cash, 1.00% LIBOR Floor)(19) | 3/31/2019 | 725,552 | 725,552 | 725,552 | 0.1 | % | ||||||||||||||||
| Revolving Credit Facility (ABR + 3.50% Cash, 3.50% ABR Floor)(30) | 3/31/2019 | 638,486 | 638,485 | 638,486 | 0.1 | % | ||||||||||||||||
| Common Units(29) | 3/31/2019 | - | - | - | 0.0 | % | ||||||||||||||||
| 18,650,453 | 9,401,264 | 9,440,372 | ||||||||||||||||||||
| Crow Precision Components, LLC | Aerospace & Defense | Senior Secured First Lien Term Loan (LIBOR + 8.50% Cash, 1.00% LIBOR Floor)(18) | 9/30/2019 | 13,540,000 | 13,540,000 | 13,540,000 | 2.6 | % | ||||||||||||||
| 350 units of outstanding equity in Wingman Holdings, Inc. | - | 700,000 | 414,305 | 0.1 | % | |||||||||||||||||
| 13,540,000 | 14,240,000 | 13,954,305 | ||||||||||||||||||||
| F-8 |
| Company(1) | Industry | Type of Investment | Maturity | Par Amount(2) | Cost(3) | Fair Value | % of Net Assets(4) | |||||||||||||||
| DHISCO Electronic Distribution, Inc.(7)(12) | Hotel, Gaming & Leisure | Senior Secured First Lien Term Loan A (LIBOR + 9.00%, 1.50% LIBOR Floor) | 11/10/2019 | 31,238,095 | 31,238,095 | 29,545,615 | 5.7 | % | ||||||||||||||
| Senior Secured First Lien Term Loan B (10.50% PIK) | 2/10/2018 | 6,982,024 | 6,982,024 | 6,587,260 | 1.3 | % | ||||||||||||||||
| Revolving Credit Facility (LIBOR + 9.00%, 1.50% LIBOR Floor)(24) | 5/10/2017 | - | - | - | 0.0 | % | ||||||||||||||||
| Equity - 1,230,769 Units(22) | - | 1,230,769 | 70,624 | 0.0 | % | |||||||||||||||||
| 38,220,119 | 39,450,888 | 36,203,499 | ||||||||||||||||||||
| DLR Restaurants LLC(12) | Hotel, Gaming & Leisure | Senior Secured First Lien Term Loan (13.00% Cash, 2.50% PIK) | 4/18/2018 | 24,117,310 | 24,117,310 | 23,958,859 | 4.6 | % | ||||||||||||||
| Unsecured Debt (12.00% Cash, 4.00% PIK) | 4/18/2018 | 287,531 | 287,531 | 279,604 | 0.1 | % | ||||||||||||||||
| 24,404,841 | 24,404,841 | 24,238,463 | ||||||||||||||||||||
| Dream Finders Homes, LLC | Construction & Building | Senior Secured First Lien Term Loan B (LIBOR + 14.50% Cash) | 10/1/2018 | 7,093,318 | 7,009,174 | 7,071,897 | 1.4 | % | ||||||||||||||
| 5,000 common units represent 5% of the outstanding equity interest of Dream Finders Holdings, LLC | 10/1/2018 | - | 180,000 | 1,619,379 | 0.3 | % | ||||||||||||||||
| 7,093,318 | 7,189,174 | 8,691,276 | ||||||||||||||||||||
| Dynamic Energy Services International LLC | Energy: Oil & Gas | Senior Secured First Lien Term Loan (LIBOR + 8.50% Cash, 1.00% LIBOR Floor, 1.50% PIK)(18) | 3/6/2018 | 16,046,050 | 16,046,050 | 13,307,952 | 2.6 | % | ||||||||||||||
| 16,046,050 | 16,046,050 | 13,307,952 | ||||||||||||||||||||
| Essex Crane Rental Corp.(12) | Construction & Building | Senior Secured First Lien Term Loan (LIBOR + 12.50% PIK, 1.00% LIBOR Floor)(10)(19) | 5/13/2019 | 23,190,922 | 20,460,116 | 1,159,546 | 0.2 | % | ||||||||||||||
| 23,190,922 | 20,460,116 | 1,159,546 | ||||||||||||||||||||
| FKI Security Group LLC(12) | Capital Equipment | Senior Secured First Lien Term Loan (LIBOR + 8.50% Cash, 1.00% LIBOR Floor)(19) | 3/30/2020 | 14,531,250 | 14,531,250 | 14,605,650 | 2.8 | % | ||||||||||||||
| 14,531,250 | 14,531,250 | 14,605,650 | ||||||||||||||||||||
| Footprint Acquisition LLC | Services: Business | Senior Secured First Lien Term Loan (LIBOR + 8.00% Cash)(18) | 2/27/2020 | 5,250,102 | 5,250,102 | 5,340,509 | 1.0 | % | ||||||||||||||
| Preferred Equity (8.75% PIK) | 5,749,795 | 5,749,795 | 5,749,508 | 1.1 | % | |||||||||||||||||
| 150.0 units of Common Stock(23) | - | - | 1,171,650 | 0.2 | % | |||||||||||||||||
| 10,999,897 | 10,999,897 | 12,261,667 | ||||||||||||||||||||
| Freedom Powersports LLC | Automotive | Senior Secured First Lien Term Loan (LIBOR + 10.75% Cash, 1.50% LIBOR Floor)(19) | 9/26/2019 | 13,890,000 | 13,890,000 | 14,167,800 | 2.7 | % | ||||||||||||||
| 13,890,000 | 13,890,000 | 14,167,800 | ||||||||||||||||||||
| F-9 |
| Company(1) | Industry | Type of Investment | Maturity | Par Amount(2) | Cost(3) | Fair Value | % of Net Assets(4) | |||||||||||||||
| Harrison Gypsum, LLC(12) | Construction & Building | Senior Secured First Lien Term Loan (LIBOR + 8.50% Cash, 0.50% PIK, 1.50% LIBOR Floor)(18) | 12/21/2018 | 53,776,985 | 53,776,985 | 51,930,283 | 10.1 | % | ||||||||||||||
| 53,776,985 | 53,776,985 | 51,930,283 | ||||||||||||||||||||
| Heligear Acquisition Co. | Aerospace & Defense | Senior Secured First Lien Note (10.25% Cash) | 10/15/2019 | 20,000,000 | 20,000,000 | 21,047,400 | 4.1 | % | ||||||||||||||
| 20,000,000 | 20,000,000 | 21,047,400 | ||||||||||||||||||||
| JD Norman Industries, Inc. | Automotive | Senior Secured First Lien Term Loan (LIBOR + 12.25% Cash)(18) | 3/6/2019 | 21,300,000 | 21,300,000 | 20,219,025 | 3.9 | % | ||||||||||||||
| 21,300,000 | 21,300,000 | 20,219,025 | ||||||||||||||||||||
| Jordan Reses Supply Company, LLC | Healthcare & Pharmaceuticals | Senior Secured Second Lien Term Loan (LIBOR + 11.00%, 1.00% LIBOR Floor) | 4/24/2020 | 20,000,000 | 20,000,000 | 20,400,000 | 4.0 | % | ||||||||||||||
| 20,000,000 | 20,000,000 | 20,400,000 | ||||||||||||||||||||
| Lighting Science Group Corporation | Containers, Packaging & Glass | Senior Secured Second Lien Term (LIBOR + 10.00% Cash, 2.00% PIK)(19) | 2/19/2019 | 16,053,472 | 15,515,186 | 15,077,260 | 2.9 | % | ||||||||||||||
| Warrants to purchase 0.98% of the outstanding equity | 2/19/2024 | - | 955,680 | 120,000 | 0.0 | % | ||||||||||||||||
| 16,053,472 | 16,470,866 | 15,197,260 | ||||||||||||||||||||
| LSF9 Atlantis Holdings, LLC | Retail | Senior Secured First Lien Term Loan (LIBOR + 9.00% Cash, 1.00% LIBOR Floor) | 1/15/2021 | 9,750,000 | 9,661,163 | 9,988,485 | 1.9 | % | ||||||||||||||
| 9,750,000 | 9,661,163 | 9,988,485 | ||||||||||||||||||||
| Merchant Cash and Capital, LLC | Banking, Finance, Insurance & Real Estate | Senior Secured First Lien Delayed Draw (LIBOR + 8.00% Cash, 3.00% LIBOR Floor)(18) | 12/4/2016 | 17,033,522 | 17,033,522 | 17,033,522 | 3.3 | % | ||||||||||||||
| Senior Secured Second Lien Term Loan (12.00% Cash) | 5/4/2017 | 15,000,000 | 15,000,000 | 14,999,250 | 2.9 | % | ||||||||||||||||
| 32,033,522 | 32,033,522 | 32,032,772 | ||||||||||||||||||||
| F-10 |
| Company(1) | Industry | Type of Investment | Maturity | Par Amount(2) | Cost(3) | Fair Value | % of Net Assets(4) | |||||||||||||||
| Miratech Intermediate Holdings, Inc.(12) | Automotive | Senior Secured First Lien Term Loan (LIBOR + 9.00% Cash, 1.00% LIBOR Floor)(18) | 5/9/2019 | 12,695,105 | 12,695,105 | 12,478,272 | 2.5 | % | ||||||||||||||
| 12,695,105 | 12,695,105 | 12,478,272 | ||||||||||||||||||||
| Momentum Telecom, Inc. | Telecommunications | Senior Secured First Lien Term Loan (LIBOR + 8.50% Cash, 1.00% LIBOR Floor)(18) | 3/10/2019 | 12,593,281 | 12,593,281 | 12,719,213 | 2.5 | % | ||||||||||||||
| 12,593,281 | 12,593,281 | 12,719,213 | ||||||||||||||||||||
| Nation Safe Drivers Holdings, Inc. | Banking, Finance, Insurance & Real Estate | Senior Secured Second Lien Term Loan (LIBOR + 8.00% Cash, 2.00% LIBOR Floor)(19) | 9/29/2020 | 35,278,846 | 35,278,846 | 35,631,635 | 6.9 | % | ||||||||||||||
| 35,278,846 | 35,278,846 | 35,631,635 | ||||||||||||||||||||
| Nielsen & Bainbridge, LLC | Consumer goods: Durable | Senior Secured Second Lien Term Loan (LIBOR + 9.25% Cash, 1.00% LIBOR Floor)(18) | 8/15/2021 | 25,000,000 | 25,000,000 | 24,696,000 | 4.8 | % | ||||||||||||||
| 25,000,000 | 25,000,000 | 24,696,000 | ||||||||||||||||||||
| NorthStar Group Services, Inc. | Construction & Building | Unsecured Debt (2.5% Cash, 15.5% PIK) | 10/24/2019 | 26,107,691 | 26,107,691 | 26,042,683 | 5.0 | % | ||||||||||||||
| 26,107,691 | 26,107,691 | 26,042,683 | ||||||||||||||||||||
| Oxford Mining Company, LLC | Metals & Mining | Senior Secured First Lien Term Loan (LIBOR + 8.50% Cash, 3.00% PIK, 0.75% LIBOR Floor) | 12/31/2018 | 20,661,469 | 20,661,469 | 20,245,760 | 3.9 | % | ||||||||||||||
| 20,661,469 | 20,661,469 | 20,245,760 | ||||||||||||||||||||
| The Plastics Group, Inc. | Chemicals, Plastics & Rubber | Senior Secured First Lien Term Loan (11.00% Cash, 2.00% PIK) | 2/28/2019 | 21,867,506 | 21,867,506 | 21,457,709 | 4.2 | % | ||||||||||||||
| 21,867,506 | 21,867,506 | 21,457,709 | ||||||||||||||||||||
| Point.360 | Services: Business | Senior Secured First Lien Term Loan (LIBOR + 6.00% Cash) | 7/8/2020 | 1,953,269 | 1,953,269 | 1,849,160 | 0.4 | % | ||||||||||||||
| Equity - 479,283 Common Shares(25) | - | 129,406 | 359,462 | 0.1 | % | |||||||||||||||||
| Warrants to purchase 2.8% of the outstanding common shares(26) | 7/8/2020 | - | 52,757 | 243,317 | 0.1 | % | ||||||||||||||||
| 1,953,269 | 2,135,432 | 2,451,939 | ||||||||||||||||||||
| Prestige Industries LLC | Services: Business | Senior Secured Second Lien Term Loan (10.00% Cash, 3.00% PIK)(10) | 11/1/2017 | 7,679,806 | 7,596,895 | 2,818,258 | 0.6 | % | ||||||||||||||
| Warrants to purchase 0.63% of the outstanding common units | 11/1/2017 | - | 151,855 | - | 0.0 | % | ||||||||||||||||
| 7,679,806 | 7,748,750 | 2,818,258 | ||||||||||||||||||||
| Prince Mineral Holding Corp.(8) | Wholesale | Senior Secured First Lien Note (11.50%) | 12/15/2019 | 6,800,000 | 6,755,409 | 6,375,000 | 1.2 | % | ||||||||||||||
| 6,800,000 | 6,755,409 | 6,375,000 | ||||||||||||||||||||
| F-11 |
| Company(1) | Industry | Type of Investment | Maturity | Par Amount(2) | Cost(3) | Fair Value | % of Net Assets(4) | |||||||||||||||
| Reddy Ice Corporation | Beverage & Food | Senior Secured Second Lien Term Loan (LIBOR + 9.50% Cash, 1.25% LIBOR Floor)(18) | 11/1/2019 | 17,000,000 | 17,000,000 | 14,092,830 | 2.7 | % | ||||||||||||||
| 17,000,000 | 17,000,000 | 14,092,830 | ||||||||||||||||||||
| Response Team Holdings, LLC | Construction & Building | Preferred Equity (12.00% PIK)(10) | 6,256,390 | 5,796,950 | 3,262,707 | 0.6 | % | |||||||||||||||
| Warrants to purchase 7.2% of the outstanding common units | 3/28/2019 | - | 429,012 | - | 0.0 | % | ||||||||||||||||
| 6,256,390 | 6,225,962 | 3,262,707 | ||||||||||||||||||||
| Safeworks, LLC(12) | Capital Equipment | Unsecured Debt (12.00% Cash) | 1/31/2020 | 15,000,000 | 15,000,000 | 15,150,000 | 2.9 | % | ||||||||||||||
| 15,000,000 | 15,000,000 | 15,150,000 | ||||||||||||||||||||
| Sendero Drilling Company, LLC | Energy: Oil & Gas | Senior Secured First Lien Term Loan (LIBOR + 11.00% Cash)(18) | 3/18/2019 | 3,996,312 | 3,545,039 | 4,076,238 | 0.8 | % | ||||||||||||||
| Warrants to purchase 5.52% of the outstanding common units | 3/18/2019 | - | 793,523 | 5,399,817 | 1.1 | % | ||||||||||||||||
| 3,996,312 | 4,338,562 | 9,476,055 | ||||||||||||||||||||
| Seotowncenter, Inc.(12) | Services: Business | Senior Secured First Lien Term Loan (LIBOR + 9.00% Cash, 1.00% LIBOR Floor)(19) | 9/11/2019 | 24,699,566 | 24,699,566 | 24,212,737 | 4.7 | % | ||||||||||||||
| 3,249.697 shares of Common Stock(14) | - | 500,000 | 139,602 | 0.0 | % | |||||||||||||||||
| 24,699,566 | 25,199,566 | 24,352,339 | ||||||||||||||||||||
| Ship Supply Acquisition Corporation | Services: Business | Senior Secured First Lien Term Loan (LIBOR + 8.00% Cash, 1.00% LIBOR Floor)(19) | 7/31/2020 | 8,073,731 | 8,073,731 | 8,151,400 | 1.6 | % | ||||||||||||||
| 8,073,731 | 8,073,731 | 8,151,400 | ||||||||||||||||||||
| Stancor, Inc. | Services: Business | Senior Secured First Lien Term Loan (LIBOR + 8.00% Cash, 0.75% LIBOR Floor)(18) | 8/19/2019 | 5,090,909 | 5,090,909 | 5,090,909 | 1.0 | % | ||||||||||||||
| 263,814.43 Class A Units(15) | - | 263,815 | 125,830 | 0.0 | % | |||||||||||||||||
| 5,090,909 | 5,354,724 | 5,216,739 | ||||||||||||||||||||
| F-12 |
| Company(1) | Industry | Type of Investment | Maturity | Par Amount(2) | Cost(3) | Fair Value | % of Net Assets(4) | |||||||||||||||
| T Residential Holdings, LLC | Banking, Finance, Insurance & Real Estate | Senior Secured First Lien Term Loan (12.00%) | 3/28/2019 | 18,500,000 | 18,500,000 | 18,542,920 | 3.6 | % | ||||||||||||||
| 18,500,000 | 18,500,000 | 18,542,920 | ||||||||||||||||||||
| Taylored Freight Services, LLC | Services: Business | Senior Secured Second Lien Term Loan (LIBOR + 9.50% Cash, 2.00% PIK, 1.50% LIBOR Floor)(19) | 11/1/2017 | 15,040,795 | 15,040,796 | 14,841,956 | 2.9 | % | ||||||||||||||
| 15,040,795 | 15,040,796 | 14,841,956 | ||||||||||||||||||||
| Tenere Acquisition Corp.(7)(9) | Chemicals, Plastics & Rubber | Senior Secured First Lien Term Loan (11.00% Cash, 2.00% PIK) | 12/15/2017 | 11,051,371 | 11,051,371 | 11,181,885 | 2.2 | % | ||||||||||||||
| 11,051,371 | 11,051,371 | 11,181,885 | ||||||||||||||||||||
| Transtelco, Inc. | Telecommunications | Senior Secured First Lien Term Loan (LIBOR + 9.00% Cash, 1.50% LIBOR Floor)(18) | 11/19/2017 | 18,672,000 | 18,672,000 | 18,837,434 | 3.7 | % | ||||||||||||||
| 18,672,000 | 18,672,000 | 18,837,434 | ||||||||||||||||||||
| Velocity Pooling Vehicle, LLC | Automotive | Senior Secured Second Lien Term Loan (LIBOR + 7.25% Cash, 1.00% LIBOR Floor)(18) | 5/13/2022 | 24,000,000 | 21,333,743 | 12,795,840 | 2.5 | % | ||||||||||||||
| 24,000,000 | 21,333,743 | 12,795,840 | ||||||||||||||||||||
| Watermill-QMC Midco, Inc. | Automotive | 1.3% Partnership Interest in Watermill-QMC Midco Inc.(6) | - | 488,332 | 641,888 | 0.1 | % | |||||||||||||||
| - | 488,332 | 641,888 | ||||||||||||||||||||
| Wheels Up Partners LLC(12) | Aerospace & Defense | Senior Secured First Lien Delayed Draw (LIBOR + 8.55% Cash, 1.00% LIBOR Floor)(19) | 10/15/2021 | 16,598,494 | 16,598,494 | 16,654,099 | 3.2 | % | ||||||||||||||
| 16,598,494 | 16,598,494 | 16,654,099 | ||||||||||||||||||||
| Subtotal Non-Controlled / Non-Affiliated Investments | $ | 825,021,074 | $ | 813,813,853 | $ | 767,302,020 | ||||||||||||||||
| F-13 |
| Company(1) | Industry | Type of Investment | Maturity | Par Amount(2) | Cost(3) | Fair Value | % of Net Assets(4) | |||||||||||||||
| Control Investments:(5) | ||||||||||||||||||||||
| AAR Intermediate Holdings, LLC(7)(12) | Energy: Oil & Gas | Senior Secured First Lien Term Loan A (LIBOR + 5.00%, 1.00% LIBOR Floor)(19) | 9/30/2021 | 8,984,232 | 8,984,232 | 8,984,232 | 1.7 | % | ||||||||||||||
| Senior Secured First Lien Term Loan B (LIBOR + 8.00% PIK, 1.00% LIBOR Floor)(19) | 9/30/2021 | 18,451,002 | 14,890,698 | 14,889,405 | 2.9 | % | ||||||||||||||||
| Revolving Credit Facility (LIBOR + 5.00%, 1.00% LIBOR Floor) | 9/30/2021 | - | - | - | 0.0 | % | ||||||||||||||||
| 21.56 Class A Units represents 21.56% of the Outstanding Equity | - | - | - | 0.0 | % | |||||||||||||||||
| 27,435,234 | 23,874,930 | 23,873,637 | ||||||||||||||||||||
| Capstone Nutrition(12) | Healthcare & Pharmaceuticals | Senior Secured First Lien Term Loan (LIBOR + 12.50% PIK, 1.00% LIBOR Floor)(10)(19) | 4/28/2019 | 22,784,841 | 20,803,397 | 14,615,564 | 2.8 | % | ||||||||||||||
| Senior Secured First Lien Delayed Draw (LIBOR + 12.50% PIK, 1.00% LIBOR Floor)(10)(19) | 4/28/2019 | 9,858,981 | 9,153,997 | 6,324,142 | 1.2 | % | ||||||||||||||||
| 4,664.6 Class B Shares and 9,424.4 Class C Shares(28) | - | 12 | - | 0.0 | % | |||||||||||||||||
| 2,932.3 Units of Common Stock(13) | - | 400,003 | - | 0.0 | % | |||||||||||||||||
| 32,643,822 | 30,357,409 | 20,939,706 | ||||||||||||||||||||
| Lydell Jewelry Design Studio, LLC(7)(12) | Consumer goods: Non-durable | Senior Secured First Lien Term Loan (LIBOR + 5.50% Cash, 7.50% PIK, 1.50% LIBOR Floor)(10)(18) | 9/13/2018 | 15,576,447 | 14,269,868 | 5,707,522 | 1.1 | % | ||||||||||||||
| Senior Secured First Lien Term Loan (LIBOR + 5.00% Cash, 1.50% LIBOR Floor)(18) | 9/13/2018 | 1,500,000 | 1,500,000 | 1,500,000 | 0.3 | % | ||||||||||||||||
| Warrants to Purchase 13.3% of the outstanding membership units | 9/13/2018 | - | - | - | 0.0 | % | ||||||||||||||||
| 4,324,951.76 shares of Common Stock(20) | - | - | - | 0.0 | % | |||||||||||||||||
| 17,076,447 | 15,769,868 | 7,207,522 | ||||||||||||||||||||
| MCC Senior Loan Strategy JV I LLC(11) | Multisector Holdings | Equity - 87.5% ownership of MCC Senior Loan Strategy JV I LLC | - | 32,112,500 | 31,252,416 | 6.0 | % | |||||||||||||||
| - | 32,112,500 | 31,252,416 | ||||||||||||||||||||
| OmniVere, LLC | Services: Business | Senior Secured First Lien Term Loan (LIBOR + 13.00% PIK)(19) | 5/5/2019 | 22,360,258 | 22,053,015 | 22,360,258 | 4.3 | % | ||||||||||||||
| Unsecured Debt (8.00% PIK)(10) | 7/24/2025 | 22,808,291 | 20,754,889 | 11,336,861 | 2.2 | % | ||||||||||||||||
| Warrants to purchase outstanding equity(21) | 5/5/2019 | - | 872,698 | - | 0.0 | % | ||||||||||||||||
| 45,168,549 | 43,680,602 | 33,697,119 | ||||||||||||||||||||
| United Road Towing, Inc. | Services: Business | Senior Secured Second Lien Term Loan (LIBOR + 9.00% PIK) | 2/21/2020 | 18,725,607 | 18,725,607 | 18,725,607 | 3.6 | % | ||||||||||||||
| Preferred Equity Class C (8.00% PIK)(10) | 18,802,789 | 16,337,178 | 1,186,268 | 0.2 | % | |||||||||||||||||
| Preferred Equity Class C-1 (8.00% PIK)(10) | 2,990,965 | 2,456,143 | - | 0.0 | % | |||||||||||||||||
| Preferred Equity Class A-2 (8.00% PIK)(10) | 5,409,618 | 4,664,855 | - | 0.0 | % | |||||||||||||||||
| 65,809.73 Class B Common Units(16) | - | 1,098,096 | - | 0.0 | % | |||||||||||||||||
| 45,928,979 | 43,281,879 | 19,911,875 | ||||||||||||||||||||
| Subtotal Control Investments | $ | 168,253,031 | $ | 189,077,188 | $ | 136,882,275 | ||||||||||||||||
| F-14 |
| Company(1) | Industry | Type of Investment | Maturity | Par Amount(2) | Cost(3) | Fair Value | % of Net Assets(4) | |||||||||||||||
| Affiliated Investments: | ||||||||||||||||||||||
| US Multifamily, LLC(11) | Banking, Finance, Insurance & Real Estate | Senior Secured First Lien Term Loan (10.00% Cash) | 9/10/2019 | 6,670,000 | 6,670,000 | 6,670,000 | 1.3 | % | ||||||||||||||
| Preferred Equity - 33,300 Units(17) | - | 3,330,000 | 3,330,000 | 0.7 | % | |||||||||||||||||
| 6,670,000 | 10,000,000 | 10,000,000 | ||||||||||||||||||||
| Subtotal Affiliated Investments | $ | 6,670,000 | $ | 10,000,000 | $ | 10,000,000 | ||||||||||||||||
| Total Investments, September 30, 2016 | $ | 999,944,105 | $ | 1,012,891,041 | $ | 914,184,295 | 176.9 | % | ||||||||||||||
(1) All of our investments are domiciled in the United States. Certain investments also have international operations.
(2) Par amount includes accumulated PIK interest and is net of repayments.
(3) Gross unrealized appreciation, gross unrealized depreciation, and net depreciation for federal income tax purposes totaled $20.6 million, $107.0 million and $86.4 million, respectively. The tax cost basis of investments is $999.0 million as of September 30, 2016.
(4) Percentage is based on net assets of $516,919,142 as of September 30, 2016.
(5) Control Investments are defined by the Investment Company Act of 1940 ("1940 Act") as investments in companies in which the Company owns more than 25% of the voting securities or maintains greater than 50% of the board representation.
(6) 12,711 Units represents 1.3% of partnership interest in Watermill-QMC Partners, LP.
(7) The investment has an unfunded commitment as of September 30, 2016 (See note 8).
(8) Securities are exempt from registration under Rule 144a of the Securities Act of 1933. This security represents a fair value of $6.4 million and 1.2% of net assets as of September 30, 2016 and is considered restricted.
(9) Includes an analysis of the value of any unfunded loan commitments.
(10) The investment was on non-accrual status as of September 30, 2016.
(11) The investment is not a qualifying asset as defined under Section 55(a) of 1940 Act, in a whole, or in part.
(12) A portion of this investment was sold via a participation agreement (See note 3).
(13) 2,932.3 Units represents 3.06% ownership of INI Parent, Inc.
(14) 3,249.697 shares of Common Stock represents 2.917% ownership of Boostability Holdings, Inc.
(15) 263,814.43 Class A Units represents 0.882% ownership of Stancor, Inc.
(16) 65,809.73 Class B Common Units Represents 65.8% ownership of United Road Towing, Inc.
(17) 33,300 Units represents 18.167% ownership of US Multifamily, LLC.
(18) The interest rate on these loans is subject to a base rate plus 1 Month London Interbank Offering Rate ("LIBOR"), which at September 30, 2016 was 0.52%. As the interest rate is subject to a minimum LIBOR Floor which was greater than the 1 Month LIBOR rate at September 30, 2016, the prevailing rate in effect at September 30, 2016 was the base rate plus the LIBOR Floor.
(19) The interest rate on these loans is subject to a base rate plus 3 Month LIBOR, which at September 30, 2016 was 0.84%. As the interest rate is subject to a minimum LIBOR Floor which was greater than the 3 Month LIBOR rate at September 30, 2016, the prevailing rate in effect at September 30, 2016 was the base rate plus the LIBOR Floor.
(20) 4,324,951.76 Units of Common Stock represents 62.7% of the oustanding equity in Lydell Jewelry Holding Company, LLC.
(21) 5,055.56 Units of Common Stock, represents 50.56% of the outstanding equity in Omnivere Holding Company, LLC.
(22) 1,230,769 Units represents 3.12% ownership of Pegasus Solutions, Inc.
(23) 150 Units represents 15.0% of Footprint Holding Company, Inc.
(24) The investment earns 0.50% commitment fee on all unused commitment. At September 30, 2016, there was $1,904,761.91 of unused commitment.
(25) 479,283 Common Shares represents 3.8% of the outstanding common shares in Point.360.
(26) 351,713 Units represents 2.8% of the outstanding common shares in Point.360.
(27) The investment earns 0.50% commitment fee on all unused commitment. At September 30, 2016, there was $446,428.57 of unused commitment.
(28) 4,664.6 Class B and 9,424.4 Class C Shares represents 4.86% and 9.83% ownership in INI Parent, Inc., respectively.
(29) 232 Common Units represents 23.2% of the outstanding shares in CP Midco, LLC.
(30) The interest rate on these loans is subject to a base rate plus ABR. As the interest rate is subject to a minimum ABR Floor which was greater than the ABR rate at September 30, 2016, the prevailing rate in effect at September 30, 2016 was the base rate plus the ABR Floor.
(31) This investment may accrue PIK interest at the election of the Borrower (LIBOR + 6.50%, 1.00% LIBOR Floor) and is determined at the end of the rate setting period.
(32) This investment may accrue PIK interest at the election of the Borrower (LIBOR + 9.50%, 1.00% LIBOR Floor) and is determined at the end of the rate setting period.
(33) 417 shares of Common Stock represents 0.3267% ownership of Be Green Holding Company.
See accompanying notes to consolidated financial statements.
| F-15 |
Medley Capital Corporation
Consolidated Schedule of Investments
September 30, 2015
| Company (1) | Industry | Type of Investment | Maturity | Par Amount (2) | Cost(3) | Fair Value | %
of Net Assets (4) | |||||||||||||||
| Non-Controlled/ Non-Affiliated Investments: | ||||||||||||||||||||||
| AAR Intermediate Holdings LLC(11) | Energy: Oil & Gas | Senior Secured First Lien Term Loan (LIBOR + 12.00%, 1.00% LIBOR Floor)(18) | 3/30/2019 | 31,966,906 | 30,302,821 | 22,503,872 | 3.6 | % | ||||||||||||||
| Warrants to purchase 1.80% of outstanding company equity | 3/30/2019 | - | 2,274,480 | - | 0.0 | % | ||||||||||||||||
| 31,966,906 | 32,577,301 | 22,503,872 | ||||||||||||||||||||
| Accupac, Inc. | Containers, Packaging & Glass | Senior Secured Second Lien Term Loan (LIBOR + 10.00% Cash, 1.00% LIBOR Floor) (17) | 3/20/2020 | 35,000,000 | 35,000,000 | 34,680,800 | 5.6 | % | ||||||||||||||
| 35,000,000 | 35,000,000 | 34,680,800 | ||||||||||||||||||||
| AESC Holding Corp, Inc. | Retail | Senior Secured Second Lien Term Loan (LIBOR + 9.00% Cash, 1.00% LIBOR Floor)(17) | 5/27/2019 | 20,000,000 | 20,000,000 | 20,149,200 | 3.3 | % | ||||||||||||||
| 20,000,000 | 20,000,000 | 20,149,200 | ||||||||||||||||||||
| Albertville Quality Foods, Inc. (11) | Beverage & Food | Senior Secured First Lien Term Loan (LIBOR + 9.50% Cash, 1.00% LIBOR Floor, 3.00% LIBOR Cap)(17) | 10/31/2018 | 17,452,830 | 17,452,830 | 17,580,585 | 2.8 | % | ||||||||||||||
| 17,452,830 | 17,452,830 | 17,580,585 | ||||||||||||||||||||
| Access Media Holdings, LLC (7) | Media: Broadcasting & Subscription | Senior Secured First Lien Term Loan (10.00%) | 7/22/2020 | 7,536,913 | 7,536,913 | 7,536,913 | 1.2 | % | ||||||||||||||
| Preferred Equity (12.00% PIK) | 7/22/2020 | 1,187,417 | 1,187,417 | 207,578 | 0.0 | % | ||||||||||||||||
| 16% of Common Equity of Newco | 7/22/2020 | - | - | - | 0.0 | % | ||||||||||||||||
| 8,724,330 | 8,724,330 | 7,744,491 | ||||||||||||||||||||
| American Covers, Inc. | Consumer Discretionary | Senior Secured Second Lien Term Loan (LIBOR + 8.50% Cash, 1.00% LIBOR Floor)(18) | 3/1/2021 | 10,000,000 | 10,000,000 | 10,000,000 | 1.6 | % | ||||||||||||||
| 10,000,000 | 10,000,000 | 10,000,000 | ||||||||||||||||||||
| F-16 |
| Company (1) | Industry | Type of Investment | Maturity | Par Amount (2) | Cost(3) | Fair Value | %
of Net Assets (4) | |||||||||||||||
| Aurora Flight Sciences Corporation | Aerospace & Defense | Senior
Secured Second Lien Term Loan (11.25% Cash, 2.00% PIK) | 3/16/2016 | 16,461,545 | 16,461,545 | 16,461,545 | 2.7 | % | ||||||||||||||
| 16,461,545 | 16,461,545 | 16,461,545 | ||||||||||||||||||||
| Autosplice, Inc. (7)(9) | High Tech Industries | Senior Secured First Lien Term Loan (LIBOR + 11.50% Cash, 1.00% LIBOR Floor)(18) | 6/30/2019 | 14,817,844 | 14,817,844 | 14,773,761 | 2.4 | % | ||||||||||||||
| 14,817,844 | 14,817,844 | 14,773,761 | ||||||||||||||||||||
| Backcountry.com, Inc. | Retail | Senior Secured First Lien Term Loan (LIBOR + 7.25% Cash, 1.00% LIBOR Floor)(18) | 6/30/2020 | 2,583,333 | 2,583,333 | 2,583,333 | 0.4 | % | ||||||||||||||
| 2,583,333 | 2,583,333 | 2,583,333 | ||||||||||||||||||||
| BayDelta Maritime LLC | Transportation: Cargo | Warrants to purchase 10% of the outstanding equity | 6/30/2016 | - | 25,000 | 460,099 | 0.1 | % | ||||||||||||||
| - | 25,000 | 460,099 | ||||||||||||||||||||
| Be Green Packaging, LLC (7)(9) | Containers, Packaging & Glass | Senior Secured First Lien Term Loan (LIBOR + 10.00%, 1.00% LIBOR Floor)(18) | 12/13/2018 | 5,000,000 | 5,000,000 | 4,823,494 | 0.8 | % | ||||||||||||||
| Senior Secured First Lien Delayed Draw (LIBOR + 10.00%, 1.00% LIBOR Floor)(18) | 12/13/2018 | 3,416,667 | 3,416,667 | 3,294,714 | 0.5 | % | ||||||||||||||||
| Revolver (LIBOR + 10.00%, 1.00% LIBOR Floor)(18) | 12/13/2018 | 354,167 | 354,167 | 327,425 | 0.1 | % | ||||||||||||||||
| 1.13% Partnership Interest in RCAF VI CIV XXIII, L.P. | 12/13/2018 | - | 416,250 | 230,894 | 0.0 | % | ||||||||||||||||
| 8,770,834 | 9,187,084 | 8,676,527 | ||||||||||||||||||||
| Black Angus Steakhouses, LLC (7)(9) | Hotel, Gaming & Leisure | Senior Secured First Lien Term Loan (LIBOR + 9.00% Cash, 1.00% LIBOR Floor)(17) | 4/24/2020 | 8,111,607 | 8,111,607 | 8,111,607 | 1.3 | % | ||||||||||||||
| Senior Secured First Lien Delayed Draw (LIBOR + 9.00%, 1.00% LIBOR Floor) | 4/24/2020 | - | - | - | 0.0 | % | ||||||||||||||||
| Revolver (LIBOR + 9.00%, 1.00% LIBOR Floor) | 4/24/2020 | 446,429 | 446,429 | 446,429 | 0.1 | % | ||||||||||||||||
| 8,558,036 | 8,558,036 | 8,558,036 | ||||||||||||||||||||
| Brantley Transportation LLC (11) | Energy: Oil & Gas | Senior Secured First Lien Term Loan (12.00%) | 8/2/2017 | 9,000,000 | 9,100,912 | 6,332,324 | 1.0 | % | ||||||||||||||
| 9,000,000 | 9,100,912 | 6,332,324 | ||||||||||||||||||||
| California Products Corporation | Chemicals, Plastics & Rubber | Senior Secured Second Lien Term Loan (13.00%) | 5/27/2019 | 13,750,000 | 13,750,000 | 13,837,313 | 2.2 | % | ||||||||||||||
| 13,750,000 | 13,750,000 | 13,837,313 | ||||||||||||||||||||
| Calloway Laboratories, Inc. | Healthcare & Pharmaceuticals | Senior Secured First Lien Term Loan (17.00% PIK) (10) | 9/30/2016 | 38,860,511 | 29,573,477 | - | 0.0 | % | ||||||||||||||
| Warrants to purchase 15.00% of the outstanding equity | 9/30/2016 | - | 68,433 | - | 0.0 | % | ||||||||||||||||
| 38,860,511 | 29,641,910 | - | ||||||||||||||||||||
| F-17 |
| Company (1) | Industry | Type of Investment | Maturity | Par Amount (2) | Cost(3) | Fair Value | %
of Net Assets (4) | |||||||||||||||
| Capstone Nutrition | Healthcare & Pharmaceuticals | Senior Secured First Lien Term Loan (LIBOR + 11.50% Cash, 1.00% PIK, 1.00% LIBOR Floor)(18) | 4/28/2019 | 20,085,144 | 20,085,144 | 20,109,849 | 3.2 | % | ||||||||||||||
| 384.62 Units of Common Stock (12) | 4/28/2019 | - | 400,000 | 731,126 | 0.1 | % | ||||||||||||||||
| 20,085,144 | 20,485,144 | 20,840,975 | ||||||||||||||||||||
| CP OPCO LLC | Services: Consumer | Senior Secured First Lien Term Loan (LIBOR + 6.75% Cash, 1.00% LIBOR Floor)(18) | 9/30/2020 | 17,000,000 | 17,000,000 | 17,000,000 | 2.7 | % | ||||||||||||||
| 17,000,000 | 17,000,000 | 17,000,000 | ||||||||||||||||||||
| ContMid Intermediate Inc.(11) | Automotive | Senior Secured Second Lien Term Loan (LIBOR + 9.00% Cash, 1.00% LIBOR Floor)(17) | 10/25/2019 | 15,000,000 | 15,000,000 | 14,811,049 | 2.4 | % | ||||||||||||||
| 15,000,000 | 15,000,000 | 14,811,049 | ||||||||||||||||||||
| ConvergeOne Holdings Corporation | Telecommunications | Senior Secured Second Lien Term Loan (LIBOR + 8.00% Cash, 1.00% LIBOR Floor)(18) | 6/17/2021 | 12,500,000 | 12,391,902 | 12,320,250 | 2.0 | % | ||||||||||||||
| 12,500,000 | 12,391,902 | 12,320,250 | ||||||||||||||||||||
| Crow Precision Components LLC | Aerospace & Defense | Senior Secured First Lien Term Loan (LIBOR + 8.50% Cash, 1.00% LIBOR Floor)(17) | 9/30/2019 | 14,000,000 | 14,000,000 | 13,998,510 | 2.3 | % | ||||||||||||||
| 250 units of outstanding equity in Wingman Holdings, Inc. | 9/30/2019 | - | 500,000 | 589,147 | 0.1 | % | ||||||||||||||||
| 14,000,000 | 14,500,000 | 14,587,657 | ||||||||||||||||||||
| DHISCO Electronic Distribution, Inc. (7)(11) | Hotel, Gaming & Leisure | Senior Secured First Lien Term Loan A (LIBOR + 9.00%, 1.50% LIBOR Floor) | 11/10/2019 | 31,238,095 | 31,238,095 | 31,479,253 | 5.1 | % | ||||||||||||||
| Senior Secured First Lien Term Loan B (10.50% PIK) | 2/10/2018 | 6,278,067 | 6,278,067 | 6,301,164 | 1.0 | % | ||||||||||||||||
| Revolving Credit Facility (LIBOR + 9.00%, 1.50% LIBOR Floor)(23) | 5/10/2017 | - | - | - | 0.0 | % | ||||||||||||||||
| Equity - 1,230,769 Units(21) | 2/10/2018 | - | 1,230,769 | 2,378,890 | 0.4 | % | ||||||||||||||||
| 37,516,162 | 38,746,931 | 40,159,307 | ||||||||||||||||||||
| DLR Restaurants LLC (11) | Hotel, Gaming & Leisure | Senior Secured First Lien Term Loan (11.00% Cash, 2.50% PIK) | 4/18/2018 | 23,512,686 | 23,512,686 | 23,226,501 | 3.7 | % | ||||||||||||||
| Unsecured Debt (12.00% Cash, 4.00% PIK) | 4/18/2018 | 276,092 | 276,092 | 272,037 | 0.0 | % | ||||||||||||||||
| 23,788,778 | 23,788,778 | 23,498,538 | ||||||||||||||||||||
| F-18 |
| Company (1) | Industry | Type of Investment | Maturity | Par Amount (2) | Cost(3) | Fair Value | %
of Net Assets (4) | |||||||||||||||
| DreamFinders Homes LLC (9) | Construction & Building | Senior Secured First Lien Term Loan B (LIBOR + 14.50% Cash) | 10/1/2018 | 14,091,194 | 13,971,357 | 14,140,514 | 2.3 | % | ||||||||||||||
| 5,000 units of outstanding equity | 10/1/2018 | - | 180,000 | 1,929,761 | 0.3 | % | ||||||||||||||||
| 14,091,194 | 14,151,357 | 16,070,275 | ||||||||||||||||||||
| Dynamic Energy Services International LLC | Energy: Oil & Gas | Senior Secured First Lien Term Loan (LIBOR + 8.50% Cash, 1.00% LIBOR Floor)(17) | 3/6/2018 | 17,575,000 | 17,575,000 | 17,042,829 | 2.7 | % | ||||||||||||||
| 17,575,000 | 17,575,000 | 17,042,829 | ||||||||||||||||||||
| Essex Crane Rental Corp. (11) | Construction & Building | Senior Secured First Lien Term Loan (LIBOR + 12.50% Cash, 1.00% LIBOR Floor)(18) | 5/13/2019 | 20,000,000 | 20,000,000 | 19,325,800 | 3.1 | % | ||||||||||||||
| 20,000,000 | 20,000,000 | 19,325,800 | ||||||||||||||||||||
| FKI Security Group LLC (11) | Capital Equipment | Senior Secured First Lien Term Loan (LIBOR + 8.50% Cash, 1.00% LIBOR Floor)(18) | 3/30/2020 | 14,906,250 | 14,906,250 | 14,616,174 | 2.4 | % | ||||||||||||||
| 14,906,250 | 14,906,250 | 14,616,174 | ||||||||||||||||||||
| Footprint Acquisition LLC | Services: Business | Senior Secured First Lien Term Loan (LIBOR + 8.00% Cash)(17) | 2/27/2020 | 5,250,102 | 5,250,103 | 5,151,828 | 0.8 | % | ||||||||||||||
| Preferred Equity (8.75% PIK) | 2/27/2020 | 5,151,581 | 5,151,581 | 4,652,001 | 0.8 | % | ||||||||||||||||
| 150.0 units of Common Stock(22) | 2/27/2020 | - | - | - | 0.0 | % | ||||||||||||||||
| 10,401,683 | 10,401,684 | 9,803,829 | ||||||||||||||||||||
| Freedom Powersports LLC(7)(9) | Automotive | Senior Secured First Lien Term Loan (LIBOR + 11.50% Cash, 1.50% LIBOR Floor)(18) | 9/26/2019 | 10,200,000 | 10,200,000 | 10,268,663 | 1.7 | % | ||||||||||||||
| Senior Secured First Lien Delayed Draw (LIBOR + 11.50% Cash, 1.50% LIBOR Floor) | 9/26/2019 | 3,000,000 | 3,000,000 | 3,032,312 | 0.5 | % | ||||||||||||||||
| 13,200,000 | 13,200,000 | 13,300,975 | ||||||||||||||||||||
| Harrison Gypsum LLC (11) | Metals & Mining | Senior Secured First Lien Term Loan (LIBOR + 8.50% Cash, 0.50% PIK, 1.50% LIBOR Floor)(17) | 12/21/2018 | 56,134,983 | 56,134,983 | 55,225,035 | 8.9 | % | ||||||||||||||
| 56,134,983 | 56,134,983 | 55,225,035 | ||||||||||||||||||||
| Heligear Acquisition Co. | Aerospace & Defense | Senior Secured First Lien Note (10.25% Cash) | 10/15/2019 | 20,000,000 | 20,000,000 | 20,523,479 | 3.3 | % | ||||||||||||||
| 20,000,000 | 20,000,000 | 20,523,479 | ||||||||||||||||||||
| Help/Systems LLC | Services: Business | Senior Secured Second Lien Term Loan (LIBOR + 8.50% Cash, 1.00% LIBOR Floor)(17) | 6/28/2020 | 15,000,000 | 15,000,000 | 15,150,000 | 2.5 | % | ||||||||||||||
| 15,000,000 | 15,000,000 | 15,150,000 | ||||||||||||||||||||
| F-19 |
| Company (1) | Industry | Type of Investment | Maturity | Par Amount (2) | Cost(3) | Fair Value | %
of Net Assets (4) | |||||||||||||||
| JD Norman Industries, Inc. | Automotive | Senior Secured First Lien Term Loan (LIBOR + 10.25% Cash)(17) | 3/6/2019 | 22,500,000 | 22,500,000 | 22,183,434 | 3.6 | % | ||||||||||||||
| 22,500,000 | 22,500,000 | 22,183,434 | ||||||||||||||||||||
| Jordan Reses Supply Company LLC | Healthcare & Pharmaceuticals | Senior Secured Second Lien Term Loan (LIBOR + 11.00%, 1.00% LIBOR Floor) | 4/24/2020 | 20,000,000 | 20,000,000 | 20,349,811 | 3.3 | % | ||||||||||||||
| 20,000,000 | 20,000,000 | 20,349,811 | ||||||||||||||||||||
| Lighting Science Group Corporation | Containers, Packaging & Glass | Senior Secured Second Lien Term (LIBOR + 10.00% Cash, 2.00% PIK)(18) | 2/19/2019 | 15,730,619 | 15,014,318 | 15,055,776 | 2.4 | % | ||||||||||||||
| Warrants to purchase 2.36% of the outstanding equity | 2/19/2019 | - | 955,680 | 353,080 | 0.1 | % | ||||||||||||||||
| 15,730,619 | 15,969,998 | 15,408,856 | ||||||||||||||||||||
| Lucky Strike Entertainment, L.L.C. | Hotel, Gaming & Leisure | Senior Secured Second Lien Term Loan (LIBOR + 11.00% Cash, 1.00% LIBOR Floor, 2.00% PIK)(18) | 12/24/2019 | 10,254,472 | 10,254,472 | 10,163,515 | 1.6 | % | ||||||||||||||
| 10,254,472 | 10,254,472 | 10,163,515 | ||||||||||||||||||||
| Lydell Jewelry Design Studio LLC (11) | Consumer goods: Non-durable | Senior Secured First Lien Term Loan (LIBOR + 5.50% Cash, 7.50% PIK, 1.50% LIBOR Floor)(17) | 9/13/2018 | 14,436,386 | 14,195,568 | 11,888,075 | 1.9 | % | ||||||||||||||
| Warrants to purchase 13.3% of the outstanding membership units | 9/13/2018 | - | - | - | 0.0 | % | ||||||||||||||||
| 14,436,386 | 14,195,568 | 11,888,075 | ||||||||||||||||||||
| Merchant Cash and Capital LLC (9) | Banking, Finance, Insurance & Real Estate | Senior Secured First Lien Delayed Draw (LIBOR + 8.00% Cash, 3.00% LIBOR Floor)(17) | 3/4/2016 | 17,500,000 | 17,500,000 | 17,547,775 | 2.8 | % | ||||||||||||||
| Senior Secured Second Lien Term Loan (12.00% Cash) | 8/19/2016 | 15,000,000 | 15,000,000 | 14,978,850 | 2.4 | % | ||||||||||||||||
| 32,500,000 | 32,500,000 | 32,526,625 | ||||||||||||||||||||
| Meridian Behavioral Health LLC (7)(9) | Healthcare & Pharmaceuticals | Senior
Secured First Lien Term Loan A (LIBOR + 11.50%, 2.50% LIBOR Floor)(18) | 11/14/2016 | 10,289,141 | 10,122,094 | 10,289,141 | 1.7 | % | ||||||||||||||
| Senior Secured First Lien Term Loan B (LIBOR + 11.50%, 2.50% LIBOR Floor)(18) | 11/14/2016 | 6,600,000 | 6,600,000 | 6,600,000 | 1.1 | % | ||||||||||||||||
| Warrants to purchase 8% of the outstanding equity | 11/14/2016 | - | 536,296 | 5,431,566 | 0.9 | % | ||||||||||||||||
| 16,889,141 | 17,258,390 | 22,320,707 | ||||||||||||||||||||
| Miratech Intermediate Holdings, Inc. (9)(11) | Automotive | Senior Secured First Lien Term Loan (LIBOR + 9.00% Cash, 1.00% LIBOR Floor, 2% PIK)(17) | 5/9/2019 | 13,756,657 | 13,756,657 | 13,580,572 | 2.2 | % | ||||||||||||||
| 13,756,657 | 13,756,657 | 13,580,572 | ||||||||||||||||||||
| F-20 |
| Company (1) | Industry | Type of Investment | Maturity | Par Amount (2) | Cost(3) | Fair Value | %
of Net Assets (4) | |||||||||||||||
| Momentum Telecom, Inc. | Telecommunications | Senior Secured First Lien Term Loan (LIBOR + 8.50% Cash, 1.00% LIBOR Floor)(17) | 3/10/2019 | 9,140,653 | 9,140,653 | 9,274,290 | 1.5 | % | ||||||||||||||
| 9,140,653 | 9,140,653 | 9,274,290 | ||||||||||||||||||||
| Nation Safe Drivers Holdings, Inc. | Banking, Finance, Insurance & Real Estate | Senior Secured Second Lien Term Loan (LIBOR + 8.00% Cash, 2.00% LIBOR Floor)(18) | 9/29/2020 | 35,278,846 | 35,278,846 | 35,302,130 | 5.7 | % | ||||||||||||||
| 35,278,846 | 35,278,846 | 35,302,130 | ||||||||||||||||||||
| Nielsen & Bainbridge LLC | Consumer goods: Durable | Senior Secured Second Lien Term Loan (LIBOR + 9.25% Cash, 1.00% LIBOR Floor)(17) | 8/15/2021 | 25,000,000 | 25,000,000 | 24,714,648 | 4.0 | % | ||||||||||||||
| 25,000,000 | 25,000,000 | 24,714,648 | ||||||||||||||||||||
| Northern Lights MIDCO LLC | Banking, Finance, Insurance & Real Estate | Senior Secured First Lien Term Loan (LIBOR + 9.50% Cash, 1.50% LIBOR Floor) | 11/24/2019 | 4,523,750 | 4,523,750 | 4,570,584 | 0.7 | % | ||||||||||||||
| 4,523,750 | 4,523,750 | 4,570,584 | ||||||||||||||||||||
| NorthStar Group Services, Inc. | Construction & Building | Unsecured Debt (2.50% Cash, 15.50% PIK) | 10/24/2019 | 23,181,705 | 23,181,705 | 23,181,705 | 3.7 | % | ||||||||||||||
| 23,181,705 | 23,181,705 | 23,181,705 | ||||||||||||||||||||
| Oxford Mining Company, LLC (9) | Metals & Mining | Senior Secured First Lien Term Loan (LIBOR + 8.50% Cash, 3.00% PIK, 0.75% LIBOR Floor) | 12/31/2018 | 20,160,994 | 20,160,994 | 19,387,166 | 3.1 | % | ||||||||||||||
| 20,160,994 | 20,160,994 | 19,387,166 | ||||||||||||||||||||
| The Plastics Group, Inc. | Chemicals, Plastics & Rubber | Senior Secured First Lien Term Loan (11.00% Cash, 2.00% PIK) | 2/28/2019 | 21,427,726 | 21,427,726 | 21,083,168 | 3.4 | % | ||||||||||||||
| 21,427,726 | 21,427,726 | 21,083,168 | ||||||||||||||||||||
| Point.360 (7) | Services: Business | Senior Secured First Lien Term Loan (LIBOR + 6.00% Cash)(18) | 7/8/2020 | 320,000 | 320,000 | 320,000 | 0.1 | % | ||||||||||||||
| Equity - 479,283 Common Shares(24) | 7/8/2020 | - | 129,406 | 479,283 | 0.1 | % | ||||||||||||||||
| Warrants to purchase 2.8% of the outstanding common shares (25) | 7/8/2020 | - | 52,757 | 272,711 | 0.0 | % | ||||||||||||||||
| 320,000 | 502,163 | 1,071,994 | ||||||||||||||||||||
| Prestige Industries LLC | Services: Business | Senior Secured Second Lien Term Loan (18.00% PIK) | 11/1/2017 | 7,932,041 | 7,879,441 | 7,280,186 | 1.2 | % | ||||||||||||||
| Warrants to purchase 0.63% of the outstanding common units | 11/1/2017 | - | 151,855 | - | 0.0 | % | ||||||||||||||||
| 7,932,041 | 8,031,296 | 7,280,186 | ||||||||||||||||||||
| Prince Mineral Holding Corp.(8) | Metals & Mining | Senior Secured First Lien Note (11.50%) | 12/15/2019 | 6,800,000 | 6,744,599 | 5,712,000 | 0.9 | % | ||||||||||||||
| 6,800,000 | 6,744,599 | 5,712,000 | ||||||||||||||||||||
| RCS Management Corporation & Specialized Medical Services, Inc. (7) | Healthcare & Pharmaceuticals | Senior Secured Second Lien Term Loan ( LIBOR + 11.00% Cash, 1.50% LIBOR Floor, 0.50% PIK)(17) | 2/29/2016 | 28,746,290 | 28,746,290 | 28,746,290 | 4.6 | % | ||||||||||||||
| 28,746,290 | 28,746,290 | 28,746,290 | ||||||||||||||||||||
| Red Skye Wireless LLC (7)(9) | Retail | Senior Secured First Lien Term Loan (LIBOR + 9.00% Cash, 1.00% LIBOR Floor)(17) | 6/27/2018 | 20,387,686 | 20,387,686 | 20,666,563 | 3.3 | % | ||||||||||||||
| 20,387,686 | 20,387,686 | 20,666,563 | ||||||||||||||||||||
| Reddy Ice Corporation | Beverage & Food | Senior Secured Second Lien Term Loan (LIBOR + 9.50% Cash, 1.25% LIBOR Floor)(17) | 11/1/2019 | 17,000,000 | 17,000,000 | 13,436,761 | 2.2 | % | ||||||||||||||
| 17,000,000 | 17,000,000 | 13,436,761 | ||||||||||||||||||||
| F-21 |
| Company (1) | Industry | Type of Investment | Maturity | Par Amount (2) | Cost(3) | Fair Value | %
of Net Assets (4) | |||||||||||||||
| Response Team Holdings, LLC | Construction & Building | Senior Secured First Lien Term Loan (LIBOR + 8.50% Cash, 1.00% PIK, 2.00% LIBOR Floor)(17) | 3/28/2019 | 25,537,850 | 25,537,850 | 25,305,455 | 4.1 | % | ||||||||||||||
| Preferred Equity (12.00% PIK) | 3/28/2019 | 5,549,736 | 5,218,954 | 5,077,731 | 0.8 | % | ||||||||||||||||
| Warrants to purchase 6.17% of the outstanding common units | 3/28/2019 | - | 429,012 | 837,967 | 0.1 | % | ||||||||||||||||
| 31,087,586 | 31,185,816 | 31,221,153 | ||||||||||||||||||||
| Safeworks LLC(11) | Capital Equipment | Unsecured Debt (12.00% Cash) | 1/31/2020 | 15,000,000 | 15,000,000 | 15,148,023 | 2.4 | % | ||||||||||||||
| 15,000,000 | 15,000,000 | 15,148,023 | ||||||||||||||||||||
| Sendero Drilling Company LLC (9) | Energy: Oil & Gas | Senior Secured First Lien Term Loan (LIBOR + 11.00% Cash)(17) | 3/18/2019 | 13,026,628 | 12,427,454 | 13,106,872 | 2.1 | % | ||||||||||||||
| Warrants to purchase 5.52% of the outstanding common units | 3/18/2019 | - | 793,523 | 4,353,269 | 0.7 | % | ||||||||||||||||
| 13,026,628 | 13,220,977 | 17,460,141 | ||||||||||||||||||||
| Seotowncenter, Inc.(11) | Services: Business | Senior Secured First Lien Term Loan (LIBOR + 9.00% Cash, 1.00% LIBOR Floor)(18) | 9/11/2019 | 27,500,000 | 27,500,000 | 27,428,182 | 4.4 | % | ||||||||||||||
| 3,249.697 shares of Common Stock(13) | 9/11/2019 | - | 500,000 | 1,184,303 | 0.2 | % | ||||||||||||||||
| 27,500,000 | 28,000,000 | 28,612,485 | ||||||||||||||||||||
| Ship Supply Acquisition Corporation (7) | Services: Business | Senior Secured First Lien Term Loan (LIBOR + 8.00% Cash, 1.00% LIBOR Floor)(18) | 7/31/2020 | 8,498,664 | 8,498,664 | 8,498,579 | 1.4 | % | ||||||||||||||
| Revolver (LIBOR + 8.00% Cash, 1.00% LIBOR Floor)(18)(19) | 7/31/2016 | 414,569 | 414,569 | 414,569 | 0.1 | % | ||||||||||||||||
| 8,913,233 | 8,913,233 | 8,913,148 | ||||||||||||||||||||
| Stancor, Inc. | Services: Business | Senior Secured First Lien Term Loan (LIBOR + 8.00% Cash, 0.75% LIBOR Floor)(17) | 8/19/2019 | 7,000,000 | 7,000,000 | 6,815,830 | 1.1 | % | ||||||||||||||
| 263,814.43 Class A Units(14) | 8/19/2019 | - | 263,814 | 267,114 | 0.0 | % | ||||||||||||||||
| 7,000,000 | 7,263,814 | 7,082,944 | ||||||||||||||||||||
| T. Residential Holdings LLC | Banking, Finance, Insurance & Real Estate | Senior Secured First Lien Term Loan (12.00%) | 3/28/2019 | 19,500,000 | 19,500,000 | 19,500,000 | 3.1 | % | ||||||||||||||
| 19,500,000 | 19,500,000 | 19,500,000 | ||||||||||||||||||||
| Taylored Freight Services LLC | Services: Business | Senior Secured Second Lien Term Loan (LIBOR + 9.50% Cash, 2.00% PIK, 1.50% LIBOR Floor)(18) | 11/1/2017 | 15,330,548 | 15,330,548 | 14,274,887 | 2.3 | % | ||||||||||||||
| 15,330,548 | 15,330,548 | 14,274,887 | ||||||||||||||||||||
| F-22 |
| Company (1) | Industry | Type of Investment | Maturity | Par Amount (2) | Cost(3) | Fair Value | %
of Net Assets (4) | |||||||||||||||
| Tempel Steel Company(8) | Metals & Mining | Senior Secured First Lien Note (12.00%) | 8/15/2016 | 11,000,000 | 10,952,851 | 10,145,174 | 1.7 | % | ||||||||||||||
| 11,000,000 | 10,952,851 | 10,145,174 | ||||||||||||||||||||
| Tenere Acquisition Corp.(7)(9) | Chemicals, Plastics & Rubber | Senior Secured First Lien Term Loan (11.00% Cash, 2.00% PIK) | 12/15/2017 | 11,359,842 | 11,359,842 | 11,627,039 | 1.9 | % | ||||||||||||||
| 11,359,842 | 11,359,842 | 11,627,039 | ||||||||||||||||||||
| Transtelco Inc. | Telecommunications | Senior Secured First Lien Term Loan (LIBOR + 9.00% Cash, 1.50% LIBOR Floor)(17) | 11/19/2017 | 18,864,000 | 18,864,000 | 18,924,365 | 3.1 | % | ||||||||||||||
| 18,864,000 | 18,864,000 | 18,924,365 | ||||||||||||||||||||
| Untangle, Inc. | Services: Business | Senior Secured First Lien Term Loan (LIBOR + 12.00% Cash)(17) | 4/18/2019 | 9,527,500 | 9,527,500 | 9,527,690 | 1.5 | % | ||||||||||||||
| 9,527,500 | 9,527,500 | 9,527,690 | ||||||||||||||||||||
| Velocity Pooling Vehicle LLC | Automotive | Senior Secured Second Lien Term Loan (LIBOR + 7.25% Cash, 1.00% LIBOR Floor)(17) | 5/14/2022 | 24,000,000 | 21,008,149 | 19,832,766 | 3.2 | % | ||||||||||||||
| 24,000,000 | 21,008,149 | 19,832,766 | ||||||||||||||||||||
| Watermill-QMC Midco, Inc. | Automotive | Senior Secured First Lien Term Loan (13.00% Cash) | 6/30/2020 | 15,409,609 | 15,409,609 | 15,409,609 | 2.5 | % | ||||||||||||||
| 1.3% Partnership Interest in Watermill-QMC Midco Inc. (6) | 6/30/2020 | - | 295,362 | 295,362 | 0.0 | % | ||||||||||||||||
| 15,409,609 | 15,704,971 | 15,704,971 | ||||||||||||||||||||
| Wheels Up Partners LLC (11) | Aerospace & Defense | Senior Secured First Lien Delayed Draw (LIBOR + 8.55% Cash, 1.00% LIBOR Floor)(18) | 10/15/2021 | 18,230,736 | 18,230,736 | 18,311,863 | 3.1 | % | ||||||||||||||
| 18,230,736 | 18,230,736 | 18,311,863 | ||||||||||||||||||||
| Window Products, Inc. | Construction & Building | Senior Secured Second Lien Term Loan (LIBOR + 10.75% Cash, 1.00% LIBOR Floor)(18) | 12/27/2019 | 14,000,000 | 14,000,000 | 14,140,000 | 2.3 | % | ||||||||||||||
| 14,000,000 | 14,000,000 | 14,140,000 | ||||||||||||||||||||
| Subtotal Non-Controlled / Non-Affiliated Investments | $ | 1,182,862,012 | $ | 1,175,785,384 | $ | 1,131,893,787 | ||||||||||||||||
| F-23 |
| Company (1) | Industry | Type of Investment | Maturity | Par Amount (2) | Cost(3) | Fair Value | %
of Net Assets (4) |
|||||||||||||||
| Control Investments: (5) | ||||||||||||||||||||||
| MCC Senior Loan Strategy JV I LLC | Multisector Holdings | Equity - 87.5% ownership of MCC Senior Loan Strategy JV I LLC | - | 14,437,500 | 14,215,834 | 2.3 | % | |||||||||||||||
| - | 14,437,500 | 14,215,834 | ||||||||||||||||||||
| OmniVere LLC | Services: Business | Senior Secured First Lien Term Loan (LIBOR + 12.00% Cash, 1.00% PIK)(18) | 5/5/2019 | 17,805,885 | 17,406,591 | 17,805,885 | 2.9 | % | ||||||||||||||
| Unsecured Debt (8.00% PIK) (10) | 7/24/2025 | 12,971,722 | 12,482,835 | 7,059,693 | 1.1 | % | ||||||||||||||||
| Warrants to purchase outstanding equity (20) | 5/5/2019 | - | 872,698 | - | 0.0 | % | ||||||||||||||||
| 30,777,607 | 30,762,124 | 24,865,578 | ||||||||||||||||||||
| United Road Towing Inc. | Services: Business | Senior Secured Second Lien Term Loan (LIBOR + 9.00% Cash)(18) | 2/21/2020 | 17,000,000 | 17,000,000 | 16,489,975 | 2.7 | % | ||||||||||||||
| Preferred Equity Class C (8.00% PIK) (10) | 2/21/2020 | 18,802,789 | 17,466,375 | 17,747,200 | 2.9 | % | ||||||||||||||||
| Preferred Equity Class C-1 (8.00% PIK) (10) | 2/21/2020 | 1,326,945 | 1,326,946 | 27,028 | 0.0 | % | ||||||||||||||||
| Preferred Equity Class A-2 (8.00% PIK) (10) | 2/21/2020 | 4,996,578 | 4,664,855 | 690,695 | 0.1 | % | ||||||||||||||||
| 65,809.73 Class B Common Units(15) | 2/21/2020 | - | 1,098,096 | 161,892 | 0.0 | % | ||||||||||||||||
| 42,126,312 | 41,556,272 | 35,116,790 | ||||||||||||||||||||
| Subtotal Control Investments | $ | 72,903,919 | $ | 86,755,896 | $ | 74,198,202 | ||||||||||||||||
| Affiliated Investments: | ||||||||||||||||||||||
| US Multifamily, LLC | Banking, Finance, Insurance & Real Estate | Senior Secured First Lien Term Loan (10.00% Cash) | 9/10/2019 | 6,670,000 | 6,670,000 | 6,670,000 | 1.1 | % | ||||||||||||||
| Preferred Equity - 33,300 Units(16) | 9/10/2019 | - | 3,330,000 | 3,330,000 | 0.5 | % | ||||||||||||||||
| 6,670,000 | 10,000,000 | 10,000,000 | ||||||||||||||||||||
| Subtotal Affiliated Investments | $ | 6,670,000 | $ | 10,000,000 | $ | 10,000,000 | ||||||||||||||||
| Total Investments, September 30, 2015 | $ | 1,262,435,930 | $ | 1,272,541,280 | $ | 1,216,091,989 | 196.2 | % | ||||||||||||||
| (1) All of our investments are domiciled in the United States. Certain investments also have international operations. |
| (2) Par amount includes accumulated PIK interest and is net of repayments. |
| (3) Gross unrealized appreciation, gross unrealized depreciation, and net depreciation for federal income tax purposes totaled $32.9 million, $71.4 million and $38.5 million, respectively. The tax cost of investments is $1,253.0 million. |
| (4) Percentage is based on net assets of $619,920,384 as of September 30, 2015. |
| (5) Control Investments are defined by the Investment Company Act of 1940 ("1940 Act") as investments in companies in which the Company owns more than 25% of the voting securities or maintains greater than 50% of the board representation. |
| (6) 12,711 Units represents 1.3% of partnership interest in Watermill-QMC Partners, LP. |
| (7) The investment has an unfunded commitment as of September 30, 2015 (See note 8). |
| (8) Securities are exempt from registration under Rule 144a of the Securities Act of 1933. These securities represent a fair value of $15.9 million and 2.6% of net assets as of September 30, 2015 and are considered restricted. |
| (9) Includes an analysis of the value of any unfunded loan commitments. |
| (10) The investment was on non-accrual status as of September 30, 2015. |
| (11) A portion of this investment was sold via a participation agreement (See note 3). |
| (12) 384.62 Units represents 1.55% ownership of Cornerstone Research & Development Inc. |
| (13) 3,249.697 shares of Common Stock represents 2.917% ownership of Boostability Holdings, Inc. |
| (14) 263,814.43 Class A Units represents 0.882% ownership of Stancor, Inc. |
| (15) 65,809.73 Class B Common Units Represents 65.8% ownership of United Road Towing, Inc. |
| (16) 33,300 Units represents 18.167% ownership of US Multifamily, LLC. |
| (17) The interest rate on these loans is subject to a base rate plus 1 Month London Interbank Offering Rate ("LIBOR"), which at September 30, 2015 was 0.20%. As the interest rate is subject to a minimum LIBOR Floor which was greater than the 1 Month LIBOR rate at September 30, 2015, the prevailing rate in effect at September 30, 2015 was the base rate plus the LIBOR Floor. |
| (18) The interest rate on these loans is subject to a base rate plus 3 Month LIBOR, which at September 30, 2015 was 0.33%. As the interest rate is subject to a minimum LIBOR Floor which was greater than the 3 Month LIBOR rate at September 30, 2015, the prevailing rate in effect at September 30, 2015 was the base rate plus the LIBOR Floor. |
| (19) The investment earns 0.50% commitment fee on all unused commitment. At September 30, 2015, there was $621,853.46 of unused commitment. |
| (20) 5,055.56 Units of Common Stock, represents 50.56% of the outstanding equity |
| (21) 1,230,769 Units represents 4.17% ownership of Pegasus Solutions, Inc. |
| (22) 150 Units represents 15.0% of Footprint Holding Company, Inc. |
| (23) The investment earns 0.50% commitment fee on all unused commitment. At September 30, 2015, there was $3,047,619.05 of unused commitment. |
| (24) 479,283 Common Shares represents 3.8% of the outstanding common shares in Point.360. |
| (25) 351,713 Units represents 2.8% of the outstanding common shares in Point.360. |
| F-24 |
Notes to Consolidated Financial Statements
September 30, 2016
Note 1. Organization
Medley Capital Corporation (the “Company”, “we” and “us”) is a non-diversified closed end management investment company incorporated in Delaware that has elected to be treated and is regulated as a business development company (“BDC”) under the Investment Company Act of 1940, as amended (the “1940 Act”). We completed our initial public offering (“IPO”) and commenced operations on January 20, 2011. The Company has elected and qualified to be treated for U.S. federal income tax purposes as a regulated investment company (“RIC”) under subchapter M of the Internal Revenue Code of 1986, as amended (the “Code”). We are externally managed and advised by MCC Advisors LLC (“MCC Advisors”), a registered investment adviser under the Investment Advisers Act of 1940, as amended (the “Advisers Act”), pursuant to an investment management agreement. MCC Advisors is a majority owned subsidiary of Medley LLC, which is controlled by Medley Management Inc., a publicly traded asset management firm, which in turn is controlled by Medley Group LLC, an entity wholly-owned by the senior professionals of Medley LLC. We use the term “Medley” to refer collectively to the activities and operations of Medley Capital LLC, Medley LLC, Medley Management Inc., Medley Group LLC, MCC Advisors, associated investment funds and their respective affiliates.
Medley Capital BDC LLC (the “LLC”), a Delaware limited liability company, was formed on April 23, 2010. On January 18, 2011, the LLC, in accordance with Delaware law, converted into Medley Capital Corporation, a Delaware corporation, and on January 20, 2011, the Company filed an election to be regulated as a BDC under the 1940 Act.
On January 20, 2011, the Company consummated its IPO, sold 11,111,112 shares of common stock at $12.00 per share and commenced its operations and investment activities. On February 24, 2011, an additional 450,000 shares of common stock were issued at a price of $12.00 per share pursuant to the partial exercise of the underwriters’ option to purchase additional shares. Net of underwriting fees and offering costs, the Company received total cash proceeds of approximately $129.6 million.
On January 20, 2011, the Company’s shares began trading on the New York Stock Exchange (“NYSE”) under the symbol “MCC”.
Prior to the consummation of our IPO, Medley Opportunity Fund LP (“MOF LP”), a Delaware limited partnership, and Medley Opportunity Fund, Ltd. (“MOF LTD”), a Cayman Islands exempted limited liability company, which are managed by an affiliate of MCC Advisors, transferred all of their respective interests in six loan participations in secured loans to middle market companies with a combined fair value, plus payment-in-kind interest and accrued interest thereon, of approximately $84.95 million (the “Loan Assets”) to MOF I BDC LLC (“MOF I BDC”), a Delaware limited liability company, in exchange for membership interests in MOF I BDC. As a result, MOF LTD owned approximately 90% of the outstanding MOF I BDC membership interests and MOF LP owned approximately 10% of the outstanding MOF I BDC membership interests.
On January 18, 2011, each of MOF LTD and MOF LP contributed their respective MOF I BDC membership interests to the LLC in exchange for LLC membership interests. As a result, MOF I BDC became a wholly-owned subsidiary of the LLC. As a result of the LLC’s conversion noted above, MOF LTD and MOF LP’s LLC membership interests were exchanged for 5,759,356 shares of the Company’s common stock at $14.75 per share. On February 23, 2012, MOF LTD and MOF LP collectively sold 4,406,301 shares of common stock in an underwritten public offering. See Note 7 for further information.
On March 26, 2013, our wholly-owned subsidiary, Medley SBIC LP (“SBIC LP”), a Delaware limited partnership which we own directly and through our wholly-owned subsidiary, Medley SBIC GP LLC, received a license from Small Business Administration (“SBA”) to operate as a Small Business Investment Company (“SBIC”) under Section 301(c) of the Small Business Investment Company Act of 1958.
The Company has formed and expects to continue to form certain taxable subsidiaries (the “Taxable Subsidiaries”), which are taxed as corporations for federal income tax purposes. These Taxable Subsidiaries allow us to hold equity securities of portfolio companies organized as pass-through entities while continuing to satisfy the requirements of a RIC under the Code.
The Company’s investment objective is to generate current income and capital appreciation by lending to privately-held middle market companies, primarily through directly originated transactions, to help these companies fund acquisitions, growth or refinancing. The portfolio generally consists of senior secured first lien term loans and senior secured second lien term loans. In many of our investments, we will receive warrants or other equity participation features which we believe will increase the total investment returns.
| F-25 |
Note 2. Significant Accounting Policies
Basis of Presentation
The Company follows the accounting and reporting guidance in the Financial Accounting Standards Board Accounting Standards Codification 946 (“ASC 946”). The accompanying consolidated financial statements have been prepared on the accrual basis of accounting in conformity with U.S. generally accepted accounting principles (“GAAP”) and include the accounts of the Company and its wholly-owned subsidiary SBIC LP and its Taxable Subsidiaries. All references made to the “Company,” “we,” and “us” herein include Medley Capital Corporation and its consolidated subsidiaries, except as stated otherwise. Additionally, the accompanying consolidated financial statements of the Company and related financial information have been prepared pursuant to the requirements for reporting on Form 10-K and Article 10 of Regulation S-X of the Securities Act of 1933. In the opinion of management, the consolidated financial statements reflect all adjustments and reclassifications that are necessary for the fair presentation of financial results as of and for the periods presented. All intercompany balances and transactions have been eliminated.
Cash and Cash Equivalents
The Company considers cash equivalents to be highly liquid investments with original maturities of three months or less. Cash and cash equivalents include deposits in a money market account. The Company deposits its cash in a financial institution and, at times, such balance may be in excess of the Federal Deposit Insurance Corporation insurance limits.
As of September 30, 2016, $104.5 million is invested in an interest-bearing money market account, which is a level 1 investment (see Note 4).
Use of Estimates in the Preparation of Financial Statements
The preparation of financial statements in conformity with GAAP requires management to make estimates and assumptions that affect the reported amounts of assets and liabilities, and disclosure of contingent assets and liabilities at the date of the consolidated financial statements and the reported amounts of revenues and expenses during the reporting period. Actual results could differ from those estimates.
Offerings
On February 5, 2014, the Company completed a public offering of 6,000,000 shares of our common stock at a public offering price of $14.00 per share, raising approximately $81.1 million in net proceeds.
On April 28, 2014, the Company completed a public offering of 6,000,000 shares of our common stock at a public offering price of $13.25 per share, raising approximately $76.9 million in net proceeds.
On August 1, 2014, the Company entered into an “At-The-Market” (“ATM”) equity distribution agreement with Goldman, Sachs & Co., Barclays Capital Inc., Credit Suisse Securities (USA) LLC, J.P. Morgan Securities LLC, Keefe, Bruyette & Woods, Inc., BB&T Capital Markets, a division of BB&T Securities, LLC, Janney Montgomery Scott LLC, Ladenburg Thalmann & Co. Inc., MLV & Co. LLC, Maxim Group LLC, National Securities Corporation and Gilford Securities Incorporated, through which the Company could sell shares of its common stock having an aggregate offering price of up to $100.0 million. During the period from August 5, 2014 to September 30, 2014, the Company sold 671,278 shares of its common stock at an average price of $12.87 per share, and raised $8.7 million in net proceeds, under the ATM program.
On August 26, 2014, the Company completed a public offering of 5,000,000 shares of our common stock and an additional 750,000 shares of our common stock pursuant to the underwriters’ partial exercise of the over-allotment option at a public offering price of $13.02 per share, raising approximately $72.8 million in net proceeds.
Deferred Offering Costs
Deferred offering costs consist of fees and expenses incurred in connection with the public offering and sale of the Company’s common stock, including legal, accounting, printing fees and other related expenses, as well as costs incurred in connection with the filing of a shelf registration statement.
| F-26 |
Debt Issuance Costs
Debt issuance costs, incurred in connection with our credit facilities, unsecured notes and SBA Debentures (see Note 5) are deferred and amortized over the life of the respective facility or instrument.
Indemnification
In the normal course of business, the Company enters into contractual agreements that provide general indemnifications against losses, costs, claims and liabilities arising from the performance of individual obligations under such agreements. The Company has had no prior claims or payments pursuant to such agreements. The Company’s individual maximum exposure under these arrangements is unknown, as this would involve future claims that may be made against the Company that have not yet occurred. However, based on management’s experience, the Company expects the risk of loss to be remote.
Revenue Recognition
Interest income, adjusted for amortization of premiums and accretion of discounts, is recorded on an accrual basis. Dividend income, which represents dividends from equity investments and distributions from Taxable Subsidiaries, are recorded on ex-dividend date and when distribution is received, respectively.
Origination/closing, amendment and transaction break-up fees associated with investments in portfolio companies are recognized as income when we become entitled to such fees. Fee income for the years ended September 30, 2016, 2015, and 2014 was approximately $7.5 million, $10.7 million, and $29.1 million, respectively (see Note 9).
Prepayment penalties received by the Company for debt instruments paid back to the Company prior to the maturity date are recorded as income upon repayment of debt.
Administrative agent fees received by the Company are capitalized as deferred revenue and recorded as fee income when the services are rendered.
The Company holds debt investments in its portfolio that contain a payment-in-kind (“PIK”) interest provision. PIK interest, which represents contractually deferred interest added to the investment balance that is generally due at maturity, is recorded on the accrual basis to the extent such amounts are expected to be collected. PIK interest is not accrued if the Company does not expect the issuer to be able to pay all principal and interest when due. For the years ended September 30, 2016, 2015, and 2014, the Company earned approximately $12.5 million, $10.2 million, and $10.7 million in PIK, respectively.
Investment transactions are accounted for on a trade date basis. Realized gains or losses on investments are measured by the difference between the net proceeds from the disposition and the amortized cost basis of investment, without regard to unrealized gains or losses previously recognized. During the year ended September 30, 2016, $15.7 million of our realized loss related to certain non-cash restructuring transactions, which is recorded on the Consolidated Statements of Operations as a component of net realized gain/(loss) from investments. There were no realized gains or losses related to such non-cash restructuring transactions for the years ended September 30, 2015 and 2014. The Company reports changes in fair value of investments as a component of the net unrealized appreciation/(depreciation) on investments in the Consolidated Statements of Operations.
Management reviews all loans that become 90 days or more past due on principal or interest or when there is reasonable doubt that principal or interest will be collected for possible placement on management’s designation of non-accrual status. Interest receivable is analyzed regularly and may be reserved against when deemed uncollectible. Interest payments received on non-accrual loans may be recognized as income or applied to principal depending upon management’s judgment regarding collectability. Non-accrual loans are restored to accrual status when past due principal and interest is paid and, in management’s judgment, are likely to remain current, although we may make exceptions to this general rule if the loan has sufficient collateral value and is in the process of collection. At September 30, 2016, certain investments in nine portfolio companies held by the Company were on non-accrual status with a combined fair value of approximately $55.9 million, or 6.1% of the fair value of our portfolio. At September 30, 2015, certain investments in three portfolio companies held by the Company were on non-accrual status with a combined fair value of approximately $25.5 million, or 2.1% of the fair value of our portfolio. At September 30, 2014, certain investments in four portfolio companies held by the Company were on non-accrual status with a combined fair value of approximately $40.3 million, or 3.2% of the fair value of our portfolio.
Investment Classification
The Company classifies its investments in accordance with the requirements of the 1940 Act. Under the 1940 Act, we would be deemed to “control” a portfolio company if we owned more than 25% of its outstanding voting securities and/or had the power to exercise control over the management or policies of such portfolio company. We refer to such investments in portfolio companies that we “control” as “Control Investments.” Under the 1940 Act, we would be deemed to be an “Affiliated Person” of a portfolio company if we own between 5% and 25% of the portfolio company’s outstanding voting securities or we are under common control with such portfolio company. We refer to such investments in Affiliated Persons as “Affiliated Investments.”
| F-27 |
Valuation of Investments
The Company applies fair value accounting to all of its financial instruments in accordance with the 1940 Act and ASC Topic 820 - Fair Value Measurements and Disclosures (“ASC 820”). ASC 820 defines fair value, establishes a framework used to measure fair value and requires disclosures for fair value measurements. In accordance with ASC 820, the Company has categorized its financial instruments carried at fair value, based on the priority of the valuation technique, into a three-level fair value hierarchy as discussed in Note 4. Fair value is a market-based measure considered from the perspective of the market participant who holds the financial instrument rather than an entity specific measure. Therefore, when market assumptions are not readily available, the Company’s own assumptions are set to reflect those that management believes market participants would use in pricing the financial instrument at the measurement date.
Investments for which market quotations are readily available are valued at such market quotations, which are generally obtained from an independent pricing service or multiple broker-dealers or market makers. We weight the use of third-party broker quotations, if any, in determining fair value based on our understanding of the level of actual transactions used by the broker to develop the quote and whether the quote was an indicative price or binding offer. However, debt investments with remaining maturities within 60 days that are not credit impaired are valued at cost plus accreted discount, or minus amortized premium, which approximates fair value. Investments for which market quotations are not readily available are valued at fair value as determined by the Company’s Board of Directors based upon input from management and third party valuation firms. Because these investments are illiquid and because there may not be any directly comparable companies whose financial instruments have observable market values, these loans are valued using a fundamental valuation methodology, consistent with traditional asset pricing standards, that is objective and consistently applied across all loans and through time.
Investments in investment funds are valued at fair value. Fair values are generally determined utilizing the net asset value (“NAV”) supplied by, or on behalf of, management of each investment fund, which is net of management and incentive fees or allocations charged by the investment fund and is in accordance with the “practical expedient”, as defined by the Accounting Standards Update (“ASU”) 2009-12, Investments in Certain Entities that Calculate Net Asset Value per Share . NAVs received by, or on behalf of, management of each investment fund are based on the fair value of the investment funds’ underlying investments in accordance with policies established by management of each investment fund, as described in each of their financial statements and offering memorandum.
The methodologies utilized by the Company in estimating its fair value of its investments categorized as Level 3 generally fall into the following two categories:
| · | The “Market Approach” uses prices and other relevant information generated by market transactions involving identical or comparable (that is, similar) assets, liabilities, or a group of assets and liabilities, such as a business. |
| · | The “Income Approach” converts future amounts (for example, cash flows or income and expenses) to a single current (that is, discounted) amount. When the income approach is used, the fair value measurement reflects current market expectations about those future amounts. |
The Company uses third-party valuation firms to assist the board of directors in the valuation of its portfolio investments. The valuation reports generated by the third-party valuation firms consider the evaluation of financing and sale transactions with third parties, expected cash flows and market based information, including comparable transactions, performance multiples, and movement in yields of debt instruments, among other factors. Based on market data obtained from the third-party valuation firms, the Company uses a market yield analysis under the Income Approach or an enterprise model of valuation under the Market Approach, or a combination thereof. In applying the market yield analysis, the value of the Company’s loans is determined based upon inputs such as the coupon rate, current market yield, interest rate spreads of similar securities, the stated value of the loan, and the length to maturity. In applying the enterprise model, the Company uses a waterfall analysis, which takes into account the specific capital structure of the borrower and the related seniority of the instruments within the borrower’s capital structure into consideration. To estimate the enterprise value of the portfolio company, we weigh some or all of the traditional market valuation methods and factors based on the individual circumstances of the portfolio company in order to estimate the enterprise value.
The methodologies and information that the Company utilizes when applying the Market Approach for performing investments includes, among other things:
| · | valuations of comparable public companies (“Guideline Comparable Approach”), |
| · | recent sales of private and public comparable companies (“Guideline Comparable Approach”), |
| · | recent acquisition prices of the company, debt securities or equity securities (“Acquisition Price Approach”), |
| · | external valuations of the portfolio company, offers from third parties to buy the company (“Estimated Sales Proceeds Approach”), |
| F-28 |
| · | subsequent sales made by the company of its investments (“Expected Sales Proceeds Approach”); and |
| · | estimating the value to potential buyers. |
The methodologies and information that the Company utilizes when applying the Income Approach for performing investments includes:
| · | discounting the forecasted cash flows of the portfolio company or securities (Discounted Cash Flow (“DCF”) Approach); and |
| · | Black-Scholes model or simulation models or a combination thereof (Income Approach – Option Model) with respect to the valuation of warrants. |
For non-performing investments, we may estimate the liquidation or collateral value of the portfolio company’s assets and liabilities using an expected recovery model (Market Approach – Expected Recovery Analysis or Estimated Liquidation Proceeds).
We undertake a multi-step valuation process each quarter when valuing investments for which market quotations are not readily available, as described below:
| · | our quarterly valuation process begins with each portfolio investment being internally valued by the valuation professionals; |
| · | preliminary valuation conclusions are then documented and discussed with senior management; and |
| · | an independent valuation firm engaged by our board of directors reviews approximately one third of these preliminary valuations each quarter on a rotating quarterly basis on non-fiscal year-end quarters, such that each of these investments will be valued by independent valuation firms at least twice per annum when combined with the fiscal year-end review of all the investments by independent valuation firms. |
In addition, all of our investments are subject to the following valuation process:
| · | the audit committee of our board of directors reviews the preliminary valuations of the investment professionals, senior management and independent valuation firms; and |
| · | our board of directors discusses valuations and determines the fair value of each investment in our portfolio in good faith based on the input of MCC Advisors, the respective independent valuation firms and the audit committee. |
Due to the inherent uncertainty of determining the fair value of investments that do not have a readily available market value, the fair value of our investments may differ significantly from the values that would have been used had a readily available market value existed for such investments, and the differences could be material.
Fair Value of Financial Instruments
The carrying amounts of certain of our financial instruments, including cash and cash equivalents, accounts payable and accrued expenses, approximate fair value due to their short-term nature. The carrying amounts and fair values of our long-term obligations are discussed in Note 5.
Recent Accounting Pronouncements
In May 2014, the FASB issued ASU 2014-09, Revenue from Contracts with Customers (Topic 606), which provides that an entity should recognize revenue to depict the transfer of promised goods or services to customers in an amount that reflects the consideration to which the entity expects to be entitled in exchange for such goods or services. To achieve this core principle, an entity should apply the following steps: (1) identify the contracts with a customer, (2) identify the performance obligations in the contracts, (3) determine the transaction prices, (4) allocate the transaction prices to the performance obligations in the contracts, and (5) recognize revenue when, or as, the entity satisfies a performance obligation. The guidance also requires advanced disclosures regarding the nature, amount, timing and uncertainty of revenue and cash flows arising from an entity's contracts with customers. In March 2016, the FASB issued ASU 2016-08, Revenue from Contracts with Customers (Topic 606): Principal versus Agent Considerations (Reporting Revenue Gross versus Net), which clarified the implementation guidance on principal versus agent considerations. In April 2016, the FASB issued ASU 2016-10, Revenue from Contracts with Customers (Topic 606): Identifying Performance Obligations and Licensing, which clarified the implementation guidance regarding performance obligations and licensing arrangements. The new standard will become effective for the Company on October 1, 2018, with early application permitted to the effective date of October 1, 2017. The Company is evaluating the effect that ASU 2014-09 will have on its consolidated financial statements and related disclosures. The Company has not yet selected a transition method nor has it determined the effect of the standard on its ongoing financial reporting.
In August, 2014, the FASB released Accounting Standards Update 2014-15, Presentation of Financial Statements — Going Concern (Subtopic 205-40) (“ASU 2014-15”). ASU 2014-15 requires the Company to evaluate whether there are conditions or events, considered in the aggregate, that raise substantial doubt about the entity’s ability to continue as a going concern within the one year period subsequent to the date that the financial statements are issued or within the one year period subsequent the date that the financial statements are available to be issued. ASU 2014-15 becomes effective for fiscal periods ending after December 15, 2016; however, early adoption is permitted. The Company has not elected to early adopt ASU 2014-15 and is considering its effects upon the financial statements.
In April 2015, the FASB issued ASU 2015-03, Interest – Imputation of Interest (Subtopic 835-30): Simplifying the Presentation of Debt Issuance Costs. ASU 2015-03 requires that debt issuance costs related to a recognized debt liability be presented in the balance sheet as a direct deduction from the carrying amount of that debt liability, consistent with debt discounts. For public business entities, the guidance is effective for annual and interim periods beginning after December 15, 2015. Prior to adoption, the Company recorded deferred debt issuance costs as deferred financing costs as an asset on the Consolidated Statements of Assets and Liabilities. Upon adoption, the Company reclassified all of these costs as unamortized debt issuance costs that reduce debt in the liabilities on the Consolidated Statements of Assets and Liabilities and retrospectively reclassified $13.1 million of deferred debt issuance costs that were previously presented as deferred financing costs as an asset as of September 30, 2015.
| F-29 |
In May 2015, the FASB issued ASU 2016-07 Fair Value Measurements: Disclosures for Investments in Certain Entitles that Calculate Net Asset Value per Share (or its Equivalent). The pronouncement removes the requirement to categorize within the fair value hierarchy all investments for which fair value is measured using NAV per share practical expedient. The pronouncement also removes the requirement to make certain disclosures for all investments that are eligible to be measured at fair value using the net asset value per share practical expedient. Rather, those disclosures are limited to the investments for which the entity has not elected to measure the fair value using that practical expedient. For public business entities, the guidance becomes effective and will be applied retrospectively for fiscal years beginning after December 15, 2015 and interim periods within those years; however, early adoption is permitted. The Company has elected to early adopt the pronouncement for the current reporting period, which is permitted; therefore the Company excluded all investments in affiliated entities fair valued using the practical expedient from the fair value hierarchy.
Federal Income Taxes
The Company has elected to be treated as a RIC under subchapter M of the Code and operates in a manner so as to qualify for the tax treatment applicable to RICs. In order to qualify as a RIC, among other things, the Company is required to meet certain source of income and asset diversification requirements and timely distribute to its stockholders at least 90% of the sum of investment company taxable income (“ICTI”) including PIK, as defined by the Code, and net tax exempt interest income (which is the excess of our gross tax exempt interest income over certain disallowed deductions) for each taxable year in order to be eligible for tax treatment under subchapter M of the Code. Depending on the level of ICTI earned in a tax year, the Company may choose to carry forward ICTI in excess of current year dividend distributions into the next tax year. Any such carryover ICTI must be distributed before the end of that next tax year through a dividend declared prior to filing the final tax return related to the year which generated such ICTI.
The Company is subject to a nondeductible U.S. federal excise tax of 4% on undistributed income if it does not distribute at least 98% of its ordinary income in any calendar year and 98.2% of its capital gain net income for each one-year period ending on October 31 of such calendar year. To the extent that the Company determines that its estimated current year annual taxable income will be in excess of estimated current year dividend distributions for excise tax purposes, the Company accrues excise tax, if any, on estimated excess taxable income as taxable income is earned. There is no provision for federal excise tax for 2015 accrued at September 30, 2016.
The Company’s Taxable Subsidiaries accrue income taxes payable based on the applicable corporate rates on the unrealized gains generated by the investments held by the Taxable Subsidiaries. As of September 30, 2016, and 2015, the Company recorded a deferred tax liability of $2.0 million, and $1.8 million, respectively, on the Consolidated Statements of Assets and Liabilities. The change in provision for deferred taxes is included as a component of net gain/(loss) on investments in the Consolidated Statements of Operations. For the year ended September 30, 2016, the change in provision for deferred taxes on the unrealized loss on investments was $0.1 million. For the years ended September 30, 2015, and 2014, the change in provision for deferred taxes on the unrealized gain on investments were $0.1 million, and $1.6 million respectively.
ICTI generally differs from net investment income for financial reporting purposes due to temporary and permanent differences in the recognition of income and expenses. The Company may be required to recognize ICTI in certain circumstances in which it does not receive cash. For example, if the Company holds debt obligations that are treated under applicable tax rules as having original issue discount, the Company must include in ICTI each year a portion of the original issue discount that accrues over the life of the obligation, regardless of whether cash representing such income is received by the Company in the same taxable year. The Company may also have to include in ICTI other amounts that it has not yet received in cash, such as 1) PIK interest income and 2) interest income from investments that have been classified as non-accrual for financial reporting purposes. Interest income on non-accrual investments is not recognized for financial reporting purposes, but generally is recognized in ICTI. Because any original issue discount or other amounts accrued will be included in the Company’s ICTI for the year of accrual, the Company may be required to make a distribution to its stockholders in order to satisfy the minimum distribution requirements, even though the Company will not have received and may not ever receive any corresponding cash amount. ICTI also excludes net unrealized appreciation or depreciation, as investment gains or losses are not included in taxable income until they are realized.
Permanent differences between ICTI and net investment income for financial reporting purposes are reclassified among capital accounts in the financial statements to reflect their tax character. Differences in classification may also result from the treatment of short-term gains as ordinary income for tax purposes. During the years ended September 30, 2016, 2015 and 2014, the Company reclassified for book purposes amounts arising from permanent book/tax differences related to the different tax treatment of distributions and closing fees as follows (dollars in thousands):
| For the years ended September 30 | ||||||||||||
| 2016 | 2015 | 2014 | ||||||||||
| Capital in excess of par value | $ | - | $ | - | $ | (7,481,539 | ) | |||||
| Accumulated undistributed net investment income/(loss) | (1,008,000 | ) | (284,593 | ) | 7,837,283 | |||||||
| Accumulated net realized gain/(loss) from investments | 1,008,000 | 284,593 | (355,744 | ) | ||||||||
| F-30 |
For income tax purposes, distributions paid to stockholders are reported as ordinary income, return of capital, long term capital gains or a combination thereof. The tax character of distributions paid for the years ended September 30, 2016, 2015 and 2014 were as follows:
| For the years ended September 30 | ||||||||||||
| 2016 | 2015 | 2014 | ||||||||||
| Ordinary income | $ | 62,122,756 | $ | 73,697,139 | $ | 64,544,920 | ||||||
| Distributions of long-term capital gains | - | 276,671 | 989,866 | |||||||||
| Return of capital | - | - | 7,481,540 | |||||||||
| Distributions on a tax basis | $ | 62,122,756 | $ | 73,973,810 | $ | 73,016,326 | ||||||
For federal income tax purposes, the cost of investments owned at September 30, 2016, 2015 and 2014 were approximately $999.0 million, $1,252.4 million, and $1,253.5 million, respectively.
At September 30, 2016, 2015 and 2014, the components of distributable earnings/(accumulated deficits) on a tax basis detailed below differ from the amounts reflected in the Company’s Statement of Assets and Liabilities by temporary and other book/tax differences, primarily relating to the tax treatment of certain fee income and organizational expenses, as follows:
| For the years ended September 30 | ||||||||||||
| 2016 | 2015 | 2014 | ||||||||||
| Undistributed ordinary income | $ | 8,793,113 | $ | 959,579 | $ | - | ||||||
| Accumulated capital and other losses | (99,177,258 | ) | (60,625,616 | ) | - | |||||||
| Other temporary differences | (11,708,070 | ) | (187,110 | ) | (203,319 | ) | ||||||
| Unrealized appreciation/(depreciation) | (86,369,176 | ) | (38,523,401 | ) | (9,441,598 | ) | ||||||
| Components of distributable earnings/(accumulated deficits) at year end | $ | (188,461,391 | ) | $ | (98,376,548 | ) | $ | (9,644,917 | ) | |||
The Company accounts for income taxes in conformity with ASC Topic 740 - Income Taxes (“ASC 740”). ASC 740 provides guidelines for how uncertain tax positions should be recognized, measured, presented and disclosed in financial statements. ASC 740 requires the evaluation of tax positions taken or expected to be taken in the course of preparing the Company’s tax returns to determine whether the tax positions are “more-likely-than-not” of being sustained by the applicable tax authority. Tax positions deemed to meet a “more-likely-than-not” threshold would be recorded as a tax benefit or expense in the current period. The Company recognizes interest and penalties, if any, related to unrecognized tax benefits as income tax expense in the Consolidated Statements of Operations. There were no material uncertain income tax positions at September 30, 2016. Although we file federal and state tax returns, our major tax jurisdiction is federal. The Company’s inception-to-date federal tax years remain subject to examination by the Internal Revenue Service.
Segments
The Company invests in various industries. The Company separately evaluates the performance of each of its investment relationships. However, because each of these investment relationships has similar business and economic characteristics, they have been aggregated into a single investment segment. All applicable segment disclosures are included in or can be derived from the Company’s financial statements. See Note 3 for further information.
Company Investment Risk, Concentration of Credit Risk, and Liquidity Risk
MCC Advisors has broad discretion in making investments for the Company. Investments will generally consist of debt instruments that may be affected by business, financial market or legal uncertainties. Prices of investments may be volatile, and a variety of factors that are inherently difficult to predict, such as domestic or international economic and political developments, may significantly affect the results of the Company’s activities and the value of its investments. In addition, the value of the Company’s portfolio may fluctuate as the general level of interest rates fluctuate.
The value of the Company’s investments in loans may be detrimentally affected to the extent, among other things, that a borrower defaults on its obligations, there is insufficient collateral and/or there are extensive legal and other costs incurred in collecting on a defaulted loan, observable secondary or primary market yields for similar instruments issued by comparable companies increase materially or risk premiums required in the market between smaller companies, such as our borrowers, and those for which market yields are observable increase materially. MCC Advisors may attempt to minimize this risk by maintaining low loan-to-liquidation values with each loan and the collateral underlying the loan.
| F-31 |
The Company’s assets may, at any time, include securities and other financial instruments or obligations that are illiquid or thinly traded, making purchase or sale of such securities and financial instruments at desired prices or in desired quantities difficult. Furthermore, the sale of any such investments may be possible only at substantial discounts, and it may be extremely difficult to value any such investments accurately.
Note 3. Investments
The composition of our investments as of September 30, 2016 as a percentage of our total portfolio, at amortized cost and fair value were as follows (dollars in thousands):
| Amortized Cost | Percentage | Fair Value | Percentage | |||||||||||||
| Senior Secured First Lien Term Loans | $ | 612,762 | 60.5 | % | $ | 565,329 | 61.8 | % | ||||||||
| Senior Secured Second Lien Term Loans | 229,898 | 22.7 | 213,537 | 23.4 | ||||||||||||
| Senior Secured First Lien Notes | 26,755 | 2.6 | 27,423 | 3.0 | ||||||||||||
| Unsecured Debt | 62,150 | 6.1 | 52,809 | 5.8 | ||||||||||||
| MCC Senior Loan Strategy JV I LLC | 32,113 | 3.2 | 31,252 | 3.4 | ||||||||||||
| Equity/Warrants | 49,213 | 4.9 | 23,834 | 2.6 | ||||||||||||
| Total | $ | 1,012,891 | 100.0 | % | $ | 914,184 | 100.0 | % | ||||||||
The composition of our investments as of September 30, 2015 as a percentage of our total portfolio, at amortized cost and fair value were as follows (dollars in thousands):
| Amortized Cost | Percentage | Fair Value | Percentage | |||||||||||||
| Senior Secured First Lien Term Loans | $ | 740,831 | 58.2 | % | $ | 695,970 | 57.2 | % | ||||||||
| Senior Secured Second Lien Term Loans | 379,115 | 29.8 | 372,176 | 30.6 | ||||||||||||
| Senior Secured First Lien Notes | 37,697 | 3.0 | 36,380 | 3.0 | ||||||||||||
| Unsecured Debt | 50,941 | 4.0 | 45,661 | 3.7 | ||||||||||||
| MCC Senior Loan Strategy JV I LLC | 14,437 | 1.1 | 14,216 | 1.2 | ||||||||||||
| Equity/Warrants | 49,520 | 3.9 | 51,689 | 4.3 | ||||||||||||
| Total | $ | 1,272,541 | 100.0 | % | $ | 1,216,092 | 100.0 | % | ||||||||
In connection with certain of the Company’s investments, the Company receives warrants which are obtained for the objective of increasing the total investment returns and are not held for hedging purposes. At September 30, 2016, and 2015, the total fair value of warrants was $5.8 million and $11.9 million, respectively, and were included in investments at fair value on the Consolidated Statement of Assets and Liabilities. During the years ended September 30, 2016 and 2015, the Company acquired 0 and 1 warrant positions, respectively.
Total unrealized gains related to warrants for the years ended September 30, 2016, 2015, and 2014 were $2.1 million, $5.4 million, and $8.4 million, respectively and were recorded on the Consolidated Statements of Operations in those accounts. The warrants are received in connection with individual investments and are not subject to master netting arrangements.
The following table shows the portfolio composition by industry grouping at fair value at September 30, 2016 (dollars in thousands):
| F-32 |
| Fair Value | Percentage | |||||||
| Services: Business | $ | 123,703 | 13.5 | % | ||||
| Banking, Finance, Insurance & Real Estate | 96,207 | 10.5 | ||||||
| Construction & Building | 91,087 | 10.0 | ||||||
| Hotel, Gaming & Leisure | 68,605 | 7.5 | ||||||
| Automotive | 60,303 | 6.6 | ||||||
| Healthcare & Pharmaceuticals | 57,041 | 6.2 | ||||||
| Energy: Oil & Gas | 52,646 | 5.8 | ||||||
| Aerospace & Defense | 51,656 | 5.6 | ||||||
| Telecommunications | 44,015 | 4.8 | ||||||
| Containers, Packaging & Glass | 42,197 | 4.6 | ||||||
| Chemicals, Plastics & Rubber | 32,640 | 3.6 | ||||||
| Multisector Holdings | 31,252 | 3.4 | ||||||
| Beverage & Food | 30,225 | 3.3 | ||||||
| Capital Equipment | 29,756 | 3.3 | ||||||
| Consumer goods: Durable | 24,696 | 2.7 | ||||||
| Metals & Mining | 20,246 | 2.2 | ||||||
| High Tech Industries | 14,489 | 1.6 | ||||||
| Retail | 12,565 | 1.4 | ||||||
| Services: Consumer | 9,440 | 1.0 | ||||||
| Media: Broadcasting & Subscription | 7,832 | 0.9 | ||||||
| Consumer goods: Non-durable | 7,208 | 0.8 | ||||||
| Wholesale | 6,375 | 0.7 | ||||||
| Total | $ | 914,184 | 100.0 | % | ||||
The following table shows the portfolio composition by industry grouping at fair value at September 30, 2015 (dollars in thousands):
| Fair Value | Percentage | |||||||
| Services: Business | $ | 161,700 | 13.3 | % | ||||
| Construction & Building | 103,939 | 8.6 | ||||||
| Banking, Finance, Insurance & Real Estate | 101,899 | 8.4 | ||||||
| Automotive | 99,414 | 8.2 | ||||||
| Healthcare & Pharmaceuticals | 92,258 | 7.6 | ||||||
| Metals & Mining | 90,469 | 7.4 | ||||||
| Hotel, Gaming & Leisure | 73,821 | 6.1 | ||||||
| Aerospace & Defense | 69,885 | 5.7 | ||||||
| Energy: Oil & Gas | 63,339 | 5.2 | ||||||
| Containers, Packaging & Glass | 58,766 | 4.8 | ||||||
| Chemicals, Plastics & Rubber | 46,548 | 3.8 | ||||||
| Retail | 43,399 | 3.6 | ||||||
| Telecommunications | 40,519 | 3.3 | ||||||
| Beverage & Food | 39,575 | 3.3 | ||||||
| Capital Equipment | 29,764 | 2.4 | ||||||
| Consumer goods: Durable | 24,715 | 2.0 | ||||||
| Services: Consumer | 17,000 | 1.4 | ||||||
| High Tech Industries | 14,774 | 1.2 | ||||||
| Multisector Holdings | 14,216 | 1.2 | ||||||
| Consumer goods: Non-durable | 11,888 | 1.0 | ||||||
| Consumer Discretionary | 10,000 | 0.8 | ||||||
| Media: Broadcasting & Subscription | 7,744 | 0.6 | ||||||
| Transportation: Cargo | 460 | 0.1 | ||||||
| Total | $ | 1,216,092 | 100.0 | % | ||||
| F-33 |
The Company invests in portfolio companies principally located in North America. The geographic composition is determined by the location of the corporate headquarters of the portfolio company, which may not be indicative of the primary source of the portfolio company’s business.
The following table shows the portfolio composition by geographic location at fair value at September 30, 2016 (dollars in thousands):
| Fair Value | Percentage | |||||||
| Midwest | $ | 217,229 | 23.8 | % | ||||
| Southwest | 195,672 | 21.4 | ||||||
| Southeast | 180,159 | 19.7 | ||||||
| West | 136,279 | 14.9 | ||||||
| Northeast | 134,781 | 14.7 | ||||||
| Mid-Atlantic | 50,064 | 5.5 | ||||||
| Total | $ | 914,184 | 100.0 | % | ||||
The following table shows the portfolio composition by geographic location at fair value at September 30, 2015 (dollars in thousands):
| Fair Value | Percentage | |||||||
| Midwest | $ | 387,086 | 31.8 | % | ||||
| Southwest | 254,265 | 20.9 | ||||||
| West | 192,906 | 15.9 | ||||||
| Southeast | 177,269 | 14.6 | ||||||
| Northeast | 126,756 | 10.4 | ||||||
| Mid-Atlantic | 77,810 | 6.4 | ||||||
| Total | $ | 1,216,092 | 100.0 | % | ||||
Transactions With Affiliated Companies
During the years ended September 30, 2016 and 2015, the Company had investments in portfolio companies designated as controlled investments and affiliates under the 1940 Act. Transactions with control investments and affiliates were as follows:
| Name of Investment | Fair Value at September 30, 2015 | Purchases (Sales) of/Advances to Affiliates | Transfers In/(Out) of Affiliates | Unrealized Gain/(Loss) | Realized Gain/(Loss) | Fair Value at September 30, 2016 | Interest Income | Dividend Income(3) | ||||||||||||||||||||||||
| Controlled Investments | ||||||||||||||||||||||||||||||||
| AAR Intermediate Holdings, LLC | $ | - | $ | - | $ | 23,874,931 | $ | (1,294 | ) | $ | - | $ | 23,873,637 | $ | 6,135 | $ | - | |||||||||||||||
| Capstone Nutrition | - | 9,872,264 | 20,840,975 | (9,773,533 | ) | - | 20,939,706 | 783,359 | - | |||||||||||||||||||||||
| Lydell Jewelry Design Studio, LLC | - | 1,574,300 | 11,888,075 | (6,254,853 | ) | - | 7,207,522 | 22,479 | - | |||||||||||||||||||||||
| MCC Senior Loan Strategy JV I LLC(1) | 14,215,834 | 17,675,000 | - | (638,418 | ) | - | 31,252,416 | - | 1,080,625 | |||||||||||||||||||||||
| OmniVere LLC | 24,865,578 | 12,918,479 | - | (4,086,938 | ) | - | 33,697,119 | 2,922,578 | - | |||||||||||||||||||||||
| United Road Towing, Inc. | 35,116,790 | 1,725,607 | - | (16,930,522 | ) | - | 19,911,875 | 1,746,391 | - | |||||||||||||||||||||||
| Total Controlled Investments | $ | 74,198,202 | $ | 43,765,650 | $ | 56,603,981 | $ | (37,685,558 | ) | $ | - | $ | 136,882,275 | $ | 5,480,942 | $ | 1,080,625 | |||||||||||||||
| Non-Controlled Affiliates | ||||||||||||||||||||||||||||||||
| US Multifamily, LLC | $ | 10,000,000 | $ | - | $ | - | $ | - | $ | - | $ | 10,000,000 | $ | 667,000 | $ | - | ||||||||||||||||
| Total Non-Controlled Affiliates | $ | 10,000,000 | $ | - | $ | - | $ | - | $ | - | $ | 10,000,000 | $ | 667,000 | $ | - | ||||||||||||||||
| F-34 |
| Name of Investment | Fair Value at September 30, 2014 | Purchases (Sales) of/Advances to Affiliates | Transfers In/(Out) of Affiliates | Unrealized Gain/(Loss)(2) | Realized Gain/(Loss)(2) | Fair Value at September 30, 2015 | Interest Income(2) | Dividend Income(2) | ||||||||||||||||||||||||
| Controlled Investments | ||||||||||||||||||||||||||||||||
| MCC Senior Loan Strategy JV I LLC(1) | $ | - | $ | 14,437,500 | $ | - | $ | (221,666 | ) | $ | - | $ | 14,215,834 | $ | - | $ | - | |||||||||||||||
| OmniVere LLC | - | 5,896,545 | 24,865,578 | (5,896,545 | ) | - | 24,865,578 | 447,077 | - | |||||||||||||||||||||||
| United Road Towing, Inc. | 38,244,386 | 1,656,318 | - | (4,783,914 | ) | - | 35,116,790 | 3,039,906 | - | |||||||||||||||||||||||
| Total Controlled Investments | $ | 38,244,386 | $ | 21,990,363 | $ | 24,865,578 | $ | (10,902,125 | ) | $ | - | $ | 74,198,202 | $ | 3,486,983 | $ | - | |||||||||||||||
| Non-Controlled Affiliates | ||||||||||||||||||||||||||||||||
| US Multifamily, LLC | $ | 10,000,000 | $ | - | $ | - | $ | - | $ | - | $ | 10,000,000 | $ | 667,000 | $ | - | ||||||||||||||||
| Cymax Stores, Inc. | 11,434,667 | (11,392,181 | ) | - | (1,491,516 | ) | 1,449,030 | - | 662,098 | - | ||||||||||||||||||||||
| Total Non-Controlled Affiliates | $ | 21,434,667 | $ | (11,392,181 | ) | $ | - | $ | (1,491,516 | ) | $ | 1,449,030 | $ | 10,000,000 | $ | 1,329,098 | $ | - | ||||||||||||||
| (1) | The Company and Great American Life Insurance Company (“GALIC”) are the members of MCC Senior Loan Strategy JV I LLC (“MCC JV”), a joint venture formed as a Delaware limited liability company that is not consolidated by either member for financial reporting purposes. The members of MCC JV make capital contributions as investments by MCC JV are completed, and all portfolio and other material decisions regarding MCC JV must be submitted to MCC JV’s board of managers, which is comprised of an equal number of members appointed by each of the Company and GALIC. Approval of MCC JV’s board of managers requires the unanimous approval of a quorum of the board of managers, with a quorum consisting of equal representation of members appointed by each of the Company and GALIC. Because management of MCC JV is shared equally between the Company and GALIC, the Company does not have operational control over the MCC JV for purposes of the 1940 Act or otherwise. |
| (2) | The prior year table has been modified to conform to the current year. |
| (3) | Amount represents distributions from MCC JV to the Company and is a component of dividend income, net of provisional taxes in the Consolidated Statements of Operations. |
Purchases/(sales) of or advances/(distributions) to affiliates represent the proceeds from sales and settlements of investments, purchases, originations and participations, investment increases due to payment-in-kind interest as well as net amortization of premium/(discount) on investments and are included in the purchases and sales presented on the Consolidated Statements of Cash Flows for the years ended September 30, 2016 and 2015, respectively. Transfers in/(out) of affiliates represents the fair value for the month an investment became or was removed as an affiliated investment. Income received from affiliates is included in total investment income on the Consolidated Statements of Operations for the years ended September 30, 2016 and 2015, respectively.
Loan Participation Sales
The Company sells portions of its investments via participation agreements to a managed account, managed by an affiliate and non-affiliate of the Company. At September 30, 2016, there were 14 participation agreements outstanding with an aggregate fair value of $254.5 million. At September 30, 2015, there were 14 participation agreements outstanding with an aggregate fair value of $301.6 million. Such investments where the Company has retained a proportionate interest are included in the consolidated schedule of investments. All of these investments are classified within Level 3 of the fair value hierarchy, as defined in Note 4.
During the years ended September 30, 2016, 2015, and 2014, the Company made interest and principal payments to the sub-participant in the aggregate amount of $26.4 million, $24.2 million, and $33.3 million, respectively. Under the terms of the participation agreements, the Company will make periodic payments to the sub-participant equal to the sub-participant's proportionate share of any principal and interest payments received by the Company from the underlying investee companies.
| F-35 |
MCC Senior Loan Strategy JV I LLC
On March 27, 2015, the Company and GALIC entered into a limited liability company operating agreement to co-manage MCC JV. All portfolio and other material decisions regarding MCC JV must be submitted to MCC JV’s board of managers, which is comprised of four members, two of whom are selected by the Company and the other two are selected by GALIC. The Company has concluded that it does not operationally control MCC JV. As the Company does not operationally control MCC JV, it does not consolidate the operations of MCC JV within the consolidated financial statements. As a practical expedient, the Company uses NAV to determine the value of its investment in MCC JV; therefore, this investment has been presented as a reconciling item within the fair value hierarchy (see Note 4). Investments held by MCC JV are measured at fair value using the same valuation methodologies as described in Note 2.
As of September 30, 2016, MCC JV had total capital commitments of $100.0 million with the Company providing $87.5 million and GALIC providing $12.5 million. Approximately $36.7 million was funded as of September 30, 2016 relating to these commitments, of which $32.1 million was from the Company.
On August 4, 2015, MCC JV entered into a senior secured revolving credit facility (the “JV Facility”) led by Credit Suisse, AG with initial commitments of $100 million subject to leverage and borrowing base restrictions. The JV Facility will bear interest at a rate of LIBOR (with no minimum) + 2.50% per annum. The revolving loan period ends on August 4, 2018 and the final maturity date is August 4, 2022. As of September 30, 2016, there was approximately $68.1 million outstanding under the JV Facility.
At September 30, 2016 and 2015, MCC JV had total investments at fair value of $93.4 million and $14.3 million, respectively. As of September 30, 2016 and 2015, MCC JV’s portfolio was comprised of senior secured first lien term loans to 30 and 5 borrowers, respectively. As of September 30, 2016, certain investments in one portfolio company were on non-accrual status. As of September 30, 2015, none of these investments were on non-accrual status.
Below is a summary of MCC JV’s portfolio, followed by a listing of the individual loans in MCC JV’s portfolio as of September 30, 2016 and 2015:
| September 30, 2016 | September 30, 2015 | |||||||
| Senior Secured Loans(1) | $ | 95,872,612 | $ | 14,373,473 | ||||
| Weighted average current interest rate on Senior Secured Loans(2) | 6.70 | % | 7.17 | % | ||||
| Number of borrowers in MCC JV | 30 | 5 | ||||||
| Largest loan to a single borrower(1) | $ | 5,216,234 | $ | 3,000,000 | ||||
| Total of five largest loans to borrowers(1) | $ | 22,637,363 | $ | 14,373,473 | ||||
| (1) | At par value. |
| (2) | Computed as the (a) annual stated interest rate on accruing senior secured loans, divided by (b) total senior secured loans at principal amount. |
MCC JV Loan Portfolio as of September 30, 2016
| Company | Industry | Type of Investment | Maturity | Par Amount | Cost | Fair Value(2) | % of Net Assets | |||||||||||||||
| 4Over International, LLC | Media: Advertising, Printing & Publishing | Senior Secured First Lien Term Loan (LIBOR + 6.00%, 1.00% LIBOR Floor)(1) | 6/7/2022 | 2,487,500 | 2,487,500 | 2,487,500 | 7.0 | % | ||||||||||||||
| 2,487,500 | 2,487,500 | 2,487,500 | ||||||||||||||||||||
| AccentCare, Inc. | Healthcare & Pharmaceuticals | Senior Secured First Lien Term Loan (LIBOR + 5.75% Cash, 1.00% LIBOR Floor)(1) | 9/3/2021 | 2,747,500 | 2,724,808 | 2,728,295 | 7.6 | % | ||||||||||||||
| 2,747,500 | 2,724,808 | 2,728,295 | ||||||||||||||||||||
| Amplify Snack Brands, Inc. | Beverage & Food | Senior Secured First Lien Term Loan (LIBOR + 5.50% Cash, 1.00% LIBOR Floor)(1) | 9/2/2023 | 4,000,000 | 3,960,392 | 3,960,000 | 11.1 | % | ||||||||||||||
| 4,000,000 | 3,960,392 | 3,960,000 | ||||||||||||||||||||
| APCO Holdings, Inc | Automotive | Senior Secured First Lien Term Loan (LIBOR + 6.00%, 1.00% LIBOR Floor)(1) | 1/31/2022 | 3,703,125 | 3,604,166 | 3,660,168 | 10.2 | % | ||||||||||||||
| 3,703,125 | 3,604,166 | 3,660,168 | ||||||||||||||||||||
| API Technologies Corp. | Aerospace and Defense | Senior Secured First Lien Term Loan (LIBOR + 6.50% Cash, 1.00% LIBOR Floor)(1) | 4/22/2022 | 2,992,500 | 2,936,717 | 2,932,650 | 8.2 | % | ||||||||||||||
| 2,992,500 | 2,936,717 | 2,932,650 | ||||||||||||||||||||
| F-36 |
| Company | Industry | Type of Investment | Maturity | Par Amount | Cost | Fair Value(2) | % of Net Assets | |||||||||||||||
| Blount International, Inc. | Capital Equipment | Senior Secured First Lien Term Loan (LIBOR + 6.25% Cash, 1.00% LIBOR Floor)(1) | 4/12/2023 | 3,000,000 | 2,947,612 | 2,910,000 | 8.1 | % | ||||||||||||||
| 3,000,000 | 2,947,612 | 2,910,000 | ||||||||||||||||||||
| CD&R TZ Purchaser, Inc. | Services: Consumer | Senior Secured First Lien Term Loan (LIBOR + 6.00%, 1.00% LIBOR Floor)(1) | 7/21/2023 | 3,500,000 | 3,448,618 | 3,395,002 | 9.5 | % | ||||||||||||||
| 3,500,000 | 3,448,618 | 3,395,002 | ||||||||||||||||||||
| CP OpCo, LLC Term Loan A | Services: Consumer | Senior Secured First Lien Term Loan (LIBOR + 4.50%, 1.00% LIBOR Floor)(1) | 3/31/2019 | 495,048 | 495,048 | 495,048 | 1.4 | % | ||||||||||||||
| 495,048 | 495,048 | 495,048 | ||||||||||||||||||||
| CP OpCo, LLC Term Loan B | Services: Consumer | Senior Secured First Lien Term Loan (LIBOR + 4.50%, 1.00% LIBOR Floor)(1) | 3/31/2019 | 206,270 | 206,270 | 206,270 | 0.6 | % | ||||||||||||||
| 206,270 | 206,270 | 206,270 | ||||||||||||||||||||
| CP OpCo, LLC Term Loan C(3) | Services: Consumer | Senior Secured First Lien Term Loan (LIBOR + 6.00%, 1.00% LIBOR Floor)(1) | 3/31/2019 | 1,447,834 | 717,016 | 717,016 | 2.0 | % | ||||||||||||||
| 1,447,834 | 717,016 | 717,016 | ||||||||||||||||||||
| CP OpCo, LLC Term Loan D(3) | Services: Consumer | Senior Secured First Lien Term Loan (LIBOR + 6.00%, 1.00% LIBOR Floor)(1) | 3/31/2019 | 901,391 | - | - | 0.0 | % | ||||||||||||||
| 901,391 | - | - | ||||||||||||||||||||
| CP OpCo, LLC Revolving Credit Facility | Services: Consumer | Senior Secured First Lien Term Loan (LIBOR + 4.50%, 1.00% LIBOR Floor)(1) | 3/31/2019 | 128,038 | 128,038 | 128,038 | 0.4 | % | ||||||||||||||
| 128,038 | 128,038 | 128,038 | ||||||||||||||||||||
| CP OpCo, LLC Revolving Credit Facility | Services: Consumer | Senior Secured First Lien Term Loan (ABR + 3.50% Cash, 3.50% ABR Floor)(1) | 3/31/2019 | 112,674 | 112,674 | 112,674 | 0.3 | % | ||||||||||||||
| 112,674 | 112,674 | 112,674 | ||||||||||||||||||||
| CP Opco, LLC (Classic Party Rentals) Common Units | Services: Consumer | Common Stock | 41 | - | - | 0.0 | % | |||||||||||||||
| 41 | - | - | ||||||||||||||||||||
| F-37 |
| Company | Industry | Type of Investment | Maturity | Par Amount | Cost | Fair Value(2) | % of Net Assets | |||||||||||||||
| CRGT Inc. | High Tech Industries | Senior Secured First Lien Term Loan (LIBOR + 6.50% Cash, 1.00% LIBOR Floor)(1) | 12/19/2020 | 2,646,703 | 2,641,393 | 2,646,703 | 7.4 | % | ||||||||||||||
| 2,646,703 | 2,641,393 | 2,646,703 | ||||||||||||||||||||
| Elite Comfort Solutions, Inc | Chemicals, Plastics & Rubber | Senior Secured First Lien Term Loan (LIBOR + 6.50% Cash, 1.00% LIBOR Floor)(1) | 1/15/2021 | 4,196,875 | 4,196,875 | 4,238,844 | 11.9 | % | ||||||||||||||
| 4,196,875 | 4,196,875 | 4,238,844 | ||||||||||||||||||||
| Explorer Holdings, Inc. | Healthcare & Pharmaceuticals | Senior Secured First Lien Term Loan (LIBOR + 5.00%, 1.00% LIBOR Floor)(1) | 5/2/2023 | 2,992,500 | 2,981,967 | 2,962,575 | 8.3 | % | ||||||||||||||
| 2,992,500 | 2,981,967 | 2,962,575 | ||||||||||||||||||||
| GTCR Valor Companies, Inc. | Media: Diversified & Production | Senior Secured First Lien Term Loan (LIBOR + 6.00% Cash, 1.00% LIBOR Floor)(1) | 6/16/2023 | 3,990,000 | 3,835,508 | 3,795,687 | 10.6 | % | ||||||||||||||
| 3,990,000 | 3,835,508 | 3,795,687 | ||||||||||||||||||||
| HarborTouch Payments, LLC | Banking, Finance, Insurance & Real Estate | Senior Secured First Lien Term Loan (LIBOR + 6.00% Cash, 1.00% LIBOR Floor)(1) | 5/31/2022 | 3,478,125 | 3,445,054 | 3,443,344 | 9.6 | % | ||||||||||||||
| 3,478,125 | 3,445,054 | 3,443,344 | ||||||||||||||||||||
| High Ridge Brands Co. | Consumer Goods - Non-Durable | Senior Secured First Lien Term Loan (LIBOR + 5.25% Cash, 1.00% LIBOR Floor)(1) | 6/30/2022 | 1,870,313 | 1,842,364 | 1,842,257 | 5.2 | % | ||||||||||||||
| 1,870,313 | 1,842,364 | 1,842,257 | ||||||||||||||||||||
| Imagine! Print Solutions, LLC | Media: Advertising, Printing & Publishing | Senior Secured First Lien Term Loan (LIBOR + 6.00%, 1.00% LIBOR Floor)(1) | 3/30/2022 | 4,977,182 | 4,918,462 | 5,020,982 | 14.1 | % | ||||||||||||||
| 4,977,182 | 4,918,462 | 5,020,982 | ||||||||||||||||||||
| Keurig Green Mountain, Inc. | Beverage & Food | Senior Secured First Lien Term Loan (LIBOR + 4.50% Cash, 0.75% LIBOR Floor)(1) | 3/3/2023 | 4,013,275 | 3,963,303 | 4,013,275 | 11.2 | % | ||||||||||||||
| 4,013,275 | 3,963,303 | 4,013,275 | ||||||||||||||||||||
| F-38 |
| Company | Industry | Type of Investment | Maturity | Par Amount | Cost | Fair Value(2) | % of Net Assets | |||||||||||||||
| Kraton Polymers LLC | Chemicals, Plastics & Rubber | Senior Secured First Lien Term Loan (LIBOR + 5.00%, 1.00% LIBOR Floor)(1) | 1/6/2022 | 3,000,000 | 2,891,792 | 3,030,000 | 8.5 | % | ||||||||||||||
| 3,000,000 | 2,891,792 | 3,030,000 | ||||||||||||||||||||
| MB Aerospace ACP Holdings II Corp. | Aerospace and Defense | Senior Secured First Lien Term Loan (LIBOR + 5.50% Cash, 1.00% LIBOR Floor)(1) | 12/15/2022 | 5,216,234 | 5,173,584 | 5,160,681 | 14.4 | % | ||||||||||||||
| 5,216,234 | 5,173,584 | 5,160,681 | ||||||||||||||||||||
| MWI Holdings, Inc. | Capital Equipment | Senior Secured First Lien Term Loan (LIBOR + 5.50% Cash, 1.00% LIBOR Floor)(1) | 6/29/2020 | 1,995,000 | 1,976,126 | 1,990,012 | 5.5 | % | ||||||||||||||
| 1,995,000 | 1,976,126 | 1,990,012 | ||||||||||||||||||||
| NetSmart Inc. | High Tech Industries | Senior Secured First Lien Term Loan (LIBOR + 4.75%, 1.00% LIBOR Floor)(1) | 4/19/2023 | 2,493,750 | 2,469,871 | 2,503,227 | 7.0 | % | ||||||||||||||
| 2,493,750 | 2,469,871 | 2,503,227 | ||||||||||||||||||||
| New Media Holdings II LLC | Media: Advertising, Printing & Publishing | Senior Secured First Lien Term Loan (LIBOR + 6.25%, 1.00% LIBOR Floor)(1) | 6/4/2020 | 2,962,302 | 2,962,302 | 2,948,972 | 8.3 | % | ||||||||||||||
| 2,962,302 | 2,962,302 | 2,948,972 | ||||||||||||||||||||
| Pomeroy Group LLC | High Tech Industries | Senior Secured First Lien Term Loan (LIBOR + 6.00%, 1.00% LIBOR Floor)(1) | 11/30/2021 | 3,491,206 | 3,389,703 | 3,386,470 | 9.5 | % | ||||||||||||||
| 3,491,206 | 3,389,703 | 3,386,470 | ||||||||||||||||||||
| Quorum Health Corporation | Healthcare & Pharmaceuticals | Senior Secured First Lien Term Loan (LIBOR + 5.75%, 1.00% LIBOR Floor)(1) | 4/29/2022 | 2,487,500 | 2,441,013 | 2,409,765 | 6.7 | % | ||||||||||||||
| 2,487,500 | 2,441,013 | 2,409,765 | ||||||||||||||||||||
| SCS Holdings I Inc. | Wholesale | Senior Secured First Lien Term Loan (LIBOR + 5.00%, 1.00% LIBOR Floor)(1) | 10/30/2022 | 2,966,292 | 2,914,417 | 2,904,564 | 8.1 | % | ||||||||||||||
| 2,966,292 | 2,914,417 | 2,904,564 | ||||||||||||||||||||
| Sundial Group Holdings LLC | Consumer Goods - Non-Durable | Senior Secured First Lien Term Loan (LIBOR + 6.25%, 1.00% LIBOR Floor)(1) | 10/19/2021 | 2,925,000 | 2,875,629 | 2,879,721 | 8.1 | % | ||||||||||||||
| 2,925,000 | 2,875,629 | 2,879,721 | ||||||||||||||||||||
| F-39 |
| Company | Industry | Type of Investment | Maturity | Par Amount | Cost | Fair Value(2) | % of Net Assets | |||||||||||||||
| Survey Sampling International, LLC | Services: Business | Senior Secured First Lien Term Loan (LIBOR + 5.00%, 1.00% LIBOR Floor)(1) | 12/16/2020 | 2,984,843 | 2,957,468 | 2,954,994 | 8.3 | % | ||||||||||||||
| 2,984,843 | 2,957,468 | 2,954,994 | ||||||||||||||||||||
| TaxAct, Inc. | Banking, Finance, Insurance & Real Estate | Senior Secured First Lien Term Loan (LIBOR + 6.00% Cash, 1.00% LIBOR Floor)(1) | 1/3/2023 | 4,233,796 | 4,129,461 | 4,302,807 | 12.0 | % | ||||||||||||||
| 4,233,796 | 4,129,461 | 4,302,807 | ||||||||||||||||||||
| VCVH Holding Corp. | High Tech Industries | Senior Secured First Lien Term Loan (LIBOR + 5.00%, 1.00% LIBOR Floor)(1) | 6/1/2023 | 2,992,500 | 2,963,504 | 2,971,852 | 8.3 | % | ||||||||||||||
| 2,992,500 | 2,963,504 | 2,971,852 | ||||||||||||||||||||
| Victory Capital Operating, LLC. | Banking, Finance, Insurance & Real Estate | Senior Secured First Lien Term Loan (LIBOR + 7.50%, 1.00% LIBOR Floor)(1) | 10/29/2021 | 1,643,836 | 1,619,749 | 1,615,069 | 4.5 | % | ||||||||||||||
| 1,643,836 | 1,619,749 | 1,615,069 | ||||||||||||||||||||
| Western Digital Corporation | High Tech Industries | Senior Secured First Lien Term Loan (LIBOR + 3.75%, 0.75% LIBOR Floor)(1) | 4/29/2023 | 2,593,500 | 2,541,321 | 2,617,879 | 7.3 | % | ||||||||||||||
| 2,593,500 | 2,541,321 | 2,617,879 | ||||||||||||||||||||
| Total Investments, September 30, 2016 | $ | 95,872,654 | $ | 92,899,725 | $ | 93,372,341 | 261.4 | % | ||||||||||||||
| (1) | Represents the weighted average annual current interest rate as of September 30, 2016. All interest rates are payable in cash, unless otherwise noted. |
| (2) | Represents the fair value in accordance with ASC Topic 820. The determination of such fair value is not included in the Company’s board of directors’ valuation process described elsewhere herein. |
| (3) | This investment was on non-accrual status as of September 30, 2016 |
| F-40 |
MCC JV Loan Portfolio as of September 30, 2015
| Company | Industry | Type of Investment | Maturity | Par Amount | Cost | Fair Value(2) | % of Net Assets | |||||||||||||||
| AccentCare, Inc. | Healthcare & Pharmaceuticals | Senior Secured First Lien Term loans (LIBOR + 5.75%, 1.00% LIBOR Floor)(1) | 9/3/2021 | 2,800,000 | 2,772,167 | 2,772,000 | 17.0 | % | ||||||||||||||
| 2,800,000 | 2,772,167 | 2,772,000 | ||||||||||||||||||||
| CP OPCO LLC | Services: Consumer | Senior Secured First Lien Term loans (LIBOR + 6.75%, 1.00% LIBOR Floor)(1) | 9/30/2020 | 3,000,000 | 2,982,480 | 3,000,000 | 18.5 | % | ||||||||||||||
| 3,000,000 | 2,982,480 | 3,000,000 | ||||||||||||||||||||
| CRGT, Inc. | High Tech Industries | Senior Secured First Lien Term loans (LIBOR + 6.50%, 1.00% LIBOR Floor)(1) | 12/19/2020 | 2,981,013 | 2,973,610 | 2,973,560 | 18.3 | % | ||||||||||||||
| 2,981,013 | 2,973,610 | 2,973,560 | ||||||||||||||||||||
| Language Line, Inc. | Telecommunications | Senior Secured First Lien Term loans (LIBOR + 5.50%, 1.00% LIBOR Floor)(1) | 7/7/2021 | 2,600,000 | 2,574,605 | 2,596,750 | 16.0 | % | ||||||||||||||
| 2,600,000 | 2,574,605 | 2,596,750 | ||||||||||||||||||||
| New Media Holdings II LLC | Media: Advertising, Printing & Publishing | Senior Secured First Lien Term loans (LIBOR + 6.25%, 1.00% LIBOR Floor)(1) | 6/4/2020 | 2,992,460 | 2,992,460 | 2,939,191 | 18.1 | % | ||||||||||||||
| 2,992,460 | 2,992,460 | 2,939,191 | ||||||||||||||||||||
| Total Investments, September 30, 2015 | $ | 14,373,473 | $ | 14,295,322 | $ | 14,281,501 | 87.9 | % | ||||||||||||||
| (1) | Represents the weighted average annual current interest rate as of September 30, 2015. All interest rates are payable in cash, unless otherwise noted. |
| (2) | Represents the fair value in accordance with ASC 820. The determination of such fair value is not included in the Company’s Board of Directors’s valuation process described elsewhere herein. |
| F-41 |
Below is certain summarized financial Information for MCC JV as of September 30, 2016 and 2015, and for the year ended September 30, 2015 and the period from July 15, 2015 (commencement of operations) through September 30, 2015:
| As of | As of | |||||||
| September 30, 2016 | September 30, 2015 | |||||||
| Selected Consolidated Statement of Assets and Liabilities Information: | ||||||||
| Investments in loans at fair value (cost: of $92,899,725 and $14,295,322, respectively) | $ | 93,372,341 | $ | 14,281,501 | ||||
| Cash | 9,720,324 | 977,318 | ||||||
| Other assets | 268,136 | 34,869 | ||||||
| Deferred financing costs (net of amortization of $34,302) | - | 1,196,392 | ||||||
| Total assets | $ | 103,360,801 | $ | 16,490,080 | ||||
| Line of credit net of debt issuance costs of $1,000,841 | $ | 67,079,159 | $ | - | ||||
| Other liabilities | 340,088 | 162,857 | ||||||
| Interest payable | 224,507 | 80,556 | ||||||
| Total liabilities | 67,643,754 | 243,413 | ||||||
| Members' capital | 35,717,047 | 16,246,667 | ||||||
| Total liabilities and members' capital | $ | 103,360,801 | $ | 16,490,080 | ||||
| For the year ended September 30, 2016 |
Period
from | |||||||
| Selected Consolidated Statement of Operations Information: | ||||||||
| Total revenues | $ | 3,916,605 | 100,056 | |||||
| Total expenses | (2,480,499 | ) | (339,615 | ) | ||||
| Net unrealized depreciation | 486,437 | (13,821 | ) | |||||
| Net realized gains | (1,415,210 | ) | 47 | |||||
| Net income/(loss) | $ | 507,333 | (253,333 | ) | ||||
Note 4. Fair Value Measurements
The Company follows ASC 820 for measuring the fair value of portfolio investments. Fair value is the price that would be received in the sale of an asset or paid to transfer a liability in an orderly transaction between market participants at the measurement date. Where available, fair value is based on observable market prices or parameters, or derived from such prices or parameters. Where observable prices or inputs are not available, valuation models are applied. These valuation models involve some level of management estimation and judgment, the degree of which is dependent on the price transparency for the instruments or market and the instruments’ complexity. The Company’s fair value analysis includes an analysis of the value of any unfunded loan commitments. Financial investments recorded at fair value in the consolidated financial statements are categorized for disclosure purposes based upon the level of judgment associated with the inputs used to measure their value. The valuation hierarchical levels are based upon the transparency of the inputs to the valuation of the investment as of the measurement date. The three levels are defined below. Investments which are valued using NAV as a practical expedient are excluded from this hierarchy:
| F-42 |
| · | Level 1 - Valuations based on quoted prices in active markets for identical assets or liabilities at the measurement date. |
| · | Level 2 - Valuations based on inputs other than quoted prices in active markets included in Level 1, which are either directly or indirectly observable at the measurement date. This category includes quoted prices for similar assets or liabilities in active markets, quoted prices for identical or similar assets or liabilities in non-active markets including actionable bids from third parties for privately held assets or liabilities, and observable inputs other than quoted prices such as yield curves and forward currency rates that are entered directly into valuation models to determine the value of derivatives or other assets or liabilities. |
| · | Level 3 - Valuations based on inputs that are unobservable and where there is little, if any, market activity at the measurement date. The inputs for the determination of fair value may require significant management judgment or estimation and are based upon management’s assessment of the assumptions that market participants would use in pricing the assets or liabilities. These investments include debt and equity investments in private companies or assets valued using the market or income approach and may involve pricing models whose inputs require significant judgment or estimation because of the absence of any meaningful current market data for identical or similar investments. The inputs in these valuations may include, but are not limited to, capitalization and discount rates, beta and EBITDA multiples. The information may also include pricing information or broker quotes which include a disclaimer that the broker would not be held to such a price in an actual transaction. The non-binding nature of consensus pricing and/or quotes accompanied by disclaimer would result in classification as Level 3 information, assuming no additional corroborating evidence. |
In addition to using the above inputs in investment valuations, the Company continues to employ the valuation policy approved by the board of directors that is consistent with ASC 820 (see Note 2). Consistent with our valuation policy, we evaluate the source of inputs, including any markets in which our investments are trading, in determining fair value.
The following table presents the fair value measurements of our investments, by major class according to the fair value hierarchy, as of September 30, 2016 (dollars in thousands):
| Level 1 | Level 2 | Level 3 | Total | |||||||||||||
| Senior Secured First Lien Term Loans | $ | - | $ | - | $ | 565,329 | $ | 565,329 | ||||||||
| Senior Secured Second Lien Term Loans | - | - | 213,537 | 213,537 | ||||||||||||
| Senior Secured First Lien Notes | - | 6,375 | 21,048 | 27,423 | ||||||||||||
| Unsecured Debt | - | - | 52,809 | 52,809 | ||||||||||||
| Equity/Warrants | 359 | 363 | 23,112 | 23,834 | ||||||||||||
| Total | $ | 359 | $ | 6,738 | $ | 875,835 | $ | 882,932 | ||||||||
| MCC Senior Loan Strategy JV I LLC(1) | $ | 31,252 | ||||||||||||||
| Total Investments, at fair value | $ | 914,184 | ||||||||||||||
| F-43 |
The following table presents the fair value measurements of our investments, by major class according to the fair value hierarchy, as of September 30, 2015 (dollars in thousands):
| Level 1 | Level 2 | Level 3 | Total | |||||||||||||
| Senior Secured First Lien Term Loans | $ | - | $ | - | $ | 695,970 | $ | 695,970 | ||||||||
| Senior Secured Second Lien Term Loans | - | - | 372,176 | 372,176 | ||||||||||||
| Senior Secured First Lien Notes | - | 5,711 | 30,669 | 36,380 | ||||||||||||
| Unsecured Debt | - | - | 45,661 | 45,661 | ||||||||||||
| Equity/Warrants | 479 | 626 | 50,584 | 51,689 | ||||||||||||
| Total | $ | 479 | $ | 6,337 | $ | 1,195,060 | $ | 1,201,876 | ||||||||
| MCC Senior Loan Strategy JV I LLC(1) | $ | 14,216 | ||||||||||||||
| Total Investments, at fair value | $ | 1,216,092 | ||||||||||||||
(1) Certain investments that are measured at fair value using NAV have not been categorized in the fair value hierarchy. The fair value amounts presented in the table are intended to permit reconciliation of the fair value hierarchy to the amount presented in the Consolidated Statements of Assets and Liabilities.
The following table provides a reconciliation of the beginning and ending balances for investments that use Level 3 inputs for the year ended September 30, 2016 (dollars in thousands):
| Senior Secured First Lien Term Loans | Senior Secured Second Lien Term Loans | Senior Secured First Lien Notes | Unsecured Debt | Equities/Warrants | Total | |||||||||||||||||||
| Balance as of September 30, 2015 | $ | 695,970 | $ | 372,176 | $ | 30,669 | $ | 45,661 | $ | 50,584 | $ | 1,195,060 | ||||||||||||
| Purchases and other adjustments to cost | 8,692 | 2,855 | 9 | 2,932 | 1,165 | 15,653 | ||||||||||||||||||
| Originations | 86,857 | 12,000 | - | 8,278 | 1,433 | 108,568 | ||||||||||||||||||
| Sales | - | - | - | - | - | - | ||||||||||||||||||
| Settlements | (181,177 | ) | (164,072 | ) | (11,000 | ) | - | (6,383 | ) | (362,632 | ) | |||||||||||||
| Net realized gains/(losses) from investments | (42,441 | ) | - | 39 | - | 3,479 | (38,923 | ) | ||||||||||||||||
| Net transfers in and/or out of Level 3 | - | - | - | - | - | - | ||||||||||||||||||
| Net unrealized gains/(losses) | (2,572 | ) | (9,422 | ) | 1,331 | (4,062 | ) | (27,166 | ) | (41,891 | ) | |||||||||||||
| Balance as of September 30, 2016 | $ | 565,329 | $ | 213,537 | $ | 21,048 | $ | 52,809 | $ | 23,112 | $ | 875,835 | ||||||||||||
| F-44 |
The following table provides a reconciliation of the beginning and ending balances for investments that use level 3 inputs for the year ended September 30, 2015 (dollars in thousands):
| Senior Secured First Lien Term Loans | Senior Secured Second Lien Term Loans | Senior Secured First Lien Notes | Unsecured Debt | Equities/Warrants | Total | |||||||||||||||||||
| Balance as of September 30, 2014 | $ | 747,740 | $ | 359,209 | $ | 53,634 | $ | 38,186 | $ | 44,282 | $ | 1,243,051 | ||||||||||||
| Purchases and other adjustments to cost | 12,644 | 2,920 | 15 | 343 | 2,514 | 18,436 | ||||||||||||||||||
| Originations | 188,406 | 61,500 | - | 12,413 | 8,216 | 270,535 | ||||||||||||||||||
| Sales | (27,509 | ) | (26,576 | ) | (12,118 | ) | - | (2,233 | ) | (68,436 | ) | |||||||||||||
| Settlements | (158,976 | ) | (18,002 | ) | - | - | - | (176,978 | ) | |||||||||||||||
| Net realized gains/(losses) from investments | (50,638 | ) | (563 | ) | (2,401 | ) | - | 982 | (52,620 | ) | ||||||||||||||
| Net transfers in and/or out of Level 3 | - | - | (8,181 | ) | - | (105 | ) | (8,286 | ) | |||||||||||||||
| Net unrealized gains/(losses) | (15,697 | ) | (6,312 | ) | (280 | ) | (5,281 | ) | (3,072 | ) | (30,642 | ) | ||||||||||||
| Balance as of September 30, 2015 | $ | 695,970 | $ | 372,176 | $ | 30,669 | $ | 45,661 | $ | 50,584 | $ | 1,195,060 | ||||||||||||
Net change in unrealized loss included in earnings related to investments still held as of September 30, 2016 and 2015, was approximately $72.6 million and $34.5 million, respectively.
Purchases and other adjustments to cost include purchases of new investments at cost, effects of refinancing/restructuring, accretion/amortization of income from discount/premium on debt securities, and PIK.
Sales represent net proceeds received from investments sold.
Settlements represent principal paydowns received.
A review of the fair value hierarchy classifications is conducted on a quarterly basis. Changes in the observability of valuation inputs may result in a reclassification for certain financial assets or liabilities. Reclassifications impacting Level 3 of the fair value hierarchy are reported as transfers in/out of the Level 3 category as of the beginning of the quarter in which the reclassifications occur. During the year ended September 30, 2016, one of our senior secured first lien notes transferred from Level 2 to Level 3 back to Level 2 with a net change in fair value of $0 because of the decrease and subsequent increase in availability of the transaction data or the inputs to the valuation became observable. During the year ended September 30, 2015, two of our senior secured first lien notes with a fair value of $18.3 million and one of our warrants with a fair value of $0.1 million transferred from Level 3 to Level 2 because of the increase in availability of the transaction data or the inputs to the valuation became observable. During the year ended September 30, 2015, one of our senior secured first lien notes with a fair value of $10.1 million transferred from Level 2 to Level 3 because of the decrease in availability of the transaction data or the inputs to the valuation became observable.
The following table presents the quantitative information about Level 3 fair value measurements of our investments, as of September 30, 2016 (dollars in thousands):
| F-45 |
| Fair Value | Valuation Technique | Unobservable Input | Range (Weighted Average) | |||||||
| Senior Secured First Lien Term Loans | $ | 446,549 | Income Approach (DCF) | Market yield | 7.55% - 16.00% (11.54%) | |||||
| Senior Secured First Lien Term Loans | 54,254 | Market Approach (Guideline Comparable)/Income Approach (DCF) | NTM Revenue Multiple(1), NTM EBITDA Multiple(1), Discount Rate | 0.40x - 1.00x (0.80x)/5.00x - 7.00x (6.46x)/17.00% - 20.00% (18.33%) | ||||||
| Senior Secured First Lien Term Loans | 7,832 | Market Approach (Guideline Comparable) | NTM Revenue Multiple(1), NTM EBITDA Multiple(1), RGU | 1.00x - 1.50x (1.50x)/5.00x - 6.00x (6.00x)/$393.75 - $525.00 ($525.00) | ||||||
| Senior Secured First Lien Term Loans | 7,207 | Market Approach (Guideline Comparable)/Income Approach (DCF) | NTM Revenue Multiple(1), Discount Rate | 0.25x - 1.00x (0.63x) 19.00% - 21.00% (20.00%) | ||||||
| Senior Secured First Lien Term Loans | 5,989 | Market Approach (Guideline Comparable)/Income Approach (DCF) | LTM Revenue Multiple(1), Discount Rate | 0.75x - 1.25x (1.00x) /14.00%-18.00% (16.00%) | ||||||
| Senior Secured First Lien Term Loans | 22,360 | Market Approach (Guideline Comparable)/Income Approach (DCF) | 2016 Revenue Multiple(1), NTM Revenue Multiple(1), NTM EBITDA, Discount rate | 0.75x-1.25x (1.25x)/0.75x-1.25x (1.25x)/6.50x-7.00x (7.00x)/ 17.50%-22.50% (20.00%) | ||||||
| Senior Secured First Lien Term Loans | 13,308 | Market Approach (Guideline Comparable) | 2016 Revenue Multiple(1) | 0.50x - 0.75x (0.63x) | ||||||
| Senior Secured First Lien Term Loans | 1,160 | Enterprise Valuation Analysis | Recovery Proceeds | $0.0M - $1.2M ($1.2M) | ||||||
| Senior Secured First Lien Term Loans | 6,670 | Recent Arms-Length Transaction | Recent Arms Length Transaction | N/A | ||||||
| Senior Secured First Lien Notes | 21,048 | Income Approach (DCF) | Market yield | 8.02% - 8.02% (8.02%) | ||||||
| Senior Secured Second Lien Term Loans | 179,197 | Income Approach (DCF) | Market yield | 8.97% - 17.86% (11.54%) | ||||||
| Senior Secured Second Lien Term Loans | 2,818 | Market Approach (Guideline Comparable) | 2016 EBITDA Multiple(1) | 5.00x - 6.00x (5.50x) | ||||||
| Senior Secured Second Lien Term Loan | 18,726 | Market Approach (Guideline Comparable) | LTM Revenue Multiple(1), NTM Revenue Multiple(1), LTM EBITDA Multiple(1) | 0.50x-0.75x(0.63x) /0.50x-0.75x(0.63x) / 6.25x - 6.75x (6.50x) | ||||||
| Senior Secured Second Lien Term Loan | 12,796 | Market Approach (Guideline Comparable) | LTM and NTM EBITDA Multiple(1) | 8.50x-9.50x (9.00x)/ 8.00x-9.00x (8.50x) | ||||||
| Unsecured Debt | 11,337 | Market Approach (Guideline Comparable)/Income Approach (DCF) | 2016 Revenue Multiple(1), NTM Revenue Multiple(1), NTM EBITDA Multiple(1), Discount rate | 0.75x-1.25x (1.25x)/0.75x-1.25x (1.25x)/6.50x-7.00x (7.00x)/ 17.50%-22.50% (20.00%) | ||||||
| Unsecured Debt | 26,322 | Income Approach (DCF) | Market Yield | 18.00%-18.50% (18.49%) | ||||||
| Unsecured Debt | 15,150 | Income Approach (DCF) | Market Yield | 10.58%-10.58% (10.58%) | ||||||
| Equity | 5,749 | Income Approach (DCF) | Market Yield | 8.75%-8.75% (8.75%) | ||||||
| F-46 |
| Fair Value | Valuation Technique | Unobservable Input | Range (Weighted Average) | |||||||
| Equity | 3,330 | Recent Arms-Length Transaction | Recent Arms Length Transaction | N/A | ||||||
| Equity | - | Market Approach (Guideline Comparable) | NTM Revenue Multiple(1), NTM EBITDA Multiple(1), RGU | 1.00x - 1.50x (1.50x)/5.00x - 6.00x (6.00x)/$393.75 - $525.00 ($525.00) | ||||||
| Warrants | - | Market Approach (Guideline Comparable)/Income Approach (DCF) | NTM Revenue Multiple(1), Discount Rate | 0.25x - 1.00x (0.63x) 19.00% - 21.00% (20.00%) | ||||||
| Equity | - | Market Approach (Guideline Comparable)/Income Approach (DCF) | LTM Revenue Multiple(1), Discount Rate | 0.75x - 1.25x (1.00x)/14.00% - 18.00% (16.00%) | ||||||
| Equity | 1,186 | Market Approach (Guideline Comparable) | LTM Revenue Multiple(1), NTM Revenue Multiple(1), LTM EBITDA Multiple(1) | 0.50x-0.75x(0.63x) /0.50x-0.75x(0.63x) / 6.25x - 6.75x (6.50x) | ||||||
| Equity | - | Market Approach (Guideline Comparable) | LTM Revenue Multiple(1), NTM Revenue Multiple(1) | 0.75x - 1.00x (0.75x) /0.75x - 1.00x (0.75x) | ||||||
| Equity | 3,263 | Market Approach (Guideline Comparable)/Income Approach (DCF) | LTM EBITDA, Run-Rate Multiple(1), Discount rate | 7.00x - 8.00x (7.50x)/7.00x - 8.00x (7.50x) / 16.00%-18.00% (17.00%) | ||||||
| Equity | 71 | Market Approach (Guideline Comparable)/Income Approach (DCF) | NTM EBITDA Multiple(1), Discount rate | 6.00x - 7.00x (7.00x)/ 14.00%-16.00% (15.00%) | ||||||
| Equity | 642 | Market Approach (Guideline Comparable)/Precedent Transaction | NTM EBITDA Multiple(1), Precedent Transaction | 4.25x - 5.25x (4.75x) / $185.3M-$185.3M ($185.3M) | ||||||
| Warrants | 5,400 | Market Approach (Guideline Comparable) | LTM EBITDA and EV/PP&E Multiple(1) | 5.50x - 6.50x (6.00x) / 0.75x - 1.00x (0.88x) | ||||||
| Equity | 1,759 | Market Approach (Guideline Comparable) | LTM and 2016 EBITDA Multiple(1) | 6.50x - 7.00x (6.54x) / 6.00x - 6.50x (6.04x) | ||||||
| Equity | 1,712 | Market Approach (Guideline Comparable) | LTM and NTM EBITDA Multiple(1) | 5.75x - 7.50x (7.03x) / 5.75x - 6.75x (6.49x) | ||||||
| Equity | - | Market Approach (Guideline Comparable)/Income Approach (DCF) | NTM Revenue Multiple(1), NTM EBITDA Multiple(1), Discount Rate | 0.40x - 1.00x (0.80x)/5.00x - 7.00x (6.46x)/17.00% - 20.00% (18.33%) | ||||||
| Warrants | - | Market Approach (Guideline Comparable) | 2016 EBITDA Multiple(1) | 5.00x - 6.00x (5.50x) | ||||||
| Equity | - | Market Approach (Guideline Comparable)/Income Approach (DCF) | 2016 Revenue Multiple(1), NTM Revenue Multiple(1), NTM EBITDA Multiple(1), Discount rate | 0.75x-1.25x (1.25x)/0.75x-1.25x (1.25x)/6.50x-7.00x (7.00x)/ 17.50%-22.50% (20.00%) | ||||||
| Total | $ | 875,835 | ||||||||
| F-47 |
The following table presents the quantitative information about Level 3 fair value measurements of our investments, as of September 30, 2015 (dollars in thousands):
| Fair Value | Valuation Technique | Unobservable Input | Range (Weighted Average) | |||||||
| Senior Secured First Lien Term Loans | $ | 594,118 | Income Approach (DCF) | Market yield | 8.08% - 15.25% (11.48%) | |||||
| Senior Secured First Lien Term Loans | 22,504 | Market Approach (Guideline Comparable) | 2015 Revenue Multiple(1) and 2015 EBITDA Multiple(1) | 0.50x - 1.00x (0.75x)/3.50x - 4.50x (4.00x) | ||||||
| Senior Secured First Lien Term Loans | 7,537 | Market Approach (Guideline Comparable) | 2015 Revenue Multiple(1), 2015 EBITDA Multiple(1), Revenue Generating Unit Price | 1.00x - 1.25x (1.13x)/12.00x - 13.00x (12.50x)/$393.75 - $525.00 ($459.38) | ||||||
| Senior Secured First Lien Term Loans | 6,332 | Market Approach (Guideline Comparable) | LTM EBITDA Multiple(1) | 4.00x - 5.00x (5.00x) | ||||||
| Senior Secured First Lien Term Loans | - | Market Approach (Guideline Comparable) | 2015 Revenue Multiple(1) | 0.40x - 0.60x (0.50x) | ||||||
| Senior Secured First Lien Term Loans | 17,806 | Market Approach (Guideline Comparable) | 2015 EBITDA Multiple(1) | 6.25x - 6.75x (6.50x) | ||||||
| Senior Secured First Lien Term Loans | 11,888 | Income Approach (DCF) and Market Approach (Guideline Comparable) | LTM and NTM EBITDA Multiple(1), Discount Rate | 4.50x - 5.00x (4.50x)/4.50x - 5.00x (4.50x)/20.0% - 22.0% (21.5%) | ||||||
| Senior Secured First Lien Term Loans | 35,785 | Recent Arms-Length Transaction | Recent Arms-Length Transaction | N/A | ||||||
| Senior Secured Second Lien Term Loans | 340,621 | Income Approach (DCF) | Market yield | 9.58% - 18.38% (11.79%) | ||||||
| Senior Secured Second Lien Term Loans | 7,280 | Income Approach (DCF) | Market yield, Cost of equity | 15.93%/19.00%-21.00% (19.00%) | ||||||
| Senior Secured Second Lien Term Loans | 14,275 | Income Approach (DCF) | Cost of equity | 16.00%-18.00% (17.00%) | ||||||
| Senior Secured Second Lien Term Loans | 10,000 | Recent Arms-Length Transaction | Recent Arms-Length Transaction | N/A | ||||||
| Senior Secured First Lien Notes | 30,669 | Income Approach (DCF) | Market yield | 9.46%-22.42% (13.75%) | ||||||
| Unsecured Debt | 38,601 | Income Approach (DCF) | Market yield | 11.71% - 18.00% (15.52%) | ||||||
| Unsecured Debt | 7,060 | Market Approach (Guideline Comparable) | 2015 EBITDA Multiple(1) | 6.25x - 6.75x (6.50x) | ||||||
| Equity | 208 | Market Approach (Guideline Comparable) | 2015 Revenue Multiple(1), 2015 EBITDA Multiple(1), Revenue Generating Unit Price | 1.00x - 1.25x (1.13x)/12.00x - 13.00x (12.50x)/$393.75 - $525.00 ($459.38) | ||||||
| Equity | 5,078 | Income Approach (DCF) | Market yield | 14.63%-14.63% (14.63%) | ||||||
| Equity | 18,627 | Option Model | LTM EBITDA Multiple(1)/Discount Rate/Volatility | 5.5x-6.5x (6.0x) / 12.0% -14.0% (12.0%) / 17.0% - 44.9% (25.0%) | ||||||
| Equity | 7,869 | Market Approach (Guideline Comparable) | LTM and 2015 EBITDA Multiple(1) | 7.50x -7.50x (7.50x)/5.50x -7.00x (6.69x) | ||||||
| Warrants | - | Income Approach (DCF) and Market Approach (Guideline Comparable) | LTM and NTM EBITDA Multiple(1), Discount Rate | 4.50x - 5.00x (4.50x)/4.50x - 5.00x (4.50x)/20.0% - 22.0% (21.5%) | ||||||
| F-48 |
| Fair Value | Valuation Technique | Unobservable Input | Range (Weighted Average) | |||||||
| Warrants | 14,486 | Market Approach (Guideline Comparable) | LTM and NTM EBITDA Multiple(1) | 4.25x - 10.00x (7.18x); 3.75x -10.00x (6.78x) | ||||||
| Warrants | 231 | Market Approach (Guideline Comparable) | 2015 EBITDA Multiple(1) | 4.0x - 7.5x (7.5x) | ||||||
| Warrants | - | Market Approach (Guideline Comparable) | 2015 Revenue Multiple(1) and 2015 EBITDA Multiple(1) | 0.50x - 1.00x (0.75x)/3.50x - 4.50x (4.00x) | ||||||
| Warrants | - | Market Approach (Guideline Comparable) | 2015 Revenue Multiple(1) | 0.40x - 0.60x (0.50x) | ||||||
| Warrants | 460 | Market Approach (Guideline Comparable)/Option Model | LTM and NTM EBITDA Multiple(1), Volatility | 5.50x - 6.50x (6.00x); 5.00x - 6.00x (5.50x); 12.28% - 20.27% (45.0%) | ||||||
| Equity | 3,330 | Income Approach (DCF) | Discount Rate | 8.00%-12.00% (8.00%) | ||||||
| Equity | 295 | Market Approach (Guideline Comparable) | LTM EBITDA Multiple(1) | 4.00x - 5.00x (4.50x) | ||||||
| Total | $ | 1,195,060 | ||||||||
(1) Represents amounts used when the Company has determined that market participants would use such multiples when measuring the fair value of these investments.
The significant unobservable inputs used in the fair value measurement of the Company’s debt investments are market yields. Increases in market yields would result in lower fair value measurements.
The significant unobservable inputs used in the fair value measurement of the Company’s equity/warrants investments are comparable company multiples of Revenue or EBITDA (earnings before interest, taxes, depreciation and amortization) for the last twelve months (“LTM”), next twelve months (“NTM”) or a reasonable period a market participant would consider. Increases in EBITDA multiples in isolation would result in higher fair value measurements.
Note 5. Borrowings
As a BDC, we are only allowed to employ leverage to the extent that our asset coverage, as defined in the 1940 Act, equals at least 200% after giving effect to such leverage. The amount of leverage that we employ at any time depends on our assessment of the market and other factors at the time of any proposed borrowing.
On November 16, 2012, we obtained exemptive relief from the SEC to permit us to exclude the debt of the SBIC LP guaranteed by the SBA from our 200% asset coverage test under the 1940 Act. The exemptive relief provides us with increased flexibility under the 200% asset coverage test by permitting it to borrow up to $150 million more than it would otherwise be able to absent the receipt of this exemptive relief.
The Company’s outstanding debt as of September 30, 2016 and 2015 was as follows (dollars in thousands):
| As of | ||||||||||||||||||||||||||||||||
| September 30, 2016 | September 30, 2015 | |||||||||||||||||||||||||||||||
| Aggregate Principal Amount Available | Principal Amount Outstanding | Carrying Value | Fair Value | Aggregate Principal Amount Available | Principal Amount Outstanding | Carrying Value | Fair Value | |||||||||||||||||||||||||
| Revolving Credit Facility | $ | 343,500 | $ | 14,000 | $ | 14,000 | $ | 14,000 | $ | 343,500 | $ | 192,700 | $ | 192,700 | $ | 192,700 | ||||||||||||||||
| Term Loan Facility | 174,000 | 174,000 | 174,000 | 174,000 | 174,000 | 174,000 | 174,000 | 174,000 | ||||||||||||||||||||||||
| 2019 Notes | 40,000 | 40,000 | 40,000 | 40,704 | 40,000 | 40,000 | 40,000 | 40,048 | ||||||||||||||||||||||||
| 2021 Notes | 74,013 | 74,013 | 74,013 | 76,677 | N/A | N/A | N/A | N/A | ||||||||||||||||||||||||
| 2023 Notes | 63,500 | 63,500 | 63,500 | 63,856 | 63,500 | 63,500 | 63,500 | 62,078 | ||||||||||||||||||||||||
| SBA Debentures | 150,000 | 150,000 | 150,000 | 150,000 | 150,000 | 150,000 | 150,000 | 150,000 | ||||||||||||||||||||||||
| Total | $ | 845,013 | $ | 515,513 | $ | 515,513 | $ | 519,237 | $ | 771,000 | $ | 620,200 | $ | 620,200 | $ | 618,826 | ||||||||||||||||
| F-49 |
Credit Facility
On July 28, 2015, we entered into Amendment No. 7 to our existing Revolver Amendment and Amendment No. 7 to our existing Term Loan Amendment, each with certain lenders party thereto and ING Capital LLC, as administrative agent. The Amendments amend certain provisions of the Facilities.
The pricing in the case of the Term Loan Facility was reduced for LIBOR loans from LIBOR (with no minimum) plus 3.25% to LIBOR plus 3.00%. The pricing on the Revolving Credit Facility will remain the same at LIBOR (with no minimum) plus 2.75%. Both the Term Loan Facility and Revolving Credit Facility will decrease by an additional 25 basis points upon receiving an investment grade rating from Standard & Poor’s.
Additionally, the Term Loan Facility’s bullet maturity was extended from June 2019 to July 2020 and the Revolving Credit Facility’s revolving period was extended from June 2017 to July 2019, followed by a one-year amortization period and a final maturity in July 2020.
As of September 30, 2016, total commitments under the Facilities are $517.5 million, comprised of $343.5 million committed to the Revolving Credit Facility and $174.0 million funded under the Term Loan Facility
At September 30, 2016, the carrying amount of our borrowings under the Facilities approximated their fair value. The fair values of our debt obligations are determined in accordance with ASC 820, which defines fair value in terms of the price that would be paid to transfer a liability in an orderly transaction between market participants at the measurement date under current market conditions. The fair value of our borrowings under the Facilities are estimated based upon market interest rates for our own borrowings or entities with similar credit risk, adjusted for nonperformance risk, if any. At September 30, 2016 and 2015, the Facilities would be deemed to be Level 3, as defined in Note 4.
In accordance with ASU 2015-03, the debt issuance costs related to the Facilities are reported on the Consolidated Statements of Assets and Liabilities as a direct deduction from the face amount of the Facilities. As of September 30, 2016 and 2015, debt issuance costs related to the Facilities were as follows (dollars in thousands):
| September 30, 2016 | September 30, 2015 | |||||||||||||||
| Revolving Facility | Term Facility | Revolving Facility | Term Facility | |||||||||||||
| Total Debt Issuance Costs | $ | 8,199 | $ | 4,290 | $ | 7,444 | $ | 3,158 | ||||||||
| Amortized Debt Issuance Costs | 4,609 | 2,093 | 3,284 | 721 | ||||||||||||
| Unamortized Debt Issuance Costs | $ | 3,590 | $ | 2,197 | $ | 4,160 | $ | 2,437 | ||||||||
The following table shows the components of interest expense, commitment fees related to the Revolving Facility, amortized debt issuance costs, weighted average stated interest rate and weighted average outstanding debt balance for the Facilities for the years ended September 30, 2016 and 2015 (dollars in thousands):
| For the years ended | ||||||||
| September 30 | ||||||||
| 2016 | 2015 | |||||||
| Revolving Facility interest | $ | 2,116 | $ | 5,386 | ||||
| Revolving Facility commitment fee | 2,491 | 852 | ||||||
| Term Facility interest | 6,047 | 5,991 | ||||||
| Amortization of debt issuance costs | 1,948 | 1,617 | ||||||
| Agency and other fees | 79 | 77 | ||||||
| Total | $ | 12,681 | $ | 13,923 | ||||
| Weighted average stated interest rate | 3.4 | % | 3.3 | % | ||||
| Weighted average outstanding balance | $ | 241,522 | $ | 350,418 | ||||
As of September 30, 2016 and 2015, there was $14.0 million and $192.7 million, respectively, outstanding under the Revolving Facility. As of September 30, 2016 and 2015, there was $174.0 million outstanding under the Term Loan Facility.
| F-50 |
Unsecured Senior Notes
On March 21, 2012, the Company issued $40.0 million in aggregate principal amount of 7.125% unsecured notes that mature on March 30, 2019 (the "2019 Notes"). The 2019 Notes may be redeemed in whole or in part at any time or from time to time at the Company's option on or after March 30, 2015. The 2019 Notes bear interest at a rate of 7.125% per year, payable quarterly on March 30, June 30, September 30 and December 30 of each year, beginning June 30, 2012. The 2019 Notes are listed on the New York Stock Exchange and trade thereon under the trading symbol “MCQ”.
On March 18, 2013, the Company issued $60.0 million in aggregate principal amount of 6.125% unsecured notes that mature on March 30, 2023 (the "2023 Notes," and together with the 2019 Notes, the “Unsecured Notes”). The 2023 Notes may be redeemed in whole or in part at any time or from time to time at the Company's option on or after March 30, 2016. The 2023 Notes bear interest at a rate of 6.125% per year, payable quarterly on March 30, June 30, September 30 and December 30 of each year, beginning June 30, 2013. The 2023 Notes are listed on the New York Stock Exchange and trade thereon under the trading symbol “MCV”.
On March 26, 2013, the Company closed an additional $3.5 million in aggregate principal amount of the 2023 Notes, pursuant to the partial exercise of the underwriters’ option to purchase additional notes.
On December 17, 2015, the Company issued $70.8 million in aggregate principal amount of 6.50% unsecured notes that mature on January 30, 2021 (the “2021 Notes” and together with the 2019 Notes and 2023 Notes, the “Notes”). The 2021 Notes may be redeemed in whole or in part at any time or from time to time at the Company’s option on or after January 30, 2019. The 2021 Notes bear interest at a rate of 6.50% per year, payable quarterly on January 30, April 30, July 30 and October 30 of each year, beginning January 30, 2016. The 2021 Notes are listed on the New York Stock Exchange and trade thereon under the trading symbol “MCX”.
On January 14, 2016, the Company closed an additional $3.25 million in aggregate principal amount of the 2021 Notes, pursuant to the partial exercise of the underwriters’ option to purchase additional notes.
The fair values of our debt obligations are determined in accordance with ASC 820, which defines fair value in terms of the price that would be paid to transfer a liability in an orderly transaction between market participants at the measurement date under current market conditions. The fair value of the Notes, which are publicly traded, is based upon closing market quotes as of the measurement date. At September 30, 2016 and 2015 the Notes would be deemed to be Level 1, as defined in Note 4.
In accordance with ASU 2015-03, the debt issuance costs related to the Notes are reported on the Consolidated Statements of Assets and Liabilities as a direct deduction from the face amount of the Notes. As of September 30, 2016 and 2015, debt issuance costs related to the Notes were as follows (dollars in thousands):
| September 30, 2016 | September 30, 2015 | |||||||||||||||||||||||||||||||
| 2019
Notes | 2021
Notes | 2023
Notes | Total | 2019
Notes | 2021
Notes | 2023
Notes | Total | |||||||||||||||||||||||||
| Total Debt Issuance Costs | $ | 1,475 | $ | 3,226 | $ | 2,129 | $ | 6,830 | $ | 1,475 | N/A | $ | 2,129 | $ | 3,604 | |||||||||||||||||
| Amortized Debt Issuance Costs | 951 | 498 | 751 | 2,200 | 741 | N/A | 539 | 1,280 | ||||||||||||||||||||||||
| Unamortized Debt Issuance Costs | $ | 524 | $ | 2,728 | $ | 1,378 | $ | 4,630 | $ | 734 | N/A | $ | 1,590 | $ | 2,324 | |||||||||||||||||
For the years ended September 30, 2016 and 2015, the components of interest expense, amortized debt issuance costs, weighted average stated interest rate and weighted average outstanding debt balance for the Notes were as follows (dollars in thousands):
| For the years ended | ||||||||
| September 30 | ||||||||
| 2016 | 2015 | |||||||
| 2019 Unsecured Notes interest | $ | 2,850 | $ | 2,850 | ||||
| 2021 Unsecured Notes interest | 3,782 | N/A | ||||||
| 2023 Unsecured Notes interest | 3,889 | 3,889 | ||||||
| Amortization of debt issuance costs | 921 | 422 | ||||||
| Total | $ | 11,442 | $ | 7,161 | ||||
| Weighted average stated interest rate | 6.5 | % | 6.5 | % | ||||
| Weighted average outstanding balance | $ | 161,491 | $ | 103,500 | ||||
| F-51 |
As of September 30, 2016 and 2015, $40.0 million and $63.5 million in aggregate principal amount of the 2019 Notes and the 2023 Notes were outstanding, respectively. As of September 30, 2016, $74.0 million in aggregate principal amount of the 2021 Notes was outstanding.
SBA Debentures
On March 26, 2013, SBIC LP received an SBIC license from the SBA.
The SBIC license allows the SBIC LP to obtain leverage by issuing SBA-guaranteed debentures, subject to the issuance of a capital commitment by the SBA and other customary procedures. SBA-guaranteed debentures are non-recourse, interest only debentures with interest payable semi-annually and have a ten year maturity. The principal amount of SBA-guaranteed debentures is not required to be paid prior to maturity but may be prepaid at any time without penalty. The interest rate of SBA-guaranteed debentures is fixed on a semi-annual basis at a market-driven spread over U.S. Treasury Notes with 10-year maturities. The SBA, as a creditor, will have a superior claim to the SBIC LP’s assets over our stockholders in the event we liquidate the SBIC LP or the SBA exercises its remedies under the SBA-guaranteed debentures issued by the SBIC LP upon an event of default.
SBA regulations currently limit the amount that the SBIC LP may borrow to a maximum of $150 million when it has at least $75 million in regulatory capital, receives a capital commitment from the SBA and has been through an examination by the SBA subsequent to licensing.
As of September 30, 2016 and 2015, SBIC LP had $75.0 million in regulatory capital and had $150.0 million SBA Debentures outstanding that mature between September 2023 and September 2025.
| F-52 |
Our fixed-rate SBA Debentures as of September 30, 2016 and 2015 were as follows (dollars in thousands):
| September 30, 2016 | September 30, 2015 | |||||||||||||||
| Rate Fix Date | Debenture Amount | Fixed All-in Interest Rate | Debenture Amount | Fixed All-in Interest Rate | ||||||||||||
| September 2013 | $ | 5,000 | 4.404 | % | $ | 5,000 | 4.404 | % | ||||||||
| March 2014 | 39,000 | 3.951 | 39,000 | 3.951 | ||||||||||||
| September 2014 | 50,000 | 3.370 | 50,000 | 3.370 | ||||||||||||
| September 2014 | 6,000 | 3.775 | 6,000 | 3.775 | ||||||||||||
| September 2015 | 50,000 | 3.571 | 50,000 | 3.571 | ||||||||||||
| Weighted Average Rate/Total | $ | 150,000 | 3.639 | % | $ | 150,000 | 3.639 | % | ||||||||
As of September 30, 2016, the carrying amount of the SBA Debentures approximated their fair value. The fair values of the SBA Debentures are determined in accordance with ASC 820, which defines fair value in terms of the price that would be paid to transfer a liability in an orderly transaction between market participants at the measurement date under current market conditions. The fair value of the SBA Debentures are estimated based upon market interest rates for our own borrowings or entities with similar credit risk, adjusted for nonperformance risk, if any. At September 30, 2016 and 2015 the SBA Debentures would be deemed to be Level 3, as defined in Note 4.
In accordance with ASU 2015-03, the debt issuance costs related to the SBA Debentures are reported on the Consolidated Statements of Assets and Liabilities as a direct deduction from the face amount of the SBA Debentures. As of September 30, 2016 and 2015, debt issuance costs related to the SBA Debentures were as follows (dollars in thousands):
| September 30, 2016 | September 30, 2015 | |||||||
| Total Debt Issuance Costs | $ | 5,138 | $ | 5,138 | ||||
| Amortized Debt Issuance Costs | 1,613 | 931 | ||||||
| Unamortized Debt Issuance Costs | $ | 3,525 | $ | 4,207 | ||||
For the years ended September 30, 2016 and 2015, the components of interest, amortized debt issuance costs, weighted average stated interest rate and weighted average outstanding debt balance for the SBA Debentures were as follows (dollars in thousands):
| For the years ended | ||||||||
| September 30 | ||||||||
| 2016 | 2015 | |||||||
| SBA Debentures interest | $ | 5,473 | $ | 3,893 | ||||
| Amortization of debt issuance costs | 681 | 554 | ||||||
| Total | $ | 6,154 | $ | 4,447 | ||||
| Weighted average stated interest rate | 3.7 | % | 3.4 | % | ||||
| Weighted average outstanding balance | $ | 150,000 | $ | 114,285 | ||||
Note 6. Agreements
Investment Management Agreement
We entered into an investment management agreement with MCC Advisors. Mr Brook Taube, our chairman and chief executive officer, is a managing partner and senior portfolio manager of MCC Advisors, and Mr. Seth Taube, one of our directors, is a managing partner of MCC Advisors.
Under the terms of our investment management agreement, MCC Advisors:
| · | determines the composition of our portfolio, the nature and timing of the changes to our portfolio and the manner of implementing such changes; | |
| · | identifies, evaluates and negotiates the structure of the investments we make (including performing due diligence on our prospective portfolio companies); and | |
| · | executes, closes, monitors and administers the investments we make, including the exercise of any voting or consent rights. |
| F-53 |
MCC Advisors’ services under the investment management agreement are not exclusive, and it is free to furnish similar services to other entities so long as its services to us are not impaired.
Pursuant to our investment management agreement, we pay MCC Advisors a fee for investment advisory and management services consisting of a base management fee and a two-part incentive fee.
On December 3, 2015, MCC Advisors recommended and, in consultation with the Board, agreed to reduce fees under the investment management agreement. Beginning January 1, 2016, the base management fee was reduced to 1.50% on gross assets above $1 billion. In addition, MCC Advisors reduced its incentive fee from 20% on pre-incentive fee net investment income over an 8% hurdle, to 17.5% on pre-incentive fee net investment income over a 6% hurdle. Moreover, the revised incentive fee includes a netting mechanism and is subject to a rolling three-year look back from January 1, 2016 forward. Under no circumstances will the new fee structure result in higher fees to MCC Advisors than fees under the prior investment management agreement.
The following discussion of our base management fee and two-part incentive fee reflect the terms of the fee waiver agreement executed by MCC Advisors on February 8, 2016 (the “Fee Waiver Agreement”). The terms of the Fee Waiver Agreement are effective as of January 1, 2016, and are a permanent reduction in the base management fee and incentive fee on net investment income payable to MCC Advisors for the investment advisory and management services it provides under the investment management agreement. The Fee Waiver Agreement does not change the second component of the incentive fee, which is the incentive fee on capital gains.
Base Management Fee
For providing investment advisory and management services to us, MCC Advisors receives a base management fee. The base management fee is calculated at an annual rate of 1.75% (0.4375% per quarter) of up to $1.0 billion of the Company’s gross assets and 1.50% (0.375% per quarter) of any amounts over $1.0 billion of the Company’s gross assets, and is payable quarterly in arrears. The base management fee will be calculated based on the average value of the Company’s gross assets at the end of the two most recently completed calendar quarters and will be appropriately pro-rated for any partial quarter.
Incentive Fee
The incentive fee has two components, as follows:
Incentive Fee Based on Income
The first component of the incentive fee is payable quarterly in arrears and is based on our pre-incentive fee net investment income earned during the calendar quarter for which the incentive fee is being calculated. MCC Advisors is entitled to receive the incentive fee on net investment income from us if our Ordinary Income (as defined below) exceeds a quarterly “hurdle rate” of 1.5%. The hurdle amount is calculated after making appropriate adjustments to the Company’s net assets, as determined as of the beginning of each applicable calendar quarter, in order to account for any capital raising or other capital actions as a result of any issuances by the Company of its common stock (including issuances pursuant to our dividend reinvestment plan), any repurchase by the Company of its own common stock, and any dividends paid by the Company, each as may have occurred during the relevant quarter.
Beginning with the calendar quarter that commenced on January 1, 2016, the incentive fee on net investment income will be determined and paid quarterly in arrears at the end of each calendar quarter by reference to our aggregate net investment income, as adjusted as described below, from the calendar quarter then ending and the eleven preceding calendar quarters (or if shorter, the number of quarters that have occurred since January 1, 2016). We refer to such period as the “Trailing Twelve Quarters.”
The hurdle amount for the incentive fee on net investment income is determined on a quarterly basis, and is equal to 1.5% multiplied by the Company’s net asset value at the beginning of each applicable calendar quarter comprising the relevant Trailing Twelve Quarters. The hurdle amount is calculated after making appropriate adjustments to the Company’s net assets, as determined as of the beginning of each applicable calendar quarter, in order to account for any capital raising or other capital actions as a result of any issuances by the Company of its common stock (including issuances pursuant to our dividend reinvestment plan), any repurchase by the Company of its own common stock, and any dividends paid by the Company, each as may have occurred during the relevant quarter. The incentive fee for any partial period will be appropriately prorated. Any incentive fee on net investment income will be paid to MCC Advisors on a quarterly basis, and will be based on the amount by which (A) aggregate net investment income (“Ordinary Income”) in respect of the relevant Trailing Twelve Quarters exceeds (B) the hurdle amount for such Trailing Twelve Quarters. The amount of the excess of (A) over (B) described in this paragraph for such Trailing Twelve Quarters is referred to as the “Excess Income Amount.” For the avoidance of doubt, Ordinary Income is net of all fees and expenses, including the reduced base management fee but excluding any incentive fee on Pre-Incentive Fee net investment income or on the Company’s capital gains.
| F-54 |
Quarterly Incentive Fee Based on Income
The incentive fee on net investment income for each quarter is determined as follows:
| · | No incentive fee on net investment income is payable to MCC Advisors for any calendar quarter for which there is no Excess Income Amount. |
| · | 100% of the Ordinary Income, if any, that exceeds the hurdle amount, but is less than or equal to an amount, which we refer to as the “Catch-up Amount,” determined as the sum of 1.8182% multiplied by the Company’s net assets at the beginning of each applicable calendar quarter, as adjusted as noted above, comprising the relevant Trailing Twelve Quarters is included in the calculation of the incentive fee on net investment income; and |
| · | 17.5% of the Ordinary Income that exceeds the Catch-up Amount is included in the calculation of the incentive fee on net investment income. |
The amount of the incentive fee on net investment income that will be paid to MCC Advisors for a particular quarter will equal the excess of the incentive fee so calculated minus the aggregate incentive fees on net investment income that were paid in respect of the first eleven calendar quarters (or the portion thereof) included in the relevant Trailing Twelve Quarters but not in excess of the Incentive Fee Cap (as described below).
The incentive fee on net investment income that is paid to MCC Advisors for a particular quarter is subject to a cap (the “Incentive Fee Cap”). The Incentive Fee Cap for any quarter is an amount equal to (a) 17.5% of the Cumulative Net Return (as defined below) during the relevant Trailing Twelve Quarters minus (b) the aggregate incentive fees on net investment income that were paid in respect of the first eleven calendar quarters (or the portion thereof) included in the relevant Trailing Twelve Quarters.
“Cumulative Net Return” means (x) the Ordinary Income in respect of the relevant Trailing Twelve Quarters minus (y) any Net Capital Loss (as described below), if any, in respect of the relevant Trailing Twelve Quarters. If, in any quarter, the Incentive Fee Cap is zero or a negative value, the Company will pay no incentive fee on net investment income to MCC Advisors for such quarter. If, in any quarter, the Incentive Fee Cap for such quarter is a positive value but is less than the incentive fee on net investment income that is payable to MCC Advisors for such quarter (before giving effect to the Incentive Fee Cap) calculated as described above, the Company will pay an incentive fee on net investment income to MCC Advisors equal to the Incentive Fee Cap for such quarter. If, in any quarter, the Incentive Fee Cap for such quarter is equal to or greater than the incentive fee on net investment income that is payable to MCC Advisors for such quarter (before giving effect to the Incentive Fee Cap) calculated as described above, the Company will pay an incentive fee on net investment income to MCC Advisors, calculated as described above, for such quarter without regard to the Incentive Fee Cap.
“Net Capital Loss” in respect of a particular period means the difference, if positive, between (i) aggregate capital losses, whether realized or unrealized, and dilution to the Company’s net assets due to capital raising or capital actions, in such period and (ii) aggregate capital gains, whether realized or unrealized and accretion to the Company’s net assets due to capital raising or capital action, in such period.
Dilution to the Company’s net assets due to capital raising is calculated, in the case of issuances of common stock, as the amount by which the net asset value per share was adjusted over the transaction price per share, multiplied by the number of shares issued. Accretion to the Company’s net assets due to capital raising is calculated, in the case of issuances of common stock (including issuances pursuant to our dividend reinvestment plan), as the excess of the transaction price per share over the amount by which the net asset value per share was adjusted, multiplied by the number of shares issued. Accretion to the Company’s net assets due to other capital action is calculated, in the case of repurchases by the Company of its own common stock, as the excess of the amount by which the net asset value per share was adjusted over the transaction price per share multiplied by the number of shares repurchased by the Company.
For the avoidance of doubt, the purpose of the new incentive fee calculation under the Fee Waiver Agreement is to permanently reduce aggregate fees payable to MCC Advisors by the Company, effective as of January 1, 2016. In order to ensure that the Company will pay MCC Advisors lesser aggregate fees on a cumulative basis, as calculated beginning January 1, 2016, we will, at the end of each quarter, also calculate the base management fee and incentive fee on net investment income owed by the Company to MCC Advisors based on the formula in place prior to January 1, 2016. If, at any time beginning January 1, 2016, the aggregate fees on a cumulative basis, as calculated based on the formula in place after January 1, 2016, would be greater than the aggregate fees on a cumulative basis, as calculated based on the formula in place prior to January 1, 2016, MCC Advisors shall only be entitled to the lesser of those two amounts.
The second component of the incentive fee is determined and payable in arrears as of the end of each calendar year (or upon termination of the investment management agreement as of the termination date) and equals 20.0% of our cumulative aggregate realized capital gains less cumulative realized capital losses, unrealized capital depreciation (unrealized depreciation on a gross investment-by-investment basis at the end of each calendar year) and all capital gains upon which prior performance-based capital gains incentive fee payments were previously made to the investment adviser.
| F-55 |
Under GAAP, the Company calculates the second component of the incentive fee as if the Company had realized all assets at their fair values as of the reporting date. Accordingly, the Company accrues a provisional capital gains incentive fee taking into account any unrealized gains or losses. As the provisional capital gains incentive fee is subject to the performance of investments until there is a realization event, the amount of the provisional capital gains incentive fee accrued at a reporting date may vary from the capital gains incentive that is ultimately realized and the differences could be material.
For the year ended September 30, 2016, base management and incentive fees, net of fees waived under the Fee Waiver Agreement were $19.3 million and $8.0 million, respectively.
For the years ended September 30, 2016, 2015, and 2014, the Company incurred base management fees to MCC Advisors of $19.5 million, $22.5 million, and $17.7 million, respectively. For the years ended September 30, 2016, 2015, and 2014, we incurred $11.5 million, $18.2 million, and $18.7 million of incentive fees related to pre-incentive fee net investment income, respectively.
As of September 30, 2016 and 2015, $4.6 million and $10.0 million were included in “management and incentive fees payable,” in the accompanying Consolidated Statements of Assets and Liabilities.
Administration Agreement
On January 19, 2011, the Company entered into an administration agreement with MCC Advisors. Pursuant to this agreement, MCC Advisors furnishes us with office facilities and equipment, clerical, bookkeeping, recordkeeping and other administrative services related to the operations of the Company. We reimburse MCC Advisors for our allocable portion of overhead and other expenses incurred by it performing its obligations under the administration agreement, including rent and our allocable portion of the cost of certain of our officers and their respective staff. From time to time, our administrator may pay amounts owed by us to third-party service providers and we will subsequently reimburse our administrator for such amounts paid on our behalf. For the years ended September 30, 2016, 2015, and 2014, we incurred $3.9 million, $4.1 million and $3.4 million in administrator expenses, respectively.
Note 7. Related Party Transactions
Investment in Loan Participations
As discussed in Note 1, the Loan Assets contributed to the Company by MOF LP and MOF LTD upon consummation of the Company’s IPO were in the form of loan participations with an affiliated entity managed by affiliates of MCC Advisors.
Due to Affiliate
Due to affiliate consists of certain general and administrative expenses paid by an affiliate on behalf of the Company.
Other Related Party Transactions
Certain affiliates of MCC Advisors, Medley Capital LLC, their respective affiliates and some of their employees purchased in the IPO an aggregate of 833,333 shares of common stock at the initial public offering price per share of $12.00. The Company received the full proceeds from the sale of these shares, and no underwriting discounts or commissions were paid in respect of these shares.
On February 23, 2012, MOF LTD and MOF LP sold 4,406,301 shares of common stock at a price of $11.13 per share. The Company did not receive any of the proceeds of the sale of these shares. In April and May 2012, MOF LTD and MOF LP distributed the remaining 946,293 shares of common stock to their investors and as of June 30, 2012, MOF LTD and MOF LP collectively no longer own shares of our common stock.
Opportunities for co-investments may arise when MCC Advisors or an affiliated adviser becomes aware of investment opportunities that may be appropriate for the Company and other clients, or affiliated funds. As a BDC, the Company was substantially limited in its ability to co-invest in privately negotiated transactions with affiliated funds until it obtained an exemptive order from the SEC on November 25, 2013 (the “Exemptive Order”). The Exemptive Order permits the Company to participate in negotiated co-investment transactions with certain affiliates, each of whose investment adviser is Medley, LLC, the parent company of Medley Capital LLC and MCC Advisors, or an investment adviser controlled by Medley, LLC in a manner consistent with its investment objective, strategies and restrictions, as well as regulatory requirements and other pertinent factors. Co-investment under the Exemptive Order is subject to certain conditions therein, including the condition that, in the case of each co-investment transaction, the Company’s Board of Directors determines that it would be advantageous for the Company to co-invest in a manner described in the Exemptive Order. Before receiving the Exemptive Order, the Company only participated in co-investments that were allowed under existing regulatory guidance, such as syndicated loan transactions where price was the only negotiated term, which limited the types of investments that the Company could make.
| F-56 |
Note 8. Commitments
Unfunded commitments
As of September 30, 2016 and 2015, we had commitments under loan and financing agreements to fund up to $9.2 million to 8 portfolio companies and $28.1 million to 12 portfolio companies, respectively. These commitments are primarily composed of senior secured term loans and a revolver and an analysis of their fair value is included in the Consolidated Schedule of Investments. The commitments are generally subject to the borrowers meeting certain criteria such as compliance with covenants and certain operational metrics. The terms of the borrowings and financings subject to commitment are comparable to the terms of other loan and equity securities in our portfolio. A summary of the composition of the unfunded commitments as of September 30, 2016 and 2015 is shown in the table below (dollars in thousands):
| As of | ||||||||
| September 30, 2016 | September 30, 2015 | |||||||
| Tenere Acquisition Corp. | $ | 2,000 | $ | 2,000 | ||||
| DHISCO Electronic Distribution, Inc. - Revolver | 1,905 | 3,048 | ||||||
| AAR Intermediate Holdings, LLC - Revolver | 1,797 | - | ||||||
| Black Angus Steakhouses, LLC - Delayed Draw Term Loan | 893 | 893 | ||||||
| Brantley Transportation LLC - Delayed Draw Term Loan | 863 | - | ||||||
| CP OPCO LLC - Revolver | 609 | - | ||||||
| Lydell Jewelry Design Studio, LLC - Delayed Draw Term Loan | 500 | - | ||||||
| Black Angus Steakhouses, LLC - Revolver | 446 | 446 | ||||||
| Access Media Holdings, LLC - Series AA Preferred Equity | 184 | - | ||||||
| Be Green Packaging, LLC - Revolver | - | 479 | ||||||
| Red Skye Wireless LLC | - | 7,500 | ||||||
| RCS Management Corporation & Specialized Medical Services, Inc. | - | 5,000 | ||||||
| Autosplice, Inc. | - | 3,026 | ||||||
| Freedom Powersports LLC - Delayed Draw Term Loan | - | 1,800 | ||||||
| Point.360 | - | 1,600 | ||||||
| Be Green Packaging, LLC - Delayed Draw Term Loan | - | 750 | ||||||
| Ship Supply Acquisition Corporation | - | 622 | ||||||
| Meridian Behavioral Health, LLC - Term Loan B | - | 500 | ||||||
| Access Media Holdings, LLC - Series A Preferred Equity | - | 424 | ||||||
| Total | $ | 9,197 | $ | 28,088 | ||||
Legal Proceedings
We are a party to certain legal proceedings incidental to the normal course of our business, including where third parties may try to seek to impose liability on us in connection with the activities of our portfolio companies. While the outcome of these legal proceedings cannot at this time be predicted with certainty, we do not expect that these proceedings will have a material effect on our financial condition or results of operations.
| F-57 |
Note 9. Fee Income
Fee income consists of origination/closing fee, amendment fee, prepayment penalty, administrative agent fee, transaction break-up fee and other miscellaneous fees. The following tables summarize the Company’s fee income for the years ended September 30, 2016, 2015 and 2014 (dollars in thousands):
| For the years ended September 30 | ||||||||||||
| 2016 | 2015 | 2014 | ||||||||||
| Amendment fee | $ | 2,563 | $ | 2,637 | $ | 1,962 | ||||||
| Prepayment fee | 2,551 | 2,306 | 8,728 | |||||||||
| Origination fee | 1,381 | 4,966 | 16,818 | |||||||||
| Administrative agent fee | 684 | 587 | 573 | |||||||||
| Other fees | 276 | 240 | 871 | |||||||||
| Transaction break-up fee | - | - | 122 | |||||||||
| Fee income | $ | 7,455 | $ | 10,736 | $ | 29,074 | ||||||
Note 10. Directors Fees
The independent directors each receive an annual fee of $55,000. They also receive $7,500 plus reimbursement of reasonable out-of-pocket expenses incurred in connection with attending each board meeting and receive $2,500 plus reimbursement of reasonable out-of-pocket expenses incurred in connection with attending each committee meeting. In addition, the chairman of the audit committee receives an annual fee of $25,000 and the chairman of each other committee receives an annual fee of $10,000 for their additional services in these capacities. In addition, other members of the audit committee receive an annual fee of $12,500 and other members of each other committee receive an annual fee of $6,000. No compensation is paid to directors who are “interested persons” of the Company (as such term is defined in the 1940 Act). For the years ended September 30, 2016, 2015, and 2014, we accrued $0.5 million, $0.6 million, and $0.6 million for directors’ fees expense, respectively.
Note 11. Earnings Per Share
In accordance with the provisions of ASC Topic 260 - Earnings per Share, basic earnings per share is computed by dividing earnings available to common shareholders by the weighted average number of shares outstanding during the period. Other potentially dilutive common shares, and the related impact to earnings, are considered when calculating earnings per share on a diluted basis.
| F-58 |
The following information sets forth the computation of the weighted average basic and diluted net increase in net assets per share from operations for the years ended September 30, 2016, 2015, and 2014 (dollars in thousands except share and per share amounts):
| For the years ended September 30 | ||||||||||||
| 2016 | 2015 | 2014 | ||||||||||
| Basic and diluted: | ||||||||||||
| Net increase/(decrease) in net assets from operations | $ | (27,962 | ) | $ | (14,758 | ) | $ | 52,158 | ||||
| Weighted average common shares outstanding | 55,399,646 | 57,624,779 | 47,366,892 | |||||||||
| Earnings per common share-basic and diluted | $ | (0.50 | ) | $ | (0.26 | ) | $ | 1.10 | ||||
| F-59 |
Note 12. Financial Highlights
The following is a schedule of financial highlights for the years ended September 30, 2016, 2015, 2014, 2013 and 2012:
| For the years ended September 30 | ||||||||||||||||||||
| 2016 | 2015 | 2014 | 2013 | 2012 | ||||||||||||||||
| Per share data: | ||||||||||||||||||||
| Net asset value per share at beginning of year | $ | 11.00 | $ | 12.43 | $ | 12.70 | $ | 12.52 | $ | 12.57 | ||||||||||
| Net investment income(1) | 0.97 | 1.27 | 1.58 | 1.53 | 1.31 | |||||||||||||||
| Net realized gains/(losses) on investments | (0.71 | ) | (1.06 | ) | 0.01 | 0.01 | 0.00 | |||||||||||||
| Net unrealized appreciation/(depreciation) on investments | (0.76 | ) | (0.46 | ) | (0.46 | ) | (0.24 | ) | (0.06 | ) | ||||||||||
| Change in provision for deferred taxes on unrealized appreciation/(depreciation) on investments | - | (0.01 | ) | (0.03 | ) | - | - | |||||||||||||
| Net increase/(decrease) in net assets | (0.50 | ) | (0.26 | ) | 1.10 | 1.30 | 1.25 | |||||||||||||
| Distributions from net investment income | (1.12 | ) | (1.27 | ) | (1.33 | ) | (1.34 | ) | (1.12 | ) | ||||||||||
| Distributions from net realized gains | - | (0.00 | ) | (0.02 | ) | (0.02 | ) | (0.01 | ) | |||||||||||
| Distributions from tax return of capital | - | - | (0.13 | ) | (0.09 | ) | (0.07 | ) | ||||||||||||
| Issuance of common stock, net of underwriting costs | - | - | 0.09 | 0.28 | (0.02 | ) | ||||||||||||||
| Repurchase of common stock under stock repurchase program | 0.11 | 0.12 | - | - | - | |||||||||||||||
| Offering costs | - | - | (0.01 | ) | (0.02 | ) | (0.01 | ) | ||||||||||||
| Other(2) | - | (0.02 | ) | 0.03 | 0.07 | (0.07 | ) | |||||||||||||
| Net asset value at end of year | $ | 9.49 | $ | 11.00 | $ | 12.43 | $ | 12.70 | $ | 12.52 | ||||||||||
| Net assets at end of year | $ | 516,919,142 | $ | 619,920,384 | $ | 729,856,881 | $ | 509,834,455 | $ | 289,339,231 | ||||||||||
| Shares outstanding at end of year | 54,474,211 | 56,337,152 | 58,733,284 | 40,152,904 | 23,110,242 | |||||||||||||||
| Per share market value at end of year | $ | 7.63 | $ | 7.44 | $ | 11.81 | $ | 13.79 | $ | 14.07 | ||||||||||
| Total return based on market value(3) | 19.37 | % | (27.56 | )% | (3.98 | )% | 9.01 | % | 54.58 | % | ||||||||||
| Total return based on net asset value(4) | 0.42 | % | 1.76 | % | 9.73 | % | 12.83 | % | 10.30 | % | ||||||||||
| Portfolio turnover rate | 8.86 | % | 18.33 | % | 33.95 | % | 25.25 | % | 25.39 | % | ||||||||||
| F-60 |
The following is a schedule of ratios and supplemental data for the years ended September 30, 2016, 2015, 2014, 2013, and 2012:
| For the years ended September 30 | ||||||||||||||||||||
| 2016 | 2015 | 2014 | 2013 | 2012 | ||||||||||||||||
| Ratios: | ||||||||||||||||||||
| Ratio of net investment income to average net assets after waivers(5)(6) | 9.97 | % | 11.00 | % | 12.00 | % | 11.19 | % | 9.96 | % | ||||||||||
| Ratio of total expenses to average net assets after waivers(5)(6) | 12.49 | % | 11.51 | % | 10.40 | % | 10.27 | % | 8.90 | % | ||||||||||
| Ratio of incentive fees to average net assets after waivers(6) | 1.49 | % | 2.75 | % | 3.00 | % | 2.80 | % | 2.49 | % | ||||||||||
| Supplemental Data: | ||||||||||||||||||||
| Ratio of net operating expenses and credit facility related expenses to average net assets(5)(6) | 11.00 | % | 8.75 | % | 7.40 | % | 7.47 | % | 6.39 | % | ||||||||||
| Percentage of non-recurring fee income(7) | 5.61 | % | 6.80 | % | 20.45 | % | 17.48 | % | 13.66 | % | ||||||||||
| Average debt outstanding(8) | $ | 553,012,824 | $ | 568,202,466 | $ | 357,547,464 | $ | 198,994,397 | $ | 69,375,137 | ||||||||||
| Average debt outstanding per common share | $ | 9.98 | $ | 9.86 | $ | 7.55 | $ | 6.58 | $ | 3.87 | ||||||||||
| Asset coverage ratio per unit(9) | 2,414 | 2,318 | 2,732 | 3,256 | 3,630 | |||||||||||||||
| Average market value per unit: | ||||||||||||||||||||
| Facilities(10) | N/A | N/A | N/A | N/A | N/A | |||||||||||||||
| SBA debentures(10) | N/A | N/A | N/A | N/A | N/A | |||||||||||||||
| Notes due 2019 | $ | 25.44 | $ | 25.26 | $ | 25.62 | $ | 25.61 | $ | 25.47 | ||||||||||
| Notes due 2021 | $ | 25.48 | N/A | N/A | N/A | N/A | ||||||||||||||
| Notes due 2023 | $ | 25.19 | $ | 24.79 | $ | 24.76 | $ | 23.74 | $ | N/A | ||||||||||
| (1) | Net investment income excluding management and incentive fee waivers based on total weighted average common stock outstanding equals $0.90 per share for the year ended September 30, 2016. Net investment income based on total weighted average common stock outstanding equals $1.27, $1.58, and $1.53 per share for the years ended September 30, 2015, 2014, and 2013, respectively. Net investment income excluding management and incentive fee waivers based on total weighted average common stock outstanding equals $1.31 per share for the year ended September 30, 2012. |
| (2) | Represents the impact of the different share amounts used in calculating per share data as a result of calculating certain per share data based upon the weighted average basic shares outstanding during the period and certain per share data based on the shares outstanding as of a period end or transaction date. |
| (3) | Total annual return is historical and assumes changes in share price, reinvestments of all dividends and distributions at prices obtained under the Company’s dividend reinvestment plan, and no sales change for the period. |
| (4) | Total annual return is historical and assumes changes in net assets value, reinvestments of all dividends and distributions at prices obtained under the Company’s dividend reinvestment plan, and no sales change for the period. |
| (5) | Ratios are annualized during interim periods. |
| (6) | For the year ended September 30, 2016, excluding management and incentive fee waivers, the ratio of net investment income, operating expenses, incentive fees, credit facility related expenses and total expenses to average net assets is 9.29%, 5.40%, 2.14%, 5.63%, and 13.17%, respectively. |
| (7) | Represents the impact of the non-recurring fees over investment income. |
| (8) | Based on daily weighted average balance of debt outstanding during the period. |
| (9) | Asset coverage per unit is the ratio of the carrying value of our total consolidated assets, less all liabilities and indebtedness not represented by senior securities, to the aggregate amount of senior securities representing indebtedness. Asset coverage per unit is expressed in terms of dollar amounts per $1,000 of indebtedness. Asset coverage ratio per unit does not include unfunded commitments. The inclusion of unfunded commitments in the calculation of the asset coverage ratio per unit would not cause us to be below the required amount of regulatory coverage. |
| (10) | The Facilities and SBA Debentures are not registered for public trading. |
| F-61 |
Note 13. Dividends
Dividends and distributions to common stockholders are recorded on the ex-dividend date. The amount to be paid out as a dividend is determined by our board of directors.
We have adopted an “opt out” dividend reinvestment plan for our common stockholders. As a result, if we declare a cash dividend or other distribution, each stockholder that has not “opted out” of our dividend reinvestment plan will have its dividends automatically reinvested in additional shares of our common stock rather than receiving cash dividends. Stockholders who receive distributions in the form of shares of common stock will be subject to the same federal, state and local tax consequences as if they received cash distributions.
The following table summarizes the Company’s dividend distributions during the years ended September 30, 2016 and 2015:
| Date Declared | Record Date | Payment Date | Amount Per Share | |||||||||
| During the year ended September 30, 2016 | ||||||||||||
| 11/5/2015 | 11/25/2015 | 12/18/2015 | $ | 0.30 | ||||||||
| 2/1/2016 | 2/24/2016 | 3/18/2016 | 0.30 | |||||||||
| 5/5/2016 | 5/25/2016 | 6/24/2016 | 0.30 | |||||||||
| 8/7/2016 | 8/24/2016 | 9/23/2016 | 0.22 | |||||||||
| $ | 1.12 | |||||||||||
| Date Declared | Record Date | Payment Date | Amount Per Share | |||||||||
| During the year ended September 30, 2015 | ||||||||||||
| 10/30/2014 | 11/26/2014 | 12/12/2014 | $ | 0.37 | ||||||||
| 2/9/2015 | 2/25/2015 | 3/13/2015 | 0.30 | |||||||||
| 5/6/2015 | 5/20/2015 | 6/12/2015 | 0.30 | |||||||||
| 8/5/2015 | 8/19/2015 | 9/11/2015 | 0.30 | |||||||||
| $ | 1.27 | |||||||||||
Note 14. Stock Repurchase Program
The following table summarizes our share repurchases under our stock repurchase program for the years ended September 30, 2016 and 2015 (dollars in thousands):
| For the year ended September 30 | ||||||||||||
| 2016 | 2015 | 2014 | ||||||||||
| Dollar amount repurchased | $ | 12,870 | $ | 21,205 | N/A | (1) | ||||||
| Shares Repurchased | 1,862,941 | 2,396,132 | N/A | (1) | ||||||||
| Average price per share | $ | 6.91 | $ | 8.89 | N/A | (1) | ||||||
| Weighted average discount to Net Asset Value | 31.0 | % | 23.5 | % | N/A | (1) | ||||||
| (1) | The Company did not repurchase any shares for the year ended September 30, 2014. |
On February 5, 2015, our board of directors approved a share repurchase program pursuant to which we can purchase up to an aggregate amount of $30.0 million of our common stock between the period of the approval date and February 5, 2016. On December 4, 2015, the board of directors extended the duration of the share repurchase program through December 31, 2016, and increased the aggregate amount to $50.0 million. Any stock repurchases will be made through the open market at times, and in such amounts, as management deems appropriate. As of September 30, 2016, the Company has repurchased an aggregate of 4,259,073 shares of common stock at an average price of $8.16 per share with a total cost of approximately $34.1 million. The maximum dollar value of shares that may yet be purchased under the plan is $15.9 million. This program may be limited or terminated at any time without prior notice. Since the inception of the program, the Company's net asset value per share was increased by approximately $0.23 as a result of the share repurchases.
| F-62 |
Note 15. Selected Quarterly Financial Data (Unaudited) (dollars in thousands)
| September 30, 2016 | June 30, 2016 | March 31, 2016 | December 31, 2015 | |||||||||||||
| Statement of Operations data: | ||||||||||||||||
| Total investment income | $ | 27,195 | $ | 28,412 | $ | 30,714 | $ | 34,427 | ||||||||
| Net investment income | 12,396 | 10,954 | 14,575 | 15,666 | ||||||||||||
| Net realized and unrealized gain/(loss) | (16,110 | ) | 3,109 | (13,994 | ) | (54,646 | ) | |||||||||
| Change in provision for deferred taxes on unrealized gain/(loss) on investments | 486 | (40 | ) | (133 | ) | (225 | ) | |||||||||
| Net increase/(decrease) in net assets resulting from operations | (3,228 | ) | 14,022 | 448 | (39,204 | ) | ||||||||||
| Earnings per share | (0.06 | ) | 0.26 | 0.01 | (0.70 | ) | ||||||||||
| Net asset value per common share at period end | $ | 9.49 | $ | 9.76 | $ | 9.80 | $ | 10.01 | ||||||||
September 30, 2015 | June 30, 2015 | March 31, 2015 | December 31, 2014 | |||||||||||||
| Statement of Operations data: | ||||||||||||||||
| Total investment income | $ | 36,607 | $ | 35,964 | $ | 36,776 | $ | 39,849 | ||||||||
| Net investment income | 17,553 | 17,240 | 17,753 | 20,390 | ||||||||||||
| Net realized and unrealized gain/(loss) | (34,868 | ) | (8,583 | ) | (5,265 | ) | (38,917 | ) | ||||||||
| Change in provision for deferred taxes on unrealized gain/(loss) on investments | 717 | (284 | ) | (705 | ) | 211 | ||||||||||
| Net increase/(decrease) in members' equity/net assets resulting from operations | (16,598 | ) | 8,373 | 11,783 | (18,316 | ) | ||||||||||
| Earnings per share | (0.29 | ) | 0.14 | 0.20 | (0.31 | ) | ||||||||||
| Net asset value per common share at period end | $ | 11.00 | $ | 11.53 | $ | 11.68 | $ | 11.74 | ||||||||
September 30, 2014 | June 30, 2014 | March 31, 2014 | December 31, 2013 | |||||||||||||
| Statement of Operations data: | ||||||||||||||||
| Total investment income | $ | 38,252 | $ | 38,072 | $ | 31,398 | $ | 31,668 | ||||||||
| Net investment income | 20,388 | 20,694 | 16,555 | 17,030 | ||||||||||||
| Net realized and unrealized gain/(loss) | (10,224 | ) | (4,006 | ) | (3,950 | ) | (2,737 | ) | ||||||||
| Net unrealized appreciation/(depreciation) on participations | (124 | ) | (29 | ) | 154 | - | ||||||||||
| Change in provision for deferred taxes on unrealized gain/(loss) on investments | (1,206 | ) | (70 | ) | (317 | ) | - | |||||||||
| Net increase/(decrease) in members' equity/net assets resulting from operations | 8,834 | 16,589 | 12,442 | 14,293 | ||||||||||||
| Earnings per share | 0.16 | 0.33 | 0.28 | 0.36 | ||||||||||||
| Net asset value per common share at period end | $ | 12.43 | $ | 12.65 | $ | 12.69 | $ | 12.68 | ||||||||
Note 16. Subsequent Events
Management has evaluated subsequent events through the date of issuance of the consolidated financial statements included herein. There have been no subsequent events that occurred during such period that would require disclosure in this Form 10-K or would be required to be recognized in the Consolidated Financial Statements as of and for the year ended September 30, 2016, except as disclosed below.
On November 3, 2016, the Company’s Board of Directors declared a quarterly dividend of $0.22 per share payable on December 23, 2016, to stockholders of record at the close of business on November 23, 2016.
On December 7, 2016, the Company's board of directors authorized an extension of the current $50 million share repurchase program through December 31, 2017.
| F-63 |
Item 9. Changes in and Disagreements with Accountants on Accounting and Financial Disclosure
None.
Item 9A. Controls and Procedures
(a) Evaluation of Disclosure Controls and Procedures
Our management, with the participation of our Chief Executive Officer and our Chief Financial Officer, evaluated the effectiveness of our disclosure controls and procedures as of September 30, 2016. The term “disclosure controls and procedures” is defined under Rules 13a-15(e) and 15d-15(e) under the Securities Exchange Act of 1934 (the “Exchange Act”), as amended. Based on the evaluation of our disclosure controls and procedures as of September 30, 2016, our Chief Executive Officer and Chief Financial Officer concluded that, as of such date, our disclosure controls and procedures were effective.
(b) Management’s Report on Internal Control Over Financial Reporting
Our management is responsible for establishing and maintaining adequate internal controls over financial reporting (as defined in Rules 13a-15(f) and 15d-15(f) of the Exchange Act). Under the supervision of our Chief Executive Officer and Chief Financial Officer, our management conducted an evaluation of the effectiveness of our internal controls over financial reporting based on the criteria established in Internal Control—Integrated Framework issued by the Committee of Sponsoring Organizations of the Treadway Commission (COSO). Based on our management’s evaluation under the framework in Internal Control—Integrated Framework , management concluded that our internal controls over financial reporting were effective as of September 30, 2016.
Because of its inherent limitations, internal controls over financial reporting may not prevent or detect misstatements. Also, projections of any evaluation of effectiveness to future periods are subject to the risk that controls may become inadequate because of changes in conditions, or that the degree of compliance with the policies or procedures may deteriorate.
(c) Audit Report of the Registered Public Accounting Firm
Our internal controls over financial reporting as of September 30, 2016 have been audited by our independent registered public accounting firm, Ernst & Young LLP, as stated in its report titled "Report of Independent Registered Public Accounting Firm" on page F-2.
(d) Changes in Internal Controls Over Financial Reporting
There has not been any change in our internal controls over financial reporting (as defined in Rule 13a-15 (f) under the Exchange Act) that occurred during the period covered by this report that has materially affected, or is reasonably likely to materially affect, our internal controls over financial reporting.
None.
| 77 |
Item 10. Directors, Executive Officers and Corporate Governance
The information required by Item 10 is hereby incorporated by reference from our definitive Proxy Statement relating to our 2017 Annual Meeting of Stockholders, to be filed with the Securities and Exchange Commission within 120 days following the end of our fiscal year.
Item 11. Executive Compensation
The information required by Item 11 is hereby incorporated by reference from our definitive Proxy Statement relating to our 2017 Annual Meeting of Stockholders, to be filed with the Securities and Exchange Commission within 120 days following the end of our fiscal year.
Item 12. Security Ownership of Certain Beneficial Owners and Management and Related Stockholder Matters
The information required by Item 12 is hereby incorporated by reference from our definitive Proxy Statement relating to our 2017 Annual Meeting of Stockholders, to be filed with the Securities and Exchange Commission within 120 days following the end of our fiscal year.
Item 13. Certain Relationships and Related Transactions, and Director Independence
The information required by Item 13 is hereby incorporated by reference from our definitive Proxy Statement relating to our 2017 Annual Meeting of Stockholders, to be filed with the Securities and Exchange Commission within 120 days following the end of our fiscal year.
Item 14. Principal Accountant Fees and Services
The information required by Item 14 is hereby incorporated by reference from our definitive Proxy Statement relating to our 2017 Annual Meeting of Stockholders, to be filed with the Securities and Exchange Commission within 120 days following the end of our fiscal year.
| 78 |
Item 15. Exhibits and Financial Statement Schedules
| a. | The following documents are filed as part of this Annual Report: |
The following financial statements are set forth in Item 8:
| Page | ||
| Report of Independent Registered Public Accounting Firm | F-1 | |
| Report of Independent Registered Public Accounting Firm on Internal Control Over Financial Reporting | F-2 | |
| Consolidated Statements of Assets and Liabilities as of September 30, 2016 and 2015 | F-3 | |
| Consolidated Statements of Operations for the years ended September 30, 2016, 2015 and 2014 | F-4 | |
| Consolidated Statements of Changes in Net Assets for the years ended September 30, 2016, 2015 and 2014 | F-5 | |
| Consolidated Statements of Cash Flows for the years ended September 30, 2016, 2015 and 2014 | F-6 | |
| Consolidated Schedules of Investments as of September 30, 2016 and 2015 | F-7 | |
| Notes to Consolidated Financial Statements | F-26 |
| b. | Exhibits: |
The following exhibits are filed as part of this report or hereby incorporated by reference to exhibits previously filed with the SEC:
| 3.1 | Certificate of Incorporation (Incorporated by reference to Exhibit 99.A.3 to the Registrant’s Pre-effective Amendment No. 3 to the Registration Statement on Form N-2, filed on November 22, 2010). |
| 3.2 | Form of Bylaws (Incorporated by reference to Exhibit 99.B.3 to the Registrant’s Pre-effective Amendment No. 3 to the Registration Statement on Form N-2, filed on November 22, 2010). |
| 4.1 | Form of Stock Certificate (Incorporated by reference to Exhibit 99.D to the Registrant’s Pre-effective Amendment No. 3 to the Registration Statement on Form N-2, filed on November 22, 2010). |
| 4.2 | Indenture, dated February 7, 2012, between Medley Capital Corporation and U.S. Bank National Association, as Trustee (Incorporated by reference to Exhibit 99.D.2 to the Registrant’s Pre-Effective Amendment No. 1 to the Registration Statement on Form N-2 (File No. 333-179237), filed on February 13, 2012). |
| 4.3 | First Supplemental Indenture, dated March 21, 2012, between Medley Capital Corporation and U.S. Bank National Association, as Trustee (Incorporated by reference to Exhibit 99.D.4 to the Registrant’s Post-Effective Amendment No. 2 to the Registrant Statement on Form N-2 (File No. 333-179237), filed on March 21, 2012). |
| 4.4 | Second Supplemental Indenture, dated March 18, 2013, between Medley Capital Corporation and U.S. Bank National Association, as Trustee (Incorporated by reference to Exhibit 99.D.4 to the Registrant’s Post-Effective Amendment No. 7 to the Registrant Statement on Form N-2 (File No. 333-179237), filed on March 15, 2013). |
| 4.5 | Statement of Eligibility of Trustee on Form T-1 (Incorporated by reference to Exhibit d.5 to the Registrant’s Registration Statement on Form N-2, filed on March 15, 2013). |
| 10.1 | Form of Amended and Restated Investment Management Agreement between Registrant and MCC Advisors LLC (Incorporated by reference to Exhibit 99.G to Registrant’s Post-Effective Amendment No. 3 to the Registration Statement on N-2, filed on December 10, 2013). |
| 10.2 | Letter from MCC Advisors LLC re: Waiver of Base Management Fee and Incentive Fee on Net Investment Income, dated February 8, 2016 (Incorporated by reference to Exhibit 99.K.5 to Registrant’s Pre-Effective Amendment No. 1 to the Registration Statement on Form N-2 (File No. 333-208746), filed on March 25, 2016). |
| 10.3 | Form of Custody Agreement (Incorporated by reference to Exhibit 99.J to the Registrant’s Pre-effective Amendment No. 3 to the Registration Statement on Form N-2, filed on November 22, 2010). |
| 10.4 | Form of Administration Agreement (Incorporated by reference to Exhibit 99.K to the Registrant’s Pre-effective Amendment No. 1 to the Registration Statement on Form N-2, filed on June 9, 2010). |
| 10.5 | Form of Sub-Administration Agreement (Incorporated by reference to Exhibit 99.K.4 to the Registrant’s Pre-effective Amendment No. 3 to the Registration Statement on Form N-2 (File No. 333-166491), filed on November 22, 2010). |
| 79 |
| 10.6 | Form of Trademark License Agreement (Incorporated by reference to Exhibit 99.K.3 to the Registrant’s Pre-effective Amendment No. 1 to the Registration Statement on Form N-2, filed on June 9, 2010). |
| 10.7 | Dividend Reinvestment Plan (Incorporated by reference to Exhibit 99.E to the Registrant’s Pre-effective Amendment No. 3 to the Registration Statement on Form N-2, filed on November 22, 2010). |
| 10.8 | Senior Secured Revolving Credit Agreement among Medley Capital Corporation as borrower, the Lenders party thereto, and ING Capital LLC, as Administrative Agent, dated August 4, 2011 (Incorporated by reference to the Current Report on Form 8-K filed on August 9, 2011). |
| 10.9 | Guarantee, Pledge and Security Agreement among the Company, the Subsidiary Guarantors party thereto, ING Capital LLC, as Administrative Agent, each Financial Agent and Designated Indebtedness Holder party thereto and ING Capital LLC, as Collateral Agent, dated August 4, 2011 (Incorporated by reference to the Current Report on Form 8-K filed on August 9, 2011). |
| 10.10 | Amendment No. 1, dated as of August 31, 2012, to the Senior Secured Revolving Credit Agreement dated as of August 4, 2011, among Medley Capital Corporation as borrower, the Lenders party thereto, and ING Capital LLC, as Administrative Agent (Incorporated by reference to the Current Report on Form 8-K filed on September 6, 2012). |
| 10.11 | Amendment No. 2, dated as of December 7, 2012, to the Senior Secured Revolving Credit Agreement dated as of August 4, 2011, among Medley Capital Corporation as borrower, the Lenders party thereto, and ING Capital LLC, as Administrative Agent, as amended by Amendment No. 1 to the Senior Secured Revolving Credit Agreement, dated as of August 31, 2012 (Incorporated by reference to the Current Report on Form 8-K filed on December 13, 2012). |
| 10.12 | Amendment No. 3, dated as of March 28, 2013, to the Senior Secured Revolving Credit Agreement dated as of August 4, 2011, among Medley Capital Corporation as borrower, the Lenders party thereto, and ING Capital LLC, as Administrative Agent, as amended by Amendment Nos. 1 and 2 to the Senior Secured Revolving Credit Agreement, dated as of August 31, 2012 and December 7, 2012, respectively (Incorporated by reference to the Current Report on Form 8-K filed on April 2, 2013). |
| 10.13 | Senior Secured Term Loan Credit Agreement, dated as of August 31, 2012, among Medley Capital Corporation as borrower, the Lenders party thereto, and ING Capital LLC, as Administrative Agent (Incorporated by reference to the Current Report on Form 8-K filed on September 6, 2012). |
| 10.14 | Amendment No. 1, dated as of December 7, 2012, to the Senior Secured Term Loan Credit Agreement dated as of August 31, 2012, among Medley Capital Corporation as borrower, the Lenders party thereto, and ING Capital LLC, as Administrative Agent (Incorporated by reference to the Current Report on Form 8-K filed on December 13, 2012). |
| 10.15 | Amendment No. 2, dated as of January 23, 2013, to the Senior Secured Term Loan Credit Agreement dated as of August 31, 2012, among Medley Capital Corporation as borrower, the Lenders party thereto, and ING Capital LLC, as Administrative Agent, as amended by Amendment No. 1 to the Senior Secured Term Loan Credit Agreement, dated as of January 23, 2013 (Incorporated by reference to the Current Report on Form 8-K filed on January 29, 2013). |
| 10.16 | Amendment No. 3, dated as of March 28, 2013, to the Senior Secured Term Loan Credit Agreement, dated as of August 31, 2012, among Medley Capital Corporation as borrower, the Lenders party thereto, and ING Capital LLC, as Administrative Agent, as amended by Amendment Nos. 1 and 2 to the Senior Secured Term Loan Credit Agreement, dated as of December 7, 2012 and January 23, 2013, respectively (Incorporated by reference to the Current Report on Form 8-K filed on April 2, 2013). |
| 10.17 | Amendment No. 4, dated as of May 1, 2013, to the Senior Secured Revolving Credit Agreement, dated as of August 4, 2011, among Medley Capital Corporation as borrower, the Lenders party thereto, and ING Capital LLC, as Administrative Agent, as amended by Amendment Nos. 1, 2 and 3 to the Senior Secured Revolving Credit Agreement, dated as of August 31, 2012, December 7, 2012 and March 28, 2013, respectively (Incorporated by reference to the Current Report on Form 8-K filed on May 7, 2013). |
| 10.18 | Amendment No. 4, dated as of May 1, 2013, to the Senior Secured Term Loan Credit Agreement, dated as of August 31, 2012, among Medley Capital Corporation as borrower, the Lenders party thereto, and ING Capital LLC, as Administrative Agent, as amended by Amendment Nos. 1, 2 and 3 to the Senior Secured Term Loan Credit Agreement, dated as of December 7, 2012, January 23, 2013 and March 28, 2013, respectively (Incorporated by reference to the Current Report on Form 8-K filed on May 7, 2013). |
| 80 |
| 10.19 | Amendment No. 5, dated as of June 2, 2014, to the Senior Secured Revolving Credit Agreement, dated as of August 4, 2011, among Medley Capital Corporation as borrower, the Lenders party thereto, and ING Capital LLC, as Administrative Agent, as amended by Amendment Nos. 1, 2, 3 and 4 to the Senior Secured Revolving Credit Agreement, dated as of August 31, 2012, December 7, 2012, March 28, 2013 and May 1, 2013, respectively (Incorporated by reference to the Current Report on Form 8-K filed on June 3, 2014). |
| 10.20 | Amendment No. 5, dated as of June 2, 2014, to the Senior Secured Term Loan Credit Agreement, dated as of August 31, 2012, among Medley Capital Corporation as borrower, the Lenders party thereto, and ING Capital LLC, as Administrative Agent, as amended by Amendment Nos. 1, 2, 3 and 4 to the Senior Secured Term Loan Credit Agreement, dated as of December 7, 2012, January 23, 2013, March 28, 2013 and May 1, 2013, respectively (Incorporated by reference to the Current Report on Form 8-K filed on June 3, 2014). |
| 10.21 | Amendment No. 6, dated as of February 2, 2015, to the Senior Secured Revolving Credit Agreement, dated as of August 4, 2011, among Medley Capital Corporation as borrower, the Lenders party thereto, and ING Capital LLC, as Administrative Agent, as amended by Amendment Nos. 1, 2, 3, 4 and 5 to the Senior Secured Revolving Credit Agreement, dated as of August 31, 2012, December 7, 2012, March 28, 2013, May 1, 2013 and June 2, 2014, respectively (Incorporated by reference to Exhibit 10.1 to the Registrant’s Quarterly Report on Form 10-Q filed on February 9, 2015). |
| 10.22 | Amendment No. 6 to the Senior Secured Term Loan Credit Agreement, dated as of August 31, 2012, among Medley Capital Corporation as borrower, the Lenders party thereto, and ING Capital LLC, as Administrative Agent, as amended by Amendment Nos. 1, 2, 3, 4 and 5 to the Senior Secured Term Loan Credit Agreement, dated as of December 7, 2012, January 23, 2013, March 28, 2013, May 1, 2013 and June 2, 2014, respectively (Incorporated by reference to Exhibit 10.2 to the Registrant’s Quarterly Report on Form 10-Q filed on February 9, 2015). |
| 10.23 | Amendment No. 1 to Amended and Restated Senior Secured Revolving Credit Agreement, dated as of September 16, 2016, by and among the Company as borrower, MCC Investment Holdings LLC, MCC Investment Holdings Sendero LLC, MCC Investment Holdings RT1 LLC, MCC Investment Holdings Omnivore LLC, MCC Investment Holdings Amvestar, LLC, and MCC Investment Holdings AAR, LLC, as subsidiary guarantors, the Lenders party thereto and ING Capital LLC, as Administrative Agent (Incorporated by reference to the Current Report on Form 8-K filed on September 22, 2016). |
| 10.24 | Amendment No. 1 to Amended and Restated Senior Secured Term Loan Credit Agreement dated as of September 16, 2016, by and among the Company as borrower, MCC Investment Holdings LLC, MCC Investment Holdings Sendero LLC, MCC Investment Holdings RT1 LLC, MCC Investment Holdings Omnivore LLC, MCC Investment Holdings Amvestar, LLC, and MCC Investment Holdings AAR, LLC, as subsidiary guarantors, the Lenders party thereto and ING Capital LLC, as Administrative Agent (Incorporated by reference to the Current Report on Form 8-K filed on September 22, 2016). |
| 10.25 | Incremental Assumption Agreement, dated as of February 10, 2012, made by Credit Suisse AG, Cayman Islands Branch, as Assuming Lender, relating to the Senior Secured Revolving Credit Agreement dated as of August 4, 2011, among Medley Capital Corporation, as Borrower, the Several Lenders and Agents from Time to Time Parties Thereto, and ING Capital LLC, as Administrative Agent and Collateral Agent (Incorporated by reference to the Current Report on Form 8-K filed on February 10, 2012). |
| 10.26 | Incremental Assumption Agreement dated as of March 30, 2012, made by Onewest Bank, FSB, as Assuming Lender, relating to the Senior Secured Revolving Credit Agreement dated as of August 4, 2011, among Medley Capital Corporation, as Borrower, the Several Lenders and Agents from Time to Time Parties Thereto, and ING Capital LLC, as Administrative Agent and Collateral Agent (Incorporated by reference to the Current Report on Form 8-K filed on April 4, 2012). |
| 10.27 | Incremental Assumption Agreement dated as of May 3, 2012, made by Doral Bank, as Assuming Lender, relating to the Senior Secured Revolving Credit Agreement dated as of August 4, 2011, among Medley Capital Corporation, as Borrower, the Several Lenders and Agents from Time to Time Parties Thereto, and ING Capital LLC, as Administrative Agent and Collateral Agent (Incorporated by reference to the Current Report on Form 8-K filed on May 3, 2012). |
| 10.28 | Incremental Assumption Agreement dated as of September 25, 2012, made by Stamford First Bank, a division of the Bank of New Canaan, as Assuming Lender, relating to the Senior Secured Revolving Credit Agreement dated as of August 4, 2011, as amended by Amendment No. 1, dated as of August 31, 2012, among Medley Capital Corporation, as Borrower, the Several Lenders and Agents from Time to Time Parties Thereto, and ING Capital LLC, as Administrative Agent and Collateral Agent (Incorporated by reference to the Current Report on Form 8-K filed on September 28, 2012). |
| 10.29 | Limited Liability Company Operating Agreement of MCC Senior Loan Strategy JV I LLC, a Delaware Limited Liability Company, dated as of March 27, 2015 (Incorporated by reference to the Current Report on Form 8-K filed on March 30, 2015). |
| 10.30 | Amended and Restated Senior Secured Revolving Credit Agreement, dated as of July 28, 2015, by and among the Company as borrower, each of the subsidiary guarantors party thereto, the Lenders party thereto and ING Capital LLC, as Administrative Agent (Incorporated by reference to the Current Report on Form 8-K filed on July 30, 2015). |
| 10.31 | Amended and Restated Senior Secured Term Loan Credit Agreement dated as of July 28, 2015, by and among the Company as borrower, each of the subsidiary guarantors party thereto, the Lenders party thereto and ING Capital LLC, as Administrative Agent (Incorporated by reference to the Current Report on Form 8-K filed on July 30, 2015). |
| 14.1 | Code of Business Conduct and Ethics of the Registrant (Incorporated by reference to Exhibit 14.1 to the Registrant’s 10-Q for the period ended June 30, 2011, filed on August 4, 2011). |
| 81 |
| 14.2 | Code of Business Ethics of MCC Advisors (Incorporated by reference to Exhibit 99.R.2 to the Registrant’s Pre-effective Amendment No. 1 to the Registration Statement on Form N-2, filed on June 9, 2010). |
| 21.1 | List of Subsidiaries* |
| 24 | Power of attorney (included on the signature page hereto) |
| 31.1 | Certification of Chief Executive Officer pursuant to Rule 13a-14 of the Securities Exchange Act of 1934, as amended.* |
| 31.2 | Certification of Chief Financial Officer pursuant to Rule 13a-14 of the Securities Exchange Act of 1934, as amended.* |
| 32.1 | Certification of Chief Executive Officer and Chief Financial Officer pursuant to section 906 of The Sarbanes-Oxley Act of 2002.* |
| * | Filed herewith. |
| 82 |
Pursuant to the requirements of Section 13 or 15(d) of the Securities Exchange Act of 1934, the registrant has duly caused this Annual Report on Form 10-K to be signed on its behalf by the undersigned, thereunto duly authorized.
|
Dated: December 8, 2016 |
Medley Capital Corporation | |
| By | /s/ Brook Taube | |
| Brook Taube | ||
| Chief Executive Officer | ||
| (Principal Executive Officer) | ||
| By | /s/ Richard T. Allorto, Jr. | |
| Richard T. Allorto, Jr. | ||
| Chief Financial Officer | ||
|
(Principal Accounting and Financial Officer) | ||
In accordance with the Securities Exchange Act of 1934, this report has been signed below by the following persons on behalf of the registrant and in the following capacities on December 8, 2016.
| /s/ Brook Taube | Chief Executive Officer and Chairman of the | |
| Brook Taube | Board of Directors (Principal Executive Officer) | |
| /s/ Richard T. Allorto, Jr. | Chief Financial Officer | |
| Richard T. Allorto, Jr. | (Principal Financial and Accounting Officer) | |
| /s/ Seth Taube | Director | |
| Seth Taube | ||
| /s/ Jeff Tonkel | Director | |
| Jeff Tonkel | ||
| /s/ Arthur S. Ainsberg | Director | |
| Arthur S. Ainsberg | ||
| /s/ Karin Hirtler-Garvey | Director | |
| Karin Hirtler-Garvey | ||
| /s/ John E. Mack | Director | |
| John E. Mack | ||
| /s/ Robert Lyons | Director | |
| Robert Lyons |
| 83 |