Attached files
| file | filename |
|---|---|
| EX-99.3 - EXHIBIT 99.3 - BROADRIDGE FINANCIAL SOLUTIONS, INC. | ex993stats1q2017.htm |
| EX-99.1 - EXHIBIT 99.1 - BROADRIDGE FINANCIAL SOLUTIONS, INC. | ex991earningsrelease-20160.htm |
| 8-K - 8-K - BROADRIDGE FINANCIAL SOLUTIONS, INC. | form8-kre1q2017earnings.htm |
1 © 2014 |
Earnings Webcast &
Conference Call
First Quarter Fiscal Year 2017
November 9, 2016
EXHIBIT 99.2
2
Forward-Looking Statements
This presentation and other written or oral statements made from time to time by representatives of Broadridge Financial Solutions, Inc. ("Broadridge" or the
"Company") may contain “forward-looking statements” within the meaning of the Private Securities Litigation Reform Act of 1995. Statements that are not
historical in nature, and which may be identified by the use of words such as “expects,” “assumes,” “projects,” “anticipates,” “estimates,” “we believe,”
“could be” and other words of similar meaning, are forward-looking statements. In particular, information appearing in the “Fiscal Year 2017 Financial
Guidance” section are forward-looking statements.
These statements are based on management’s expectations and assumptions and are subject to risks and uncertainties that may cause actual results to differ
materially from those expressed. These risks and uncertainties include those risk factors discussed in Part I, “Item 1A. Risk Factors” of our Annual Report on
Form 10-K for the fiscal year ended June 30, 2016 (the “2016 Annual Report”), as they may be updated in any future reports filed with the Securities and
Exchange Commission. All forward-looking statements speak only as of the date of this presentation and are expressly qualified in their entirety by reference
to the factors discussed in the 2016 Annual Report.
These risks include: the success of Broadridge in retaining and selling additional services to its existing clients and in obtaining new clients; Broadridge’s
reliance on a relatively small number of clients, the continued financial health of those clients, and the continued use by such clients of Broadridge’s services
with favorable pricing terms; changes in laws and regulations affecting Broadridge’s clients or the services provided by Broadridge; any material breach of
Broadridge security affecting its clients’ customer information; declines in participation and activity in the securities markets; the failure of Broadridge’s
outsourced data center services provider to provide the anticipated levels of service; a disaster or other significant slowdown or failure of Broadridge’s
systems or error in the performance of Broadridge’s services; overall market and economic conditions and their impact on the securities markets;
Broadridge’s failure to keep pace with changes in technology and demands of its clients; Broadridge’s ability to attract and retain key personnel; the impact
of new acquisitions and divestitures; and competitive conditions. Broadridge disclaims any obligation to update or revise forward-looking statements that
may be made to reflect events or circumstances that arise after the date made or to reflect the occurrence of unanticipated events, other than as required by
law.
3
Use of Non-GAAP Financial Measures
Explanation and Reconciliation of the Company’s Use of Non-GAAP Financial Measures
The Company’s results in this presentation are presented in accordance with U.S. GAAP except where otherwise noted. In certain circumstances, results have
been presented that are not generally accepted accounting principles measures (“Non-GAAP”). These Non-GAAP measures are Adjusted Operating income,
Adjusted Operating income margin, Adjusted Net earnings, Adjusted earnings per share, and Free cash flow. These Non-GAAP financial measures should be
viewed in addition to, and not as a substitute for, the Company’s reported results.
The Company believes its Non-GAAP financial measures help investors understand how management plans, measures and evaluates the Company’s business
performance. Management believes that Non-GAAP measures provide consistency in its financial reporting and facilitates investors’ understanding of the
Company’s operating results and trends by providing an additional basis for comparison. Management uses these Non-GAAP financial measures to, among other
things, evaluate the Company's ongoing operations, for internal planning and forecasting purposes and in the calculation of performance-based compensation. In
addition, and as a consequence of the importance of these Non-GAAP financial measures in managing its business, the Company’s Compensation Committee of
the Board of Directors incorporates Non-GAAP financial measures in the evaluation process for determining management compensation.
Adjusted Operating Income, Adjusted Operating Income Margin, Adjusted Net Earnings and Adjusted Earnings per Share
These Non-GAAP measures reflect Operating income, Operating income margin, Net earnings, and Diluted earnings per share, as adjusted to exclude the impact
of certain costs, expenses, gains and losses and other specified items that management believes are not indicative of the Company's ongoing operating
performance. These adjusted measures exclude the impact of Amortization of Acquired Intangibles and Purchased Intellectual Property, and Acquisition and
Integration Costs. Amortization of Acquired Intangibles and Purchased Intellectual Property represents non-cash expenses associated with the Company's
acquisition activities. Acquisition and Integration Costs represent certain transaction and integration costs associated with the Company’s acquisition activities.
The Company excludes Amortization of Acquired Intangibles and Purchased Intellectual Property, and Acquisition and Integration Costs from these measures
because excluding such information provides the Company with an understanding of the results from the primary operations of its business and these items do
not reflect ordinary operations or earnings. Management believes these measures may be useful to an investor in evaluating the underlying operating
performance of the Company's business.
Free Cash Flow
In addition to the Non-GAAP financial measures discussed above, the Company provides Free cash flow information because it considers Free cash flow to be a
liquidity measure that provides useful information to management and investors about the amount of cash generated that could be used for dividends, share
repurchases, strategic acquisitions and other discretionary investments. Free cash flow is a Non-GAAP financial measure and is defined by the Company as Net
cash flows provided by operating activities less Capital expenditures and Software purchases and capitalized internal use software.
Reconciliations of such Non-GAAP measures to the most directly comparable financial measures presented in accordance with GAAP can be found in the tables
that are part of this presentation.
Use of Material Contained Herein
The information contained in this presentation is being provided for your convenience and information only. This information is accurate as of the date of its
initial presentation. If you plan to use this information for any purpose, verification of its continued accuracy is your responsibility. Broadridge assumes no duty
to update or revise the information contained in this presentation.
4
Highlights
Solid 1Q financial results
On track to achieve Fiscal Year 2017 guidance and three year
financial objectives
Continued momentum in Closed sales
NACC integration going well - on track to achieve synergy targets
and executing on digital strategy
Blockchain investment demonstrates commitment to innovation
leadership in proxy market
Tuck-in M&A strategy remains a focus
5
First Quarter 2017 Financial Summary
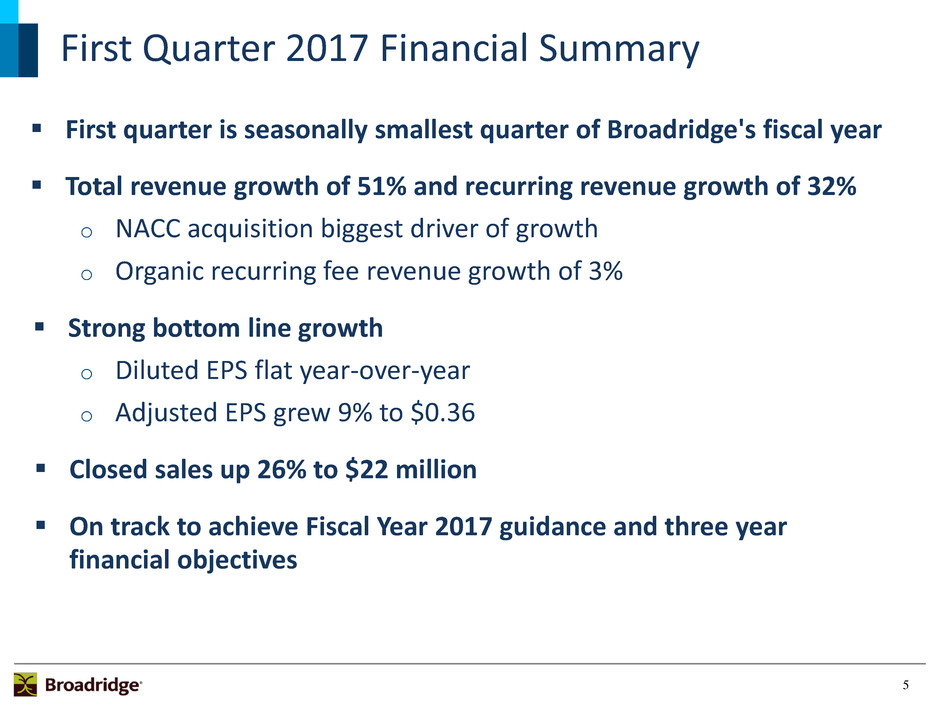
First quarter is seasonally smallest quarter of Broadridge's fiscal year
Total revenue growth of 51% and recurring revenue growth of 32%
o NACC acquisition biggest driver of growth
o Organic recurring fee revenue growth of 3%
Strong bottom line growth
o Diluted EPS flat year-over-year
o Adjusted EPS grew 9% to $0.36
Closed sales up 26% to $22 million
On track to achieve Fiscal Year 2017 guidance and three year
financial objectives
6
Business Update
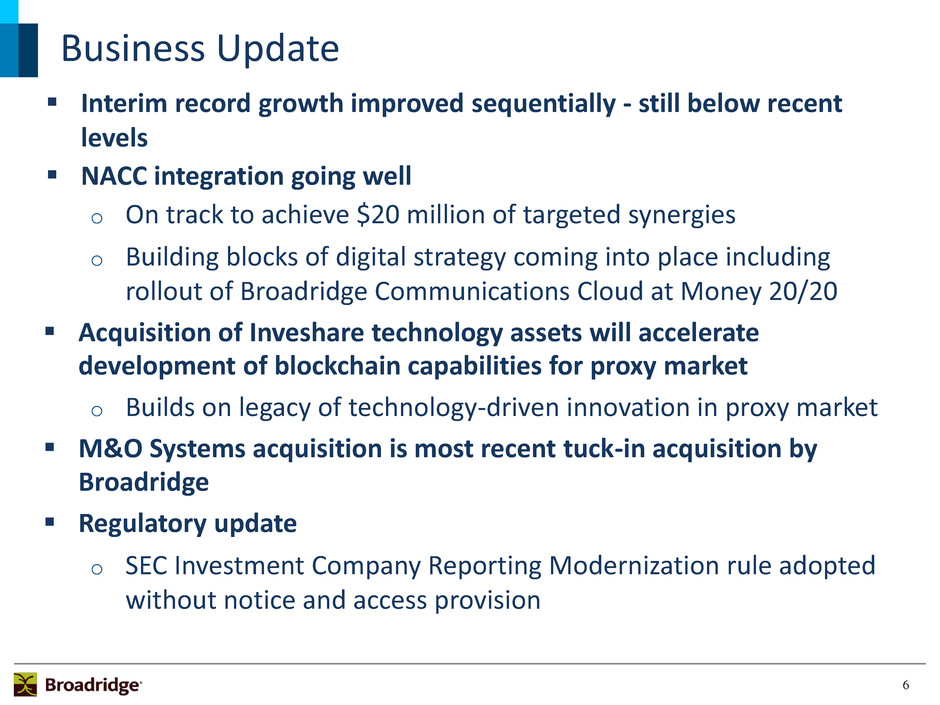
Interim record growth improved sequentially - still below recent
levels
NACC integration going well
o On track to achieve $20 million of targeted synergies
o Building blocks of digital strategy coming into place including
rollout of Broadridge Communications Cloud at Money 20/20
Acquisition of Inveshare technology assets will accelerate
development of blockchain capabilities for proxy market
o Builds on legacy of technology-driven innovation in proxy market
M&O Systems acquisition is most recent tuck-in acquisition by
Broadridge
Regulatory update
o SEC Investment Company Reporting Modernization rule adopted
without notice and access provision
7
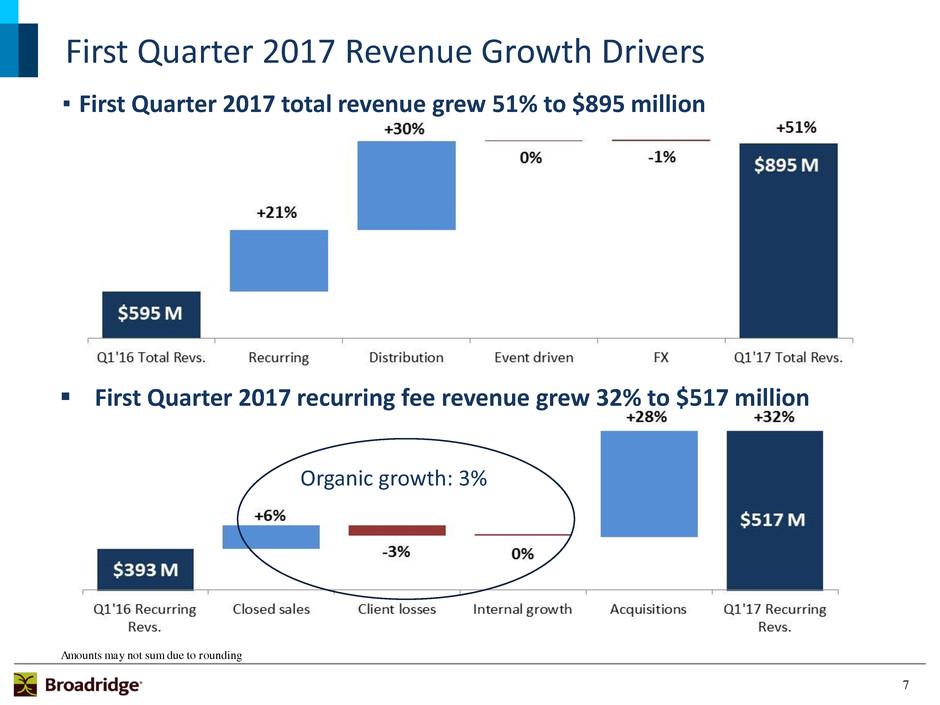
First Quarter 2017 Revenue Growth Drivers
First Quarter 2017 recurring fee revenue grew 32% to $517 million
Organic growth: 3%
Amounts may not sum due to rounding
▪ First Quarter 2017 total revenue grew 51% to $895 million
8
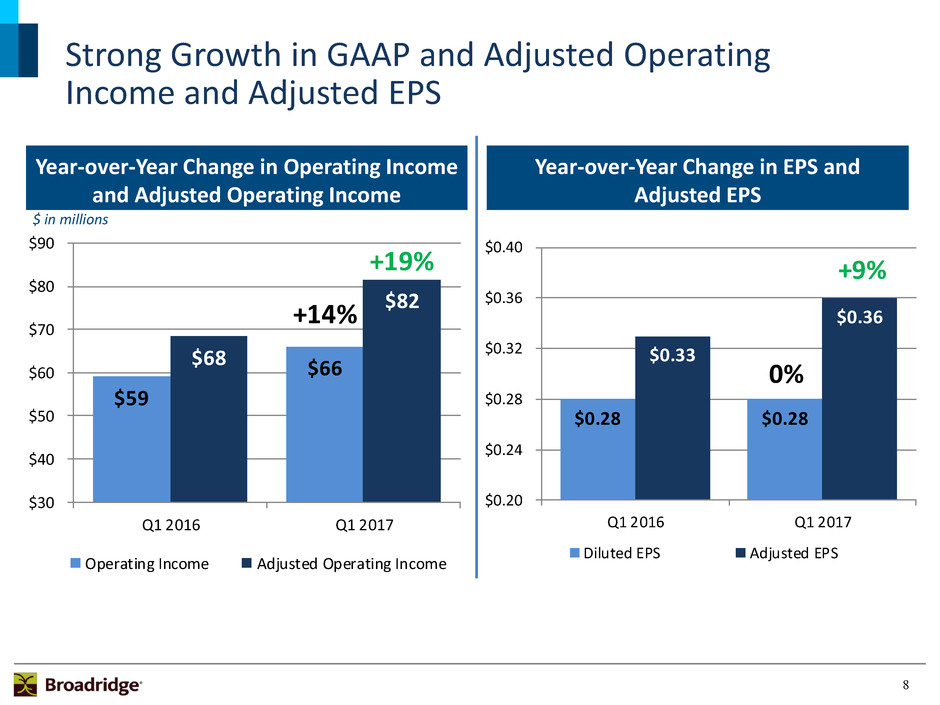
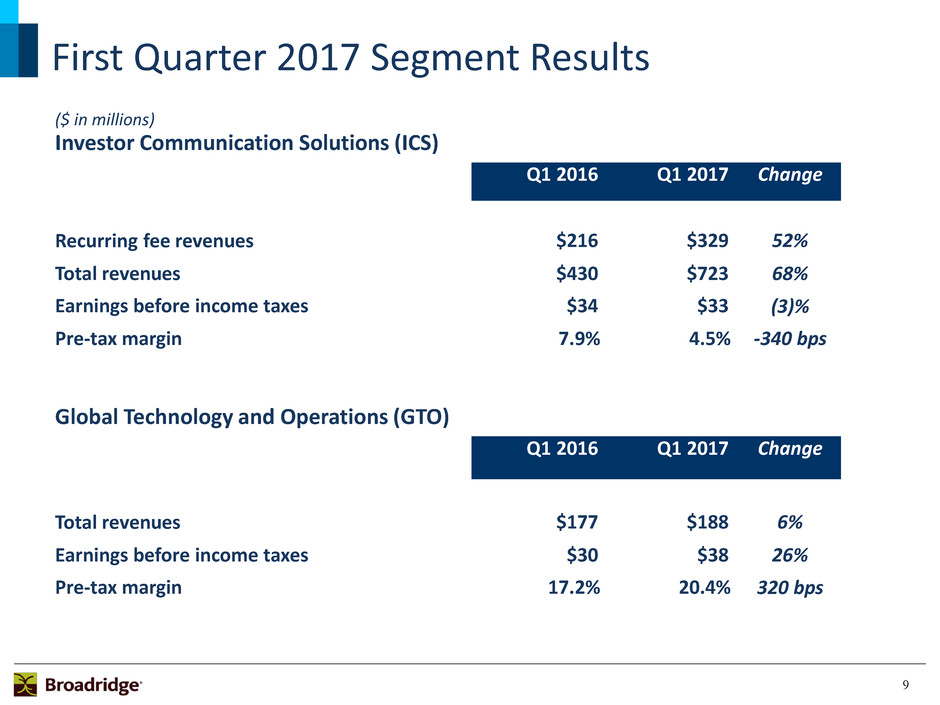
Strong Growth in GAAP and Adjusted Operating
Income and Adjusted EPS
$ in millions
Year-over-Year Change in Operating Income
and Adjusted Operating Income
Year-over-Year Change in EPS and
Adjusted EPS
$59
$66 $68
$82
$30
$40
$50
$60
$70
$80
$90
Q1 2016 Q1 2017
Operating Income Adjusted Operating Income
+19%
+14%
$0.28 $0.28
$0.33
$0.36
$0.20
$0.24
$0.28
$0.32
$0.36
$0.40
Q1 2016 Q1 2017
Dilute EPS Adjust d EPS
+9%
0%
9
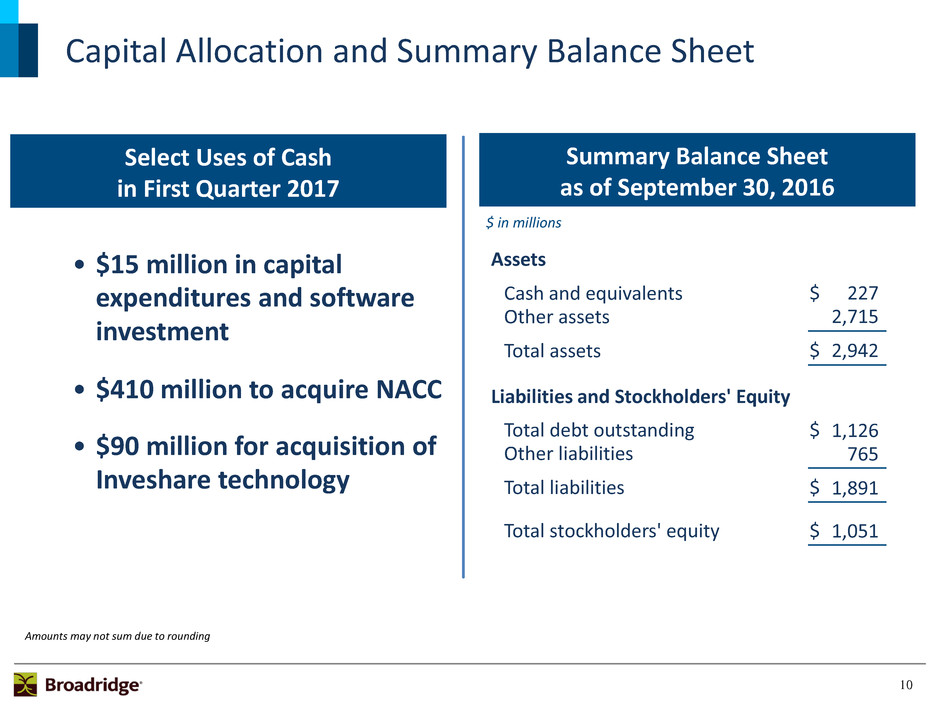
($ in millions)
Investor Communication Solutions (ICS)
Q1 2016 Q1 2017 Change
Recurring fee revenues $216 $329 52%
Total revenues $430 $723 68%
Earnings before income taxes $34 $33 (3)%
Pre-tax margin 7.9 % 4.5 % -340 bps
Global Technology and Operations (GTO)
Q1 2016 Q1 2017 Change
Total revenues $177 $188 6%
Earnings before income taxes $30 $38 26%
Pre-tax margin 17.2 % 20.4 % 320 bps
First Quarter 2017 Segment Results
10
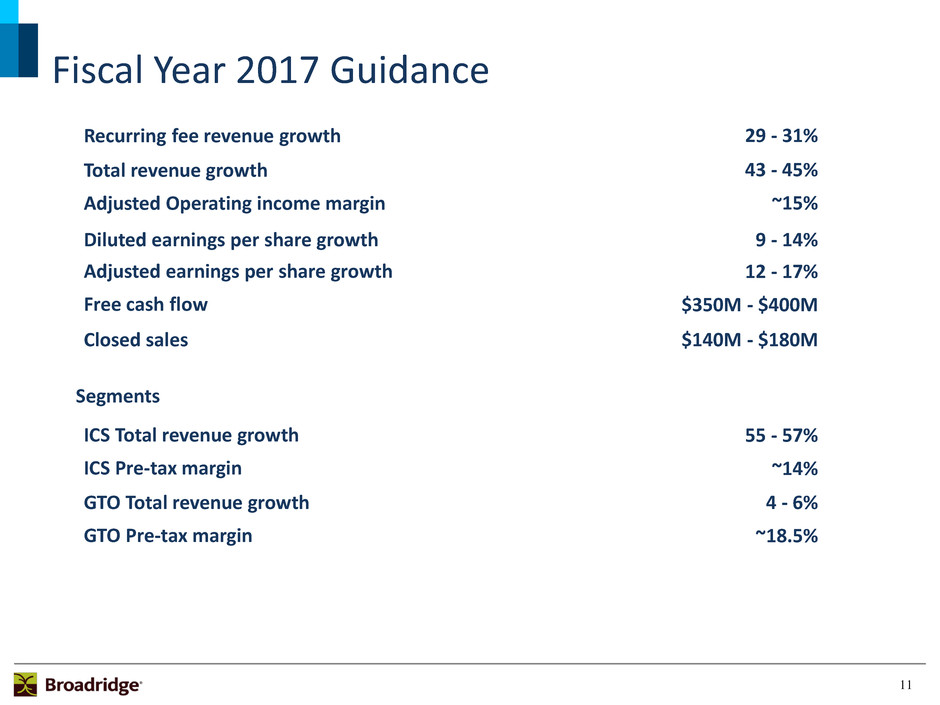
Capital Allocation and Summary Balance Sheet
Select Uses of Cash
in First Quarter 2017
• $15 million in capital
expenditures and software
investment
• $410 million to acquire NACC
• $90 million for acquisition of
Inveshare technology
Summary Balance Sheet
as of September 30, 2016
Assets
Cash and equivalents $ 227
Other assets 2,715
Total assets $ 2,942
Liabilities and Stockholders' Equity
Total debt outstanding $ 1,126
Other liabilities 765
Total liabilities $ 1,891
Total stockholders' equity $ 1,051
Amounts may not sum due to rounding
$ in millions
11
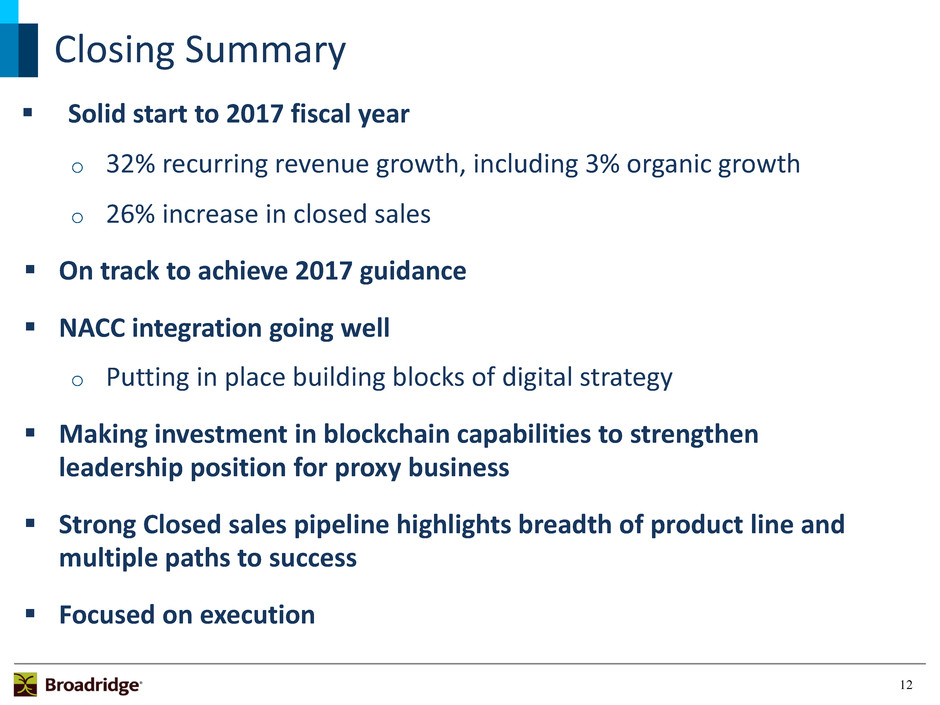
Fiscal Year 2017 Guidance
Recurring fee revenue growth 29 - 31%
Total revenue growth 43 - 45%
Adjusted Operating income margin ~15%
Diluted earnings per share growth 9 - 14%
Adjusted earnings per share growth 12 - 17%
Free cash flow $350M - $400M
Closed sales $140M - $180M
Segments
ICS Total revenue growth 55 - 57%
ICS Pre-tax margin ~14%
GTO Total revenue growth 4 - 6%
GTO Pre-tax margin ~18.5%
12
Closing Summary
Solid start to 2017 fiscal year
o 32% recurring revenue growth, including 3% organic growth
o 26% increase in closed sales
On track to achieve 2017 guidance
NACC integration going well
o Putting in place building blocks of digital strategy
Making investment in blockchain capabilities to strengthen
leadership position for proxy business
Strong Closed sales pipeline highlights breadth of product line and
multiple paths to success
Focused on execution
13
Appendix
14
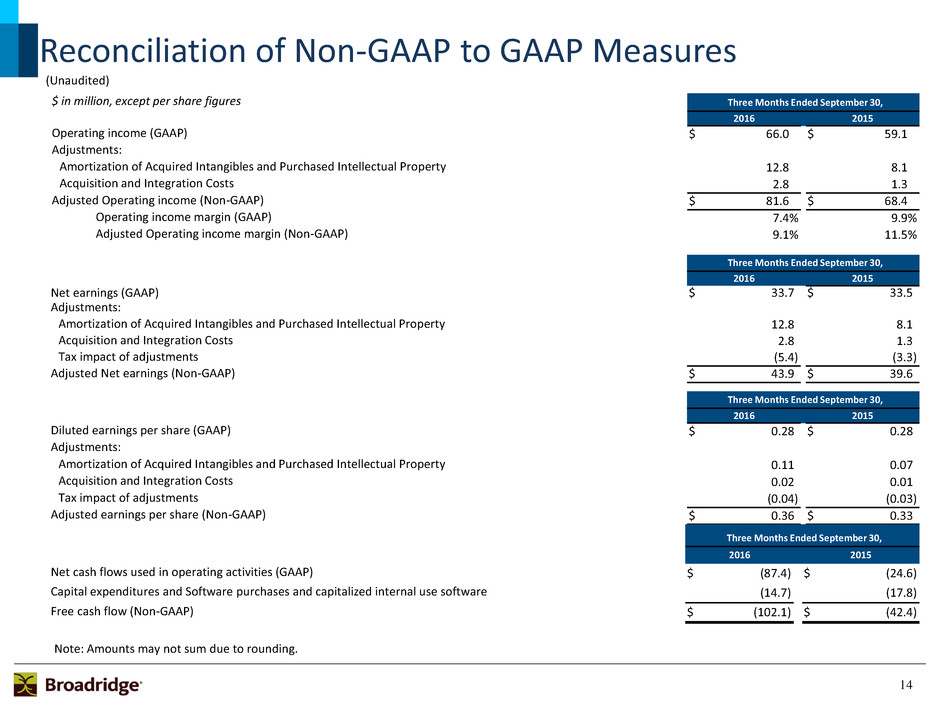
Reconciliation of Non-GAAP to GAAP Measures
$ in million, except per share figures Three Months Ended September 30,
2016 2015
Operating income (GAAP) $ 66.0 $ 59.1
Adjustments:
Amortization of Acquired Intangibles and Purchased Intellectual Property 12.8 8.1
Acquisition and Integration Costs 2.8 1.3
Adjusted Operating income (Non-GAAP) $ 81.6 $ 68.4
Operating income margin (GAAP) 7.4 % 9.9 %
Adjusted Operating income margin (Non-GAAP) 9.1 % 11.5 %
Three Months Ended September 30,
2016 2015
Net earnings (GAAP) $ 33.7 $ 33.5
Adjustments:
Amortization of Acquired Intangibles and Purchased Intellectual Property 12.8 8.1
Acquisition and Integration Costs 2.8 1.3
Tax impact of adjustments (5.4 ) (3.3 )
Adjusted Net earnings (Non-GAAP) $ 43.9 $ 39.6
Three Months Ended September 30,
2016 2015
Diluted earnings per share (GAAP) $ 0.28 $ 0.28
Adjustments:
Amortization of Acquired Intangibles and Purchased Intellectual Property 0.11 0.07
Acquisition and Integration Costs 0.02 0.01
Tax impact of adjustments (0.04 ) (0.03 )
Adjusted earnings per share (Non-GAAP) $ 0.36 $ 0.33
Note: Amounts may not sum due to rounding.
Three Months Ended September 30,
2016 2015
Net cash flows used in operating activities (GAAP) $ (87.4 ) $ (24.6 )
Capital expenditures and Software purchases and capitalized internal use software (14.7 ) (17.8 )
Free cash flow (Non-GAAP) $ (102.1 ) $ (42.4 )
(Unaudited)
15
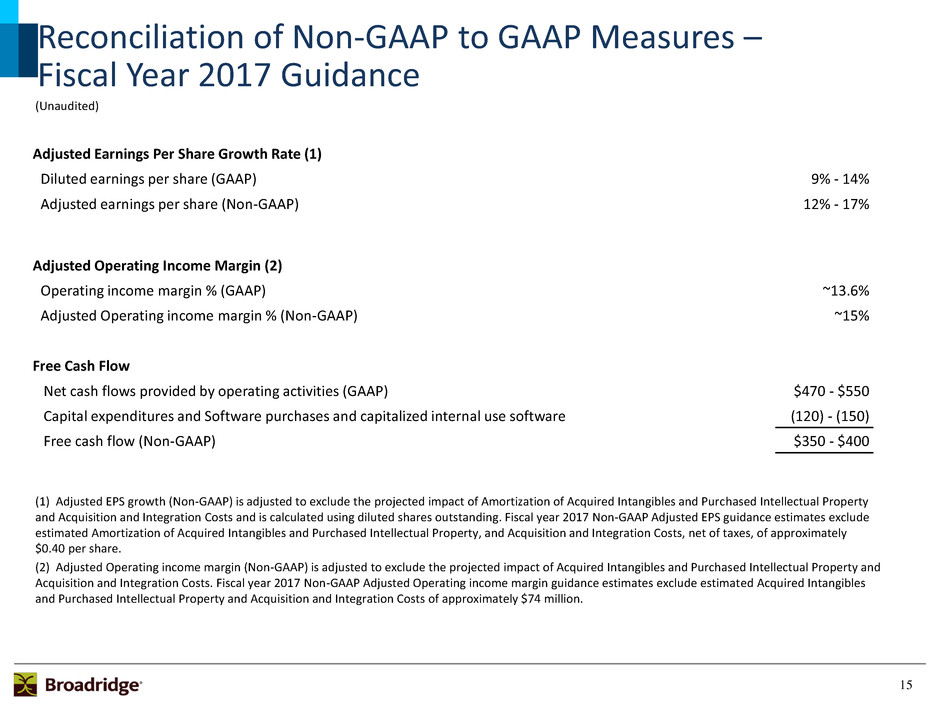
Reconciliation of Non-GAAP to GAAP Measures –
Fiscal Year 2017 Guidance
(Unaudited)
Adjusted Earnings Per Share Growth Rate (1)
Diluted earnings per share (GAAP) 9% - 14%
Adjusted earnings per share (Non-GAAP) 12% - 17%
Adjusted Operating Income Margin (2)
Operating income margin % (GAAP) ~13.6%
Adjusted Operating income margin % (Non-GAAP) ~15%
Free Cash Flow
Net cash flows provided by operating activities (GAAP) $470 - $550
Capital expenditures and Software purchases and capitalized internal use software (120) - (150)
Free cash flow (Non-GAAP) $350 - $400
(1) Adjusted EPS growth (Non-GAAP) is adjusted to exclude the projected impact of Amortization of Acquired Intangibles and Purchased Intellectual Property
and Acquisition and Integration Costs and is calculated using diluted shares outstanding. Fiscal year 2017 Non-GAAP Adjusted EPS guidance estimates exclude
estimated Amortization of Acquired Intangibles and Purchased Intellectual Property, and Acquisition and Integration Costs, net of taxes, of approximately
$0.40 per share.
(2) Adjusted Operating income margin (Non-GAAP) is adjusted to exclude the projected impact of Acquired Intangibles and Purchased Intellectual Property and
Acquisition and Integration Costs. Fiscal year 2017 Non-GAAP Adjusted Operating income margin guidance estimates exclude estimated Acquired Intangibles
and Purchased Intellectual Property and Acquisition and Integration Costs of approximately $74 million.
