Attached files
Table of Contents
UNITED STATES
SECURITIES AND EXCHANGE COMMISSION
WASHINGTON, D.C. 20549
FORM 10-K
(Mark One)
| x | ANNUAL REPORT PURSUANT TO SECTION 13 OR 15(d) OF THE SECURITIES EXCHANGE ACT OF 1934 |
FOR THE FISCAL YEAR ENDED JUNE 30, 2010
OR
| ¨ | TRANSITION REPORT PURSUANT TO SECTION 13 OR 15(d) OF THE SECURITIES EXCHANGE ACT OF 1934 |
FOR THE TRANSITION PERIOD FROM TO
COMMISSION FILE NUMBER 001-33220
BROADRIDGE FINANCIAL SOLUTIONS, INC.
(Exact name of registrant as specified in its charter)
| DELAWARE | 33-1151291 | |
| (State or other jurisdiction of incorporation or organization) |
(I.R.S. Employer Identification No.) |
| 1981 MARCUS AVENUE LAKE SUCCESS, NY |
11042 | |
| (Address of principal executive offices) | (Zip code) |
(516) 472-5400
(Registrant’s telephone number, including area code)
Securities registered pursuant to Section 12(b) of the Act:
| Title of Each Class: |
Name of Each Exchange on Which Registered: | |
| Common Stock, par value $0.01 per share | New York Stock Exchange |
Securities registered pursuant to Section 12(g) of the Act:
None
Indicate by check mark if the registrant is a well-known seasoned issuer, as defined in Rule 405 of the Securities Act. Yes x No ¨
Indicate by check mark if the registrant is not required to file reports pursuant to Section 13 or Section 15(d) of the Act. Yes ¨ No x
Indicate by check mark whether the registrant (1) has filed all reports required to be filed by Section 13 or 15(d) of the Securities Exchange Act of 1934 during the preceding 12 months (or for such shorter period that the registrant was required to file such reports), and (2) has been subject to such filing requirements for the past 90 days. Yes x No ¨
Indicate by check mark whether the registrant has submitted electronically and posted on its corporate Web site, if any, every Interactive Data File required to be submitted and posted pursuant to Rule 405 of Regulation S-T (Section 232.405 of this chapter) during the preceding 12 months (or for such shorter period that the registrant was required to submit and post such files). Yes ¨ No ¨
Indicate by check mark if disclosure of delinquent filers pursuant to Item 405 of Regulation S-K (Section 229.405 of this chapter) is not contained herein, and will not be contained, to the best of registrant’s knowledge, in definitive proxy or information statements incorporated by reference in Part III of this Form 10-K or any amendment to this Form 10-K. x
Indicate by check mark whether the registrant is a large accelerated filer, an accelerated filer, a non-accelerated filer, or a smaller reporting company. See the definitions of “large accelerated filer,” “accelerated filer” and “smaller reporting company” in Rule 12b-2 of the Exchange Act. (Check one):
Large Accelerated Filer x Accelerated Filer ¨ Non-Accelerated Filer ¨ Smaller Reporting Company ¨
Indicate by check mark whether the registrant is a shell company (as defined in Rule 12b-2 of the Exchange Act). Yes ¨ No x
The aggregate market value, as of December 31, 2009, of common stock held by non-affiliates of the registrant was approximately $3,036,389,271.
As of July 30, 2010, there were 126,733,539 shares of the registrant’s common stock outstanding (excluding 19,185,386 shares held in treasury), par value $0.01 per share.
DOCUMENTS INCORPORATED BY REFERENCE
Portions of the registrant’s definitive proxy statement to be filed with the Securities and Exchange Commission within
120 days after the fiscal year end of June 30, 2010 are incorporated by reference into Part III.
Table of Contents
| PAGE | ||||
| 1 | ||||
| ITEM 1. |
1 | |||
| ITEM 1A. |
12 | |||
| ITEM 1B. |
20 | |||
| ITEM 2. |
20 | |||
| ITEM 3. |
20 | |||
| ITEM 4. |
20 | |||
| 21 | ||||
| ITEM 5. |
21 | |||
| ITEM 6. |
24 | |||
| ITEM 7. |
Management’s Discussion and Analysis of Financial Condition and Results of Operations |
25 | ||
| ITEM 7A. |
40 | |||
| ITEM 8. |
41 | |||
| ITEM 9. |
Changes in and Disagreements with Accountants on Accounting and Financial Disclosure |
71 | ||
| ITEM 9A. |
71 | |||
| ITEM 9B. |
72 | |||
| 73 | ||||
| ITEM 10. |
73 | |||
| ITEM 11. |
73 | |||
| ITEM 12. |
Security Ownership of Certain Beneficial Owners and Management and Related Stockholder Matters |
73 | ||
| ITEM 13. |
Certain Relationships and Related Transactions, and Director Independence |
73 | ||
| ITEM 14. |
73 | |||
| 74 | ||||
| ITEM 15. |
74 | |||
i
Table of Contents
Forward-Looking Statements
This Annual Report on Form 10-K may contain “forward-looking statements” within the meaning of the Private Securities Litigation Reform Act of 1995. Statements that are not historical in nature and which may be identified by the use of words like “expects,” “assumes,” “projects,” “anticipates,” “estimates,” “we believe,” “could be” and other words of similar meaning, are forward-looking statements. These statements are based on management’s expectations and assumptions and are subject to risks and uncertainties that may cause actual results to differ materially from those expressed. Factors that could cause actual results to differ materially from those contemplated by the forward-looking statements include:
| • | the success of Broadridge Financial Solutions, Inc. (“Broadridge®” or the “Company”) in retaining and selling additional services to its existing clients and in obtaining new clients; |
| • | the pricing of Broadridge’s products and services; |
| • | changes in laws and regulations affecting the investor communication services provided by Broadridge; |
| • | declines in participation and activity in the securities markets; |
| • | overall market and economic conditions and their impact on the securities markets; |
| • | any material breach of Broadridge security affecting its clients’ customer information; |
| • | the failure of Broadridge’s outsourced data center services provider to provide the anticipated levels of service; |
| • | any significant slowdown or failure of Broadridge’s systems or error in the performance of Broadridge’s services; |
| • | Broadridge’s failure to keep pace with changes in technology and demands of its clients; |
| • | the ability to attract and retain key personnel; |
| • | the impact of new acquisitions and divestitures; and |
| • | competitive conditions. |
Broadridge disclaims any obligation to update any forward-looking statements, whether as a result of new information, future events or otherwise.
| ITEM 1. | Business |
Overview
Broadridge is a leading global provider of technology solutions to the financial services industry. Our systems and services include investor communication solutions, and securities processing and operations outsourcing solutions. In short, we provide the infrastructure that helps make the financial services industry work. With more than 40 years of experience, we provide financial services firms with advanced, dependable, scalable and cost-effective integrated systems. Our systems help reduce the need for clients to make significant capital investments in operations infrastructure, thereby allowing them to increase their focus on core business activities.
We serve a large and diverse client base in the financial services industry, including retail and institutional brokerage firms, global banks, mutual funds, annuity companies, institutional investors, specialty trading firms, and clearing firms. We also provide services to corporate issuers.
1
Table of Contents
We deliver a broad range of solutions that help our clients better serve their retail and institutional customers across the entire investment lifecycle, including pre-trade, trade, and post-trade processing. Our securities processing systems enable our clients to process securities transactions in more than 50 countries. In fiscal year 2010, we: (i) distributed over one billion investor communications, including proxy materials, investor account statements, trade confirmations, tax statements and prospectuses; and (ii) on average processed over 1.5 million equity trades per day and over $3.5 trillion in fixed income trades per day of United States (U.S.) and Canadian securities. Our operations are classified into two business segments:
Investor Communication Solutions
A large portion of our Investor Communication Solutions business involves the processing and distribution of proxy materials to investors in equity securities and mutual funds, as well as the facilitation of related vote processing. ProxyEdge®, our innovative electronic proxy delivery and voting solution for institutional investors, helps ensure the participation of the largest stockholders of many companies. We also provide the distribution of regulatory reports and corporate action/reorganization event information, as well as tax reporting solutions that help our clients meet their regulatory compliance needs. In addition, we provide financial information distribution and transaction reporting services to both financial institutions and securities issuers. These services include the processing and distribution of account statements and trade confirmations, traditional and personalized document fulfillment and content management services, marketing communications, and imaging, archival and workflow solutions that enable and enhance our clients’ communications with investors. All of these communications are delivered in paper or electronic form.
In fiscal year 2010, Broadridge entered the transfer agency business through its acquisition of StockTrans, Inc. (“StockTrans”), a leading provider of registrar, stock transfer and record-keeping services with over 38 years of experience. In addition, Broadridge introduced several investor communication solutions last year. They are The Investor Network, our Shareholder Forum and Virtual Shareholder Meeting solutions, and our data aggregation and data management solutions. These service offerings are described in “The Broadridge Business” section below.
Securities Processing Solutions
We offer a suite of advanced computerized real-time transaction processing services that automate the securities transaction lifecycle, from desktop productivity tools, data aggregation, performance reporting, and portfolio management to order capture and execution, trade confirmation, settlement, and accounting. Our services help financial institutions efficiently and cost-effectively consolidate their books and records, gather and service assets under management, focus on their core businesses, and manage risk. With multi-currency capabilities, our Global Processing Solution supports real-time global trading of equity, option, mutual fund, and fixed income securities in established and emerging markets. In addition, our operations outsourcing solutions allow broker-dealers to outsource certain administrative functions relating to clearing and settlement, from order entry to trade matching and settlement, while maintaining their ability to finance and capitalize their business.
History and Development of Our Company
We are the former Brokerage Services division of Automatic Data Processing, Inc. (“ADP”). Broadridge Financial Solutions, Inc. was incorporated in Delaware as a wholly-owned subsidiary of ADP on March 29, 2007 in anticipation of our spin-off from ADP. On March 30, 2007, we spun off from ADP and began operating as an independent public company. Our company has more than 40 years of history of providing innovative solutions to financial services firms and publicly-held companies. In 1962, the Brokerage Services division of ADP opened for business with one client, processing an average of 300 trades per night. In 1979, we expanded our U.S.-based securities processing solutions to process Canadian securities.
2
Table of Contents
We made significant additions to our Securities Processing Solutions business through two key acquisitions in the mid-1990s. In 1995, we acquired a London-based provider of multi-currency clearance and settlement services, to become a global supplier of transaction processing services. In 1996, we acquired a provider of institutional fixed income transaction processing systems.
We began offering our proxy services in 1989. The proxy services business, which started what has become our Investor Communication Solutions business, leveraged the information processing systems and infrastructure of our Securities Processing Solutions business. Our proxy services offering attracted 31 major clients in its first year of operations. In 1992, we acquired The Independent Election Corporation of America which further increased our proxy services capabilities. By 1999, we were handling over 90% of the investor communication distributions for all securities held of record by banks and broker-dealers in the U.S.—from proxy statements to annual reports. During the 1990s, we expanded our proxy services business to serve security owners of Canadian and United Kingdom issuers and we began offering a complete outsourced solution for international proxies.
In 1998, having previously provided print and distribution services as an accommodation to our securities processing and proxy clients, we decided to focus on account statement and reporting services. In 2001, we developed and released PostEdge® to meet the need for electronic distribution and archiving of all investor communications.
In 2004, we purchased Bank of America Corporation’s U.S. Clearing and Broker-Dealer Services businesses, which enabled us to provide securities clearing and operations outsourcing services. In 2010, we sold the contracts of substantially all of our securities clearing clients and commenced the wind down of the securities clearing business. We will continue to perform our operations outsourcing services as part of our Securities Processing Solutions business.
The Broadridge Business
Our operations are classified into two business segments: Investor Communication Solutions and Securities Processing Solutions.
Investor Communication Solutions
A majority of publicly-traded shares are not registered in companies’ records in the names of their ultimate beneficial owners. Instead, a substantial majority of all public companies’ shares are held in “street name,” meaning that they are held of record by broker-dealers or banks through their depositories. Most street name shares are registered in the name “Cede & Co.,” the name used by The Depository Trust and Clearing Corporation (“DTCC”), which holds shares on behalf of its participant broker-dealers and banks. These participant broker-dealers and banks (which are known as nominees because they hold securities in name only) in turn hold the shares on behalf of their clients, the individual beneficial owners. Nominees, upon request, are required to provide companies with lists of beneficial owners who do not object to having their names, addresses, and share holdings supplied to companies, so called “non-objecting beneficial owners” (or “NOBOs”). Objecting beneficial owners (or “OBOs”) may be contacted directly only by the broker-dealer or bank.
Because DTCC’s role is only that of custodian, a number of mechanisms have been developed in order to pass the legal rights it holds as the record owner (such as the right to vote) to the beneficial owners. The first step in passing voting rights down the chain is the “omnibus proxy,” which DTCC executes to transfer its voting rights to its participant nominees.
Under applicable rules, nominees must deliver proxy materials to beneficial owners and request voting instructions. Nominees are often prohibited by applicable New York Stock Exchange (“NYSE”), or other self-regulatory organization (“SRO”) rules, or by express agreements with their customers from voting the securities held in their customers’ accounts in the absence of receiving such customers’ voting instructions.
3
Table of Contents
A large number of nominees have contracted out the administrative processes of distributing proxy materials and tabulating voting instructions to us. Nominees accomplish this by transferring to us via powers of attorney the authority to execute a proxy, which authority they receive from DTCC (via omnibus proxy). We then distribute the proxy materials and voting instruction forms (known as “VIFs”) to beneficial owners.
The Securities and Exchange Commission’s (the “SEC”) rules require public companies to reimburse nominees for the expense of distributing stockholder communications to beneficial owners of securities held in street name. The reimbursement rates are set forth in the rules of SROs, including the NYSE. We act as a billing and collection agent for many nominees with respect to this reimbursement. We bill public companies on behalf of the nominees, collect the fee and remit to the nominee any difference between the fee that the nominee is entitled to collect and the amount that the nominee has agreed to pay us for our services.
We also compile NOBO lists on behalf of nominees in response to requests from issuers. The preparation of NOBO lists is subject to reimbursement by the securities issuers requesting such lists to the broker-dealers. The reimbursement rates are based on the number of NOBOs on the list produced pursuant to NYSE or other SRO rules. Such rules also provide for certain fees to be paid to third party intermediaries who compile such NOBO lists. We function as such an intermediary in the NOBO process.
We also provide proxy distribution, vote tabulation, and various additional investor communication tools and services to institutional investors, corporate issuers, and investment companies.
The services we provide in this segment represented approximately 76%, 74%, and 74% of our total Revenues in fiscal years 2010, 2009, and 2008, respectively. Prior year amounts have been adjusted to reflect the change in reportable segments described in Note 1, “Basis of Presentation” to our Consolidated Financial Statements under Item 8 of Part II of this Annual Report on Form 10-K. These services include the following:
Bank and Brokerage Offerings. We handle the entire proxy materials distribution and voting process for our bank and broker-dealer clients on-line and in real-time, from coordination with third-party entities to ordering, inventory maintenance, mailing, tracking and vote tabulation. We offer electronic proxy delivery services for the electronic delivery of proxy materials to investors and collection of consents; maintenance of a database that contains the delivery method preferences of our clients’ customers; posting of documents on the Internet; e-mail notification to investors notifying them that proxy materials are available; and proxy voting over the Internet. We also have the ability to combine stockholder communications for multiple stockholders residing at the same address which we accomplish by having ascertained the delivery preferences of investors. In addition, we provide a complete outsourced solution for the processing of international proxies. We also provide a complete reorganization communications solution to notify investors of reorganizations or corporate action events such as tender offers, mergers and acquisitions, bankruptcies, and class action lawsuits.
We also offer our bank and brokerage clients financial information distribution and transaction reporting services to help them meet their regulatory compliance requirements and business needs including: prospectus fulfillment services; electronic prospectus services; Investor Mailbox, our service providing the electronic delivery of investor communications to our clients’ websites; PostEdge, our electronic document archival and electronic delivery solution for documents including trade confirmations, tax documents and account statements; marketing communications; imaging, archival and workflow solutions; and on-demand digital print services. We also offer our bank and brokerage clients The Investor Network, our comprehensive social network for validated investors. The Investor Network provides a secure environment for investors to discuss their investments, the economy and other market-related activity. It can integrate directly with a brokerage firm’s customer-facing website. This allows brokerage customers to participate as validated members without having to divulge personal and confidential information that other online social media sites typically require.
Institutional Investor Offerings. We provide a suite of services to manage the entire proxy voting process of institutional investors, including fulfilling their fiduciary obligations and meeting their reporting needs such as
4
Table of Contents
ProxyEdge, our workflow solution that integrates ballots for positions held across multiple custodians and presents them under a single proxy. Voting can be instructed for the entire position, by account vote group or on an individual account basis either manually or automatically based on the recommendations of participating governance research providers. ProxyEdge also provides for client reporting and regulatory reporting. ProxyEdge can be utilized for meetings of U.S. and Canadian companies and for meetings in many non-North American countries based on the holdings of our global custodian clients.
Corporate Issuer Offerings. We are the largest processor and provider of investor communication solutions to public companies. We offer our corporate issuer clients many tools to facilitate their communications with investors such as Internet and telephone proxy voting, electronic delivery of corporate filings, and householding of communications to stockholders at the same address. One of our opportunities for growth in the Investor Communication Solutions segment involves serving corporate issuer clients in providing communications services to registered stockholders—that is, stockholders who do not hold their shares through a broker-dealer in street name. We also offer proxy services to non-North American corporate issuers in connection with their general and special meetings of stockholders. Our corporate issuer services include ShareLink®, which provides complete project management for the beneficial and registered proxy process.
Our Shareholder Forum and Virtual Shareholder Meeting solutions were introduced last year. The Shareholder Forum is an online venue that offers public companies the ability to host structured, controlled communication with their shareholders on a timely and regular basis. Validated shareholders can submit questions, answer surveys in preparation of the annual meeting and year-round, and communicate in various ways with a corporation. Our Virtual Shareholder Meeting service provides corporate issuers with the ability to host their annual meeting electronically on the Internet, either on a stand-alone basis, or in conjunction with their physical annual meeting. As the entity that provides beneficial shareholder proxy processing on behalf of many banks and brokerage firms, we can provide shareholder validation and voting to companies that want to hold virtual meetings. In fiscal year 2010, we enabled 20 companies to hold Virtual Shareholder Meetings.
In fiscal year 2010, we entered the transfer agency business through our acquisition of StockTrans, a leading provider of registrar, stock transfer and record-keeping services with over 38 years of experience. Our transfer agency strategy is to address the needs public companies have expressed for lower-cost, more reliable stockholder record maintenance and communication services by leveraging our existing investor communications and securities processing capabilities to enable us to deliver enhanced transfer agency services to corporate issuers.
Mutual Fund Offerings. We provide a full range of tools that enable mutual funds to communicate with large audiences of investors efficiently, reliably, and often with substantial cost savings. Our solutions allow mutual funds to centralize all investor communications through one resource. We also provide printing and mailing of regulatory reports, prospectuses and proxy materials, as well as proxy solicitation services. In addition, we distribute marketing communications and informational materials and create on-demand enrollment materials for mutual fund investors. Our position in the industry enables us to manage the entire communication process with both registered and beneficial stockholders. Our SalesVision® platform provides comprehensive data aggregation and data management solutions. SalesVision is software delivered as a service (“SaaS”) and assists mutual funds in processing commission and distribution payments, monitoring their compliance with regulatory requirements, and assembling shareholder and intermediary data in a form to better drive their sales strategy and marketing programs.
Securities Processing Solutions
Transactions involving securities and other financial market instruments originate with an investor, who places an order with a broker who in turn routes that order to an appropriate market for execution. At that point, the parties to the transaction coordinate payment and settlement of the transaction through a clearinghouse. The records of the parties involved must then be updated to reflect completion of the transaction. Tax, custody,
5
Table of Contents
accounting and record-keeping requirements must be complied with in connection with the transaction and the customer’s account information must correctly reflect the transaction. The accurate processing of trading activity and custody activity requires effective automation and information flow across multiple systems and functions within the brokerage firm and across the systems of the various parties that participate in the execution of a transaction.
Our securities processing solutions automate the transaction lifecycle of equity, mutual fund, fixed income, and option securities trading operations, from order capture and execution through trade confirmation, settlement, custody and accounting. Our services facilitate the automation of straight-through-processing operations and enable financial institutions efficiently and cost-effectively to consolidate their books and records, focus on their core businesses, and manage risk. With our multi-currency capabilities, we support trading activities on a global basis.
In March 2010, we entered into an Information Technology Services Agreement (the “IT Services Agreement”) with IBM, under which IBM will provide certain aspects of our information technology infrastructure that are currently provided under the data center outsourcing services agreement with ADP. In addition, the Company and IBM entered into a business alliance agreement. The alliance agreement provides a structure for IBM and Broadridge to jointly market and sell a complementary suite of services from each party’s portfolio. The alliance will allow Broadridge and IBM to expand their service offerings in the financial services market by providing a comprehensive outsourced solution combining IBM’s technology infrastructure and the Broadridge securities processing application and operations outsourcing solutions into a jointly-offered set of alliance service offerings.
Our securities processing services represented approximately 24%, 27%, and 25% of our total Revenues in fiscal years 2010, 2009, and 2008, respectively. Prior year amounts have been adjusted to reflect the change in reportable segments described in Note 1, “Basis of Presentation” to our Consolidated Financial Statements under Item 8 of Part II of this Annual Report on Form 10-K. These services include the following:
North American Processing Services. We provide a set of sophisticated, multi-currency systems that support real-time processing of securities transactions in North American equities, options, fixed income securities, and mutual funds. Brokerage Processing Services (“BPS”) is our core multi-currency back-office processing system that supports real-time processing of transactions in the U.S. markets. BPS handles everything from order management to clearance/settlement and custody, and assists our clients in meeting their regulatory reporting and other back-office requirements. BPS is provided on a hosted application service provider (“ASP”) basis. We also offer a version of BPS for processing Canadian securities. In addition to our BPS offering, we provide specialized transaction processing tools and services for small to mid-market financial firms in the U.S. and Canada that are operated on separate Broadridge technology platforms. We also provide state-of-the-art fixed income transaction processing capabilities and support for front-, middle-, and back-office functions. Our securities processing services can be integrated with our web-based desktop applications, wealth management tools, enterprise workflow, automated inquiry reporting and record-keeping services.
International Processing Services. We provide advanced multi-currency transaction processing solutions for institutional and retail securities operations, corporate actions, and business process outsourcing services such as data cleansing. Our Global Processing Solution is our integrated delivery of multiple securities processing products and services to create a comprehensive system that is capable of processing transactions in equity, option, mutual fund, and fixed income securities in established and emerging markets, at any time. Its advanced real-time processes automate the securities transaction lifecycle from order capture and execution through confirmation, settlement, and accounting.
Operations Outsourcing Services. We also provide operations outsourcing services relating to a variety of securities clearing, record-keeping, and custody-related functions. Our clients execute and clear their securities transactions and engage us to perform a number of related administrative back-office functions, such as record-keeping and reconciliations. In this capacity, we are not the broker-dealer of record.
6
Table of Contents
On June 25, 2010, we completed the sale of the contracts of substantially all of the securities clearing clients of our wholly owned subsidiary, Ridge Clearing & Outsourcing Solutions, Inc. (“Ridge”), to Penson Financial Services, Inc. (“PFSI”), a wholly owned subsidiary of Penson Worldwide, Inc. (“PWI”), pursuant to an asset purchase agreement, dated as of November 2, 2009 (the “Asset Purchase Agreement”).
Under the terms of the Asset Purchase Agreement, we received an aggregate purchase price of $35.2 million (the “Purchase Price”) from PWI consisting of (a) a five-year subordinated note (the “Seller Note”) payable by PWI in the principal amount of $20.6 million and bearing interest at an annual rate equal to the London Inter-Bank Offer Rate (“LIBOR”) plus 550 basis points, and (b) 2,455,627 shares of PWI’s common stock (the “PWI Common Stock”), representing 9.5% of the issued and outstanding shares of PWI’s common stock as of May 31, 2010, at the closing price of PWI’s common stock on June 25, 2010 of $5.95 per share. The Purchase Price is subject to certain adjustments post-closing upon the occurrence of agreed upon events including adjustments to reflect certain recently signed Ridge correspondent clearing contracts.
Concurrent with entering into the Asset Purchase Agreement, we entered into a master services agreement with PWI (the “Outsourcing Agreement”). Under the Outsourcing Agreement, Ridge will provide securities processing and back-office support services to PFSI. This agreement includes selective processing services for PFSI’s existing securities processing operations and back-office functions, as well as selective processing services related to the clearing client contracts acquired by PFSI from Ridge.
For the few Ridge securities clearing contracts that were not acquired by PFSI, Ridge will continue to perform securities clearing services as it winds down the clearing business. We expect to completely exit the clearing business in fiscal year 2011.
Broadridge’s Integrated Solutions
Our core systems for processing equity, option, and mutual fund transactions in the U.S. markets can also be combined with our specialized systems for processing fixed income and international securities transactions. These specialized securities processing services can be fully integrated with operations outsourcing services. In addition, our clients can integrate our securities processing and operations outsourcing services with our other services including: (i) the processing of trade confirmations and account statements, delivered in paper or electronically; (ii) equity and mutual fund prospectus processing; (iii) automated workflow tools that help our clients streamline their securities processing and operations activities; and (iv) a full suite of wealth management products including data aggregation tools, end-customer websites, broker desktop, financial planning and modeling tools, performance reporting and portfolio accounting.
Clients
We serve a large and diverse client base in the financial services industry including retail and institutional brokerage firms, global banks, mutual funds, annuity companies, institutional investors, specialty trading firms, independent broker-dealers, and clearing firms. We also provide services to corporate issuers.
In fiscal year 2010, we:
| • | processed approximately 66% of the outstanding shares in the U.S. in the performance of our proxy services; |
| • | distributed over one billion investor communications in either paper or electronic form; |
| • | processed on average over 1.5 million equity trades per day and over $3.5 trillion in fixed income trades per day of U.S. and Canadian securities; and |
| • | provided fixed income trade processing services to 10 of the 18 primary dealers of fixed income securities in the U.S. |
7
Table of Contents
In fiscal year 2010, we derived approximately 25% of our consolidated revenues from five clients. Our largest single client accounted for approximately 6% of our consolidated revenues.
Competition
We operate in a highly competitive industry. Our Investor Communication Solutions business competes with companies that provide investor communication and corporate governance solutions including transfer agents who handle communication services to registered (non-beneficial) securities holders, proxy advisory firms, proxy solicitation firms and other proxy services providers. We also face competition from numerous firms in the compiling and printing of transaction confirmations and account statements. Our Securities Processing Solutions business principally competes with brokerage firms that perform their trade processing in-house, and with numerous other outsourcing vendors. Our back-office support services offered through this segment also compete with very large financial institutions that manage their own back-office record-keeping operations. In many cases, clients engage us only to perform certain functions, such as back-office processing, and do not outsource their other functions such as clearing operations support that we would also perform for them.
Technology
We have several information processing systems which serve as the core foundation of our technology platform. We leverage these systems in order to provide our services. We are committed to maintaining extremely high levels of quality service through our skilled technical employees and the use of our technology within an environment that seeks continual improvement.
Our mission-critical applications are designed to provide high levels of availability, scalability, reliability, and flexibility. They operate on industry standard enterprise architecture platforms that provide high degrees of horizontal and vertical scaling. This scalability and redundancy allows us to provide high degrees of system availability. Our principal data center systems and applications are operated and managed by ADP under a data center outsourcing services agreement we entered into with ADP in March 2007. Under this agreement, ADP is responsible for hosting a significant portion of our mainframe, midrange, open systems, and networks. Additionally, systems engineering, network engineering, hardware engineering, network operations, data center operations, application change management, and data center disaster recovery services are managed by ADP. All critical platforms are fully supported under ADP’s disaster recovery program which provides geographic diversity and precise system, application, data and network recovery. We continue to manage the application development, information technology strategy and system architecture direction and management functions.
In March 2010, we entered into the IT Services Agreement with IBM, under which IBM will provide certain aspects of our information technology infrastructure that are currently provided under the data center outsourcing services agreement with ADP.
Under the IT Services Agreement, IBM will provide a broad range of technology services including supporting our mainframe, midrange, open systems, network and data center operations, as well as providing disaster recovery services. We have the option of incorporating additional services into the agreement over time. The IT Services Agreement has an initial term of 11 years and seven months, expiring on October 31, 2021.We have the right to renew it for up to an additional 12-month term. We expect to complete the migration of our data center processing from ADP to IBM by June 2012. ADP will continue to perform data processing services until the migration to IBM is complete.
We have the right to terminate the IT Services Agreement for several reasons including for cause, for convenience, or in the event of a change of ownership control of IBM. However, several of the grounds for termination of the IT Services Agreement by Broadridge require us to pay a termination fee to IBM. IBM also has certain termination rights in the event of a material breach of the Company’s obligations under the IT Services Agreement and its failure to cure.
8
Table of Contents
Most of our systems and applications process in Tier IV data centers. Tier IV data centers employ multiple active power and cooling distribution paths, redundant components, and are capable of providing 99.995% availability. Tier IV data centers provide infrastructure capacity and capability to permit any planned activity without disruption to the critical load, and can sustain at least one worst-case, unplanned failure or event with no critical load impact. Our geographically dispersed processing centers also provide disaster recovery and business continuity processing.
To further demonstrate our commitment to maintaining the highest levels of quality service and client satisfaction within an environment that fosters continual improvement, our data centers are International Organization for Standardization (“ISO”) 9001:2000 certified. In addition, Broadridge’s core applications and facilities for the provision of our proxy, U.S. equity and fixed income securities processing services, and ADP’s data centers are ISO 27001 certified. The IBM data centers are also ISO 27001 certified. This security standard specifies the requirements for establishing, implementing, operating, monitoring, reviewing, maintaining and improving a documented Information Security Management System within the context of the organization’s overall business risks. It specifies the requirements for the implementation of security controls customized to the needs of individual organizations. This standard addresses confidentiality, access control, vulnerability, business continuity, and risk assessment.
Product Development. Our products and services are designed with reliability, availability, scalability, and flexibility so that we can fully meet our clients’ processing needs. These applications are built in a manner which allows us to meet the breadth and depth of requirements of our financial services industry clients in a highly efficient manner. We continually upgrade, enhance, and expand our existing products and services taking into account input from clients, industry-wide initiatives and regulatory changes affecting our clients.
Intellectual Property. We own registered marks for our trade name and own or have applied for trademark registrations for many of our services and products. We regard our products and services as proprietary and utilize internal security practices and confidentiality restrictions in contracts with employees, clients, and others for protection. We believe that we hold all proprietary rights necessary to conduct our business.
Employees
At June 30, 2010, we had approximately 5,400 employees. None of our employees are subject to collective bargaining agreements governing their employment with our company. We believe that our employee relations are good.
Regulation
The securities and financial services industries are subject to extensive regulation in the U.S. and in other jurisdictions. As a matter of public policy, regulatory bodies in the U.S. and the rest of the world are charged with safeguarding the integrity of the securities and other financial markets and with protecting the interests of investors participating in those markets.
In the U.S., the securities and financial services industries are subject to regulation under both federal and state laws. At the federal level, the SEC regulates the securities industry, along with the Financial Industry Regulatory Authority, Inc. (“FINRA”), the various stock exchanges, and other self-regulatory organizations (“SROs”). Our Investor Communication Solutions and Securities Processing Solutions businesses are generally not directly subject to federal, state, or foreign laws and regulations that are specifically applicable to financial institutions. However, as a provider of services to financial institutions and issuers of securities, our services are provided in a manner to assist our clients in complying with the laws and regulations to which they are subject, such as our proxy distribution, processing, and voting services. As a result, the services we provide may change as applicable SEC and NYSE regulations are revised. For example, the SEC has in recent years amended the proxy rules to allow public companies to follow a “notice and access” model of proxy material delivery. The SEC’s notice and access rules have caused us to develop and offer a number of new and additional services.
9
Table of Contents
On July 14, 2010, the SEC voted unanimously to issue for public comment a concept release (the “Concept Release”) focusing on a wide range of topics related to the U.S. proxy system. The Concept Release is organized by the three general topics on which the SEC is seeking public input: (1) ensuring the accuracy, transparency, and efficiency of the voting process, (2) enhancing shareholder communication and participation, and (3) addressing the relationship between voting power and economic interest. Comments on the Concept Release are due within 90 days of its publication, and at the end of that period, the SEC may, but is not necessarily required to engage in rulemaking with respect to the topics addressed by the Concept Release. It is too early in the process for the Company to make a determination as to whether there will be any modifications made to the current proxy system, and if so, what impact, if any, any such modifications to the current proxy system will have on our business. We will monitor any future actions taken by the SEC, the SROs or other participants in the proxy process with respect to the Concept Release. If changes are made to the U.S. proxy system, we expect to continue to adapt our business practices and service offerings to assist our clients in fulfilling their obligations under any new or modified legal requirements and industry practices. For example, we are in the process of implementing changes to our services to enable our clients to comply with the recently enacted Dodd-Frank Wall Street Reform and Consumer Protection Act requirement that public companies include in their proxy materials a resolution subject to stockholder vote to approve the compensation of executives.
Certain of the securities processing services we provide may be deemed to be mission-critical functions of financial institutions that are regulated by one or more member agencies of the Federal Financial Institutions Examination Council (“FFIEC”). We are therefore subject to examination by the member agencies of the FFIEC which are the Board of Governors of the Federal Reserve System, the Federal Deposit Insurance Corporation, the Office of the Comptroller of the Currency, the Office of Thrift Supervision, and the National Credit Union Association. The FFIEC conducts periodic reviews of certain of our operations in order to identify existing or potential risks associated with our operations that could adversely affect the financial institutions to which we provide services, evaluates our risk management systems and controls, and determines our compliance with applicable laws that affect the services we provide to financial institutions. In addition to examining areas such as our management of technology, data integrity, information confidentiality and service availability, the reviews also assess our financial stability. A sufficiently unfavorable review from the FFIEC could result in our clients not being allowed to use our services. In addition, we engage independent auditors to review many of our operations to provide internal control evaluations for our clients and their regulators.
As a registered broker-dealer, our subsidiary Ridge is subject to regulations concerning many aspects of its business, including trade practices, capital structure, record retention, money laundering prevention, and the supervision of the conduct of directors, officers and employees. A failure by Ridge to comply with any of these laws, rules or regulations could result in censure, fine, the issuance of cease-and-desist orders, or the suspension or revocation of SEC authorization granted to allow the operation of its business or disqualification of the directors, officers or employees of such business. In addition, as a registered broker-dealer, Ridge is required to participate in the Securities Investor Protection Corporation (“SIPC”) for the benefit of the customers of our introducing broker-dealer clients in connection with our securities clearing services. On June 25, 2010, we completed the sale of the contracts of substantially all of Ridge’s securities clearing clients and are in the process of winding down the securities clearing business, which we expect to complete in fiscal year 2011. As we wind down that business, Ridge continues to perform securities clearing services on a limited basis. Until such wind down is complete, Ridge will continue to be subject to the regulatory requirements of a broker-dealer performing those functions. These regulations include the SEC’s customer protection rule, which protects both the customer funds and customer securities; the SEC’s hypothecation Rules 8c-1 and 15c2-1 regarding the borrowing and lending of our correspondents’ customers’ securities; Regulation T, which regulates the borrowing and lending of securities by broker-dealers; and Regulation SHO, which prohibits short sales in certain instances.
Our operations outsourcing services are subject to regulatory oversight by the SEC and FINRA. The recent economic turmoil has resulted in increased regulatory scrutiny of the securities industry including the outsourcing of regulatory functions. This oversight could result in the future enactment of more restrictive laws
10
Table of Contents
or rules with respect to operations outsourcing. We will monitor any future actions taken by the SEC and FINRA, and if new requirements are enacted, we expect to adapt our business practices and service offerings to assist our clients in fulfilling their obligations under any new or modified legal requirements and industry practices. In addition, if we expand our outsourcing solutions services into other countries in the future, we will be required to comply with the regulatory controls of each country in which we conduct business.
Our subsidiary StockTrans, as a transfer agent, is subject to certain rules and regulations promulgated by the SEC, including without limitation, with respect to registration with the SEC, annual reporting, internal controls, proper disposal of consumer report information and obligations relating to StockTrans’ operations. StockTrans has been formally approved by the NYSE before commencing to act as a transfer agent or registrar for issuers of NYSE listed securities and is subject to certain NYSE requirements concerning operational standards. Furthermore, StockTrans is also subject to certain provisions of the Gramm-Leach-Bliley Act and the Federal Trade Commission’s regulations with respect to maintenance of information security safeguards.
Privacy and Information Security Regulations
The processing of personal information is required to provide our services. Data privacy laws and regulations in the U.S. and foreign countries apply to the collection, transfer, use, storage, and destruction of personal information. In the U.S., the federal Gramm-Leach-Bliley Act, which applies to financial institutions, and various state privacy laws, which apply to businesses that collect personal information, apply directly to our subsidiaries Ridge and StockTrans. The Gramm-Leach-Bliley Act and state privacy laws apply indirectly, through contractual commitments with our clients and through industry standards, to the entities that perform our investor communication and securities processing services. The state privacy laws require notification to affected individuals, state officers, and consumer reporting agencies in the event of a security breach that results in unauthorized access to or disclosure of certain non-public personal information. These regulations and laws also impose requirements for safeguarding personal information through internal policies and procedures.
Similar data privacy laws related to the collection, transfer, use, and storage of personal information exist outside of the U.S., such as the European Union’s 95/46 EC Directive of the European Parliament, Canada’s Personal Information Protection and Electronic Documents Act, individual European national laws, and data privacy laws of other countries. In some cases, these laws may be more restrictive and may require different compliance requirements than the Gramm-Leach-Bliley Act or the U.S. state privacy laws, and may impose additional duties on companies.
There has been increased public attention regarding the corporate use of personal information, accompanied by legislation and regulations intended to strengthen data protection, information security and consumer privacy. The law in these areas is not consistent or settled. While we believe that Broadridge is compliant with its regulatory responsibilities, the legal, political, and business environments in these areas are rapidly changing, and subsequent legislation, regulation, litigation, court rulings, or other events could expose Broadridge to increased program costs, liability, and possible damage to our reputation.
Other
Our businesses, both directly and indirectly, rely on the Internet and other electronic communications gateways. We intend to expand our use of these gateways. To date, the use of the Internet has been relatively free from regulatory restraints. However, governmental agencies within the U.S. and other jurisdictions are beginning to address regulatory issues that may arise in connection with the use of the Internet. Accordingly, new regulations or interpretations may be adopted that constrain our own and our clients’ abilities to transact business through the Internet or other electronic communications gateways.
11
Table of Contents
Seasonality
Processing and distributing proxy materials and annual reports to investors in equity securities and mutual funds comprises a large portion of our Investor Communication Solutions business. We process and distribute the greatest number of proxy materials and annual reports during our fourth fiscal quarter (the second quarter of the calendar year). The recurring periodic activity of this business is linked to significant filing deadlines imposed by law on public reporting companies and mutual funds. Historically, this has caused our revenues, operating income, net earnings, and cash flows from operating activities to be higher in our fourth fiscal quarter than in any other quarter. The seasonality of our revenues makes it difficult to estimate future operating results based on the results of any specific fiscal quarter and could affect an investor’s ability to compare our financial condition, results of operations, and cash flows on a fiscal quarter-by-quarter basis.
Segment and Geographic Area Financial Information
You can find financial information regarding our operating segments and our geographic areas in Note 17, “Financial Data By Segment” to our Consolidated Financial Statements under Item 8 of Part II of this Annual Report on Form 10-K.
Available Information
Our headquarters are located at 1981 Marcus Avenue, Lake Success, New York 11042, and our telephone number is (516) 472-5400.
We maintain an Investor Relations website on the Internet at www.broadridge-ir.com. We make available free of charge, on or through this website, our annual, quarterly and current reports, and any amendments to those reports as soon as reasonably practicable following the time they are electronically filed with or furnished to the SEC. To access these, just click on the “SEC Filings” link found on our Investor Relations homepage. You can also access our Investor Relations website through our main website at www.broadridge.com by clicking on the “Investor Relations” link, which is located at the top of our homepage. Information contained on our website is not incorporated by reference into this Annual Report on Form 10-K or any other report filed with the SEC.
| ITEM 1A. | Risk Factors |
You should carefully consider each of the following risks and all of the other information set forth in this Annual Report on Form 10-K or incorporated by reference herein. Based on the information currently known to us, we believe that the following information identifies the material risk factors affecting our company. However, additional risks and uncertainties not currently known to us or that we currently believe to be immaterial may also adversely affect our business.
If any of the following risks and uncertainties develop into actual events, they could have a material adverse effect on our business, financial condition, or results of operations.
12
Table of Contents
Consolidation in the financial services industry could adversely affect our revenues by eliminating some of our existing and potential clients and could make us increasingly dependent on a more limited number of clients.
There has been and continues to be merger, acquisition, and consolidation activity in the financial services industry. In recent years, the economic slowdown and in particular, its impact on the financial services industry, resulted in increased mergers or consolidations of our clients. Mergers or consolidations of financial institutions could reduce the number of our clients and potential clients. If our clients merge with or are acquired by other firms that are not our clients, or firms that use fewer of our services, they may discontinue or reduce the use of our services. In addition, it is possible that the larger financial institutions resulting from mergers or consolidations could decide to perform in-house some or all of the services that we currently provide or could provide. Any of these developments could have a material adverse effect on our business and results of operations.
A large percentage of our revenues are derived from a small number of clients in the financial services industry.
In fiscal year 2010, we derived approximately 25% of our consolidated revenues from our five largest clients and approximately 70% of the revenues of our Securities Processing Solutions segment from the 15 largest clients in that segment. Our largest single client accounted for approximately 6% of our consolidated revenues. While these clients generally work with multiple business segments, the loss of business from any of these clients due to merger or consolidation or non-renewal of contracts would have an adverse effect on our revenues and results of operations, and the loss of any of these securities processing clients could result in a material adverse effect on the revenues and results of operations of our Securities Processing Solutions segment. At the end of a contract term, our clients have the opportunity to renegotiate their contracts with us and to consider whether to renew their contracts or engage one of our competitors to provide services. If we are not successful in achieving high renewal rates with favorable terms, particularly with these clients, our revenues from such renewals and the associated earnings could be negatively impacted. In addition, the current economic slowdown and in particular, its impact on the financial services industry, has resulted in increased pricing pressure, particularly with respect to our Securities Processing Solutions business.
The financial services industry has experienced increasing scrutiny by regulatory authorities in recent years and further changes in legislation or regulations may adversely affect our ability to conduct our business or may reduce our profitability.
The legislative and regulatory environment of the financial services industry has recently undergone significant change and may undergo further change in the future. The SEC, FINRA, various stock exchanges, and other U.S. and foreign governmental or regulatory authorities continuously review legislative and regulatory initiatives and may adopt new or revised laws and regulations. These legislative and regulatory initiatives may adversely affect the way in which we conduct our business and may make our business less profitable. Also, changes in the interpretation or enforcement of existing laws and regulations by those entities may adversely affect our business.
Our Investor Communication Solutions and Securities Processing Solutions businesses are generally not directly subject to federal, state, or foreign laws and regulations that are specifically applicable to financial institutions. However, as a provider of services to financial institutions and issuers of securities, our services are particularly sensitive to changes in laws and regulations governing our clients and the securities markets. On July 14, 2010, the SEC voted unanimously to issue the Concept Release for public comment. The Concept Release focuses on a wide range of topics related to the U.S. proxy system. The Concept Release is organized by the three general topics on which the SEC is seeking public input: (1) ensuring the accuracy, transparency, and efficiency of the voting process, (2) enhancing shareholder communication and participation, and (3) addressing the relationship between voting power and economic interest. Comments on the Concept Release are due within
13
Table of Contents
90 days of its publication, and at the end of that period, the SEC may, but is not necessarily required to engage in rulemaking with respect to the topics addressed by the Concept Release. It is too early in the process for the Company to make a determination as to whether there will be any modifications made to the current proxy system, and if so, what impact, if any, any such modifications to the current proxy system will have on our business. However, as with any regulatory change, we may have to incur additional costs to adapt our business to possible modifications in the proxy system that could result from the rulemaking process initiated by the Concept Release.
Certain of the securities processing services we provide may be deemed to be mission-critical functions of financial institutions that are regulated by one or more member agencies of the FFIEC Council. We are therefore subject to examination by the member agencies of the FFIEC. The FFIEC has been conducting periodic reviews of certain of our operations since August 2006 in order to identify existing or potential risks associated with our operations that could adversely affect the financial institutions to which we provide services, evaluates our risk management systems and controls, and determines our compliance with applicable laws that affect the services we provide to financial institutions. In addition to examining areas such as our management of technology, data integrity, information confidentiality and service availability, the reviews also assess our financial stability. A sufficiently unfavorable review from the FFIEC could result in our clients not being allowed to use our services, which could have a material adverse effect on our business, financial condition and results of operations.
In addition, as a provider of services to financial institutions, the operations outsourcing solutions provided by Ridge are subject to regulatory oversight. If we fail to comply with any applicable regulations, we could be subject to suits for breach of contract or to governmental proceedings, censures and fines, our client relationships and reputation could be harmed and we could be limited in our ability to obtain new clients. In addition, the future enactment of more restrictive laws or rules with respect to operations outsourcing could have an adverse impact on the financial performance of the operations outsourcing business. Furthermore, regulatory approval may be required before expansion of our operations outsourcing business activities. We may not be able to obtain the necessary regulatory approvals for any desired expansion. Even if approvals are obtained, they may impose restrictions on our business and could require us to incur significant compliance costs or adversely affect the development of business activities in affected markets.
There has been increased public attention regarding the corporate use of personal information, accompanied by legislation and regulations intended to strengthen data protection, information security and consumer privacy. The law in these areas is not consistent or settled. While we believe that Broadridge is compliant with its regulatory responsibilities, the legal, political and business environments in these areas are rapidly changing, and subsequent legislation, regulation, litigation, court rulings or other events could expose Broadridge to increased program costs, liability, and possible damage to our reputation.
Our revenues may decrease due to declines in the number of unique securities positions, trading volume, market prices, or the liquidity of the securities markets.
We generate significant revenues from the transaction processing fees we earn from our investor communications, securities processing, and operations outsourcing services. These revenue sources are substantially dependent on the levels of participation and activity in the securities markets. The number of unique securities positions held by investors through our clients and our clients’ customer trading volumes reflect the levels of participation and activity in the markets, which are impacted by market prices, and the liquidity of the securities markets, among other factors. Over the past several years, the U.S. and foreign securities markets have experienced significant volatility. Sudden sharp or gradual but sustained declines in market participation and activity can result in reduced investor communications activity, including reduced proxy, mutual fund, and mergers and acquisitions communications processing, and reduced trading volumes. The occurrence of any of these events would likely result in reduced revenues and decreased profitability from our business operations.
14
Table of Contents
General economic and political conditions and broad trends in business and finance that are beyond our control may contribute to reduced levels of activity in the securities markets, which could result in lower revenues from our business operations.
The number of unique securities positions held by investors through our clients, trading volume, market prices, and liquidity of the securities markets are affected by general national and international economic and political conditions, and broad trends in business and finance that result in changes in participation and activity in the securities markets. These factors include:
| • | economic, political and market conditions; |
| • | legislative and regulatory changes; |
| • | the availability of short-term and long-term funding and capital; |
| • | the level and volatility of interest rates; |
| • | currency values and inflation; and |
| • | national, state, and local taxation levels affecting securities transactions. |
These factors are beyond our control and may contribute to reduced levels of participation and activity in the securities markets. Our revenues have historically been largely driven by transaction processing based on levels of participation and activity in the securities markets. Accordingly, any significant reduction in participation and activity in the securities markets would likely result in lower revenues from our business operations.
Breaches of our information security policies or safeguards could adversely affect our ability to operate, could result in the personal or account information of our clients’ customers being misappropriated, and may cause us to be held liable or suffer harm to our reputation.
We process and transfer the personal and account information of customers of financial institutions and investors in public companies and mutual funds. Our clients are subject to laws and regulations in the U.S. and other jurisdictions designed to protect the privacy of personal information and to prevent that information from being inappropriately disclosed, misused, altered, destroyed or otherwise compromised, and they require that we abide by such laws and regulations in performing our services for them. In addition, our subsidiaries Ridge and StockTrans are subject to these laws and regulations. We have developed and maintain technical and operational safeguards which vary based on service and information type, including encryption, authentication technology, and transmission of data over private networks in order to effect secure transmissions of confidential information over computer systems and the Internet. However, despite those safeguards, it is possible that hackers, employees acting contrary to security policies, or others could improperly access our systems or improperly obtain or disclose the personal or account information of our clients’ customers or investors in public companies and mutual funds. Any breach of our information security policies or safeguards resulting in the unauthorized use or disclosure of personal or account information could result in interruptions to our operations or delivery of services to our clients, and we could be liable to parties who are financially harmed by those breaches. Our liability risk is anticipated in our services agreements with our clients and our insurance coverage. However, we may not be adequately protected against all possible losses through the terms of our services agreements and our insurance coverage. In addition, we may incur significant costs to protect against the threat of information security breaches or to alleviate problems caused by such breaches. Furthermore, such breaches could cause us to lose revenues, lose clients or damage our reputation.
15
Table of Contents
We purchase a significant portion of our data center services, including disaster recovery capabilities, from a third party data center services provider, and if our data center services provider fails to adequately perform the data center services in the manner necessary to meet our clients’ needs, our business, financial condition, and results of operations may be harmed.
ADP provides us with data center services under a data center outsourcing services agreement that include hosting the mainframe, midrange, open systems, and networks. Additionally, systems engineering, network engineering, hardware engineering, network operations, data center operations, application change management, and data center disaster recovery services are managed by ADP. As a result, we currently purchase a significant portion of our data center services, including disaster recovery capabilities, from ADP. In March 2010, we entered into the IT Services Agreement with IBM under which IBM will provide us with data center services. We expect the migration to IBM to be completed by June 2012 and ADP will continue to provide us with data center services until the migration to IBM is complete. During the transition to IBM, if ADP fails to adequately perform the data center services in the manner necessary to meet our clients’ needs, our business, financial condition and results of operations may be harmed. In addition, there is a risk that we may experience a disruption as a result of the transition from ADP to IBM impacting the services we provide to our clients. As a result, our business, financial condition, and results of operations may be harmed. Some of these risks are anticipated and covered through service level credits, termination rights, and indemnification clauses in our services agreements with ADP and IBM. However, we may not adequately be protected against all possible losses through the terms of those agreements.
Any slowdown or failure of our computer or communications systems or those of our outsourced data center services provider could impact our ability to provide services to our clients and support our internal operations and could subject us to liability for losses suffered by our clients or their customers.
Our services depend on our ability to store, retrieve, process, and manage significant databases, and to receive and process transactions and investor communications through a variety of electronic systems and media. Our systems, those of our outsourced data center services provider, or any other systems with which ours interact could slow down significantly or fail for a variety of reasons, including:
| • | computer viruses or undetected errors in internal software programs or computer systems; |
| • | inability to rapidly monitor all system activity; |
| • | inability to effectively resolve any errors in internal software programs or computer systems once they are detected; |
| • | heavy stress placed on systems during peak times; or |
| • | power or telecommunications failure, fire, flood or any other disaster. |
While we monitor system loads and performance and implement system upgrades to handle predicted increases in trading volume and volatility, we cannot assure you that we will be able to predict future volume increases or volatility accurately or that our systems and those of our data center services provider will be able to accommodate these volume increases or volatility without failure or degradation. Moreover, because we have outsourced our data center operations, the operation and performance of the data center involve factors beyond our control. Any significant degradation or failure of our computer systems, communications systems or any other systems in the performance of our services could cause our clients or their customers to suffer delays in their receipt of our services. These delays could cause substantial losses for our clients or their customers, and we could be liable to parties who are financially harmed by those failures. Our liability risk is anticipated in our services agreements with our clients and our insurance coverage. However, we may not be adequately protected against all possible losses through the terms of our services agreements and our insurance coverage. In addition, such failures could cause us to lose revenues, lose clients or damage our reputation.
16
Table of Contents
Operational errors in the performance of our services could lead to liability for claims, client loss and result in reputational damage.
An intentional failure or negligence in properly performing our investor communications, securities processing, or operations outsourcing services could result in our clients and/or Ridge being subjected to censures, fines, or other sanctions by applicable regulatory authorities, and we could be liable to parties who are financially harmed by those errors. Our liability risk is anticipated in our services agreements with our clients and our insurance coverage. However, we may not be adequately protected against all possible losses through the terms of our services agreements and our insurance coverage. In addition, such errors could cause us to lose revenues, lose clients or damage our reputation.
If the operational systems and infrastructure that we depend on fail to keep pace with our growth, we may experience operating inefficiencies, client dissatisfaction and lost revenue opportunities.
The growth of our business and expansion of our client base may place a strain on our management and operations. We believe that our current and anticipated future growth will require the implementation of new and enhanced communications and information systems, the training of personnel to operate these systems, and the expansion and upgrade of core technologies. While many of our systems are designed to accommodate additional growth without redesign or replacement, we may nevertheless need to make significant investments in additional hardware and software to accommodate growth. In addition, we cannot assure you that we will be able to predict the timing or rate of this growth accurately or expand and upgrade our systems and infrastructure on a timely basis.
Our growth has required and will continue to require increased investments in management personnel and systems, financial systems and controls, and office facilities. In the absence of continued revenue growth, the costs associated with these investments would cause our operating margins to decline from current levels. We cannot assure you that we will be able to manage or continue to manage our recent or future growth successfully. If we fail to manage our growth, we may experience operating inefficiencies, dissatisfaction among our client base, and lost revenue opportunities.
If we are unable to respond to the demands of our existing and new clients, our ability to reach our revenue goals or maintain our profitability could be diminished.
The global financial services industry is characterized by increasingly complex and integrated infrastructures and products, new and changing business models and rapid technological and regulatory changes. Our clients’ needs and demands for our products and services evolve with these changes. For example, given recent industry and market events, clients of our Securities Processing Solutions business are increasingly focused on more sophisticated and comprehensive risk management models and practices to increase transparency, exercise controls, and minimize potential exposure. Our future success will depend, in part, on our ability to respond to our clients’ demands for new services, capabilities and technologies on a timely and cost-effective basis, to adapt to technological advancements and changing regulatory standards, and to address our clients’ increasingly sophisticated requirements.
Intense competition could negatively affect our ability to maintain or increase our market share and profitability.
The markets for our products and services continue to evolve and are highly competitive. We compete with a number of firms that provide similar products and services. In addition, our securities processing solutions compete with our clients’ in-house capabilities to perform competitive functions. Our competitors may be able to respond more quickly to new or changing opportunities, technologies, and client requirements and may be able to undertake more extensive promotional activities, offer more attractive terms to clients and adopt more aggressive pricing policies than we will be able to offer or adopt. In addition, we expect that the markets in which we
17
Table of Contents
compete will continue to attract new competitors and new technologies, including international providers of similar products and services to ours, having a lower cost structure. There can be no assurances that we will be able to compete effectively with current or future competitors. If we fail to compete effectively, our market share could decrease and our business, financial condition, and results of operations could be materially harmed.
Our business, financial position, and results of operations could be harmed by adverse rating actions by credit rating agencies.
If the credit ratings of our outstanding indebtedness are downgraded, or if rating agencies indicate that a downgrade may occur, our business, financial position, and results of operations could be adversely affected and perceptions of our financial strength could be damaged. A downgrade would have the effect of increasing our borrowing costs, and could decrease the availability of funds we are able to borrow, adversely affecting our business, financial position, and results of operations. In addition, a downgrade could adversely affect our relationships with our clients. For further information with respect to our borrowing costs, see Note 11, “Borrowings” to our Financial Statements under Item 8 of Part II of this Annual Report on Form 10-K.
We may be unable to attract and retain key personnel.
Our continued success depends on our ability to attract and retain key personnel such as our senior management and other qualified personnel to conduct our business. With the exception of one recently-hired executive officer, we do not have employment agreements with any of our key personnel. The market for such experienced senior managers and other qualified personnel is extremely competitive. There can be no assurance that we will be successful in our efforts to recruit and retain the required key personnel. If we are unable to attract and retain qualified individuals or our recruiting and retention costs increase significantly, our operations and financial results could be materially adversely affected.
The inability to identify, obtain and retain important intellectual property rights to technology could harm our business.
Our success depends in part upon the development and acquisition of systems and applications to conduct our business. These systems and applications are primarily developed by employees or obtained through acquisitions. Our success will increasingly depend in part on our ability to identify, obtain and retain intellectual property rights to technology, both for internal use as well as for use in providing services to our clients, either through internal development, acquisition or licensing from others, or alliances with others. Our inability to identify, obtain and retain rights to certain technology on favorable terms and conditions would make it difficult to conduct business, or to timely introduce new and innovative products and services, which could harm our business, financial condition, and results of operations.
Our products and services, and the products and services provided to us by third parties, may infringe upon intellectual property rights of third parties, and any infringement claims could require us to incur substantial costs, distract our management, or prevent us from conducting our business.
Although we attempt to avoid infringing upon known proprietary rights of third parties, we are subject to the risk of claims alleging infringement of third-party proprietary rights. If we infringe upon the rights of third parties, we may be unable to obtain licenses to use those rights on commercially reasonable terms. Additionally, third parties that provide us with products and services that are integral to the conduct of our business may be subject to similar allegations, which could prevent them from continuing to provide these products and services to us. In either of these events, we would need to undertake substantial reengineering in order to continue offering our services and we may not succeed in doing so. In addition, any claim of infringement could cause us to incur substantial costs defending the claim, even if the claim is invalid, and could distract our management from our business. Furthermore, a party making such a claim could secure a judgment that requires us to pay substantial damages. A judgment could also include an injunction or other court order that could prevent us from conducting our business.
18
Table of Contents
Acquisitions and integrating such acquisitions create certain risks and may affect operating results.
From time to time, we have been, and expect to continue to engage in business acquisitions. The acquisition and integration of businesses involve a number of risks. The core risks are in the areas of:
| • | valuation: negotiating a fair price for the business based on inherently limited due diligence reviews; |
| • | integration: managing the complex process of integrating the acquired company’s people, products, technology, and other assets so as to realize the projected value of the acquired company and the synergies projected to be realized in connection with the acquisition; and |
| • | legacy issues: protecting against actions, claims, regulatory investigations, losses, and other liabilities related to the predecessor business. |
Also, the process of integrating these businesses may disrupt our business and divert our resources. These risks may arise for a number of reasons including, for example:
| • | finding suitable businesses to acquire at affordable valuations or on other acceptable terms; |
| • | competition for acquisitions from other potential acquirors; |
| • | incurring unforeseen obligations or liabilities in connection with such acquisitions; |
| • | devoting unanticipated financial and management resources to an acquired business; |
| • | borrowing money from lenders or selling equity or debt securities to the public to finance future acquisitions on terms that may be adverse to us; |
| • | entering markets where we have minimal prior experience; and |
| • | experiencing decreases in earnings as a result of non-cash impairment charges. |
In addition, international acquisitions often involve additional or increased risks including, for example:
| • | geographically separated organizations, systems, and facilities; |
| • | integrating personnel with diverse business backgrounds and organizational cultures; |
| • | complying with foreign regulatory requirements; |
| • | enforcing intellectual property rights in some foreign countries; and |
| • | general economic and political conditions. |
In the event of a disaster, our disaster recovery and business continuity plans may fail, which could result in the loss of client data and adversely interrupt operations.
Our operations are dependent on our ability to protect our infrastructure against damage from catastrophe, natural disaster, or severe weather including events resulting from unauthorized security breach, power loss, telecommunications failure, terrorist attack, or other events that could have a significant disruptive effect on our operations. We have disaster recovery and business continuity plans in place in the event of system failure due to any of these events and we test our plans regularly. In addition, our outsourced data center services provider also has disaster recovery plans and procedures in place. However, we cannot be certain that our plans, or those of our outsourced data center services provider, will be successful in the event of a disaster. If our disaster recovery or business continuity plans are unsuccessful in a disaster recovery scenario, we could potentially lose client data or experience material adverse interruptions to our operations or delivery of services to our clients, and we could be liable to parties who are financially harmed by those failures. Our liability risk is anticipated in our services agreements with our clients and our insurance coverage. However, we may not be adequately protected against all possible losses through the terms of our services agreements and our insurance coverage. In addition, such failures could cause us to lose revenues, lose clients or damage our reputation.
19
Table of Contents
The financial services business is highly dependent on certain market centers that may be targets of terrorism.
Our business is dependent on exchanges and market centers being able to process trades. Terrorist activities in September 2001 caused the U.S. securities markets to close for four days. This impacted our revenues and profitability for that period of time. If future terrorist incidents cause interruption of market activity, our revenues and profits may be impacted negatively again.
Our revenues are subject to seasonal variations because we process and distribute the greatest number of proxy materials and annual reports in our fourth fiscal quarter.
Processing and distributing proxy materials and annual reports to investors in equity securities and mutual funds comprises a large portion of our Investor Communication Solutions business. We process and distribute the greatest number of proxy materials and annual reports during our fourth fiscal quarter. The recurring periodic activity of this business is linked to significant filing deadlines imposed by law on public reporting companies and mutual funds. Historically, this has caused our revenues, operating income, net earnings, and cash flows from operating activities to be higher in our fourth fiscal quarter than in any other fiscal quarter. The seasonality of our revenues makes it difficult to estimate future operating results based on the results of any specific fiscal quarter and could affect an investor’s ability to compare our financial condition, results of operations, and cash flows on a fiscal quarter-by-quarter basis.
| ITEM 1B. | Unresolved Staff Comments. |
None
| ITEM 2. | Properties. |
We operate our business from 40 facilities. We own a 20,000 square foot facility in Mount Laurel, New Jersey, where we perform certain product development functions. We also own a 36,000 square foot facility in Wheat Ridge, Colorado, where we perform securities processing services. We lease three facilities in Edgewood, New York with a combined space of 709,000 square feet which are used in connection with our Investor Communication Solutions business. We lease space at 35 additional locations, subject to customary lease arrangements, including a 67,000 square foot facility in Lake Success, New York that serves as our corporate headquarters as well as the location of our operations outsourcing solutions business. Our leases expire on a staggered basis. We believe our facilities are currently adequate for their intended purposes and are adequately maintained.
| ITEM 3. | Legal Proceedings. |
In the normal course of business, the Company is subject to claims and litigation. While the outcome of any claim or litigation is inherently unpredictable, the Company believes that the ultimate resolution of these matters will not, individually or in the aggregate, result in a material adverse impact on its financial condition, results of operations, or cash flows. On January 28, 2010, the Company filed a declaratory action in the U.S. District Court for the District of Delaware (the “Delaware District Court”) against Inveshare, Inc. (the “Defendant”) seeking a declaration by the court that Broadridge does not infringe two U.S. patents owned by the Defendant that included claims related to the delivery and distribution of an electronic solicitation. The Company’s complaint also alleged that the Defendant’s patents are invalid and/or are unenforceable due to inequitable conduct. On March 22, 2010, the Defendant answered the Company’s complaint and filed a counterclaim against the Company alleging that Broadridge uses a process that infringes one of the patents in the action. In its counterclaim, Defendant is seeking injunctive relief and unspecified damages. This lawsuit is in an early procedural stage and the Company cannot predict with assurance what impact, if any, the outcome of this litigation may have on its financial condition, results of operations, or cash flows.
| ITEM 4. | Submission of Matters to a Vote of Security Holders. |
None.
20
Table of Contents
| ITEM 5. | Market for Registrant’s Common Equity, Related Stockholder Matters and Issuer Purchases of Equity Securities. |
Our common stock began trading “regular way” on the NYSE under the symbol “BR” on April 2, 2007. There were 17,097 stockholders of record of the Company’s common stock as of July 30, 2010. This figure excludes an estimate of the indeterminate number of beneficial holders whose shares may be held of record by brokerage firms and clearing agencies. The following table presents the high and low sales prices of the Company’s common stock on the NYSE as well as the cash dividends per share of common stock declared during the fiscal quarters indicated:
| Common Stock Market Price |
High | Low | Dividends Declared | ||||||
| Fiscal Year 2010 |
|||||||||
| First Quarter |
$ | 21.85 | $ | 15.19 | $ | 0.14 | |||
| Second Quarter |
23.22 | 19.78 | 0.14 | ||||||
| Third Quarter |
23.27 | 20.73 | 0.14 | ||||||
| Fourth Quarter |
24.02 | 18.51 | 0.14 | ||||||
| Fiscal Year 2009 |
|||||||||
| First Quarter |
$ | 21.44 | $ | 15.10 | $ | 0.07 | |||
| Second Quarter |
14.83 | 9.72 | 0.07 | ||||||
| Third Quarter |
19.27 | 12.84 | 0.07 | ||||||
| Fourth Quarter |
19.82 | 16.00 | 0.07 | ||||||
Dividend Policy
We expect to pay cash dividends on our common stock. On August 3, 2010, our Board of Directors increased our quarterly cash dividend by $0.01 per share to $0.15 per share, an increase in our annual dividend amount of $0.04 per share. However, the declaration and payment of future dividends to holders of our common stock will be at the discretion of our Board of Directors, and will depend upon many factors, including our financial condition, earnings, capital requirements of our businesses, legal requirements, regulatory constraints, industry practice, and other factors that the Board of Directors deems relevant.
As a holding company with no material liquid assets other than the capital stock of our subsidiaries, our ability to pay dividends will be dependent on our receiving dividends from our operating subsidiaries. Ridge, our subsidiary through which we provide our operations outsourcing services, is highly regulated and may be subject to restrictions on its ability to pay dividends to us.
21
Table of Contents
Performance Graph
The following graph compares the cumulative total stockholder return on Broadridge common stock from March 22, 2007, the date our common stock commenced trading on a “when issued” basis, to June 30, 2010 with the comparable cumulative return of (i) the S&P 400 MidCap Index, and (ii) the S&P 400 Information Technology Index. The graph assumes $100 was invested on March 22, 2007 in our common stock and in each of the indices and assumes that all cash dividends are reinvested. The table below the graph shows the dollar value of those investments as of the dates in the graph. The comparisons in the graph are required by the SEC and are not intended to forecast or be indicative of future performance of our common stock.
The following performance graph and related information shall not be deemed “soliciting material” or to be “filed” with the SEC, nor shall such information be incorporated by reference into any future filing under the Securities Act of 1933 or the Exchange Act, each as amended, except to the extent that Broadridge specifically incorporates it by reference into such filing.
Comparison of Cumulative Total Return Among Broadridge Financial Solutions, Inc., S&P 400 MidCap
Index and S&P 400 Information Technology Index (in dollars)
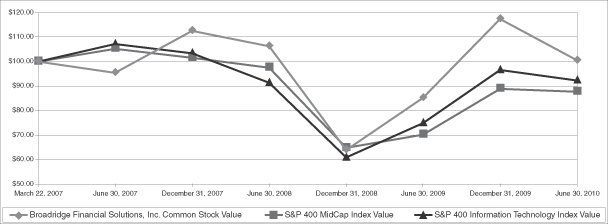
| March 22, 2007 |
June 30, 2007 |
December 31, 2007 |
June 30, 2008 |
December 31, 2008 |
June 30, 2009 |
December 31, 2009 |
June 30, 2010 | |||||||||||||||||
| Broadridge Common Stock Value |
$ | 100.00 | $ | 95.42 | $ | 112.59 | $ | 106.29 | $ | 63.93 | $ | 85.20 | $ | 117.41 | $ | 100.48 | ||||||||
| S&P 400 MidCap Index Value |
$ | 100.00 | $ | 105.25 | $ | 101.49 | $ | 97.53 | $ | 64.72 | $ | 70.20 | $ | 88.91 | $ | 87.70 | ||||||||
| S&P 400 Information Technology Index Value |
$ | 100.00 | $ | 107.14 | $ | 103.42 | $ | 91.33 | $ | 60.81 | $ | 74.91 | $ | 96.52 | $ | 92.32 | ||||||||
22
Table of Contents
Purchases of Equity Securities by the Issuer and Affiliated Purchasers
The following table contains information about our purchases of our equity securities for each of the three months during our fourth fiscal quarter ended June 30, 2010:
| Period |
Total Number of Shares Purchased |
Average Price Paid per Share |
Total Number of Shares Purchased as Part of a Publicly Announced Plan(2) |
Maximum Number (or Approximate Dollar Value) of Shares (or Units) that May Yet Be Purchased Under the Plans(2) | |||||
| April 1, 2010 – April 30, 2010(1) |
451,589 | $ | 21.32 | — | — | ||||
| May 1, 2010 – May 31, 2010(2) |
900,000 | 19.50 | 900,000 | — | |||||
| June 1, 2010 – June 30, 2010(2) |
6,188,200 | 19.48 | 6,188,200 | 6,311,522 | |||||
| Total |
7,539,789 | 7,088,200 | 6,311,522 | ||||||
| (1) | Represents shares purchased from employees to pay taxes related to the vesting of restricted shares. |
| (2) | On August 11, 2009, the Board of Directors authorized a stock repurchase plan for the repurchase of up to 10 million shares of the Company’s common stock. There are no shares remaining for repurchase under this stock repurchase plan at June 30, 2010. |
On June 7, 2010, the Board of Directors authorized a stock repurchase plan for the repurchase of up to 10 million shares of the Company’s common stock. There are 6,311,522 shares remaining for repurchase under this stock repurchase plan at June 30, 2010.
23
Table of Contents
| ITEM 6. | Selected Financial Data |
Broadridge spun-off from ADP on March 30, 2007. Financial data is presented on a combined basis for periods preceding the spin-off and on a consolidated basis subsequently. The following tables set forth selected consolidated financial information from our audited Consolidated Financial Statements (the “Financial Statements”) as of and for the fiscal years ended June 30, 2010, 2009 and 2008. The selected financial data for the fiscal years ended June 30, 2007 and 2006 include various adjustments to reflect our operation as a stand-alone entity during the periods when we were a subsidiary of ADP. The selected financial data presented below should be read in conjunction with our Financial Statements and the accompanying Notes included in this Annual Report on Form 10-K and “Management’s Discussion and Analysis of Financial Condition and Results of Operations.”
| Years Ended June 30, | |||||||||||||||
| 2010 | 2009 | 2008 | 2007 | 2006 | |||||||||||
| (in millions, except for per share amounts) | |||||||||||||||
| Statements of Earnings Data |
|||||||||||||||
| Revenues |
$ | 2,209.2 | $ | 2,073.0 | $ | 2,130.8 | $ | 2,067.4 | $ | 1,852.7 | |||||
| Earnings from continuing operations before income taxes |
$ | 342.1 | $ | 346.0 | $ | 319.7 | $ | 325.9 | $ | 315.5 | |||||
| Net earnings from continuing operations |
$ | 225.1 | $ | 223.1 | $ | 188.4 | $ | 200.3 | $ | 193.3 | |||||
| Net earnings |
$ | 190.0 | $ | 223.3 | $ | 192.2 | $ | 197.1 | $ | 180.5 | |||||
| Basic earnings per share from continuing operations(a) |
$ | 1.66 | $ | 1.60 | $ | 1.35 | $ | 1.44 | $ | 1.39 | |||||
| Diluted earnings per share from continuing operations(a) |
$ | 1.62 | $ | 1.58 | $ | 1.34 | $ | 1.44 | $ | 1.39 | |||||
| Basic Weighted-average shares outstanding |
135.9 | 140.0 | 139.6 | 138.8 | 138.8 | ||||||||||
| Diluted Weighted-average shares outstanding |
139.1 | 141.6 | 141.0 | 139.0 | 138.8 | ||||||||||
| Cash dividends declared per common share |
$ | 0.56 | $ | 0.28 | $ | 0.24 | $ | 0.06 | $ | — | |||||
| June 30, | |||||||||||||||
| 2010 | 2009 | 2008 | 2007 | 2006 | |||||||||||
| (in millions) | |||||||||||||||
| Balance Sheet Data |
|||||||||||||||
| Cash and cash equivalents |
$ | 412.6 | $ | 173.4 | $ | 54.7 | $ | 72.2 | $ | 33.1 | |||||
| Securities clearing receivables(b) |
52.5 | 1,011.3 | 1,369.9 | 1,241.2 | 836.8 | ||||||||||
| Total current assets |
992.4 | 2,051.8 | 2,131.8 | 2,013.7 | 1,459.6 | ||||||||||
| Property, plant and equipment, net |
87.4 | 75.4 | 82.6 | 77.4 | 80.7 | ||||||||||
| Total assets |
1,794.4 | 2,774.7 | 2,833.6 | 2,678.2 | 2,134.7 | ||||||||||
| Securities clearing payables(b) |
77.4 | 1,088.1 | 1,157.4 | 915.4 | 613.6 | ||||||||||
| Total current liabilities |
475.2 | 1,429.9 | 1,532.2 | 1,433.2 | 995.3 | ||||||||||
| Long-term debt |
324.1 | 324.1 | 447.9 | 617.7 | — | ||||||||||
| Total liabilities |
987.3 | 1,865.7 | 2,087.8 | 2,147.1 | 1,091.5 | ||||||||||
| Total stockholders’ equity |
807.1 | 909.0 | 745.8 | 531.1 | 1,043.2 | ||||||||||
| (a) | The computation of basic earnings per share (“EPS”) from continuing operations is based on the Company’s Net Earnings divided by the basic Weighted-average shares outstanding. On March 30, 2007, the separation from ADP was completed in a tax-free distribution to the Company’s stockholders of one share of the Company’s common stock for every four shares of ADP common stock held on March 23, 2007 (the “Distribution”). As a result, on March 30, 2007, the Company had 138.8 million Weighted-average shares outstanding, and this Weighted-average share amount is utilized for the calculation of basic EPS for all periods presented before the Distribution. For all periods before the date of Distribution, the same number of Weighted-average shares outstanding is used for the calculation of diluted EPS as for basic EPS, as no common stock of the Company existed before March 31, 2007 and no equity awards of the Company were outstanding for the prior periods. Diluted EPS subsequent to the Distribution reflects the potential dilution that could occur if outstanding stock options at the presented date are exercised and shares of restricted stock have vested. |
| (b) | See Note 7, “Discontinued Operations” to our Financial Statements under Item 8 of Part II of this Annual Report on Form 10-K for additional information about our Securities clearing receivables and Securities clearing payables. |
24
Table of Contents
| ITEM 7. | Management’s Discussion and Analysis of Financial Condition and Results of Operations |
This discussion summarizes the significant factors affecting the results of operations and financial condition of Broadridge during the fiscal years ended June 30, 2010, 2009, and 2008 and should be read in conjunction with our Financial Statements and accompanying Notes thereto included elsewhere herein. Certain information contained in “Management’s Discussion and Analysis of Financial Condition and Results of Operations” are “forward-looking statements” within the meaning of the Private Securities Litigation Reform Act of 1995. Statements that are not historical in nature and which may be identified by the use of words like “expects,” “assumes,” “projects,” “anticipates,” “estimates,” “we believe,” “could be” and other words of similar meaning, are forward-looking statements. These statements are based on management’s expectations and assumptions and are subject to risks and uncertainties that may cause actual results to differ materially from those expressed. Our actual results may differ materially from the results discussed in this Item 7 because of various factors, including those set forth elsewhere herein. See “Forward-Looking Statements” and “Risk Factors” included in Item 1 of this Annual Report on Form 10-K.
DESCRIPTION OF THE COMPANY AND BUSINESS SEGMENTS
Broadridge is a leading global provider of technology solutions to the financial services industry. Our systems and services include investor communication solutions, and securities processing and operations outsourcing solutions. We offer advanced integrated systems and services that are dependable, scalable and cost-efficient. Our systems help reduce the need for clients to make significant capital investments in operations infrastructure, thereby allowing them to increase their focus on core business activities. Our operations are classified into two business segments: Investor Communication Solutions and Securities Processing Solutions.
Investor Communication Solutions
A large portion of our Investor Communication Solutions business involves the processing and distribution of proxy materials to investors in equity securities and mutual funds, as well as the facilitation of related vote processing. ProxyEdge, our innovative electronic proxy delivery and voting solution for institutional investors, helps ensure the participation of the largest stockholders of many companies. We also provide the distribution of regulatory reports and corporate action/reorganization event information, as well as tax reporting solutions that help our clients meet their regulatory compliance needs. In addition, we provide financial information distribution and transaction reporting services to both financial institutions and securities issuers. These services include the processing and distribution of account statements and trade confirmations, traditional and personalized document fulfillment and content management services, marketing communications, and imaging, archival and workflow solutions that enable and enhance our clients’ communications with investors. All of these communications are delivered in paper or electronic form.
Securities Processing Solutions
We offer a suite of advanced computerized real-time transaction processing services that automate the securities transaction lifecycle, from desktop productivity tools, data aggregation, performance reporting, and portfolio management to order capture and execution, trade confirmation, settlement, and accounting. Our services help financial institutions efficiently and cost-effectively consolidate their books and records, gather and service assets under management, focus on their core businesses, and manage risk. With multi-currency capabilities, our Global Processing Solution supports real-time global trading of equity, option, mutual fund and fixed income securities in established and emerging markets. In addition, our operations outsourcing solutions allow broker-dealers to outsource certain administrative functions relating to clearing and settlement, from order entry to trade matching and settlement, while maintaining their ability to finance and capitalize their business.
ACQUISITIONS
Assets acquired and liabilities assumed in business combinations were recorded on the Company’s Consolidated Balance Sheets as of the respective acquisition dates based upon their estimated fair values at such
25
Table of Contents
dates. The results of operations of businesses acquired by the Company were included in the Company’s Consolidated Statements of Earnings since their respective dates of acquisition. The excess of the purchase price over the estimated fair values of the underlying assets acquired and liabilities assumed was allocated to goodwill.
Acquisitions completed by the Company with an aggregate purchase price of greater than $15.0 million during the fiscal years ended June 30, 2010, 2009 and 2008, were as follows:
The Company acquired one business in the Securities Processing Solutions segment in fiscal year 2010 for $37.7 million. This acquisition resulted in $20.9 million of goodwill. Intangible assets acquired, which totaled $10.6 million, consist primarily of customer relationships and acquired software technology, which are being amortized over a ten-year life and five-year life, respectively. This acquisition was not material to the Company’s operations, financial position, or cash flows.
The Company acquired one business in the Investor Communication Solutions segment in fiscal year 2009 for $45.2 million. This acquisition resulted in $31.4 million of goodwill. Intangible assets acquired, which totaled $13.0 million, consist primarily of acquired technology and customer relationships that are being amortized over a five-year life and seven-year life, respectively. This acquisition was not material to the Company’s operations, financial position, or cash flows.
The Company also completed acquisitions with individual aggregate purchase prices of less than $15.0 million during fiscal years 2010, 2009 and 2008, respectively, which were not material to the Company’s consolidated Financial Statements.
DIVESTITURES
In November 2009, the Company and Ridge entered into an Asset Purchase Agreement with PWI and PFSI, to sell substantially all contracts of the securities clearing clients of Ridge to PFSI. On June 25, 2010, the Company completed the sale of the contracts of substantially all of the securities clearing clients of Ridge to PFSI, for an aggregate purchase price of $35.2 million. The purchase price paid to Broadridge consists of (i) a five-year subordinated note from PWI in the principal amount of $20.6 million bearing interest at an annual rate equal to the London Inter-Bank Offer Rate (“LIBOR”) plus 550 basis points, and (ii) 2,455,627 shares of PWI’s common stock (representing 9.5% of PWI’s outstanding common stock as of May 31, 2010), at the June 25, 2010 closing price of PWI’s common stock of $5.95 per share. The purchase price is subject to certain adjustments post-closing including adjustments to reflect certain recently signed correspondent clearing contracts. The Company will discontinue its securities clearing services business but will continue to provide operations outsourcing solutions aligned with the Securities Processing Solutions business. See Note 7, “Discontinued Operations” for detailed information on discontinued operations.
BORROWINGS
On March 29, 2007, the Company entered into a $1,190.0 million senior unsecured credit facility, consisting of a $440.0 million five-year term loan facility, a $500.0 million five-year revolving credit facility and a $250.0 million one-year revolving credit facility. On March 29, 2007, the Company borrowed $440.0 million under the five-year term loan facility and $250.0 million under the one-year revolving credit facility. The proceeds received in connection with the $690.0 million of borrowings were paid to our former parent company Automatic Data Processing, Inc. (“ADP”) on March 30, 2007 as a dividend. These credit facilities are subject to covenants, including financial covenants consisting of a leverage ratio and an interest coverage ratio. At June 30, 2010 and 2009, the Company was not aware of any instances of non-compliance with the financial covenants of these credit facilities.
During the fiscal years ended June 30, 2010, 2009 and 2008, the Company repaid zero, zero and $170.0 million, respectively, of the five-year term loan facility. The one-year revolving credit facility was cancelled upon repayment on May 29, 2007 with the net proceeds from the issuance of $250.0 million in aggregate principal amount of the 6.125% Senior Notes due 2017 (the “Senior Notes”) and cash. The terms of the Senior
26
Table of Contents
Notes are governed by an indenture, dated as of May 29, 2007, by and between Broadridge and U.S. Bank National Association, as trustee thereunder. The Senior Notes are unsecured obligations of Broadridge and rank equally in right of payment with other unsecured and unsubordinated obligations of Broadridge. Interest is payable semiannually on June 1 and December 1 each year based on a fixed per annum rate equal to 6.125%. During fiscal year 2009, the Company completed the purchase of $125.0 million principal amount of the Senior Notes (including $1.0 million unamortized bond discount) pursuant to the cash tender offer for such notes. The consideration paid for the Senior Notes accepted for payment was $116.3 million. The completed purchase resulted in a one-time non-cash gain from early extinguishment of debt of $8.4 million. Please refer to Note 11, “Borrowings” to our Financial Statements under Item 8 of Part II of this Annual Report on Form 10-K for a more detailed discussion.
BASIS OF PRESENTATION
The Financial Statements have been prepared in accordance with accounting principles generally accepted in the U.S. These Financial Statements present the consolidated position of the Company. These Financial Statements include the entities in which the Company directly or indirectly has a controlling financial interest and various entities in which the Company has investments recorded under the cost and equity methods of accounting. Intercompany balances and transactions have been eliminated.
In presenting the Financial Statements, management makes estimates and assumptions that affect the amounts reported and related disclosures. Estimates, by their nature, are based on judgment and available information. Accordingly, actual results could differ from those estimates. In management’s opinion, the Financial Statements contain all normal recurring adjustments necessary for a fair presentation of results reported. The results of operations reported for the periods presented are not necessarily indicative of the results of operations for subsequent periods.
CRITICAL ACCOUNTING POLICIES
We continually evaluate the accounting policies and estimates used to prepare the Financial Statements. The estimates are based on historical experience and are believed to be reasonable. Actual amounts and results could differ from these estimates made by management. Certain accounting policies that require significant management estimates and are deemed critical to our results of operations or financial position are discussed below.
Goodwill. We review the carrying value of all our goodwill in accordance with Accounting Standards Codification (“ASC”) No. 350, “Intangibles—Goodwill and Other” (“ASC No. 350”) (formerly Financial Accounting Standards Board, (“FASB”) Statement of Financial Accounting Standards (“SFAS”) No. 142, “Goodwill and Other Intangible Assets”), by comparing the carrying value of our reporting units to their fair values. We are required to perform this comparison at least annually or more frequently if circumstances indicate possible impairment. When determining fair value, we utilize a discounted future cash flow approach using various assumptions, including projections of revenues based on assumed long-term growth rates, estimated costs and appropriate discount rates based on the particular business’ weighted-average cost of capital. The principal factors used in the discounted cash flow analysis requiring judgment are the projected future operating cash flows, the weighted-average cost of capital and the terminal value growth rate assumptions. The weighted-average cost of capital takes into account the relative weights of each component of our consolidated capital structure (equity and long-term debt). Our estimates of long-term growth and costs are based on historical data, various internal estimates and a variety of external sources, and are developed as part of our routine, long-range planning process. Changes in economic and operating conditions impacting these assumptions could result in goodwill impairments in future periods. We had $509.5 million of goodwill as of June 30, 2010. Given the significance of our goodwill, an adverse change to the fair value could result in an impairment charge, which could be material to our earnings. A 10% change in our estimates of projected future operating cash flows, discount rates, or terminal value growth rates used in our calculations of the fair values of the reporting units would have no impact on the reported value of our goodwill.
27
Table of Contents
Income Taxes. We account for income taxes in accordance with ASC No. 740, “Income Taxes” (formerly SFAS No. 109, “Accounting for Income Taxes”), which establishes financial accounting and reporting standards for the effect of income taxes. The objectives of accounting for income taxes are to recognize the amount of taxes payable or refundable for the current year and deferred tax liabilities and assets for the future tax consequences of events that have been recognized in an entity’s financial statements or tax returns. Judgment is required in addressing the future tax consequences of events that have been recognized in our Financial Statements or tax returns (e.g., realization of deferred tax assets, changes in tax laws or interpretations thereof). In addition, although currently not under any U.S. or foreign income tax exam for the period March 31, 2007 through June 30, 2010, in the future we expect to be subject to the continuous examination of our income tax returns by the IRS and other tax authorities. A change in the assessment of the outcomes of such matters could materially impact our Financial Statements. As of June 30, 2010, we had estimated foreign net operating loss carryforwards of approximately $24.0 million as of June 30, 2010 of which $8.7 million expires in 2011 through 2017 and $15.3 million which has an indefinite utilization period. In addition, the Company has estimated U.S. federal net operating loss carryforwards of approximately $42.8 million, which expire in 2020 through 2029. We have recorded valuation allowances of $15.9 million and $25.7 million at June 30, 2010 and 2009, respectively, because the Company does not believe that it is more likely than not that it will be able to utilize the deferred tax assets attributable to net operating and capital loss carryforwards of certain subsidiaries to offset future taxable earnings.
Share-based Payments. ASC No. 718 “Compensation—Stock Compensation” (formerly SFAS No. 123R, “Share-Based Payment”), requires the measurement of stock-based compensation expense based on the fair value of the award on the date of grant. We determine the fair value of stock options issued by using a binomial option-pricing model. The binomial option-pricing model considers a range of assumptions related to volatility, dividend yield, risk-free interest rate and employee exercise behavior. Expected volatilities utilized in the binomial option-pricing model are based on a combination of implied market volatilities, historical volatility of our stock price and other factors. Similarly, the dividend yield is based on historical experience and expected future changes. The risk-free rate is derived from the U.S. Treasury yield curve in effect at the time of grant. The binomial option-pricing model also incorporates exercise and forfeiture assumptions based on an analysis of historical data. The expected life of the stock option grants is derived from the output of the binomial model and represents the period of time that options granted are expected to be outstanding. Determining these assumptions are subjective and complex, and therefore, a change in the assumptions utilized could impact the calculation of the fair value of our stock options. A hypothetical change of five percentage points applied to the volatility assumption used to determine the fair value of the fiscal year 2010 stock option grants would result in approximately a $1.1 million change in total pre-tax stock-based compensation expense for the fiscal year 2010 grants, which would be amortized over the vesting period. A hypothetical change of one year in the expected life assumption used to determine the fair value of the fiscal year 2010 stock option grants would result in approximately a $0.4 million change in the total pre-tax stock-based compensation expense for the fiscal year 2010 grants, which would be amortized over the vesting period. A hypothetical change of one percentage point in the forfeiture rate assumption used for the fiscal year 2010 stock option grants would result in approximately a $0.1 million change in the total pre-tax stock-based compensation expense for the fiscal year 2010 grants, which would be amortized over the vesting period. A hypothetical one-half percentage point change in the dividend yield assumption used to determine the fair value of the fiscal year 2010 stock option grants would result in approximately a $0.5 million change in the total pre-tax stock-based compensation expense for the fiscal year 2010 grants, which would be amortized over the vesting period.
RESULTS OF OPERATIONS
The following discussions of Analysis of Consolidated Continuing Operations and Analysis of Reportable Segments refers to the fiscal year ended June 30, 2010 compared to the fiscal year ended June 30, 2009, and the fiscal year ended June 30, 2009 compared to the fiscal year ended June 30, 2008. The Analysis of Consolidated Continuing Operations should be read in conjunction with the Analysis of Reportable Segments, which provides more detailed discussions concerning certain components of the Consolidated Results of Continuing Operations.
28
Table of Contents
ANALYSIS OF CONSOLIDATED OPERATIONS
Fiscal Year 2010 Compared to Fiscal Year 2009
The table below presents Consolidated Statement of Earnings from Continuing Operations data for the fiscal years ended June 30, 2010 and 2009, and the dollar and percentage changes between periods:
| Years Ended June 30, | |||||||||||||||
| 2010 | 2009 | Change | |||||||||||||
| ($) | (%) | ||||||||||||||
| ($ in millions, except for per share amounts) | |||||||||||||||
| Revenues |
$ | 2,209.2 | $ | 2,073.0 | $ | 136.2 | 7 | ||||||||
| Cost of revenues |
1,616.4 | 1,510.1 | 106.3 | 7 | |||||||||||
| Selling, general and administrative expenses |
241.6 | 212.9 | 28.7 | 13 | |||||||||||
| Other expenses, net |
9.1 | 4.0 | 5.1 | NM | * | ||||||||||
| Total expenses |
1,867.1 | 1,727.0 | 140.1 | 8 | |||||||||||
| Earnings from continuing operations before income taxes |
342.1 | 346.0 | (3.9 | ) | (1 | ) | |||||||||
| Margin |
15.5 | % | 16.7 | % | (1.2 | ) pts | |||||||||
| Provision for income taxes |
117.0 | 122.9 | (5.9 | ) | (5 | ) | |||||||||
| Effective tax rate |
34.2 | % | 35.5 | % | (1.3 | ) pts | |||||||||
| Net earnings from continuing operations |
$ | 225.1 | $ | 223.1 | $ | 2.0 | 1 | ||||||||
| Basic earnings per share from continuing operations |
$ | 1.66 | $ | 1.60 | $ | 0.06 | 4 | ||||||||
| Diluted earnings per share from continuing operations |
$ | 1.62 | $ | 1.58 | $ | 0.04 | 3 | ||||||||
| * | Not Meaningful |
Revenues. Revenues for the fiscal year ended June 30, 2010 were $2,209.2 million, an increase of $136.2 million or 7%, compared to $2,073.0 million for the fiscal year ended June 30, 2009. The increase reflects higher contributions from fee revenues of $112.4 million and higher distribution revenues of $23.8 million. Distribution revenues consist primarily of postage related fees. Higher fee revenues of $112.4 million were primarily driven by $77.0 million in event-driven mutual fund proxy revenues. Also contributing to the 7% increase, were higher recurring revenues driven by a positive contribution from sales less losses (“Net New Business”) including the recently signed contract with Morgan Stanley Smith Barney LLC (“MSSB”), and gains from acquisitions, partially offset by negative internal growth. Revenues were also favorably impacted by foreign currency exchange rates of $19.7 million.
Total Expenses. Total expenses for the fiscal year ended June 30, 2010 were $1,867.1 million, an increase of $140.1 million, or 8%, compared to $1,727.0 million for the fiscal year ended June 30, 2009. The increase reflects $106.3 million, or 7% increase in Cost of revenues, $28.7 million, or 13% increase in Selling, general and administrative expenses, and a $5.1 million increase in Other expenses, net.
Cost of revenues for the fiscal year ended June 30, 2010 were $1,616.4 million, an increase of $106.3 million, or 7%, compared to $1,510.1 million for the fiscal year ended June 30, 2009. The increase reflects higher expense relating to higher fee revenues driven by event-driven mutual fund proxy, the net impact of higher distribution costs related to higher distribution revenues, the integration of the MSSB business, and acquisitions. Distribution cost of revenues for the fiscal year ended June 30, 2010 were $685.7 million, an increase of $21.2 million, or 3%, compared to $664.5 million for the fiscal year ended June 30, 2009. Distribution cost of revenues consist primarily of postage related expenses. Fluctuations in foreign currency exchange rates also increased Cost of revenues by $9.3 million.
Selling, general and administrative expenses for the fiscal year ended June 30, 2010 were $241.6 million, an increase of $28.7 million, or 13%, compared to $212.9 million for the fiscal year ended June 30, 2009. The
29
Table of Contents
increase is primarily due to one-time non-recurring credits of $7.4 million during the fiscal year ended June 30, 2009, $7.2 million higher selling expenses on a 26% increase in sales for the fiscal year ended June 30, 2010, increased costs related to strategic initiatives and investments of $6.8 million and the impact of foreign currency exchange rates of $2.0 million, partially offset by $2.2 million lower stock-based compensation expense related to special stock option grants to corporate officers during the fiscal year ended June 30, 2010 which vested immediately, were expensed upon vest, and did not recur during the fiscal year ended June 30, 2010.
Other expenses, net for the fiscal year ended June 30, 2010 were $9.1 million, an increase of $5.1 million, compared to $4.0 million for the fiscal year ended June 30, 2009. The increase reflects the effect of the one-time gain of $8.4 million from the purchase of the 6.125% senior notes due 2017 (the “Senior Notes”) during the fiscal year ended June 30, 2009, a lower foreign currency exchange gain of $0.9 million, partially offset by lower interest expense on our Long-term debt of $4.5 million due to the decline in the weighted-average interest rate on our five-year term loan facility.
Earnings from Continuing Operations before Income Taxes. Earnings from Continuing Operations before income taxes for the fiscal year ended June 30, 2010 were $342.1 million, a decrease of $3.9 million, or 1%, compared to $346.0 million for the fiscal year ended June 30, 2009. The decrease reflects a higher increase in Total expenses which more than offset the increase in Revenues during the fiscal year ended June 30, 2010, compared to the fiscal year ended June 30, 2009, as discussed above. Overall margin decreased from 16.7% to 15.5% for the fiscal year ended June 30, 2009 compared to the fiscal year ended June 30, 2010, respectively.
Provision for Income Taxes. Our Provision for income taxes and Effective tax rates for the fiscal year ended June 30, 2010 were $117.0 million and 34.2%, respectively, compared to $122.9 million and 35.5%, for the fiscal year ended June 30, 2009, respectively. The decrease in our Provision for income taxes and the Effective tax rate for the fiscal year ended June 30, 2010 compared to the fiscal year ended June 30, 2009 was primarily attributable to the release of a valuation allowance on a deferred tax asset relating to tax loss carryforwards, and lower enacted tax rates in certain non-U.S. tax jurisdictions.
Net Earnings from Continuing Operations and Basic and Diluted Earnings per Share from Continuing Operations. Net Earnings from Continuing Operations for the fiscal year ended June 30, 2010 were $225.1 million, an increase of $2.0 million, or 1%, compared to $223.1 million for the fiscal year ended June 30, 2009. The increase in Net earnings from Continuing Operations reflects higher Revenues and a lower Effective tax rate, which more than offset the increase in Total expenses during the fiscal year ended June 30, 2010, compared to the fiscal year ended June 30, 2009, as discussed above.
Basic and diluted earnings per share from Continuing Operations for the fiscal year ended June 30, 2010 were $1.66, an increase of $0.06, or 4%, and $1.62, an increase of $0.04, or 3%, respectively, compared to $1.60 and $1.58 for the fiscal year ended June 30, 2009, respectively.
30
Table of Contents
Fiscal Year 2009 Compared to Fiscal Year 2008
The table below presents Consolidated Statement of Earnings from Continuing Operations data for the fiscal years ended June 30, 2009 and 2008, and the dollar and percentage changes between periods:
| Years Ended June 30, | |||||||||||||||
| 2009 | 2008 | Change | |||||||||||||
| ($) | (%) | ||||||||||||||
| ($ in millions, except for per share amounts) | |||||||||||||||
| Revenues |
$ | 2,073.0 | $ | 2,130.8 | $ | (57.8 | ) | (3 | ) | ||||||
| Cost of revenues |
1,510.1 | 1,547.8 | (37.7 | ) | (2 | ) | |||||||||
| Selling, general and administrative expenses |
212.9 | 232.4 | (19.5 | ) | (8 | ) | |||||||||
| Other expenses, net |
4.0 | 30.9 | (26.9 | ) | (87 | ) | |||||||||
| Total expenses |
1,727.0 | 1,811.1 | (84.1 | ) | (5 | ) | |||||||||
| Earnings from continuing operations before income taxes |
346.0 | 319.7 | 26.3 | 8 | |||||||||||
| Margin |
16.7 | % | 15.0 | % | 1.7 | pts | |||||||||
| Provision for income taxes |
122.9 | 131.3 | (8.4 | ) | (6 | ) | |||||||||
| Effective tax rate |
35.5 | % | 41.1 | % | (5.6 | )pts | |||||||||
| Net earnings from continuing operations |
$ | 223.1 | $ | 188.4 | $ | 34.7 | 18 | ||||||||
| Basic earnings per share from continuing operations |
$ | 1.60 | $ | 1.35 | $ | 0.25 | 19 | ||||||||
| Diluted earnings per share from continuing operations |
$ | 1.58 | $ | 1.34 | $ | 0.24 | 18 | ||||||||
Revenues. Revenues for the fiscal year ended June 30, 2009 were $2,073.0 million, a decrease of $57.8 million or 3%, compared to $2,130.8 million for the fiscal year ended June 30, 2008. The decrease reflects lower contributions from distribution revenues of $51.0 million and fee revenues of $6.8 million. Distribution revenues consist primarily of postage related fees. Lower fee revenues of $6.8 million were primarily driven by the unfavorable impact of foreign currency exchange rates of $32.0 million and lower contribution from event-driven revenues of $20.3 million, mostly offset by Net New Business of $25.7 million and internal growth of $22.1 million.
Total Expenses. Total expenses for the fiscal year ended June 30, 2009 were $1,727.0 million, a decrease of $84.1 million, or 5%, compared to $1,811.1 million for the fiscal year ended June 30, 2008. The decrease in Total expenses reflects a decrease of $37.7 million, or 2% in Cost of revenues, a decrease of $19.5 million, or 8% in Selling, general and administrative expenses, and a decrease of $26.9 million, or 87% in Other expenses, net.
Cost of revenues for the fiscal year ended June 30, 2009 were $1,510.1 million, a decrease of $37.7 million, or 2%, compared to $1,547.8 million for the fiscal year ended June 30, 2008. The decrease reflects a decline in distribution costs in our Investor Communication Solutions segment reflecting lower distribution revenues, as discussed above. Distribution cost of revenues for the fiscal year ended June 30, 2009 were $664.5 million, a decrease of $47.2 million, or 7%, compared to $711.7 million for the fiscal year ended June 30, 2008. Distribution cost of revenues consist primarily of postage related expenses. Fluctuations in foreign currency exchange rates also decreased Cost of revenues by $15.7 million. These decreases were partially offset by increased Cost of revenues in our Securities Processing Solutions segment of $19.2 million, or 6% reflecting higher investment spend related to both new products and new business, increased amortization of conversion costs and lower capitalization of conversion related resources, and higher corporate investment spending of $8.5 million.
Selling, general and administrative expenses for the fiscal year ended June 30, 2009 were $212.9 million, a decrease of $19.5 million, or 8%, compared to $232.4 million for the fiscal year ended June 30, 2008. The decrease reflects one-time non-recurring transition costs of $13.7 million for the fiscal year ended June 30, 2008. Also contributing to the decrease, were $10.2 million in lower stock-based compensation expense primarily
31
Table of Contents
reflecting a $5.4 million decrease in stock-based compensation expense related to special stock option grants to corporate officers, and fluctuations in foreign currency exchange rates of $6.0 million. These decreases were partially offset by $9.8 million of higher incremental public company expenses and $3.9 million of higher selling expenses.
Other expenses, net for the fiscal year ended June 30, 2009 were $4.0 million, a decrease of $26.9 million, or 87%, compared to $30.9 million for the fiscal year ended June 30, 2008. The decrease reflects a $2.8 million foreign currency exchange gain, $8.4 million gain from the purchase of $125.0 million principal amount of the Senior Notes, and a decrease in interest expense of $17.0 million reflecting lower interest expense on our Long-term debt related to a lower outstanding balance because of the purchase of the Senior Notes during the fiscal year ended June 30, 2009, and the decline in the weighted-average interest rate on the five-year term loan facility.
Earnings from Continuing Operations before Income Taxes. Earnings from Continuing Operations before income taxes for the fiscal year ended June 30, 2009 were $346.0 million, an increase of $26.3 million, or 8%, compared to $319.7 million for the fiscal year ended June 30, 2008. The increase reflects a decline in Revenues which was more than offset by the decline in Total expenses during the fiscal year ended June 30, 2009 compared to the fiscal year ended June 30, 2008, as discussed above. Overall margin increased from 15.0% to 16.7% for the fiscal year ended June 30, 2008 as compared to the fiscal year ended June 30, 2009. Excluding one-time non-recurring transition costs of $13.7 million for the fiscal year ended June 30, 2008, overall margin increased from 15.6% to 16.7%.
Provision for Income Taxes. Our Provision for income taxes and Effective tax rate for the fiscal year ended June 30, 2009 were $122.9 million and 35.5%, respectively, compared to $131.3 million and 41.1%, for the fiscal year ended June 30, 2008, respectively. The decrease in our Provision for income taxes and Effective tax rate is primarily attributable to approved certification for a state tax credit program scheduled to expire in 2018 and lower enacted tax rates in certain U.S. state and international tax jurisdictions for the fiscal year ended June 30, 2009. The state tax credit program is retroactive to fiscal year 2008. The year-to-date benefit of $8.0 million was comprised of $4.0 million for fiscal year 2008 and $4.0 million for fiscal year 2009. The effect of the retroactive adjustment attributable to the reporting period for the state tax credit program applicable to prior periods was a reduction in our Provision for income taxes and Effective tax rate of $4.0 million and 1.2 percentage points, for the fiscal year ended June 30, 2009.
Net Earnings from Continuing Operations and Basic and Diluted Earnings per Share from Continuing Operations. Net earnings from Continuing Operations for the fiscal year ended June 30, 2009 were $223.1 million, an increase of $34.7 million, or 18%, compared to $188.4 million for the fiscal year ended June 30, 2008. The increase in Net earnings from Continuing Operations reflects a decline in Revenues, which was more than offset by a reduction in Total expenses and a lower Effective tax rate during the fiscal year ended June 30, 2009 compared to the fiscal year ended June 30, 2008, as discussed above.
Basic and diluted earnings per share from Continuing Operations for the fiscal year ended June 30, 2009 were $1.60 and $1.58, respectively, an increase of $0.25 and $0.24, respectively, or 19% and 18%, respectively, compared to $1.35 and $1.34, respectively, for the fiscal year ended June 30, 2008.
ANALYSIS OF REPORTABLE SEGMENTS
As a result of Broadridge entering into the Asset Purchase Agreement to sell substantially all of the contracts of the securities clearing clients of Ridge to PFSI, Broadridge now has two reportable operating business segments: Investor Communication Solutions and Securities Processing Solutions. The securities clearing business is reflected in discontinued operations (see Note 1, “Basis of Presentation” and Note 7, “Discontinued Operations” for detailed information on discontinued operations), and the operations outsourcing solutions business retained by Broadridge is now reported as part of the Securities Processing Solutions business segment. This change is reflected in all prior periods presented in this report on Form 10-K.
32
Table of Contents
The primary components of “Other” are the elimination of intersegment revenues and profits as well as certain unallocated expenses. Foreign exchange is a reconciling item between the actual foreign exchange rates and budgeted foreign exchange rates.
Certain corporate expenses, as well as certain centrally managed expenses, are allocated based upon budgeted amounts in a reasonable manner. Because the Company compensates the management of its various businesses on, among other factors, segment profit, the Company may elect to record certain segment-related expense items of an unusual or non-recurring nature in consolidation rather than reflect such items in segment profit.
Revenues
| Years Ended June 30, | Change | |||||||||||||||||||||||
| 2010 vs. 2009 | 2009 vs. 2008 | |||||||||||||||||||||||
| 2010 | 2009 | 2008 | $ | % | $ | % | ||||||||||||||||||
| ($ in millions) | ||||||||||||||||||||||||
| Investor Communication Solutions |
$ | 1,669.6 | $ | 1,531.0 | $ | 1,575.2 | $ | 138.6 | 9 | $ | (44.2 | ) | (3 | ) | ||||||||||
| Securities Processing Solutions |
535.9 | 558.9 | 533.5 | (23.0 | ) | (4 | ) | 25.4 | 5 | |||||||||||||||
| Other |
2.4 | 1.5 | 8.5 | 0.9 | 60 | (7.0 | ) | (82 | ) | |||||||||||||||
| Foreign currency exchange |
1.3 | (18.4 | ) | 13.6 | 19.7 | NM | * | (32.0 | ) | NM | * | |||||||||||||
| Total |
$ | 2,209.2 | $ | 2,073.0 | $ | 2,130.8 | $ | 136.2 | 7 | $ | (57.8 | ) | (3 | ) | ||||||||||
| * | Not Meaningful |
Earnings (Loss) from Continuing Operations before Income Taxes
| Years Ended June 30, | Change | |||||||||||||||||||||||||
| 2010 vs. 2009 | 2009 vs. 2008 | |||||||||||||||||||||||||
| 2010 | 2009 | 2008 | $ | % | $ | % | ||||||||||||||||||||
| ($ in millions) | ||||||||||||||||||||||||||
| Investor Communication Solutions |
$ | 272.8 | $ | 248.9 | $ | 255.3 | $ | 23.9 | 10 | $ | (6.4 | ) | (3 | ) | ||||||||||||
| Securities Processing Solutions |
99.3 | 133.8 | 127.0 | (34.5 | ) | (26 | ) | 6.8 | 5 | |||||||||||||||||
| Other |
(34.1 | ) | (32.5 | ) | (68.7 | ) | (1.6 | ) | (5 | ) | 36.2 | 53 | ||||||||||||||
| Foreign currency exchange |
4.1 | (4.2 | ) | 6.1 | 8.3 | NM | * | (10.3 | ) | NM | * | |||||||||||||||
| Earnings before income taxes |
$ | 342.1 | $ | 346.0 | $ | 319.7 | $ | (3.9 | ) | (1 | ) | $ | 26.3 | 8 | ||||||||||||
| * | Not Meaningful |
Investor Communication Solutions
Fiscal Year 2010 Compared to Fiscal Year 2009
Revenues. Investor Communication Solutions segment’s Revenues for the fiscal year ended June 30, 2010 were $1,669.6 million, an increase of $138.6 million, or 9%, compared to $1,531.0 million for the fiscal year ended June 30, 2009. The 9% increase was primarily driven by higher event-driven fee revenues from mutual fund proxy. Also contributing to the Revenue increase were higher recurring revenues driven by Net New Business in transaction reporting primarily as a result of the recently signed contract with MSSB and revenue gains from acquisitions. Distribution revenues for the fiscal year ended June 30, 2010 were $780.6 million, an increase of $23.8 million, or 3% compared to $756.8 million for the fiscal year ended June 30, 2009. Position growth, a key measure in the number of pieces processed, was negative 1% for annual equity proxy and a positive 6% for mutual fund interim communications. The number of pieces processed increased 7% from 1,196.8 million pieces to 1,276.1 million pieces driven primarily by event-driven mutual fund proxy activity.
33
Table of Contents
Earnings from Continuing Operations before Income Taxes. Earnings from Continuing Operations before income taxes for the fiscal year ended June 30, 2010 were $272.8 million, an increase of $23.9 million, or 10%, compared to $248.9 million for the fiscal year ended June 30, 2009. Margin was unchanged from 16.3% as contribution from higher fee revenues were offset by strategic initiatives including MSSB and increased investment spend on acquisitions.
Fiscal Year 2009 Compared to Fiscal Year 2008
Revenues. Investor Communication Solutions segment’s Revenues for the fiscal year ended June 30, 2009 were $1,531.0 million, a decrease of $44.2 million, or 3%, compared to $1,575.2 million for the fiscal year ended June 30, 2008. The decrease reflects lower net distribution revenues driven by less event-driven activity and higher adoption rates for notice and access, partially offset by increased recurring revenues driven by Net New Business and internal growth. Net distribution revenues were $756.8 million, a decrease of $51.0 million, or 6%. Position growth, a key measure in the number of pieces processed, was negative 2% for annual equity proxies and a positive 4% for mutual fund interim communications. The total number of pieces processed decreased 1% from 1,210.5 million pieces to 1,196.8 million pieces.
Earnings from Continuing Operations before Income Taxes. Earnings from Continuing Operations before income taxes for the fiscal year ended June 30, 2009 were $248.9 million, a decrease of $6.4 million, or 3%, compared to $255.3 million for the fiscal year ended June 30, 2008. Margin increased 0.1 percentage point compared to the prior year to 16.3%.
Securities Processing Solutions
Fiscal Year 2010 Compared to Fiscal Year 2009
Revenues. Securities Processing Solutions segment’s Revenues for the fiscal year ended June 30, 2010 were $535.9 million, a decrease of $23.0 million, or 4%, compared to $558.9 million for the fiscal year ended June 30, 2009. The 4% decrease in Revenues was driven by the fiscal year 2009 carryover impact of client losses and price concessions as well as lower trade volumes in our equity and fixed income businesses, partially offset by new business. Operations outsourcing revenues was essentially unchanged.
Earnings from Continuing Operations before Income Taxes. Earnings from Continuing Operations before income taxes for the fiscal year ended June 30, 2010 were $99.3 million, a decrease of $34.5 million, or 26%, compared to $133.8 million for the fiscal year ended June 30, 2009. Margin decreased by 5.4 percentage points to 18.5% for the fiscal year ended June 30, 2010. The decrease is primarily due to the impact of revenue mix.
Fiscal Year 2009 Compared to Fiscal Year 2008
Revenues. Securities Processing Solutions segment’s Revenues for the fiscal year ended June 30, 2009 were $558.9 million, an increase of $25.4 million, or 5%, compared to $533.5 million for the fiscal year ended June 30, 2008. The increase in Revenues was driven by internal growth reflecting higher non-transaction service revenue, higher Net New Business and revenue contribution from an acquisition. Operations outsourcing contributed $5.9 million of the revenue increase, driven primarily by Net New Business.
Earnings from Continuing Operations before Income Taxes. Earnings from Continuing Operations before income taxes for the fiscal year ended June 30, 2009 were $133.8 million, an increase of $6.8 million, or 5%, compared to $127.0 million for the fiscal year ended June 30, 2008. Margin increased 0.1 percentage point compared to the prior year to 23.9%. Margin contribution from higher revenue was more than offset by higher investment spend related to new products, increased amortization of conversion costs, and lower capitalization of conversion related resources.
34
Table of Contents
Other
Fiscal Year 2010 Compared to Fiscal Year 2009
Revenues. Other segment Revenues were $2.4 million, an increase of $0.9 million for the fiscal year ended June 30, 2010, compared to $1.5 million for the fiscal year ended June 30, 2009, reflecting primarily one-time non-recurring termination fees during the fiscal year ended June 30, 2010.
Loss from Continuing Operations before Income Taxes. Loss from Continuing Operations before income taxes was $34.1 million for the fiscal year ended June 30, 2010, an increase of $1.6 million, compared to a $32.5 million loss from continuing operations before income taxes for the fiscal year ended June 30, 2009. The increased loss reflects the effect of the one-time gain from the purchase of the Senior Notes of $8.4 million during the fiscal year ended June 30, 2009 and a lower foreign currency exchange gain of $0.9 million. This loss was partially offset by lower interest expense on our Long-term debt of $4.5 million due to the decline in the weighted-average interest rate on our five-year term loan facility, a decrease of $2.2 million in stock-based compensation expense due to special stock option grants to corporate officers, and a reduction in corporate spending. The increase also reflects $0.9 million in one-time termination fees during the fiscal year ended June 30, 2010.
Fiscal Year 2009 Compared to Fiscal Year 2008
Revenues. Other Revenues were $1.5 million, a decrease of $7.0 million for the fiscal year ended June 30, 2009, compared to $8.5 million for the fiscal year ended June 30, 2008, reflecting primarily one-time non-recurring termination fees during the fiscal year ended June 30, 2008.
Loss from Continuing Operations before Income Taxes. The primary components of Other expenses are certain unallocated expenses and Other expenses, net. Loss from Continuing Operations before income taxes was $32.5 million for the fiscal year ended June 30, 2009, a decrease of $36.2 million, compared to a $68.7 million loss for the fiscal year ended June 30, 2008. The improvement reflects an $8.4 million gain from the purchase of $125.0 million principal amount of the Senior Notes during the fiscal year ended June 30, 2009 and an increase in foreign currency exchange gain of $2.8 million. Interest expense on our Long-term debt declined by $17.0 million due to a lower outstanding balance and the decline in the weighted-average interest rate on our five-year term loan facility. One-time transition costs of $13.7 million during the fiscal year ended June 30, 2008 did not recur. Stock compensation expense decreased by $8.2 million primarily due to higher expense for the fiscal year ended June 30, 2008 related to the special stock option grants to corporate officers granted in that fiscal year. The gains and expense reductions were partially offset by increased investment expenses of $8.5 million during the fiscal year ended June 30, 2009 and $7.0 million in one-time non-recurring termination fees earned during the fiscal year ended June 30, 2008.
FINANCIAL CONDITION, LIQUIDITY AND CAPITAL RESOURCES
At June 30, 2010 and 2009, Cash and cash equivalents were $412.6 million and $173.4 million, respectively. Total stockholders’ equity was $807.1 million and $909.0 million at June 30, 2010 and 2009, respectively. At June 30, 2010, working capital was $506.0 million, compared to $621.9 million at June 30, 2009.
On March 29, 2007, the Company entered into a $1,190.0 million senior unsecured credit facility, consisting of a $440.0 million five-year term loan, a $500.0 million five-year revolving credit facility and a $250.0 million one-year revolving credit facility. On March 29, 2007, the Company borrowed $440.0 million under the five-year term loan facility and $250.0 million under the one-year revolving credit facility. The proceeds received in connection with the $690.0 million of borrowings were paid to ADP on March 30, 2007 as a dividend. These credit facilities are subject to covenants, including financial covenants consisting of a leverage ratio and an interest coverage ratio. At June 30, 2010 and 2009, the Company was not aware of any instances of non-compliance with the financial covenants of these credit facilities.
35
Table of Contents
During the fiscal years 2010, 2009, and 2008, the Company repaid zero, zero and $170.0 million, respectively, of the five-year term loan facility. The one-year revolving credit facility was cancelled upon repayment on May 29, 2007 with the net proceeds from the issuance of $250.0 million in aggregate principal amount of the Senior Notes and cash. The terms of the Senior Notes are governed by an indenture, dated as of May 29, 2007, by and between Broadridge and U.S. Bank National Association, as trustee thereunder. The Senior Notes are unsecured obligations of Broadridge and rank equally in right of payment with other unsecured and unsubordinated obligations of Broadridge. Interest is payable semiannually on June 1 and December 1 each year based on a fixed per annum rate equal to 6.125%. During fiscal year 2009, the Company completed the purchase of $125.0 million principal amount of the Senior Notes (including $1.0 million unamortized bond discount) pursuant to the cash tender offer for such notes. The consideration paid for the Senior Notes accepted for payment was $116.3 million. The completed purchase resulted in a one-time non-cash gain from early extinguishment of debt of $8.4 million. Please refer to Note 11, “Borrowings” to our Financial Statements under Item 8 of Part II of this Annual Report on Form 10-K for a more detailed discussion.
Based upon current and anticipated levels of operation, we believe that our cash on hand and cash flow from operations, combined with borrowings available under the credit facility, will be sufficient to enable us to meet our current and anticipated cash operating requirements, capital expenditures, and working capital needs. Please refer to the discussion of cash flows used in financing activities in the following section for further discussion of our financing activities.
Cash Flows
Net cash flows provided by operating activities were $360.1 million for the fiscal year ended June 30, 2010, an increase of $82.9 million, compared to $277.2 million net cash flows provided during the fiscal year ended June 30, 2009. The increase reflects higher accrued expenses of $28.0 million and higher accounts payable of $23.9 million during the fiscal year ended June 30, 2010, compared to the fiscal year ended June 30, 2009 due to the timing of payables, and a decrease in the purchase of other current assets of $27.2 million during the fiscal year ended June 30, 2010, compared to the fiscal year ended June 30, 2009.
Net cash flows used in investing activities for the fiscal year ended June 30, 2010 were $88.3 million, a decrease of $2.4 million, compared to $90.7 million for the fiscal year ended June 30, 2009. The decrease reflects lower spending of $25.6 million on acquisitions during the fiscal year ended June 30, 2010, compared to the fiscal year ended June 30, 2009, partially offset by increases in capital expenditures of $15.9 million and purchases of intangibles of $7.3 million during the fiscal year ended June 30, 2010, compared to the fiscal year ended June 30, 2009.
Net cash flows used in financing activities for the fiscal year ended June 30, 2010 were $278.1 million which represents an increase of $97.7 million, compared to $180.4 million for the fiscal year ended June 30, 2009. The increase in Net cash flows used in financing activities reflects $233.4 million in higher repurchases of the Company’s common stock intended to offset dilution from the Company’s equity compensation plans and an increase of $28.7 million in dividends paid, slightly offset by lower payments on Long-term debt of $114.4 million and $50.2 million in higher proceeds from exercise of stock options.
Income Taxes
Before the spin-off from our former parent company ADP, the Company’s taxable income was included in separate income tax returns filed with the appropriate taxing jurisdictions, except for U.S. federal and certain state and foreign jurisdictions in which the Company’s taxable income is included in the income tax returns ADP or an ADP affiliate. Subsequent to the spin-off, the Company files its own U.S. federal, state and foreign returns.
The provision for income taxes is computed as if the Company filed on a combined stand-alone or separate tax return basis, as applicable. The provision for income taxes does not reflect the Company’s inclusion in the tax
36
Table of Contents
returns of ADP or an ADP affiliate. Certain income taxes of the Company were paid by ADP or an ADP affiliate on behalf of the Company.
The Company, headquartered in the U.S., is routinely examined by the U.S. Internal Revenue Service (the “IRS”) as part of the IRS U.S. federal income tax audit of ADP and is also routinely examined by the tax authorities in the U.S. states and foreign countries in which it conducts business. The tax years under audit examination vary by tax jurisdiction. With respect to U.S. federal income taxes, the Company was a member of the ADP U.S. federal income tax consolidated group through March 30, 2007. As a member of the ADP U.S. federal income tax consolidation, the Company is included in any IRS examination of ADP for periods up to and including March 30, 2007. ADP and the Company are currently under IRS audit for the fiscal year ended June 30, 1998 through the fiscal year ended June 30, 2002 which was substantially completed in fiscal year 2009. In addition, the IRS is conducting an examination of fiscal years 2003 through 2007. As a member of the ADP U.S. federal income tax consolidated group and pursuant to a tax allocation agreement between the Company and ADP, the U.S. federal income tax payable of the Company for the period ended March 30, 2007, will be assumed by ADP. In addition, any items of income or expense successfully challenged by the IRS attributable to the business operations of the Company for tax periods ended March 30, 2007 or earlier, will be tax liabilities assumed by ADP. Correspondingly, any items of income or expense attributable to the business operations of the Company for tax periods ended March 30, 2007 or earlier, which are settled favorably with the IRS by ADP will remain with ADP. Accordingly, the Company has not established any tax reserves or tax assets with respect to U.S. federal income taxes for the tax period ended March 30, 2007.
The tax allocation agreement between the Company and ADP also extends to the Company’s U.S. state income tax and most foreign income tax liabilities and tax assets. Thus, for any foreign or U.S. state income tax liabilities or tax assets relating to tax periods ended March 30, 2007 or earlier attributable to the Company’s business operations, depending on the tax jurisdiction, ADP will either make payments directly to the appropriate tax authorities or reimburse the Company for tax payments the Company made to the tax authorities that related to tax liabilities subject to the tax allocation agreement to the extent that such tax liabilities are in excess of amounts provided for in respect of such income taxes on the Consolidated Balance Sheet of the Company including the Notes thereto, as of June 30, 2010. Similarly, to the extent that there are any tax refunds attributable to the Company’s business operations in a particular tax jurisdiction for the period ended March 30, 2007 or earlier, ADP will either receive such refund directly from the appropriate tax authorities or receive reimbursement from the Company for the refund received by the Company that is subject to the tax allocation agreement.
The Company regularly considers the likelihood of assessments in each of the jurisdictions resulting from examinations. To the extent the Company determines it has potential tax assessment in particular tax jurisdictions and that such assessments are not covered by the tax allocation agreement, the Company has established tax reserves which it believes are adequate in relation to the potential assessments. Once established, reserves are adjusted when there is more information available, when an event occurs necessitating a change to the reserves or the statute of limitations for the relevant taxing authority to examine the tax position has expired. The resolution of tax matters should not have a material effect on the financial condition of the Company or on the Company’s Consolidated Statements of Earnings for a particular future period.
Defined Benefit Pension Plan
The Company sponsors a Supplemental Officer Retirement Plan (the “Broadridge SORP”). The Broadridge SORP is a defined benefit plan pursuant to which the Company will pay supplemental pension benefits to certain key officers upon retirement based upon the officers’ years of service and compensation. The amount charged to expense for the Broadridge SORP was $1.2 million, $0.6 million, and $0.5 million for the fiscal years ended June 30, 2010, 2009 and 2008, respectively. Broadridge management believes the Broadridge SORP expense is not material to the Company’s Consolidated Financial Statements.
37
Table of Contents
Contractual Obligations
The following table summarizes our contractual obligations to third parties as of June 30, 2010 and the effect such obligations are expected to have on our liquidity and cash flows in future periods:
| Payments Due by Period | |||||||||||||||
| Total | Less than 1 Year |
1-3 Years | 4-5 Years | After 5 Years | |||||||||||
| (in millions) | |||||||||||||||
| Long-term debt(1) |
$ | 324.1 | $ | — | $ | 200.0 | $ | — | $ | 124.1 | |||||
| Operating lease and software licenses(2) |
172.6 | 44.6 | 68.9 | 35.4 | 23.7 | ||||||||||
| Purchase obligations(3) |
810.5 | 116.5 | 219.5 | 122.5 | 352.0 | ||||||||||
| Total |
$ | 1,307.2 | $ | 161.1 | $ | 488.4 | $ | 157.9 | $ | 499.8 | |||||
| (1) | These amounts represent the principal repayments of Long-term debt and are included on our Consolidated Balance Sheets. As of June 30, 2010, we had $324.1 million of outstanding debt consisting of $200.0 million of a term loan facility and $124.1 million in Senior Notes. See Note 11, “Borrowings” to our Financial Statements under Item 8 of Part II of this Annual Report on Form 10-K for additional information about our Borrowings and related matters. Excludes future cash payments related to interest expense as the term loan facility is variable rate and the interest payments will ultimately be determined by the rates in effect during each period. |
| (2) | Included in these amounts are various facilities and equipment leases and software license agreements. We enter into operating leases in the normal course of business relating to facilities and equipment, as well as the licensing of software. The majority of our lease agreements have fixed payment terms based on the passage of time. Certain facility and equipment leases require payment of maintenance and real estate taxes and contain escalation provisions based on future adjustments in price indices. Our future operating lease obligations could change if we exit certain contracts and if we enter into additional operating lease agreements. |
| (3) | Purchase obligations primarily relate to payments to ADP related to a data center outsourcing services agreement that expires in fiscal year 2012, payments to IBM related to the IT Services Agreement entered into in March 2010 that expires October 2021, and purchase and maintenance agreements on our software, equipment and other assets. |
ADP provides the Company with data center services under a data center outsourcing services agreement which expires on June 30, 2012. Among the principal services provided by ADP are information technology services and service delivery network services. For the fiscal years ended June 30, 2010, 2009 and 2008, the Company recorded expenses related to this agreement of $104.8 million, $102.8 million and $107.0 million, respectively, in the Consolidated Statements of Earnings.
Other Commercial Commitments
The Company has a five-year revolving credit facility that expires in March 2012 that has an available capacity of $500.0 million. As of June 30, 2010, no amounts were outstanding under this credit facility.
In addition, immediately before the separation from ADP, certain of the Company’s foreign subsidiaries established unsecured, uncommitted lines of credit with banks. These lines of credit bear interest at a rate equal to LIBOR plus 250 basis points. There were no outstanding borrowings under these lines of credit at June 30, 2010.
38
Table of Contents
Off-Balance Sheet Arrangements
It is not the Company’s business practice to enter into off-balance sheet arrangements. However, the Company is exposed to market risk from changes in foreign currency exchange rates that could impact its financial position, results of operations, and cash flows. The Company manages its exposure to these market risks through its regular operating and financing activities and, when deemed appropriate, through the use of derivative financial instruments. The Company uses derivative financial instruments as risk management tools and not for trading purposes. The Company was not a party to any derivative financial instruments at June 30, 2010, 2009, and 2008. In the normal course of business, the Company also enters into contracts in which it makes representations and warranties that relate to the performance of the Company’s products and services. The Company does not expect any material losses related to such representations and warranties, or collateral arrangements.
NEW ACCOUNTING PRONOUNCEMENTS
Please refer to Note 2, “Summary of Significant Accounting Policies—O. New Accounting Pronouncements” to our Financial Statements under Item 8 of Part II of this Annual Report on Form 10-K for a discussion on the impact of the adoption of new accounting pronouncements.
39
Table of Contents
| ITEM 7A. | Quantitative and Qualitative Disclosures About Market Risk |
As of June 30, 2010, $200.0 million of our total $324.1 million in debt outstanding is based on floating interest rates. Our term loan facility had a balance outstanding of $200.0 million as of June 30, 2010. The interest rate is based on LIBOR plus 40 to 90 basis points based on our debt rating at the time of borrowing. The weighted-average interest rate was 0.85% as of June 30, 2010.
As a registered broker-dealer, our subsidiary Ridge is subject to regulations concerning many aspects of its business, including trade practices, capital structure, record retention, money laundering prevention, and the supervision of the conduct of directors, officers and employees. A failure by Ridge to comply with any of these laws, rules or regulations could result in censure, fine, the issuance of cease-and-desist orders, or the suspension or revocation of SEC authorization granted to allow the operation of its business or disqualification of the directors, officers or employees of such business. In addition, as a registered broker-dealer, Ridge is required to participate in the Securities Investor Protection Corporation (“SIPC”) for the benefit of the customers of our introducing broker-dealer clients in connection with our securities clearing services. On June 25, 2010, we completed the sale of the contracts of substantially all of Ridge’s securities clearing clients and are in the process of winding down the securities clearing business, which we expect to complete in fiscal year 2011. As we wind down that business, Ridge continues to perform securities clearing services on a limited basis. Until such wind down is complete, Ridge will continue to be subject to the regulatory requirements of a broker-dealer performing those functions. These regulations include the SEC’s customer protection rule, which protects both the customer funds and customer securities; the SEC’s hypothecation Rules 8c-1 and 15c2-1 regarding the borrowing and lending of our correspondents’ customers’ securities; Regulation T, which regulates the borrowing and lending of securities by broker-dealers; and Regulation SHO, which prohibits short sales in certain instances.
40
Table of Contents
| ITEM 8. | Financial Statements and Supplementary Data |
INDEX TO FINANCIAL STATEMENTS AND FINANCIAL STATEMENT SCHEDULE
| Consolidated Financial Statements |
||
| 42 | ||
| Consolidated Statements of Earnings for the Fiscal Years Ended June 30, 2010, 2009, and 2008 |
44 | |
| 45 | ||
| Consolidated Statements of Cash Flows for the Fiscal Years Ended June 30, 2010, 2009, and 2008 |
46 | |
| 47 | ||
| 48 | ||
| Financial Statement Schedule |
||
| 70 | ||
41
Table of Contents
REPORT OF INDEPENDENT REGISTERED PUBLIC ACCOUNTING FIRM
To the Board of Directors and Stockholders of
Broadridge Financial Solutions, Inc.
1981 Marcus Avenue
Lake Success, NY 11042
We have audited the accompanying consolidated balance sheets of Broadridge Financial Solutions, Inc. and subsidiaries (the “Company”) as of June 30, 2010 and 2009, and the related consolidated statements of earnings, stockholders’ equity, and cash flows for each of the three years in the period ended June 30, 2010. Our audits also included the financial statement schedule listed in the Index at Item 15. We also have audited the Company’s internal control over financial reporting as of June 30, 2010, based on criteria established in Internal Control—Integrated Framework issued by the Committee of Sponsoring Organizations of the Treadway Commission. The Company’s management is responsible for these financial statements and financial statement schedule, for maintaining effective internal control over financial reporting, and for its assessment of the effectiveness of internal control over financial reporting, included in the accompanying Management’s Report on Internal Control over Financial Reporting. Our responsibility is to express an opinion on these financial statements and financial statement schedule and an opinion on the Company’s internal control over financial reporting based on our audits.
We conducted our audits in accordance with the standards of the Public Company Accounting Oversight Board (United States). Those standards require that we plan and perform the audit to obtain reasonable assurance about whether the financial statements are free of material misstatement and whether effective internal control over financial reporting was maintained in all material respects. Our audits of the financial statements included examining, on a test basis, evidence supporting the amounts and disclosures in the financial statements, assessing the accounting principles used and significant estimates made by management, and evaluating the overall financial statement presentation. Our audit of internal control over financial reporting included obtaining an understanding of internal control over financial reporting, assessing the risk that a material weakness exists, testing and evaluating the design and operating effectiveness of internal control based on the assessed risk. Our audits also included performing such other procedures as we considered necessary in the circumstances. We believe that our audits provide a reasonable basis for our opinions.
A company’s internal control over financial reporting is a process designed by, or under the supervision of, the company’s principal executive and principal financial officers, or persons performing similar functions, and effected by the company’s board of directors, management, and other personnel to provide reasonable assurance regarding the reliability of financial reporting and the preparation of financial statements for external purposes in accordance with generally accepted accounting principles. A company’s internal control over financial reporting includes those policies and procedures that (1) pertain to the maintenance of records that, in reasonable detail, accurately and fairly reflect the transactions and dispositions of the assets of the company; (2) provide reasonable assurance that transactions are recorded as necessary to permit preparation of financial statements in accordance with generally accepted accounting principles and that receipts and expenditures of the company are being made only in accordance with authorizations of management and directors of the company; and (3) provide reasonable assurance regarding prevention or timely detection of unauthorized acquisition, use, or disposition of the company’s assets that could have a material effect on the financial statements.
Because of the inherent limitations of internal control over financial reporting, including the possibility of collusion or improper management override of controls, material misstatements due to error or fraud may not be prevented or detected on a timely basis. Also, projections of any evaluation of the effectiveness of the internal control over financial reporting to future periods are subject to the risk that the controls may become inadequate because of changes in conditions, or that the degree of compliance with the policies or procedures may deteriorate.
42
Table of Contents
In our opinion, the consolidated financial statements referred to above present fairly, in all material respects, the financial position of Broadridge Financial Solutions, Inc. and subsidiaries as of June 30, 2010 and 2009, and the results of their operations and their cash flows for each of the three years in the period ended June 30, 2010, in conformity with accounting principles generally accepted in the United States of America. Also, in our opinion, such financial statement schedule, when considered in relation to the basic consolidated financial statements taken as a whole, present fairly, in all material respects, the information set forth therein. Also, in our opinion, the Company maintained, in all material respects, effective internal control over financial reporting as of June 30, 2010, based on the criteria established in Internal Control—Integrated Framework issued by the Committee of Sponsoring Organizations of the Treadway Commission.
/s/ DELOITTE & TOUCHE LLP
New York, New York
August 12, 2010
43
Table of Contents
Broadridge Financial Solutions, Inc.
Consolidated Statements of Earnings
(In millions, except per share amounts)
| Years ended June 30, | ||||||||||
| 2010 | 2009 | 2008 | ||||||||
| Revenues |
$ | 2,209.2 | $ | 2,073.0 | $ | 2,130.8 | ||||
| Cost of revenues |
1,616.4 | 1,510.1 | 1,547.8 | |||||||
| Selling, general and administrative expenses |
241.6 | 212.9 | 232.4 | |||||||
| Other expenses, net |
9.1 | 4.0 | 30.9 | |||||||
| Total expenses |
1,867.1 | 1,727.0 | 1,811.1 | |||||||
| Earnings from continuing operations before income taxes |
342.1 | 346.0 | 319.7 | |||||||
| Provision for income taxes |
117.0 | 122.9 | 131.3 | |||||||
| Net earnings from continuing operations |
225.1 | 223.1 | 188.4 | |||||||
| Earnings (loss) from discontinued operations, net of tax benefit (expense) |
(35.1 | ) | 0.2 | 3.8 | ||||||
| Net earnings |
$ | 190.0 | $ | 223.3 | $ | 192.2 | ||||
| Basic earnings per share: |
||||||||||
| Basic earnings per share from continuing operations |
$ | 1.66 | $ | 1.60 | $ | 1.35 | ||||
| Basic earnings (loss) per share from discontinued operations |
(0.26 | ) | — | 0.03 | ||||||
| Basic earnings per share |
$ | 1.40 | $ | 1.60 | $ | 1.38 | ||||
| Diluted earnings per share: |
||||||||||
| Diluted earnings per share from continuing operations |
$ | 1.62 | $ | 1.58 | $ | 1.34 | ||||
| Diluted earnings (loss) per share from discontinued operations |
(0.25 | ) | — | 0.02 | ||||||
| Diluted earnings per share |
$ | 1.37 | $ | 1.58 | $ | 1.36 | ||||
| Weighted-average shares outstanding: |
||||||||||
| Basic |
135.9 | 140.0 | 139.6 | |||||||
| Diluted |
139.1 | 141.6 | 141.0 | |||||||
| Dividends declared per common share |
$ | 0.56 | $ | 0.28 | $ | 0.24 | ||||
See notes to consolidated financial statements.
44
Table of Contents
Broadridge Financial Solutions, Inc.
Consolidated Balance Sheets
(In millions, except per share amounts)
| June 30, 2010 |
June 30, 2009 |
|||||||
| Assets |
||||||||
| Current assets: |
||||||||
| Cash and cash equivalents |
$ | 412.6 | $ | 173.4 | ||||
| Accounts receivable, net of allowance for doubtful accounts of $2.0 and $2.3, respectively |
354.3 | 381.0 | ||||||
| Other current assets |
101.7 | 83.2 | ||||||
| Assets of discontinued operations |
123.8 | 1,414.2 | ||||||
| Total current assets |
992.4 | 2,051.8 | ||||||
| Property, plant and equipment, net |
87.4 | 75.4 | ||||||
| Other non-current assets |
159.0 | 136.3 | ||||||
| Goodwill |
509.5 | 481.8 | ||||||
| Intangible assets, net |
46.1 | 29.4 | ||||||
| Total assets |
$ | 1,794.4 | $ | 2,774.7 | ||||
| Liabilities and Stockholders’ Equity |
||||||||
| Current liabilities: |
||||||||
| Accounts payable |
$ | 91.3 | $ | 72.0 | ||||
| Accrued expenses and other current liabilities |
261.2 | 216.7 | ||||||
| Deferred revenues |
34.8 | 34.6 | ||||||
| Liabilities of discontinued operations |
99.1 | 1,106.6 | ||||||
| Total current liabilities |
486.4 | 1,429.9 | ||||||
| Long-term debt |
324.1 | 324.1 | ||||||
| Deferred taxes |
56.2 | 23.2 | ||||||
| Other non-current liabilities |
72.8 | 37.6 | ||||||
| Deferred revenues |
47.8 | 50.9 | ||||||
| Total liabilities |
987.3 | 1,865.7 | ||||||
| Commitments and contingencies (Note 15) |
||||||||
| Stockholders’ equity: |
||||||||
| Preferred stock: Authorized, 25.0 shares; issued and outstanding, none |
— | — | ||||||
| Common stock, $.01 par value: Authorized, 650.0 shares; issued, 145.9 and 141.8 shares at June 30, 2010 and 2009, respectively; outstanding, 129.2 and 139.3 shares at June 30, 2010 and 2009, respectively |
1.5 | 1.4 | ||||||
| Additional paid-in capital |
587.8 | 505.9 | ||||||
| Retained earnings |
546.9 | 432.3 | ||||||
| Treasury stock—at cost, 16.7 and 2.5 shares, respectively |
(327.7 | ) | (37.5 | ) | ||||
| Accumulated other comprehensive income (loss) |
(1.4 | ) | 6.9 | |||||
| Total stockholders’ equity |
807.1 | 909.0 | ||||||
| Total liabilities and stockholders’ equity |
$ | 1,794.4 | $ | 2,774.7 | ||||
See notes to consolidated financial statements.
45
Table of Contents
Broadridge Financial Solutions, Inc.
Consolidated Statements of Cash Flows
(In millions)
| Years ended June 30, | ||||||||||||
| 2010 | 2009 | 2008 | ||||||||||
| Cash Flows From Operating Activities |
||||||||||||
| Net earnings |
$ | 190.0 | $ | 223.3 | $ | 192.2 | ||||||
| Adjustments to reconcile Net earnings to net cash flows provided by operating activities: |
||||||||||||
| (Earnings) loss from discontinued operations, net of tax |
35.1 | (0.2 | ) | (3.8 | ) | |||||||
| Depreciation and amortization |
41.3 | 38.4 | 37.9 | |||||||||
| Amortization of other assets |
15.7 | 15.3 | 10.5 | |||||||||
| Deferred income taxes |
3.4 | 5.3 | (17.2 | ) | ||||||||
| Stock-based compensation expense |
27.3 | 28.6 | 33.7 | |||||||||
| Excess tax benefits from the issuance of stock-based compensation awards |
(0.2 | ) | (0.4 | ) | (1.7 | ) | ||||||
| Gain on purchase of senior notes |
— | (8.4 | ) | — | ||||||||
| Other |
1.1 | (0.8 | ) | 7.4 | ||||||||
| Changes in operating assets and liabilities: |
||||||||||||
| Current assets and liabilities: |
||||||||||||
| Decrease in Accounts receivable, net |
27.8 | 31.7 | 56.3 | |||||||||
| (Increase) decrease in Other current assets |
4.2 | (23.0 | ) | 2.4 | ||||||||
| (Decrease) increase in Accounts payable |
9.9 | (14.0 | ) | (1.0 | ) | |||||||
| (Decrease) increase in Accrued expenses and other current liabilities |
7.8 | (20.2 | ) | 2.3 | ||||||||
| Increase (decrease) in Deferred revenues |
0.1 | 9.1 | 0.6 | |||||||||
| Non-current assets and liabilities: |
||||||||||||
| Increase in Other non-current assets |
(10.9 | ) | (14.7 | ) | (43.7 | ) | ||||||
| Increase in Other non-current liabilities |
7.5 | 7.2 | 32.0 | |||||||||
| Net cash flows provided by operating activities of continuing operations |
360.1 | 277.2 | 307.9 | |||||||||
| Cash Flows From Investing Activities |
||||||||||||
| Capital expenditures |
(42.7 | ) | (26.8 | ) | (41.4 | ) | ||||||
| Purchases of intangibles |
(10.4 | ) | (3.1 | ) | (5.1 | ) | ||||||
| Acquisitions, net of cash acquired |
(35.2 | ) | (60.8 | ) | (6.1 | ) | ||||||
| Net cash flows used in investing activities of continuing operations |
(88.3 | ) | (90.7 | ) | (52.6 | ) | ||||||
| Cash Flows From Financing Activities |
||||||||||||
| Payments on Long-term debt |
— | (114.4 | ) | (170.0 | ) | |||||||
| Dividends paid |
(66.6 | ) | (37.9 | ) | (33.6 | ) | ||||||
| Proceeds from exercise of stock options |
57.2 | 7.0 | 20.0 | |||||||||
| Purchases of Common stock |
(268.9 | ) | (35.5 | ) | (1.9 | ) | ||||||
| Excess tax benefit from the issuance of stock-based compensation awards |
0.2 | 0.4 | 1.7 | |||||||||
| Net cash flows used in financing activities of continuing operations |
(278.1 | ) | (180.4 | ) | (183.8 | ) | ||||||
| Cash flows from discontinued operations: |
||||||||||||
| Net cash flows provided by operating activities |
133.5 | 81.6 | 174.1 | |||||||||
| Net cash flows provided by (used in) financing activities |
4.4 | (8.2 | ) | (136.6 | ) | |||||||
| Net cash flows provided by discontinued operations |
137.9 | 73.4 | 37.5 | |||||||||
| Effect of exchange rate changes on Cash and cash equivalents |
0.1 | 3.1 | 0.7 | |||||||||
| Net change in cash and cash equivalents |
131.7 | 82.6 | 109.7 | |||||||||
| Cash and cash equivalents, beginning of fiscal year |
173.4 | 54.7 | 72.2 | |||||||||
| Cash and cash equivalents of discontinued operations, beginning of fiscal year |
107.5 | 143.6 | 16.4 | |||||||||
| Cash and cash equivalents, end of fiscal year |
412.6 | 280.9 | 198.3 | |||||||||
| Cash and cash equivalents of discontinued operations, end of fiscal year |
— | 107.5 | 143.6 | |||||||||
| Cash and cash equivalents of continuing operations, end of fiscal year |
$ | 412.6 | $ | 173.4 | $ | 54.7 | ||||||
| Supplemental disclosure of cash flow information: |
||||||||||||
| Cash payments made for interest |
$ | 11.1 | $ | 14.5 | $ | 30.6 | ||||||
| Cash payments made for income taxes |
$ | 107.9 | $ | 129.2 | $ | 159.1 | ||||||
| Non-cash operating activities: |
||||||||||||
| Non-cash obligation assumed from sale of discontinued operations |
$ | 21.6 | $ | — | $ | — | ||||||
| Non-cash investing activities: |
||||||||||||
| Property, plant and equipment included in accrued expenses |
$ | 4.3 | $ | 2.8 | $ | 3.1 | ||||||
| Consideration received as part of the sale of discontinued operations |
$ | 33.1 | $ | — | $ | — | ||||||
| Non-cash financing activities: |
||||||||||||
| Purchases of common stock excluded from accrued expenses |
$ | 21.3 | $ | — | $ | — | ||||||
| Dividends payable |
$ | 8.8 | $ | — | $ | — | ||||||
See notes to consolidated financial statements.
46
Table of Contents
Broadridge Financial Solutions, Inc.
Consolidated Statements of Stockholders’ Equity
(In millions, except per share amounts)
| Common Stock | Additional Paid-In Capital |
Retained Earnings |
Treasury Stock |
Accumulated Other Comprehensive Income (Loss) |
Total Stockholders’ Equity |
|||||||||||||||||||
| Shares | Amount | |||||||||||||||||||||||
| Balances, July 1, 2007 |
139.3 | $ | 1.4 | $ | 412.9 | $ | 90.3 | $ | (0.1 | ) | $ | 26.6 | $ | 531.1 | ||||||||||
| Comprehensive income: |
||||||||||||||||||||||||
| Net earnings |
— | — | — | 192.2 | — | — | ||||||||||||||||||
| Foreign currency translation adjustments |
— | — | — | — | — | 2.8 | ||||||||||||||||||
| Total comprehensive income |
195.0 | |||||||||||||||||||||||
| Adoption of FIN 48 |
— | — | — | (0.7 | ) | — | — | (0.7 | ) | |||||||||||||||
| Pension and postretirement liability adjustment, net of taxes of $0.5 |
— | — | 0.7 | — | — | (0.7 | ) | — | ||||||||||||||||
| Stock plans and related tax benefits |
1.2 | — | 22.1 | — | — | — | 22.1 | |||||||||||||||||
| Stock-based compensation |
— | — | 33.8 | — | — | — | 33.8 | |||||||||||||||||
| Treasury stock acquired (0.1 shares) |
— | — | — | — | (1.9 | ) | — | (1.9 | ) | |||||||||||||||
| Common stock dividends ($0.24 per share) |
— | — | — | (33.6 | ) | — | — | (33.6 | ) | |||||||||||||||
| Balances, June 30, 2008 |
140.5 | 1.4 | 469.5 | 248.2 | (2.0 | ) | 28.7 | 745.8 | ||||||||||||||||
| Comprehensive income: |
||||||||||||||||||||||||
| Net earnings |
— | — | — | 223.3 | — | — | ||||||||||||||||||
| Foreign currency translation adjustments |
— | — | — | — | — | (20.8 | ) | |||||||||||||||||
| Pension and postretirement liability adjustment, net of taxes of $0.7 |
— | — | — | — | — | (1.0 | ) | |||||||||||||||||
| Total comprehensive income |
201.5 | |||||||||||||||||||||||
| Stock plans and related tax benefits |
1.3 | — | 6.9 | — | — | — | 6.9 | |||||||||||||||||
| Stock-based compensation |
— | — | 29.5 | — | — | — | 29.5 | |||||||||||||||||
| Treasury stock acquired (2.4 shares) |
— | — | — | — | (35.5 | ) | — | (35.5 | ) | |||||||||||||||
| Common stock dividends ($0.28 per share) |
— | — | — | (39.2 | ) | — | — | (39.2 | ) | |||||||||||||||
| Balances, June 30, 2009 |
141.8 | 1.4 | 505.9 | 432.3 | (37.5 | ) | 6.9 | 909.0 | ||||||||||||||||
| Comprehensive income: |
||||||||||||||||||||||||
| Net earnings |
— | — | — | 190.0 | — | — | ||||||||||||||||||
| Foreign currency translation adjustments |
— | — | — | — | — | (7.5 | ) | |||||||||||||||||
| Pension and postretirement liability adjustment, net of taxes of $0.5 |
— | — | — | — | — | (0.8 | ) | |||||||||||||||||
| Total comprehensive income |
181.7 | |||||||||||||||||||||||
| Stock plans and related tax benefits |
4.1 | 0.1 | 53.8 | — | — | — | 53.9 | |||||||||||||||||
| Stock-based compensation |
— | — | 28.1 | — | — | — | 28.1 | |||||||||||||||||
| Treasury stock acquired (14.2 shares) |
— | — | — | — | (290.2 | ) | — | (290.2 | ) | |||||||||||||||
| Common stock dividends ($0.56 per share) |
— | — | — | (75.4 | ) | — | — | (75.4 | ) | |||||||||||||||
| Balances, June 30, 2010 |
145.9 | $ | 1.5 | $ | 587.8 | $ | 546.9 | $ | (327.7 | ) | $ | (1.4 | ) | $ | 807.1 | |||||||||
See notes to consolidated financial statements.
47
Table of Contents
Broadridge Financial Solutions, Inc.
Notes to Consolidated Financial Statements
NOTE 1. BASIS OF PRESENTATION
A. Description of Business. Broadridge Financial Solutions, Inc. (“Broadridge” or the “Company”), a Delaware corporation, is a leading global provider of investor communication solutions, and securities processing and operations outsourcing solutions to the financial services industry. The Company previously classified its operations into three reportable segments, Investor Communication Solutions, Securities Processing Solutions and Clearing and Outsourcing Solutions. On November 2, 2009, Broadridge announced that it had entered into a definitive agreement to sell substantially all contracts of the securities clearing clients of the Clearing and Outsourcing Solutions business, and on June 25, 2010, the Company completed the sale of the contracts of substantially all of the securities clearing clients. Securities clearing services refers to the process of matching, recording and processing securities transaction instructions and exchanging payments between counterparties and providing financing for client inventory through margin lending. Operations outsourcing services allow broker-dealers to outsource certain administrative functions relating to the securities clearing and settlement process to Broadridge. Beginning in the second quarter of fiscal year 2010, the securities clearing activities are presented as a discontinued operation and the operations outsourcing solutions business retained by Broadridge is included within the Securities Processing Solutions business segment. Broadridge only delivers operations outsourcing solutions on our Securities Processing Solutions technology platforms. See Note 7, “Discontinued Operations” for detailed information on discontinued operations, Note 9, “Goodwill and Intangible Assets, Net” for a discussion on the reclassification of goodwill and Note 17, “Financial Data by Segment” for restated segment information. The Company now classifies its continuing operations into the following two reportable segments:
| • | Investor Communication Solutions—A large portion of Broadridge’s Investor Communication Solutions business involves the processing and distribution of proxy materials to investors in equity securities and mutual funds, as well as the facilitation of related vote processing. ProxyEdge, its innovative electronic proxy delivery and voting solution for institutional investors, helps ensure the participation of the largest stockholders of many companies. Broadridge also provides the distribution of regulatory reports and corporate action/reorganization event information, as well as tax reporting solutions that help its clients meet their regulatory compliance needs. In addition, Broadridge provides financial information distribution and transaction reporting services to both financial institutions and securities issuers. These services include the processing and distribution of account statements and trade confirmations, traditional and personalized document fulfillment and content management services, marketing communications, and imaging, archival and workflow solutions that enable and enhance its clients’ communications with investors. All of these communications are delivered in paper or electronic form. |
| • | Securities Processing Solutions—Broadridge offers a suite of advanced computerized real-time transaction processing services that automate the securities transaction lifecycle, from desktop productivity tools, data aggregation, performance reporting, and portfolio management to order capture and execution, trade confirmation, settlement, and accounting. Broadridge’s services help financial institutions efficiently and cost-effectively consolidate their books and records, gather and service assets under management, focus on their core businesses, and manage risk. With multi-currency capabilities, its Global Processing Solution supports real-time global trading of equity, option, mutual fund and fixed income securities in established and emerging markets. In addition, its operations outsourcing solutions allows broker-dealers to outsource certain administrative functions relating to clearing and settlement, from order entry to trade matching and settlement, while maintaining their ability to finance and capitalize their business. |
B. Basis of Presentation. The Consolidated Financial Statements have been prepared in accordance with accounting principles generally accepted in the United States of America (“U.S.”). These financial statements present the consolidated position of the Company. These financial statements include the entities in which the
48
Table of Contents
Company directly or indirectly has a controlling financial interest and various entities in which the Company has investments recorded under both the cost and equity methods of accounting. Intercompany balances and transactions have been eliminated.
NOTE 2. SUMMARY OF SIGNIFICANT ACCOUNTING POLICIES
A. Use of Estimates. The preparation of these financial statements in conformity with accounting principles generally accepted in the U.S. requires management to make estimates and assumptions that affect the amounts reported in the Consolidated Financial Statements and accompanying notes. Actual results could differ from these estimates.
B. Revenue Recognition. The Company’s revenues are primarily generated from fees for providing services. Revenues are recognized for the two reportable segments as follows:
| • | Investor Communication Solutions—Revenues are generated from processing and distributing investor communications as well as vote processing and tabulation. The Company typically enters into agreements with clients to provide services on a fee for service basis. Fees received from the rendering of services are recognized as revenue in the period in which the services have been provided and when collectability is reasonably assured. |
| • | Securities Processing Solutions—Revenues are generated from fees for transaction processing. Client service agreements often include up-front consideration as well as a recurring fee for transaction processing. In accordance with Accounting Standards Codification Topic (“ASC”) No. 605 “Revenue Recognition” (formerly Securities and Exchange Commission’s (“SEC”) Staff Accounting Bulletin (“SAB”) No. 104, “Revenue Recognition” and Financial Accounting Standards Board (“FASB”) Emerging Issues Task Force (“EITF”) 00-21, “Revenue Arrangements with Multiple Deliverables”) up-front implementation fees are deferred and recognized on a straight-line basis over the longer of the respective service term of the contract or the expected customer relationship period which commences after client acceptance when the processing term begins. Fees received from processing services are recognized as revenue in the period in which the services have been rendered and when collectability is reasonably assured. Additionally, revenues generated from outsourcing services are recognized based on fixed monthly fees in the period in which the services are rendered in accordance with the respective contractual agreement. |
C. Cash and Cash Equivalents. Investment securities with a maturity of 90 days or less at the time of purchase are considered cash equivalents. Cash and cash equivalents also include cash of $7.6 million as of June 30, 2010 held on behalf of transfer agent clients. A corresponding liability is also included as a current liability in Accrued expenses and other current liabilities on the accompanying Consolidated Balance Sheets.
D. Financial Instruments. Substantially all of the financial instruments of the Company other than Long-term debt are carried at fair values, or at carrying amounts that approximate fair values because of the short maturity of the instruments. The carrying value of the Company’s long-term variable-rate term loan facility approximates fair value because these instruments reflect market changes to interest rates. The carrying value of the Company’s long-term fixed-rate senior notes represents the face value of the long-term fixed-rate senior notes net of the unamortized discount. The fair value of the Company’s long-term fixed-rate senior notes is based on quoted market prices. See Note 11, “Borrowings,” for a further discussion of the Company’s long-term fixed-rate senior notes.
E. Property, Plant and Equipment. Property, plant and equipment is stated at cost and depreciated over the estimated useful lives of the assets using the straight-line method. Leasehold improvements are amortized over the shorter of the term of the lease or the estimated useful lives of the improvements. The estimated useful lives of assets are as follows:
| Equipment |
3 to 5 years | |
| Buildings |
10 years | |
| Furniture and fixtures |
3 to 7 years |
49
Table of Contents
F. Inventories. Inventories are stated at the lower of cost (determined on a first-in, first-out basis) or market. Inventory balances are reflected in Other current assets in the Consolidated Balance Sheets.
G. Deferred Client Conversion Costs. Direct costs that are incurred to set up or convert a client’s systems to function with the Company’s technology are generally deferred and recognized on a straight-line basis which commences after client acceptance when the processing term begins. To the extent deferred costs exceed related implementation fee revenues, such excess costs are amortized over the service term of the contract. Deferred costs up to the amount of the related implementation fees are recognized over the longer of the respective service term of the contract or expected customer relationship period. These capitalized costs are reflected in Other non-current assets in the Consolidated Balance Sheets.
H. Other Non-Current Assets. Other non-current assets in the Consolidated Balance Sheets for fiscal year 2010 includes $20.6 million principal amount of the five-year subordinated note receivable with Penson Worldwide, Inc. (“PWI”) and a $12.5 million investment in PWI’s common stock. See Note 7, “Discontinued Operations,” for a more detailed discussion of these transactions between the Company and PWI.
I. Goodwill. The Company accounts for its goodwill and intangible assets in accordance with ASC No. 350, “Intangibles—Goodwill and Other” (“ASC No. 350”) (formerly Statement of Financial Accounting Standards (“SFAS”) No. 142, “Goodwill and Other Intangible Assets”), which states that goodwill and intangible assets with indefinite useful lives should not be amortized, but instead tested for impairment at the reporting unit level at least annually or more frequently if circumstances indicate possible impairment. The Company tests for goodwill impairment annually in the fourth quarter of the fiscal year. If impairment exists, a write-down to fair value (measured by discounting estimated future cash flows) is recorded.
J. Impairment of Long-Lived Assets. In accordance with ASC No. 360-10, “Property, Plant and Equipment—Impairment or Disposal of Long-Lived Assets,” (“ASC No. 360-10”) (formerly SFAS No. 144, “Accounting for the Impairment and Disposal of Long-Lived Assets”, long-lived assets are reviewed for impairment whenever events or changes in circumstances indicate that the carrying amount of an asset may not be recoverable. Recoverability of assets to be held and used is measured by a comparison of the carrying amount of an asset to the estimated undiscounted future cash flows expected to be generated by the asset. If the carrying amount of an asset exceeds its expected estimated future cash flows, an impairment charge is recognized for the amount by which the carrying amount of the asset exceeds the fair value of the asset. Intangible assets with finite lives are amortized primarily on a straight-line basis over their estimated useful lives and are reviewed for impairment in accordance with ASC No. 360-10.
K. Foreign Currency Translation and Transactions. The net assets of the Company’s foreign subsidiaries are translated into U.S. dollars based on exchange rates in effect at the end of each period. Revenues and expenses are translated at average exchange rates during the periods. Currency transaction gains or losses are included in Other expenses, net. Gains or losses from balance sheet translation are included in Stockholders’ equity within Accumulated other comprehensive income (loss) on the Consolidated Balance Sheets.
L. Stock-Based Compensation. The Company accounts for stock-based compensation in accordance primarily with ASC No. 718 “Compensation—Stock Compensation” (formerly SFAS No. 123R, “Share-Based Payment”) by recognizing the measurement of stock-based compensation expense in Net earnings based on the fair value of the award on the date of grant. For stock options issued, the fair value of each stock option was estimated on the date of grant using a binomial option pricing model. The binomial model considers a range of assumptions related to volatility, risk-free interest rate, and employee exercise behavior. Expected volatilities utilized in the binomial model are based on a combination of implied market volatilities, historical volatility of the Company’s stock price, and other factors. Similarly, the dividend yield is based on historical experience and expected future changes. The risk-free rate is derived from the U.S. Treasury yield curve in effect at the time of grant. The binomial model also incorporates exercise and forfeiture assumptions based on an analysis of historical data. The expected life of the stock option grants is derived from the output of the binomial model and represents the period of time that options granted are expected to be outstanding.
50
Table of Contents
M. Internal Use Software. Expenditures for major software purchases and software developed or obtained for internal use are capitalized and amortized over a three- to five-year period on a straight-line basis. For software developed or obtained for internal use, the Company capitalizes these costs in accordance with the provisions of ASC No. 350-40, “Internal Use Software” (formerly Statement of Position (“SOP”) 98-1, “Accounting for the Costs of Computer Software Developed or Obtained for Internal Use.” The Company’s policy provides for the capitalization of external direct costs of materials and services associated with developing or obtaining internal use computer software. In addition, the Company also capitalizes payroll and payroll-related costs for employees who are directly associated with internal use computer software projects. The amount of capitalizable payroll costs with respect to these employees is limited to direct time spent on such projects. Costs associated with preliminary project stage activities, training, maintenance, and all other post-implementation stage activities are expensed as incurred. The Company also expenses internal costs related to minor upgrades and enhancements, as it is impractical to separate these costs from normal maintenance activities.
N. Income Taxes. The Company accounts for income taxes under the liability method, which requires that deferred tax assets and liabilities be determined based on the expected future income tax consequences of events that have been recognized in the Consolidated Financial Statements.
Deferred tax assets and liabilities are recognized based on temporary differences between the financial statement carrying amounts and tax bases of assets and liabilities using enacted tax rates in effect in the years in which the temporary differences are expected to reverse.
O. New Accounting Pronouncements. In October 2009, the FASB issued Accounting Standards Update (“ASU”) No. 2009-13, “Multiple-Deliverable Revenue Arrangements a consensus of the FASB Emerging Issues Task Force,” an amendment of ASC No. 605-25, “Revenue Recognition” (formerly EITF Issue No. 08-01, “Revenue Arrangements with Multiple Deliverables”). This standard provides principles for allocation of consideration among its multiple-elements, allowing more flexibility in identifying and accounting for separate deliverables under an arrangement. The ASU introduces an estimated selling price method for valuing the elements of a bundled arrangement if vendor-specific objective evidence or third-party evidence of selling price is not available, and significantly expands related disclosure requirements. It is effective on a prospective basis for revenue arrangements entered into or materially modified in fiscal years beginning on or after June 15, 2010. Alternatively, adoption may be on a retrospective basis, and early application is permitted. ASU No. 2009-13 will become effective in the first fiscal quarter of fiscal year 2011 and is not expected to have a material impact on the Company’s results of operations, cash flows or financial condition.
In July 2009, the FASB issued ASC No. 105, “Generally Accepted Accounting Principles” (formerly Statement of Financial Standards (SFAS) No. 168, “The Hierarchy of Generally Accepted Accounting Principles”). This standard contains guidance which reduces the U.S. GAAP hierarchy to two levels, one that is authoritative and one that is not. This standard was effective September 15, 2009 and did not have an impact on the Company’s results of operations, cash flows or financial condition.
In February 2010, an update was made to the “Subsequent Events Topic,” ASC No. 855. Among other things, this update defines “revised financial statements” as financial statements revised as a result of correction of an error or retrospective application of GAAP and requires an entity to update its evaluation of subsequent events through the date the revised financial statements are issued or are available to be issued. This update was effective upon issuance and therefore was effective for the Company for the quarter ended March 31, 2010. The adoption of these updates did not have a material impact on the Company’s results of operations, cash flows or financial condition.
ASC No. 820-10, “Fair Value Measurements and Disclosures” (formerly SFAS No. 157, “Fair Value Measurements”), with respect to non-financial assets and liabilities was adopted effective July 1, 2009. This standard defines fair value, establishes a framework for measuring fair value and expands disclosures about fair value measurements. This standard did not have a financial impact to the consolidated financial statements. Refer to Note 6, “Fair Value of Financial Instruments,” for additional information regarding our fair value measurements for financial assets and liabilities.
51
Table of Contents
In December 2007, the FASB issued new accounting guidance on business combinations and non-controlling interests in consolidated financial statements. The new guidance revises the method of accounting for a number of aspects of business combinations and non-controlling interests, including acquisition costs, contingencies (including contingent assets, contingent liabilities and contingent purchase price), the impacts of partial and step-acquisitions (including the valuation of net assets attributable to non-acquired minority interests), and post acquisition exit activities of acquired businesses. The new guidance became effective for the Company beginning July 1, 2009, and the application of this guidance did not have a material impact on the Company’s results of operations, cash flows or financial position.
In April 2009, ASC No. 805, “Business Combinations” (formerly FASB Staff Position (“FSP”) No. FAS 141(R)-1, “Accounting for Assets Acquired and Liabilities Assumed in a Business Combination That Arise from Contingencies” (“FSP FAS 141(R)-1”) was issued. ASC No. 805 addresses application issues raised on initial recognition and measurement, subsequent measurement and accounting, and disclosure of assets and liabilities arising from contingencies in a business combination. ASC No. 805 became effective on or after the beginning of the first annual reporting on or after December 15, 2008. The Company applied ASC No. 805 to acquisitions that closed after July 1, 2009, and the application of this guidance did not have a material impact on the Company’s results of operations, cash flows or financial position.
P. Advertising Costs. Advertising costs are expensed at the time the advertising takes place. Selling, general and administrative expenses include advertising costs of $1.9 million, $2.7 million and $2.8 million for the fiscal years ended June 30, 2010, 2009 and 2008, respectively.
Q. Subsequent Events. In preparing the accompanying Consolidated Financial Statements, in accordance with ASC No. 855, “Subsequent Events,” the Company has reviewed events that have occurred after June 30, 2010, through the date of issuance of the financial statements. During this period, the Company did not have any material subsequent events.
NOTE 3. EARNINGS PER SHARE
Basic earnings per share (“EPS”) is calculated by dividing the Company’s Net earnings by the basic Weighted-average shares outstanding for the periods presented.
Diluted EPS reflects the potential dilution that could occur if outstanding stock options at the presented date are exercisable and shares of restricted stock have vested.
As of June 30, 2010, 2009 and 2008, the computation of diluted EPS did not include 4.4 million, 6.9 million and 5.4 million options to purchase Broadridge common stock, respectively, as the effect of their inclusion would have been anti-dilutive.
The following table sets forth the denominators of the basic and diluted EPS computations:
| Years ended June 30, | ||||||
| 2010 | 2009 | 2008 | ||||
| (in millions) | ||||||
| Weighted-average shares outstanding: |
||||||
| Basic |
135.9 | 140.0 | 139.6 | |||
| Common stock equivalents |
3.2 | 1.6 | 1.4 | |||
| Diluted |
139.1 | 141.6 | 141.0 | |||
52
Table of Contents
The following table sets forth the computation of basic EPS utilizing Net earnings from continuing operations and Net Earnings for the fiscal year and the Company’s basic Weighted-average shares outstanding:
| Years ended June 30, | |||||||||
| 2010 | 2009 | 2008 | |||||||
| (in millions, except per share amounts) | |||||||||
| Net earnings from continuing operations |
$ | 225.1 | $ | 223.1 | $ | 188.4 | |||
| Net earnings |
190.0 | 223.3 | 192.2 | ||||||
| Basic Weighted-average shares outstanding |
135.9 | 140.0 | 139.6 | ||||||
| Basic EPS from continuing operations |
1.66 | 1.60 | 1.35 | ||||||
| Basic EPS |
$ | 1.40 | $ | 1.60 | $ | 1.38 | |||
The following table sets forth the computation of diluted EPS utilizing Net earnings from continuing operations and Net earnings for the fiscal year and the Company’s diluted Weighted-average shares outstanding:
| Years ended June 30, | |||||||||
| 2010 | 2009 | 2008 | |||||||
| (in millions, except per share amounts) | |||||||||
| Net earnings from continuing operations |
$ | 225.1 | $ | 223.1 | $ | 188.4 | |||
| Net earnings |
190.0 | 223.3 | 192.2 | ||||||
| Diluted Weighted-average shares outstanding |
139.1 | 141.6 | 141.0 | ||||||
| Diluted EPS from continuing operations |
1.62 | 1.58 | 1.34 | ||||||
| Diluted EPS |
$ | 1.37 | $ | 1.58 | $ | 1.36 | |||
NOTE 4. OTHER EXPENSES, NET
Other expenses, net consisted of the following:
| Years ended June 30, | ||||||||||||
| 2010 | 2009 | 2008 | ||||||||||
| ($ in millions) | ||||||||||||
| Interest expense on borrowings |
$ | 9.8 | $ | 14.3 | $ | 31.3 | ||||||
| Interest income |
(0.7 | ) | (0.8 | ) | (2.0 | ) | ||||||
| Foreign currency exchange (gain) loss |
(1.0 | ) | (1.9 | ) | 0.9 | |||||||
| Gain from purchase of senior notes |
— | (8.4 | ) | — | ||||||||
| Other |
1.0 | 0.8 | 0.7 | |||||||||
| Other expenses, net |
$ | 9.1 | $ | 4.0 | $ | 30.9 | ||||||
NOTE 5. ACQUISITIONS
Assets acquired and liabilities assumed in business combinations were recorded on the Company’s Consolidated Balance Sheets as of the respective acquisition dates based upon their estimated fair values at such dates. The results of operations of businesses acquired by the Company were included in the Company’s Consolidated Statements of Earnings since their respective dates of acquisition. The excess of the purchase price over the estimated fair values of the underlying assets acquired and liabilities assumed was allocated to goodwill.
Acquisitions completed by the Company with an aggregate purchase price of greater than $15.0 million during the fiscal years ended June 30, 2010, 2009 and 2008, were as follows:
The Company acquired one business in the Securities Processing Solutions segment in fiscal year 2010 for $37.7 million. This acquisition resulted in $20.9 million of goodwill. Intangible assets acquired, which totaled $10.6 million, consist primarily of customer relationships and acquired software technology, which are being amortized over a ten-year life and five-year life, respectively. This acquisition was not material to the Company’s operations, financial position, or cash flows.
53
Table of Contents
The Company acquired one business in the Investor Communications Solutions segment in fiscal year 2009 for $45.2 million. This acquisition resulted in $31.4 million of goodwill. Intangible assets acquired, which totaled $13.0 million, consist primarily of acquired technology and customer relationships that are being amortized over a five-year life and seven-year life, respectively. This acquisition was not material to the Company’s operations, financial position, or cash flows.
The Company also completed acquisitions with individual aggregate purchase prices of less than $15.0 million during fiscal years 2010, 2009 and 2008, respectively, which were not material to the Company’s consolidated financial statements.
NOTE 6. FAIR VALUE OF FINANCIAL INSTRUMENTS
Accounting guidance on fair value measurements for certain financial assets and liabilities requires that assets and liabilities carried at fair value be classified and disclosed in one of the following three categories:
| Level 1 | Inputs that are based upon unadjusted quoted prices for identical instruments traded in active markets. | |
| Level 2 | Quoted prices in markets that are not considered to be active or financial instruments for which all significant inputs are observable, either directly or indirectly; | |
| Level 3 | Unobservable inputs that are supported by little or no market activity and that are significant to the fair value of the assets or liabilities. Level 3 assets and liabilities include financial instruments whose value is determined using pricing models, discounted cash flow methodologies, or similar techniques, as well as instruments for which the determination of fair value requires significant management judgment or estimation. | |
In valuing assets and liabilities, the Company is required to maximize the use of quoted market prices and minimize the use of unobservable inputs. The Company calculates the fair value of our Level 1 and Level 2 instruments based on the exchange traded price of similar or identical instruments where available or based on other observable instruments. These calculations take into consideration the credit risk of both the Company and our counterparties. The Company has not changed its valuation techniques in measuring the fair value of any financial assets and liabilities during the period.
The following table sets forth the Company’s financial assets and liabilities as of June 30, 2010 that are measured at fair value on a recurring basis during the period, segregated by level within the fair value hierarchy:
| Level 1 | Level 2 | Level 3 | Total | |||||||||
| ($ in millions) | ||||||||||||
| Assets |
||||||||||||
| Cash and cash equivalents: |
||||||||||||
| Money market funds |
$ | 177.0 | $ | — | $ | — | $ | 177.0 | ||||
| Other non-current assets: |
||||||||||||
| Note receivable |
— | — | 20.6 | 20.6 | ||||||||
| Total |
$ | 177.0 | $ | — | $ | 20.6 | $ | 197.6 | ||||
The note receivable in Level 3 assets represents the present value of a five-year subordinated note from PWI. There was no financial impact to the Company’s statement of operations as of June 30, 2010.
54
Table of Contents
The following table sets forth the Company’s financial assets and liabilities as of June 30, 2009 that are measured at fair value on a recurring basis during the period, segregated by level within the fair value hierarchy:
| Level 1 | Level 2 | Level 3 | Total | |||||||||
| ($ in millions) | ||||||||||||
| Assets |
||||||||||||
| Cash and cash equivalents: |
||||||||||||
| Money market funds |
$ | 159.6 | $ | — | $ | — | $ | 159.6 | ||||
| Assets of discontinued operations: |
||||||||||||
| U.S. government obligations |
2.0 | — | — | 2.0 | ||||||||
| Total |
$ | 161.6 | $ | — | $ | — | $ | 161.6 | ||||
The following table sets forth an analysis of changes during fiscal years 2010 and 2009 in Level 3 financial assets of the Company:
| 2010 | 2009 | |||||
| ($ in millions) | ||||||
| Beginning balance, |
$ | — | $ | — | ||
| Net realized/unrealized gains/(losses) |
— | — | ||||
| Purchases/(sales) |
20.6 | — | ||||
| Transfers in/(out) of Level 3 |
— | — | ||||
| Balance at June 30, |
$ | 20.6 | $ | — | ||
The following table sets forth a summary of Level 3 fair value asset impairments that the Company incurred during fiscal years 2010 and 2009 (see Note 9, “Goodwill and Intangible Assets, Net” for a discussion of these asset impairments):
| 2010 | 2009 | |||||
| ($ in millions) | ||||||
| Goodwill impairments |
$ | 29.3 | $ | — | ||
| Intangible asset impairments |
10.9 | — | ||||
| Total asset impairments at June 30, |
$ | 40.2 | $ | — | ||
NOTE 7. DISCONTINUED OPERATIONS
In November 2009, the Company and Ridge Clearing & Outsourcing Solutions, Inc. (“Ridge”) entered into an asset purchase agreement (the “Asset Purchase Agreement”) with PWI and Penson Financial Services, Inc., a wholly owned subsidiary of PWI (“PFSI”), to sell substantially all contracts of the securities clearing clients of Ridge to PFSI.
On June 25, 2010, the Company completed the sale of the contracts of substantially all of the securities clearing clients of Ridge to PFSI, for an aggregate purchase price of $35.2 million. The purchase price paid to Broadridge consists of (i) a five-year subordinated note from PWI in the principal amount of $20.6 million bearing interest at an annual rate equal to the London Inter-Bank Offer Rate (“LIBOR”) plus 550 basis points, and (ii) 2,455,627 shares of PWI’s common stock (representing 9.5% of PWI’s outstanding common stock as of May 31, 2010), at the June 25, 2010 closing price of PWI’s common stock of $5.95 per share. The purchase price is subject to certain adjustments post-closing including adjustments to reflect certain recently signed correspondent clearing contracts. The Company will discontinue its securities clearing services business but will continue to provide operations outsourcing solutions aligned with the Securities Processing Solutions business.
55
Table of Contents
The results of the securities clearing business, which previously were included in the Clearing and Outsourcing Solutions segment, are included in Earnings (loss) from discontinued operations, net of tax benefit (expense), for all periods presented. The net assets associated with the securities clearing business, totaling $24.7 million and $307.6 million, have been reclassified to Assets of discontinued operations and Liabilities of discontinued operations as of June 30, 2010 and June 30, 2009, respectively.
For a period of time, the Company will continue to generate cash flows and to report income statement activity in Earnings (loss) from discontinued operations, net of tax benefit, associated with the securities clearing business. The activities that give rise to these cash flows and income statement activities are transitional in nature.
The following summarized financial information related to the securities clearing business has been segregated from continuing operations and reported as discontinued operations:
| Years ended June 30, | ||||||||||||
| 2010 | 2009 | 2008 | ||||||||||
| ($ in millions) | ||||||||||||
| Revenues |
$ | 74.3 | $ | 76.3 | $ | 76.6 | ||||||
| Earnings from discontinued operations, before net loss on disposal |
$ | — | $ | 0.3 | $ | 6.2 | ||||||
| Income tax expense |
— | (0.1 | ) | (2.4 | ) | |||||||
| Net earnings from discontinued operations, before loss on disposal |
— | 0.2 | 3.8 | |||||||||
| Loss on disposal of assets of discontinued operations, net of tax benefit of $20.2 |
(35.1 | ) | — | — | ||||||||
| Earnings (loss) from discontinued operations, net of tax benefit (expense) |
$ | (35.1 | ) | $ | 0.2 | $ | 3.8 | |||||
The following assets and liabilities have been segregated and classified as Assets of discontinued operations and Liabilities of discontinued operations, as appropriate, in the consolidated balance sheet as of June 30, 2010 and June 30, 2009, respectively. These assets and liabilities related to the securities clearing business described above, net to $24.7 million and $307.6 million. The amounts presented below were adjusted to exclude intercompany receivables and payables between the business held for sale and the Company, which are to be excluded from the disposition.
| June 30, 2010 | June 30, 2009 | |||||
| ($ in millions) | ||||||
| Assets |
||||||
| Cash and cash equivalents |
$ | — | $ | 107.5 | ||
| Cash and securities segregated for regulatory purposes and securities deposited with clearing organizations |
67.0 | 246.5 | ||||
| Securities clearing receivables, net of allowance for doubtful accounts of zero and $2.0, respectively |
52.5 | 1,011.3 | ||||
| Other assets |
4.3 | 48.9 | ||||
| Total assets of discontinued operations |
123.8 | 1,414.2 | ||||
| Liabilities |
||||||
| Accrued expenses and other current liabilities |
21.7 | 18.5 | ||||
| Securities clearing payables |
77.4 | 1,088.1 | ||||
| Total liabilities of discontinued operations |
99.1 | 1,106.6 | ||||
| Net assets of discontinued operations |
$ | 24.7 | $ | 307.6 | ||
Securities clearing receivables/payables and segregated cash will be converted to cash shortly after the close of the transaction, with any excess cash remaining with the Company.
56
Table of Contents
Regulatory Requirements
As a registered broker-dealer and member of the New York Stock Exchange (“NYSE”) and the Financial Industry Regulatory Authority (“FINRA”), Ridge is subject to the Uniform Net Capital Rule 15c3-1 of the Securities Exchange Act of 1934, as amended (“Rule 15c3-1”). Ridge computes its net capital under the alternative method permitted by Rule 15c3-1, which requires Ridge to maintain minimum net capital equal to the greater of $250,000 or 2% of aggregate debit items arising from customer transactions. The NYSE and FINRA may require a member firm to reduce its business if its net capital is less than 4% of aggregate debit items, or may prohibit a member firm from expanding its business or paying cash dividends if resulting net capital would be less than 5% of aggregate debit items. At June 30, 2010, Ridge had net capital of $146.2 million, which was approximately 406.0% of aggregate debit items and exceeded the minimum requirements by $145.5 million.
NOTE 8. PROPERTY, PLANT AND EQUIPMENT, NET
Depreciation and amortization expense for Property, plant and equipment was $32.3 million, $32.8 million, and $32.9 million for the three fiscal years ended June 30, 2010, 2009 and 2008, respectively. Property, plant and equipment at cost and accumulated depreciation at June 30, 2010 and 2009 are as follows:
| June 30, | ||||||||
| 2010 | 2009 | |||||||
| ($ in millions) | ||||||||
| Property, plant and equipment: |
||||||||
| Land and buildings |
$ | 4.3 | $ | 4.2 | ||||
| Equipment |
224.0 | 203.2 | ||||||
| Furniture, leaseholds and other |
155.1 | 158.7 | ||||||
| 383.4 | 366.1 | |||||||
| Less: Accumulated depreciation |
(296.0 | ) | (290.7 | ) | ||||
| Property, plant and equipment, net |
$ | 87.4 | $ | 75.4 | ||||
NOTE 9. GOODWILL AND INTANGIBLE ASSETS, NET
Changes in Goodwill for the fiscal years ended June 30, 2010 and 2009 are as follows:
| Investor Communication Solutions |
Securities Processing Solutions |
Clearing and Outsourcing Solutions |
Total | ||||||||||||
| ($ in millions) | |||||||||||||||
| Balance as of July 1, 2008 |
$ | 259.3 | $ | 195.7 | $ | 29.3 | $ | 484.3 | |||||||
| Additions |
31.4 | 11.2 | — | 42.6 | |||||||||||
| Reclassified to assets of discontinued operations |
— | — | (29.3 | ) | (29.3 | ) | |||||||||
| Cumulative translation adjustments |
— | (15.8 | ) | — | (15.8 | ) | |||||||||
| Balance as of June 30, 2009 |
290.7 | 191.1 | — | 481.8 | |||||||||||
| Additions |
12.4 | 20.9 | — | 33.3 | |||||||||||
| Cumulative translation adjustments |
— | (5.6 | ) | — | (5.6 | ) | |||||||||
| Balance as of June 30, 2010 |
$ | 303.1 | $ | 206.4 | $ | — | $ | 509.5 | |||||||
During fiscal year 2010, the Company sold the contracts of substantially all of its securities clearing clients. As a result, goodwill of $29.3 million in the former Clearing and Outsourcing Solutions segment was reclassified to Assets of discontinued operations and subsequently written off in fiscal year 2010 as a result of the sale of this business (see Note 7, “Discontinued Operations”).
During fiscal years 2010, 2009 and 2008, the Company performed the required impairment tests of Goodwill under ASC No. 350 (formerly SFAS No. 142) and determined that there was no impairment other than as noted above.
57
Table of Contents
Intangible assets at cost and accumulated amortization at June 30, 2010 and 2009 are as follows:
| June 30, | ||||||||||||||||||||
| 2010 | 2009 | |||||||||||||||||||
| Original Cost |
Accumulated Amortization |
Intangible Assets, net |
Original Cost |
Accumulated Amortization |
Intangible Assets, net | |||||||||||||||
| ($ in millions) | ||||||||||||||||||||
| Software and software licenses |
$ | 71.3 | $ | (46.2 | ) | $ | 25.1 | $ | 60.3 | $ | (42.1 | ) | $ | 18.2 | ||||||
| Customer contracts and lists |
31.7 | (12.6 | ) | 19.1 | 20.9 | (10.9 | ) | 10.0 | ||||||||||||
| Other intangibles |
2.6 | (0.7 | ) | 1.9 | 2.3 | (1.1 | ) | 1.2 | ||||||||||||
| $ | 105.6 | $ | (59.5 | ) | $ | 46.1 | $ | 83.5 | $ | (54.1 | ) | $ | 29.4 | |||||||
During fiscal year 2010, the customer relationship intangible asset at Ridge was reclassified to Assets of discontinued operations as a result of the sale of the business (see Note 7, “Discontinued Operations”), with an original cost of $22.0 million, and accumulated amortization of $10.1 million associated with this asset.
Other intangibles consist primarily of purchased rights, covenants, patents, and trademarks (acquired directly or through acquisitions). All of the intangible assets have finite lives and, as such, are subject to amortization. The weighted-average remaining useful life of the intangible assets is 4.4 years (3.6 years for software and software licenses and 7.6 years for customer contracts and lists). Amortization of intangibles totaled $9.0 million, $5.6 million, and $5.0 million for fiscal years 2010, 2009, and 2008, respectively. Estimated amortization expenses of the Company’s existing intangible assets for the next five fiscal years are as follows:
| Years Ending June 30, |
($ in millions) | ||
| 2011 |
$ | 10.9 | |
| 2012 |
9.5 | ||
| 2013 |
7.3 | ||
| 2014 |
4.9 | ||
| 2015 |
2.9 | ||
NOTE 10. ACCRUED EXPENSES AND OTHER CURRENT LIABILITIES
Accrued expenses and other current liabilities consist of the following:
| June 30, | ||||||
| 2010 | 2009 | |||||
| ($ in millions) | ||||||
| Employee compensation and benefits |
$ | 101.9 | $ | 95.8 | ||
| Accrued broker fees |
56.3 | 48.6 | ||||
| Accrued income tax liability |
24.3 | 26.0 | ||||
| Accrued dividend payable |
18.6 | 9.8 | ||||
| Other |
60.1 | 36.5 | ||||
| Total |
$ | 261.2 | $ | 216.7 | ||
NOTE 11. BORROWINGS
Revolving Credit and Loan Facilities: On March 29, 2007, the Company entered into a $1,190.0 million senior unsecured credit facility, consisting of a $440.0 million, five-year term loan facility, a $500.0 million, five-year revolving credit facility and a $250.0 million, one-year revolving credit facility. Borrowings under the five-year term loan facility bear interest at LIBOR plus 40 to 90 basis points based on debt ratings at the time of the borrowing. The five-year term loan facility was subject to interest at LIBOR plus 40 basis points and 50 basis
58
Table of Contents
points as of June 30, 2010 and 2009, respectively. The weighted-average interest rate on the five-year term loan facility was 0.85% and 2.36% for the fiscal years ended June 30, 2010 and 2009, respectively. Borrowings under the five-year revolving credit facility bear interest at LIBOR plus 27 to 75 basis points based on debt ratings and the utilization percentage of the facility at the time of the borrowing. The five-year revolving credit facility also has an annual facility fee equal to 8 to 20 basis points on the $500.0 million facility, based on the Company’s debt rating, whether used or unused. The annual facility fee for the five-year revolving credit facility was equal to 8 basis points and 10 basis points as of June 30, 2010 and 2009, respectively. The Company incurred $1.5 million in debt issuance costs to establish these credit facilities. These costs have been capitalized in Other non-current assets in the Consolidated Balance Sheets and are amortized to interest expense on a straight-line basis, which approximates the effective interest method, over the terms of these facilities.
On March 29, 2007, the Company borrowed $440.0 million under the five-year term loan facility and $250.0 million under the one-year revolving credit facility. The proceeds received in connection with the $690.0 million of borrowings were transferred to ADP on March 30, 2007 as a tax-free dividend as part of the spin-off from our former parent company (the “Distribution”). In May 2007, the Company refinanced the $250.0 million one-year revolving credit facility through an offering of $250.0 million of 6.125% senior notes discussed below. The one-year revolving credit facility was cancelled upon repayment. During the fiscal years ended June 30, 2010, 2009 and 2008, the Company repaid zero, zero and $170.0 million, respectively, of the five-year term loan facility. During the fiscal years ended June 30, 2010 and 2009, the Company purchased zero and $125.0 million principal amount, respectively, of the 6.125% senior notes due 2017.
These credit facilities are subject to covenants, including financial covenants consisting of a leverage ratio and an interest coverage ratio. At June 30, 2010 and 2009, the Company is not aware of any instances of any non-compliance with the financial covenants of these credit facilities.
Senior Notes: In May 2007, the Company completed an offering of $250.0 million in aggregate principal amount of senior notes (the “Senior Notes”). The Senior Notes will mature on June 1, 2017 and bear interest at a rate of 6.125% per annum. Interest on the Senior Notes is payable semi-annually in arrears on June 1 and December 1 of each year. The Senior Notes were issued at a price of 99.1% (effective yield to maturity of 6.251%). The indenture governing the Senior Notes contains certain covenants including covenants restricting the Company’s ability to create or incur liens securing indebtedness for borrowed money and to enter into certain sale-leaseback transactions. At June 30, 2010 and 2009, we are not aware of any instances of non-compliance with the financial covenants of the indenture governing the Senior Notes. The indenture also contains covenants regarding the purchase of the notes upon a change of control triggering event. The Senior Notes are senior unsecured obligations of the Company and rank equally with our other senior indebtedness. The Company may redeem the Senior Notes in whole or in part at any time before their maturity. The Company incurred $1.9 million in debt issuance costs to establish the Senior Notes. These costs have been capitalized and will be amortized to interest expense on a straight-line basis, which approximates the effective interest method, over the ten-year term. During the fiscal year ended June 30, 2009, the Company purchased $125.0 million principal amount of the Senior Notes (including $1.0 million unamortized bond discount) pursuant to a cash tender offer for such notes. The consideration paid for the Senior Notes accepted for payment was $116.3 million. The completed purchase resulted in a one-time non-cash gain from early extinguishment of debt of $8.4 million.
In addition, certain of the Company’s foreign subsidiaries established unsecured, uncommitted lines of credit with banks. These lines of credit bear interest at LIBOR plus 250 basis points. As of June 30, 2010 and 2009, respectively, no amounts were outstanding under these lines of credit.
59
Table of Contents
Available Capacity: As of June 30, 2010, outstanding borrowings and available capacity under the Company’s borrowing arrangements were as follows:
| Expiration Date |
Total Capacity |
Outstanding Borrowings |
Unused Available Capacity | ||||||||
| ($ in millions) | |||||||||||
| Long-term debt |
|||||||||||
| Term loan facility |
March 2012 | $ | 200.0 | $ | 200.0 | $ | — | ||||
| Senior notes |
June 2017 | 124.1 | 124.1 | — | |||||||
| Revolving credit facility |
March 2012 | 500.0 | — | 500.0 | |||||||
| $ | 824.1 | $ | 324.1 | $ | 500.0 | ||||||
The carrying value of the variable-rate term loan facility approximates fair value. The fair value of the fixed-rate Senior Notes at June 30, 2010 was $130.2 million based on quoted market prices. Amounts are due on the expiration dates listed above.
NOTE 12. STOCK-BASED COMPENSATION
Incentive Equity Awards. The Broadridge Financial Solutions, Inc. 2007 Omnibus Award Plan (the “2007 Plan”) provides for the granting of incentive stock options, nonqualified stock options, stock appreciation rights, restricted stock, restricted stock units, phantom stock awards, stock bonuses and performance compensation awards to employees, non-employee directors, and other key individuals who perform services for the Company. The Company accounts for stock-based compensation in accordance with ASC No. 718 (formerly SFAS No. 123R) which requires the measurement of stock-based compensation expense to be recognized in Net earnings based on the fair value of the award on the date of grant. In accordance with the 2007 Plan, the Company’s stock-based compensation consists of the following:
Stock Options: Stock options are granted to employees at exercise prices equal to the fair market value of the Company’s common stock on the dates of grant. Stock options are generally issued under a graded vesting schedule and, generally vest ratably over five years and have a term of 10 years. Compensation expense for stock options is recognized over the requisite service period for each separately vesting portion of the stock option award.
Time-based Restricted Stock: The Company has a time-based restricted stock program under which shares of common stock have been issued to certain key employees. These shares are restricted as to transfer and in certain circumstances must be returned to the Company at the original purchase price. The Company records stock compensation expense relating to the issuance of time-based restricted stock over the period during which the transfer restrictions exist, which is up to five years from the date of grant. The value of the Company’s time-based restricted stock, based on market prices, is recognized as compensation expense over the restriction period on a straight-line basis.
Performance-based Restricted Stock: The Company has a performance-based restricted stock program under which shares of common stock will be issued to certain key employees upon the achievement, by the Company, of specific performance metrics. When it is probable that the performance metrics will be achieved, the Company records stock compensation expense for performance-based restricted stock on a straight-line basis over the performance period, plus a subsequent vesting period, which typically totals approximately two and one-half years from the date of grant. Certain performance-based equity awards granted to non-U.S. employees are to be settled in cash. The Company records a liability for these performance-based equity awards. The liability and the corresponding stock compensation expense are adjusted to reflect the Company’s closing stock price as of the end of each reporting period.
60
Table of Contents
Restricted Stock Units: The Company has a performance-based restricted stock unit (“RSUs”) program under which RSUs representing the right to receive one share of the Company’s common stock for each vested RSU. RSUs vest upon the achievement, by the Company, of specific performance metrics. The Company records stock compensation expense for performance-based restricted stock on a straight-line basis over the performance period, plus a subsequent vesting period, which typically totals approximately two and one-half years from the date of grant.
The activity related to the Company’s incentive equity awards for the fiscal years ended June 30, 2010, 2009 and 2008 consisted of the following:
| Stock Options | Time-based Restricted Stock |
Performance-based Restricted Stock | ||||||||||||||||
| Number of Options |
Weighted Average Exercise Price |
Number of Shares |
Weighted Average Grant Price |
Number of Shares |
Weighted Average Grant Price | |||||||||||||
| Balances at July 1, 2007 |
17,211,073 | $ | 18.67 | 338,471 | $ | 19.70 | 769,814 | $ | 19.70 | |||||||||
| Granted |
1,792,083 | 20.91 | 1,009,101 | 18.44 | 238,765 | 18.52 | ||||||||||||
| Exercised(a) |
(1,179,924 | ) | 17.26 | — | — | |||||||||||||
| Vesting of Restricted Shares |
— | (206,826 | ) | 19.69 | — | |||||||||||||
| Expired/forfeited |
(399,343 | ) | 16.86 | (22,041 | ) | 18.45 | (32,250 | ) | 19.70 | |||||||||
| Balances at June 30, 2008 |
17,423,889 | $ | 19.00 | 1,118,705 | $ | 18.59 | 976,329 | $ | 19.41 | |||||||||
| Granted |
2,100,900 | 17.32 | 970,393 | 14.11 | 519,502 | 16.12 | ||||||||||||
| Exercised(a) |
(381,567 | ) | 16.95 | — | — | |||||||||||||
| Vesting of Restricted Shares |
— | — | (90,740 | ) | 19.70 | (943,410 | ) | 19.70 | ||||||||||
| Expired/forfeited |
(484,070 | ) | 18.72 | (40,246 | ) | 17.16 | (19,021 | ) | 18.65 | |||||||||
| Balances at June 30, 2009 |
18,659,152 | $ | 18.86 | 1,958,112 | $ | 16.35 | 533,400 | $ | 15.72 | |||||||||
| Granted |
1,751,500 | 22.94 | 1,005,598 | 18.65 | 407,043 | 18.64 | ||||||||||||
| Exercised(a) |
(2,905,972 | ) | 18.46 | — | — | |||||||||||||
| Vesting of Restricted Shares |
— | (982,805 | ) | 17.88 | (266,634 | ) | 18.34 | |||||||||||
| Expired/forfeited |
(135,468 | ) | 19.93 | (96,735 | ) | 21.51 | (2,950 | ) | 16.27 | |||||||||
| Balances at June 30, 2010(b)(c) |
17,369,212 | $ | 19.33 | 1,884,170 | $ | 16.52 | 670,859 | $ | 16.45 | |||||||||
| (a) | Stock options exercised during the fiscal years ended June 30, 2010, 2009 and 2008 had intrinsic values of $10.1 million, $1.0 million and $5.5 million, respectively. |
| (b) | As of June 30, 2010, the Company’s outstanding “in the money” stock options using the fiscal year-end share price of $19.05 (approximately 9.2 million shares) had an aggregate intrinsic value of $17.8 million. |
| (c) | As of June 30, 2010, the Company’s outstanding stock options include 1,288,497 options with a strike price of $24.39 per share that expire in October 2010. |
61
Table of Contents
The table below summarizes information regarding the Company’s outstanding and exercisable stock options as of June 30, 2010:
| Outstanding Options | |||||||
| Options Outstanding |
Weighted Average Remaining Contractual Life |
Weighted Average Exercise Price | |||||
| Range of Exercise Prices |
|||||||
| $0.01 to $14.00 |
1,051,541 | 5.14 | $ | 13.71 | |||
| $14.01 to $16.00 |
1,665,525 | 4.56 | $ | 15.76 | |||
| $16.01 to $18.00 |
2,959,316 | 4.71 | $ | 17.39 | |||
| $18.01 to $20.00 |
4,393,912 | 5.83 | $ | 18.71 | |||
| $20.01 to $22.00 |
4,577,077 | 4.60 | $ | 20.97 | |||
| $22.01 to $24.00 |
1,050,008 | 8.37 | $ | 23.04 | |||
| $24.01 to $26.00 |
1,671,833 | 2.44 | $ | 24.68 | |||
| 17,369,212 | 4.98 | $ | 19.33 | ||||
| Exercisable Options | |||||||
| Range of Exercise Prices |
Options Exercisable |
Weighted Average Remaining Contractual Life |
Weighted Average Exercise Price | ||||
| $0.01 to $14.00 |
741,180 | 3.70 | $ | 13.68 | |||
| $14.01 to $16.00 |
1,409,562 | 3.83 | $ | 15.86 | |||
| $16.01 to $18.00 |
2,576,873 | 4.24 | $ | 17.46 | |||
| $18.01 to $20.00 |
3,500,843 | 5.76 | $ | 18.71 | |||
| $20.01 to $22.00 |
3,502,869 | 3.16 | $ | 20.76 | |||
| $22.01 to $24.00 |
666,672 | 7.66 | $ | 22.76 | |||
| $24.01 to $26.00 |
1,288,497 | 0.30 | $ | 24.39 | |||
| 13,686,496 | 4.08 | $ | 19.17 | ||||
Stock-based compensation expense of $27.3 million, $28.6 million, and $33.7 million was recognized in earnings from continuing operations in the Consolidated Statements of Earnings for the fiscal years ended June 30, 2010, 2009 and 2008, respectively, as well as related tax benefits of $10.4 million, $11.4 million, and $13.1 million, respectively. Stock-based compensation expense of $1.1 million, $1.1 million, and $1.0 million was recognized in earnings from discontinued operations in the Consolidated Statements of Earnings for the fiscal years ended June 30, 2010, 2009 and 2008, respectively, as well as related tax benefits of $0.4 million, $0.4 million, and $0.4 million, respectively.
As of June 30, 2010, the total remaining unrecognized compensation cost related to non-vested stock options and restricted stock awards amounted to $10.1 million and $22.6 million, respectively, which will be amortized over the weighted-average remaining requisite service periods of 2.8 years and 1.5 years, respectively.
The following table presents the assumptions used to determine the fair values of the stock option grants during the fiscal years ended June 30, 2010, 2009 and 2008:
| Fiscal Year Ended June 30, 2010 |
Fiscal Year Ended June 30, 2009 |
Fiscal Year Ended June 30, 2008 | ||||
| Risk-free interest rate |
2.9% - 3.2% | 1.9% - 2.6% | 3.0% - 3.2% | |||
| Dividend yield |
2.5% - 2.6% | 2.3% - 2.6% | 1.4% | |||
| Weighted-average volatility factor |
32.1% - 33.0% | 51.3% - 52.8% | 36.6% - 37.4% | |||
| Weighted-average expected life (in years) |
6.1 - 6.9 | 4.9 - 6.9 | 5.8 - 6.2 | |||
| Weighted-average fair value (in dollars) |
$ 6.00 | $ 4.50 | $ 6.36 |
62
Table of Contents
NOTE 13. EMPLOYEE BENEFIT PLANS
A. Defined Contribution Savings Plan. The Company’s Board of Directors approved a Broadridge sponsored 401(k) savings plan covering eligible full-time domestic employees of the Company. This plan provides a base contribution plus Company matching contributions on a portion of employee contributions. The costs recorded by the Company for this plan were $18.2 million, $15.9 million and $10.8 million for the fiscal years ended June 30, 2010, 2009 and 2008, respectively.
B. Defined Benefit Pension Plan. The Company’s Board of Directors approved a Broadridge sponsored Supplemental Officer Retirement Plan (the “Broadridge SORP”). The Broadridge SORP is a defined benefit plan pursuant to which the Company will pay supplemental pension benefits to certain key officers upon retirement based upon the officers’ years of service and compensation. The amount charged to expense for the Broadridge SORP was $1.2 million, $0.6 million and $0.5 million during the fiscal years ended June 30, 2010, 2009 and 2008, respectively. Broadridge management believes the Broadridge SORP expense is not material to the Company’s Consolidated Financial Statements.
NOTE 14. INCOME TAXES
Earnings from continuing operations before income taxes shown below are based on the geographic location to which such earnings are attributable.
| Years Ended June 30, | |||||||||
| 2010 | 2009 | 2008 | |||||||
| ($ in millions) | |||||||||
| Earnings before income taxes: |
|||||||||
| U.S. |
$ | 247.9 | $ | 278.7 | $ | 235.3 | |||
| Foreign |
94.2 | 67.3 | 84.4 | ||||||
| $ | 342.1 | $ | 346.0 | $ | 319.7 | ||||
The Provision for income taxes consists of the following components:
| Years Ended June 30, | |||||||||||
| 2010 | 2009 | 2008 | |||||||||
| ($ in millions) | |||||||||||
| Current: |
|||||||||||
| U.S. Domestic |
$ | 76.5 | $ | 95.6 | $ | 92.9 | |||||
| Foreign |
28.1 | 21.3 | 32.2 | ||||||||
| State |
9.0 | 2.8 | 21.6 | ||||||||
| Total current |
113.6 | 119.7 | 146.7 | ||||||||
| Deferred: |
|||||||||||
| U.S. Domestic |
0.6 | 4.0 | (9.7 | ) | |||||||
| Foreign |
0.9 | (0.3 | ) | (0.9 | ) | ||||||
| State |
1.9 | (0.5 | ) | (4.8 | ) | ||||||
| Total deferred |
3.4 | 3.2 | (15.4 | ) | |||||||
| Total provision for income taxes |
$ | 117.0 | $ | 122.9 | $ | 131.3 | |||||
63
Table of Contents
A reconciliation of the Company’s effective tax rate on Earnings from continuing operations before income taxes and the U.S. federal statutory rate is as follows:
| Years Ended June 30, | |||||||||||||||||||||
| 2010 | % | 2009 | % | 2008 | % | ||||||||||||||||
| ($ in millions) | |||||||||||||||||||||
| Provision for income taxes at U.S. statutory rate |
$ | 119.7 | 35.0 | $ | 121.1 | 35.0 | $ | 111.9 | 35.0 | ||||||||||||
| Increase in Provision for income taxes from: |
|||||||||||||||||||||
| State taxes, net of federal tax |
8.6 | 1.6 | 5.8 | 1.7 | 11.5 | 3.6 | |||||||||||||||
| Foreign taxes |
(4.6 | ) | (1.4 | ) | (1.7 | ) | (0.5 | ) | (2.3 | ) | (0.7 | ) | |||||||||
| Valuation allowances on tax attributes |
(9.5 | ) | (2.8 | ) | (4.1 | ) | (1.2 | ) | 7.4 | 2.3 | |||||||||||
| Other |
2.8 | 1.8 | 1.8 | 0.5 | 2.8 | 0.9 | |||||||||||||||
| $ | 117.0 | 34.2 | $ | 122.9 | 35.5 | $ | 131.3 | 41.1 | |||||||||||||
The Company’s effective tax rate for the fiscal year ended June 30, 2010 was 34.2% compared to 35.5% for the fiscal year ended June 30, 2009. The decrease in the effective tax rate was primarily attributable to the release of a valuation allowance on a deferred tax asset relating to loss carryforwards and lower rates in certain non-U.S. tax jurisdictions.
As of June 30, 2010, the Company had approximately $179.0 million of earnings attributable to foreign subsidiaries. The Company considers such earnings as permanently reinvested outside the U.S. and, therefore, provides no additional taxes that could occur upon repatriation. It is not practicable to determine the amount of income taxes payable in the event all such foreign earnings are repatriated.
Deferred income taxes reflect the net tax effects of temporary differences between the financial reporting and tax bases of assets and liabilities and are measured using the enacted tax rates and laws that will be in effect when such differences are expected to reverse. Significant components of the Company’s deferred tax assets and liabilities at June 30, 2010 and 2009 were as follows:
| June 30, | ||||||||
| 2010 | 2009 | |||||||
| ($ in millions) | ||||||||
| Classification: |
||||||||
| Current deferred tax assets (included in Other current assets) |
$ | 32.4 | $ | 14.6 | ||||
| Long-term deferred tax liabilities (included in Other non-current liabilities) |
(56.2 | ) | (23.2 | ) | ||||
| Net deferred tax liabilities |
$ | (23.8 | ) | $ | (8.6 | ) | ||
| Components: |
||||||||
| Deferred tax assets: |
||||||||
| Accrued expenses not currently deductible |
$ | 6.0 | $ | 6.7 | ||||
| Depreciation |
14.8 | 22.5 | ||||||
| Compensation and benefits not currently deductible |
41.4 | 40.6 | ||||||
| Net operating and capital losses |
30.8 | 32.2 | ||||||
| Foreign tax credits |
0.1 | — | ||||||
| Other |
6.5 | 5.2 | ||||||
| 99.6 | 107.2 | |||||||
| Less: Valuation allowances |
(15.9 | ) | (25.7 | ) | ||||
| Deferred tax assets, net |
83.7 | 81.5 | ||||||
| Deferred tax liabilities: |
||||||||
| Goodwill and identifiable intangibles |
86.0 | 68.3 | ||||||
| Net deferred expenses |
17.7 | 18.2 | ||||||
| Other |
3.8 | 3.6 | ||||||
| Deferred tax liabilities |
107.5 | 90.1 | ||||||
| Net deferred tax liabilities |
$ | (23.8 | ) | $ | (8.6 | ) | ||
64
Table of Contents
The Company has estimated foreign net operating loss carryforwards of approximately $24.0 million as of June 30, 2010 of which $8.7 million expires in 2011 through 2017 and $15.3 million which has an indefinite utilization period. In addition, the Company has estimated U.S. federal net operating loss carryforwards of approximately $42.8 million which expire in 2020 through 2029.
The Company has recorded valuation allowances of $15.9 million and $25.7 million at June 30, 2010 and 2009, respectively, because the Company does not believe that it is more likely than not that it will be able to utilize the deferred tax assets attributable to net operating and capital loss carryforwards, of certain subsidiaries to offset future taxable earnings.
Upon the adoption of ASC No. 740, the Company recognized an increase of $0.7 million in the liability for unrecognized tax benefits and was accounted for as a reduction of Retained earnings on the Consolidated Balance Sheet at July 1, 2007. During fiscal years 2010 and 2009, the Company increased its reserve for unrecognized tax benefits by $4.4 million and $5.8 million, respectively. The change relates to tax positions taken for the current and prior tax year. The amount of the unrecognized tax benefits at June 30, 2010 that, if recognized, would affect the Company’s effective tax rate is approximately $13.0 million.
In the next twelve months, the Company does not expect to materially decrease its reserve for unrecognized tax benefits.
The following table summarizes the activity related to the Company’s unrecognized tax benefits:
| Fiscal Year Ended June 30, | |||||||||
| 2010 | 2009 | 2008 | |||||||
| ($ in millions) | |||||||||
| Beginning balance |
$ | 11.5 | $ | 5.1 | $ | 0.7 | |||
| Gross increase related to prior period tax positions |
5.2 | 6.4 | 2.8 | ||||||
| Gross increase related to current period tax positions |
— | — | 1.6 | ||||||
| Balance at June 30, |
$ | 16.7 | $ | 11.5 | $ | 5.1 | |||
The Company’s policy with respect to interest and penalties associated with uncertain tax positions is not to include them in income tax expense but include penalties as a component of other accrued expenses and interest in interest expense. During the fiscal years ended June 30, 2010 and 2009, the Company recognized approximately $0.8 million and $0.6 million, respectively, in interest and penalties. Included within the reserve for unrecognized tax benefits recorded on July 1, 2007 was accrued interest and penalties of $0.1 million.
The Company is currently not under any material U.S. federal and state or foreign income tax exams for the periods beginning March 31, 2007 through June 30, 2010.
NOTE 15. CONTRACTUAL COMMITMENTS, CONTINGENCIES, AND OFF-BALANCE SHEET ARRANGEMENTS
In the normal course of business, the Company is subject to claims. While the outcome of any claim or litigation is inherently unpredictable, the Company believes that the ultimate resolution of these matters will not, individually or in the aggregate, result in a material adverse impact on the Consolidated Financial Statements. On January 28, 2010, the Company filed a declaratory action in the U.S. District Court for the District of Delaware (the “Delaware District Court”) against Inveshare, Inc. (the “Defendant”) seeking a declaration by the court that Broadridge does not infringe two U.S. patents owned by the Defendant that included claims related to the delivery and distribution of an electronic solicitation. The Company’s complaint also alleged that the Defendant’s patents are invalid and/or are unenforceable due to inequitable conduct. On March 22, 2010, the Defendant answered the Company’s complaint and filed a counterclaim against the Company alleging that
65
Table of Contents
Broadridge uses a process that infringes one of the patents in the action. In its counterclaim, Defendant is seeking injunctive relief and unspecified damages. This lawsuit is in an early procedural stage and the Company cannot predict with assurance what impact, if any, the outcome of this litigation may have on its financial condition, results of operations, or cash flows.
In March 2010, the Company and International Business Machines Corporation (“IBM”) entered into an Information Technology Services Agreement (the “IT Services Agreement”), under which IBM will provide certain aspects of the Company’s information technology infrastructure that are currently provided under a data center outsourcing services agreement by the Company’s former parent company, ADP. Under the IT Services Agreement, IBM will provide a broad range of technology services to the Company including supporting its mainframe, server, network and data center operations, as well as providing disaster recovery services. The Company has the option of incorporating additional services into the agreement over time. The Company expects that the migration of its data center processing from ADP to IBM will be completed by June 2012. The IT Services Agreement has an initial term of 11 years and seven months, expiring on October 31, 2021. The Company has the right to renew the initial term of the IT Services Agreement for up to one additional 12-month term. Commitments under this agreement are $561.5 million through fiscal year 2022, the final year of the contract.
The Company entered into a data center outsourcing services agreement with ADP before the Distribution under which ADP provides the Company with data center services. Among the principal services provided by the data center are information technology services and service delivery network services. Under the agreement, ADP is responsible for hosting the mainframe, midrange, open systems, and networks. Additionally, systems engineering, network engineering, hardware engineering, network operations, data center operations, application change management, and data center disaster recovery services are managed by ADP. The agreement will expire on June 30, 2012. For the fiscal year ended June 30, 2010, 2009 and 2008, the Company recorded expenses of $104.8 million, $102.8 million and $107.0 million, respectively, in the Consolidated Statements of Earnings related to this agreement. Commitments under this agreement are $216.0 million through fiscal year 2012, the final year of the contract.
Total expense under the above agreements was approximately $162.1 million, $152.2 million and $157.2 million in fiscal years 2010, 2009, and 2008, respectively, with minimum commitments at June 30, 2010 as follows:
| Fiscal Years Ending June 30, |
($ in millions) | ||
| 2011 |
$ | 161.1 | |
| 2012 |
191.7 | ||
| 2013 |
96.7 | ||
| 2014 |
85.1 | ||
| 2015 |
72.8 | ||
| Thereafter |
375.7 | ||
| $ | 983.1 | ||
In addition to fixed rentals, certain leases require payment of maintenance and real estate taxes and contain escalation provisions based on future adjustments in price indices.
As of June 30, 2010, the Company had purchase commitments of approximately $4.3 million comprised primarily of maintenance contracts, the majority of which relate to fiscal year 2011.
As of June 30, 2010, the Company had an outstanding letter of credit for $0.7 million. This letter of credit was issued in May 2007 to guarantee certain claim payments to a third-party insurance company in the event the Company does not pay its portion of the claims. No amounts were drawn on this letter of credit.
66
Table of Contents
From time to time the Company will extend a temporary subordinated loan (“TSL”) to its correspondent broker-dealers. As of both June 30, 2010 and 2009, there were no TSLs outstanding.
In addition, the Company has obligations under various facilities and equipment leases and software license agreements.
It is not the Company’s business practice to enter into off-balance sheet arrangements. However, the Company is exposed to market risk from changes in foreign currency exchange rates that could impact its financial position, results of operations, and cash flows. The Company manages its exposure to these market risks through its regular operating and financing activities and, when deemed appropriate, through the use of derivative financial instruments. The Company uses derivative financial instruments as risk management tools and not for trading purposes. The Company was not a party to any derivative financial instruments as of June 30, 2010 and 2009. In the normal course of business, the Company also enters into contracts in which it makes representations and warranties that relate to the performance of the Company’s products and services. The Company does not expect any material losses related to such representations and warranties, or collateral arrangements.
As a registered broker-dealer, our subsidiary Ridge is subject to regulations concerning many aspects of its business, including trade practices, capital structure, record retention, money laundering prevention, and the supervision of the conduct of directors, officers and employees. A failure by Ridge to comply with any of these laws, rules or regulations could result in censure, fine, the issuance of cease-and-desist orders, or the suspension or revocation of SEC authorization granted to allow the operation of its business or disqualification of the directors, officers or employees of such business. In addition, as a registered broker-dealer, Ridge is required to participate in the Securities Investor Protection Corporation (“SIPC”) for the benefit of the customers of our introducing broker-dealer clients in connection with our securities clearing services. On June 25, 2010, we completed the sale of the contracts of substantially all of Ridge’s securities clearing clients and are in the process of winding down the securities clearing business, which we expect to complete in fiscal year 2011. As we wind down that business, Ridge continues to perform securities clearing services on a limited basis. Until such wind down is complete, Ridge will continue to be subject to the regulatory requirements of a broker-dealer performing those functions. These regulations include the SEC’s customer protection rule, which protects both the customer funds and customer securities; the SEC’s hypothecation Rules 8c-1 and 15c2-1 regarding the borrowing and lending of our correspondents’ customers’ securities; Regulation T, which regulates the borrowing and lending of securities by broker-dealers; and Regulation SHO, which prohibits short sales in certain instances.
NOTE 16. ACCUMULATED OTHER COMPREHENSIVE INCOME (LOSS)
Comprehensive income is a measure of income that includes both Net earnings and other comprehensive income. Other comprehensive income (loss) results from items deferred on the Consolidated Balance Sheets in Stockholders’ equity. Other comprehensive income (loss) was $(8.3) million, $(21.8) million and $2.8 million in fiscal years 2010, 2009 and 2008, respectively. The accumulated balances for each component of other comprehensive income are as follows:
| June 30, | ||||||||||||
| 2010 | 2009 | 2008 | ||||||||||
| ($ in millions) | ||||||||||||
| Currency translation adjustments |
$ | 2.2 | $ | 9.7 | $ | 30.5 | ||||||
| Change in funded status in pension and retirement plan, net of tax of $1.3 |
(2.0 | ) | (2.0 | ) | (2.0 | ) | ||||||
| Pension and postretirement liability adjustment, net of taxes of $1.1, $0.7 and zero at June 30, 2010, 2009 and 2008, respectively |
(1.6 | ) | (0.8 | ) | 0.2 | |||||||
| Accumulated other comprehensive income (loss) |
$ | (1.4 | ) | $ | 6.9 | $ | 28.7 | |||||
67
Table of Contents
NOTE 17. FINANCIAL DATA BY SEGMENT
The Company classifies its operations into the following two reportable segments: Investor Communication Solutions and Securities Processing Solutions. See Note 1, “Basis of Presentation” for a further discussion of the Company’s reportable segments. The primary components of “Other” are the elimination of intersegment revenues and profits as well as certain unallocated expenses. Foreign exchange is a reconciling item between the actual foreign exchange rates and fiscal year 2010 budgeted foreign exchange rates. The prior fiscal year’s reportable segment Net revenues and Earnings before income taxes have been adjusted to reflect updated fiscal year 2010 budgeted foreign exchange rates, this adjustment represents a reconciling difference to Net revenues and Earnings before income taxes.
Certain corporate expenses, as well as certain centrally managed expenses, are allocated based upon budgeted amounts in a reasonable manner. Because the Company compensates the management of its various businesses on, among other factors, segment profit, the Company may elect to record certain segment related expense items of an unusual or non-recurring nature in “Other” rather than reflect such items in segment profit.
Assets included in Other includes the securities clearing activities formerly reported in the Clearing and Outsourcing Solutions segment that are now reported as assets of discontinued operations.
| Investor Communication Solutions |
Securities Processing Solutions |
Other | Foreign Exchange |
Total | |||||||||||||
| ($ in millions) | |||||||||||||||||
| Year ended June 30, 2010 |
|||||||||||||||||
| Revenues |
$ | 1,669.6 | $ | 535.9 | $ | 2.4 | $ | 1.3 | $ | 2,209.2 | |||||||
| Earnings (loss) from continuing operations before income taxes |
272.8 | 99.3 | (34.1 | ) | 4.1 | 342.1 | |||||||||||
| Assets |
735.5 | 650.5 | 408.4 | — | 1,794.4 | ||||||||||||
| Capital expenditures |
26.8 | 12.1 | 3.8 | — | 42.7 | ||||||||||||
| Depreciation and amortization |
23.2 | 11.9 | 6.2 | — | 41.3 | ||||||||||||
| Year ended June 30, 2009 |
|||||||||||||||||
| Revenues |
$ | 1,531.0 | $ | 558.9 | $ | 1.5 | $ | (18.4 | ) | $ | 2,073.0 | ||||||
| Earnings (loss) from continuing operations before income taxes |
248.9 | 133.8 | (32.5 | ) | (4.2 | ) | 346.0 | ||||||||||
| Assets |
735.0 | 469.6 | 1,570.1 | — | 2,774.7 | ||||||||||||
| Capital expenditures |
14.8 | 9.3 | 2.7 | — | 26.8 | ||||||||||||
| Depreciation and amortization |
23.5 | 9.9 | 5.0 | — | 38.4 | ||||||||||||
| Year ended June 30, 2008 |
|||||||||||||||||
| Revenues |
$ | 1,575.2 | $ | 533.5 | $ | 8.5 | $ | 13.6 | $ | 2,130.8 | |||||||
| Earnings (loss) from continuing operations before income taxes |
255.3 | 127.0 | (68.7 | ) | 6.1 | 319.7 | |||||||||||
| Assets |
708.0 | 483.4 | 1,642.2 | — | 2,833.6 | ||||||||||||
| Capital expenditures |
22.0 | 9.7 | 9.7 | — | 41.4 | ||||||||||||
| Depreciation and amortization |
25.2 | 8.5 | 4.2 | — | 37.9 | ||||||||||||
68
Table of Contents
Revenues and assets by geographic area are as follows (assets for the U.S. for the year ended June 30, 2010 includes the securities clearing activities formerly reported in the Clearing and Outsourcing Solutions segment that are now reported as assets of discontinued operations):
| United States |
Canada | United Kingdom |
Other | Total | |||||||||||
| ($ in millions) | |||||||||||||||
| Year ended June 30, 2010 |
|||||||||||||||
| Revenues |
$ | 1,929.6 | $ | 241.9 | $ | 13.9 | $ | 23.8 | $ | 2,209.2 | |||||
| Assets |
$ | 1,560.1 | $ | 67.0 | $ | 121.3 | $ | 46.0 | $ | 1,794.4 | |||||
| Year ended June 30, 2009 |
|||||||||||||||
| Revenues |
$ | 1,838.0 | $ | 198.6 | $ | 13.5 | $ | 22.9 | $ | 2,073.0 | |||||
| Assets |
$ | 2,578.8 | $ | 77.2 | $ | 81.9 | $ | 36.8 | $ | 2,774.7 | |||||
| Year ended June 30, 2008 |
|||||||||||||||
| Revenues |
$ | 1,866.0 | $ | 226.6 | $ | 15.6 | $ | 22.6 | $ | 2,130.8 | |||||
| Assets |
$ | 2,628.3 | $ | 83.7 | $ | 88.5 | $ | 33.1 | $ | 2,833.6 | |||||
NOTE 18. QUARTERLY FINANCIAL RESULTS (UNAUDITED)
Summarized quarterly results of operations for the fiscal years ended June 30, 2010 and 2009 are as follows:
| First Quarter |
Second Quarter |
Third Quarter |
Fourth Quarter | |||||||||
| ($ in millions, except per share amounts) | ||||||||||||
| Year ended June 30, 2010 |
||||||||||||
| Revenues |
$ | 438.2 | $ | 529.7 | $ | 490.8 | $ | 750.5 | ||||
| Earnings from continuing operations before income taxes |
42.5 | 68.5 | 48.4 | 182.7 | ||||||||
| Net earnings |
26.4 | 33.6 | 24.9 | 105.1 | ||||||||
| Basic EPS from continuing operations |
0.19 | 0.38 | 0.23 | 0.86 | ||||||||
| Basic EPS |
0.19 | 0.25 | 0.18 | 0.78 | ||||||||
| Diluted EPS from continuing operations |
0.19 | 0.37 | 0.22 | 0.84 | ||||||||
| Diluted EPS |
0.19 | 0.24 | 0.18 | 0.76 | ||||||||
| Year ended June 30, 2009 |
||||||||||||
| Revenues |
$ | 455.5 | $ | 437.5 | $ | 463.7 | $ | 716.3 | ||||
| Earnings from continuing operations before income taxes |
59.1 | 48.7 | 54.5 | 183.7 | ||||||||
| Net earnings |
35.6 | 29.9 | 40.9 | 116.9 | ||||||||
| Basic EPS from continuing operations |
0.26 | 0.21 | 0.30 | 0.83 | ||||||||
| Basic EPS |
0.26 | 0.21 | 0.29 | 0.84 | ||||||||
| Diluted EPS from continuing operations |
0.26 | 0.21 | 0.29 | 0.82 | ||||||||
| Diluted EPS |
0.25 | 0.21 | 0.29 | 0.83 | ||||||||
* * * * * * *
69
Table of Contents
Broadridge Financial Solutions, Inc.
Schedule II—Valuation and Qualifying Accounts
($ in thousands)
| Column A |
Column B | Column C | Column D | Column E | |||||||||
| Balance at beginning of period |
Additions charged to costs and expenses |
Deductions | Balance at end of period | ||||||||||
| Year ended June 30, 2010: |
|||||||||||||
| Allowance for doubtful accounts: |
|||||||||||||
| Accounts receivable, net |
$ | 2,251 | $ | 3,016 | $ | (3,259 | ) | $ | 2,008 | ||||
| Securities clearing receivables |
$ | 2,000 | $ | — | $ | (2,000 | ) | $ | — | ||||
| Deferred tax valuation allowance |
$ | 25,700 | $ | — | $ | (9,800 | ) | $ | 15,900 | ||||
| Year ended June 30, 2009: |
|||||||||||||
| Allowance for doubtful accounts: |
|||||||||||||
| Accounts receivable, net |
$ | 3,796 | $ | 754 | $ | (2,299 | ) | $ | 2,251 | ||||
| Securities clearing receivables |
$ | 2,000 | $ | — | $ | — | $ | 2,000 | |||||
| Deferred tax valuation allowance |
$ | 29,800 | $ | — | $ | (4,100 | ) | $ | 25,700 | ||||
| Year ended June 30, 2008: |
|||||||||||||
| Allowance for doubtful accounts: |
|||||||||||||
| Accounts receivable, net |
$ | 2,559 | $ | 1,956 | $ | (719 | ) | $ | 3,796 | ||||
| Securities clearing receivables |
$ | 2,096 | $ | 52 | $ | (148 | ) | $ | 2,000 | ||||
| Deferred tax valuation allowance |
$ | 21,900 | $ | 7,900 | $ | — | $ | 29,800 | |||||
70
Table of Contents
| ITEM 9. | Changes in and Disagreements with Accountants on Accounting and Financial Disclosure. |
None.
| ITEM 9A. | Controls and Procedures. |
Management Report
Attached as Exhibits 31.1 and 31.2 to this Form 10-K are certifications of Broadridge’s Chief Executive Officer and Chief Financial Officer, which are required by Rule 13a-14(a) of the Exchange Act, as amended. This “Controls and Procedures” section should be read in conjunction with the Deloitte & Touche LLP audit and attestation of the Company’s internal control over financial reporting that appears in Item 8 “Financial Statements and Supplementary Data” in this Annual Report on Form 10-K and is hereby incorporated herein by reference.
Management’s Evaluation of Disclosure Controls and Procedures
Our management, with the participation of our Chief Executive Officer and Chief Financial Officer as of June 30, 2010, evaluated the effectiveness of our disclosure controls as defined in Rule 13a-15(e) under the Exchange Act. The Chief Executive Officer and Chief Financial Officer concluded that our disclosure controls and procedures as of June 30, 2010 were effective to provide reasonable assurance that the information required to be disclosed by us in reports filed under the Exchange Act is (i) recorded, processed, summarized, and reported within the time periods specified in the SEC’s rules and forms and (ii) accumulated and communicated to our management, including our Chief Executive Officer and Chief Financial Officer, as appropriate, to allow timely decisions regarding disclosure.
Management’s Report on Internal Control over Financial Reporting
It is the responsibility of Broadridge’s management to establish and maintain effective internal control over financial reporting (as defined in Rule 13a-15(f) under Exchange as defined in Rule 13a-15(f) under Exchange Act). Internal control over financial reporting is designed to provide reasonable assurance to Broadridge’s management and board of directors regarding the preparation of reliable financial statements for external purposes in accordance with generally accepted accounting principles.
Broadridge’s internal control over financial reporting includes those policies and procedures that: (i) pertain to the maintenance of records that, in reasonable detail, accurately and fairly reflect the transactions and dispositions of the assets of Broadridge; (ii) provide reasonable assurance that transactions are recorded as necessary to permit preparation of financial statements in accordance with generally accepted accounting principles, and that receipts and expenditures of Broadridge are being made only in accordance with authorizations of management and directors of Broadridge; and (iii) provide reasonable assurance regarding the prevention or timely detection of unauthorized acquisition, use or disposition of Broadridge’s assets that could have a material effect on the financial statements of Broadridge.
Because of its inherent limitations, internal control over financial reporting may not prevent or detect misstatements. Therefore, even those systems determined to be effective can provide only reasonable assurance with respect to financial statement preparation and presentation.
Management has performed an assessment of the effectiveness of Broadridge’s internal control over financial reporting as of June 30, 2010 based upon criteria set forth in Internal Control—Integrated Framework issued by the Committee of Sponsoring Organizations of the Treadway Commission. Based on this assessment, management determined that Broadridge’s internal control over financial reporting was effective as of June 30, 2010.
71
Table of Contents
Deloitte & Touche LLP, the Company’s independent registered public accounting firm, has audited the effectiveness of the Company’s internal over financial reporting and has issued an attestation report on the effectiveness of the Company’s internal control over financial reporting, which attestation report appears in Item 8 “Financial Statements and Supplementary Data” in this Annual Report on Form 10-K.
| /S/ RICHARD J. DALY |
| Richard J. Daly |
| Chief Executive Officer |
| /S/ DAN SHELDON |
| Dan Sheldon |
| Vice President, Chief Financial Officer |
Lake Success, New York
August 12, 2010
Changes in Internal Control over Financial Reporting
No change over our internal control over financial reporting (as defined in Rules 13a-15(f) and 15d-15(f) under the Exchange Act) occurred during the fiscal quarter ended June 30, 2010 that has materially affected, or is reasonably likely to materially affect, our internal control over financial reporting.
| ITEM 9B. | Other Information. |
None.
72
Table of Contents
| ITEM 10. | Directors. Executive Officers and Corporate Governance. |
We incorporate by reference the information responsive to this Item appearing in our Proxy Statement.
| ITEM 11. | Executive Compensation. |
We incorporate by reference the information responsive to this Item appearing in our Proxy Statement.
| ITEM 12. | Security Ownership of Certain Beneficial Owners and Management and Related Stockholder Matters. |
We incorporate by reference the information responsive to this Item appearing in our Proxy Statement.
| ITEM 13. | Certain Relationships and Related Transactions, and Director Independence. |
We incorporate by reference the information responsive to this Item appearing in our Proxy Statement.
| ITEM 14. | Principal Accountant Fees and Services. |
We incorporate by reference the information responsive to this Item appearing in our Proxy Statement.
73
Table of Contents
| ITEM 15. | Exhibits and Financial Statement Schedules. |
| (a) | The following documents are filed as part of this Annual Report on Form 10-K: |
| 1. | Financial Statements. |
The Consolidated Financial Statements are listed under Item 8 of this Annual Report on Form 10-K. See Index to Financial Statements and Financial Statement Schedule.
| 2. | Financial Statement Schedule. |
Schedule II—Valuation and Qualifying Accounts is listed under Item 8 of this Annual Report on Form 10-K. See Index to Financial Statements and Financial Statement Schedule.
| 3. | Exhibits. |
The Exhibits filed as part of this Annual Report on Form 10-K are listed on the Exhibit Index, which Exhibit Index is incorporated in this Annual Report on Form 10-K by reference.
74
Table of Contents
SIGNATURES
Pursuant to the requirements of Section 13 or 15(d) of the Securities Exchange Act of 1934, as amended, the Registrant has duly caused this Annual Report on Form 10-K to be signed on its behalf by the undersigned hereunto duly authorized.
Date: August 12, 2010
| BROADRIDGE FINANCIAL SOLUTIONS, INC. | ||
| By: | /S/ RICHARD J. DALY | |
| Name: | Richard J. Daly | |
| Title: | Chief Executive Officer | |
Pursuant to the requirements of the Securities Exchange Act of 1934, as amended, this Annual Report on Form 10-K has been signed below by the following persons on behalf of the Registrant and in the capacities and on the dates indicated.
| Signature |
Title |
Date | ||
| /S/ RICHARD J. DALY Richard J. Daly |
Chief Executive Officer and Director (Principal Executive Officer) | August 12, 2010 | ||
| /S/ DAN SHELDON Dan Sheldon |
Vice President, Chief Financial Officer (Principal Financial and Accounting Officer) | August 12, 2010 | ||
| /S/ ARTHUR F. WEINBACH Arthur F. Weinbach |
Executive Chairman and Chairman of the Board | August 12, 2010 | ||
| /S/ LESLIE A. BRUN Leslie A. Brun |
Director | August 12, 2010 | ||
| /S/ ROBERT N. DUELKS Robert N. Duelks |
Director | August 12, 2010 | ||
| /S/ RICHARD J. HAVILAND Richard J. Haviland |
Director | August 12, 2010 | ||
| /S/ ALEXANDRA LEBENTHAL Alexandra Lebenthal |
Director | August 12, 2010 | ||
| /S/ STUART R. LEVINE Stuart R. Levine |
Director | August 12, 2010 | ||
| /S/ THOMAS J. PERNA Thomas J. Perna |
Director | August 12, 2010 | ||
| /S/ ALAN J. WEBER Alan J. Weber |
Director | August 12, 2010 | ||
75
Table of Contents
EXHIBIT INDEX
| Exhibit |
Description of Exhibit(1) | |
| 2.1 | Asset Purchase Agreement, dated as of November 2, 2009, by and among Broadridge Financial Solutions, Inc., Ridge Clearing & Outsourcing Solutions, Inc., Penson Worldwide, Inc., and Penson Financial Services, Inc. (incorporated by reference to Exhibit 2.1 to Form 10-Q filed on February 4, 2010).(2)(3) | |
| 3.1 | Certificate of Incorporation of Broadridge Financial Solutions, Inc. (incorporated by reference to Exhibit 3.1 to Form 8-K filed on April 2, 2007). | |
| 3.2 | Amended and Restated By-laws of Broadridge Financial Solutions, Inc. (incorporated by reference to Exhibit 3.2 to Form 8-K filed on June 7, 2007). | |
| 4.1 | Indenture dated as of May 29, 2007 by and between Broadridge Financial Solutions, Inc. and U.S. Bank National Association, as Trustee (incorporated by reference to Exhibit 4.1 to Form 8-K filed on May 30, 2007). | |
| 4.2 | First Supplemental Indenture dated as of May 29, 2007 by and between Broadridge Financial Solutions, Inc. and U.S. Bank National Association, as Trustee (incorporated by reference to Exhibit 4.2 to Form 8-K filed on May 30, 2007). | |
| 4.3 | Form of 6.125% Senior Note due 2017 dated May 29, 2007 (incorporated by reference to Exhibit 4.3 to Form 8-K filed on May 30, 2007). | |
| 10.1 | Separation and Distribution Agreement, dated as of March 20, 2007, between Automatic Data Processing, Inc. and Broadridge Financial Solutions, LLC (incorporated by reference to Exhibit 10.1 to Form 8-K filed on March 21, 2007). | |
| 10.2 | Tax Allocation Agreement, dated as of March 29, 2007, between Automatic Data Processing, Inc. and Broadridge Financial Solutions, LLC (incorporated by reference to Exhibit 10.1 to Form 8-K filed on April 2, 2007). | |
| 10.3 | Transition Services Agreement, dated as of March 29, 2007, between Automatic Data Processing, Inc. and Broadridge Financial Solutions, LLC (incorporated by reference to Exhibit 10.2 to Form 8-K filed on April 2, 2007). | |
| 10.4 | Data Center Outsourcing Services Agreement, dated as of March 29, 2007, between Automatic Data Processing, Inc. and Broadridge Financial Solutions, LLC (incorporated by reference to Exhibit 10.3 to Form 8-K filed on April 2, 2007). | |
| 10.5 | Intellectual Property Transfer Agreement, dated as of March 29, 2007, between Automatic Data Processing, Inc. and Broadridge Financial Solutions, LLC (incorporated by reference to Exhibit 10.4 to Form 8-K filed on April 2, 2007). | |
| 10.6 | Employee Matters Agreement, dated as of March 29, 2007, between Automatic Data Processing, Inc. and Broadridge Financial Solutions, LLC (incorporated by reference to Exhibit 10.5 to Form 8-K filed on April 2, 2007). | |
| 10.7 | Broadridge Financial Solutions, Inc. Change in Control Severance Plan for Corporate Officers (incorporated by reference to Exhibit 10.6 to Form 8-K filed on April 2, 2007). | |
| 10.8 | Supplemental Officers Retirement Plan (incorporated by reference to Exhibit 10.7 to Form 8-K filed on April 2, 2007). | |
| 10.9 | Change in Control Enhancement Agreement for Richard J. Daly (incorporated by reference to Exhibit 10.8 to Form 8-K filed on April 2, 2007). | |
| 10.10 | Change in Control Enhancement Agreement for John Hogan (incorporated by reference to Exhibit 10.9 to Form 8-K filed on April 2, 2007). | |
76
Table of Contents
| Exhibit |
Description of Exhibit(1) | |
| 10.11 | 2007 Deferred Compensation Plan (incorporated by reference to Exhibit 10.10 to Form 8-K filed on April 2, 2007). | |
| 10.12 | Broadridge Financial Solutions, Inc. 2007 Omnibus Award Plan (incorporated by reference to Exhibit 10.11 to Form 8-K filed on April 2, 2007). | |
| 10.13 | Broadridge Financial Solutions, Inc. 2007 Omnibus Award Plan (Amended and Restated effective August 4, 2008) (incorporated by reference to Exhibit 10.1 to Form 8-K filed on November 14, 2008). | |
| 10.14 | Five-Year Credit Agreement dated as of March 29, 2007 by and among Broadridge Financial Solutions, Inc., JPMorgan Chase Bank, N.A., as Administrative Agent, J.P. Morgan Europe Limited, as London Agent, Citibank, N.A., as Syndication Agent, and the Lenders party thereto (incorporated by reference to Exhibit 10.12 to Form 8-K filed on April 2, 2007). | |
| 10.15 | Interim Credit Agreement dated as of March 29, 2007 by and among Broadridge Financial Solutions, Inc., JPMorgan Chase Bank, N.A., as Administrative Agent, Citibank, N.A., as Syndication Agent, and the Lenders party thereto (incorporated by reference to Exhibit 10.13 to Form 8-K filed on April 2, 2007). | |
| 10.16 | Underwriting Agreement dated as of May 23, 2007 by and among Broadridge Financial Solutions, Inc. and Citigroup Global Markets Inc. and J.P. Morgan Securities Inc., as representatives of the underwriters party thereto (incorporated by reference to Exhibit 1.1 to Form 8-K filed on May 30, 2007). | |
| 10.17 | Revolving Credit Agreement, dated as of August 5, 2009, by and among Ridge & Outsourcing Solutions, Inc., Broadridge Financial Solutions, Inc., as guarantor, and U.S. Bank National Association (incorporated by reference to Exhibit 10.1 to Form 8-K filed on August 6, 2009). | |
| 10.18 | Collateral Pledge Agreement, dated as of August 5, 2009, by and between Ridge & Outsourcing Solutions, Inc. and U.S. Bank National Association (incorporated by reference to Exhibit 10.2 to Form 8-K filed on August 6, 2009). | |
| 10.19 | Master Services Agreement, dated as of November 2, 2009, by and between Broadridge Financial Solutions, Inc. and Penson Worldwide, Inc. (incorporated by reference to Exhibit 10.1 to Form 10-Q/A filed on June 10, 2010).(3) | |
| 10.20 | Offer Letter by and between Broadridge Financial Solutions, Inc. and Timothy Gokey, dated as of March 15, 2010, (incorporated by reference to Exhibit 10.1 to Form 10-Q filed on May 10, 2010). | |
| 10.21 | Information Technology Services Agreement, dated as of March 31, 2010, by and between International Business Machines Corporation and Broadridge Financial Solutions, Inc. (incorporated by reference to Exhibit 10.2 to Form 10-Q filed on May 10, 2010).(3) | |
| 10.22 | Amendment Agreement, dated as of June 25, 2010, by and among SAI Holdings, Inc., Penson Financial Services, Inc., Penson Worldwide, Inc., Penson Financial Services Ltd., Penson Financial Services Canada Inc., Broadridge Financial Solutions, Inc., Ridge Clearing & Outsourcing Solutions, Inc., Broadridge Financial Solutions (Canada) Inc., and Ridge Clearing & Outsourcing Solutions Limited.(3) | |
| 10.23 | Amendment, Assignment and Assumption Agreement, dated as of June 25, 2010, by and among SAI Holdings, Inc., Penson Financial Services, Inc., Penson Worldwide, Inc., Penson Financial Services Ltd., Penson Financial Services Canada Inc., Broadridge Financial Solutions, Inc., Ridge Clearing & Outsourcing Solutions, Inc., Broadridge Financial Solutions (Canada) Inc., and Ridge Clearing & Outsourcing Solutions Limited.(2)(3) | |
| 10.24 | Amendment No. 1 to the Information Technology Services Agreement, dated as of June 25, 2010, by and between International Business Machines Corporation and Broadridge Financial Solutions, Inc.(3) | |
77
Table of Contents
| Exhibit |
Description of Exhibit(1) | |
| 10.25 | Broadridge Financial Solutions, Inc. 2007 Omnibus Award Plan (Amended and Restated effective August 4, 2008, as amended effective August 4, 2009) (incorporated by reference to Exhibit 10.1 to Form 8-K filed on November 20, 2009). | |
| 12.1 | Computation of Ratio of Earnings to Fixed Charges. | |
| 14 | Code of Ethics for the Company’s Principal Executive Officer and Senior Financial Officers (incorporated by reference to Exhibit 99.1 to Form 8-K filed on August 2, 2007). | |
| 21.1 | Subsidiaries of the Company. | |
| 23.1 | Consent of Independent Registered Public Accounting Firm. | |
| 31.1 | Certification of the Chief Executive Officer of Broadridge Financial Solutions, Inc., pursuant to Rule 13a-14 of the Exchange Act, as adopted pursuant to Section 302 of the Sarbanes-Oxley Act of 2002. | |
| 31.2 | Certification of the Chief Financial Officer of Broadridge Financial Solutions, Inc., pursuant to Rule 13a-14 of the Exchange Act, as adopted pursuant to Section 302 of the Sarbanes-Oxley Act of 2002. | |
| 32.1 | Certification of the Chief Executive Officer pursuant to Rule 13a-14(b) of the Exchange Act and 18 U.S.C. Section 1350, as adopted pursuant to Section 906 of the Sarbanes-Oxley Act of 2002. | |
| 32.2 | Certification of the Chief Financial Officer pursuant to Rule 13a-14(b) of the Exchange Act and 18 U.S.C. Section 1350, as adopted pursuant to Section 906 of the Sarbanes-Oxley Act of 2002. | |
| (1) | The SEC File No. for the Company’s Form 8-K Reports referenced is 001-33220. |
| (2) | Schedules to the Asset Purchase Agreement filed as Exhibit 2.1, as amended by the Amendment, Assignment and Assumption Agreement filed as Exhibit 10.23, have been omitted pursuant to Item 601(b)(2) of Regulation S-K. The Registrant hereby undertakes to furnish supplemental copies of any omitted schedules upon request by the Securities and Exchange Commission. |
| (3) | Certain Confidential Information contained in this Exhibit was omitted by means of redacting a portion of the text and replacing it with an asterisk. This Exhibit has been filed separately with the Secretary of the Securities and Exchange Commission without the redaction pursuant to a Confidential Treatment Request under Rule 24b-2 of the Securities Exchange Act of 1934, as amended. |
78